Embed Size (px)
Citation preview
NTIA Report 83-126
Digital Microwave Transmission Testsat the Pacific Missile Test Center,
Pt. Mugu, California
R.W. Hubbard
u.s. DEPARTMENT OF COMMERCEMalcom Baldrige, Secretary
Susan G. Stuebing, Acting Assistant Secretaryfor Communications and Information
June 1983

Disclaimer
Certain commercial equipment, instruments, or materials areidentified in this paper to specify adequately the experimentalprocedure. In no case does such identification imply recommendation or endorsement by the National Telecommunications andInformation Administration, nor does it imply that the material orequipment identified is necessarily the best available for thepurpose.
ii
TABLE OF CONTENTS
LIST OF FIGURESLIST OF TABLESABSTRA·CT1. INTRODUCTION AND OBJECTIVES2. BACKGROUND3. EXPERIMENT PLAN
3.1 Measurement Parameters3.2 Link Configuration3.3 BER and Burst Error Measurement3.4 Adaptive Equalizer Control Voltages3.5 RSL Records3.6 PN Channel Probe3.7 Angle Diversity Measurements
4. DATA ACQUISITION SYSTEMS4.1 Digital Radio Performance Data4.2 PN Probe and Other Data
5. DATA FORMATTING AND PROCESSING METHODS6. PRELIMINARY RESULTS AND DISCUSSION7. SUMMARY AND CONCLUSIONS8. ACKNOWLEDGEMENTS9. REFERENCESAPPENDIX
iii
Pagev
vi1
1
2
4
4
4
5
6
6
7
9
10
-12
14
15
23, ,54
56
58
59
LIST OF FIGURES
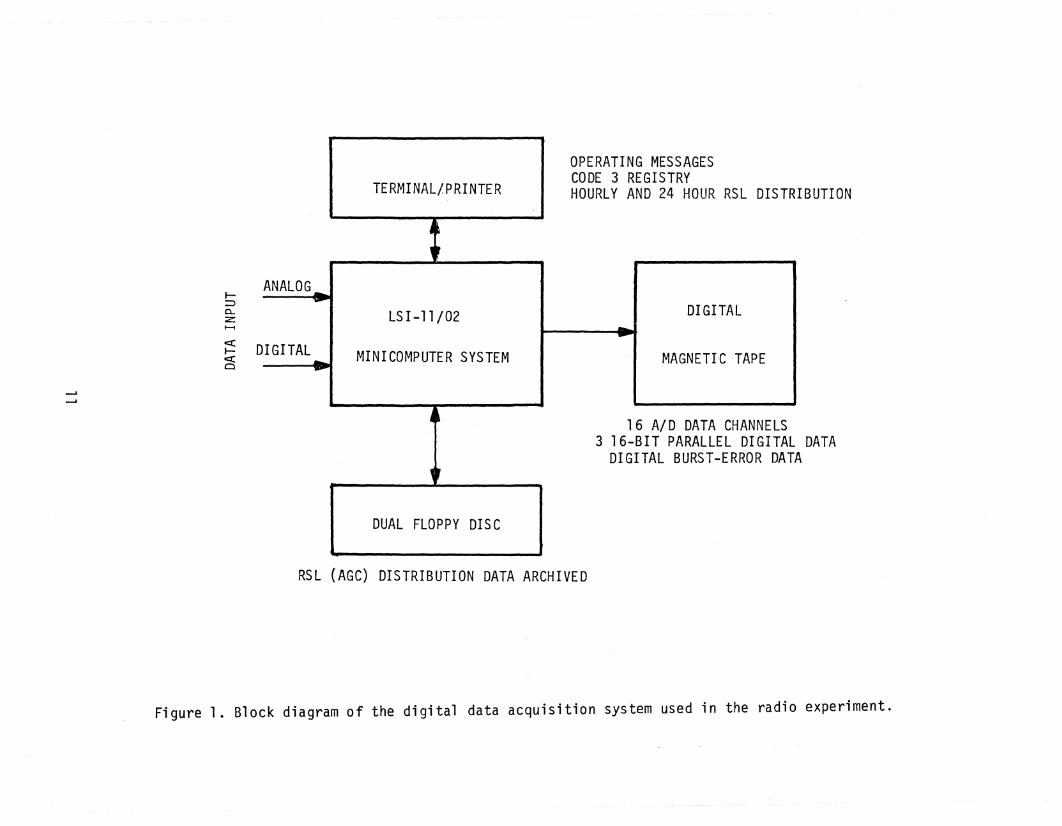
PageFigure 1. Block diagram of the digital data acquisition system used
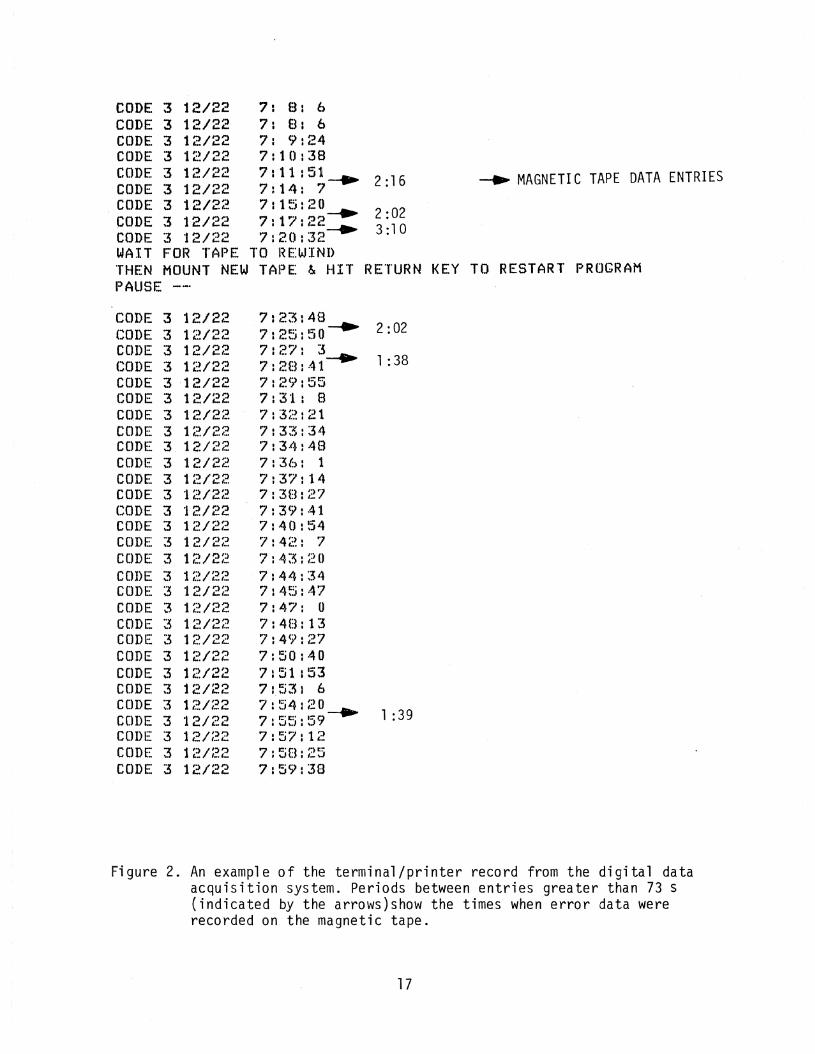
in the radio experiment. 11Figure 2. An example of the terminal/printer record from the digital
data acquisition system. Periods between entries greaterthan 73 s (indicated by the arrows) show the times whenerror data were recorded on the magnetic tape. 17
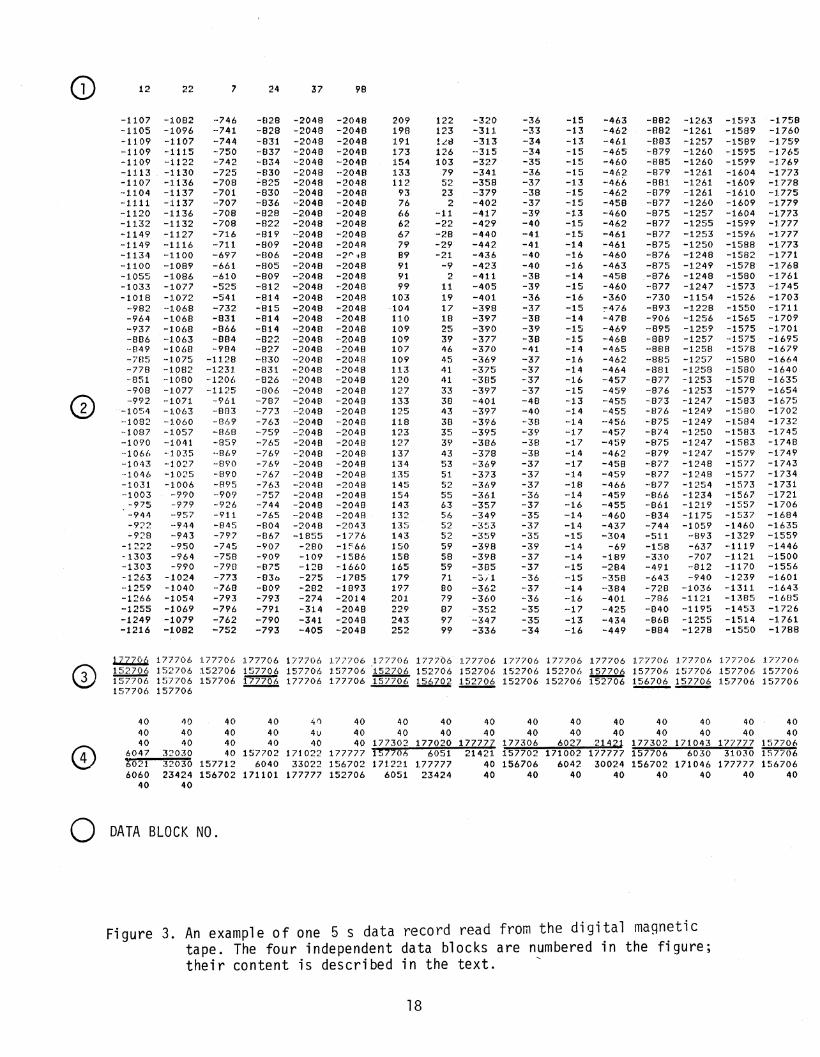
Figure 3. An example of one 5 s data record read from the digitalmagnetic tape. The four independent data blocks arenumbered in the figure; their content ;s described inthe text. 22
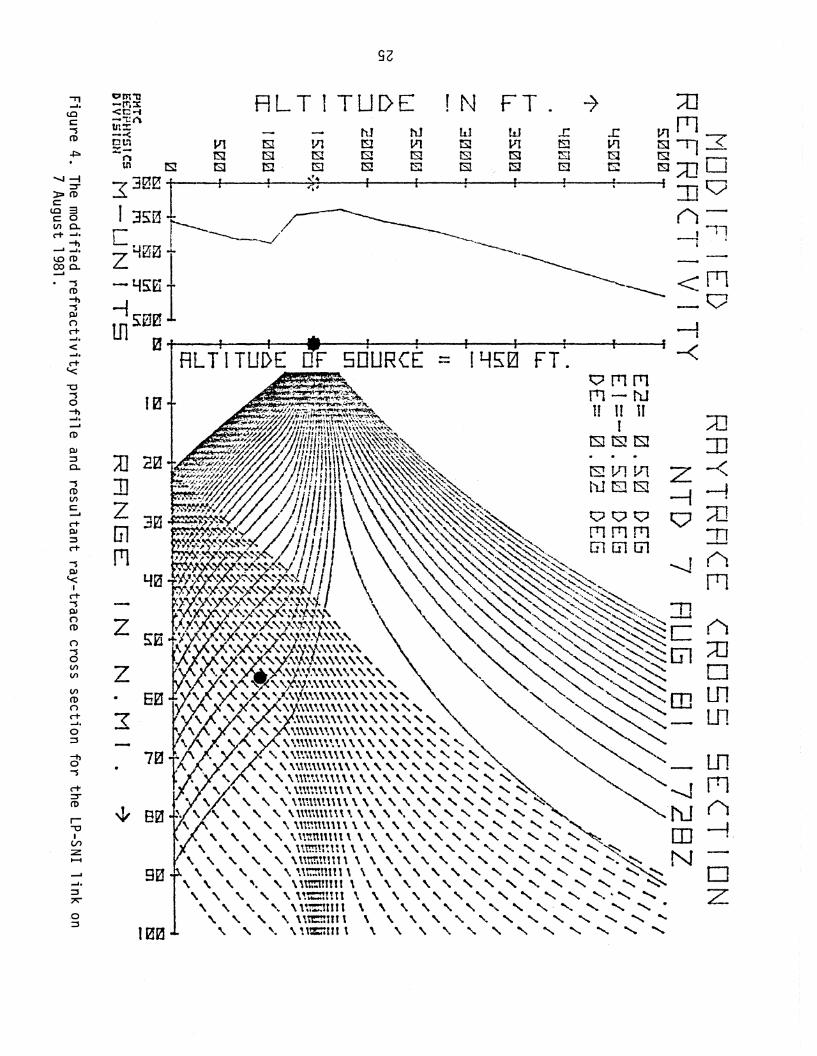
Figure 4. The modified refractivity profile and resultant ray-tracecross section for the LP-SNI link on 7 August 1981. 25
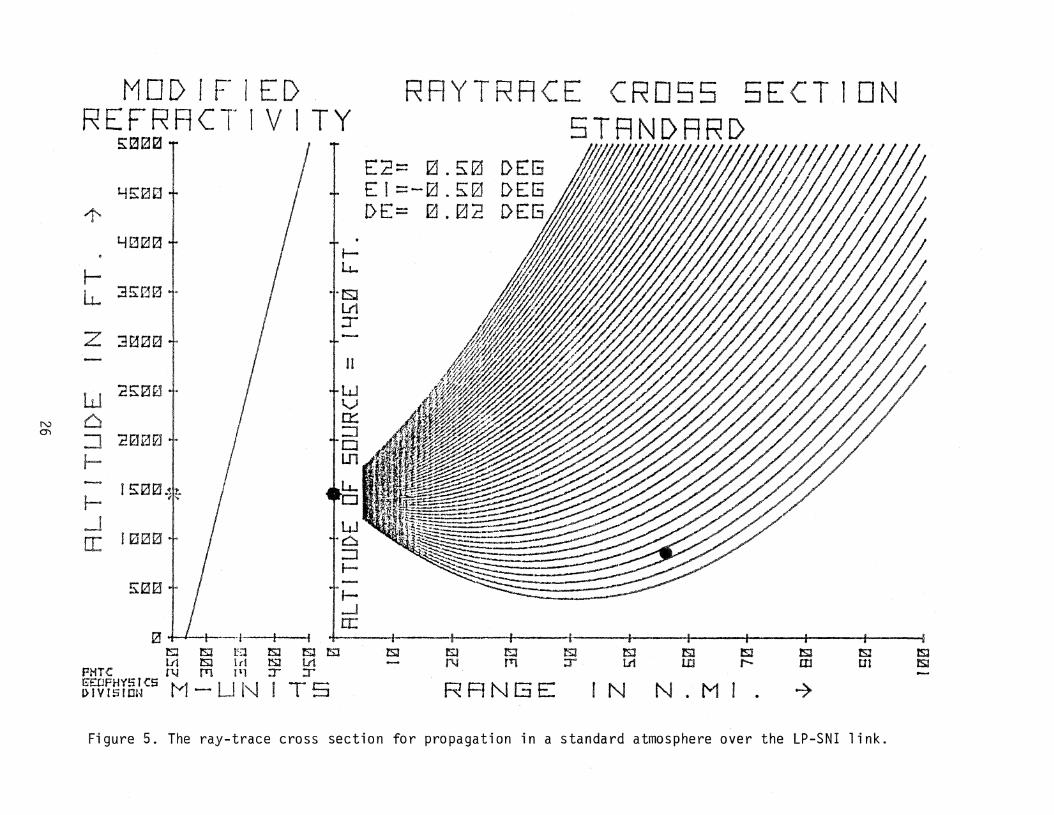
Figure 5. The ray-trace cross section for propagation in a standardatmosphere over the LP~SNI link. 26
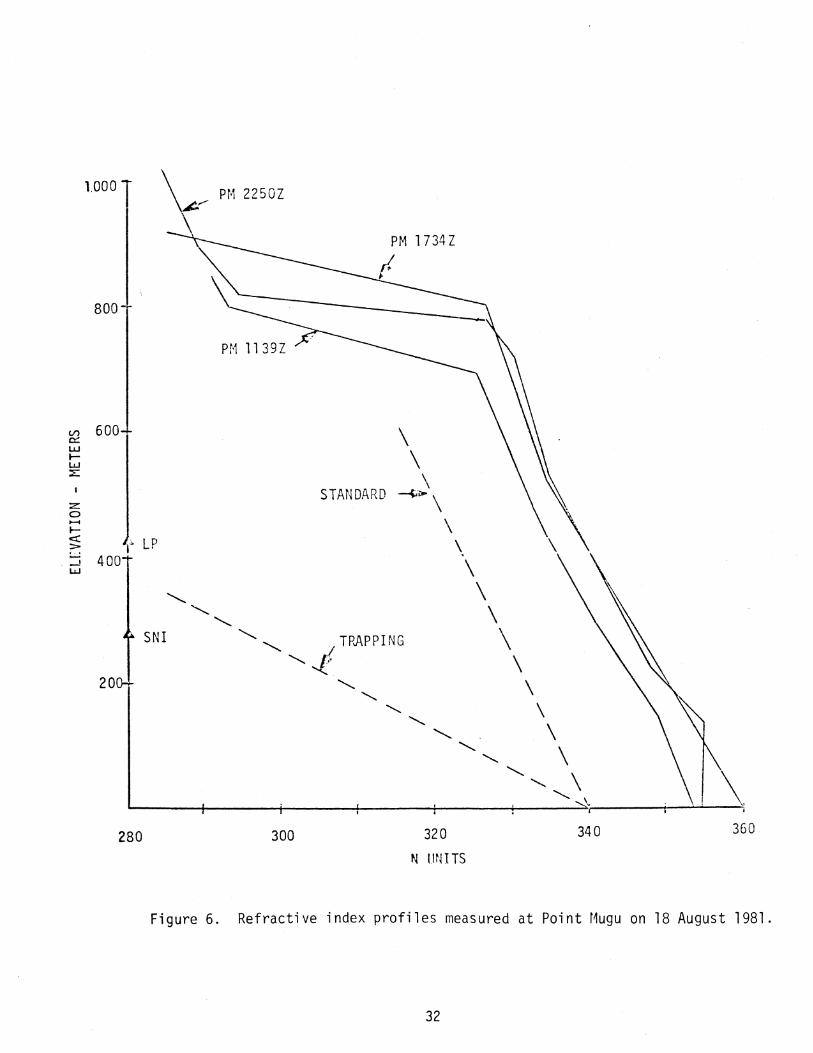
Figure 6. Refractive index profiles measured at Point Mugu on18 August 1981.' 32
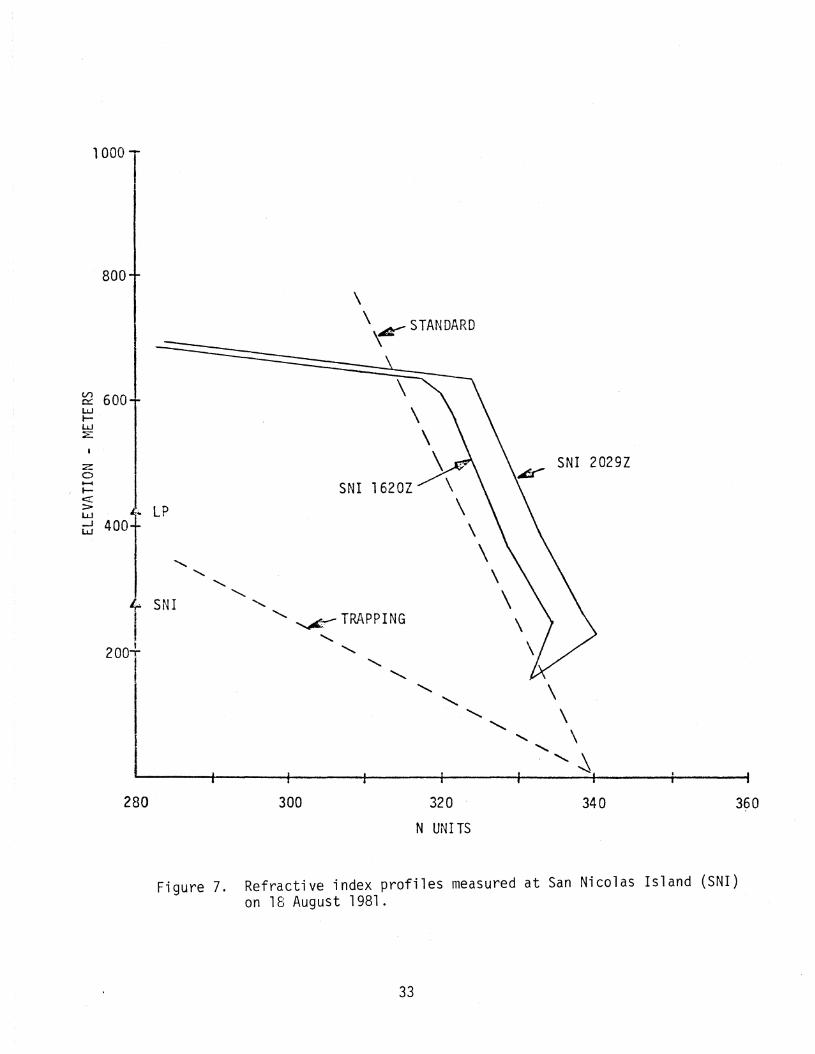
Figure 7. Refractive index profiles measured at San Nicolas Island(SNI) on 18 August 1981. 33
Figure 8. Refractive index profiles measured at point Mugu (PM) andSan Nicolas Island (SNI) on 19 August 1981. 35
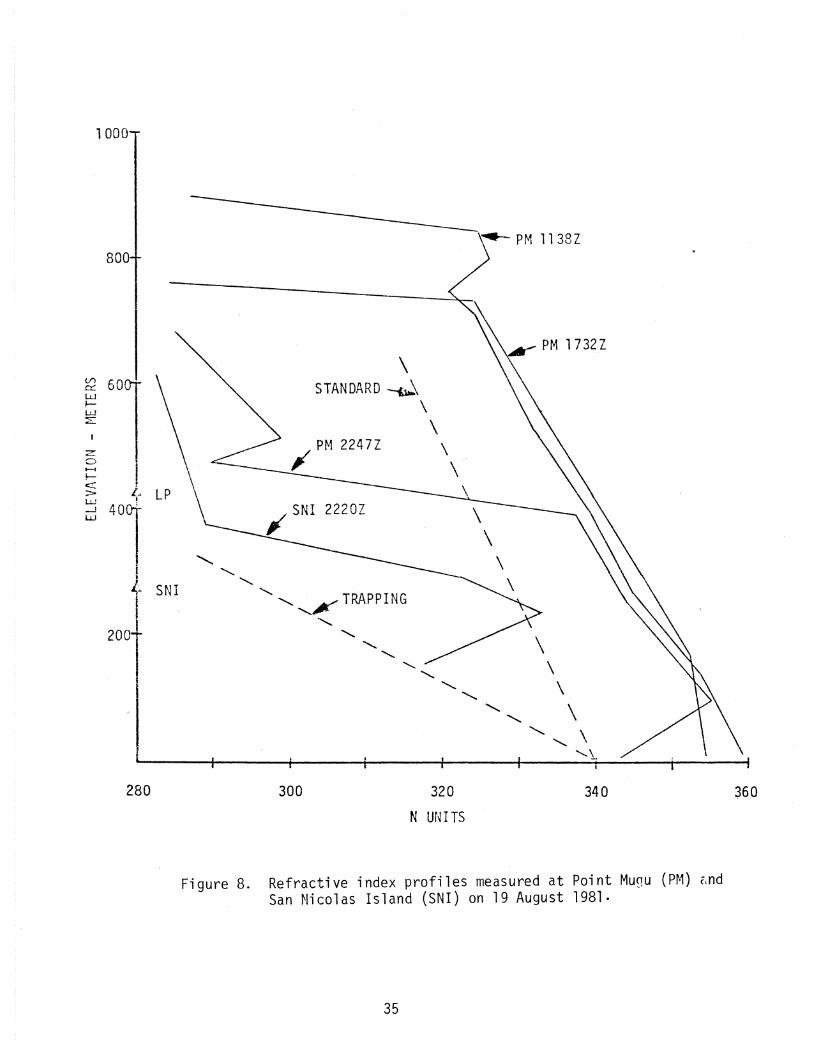
Figure 9. Graphical correspondence between delay-spread measurementsand the refractivity data on the LP-SNI link on18 August 1981. 37
Figure 10. Graphical correspondence between delay-spread measurementsand the refractivity data on the LP-SNI link on19 August 1981. 40
Figure 11. Refractive index profiles measured at Point Mugu (PM) on1-2 September 1981. 41
Figure 12. The modified refractivity profile and the resultant ray-trace cross section for the LP-SNI link on 2 September 1981. 42
Figure 13. The theoretical frequency transfer function of the transmission channel for the multipath conditions on 1 September1981. The illustration applies to the nominal multipath.de1ay of 4 nS t measured during the interval of the datapresented in Table 7. 46
Figure 14. A sample of the received signal spectra measured from bothradios during the interval of test data given in Table 7. 48
Figure 15. Results of special nondiversity performance measurementsperformed on 2 September 1981. 50
Figure 16. An example of the spectral distortions caused by multipathactivity during the special tests conducted on 2 September1981. The spectral functions were recorded at 1 s intervals. 51
iv
LIST OF FIGURES (Cant.)Page
Figure 17. A sample of the received signal spectra measured from bothradios during the nondiversity test on the upper antenna(Figure 15). Note a gap in the record, indicating that theDRAMA radio registered no error or alarm data between1850:57Z and 1851:17Z. 53
Figure A-l. An example of the errored-second performance data as itappears in the printer output record. 61
LIST OF TABLESTable 1. LSI-ll Minicomputer System (CPU) Data 16Table 2. Microwave Radio Performance Data 19Table 3. Contents of the Octal Data from Figure 3 21Table 4. Comparative PeY'formanceData for 7 August 1981
(15-minute intervals) 27Table 5. Comparative Performance Data for 7 August 1981
(l-minute intervals) 27Table 6. PMTC Radio Performance Data, 18-20 August 1981 30Table 7. Radio Performance Data on 1 September 1981 44Table A-l. Digital Data Acquisition System - DRAMA Radio 60Table A-2. DRAMA Radio Data Signals 62
v

IIII
IIII
IIIII
II
IIIIIII
IIIIIII
II
IIIIIIIII
IIIIIIIII
IIIIIIIII
IIIIIII
III
IIII
IIIII
II
IIIIIII
IIIIII
DIGITAL MICROWAVE TRANSMISSION TESTS AT THEPACIFIC MISSILE TEST CENTER,
PT. MUGU, CALIFORNIA
R.W. HUbbard*
This report describes an experiment designed to measure theperformance of digital microwave radio systems in a line-of-sight(LOS) link that is subject to strong atmospheric multipath. Itoutlines the measurements made to characterize the propagationmedium, the status of spa.ce-diversity receiver systems equipped withswitched combiners, and the burst-error statistics caused by themulti path environment. The results presented in this report comparethe performance of two radios, operating simultaneously in the sametransmission channel. Detailed error distribution data have notyet been analyzed.
Key words: adaptive equalization; atmospheric multi path;digital communications; impulse response
1. INTRODUCTION AND OBJECTIVESThis document presents some preliminary results of a test program designed to
evaluate the performance of diigital microwave systems in anomalous propagationconditions. The program was a joint effort of the Control Systems Development andRange Communications Divisions of the U.S. Navy Pacific Missile Test Center (PMTC),and the Institute for Telecorl1tl1unication Sciences (ITS), National Telecommunicationsand Information Administration (NTIA), U.S. Department of Commerce, Boulder,Colorado.
The objective of the program was to conduct and evaluate the results of a comprehensive experiment in which simultaneous measurements were made of the performanceof a high bit-rate digital radio system and the propagation conditions in the radiotransmission channel. The transmission channel was monitored with use of the ITSPseudo-Random Noise (PN) Channel Probe (Linfield et al., 1976) in much the samemanner as this system was applied to a previous experiment at PMTC (Hubbard, 1979.).The performance of the radio system(s) was measured through use of a bit-error-rate(BER) instrument and an error analyzer, with emphasis placed on the distribution ofbit-errors.
The anomalous propagation condition of interest is that of multipath, createdby either refractive effects of the atmosphere, or superrefractive height profiles
*The author is with the Institute for Telecommunication Sciences, Nationa"l Telecommunicattons and Information Administration, U.S. Department of Corrmerce,Boulder, Colorado 80303.
that produce strong ducting conditions within the channel. In order to determinethe meteorological conditions for the channel, the Geophysics Division at PMTCsupported this program with all appropriate data. These data consisted of at leasttwo radiosonde observ~tions each day, taken at both terminals of the test path. Inaddition, forecast statements relative to expected ducting and other pertinentweather features were issued daily by this department. The forecast memos were usedto direct special features of the measurements as appropriate. The radiosonde datawere compiled into refractive index profiles, and plotted by computer routines. Theprofile plots were made available to the experiment team within a short period oftime after a radiosonde launch.
The combination of the impulse response and performance data in this programmarked another IIfirst ll in the field of digital microwave performance tests. Earlier,ITS measurements demonstrated the catastrophic impact that atmospheric multipath canhave on digital transmission [Dougherty and Hartman, 1977]. Many experimentors havereported performance measures on digital systems, with limited knowledge or observation of multipath phenomena. Others, including the ITS, have made significantmeasurements relative to digital microwave propagation parameters. These includeimpulse response and meteorological data. Rarely, however, have these two facetsof digital communication experiments been performed simultaneously, particularlyover the same transmission channel. A direct correlation of these data will providenew insight to performance criteria, and knowledge of adaptive techniques that willserve to improve the future performance of this very important communication technology. It is expected that the data will also be useful in enhancing analyticalmodels for LOSdigjtal systems.
2. BACKGROUNDMultipath in a microwave propagation path is a problem of growing concern to
both military and commercial users. A significant body of performance measurementshave been reported in the literature in the last few years. Examples of specificexperiments are given by Anderson et ale (1978) and Barnett (1978). Both of thesepapers illustrate the degradation in performance due to multipath propagation.However, each experiment relied on only cursory observations of the multipathstructure, derived from observing some characteristic of the received signal in thedigital microwave system. No direct observation of the channel multipath wasavailable, and no observations were made that could determine the origin or statistics
of the multipath signals.In preparing plans to convert their range communication systems (PMTC, 1976)
to an all digital format in the future, the PMTC began to assess the potential
2

performance of these microwave systems with respect to their mission requirements.
The multipath question was of paramount importance because of the known and persistantmeteorological conditions that develop along the Southern California coast. ThePMTC has maintained microwave propagation records for many years, and observed themultipath effects in their analog systems. The worst propagation periods usuallyoccur when a marine layer of moist air develops offcoast, and causes a temperatureinversion. This weather condition results in a superrefractive (often exceedingducting conditions) layer in the propagation channel. The knowledge of theseconditions prompted the PMTC to investigate the multipath problem in detail, priorto investing in any specific d-igital system. The ITS performed impulse response
measurements over a 65 mi (104.6 km) overwater link between Laguna Peak (LP) atPoint Mugu, and San Nicolas Is-land (SNI), to evaluate the multipath problem. Thesemeasurements were reported in the reference given previously (Hubbard, 1979). ThePN probe signal was multiplexed onto the PMTC system at SNI, and the impulseresponse was simultaneously measured on both of the space diversity channels at LP.In addition, the error performance of the PN code used for the impulse responsemeasurements was also monitored at LP. The PN probe was operated at 8.6 GHz. ThePMTC microwave system was operating on 7.17 and 7.47 GHz.
Based on the results of the above experiment, it was concluded that a digital
system operating with a mission bit-rate on the order of 50 Mb/s would performadequately over this link, provided that space and frequency diversity and adaptiveequalization were used to combat the multipath effects. Subsequently, the PMTC haspurchased a commercial digital microwave system which operates in an 8-PSK mode ata T3 transmission rate of 44.736 Mb/s (2.25 bits/Hz). This system was installed onthe LP-SNI link using space diversity reception and adaptive spectrum equalization,and was used in the test program reported here. The system was made available forexperimental purposes for a pe}~iod of about one year. This permitted measurementsto be made through the most severe anomalous propagation periods, which are the
summer and early fall months. Similar conditions usually develop on this path during December and January, but do not persist for long periods of time.
The specific measurements made during this experiment are outlined in the fol
lowing sections. Initially, the measurements were made on the PMTC 44.736 Mb/ssystem. Howev~r, a second micl~owave system was added to the experiment at a later
date. This was a prototype of the Qigital' Radio and ~ultiplex ~cquisition (DRAMA)system under development by thE~ military. This report presents the results ofselected test periods where the performances of the two radios are compared. The
3
DRAMA tests have been reported separate1y1. A complete report of the PMTC radiotests will be published at a later time.
3. EXPERIMENT PLAN3.1 Measurement Parameters
This experiment included the following measurements, each of which is discussedindependently in subsequent subsections.
1. BER and burst-error statistics of the mission bit-stream of the microwaveradio.
2. Two control voltages developed by each adaptive equalizer unit in the two
receiver channels of the PMTC digital radios. These signals are proportional to the "tilt" and "no tch" gain function of the equalizers, and arethus a measure of the multipath effects in the signal pass-band of thereceiver.
3. Received signal level (RSL) of each space diversity channel, from the twomicrowave receivers. In association with these measurements, the diversityswitch status was also recorded, so that a record is maintained as towhich diversity channel was selected for data reception. The RSL of thePN probe system was also recorded for frequency comparison.
4. Impulse response data of the propagation channel, including statistics ofthe frequency selective fading in the broadband spectrum of the PN probesystem. The impulse response was measured on two diversity channelssimultaneously.
5. Angle diversity measurements. These were conducted in a similar mannerto that -used in the earlier measurement on the PMTC link (Hubbard, 1979).
3.2 Link ConfigurationThe LP-SNI link was configured for measurements of the digital performance in
one direction only; the transmitter terminal was located on SNI, and the receiversand data aquisition systems were located on LP. For all other instrumentation,including the PN probe, the transmitters were located at SNI, and the receivingequipment was located atLP.
The LP-SNI link is characterized as follows:Site Elevation at LP: 1400 ft (426.7 m) above mslSite Elevation at SNI: 912 eft (278 m) above mslLength (over water): 65 mi (104.6 km)
'Hubbard, R.W. (1982), Digital European backbone (DEB) stages II-IV, propagationdependent availability FOT&E report, ITS report to sponsor (distribution limited tou.s. Government Agencies only), October.
4
Transmitter Antenna: 10 ft (3.05 m) paraboloid; 70 ft (21.3 m) aboveground
Receiving Antennas: 10 ft (3.05 m) paraboloids; 30 ft (9 m) and 120 ft(36.6 m) above ground
Vertical Diversity Spacing: 90 ft (27.4 m)Antenna Gains at 7350 MHz: 44 dB
The frequency assignments for the microwave systems are as follows:PMTC Analog System: 7170 MHz and 7470 MHzPMTC Digital System: 7350 MHz and 7800 MHzDRAMA Prototype: 814,0 MHzITS PN Channel Probe: 8600 MHz
3.3 BER and Burst Error MeasurementThe BER and burst~error measurements were made using commercial instruments
manufactured by Tau-Tron, Inc. The basic error detector was a model PTS-107. Thissystem uses a PN sequence as a test signal, which is selectable in length from(27-1) to (22°_1). A (215_1) sequence was transmitted at a 1-3 rate of 44.736 Mb/s.The error analyzer was set to match the code length and clock rate at the transmitter. The output signal of the PTS-107 was a serial pulse for every bit in errorin the detection process. The error-pulse stream was fed to a,companion instrument,an MK-4 error analyzer. This instrument provides the following information:
1. Number of error-free sync periods. {This statistic wastabulated in fixed time intervals for long error-free periods;see Section 4.l.}
2. Number of error~free bits from the last sync signal to thefirst error burst.
3. Length of each burst of errors.4. Number of bits in error in each burst.Two parameters were selectable for the ,above burst-error analysis. The first
was the length of a coarse sync period, and the second was the length of the errorfree gap between bursts~ The sync period was chosen for an unambiguous result {seeSection 4.1}, and the error-free gap may be selected within the binary range of 32to 256 bits. The smallest error-gap of 32 bits was initially selected. However,this value was changed during the experiment to the maximum of 256 bits, because ofthe severity of the error data.
The'data output of the burst-error system is composed of lOBeD digits, containing the barst statistics noted above. These data were recorded in a digitaldata acquisition system (see Section 4). No direct record of the BER was included
5
in the digital records. However, this parameter was recorded on an auxiliary
thermal line printer for a permanent record and on-site review. It should also benoted that BER (for any selected period of time) may be developed from the analysisprocedures used on the digital burst-error data.
All recorded data were time-tagged with an appropriate clock, as describedunder the description for the data acquisition systems (Section 4). This assuredproper time synchronization of all data records for correlation analyses.
3.4 Adaptive Equalizer Control VoltagesTwo contro1 .vo1tages from each of the two (di vers i ty) recei vers in the PMTC
digital radios were recorded. These control voltages indicate the adaptive gainfunction in the equalizers for correcting the multipath IItilt li within the data bandwidth, and the effects of a multipath "notch ll when it appears near the band center.Each of these signals is an analog output of the adaptive equalizers. They were AIDconverted at a rate of 10 samples per second, and recorded in the digitalacquisition system. Calibration of these signals was performed initially by using aspecial test unit developed by the radio manufacturer.
The equalizer data provided a permanent record of the following phenomena:a. Relative position and depth of a multipath notch in the
transmission channel; i.e., the encroachment of a frequencyselective fade on the signal pass-band, and the position(either above or below) the center frequency.
b. Depth of a frequency selective notch when it appears nearthe band center of the signal spectrum.
3.5 RSL RecordsThe received signal level (RSL) of each of the digital diversity receivers was
recorded. The two analog signals were AID sampled at a rate of 10 samples/s, andrecorded in the digital acquisition system.
Calibration of the RSL signals was performed by using a stable signal generatorwith a precision attenuator. Calibrations were performed as required, so that avalid calibration was available for each data tape. The appropriate calibrationdata were retained in storage in the data system for regular data runs. For anyspecial runs, such as those outlined below for diversity etc., a special calibration was made.
6
3.6 PN Channel ProbeAs noted previouslYt the ITSPN channel probe was used in the experiment to
measure and record the impulse response of the propagation channel. This system wasmultiplexed onto the existing PMTC microwave transmission lines. The multiplexerswere furnished by ITS. They are designed to pass (with <1 dB insertion loss) thePMTC operating frequencies in the range of 7.15 to 7.90 GHz through the primaryport. The second port accommodated the PN probe signal at 8.6 GHz, with a pass bandof +200 MHz. The isolation between these ports is in excess of 50 c1B. The use ofthis multiplex arrangement permitted the impulse response to be measured over precisely the same propagation path as the digital radio transmission.
The channel probe uses a PN code length of 511 bits (29-1), clocked at rate of150 MHz. This permits a multipath delay resolution (without overlap) of approximately 6.67 ns. The actual resolution is however, on the order of 1 ns in mostinstances. The system employs a dual receiver, so that simultaneous data may beobtained on diversity paths. Four analog data signals are available from eachreceiver channel as follows:
1. Co-phase impulse [hr(T)]
2. Quadrature-phase impulse [hi(T)]
3. Power impulse function [E(e)2J
4. RSL (power level detector on 600 MHz IF).The PN probe develops the impulse response measurement using a correlation
detection process in the receiver. This technique provides a time-bandwidth tradeoff in comparison with rf impulse measurements. Since most propagation channelschange characteristics relatively slowly, the PN probe has been configured todevelop the response at a data rate from 1 impulse/s to 10 impulses/s. The 1impulse/s rate for line-of-sight (LOS) microwave links has proven adequate in mostof the previous experiments, and was used predominately in this experiment. Thetotal delay time (window) possible from the measurement is 3.4 ~s for the specifiedcode length and clock rate. However, the data of interest in a LOS circuit is
generally confined to a few ns.The impulse response data gathered during the early part of the PMTC test pro-
gram were recorded separately on analog magnetic tape. The local PMTC IRIG B timecode (used to synchronize all of the data, as explained in Section 4) was alsorecorded on the analog tapes. In this fashion, the analog tape records can becompletely synchronous with the digital tape records of other data.
7
Later, with the addition of the DRAMA radio to the experiment (under sponsorship of the u.s. Air Fo~ce), a second digital data acquisition system was implemented. At this time, the impulse response data were also recorded in a digitalformat. The sampling rate for these data was 2 kHz but the sampling range wasrestri~ted to approximately 40 samples. The equivalent time resolution was approximately 2 ns/sample in the recorded response, which permitted multipath delay measurements to a maximum of 80 ns.
The data recorded in the analog system was played-back on-site for a review ofevents that occurred during periods when the receiving site was unattended.
In addition to the above signals, two additional data sources were derived fromthe PN probe. The first was a measure of the BER of the test signal used in the PN
probe. The 150 Mb/s data stream was detected in one channel of the receiver only,and was fed to the input of a commercial error detector. The error performance onthis signal was in direct time relationship to the frequency selective fadingcaused by multipath in the channel, and could be visually correlated with thecorresponding impulse response. These data were used as an on-site monitor for pathconditions, and were not recorded for analysis.
Since frequency selective fading will affect the different operating frequencies at different times, the BER data from the probe measurement was used forcomparison with the short term effects measured on the PMTC digital data. Thisvisual monitor technique permitted on-site observation of multi path effects, andthey could be traced across a wide range of microwave transmission frequencies;those listed in Section 3.2. When the DRAMA prototype radio was added to theexperiment, a total of five different transmission frequencies was observed,ranging from 7.17 GHz to 8.6 GHz. This data base provided new insight to thecorrelation properties of multipath effects.
Another data source from the probe system was implemented to monitor continuously the band-edge effects on the transmission during multipath activity. Forexample, the delay time of a multipath component will change over a period of time.This will cause a number of frequency-selective notches to move rapidly through thesignal pass-band. It was expected that this phenomenon would be the predominantcause of any burst-error type performance, and thus the band-edge signals wererecorded so that they could be directly correlated with the burst-error measurement.
The data were recorded as one of the analog inputs to the digital data system. The
actual signal format is explained below.
8
To develop the band-edge sign~ls, the 150 MHz clock frequency used in the PNprobe was inserted (amplitude modulated) onto the transmitted signal. The PNtransmitted (bi-phase) spectrum follows the (sin x/x)2 power law. For the biphasesignal, a spectral null occurs at points ~150 MHz from the center frequency. Theadded clock frequency thus appE~ars as a spectral line at these null points, and doesnot cause any interference effects to either the BER or impulse response measurements. The amplitude modulated spectral lines thus appear in the received IF spectrum at the bi-phase band edges at 450 MHz and 750 MHz (IF = 600 MHz). These twospectral lines were filtered and fed to two independent amplifiers for separatemeasurement. Tilt across the transmission BW is registered by the difference inmagnitude of these detected si~~nals. Any rapid movement of frequency selectivefades (due to multipath with changing delay time) was detected by the fading character of these signals.
The measurement of prime importance is the relative amplitudes of the twoinserted signals. Thus~ in the recording of these data, the difference between thetwo detected magnitudes was actually recorded. One signal wa~ inverted and algebraically combined with the second signal. In this manner, the polarity of the combined (recorded) signal indicates on which side of the signal spectrum a multipathnotch has impinged. In addition, a cyclic pattern to the signal indicates themotion of a notch completely through the signal pass-band, and the phase or timingof the notch movement (+ or - .on the frequency axis). This data signal was handledas an additional analog output from the PN probe; i.e., it was sampled in the AIDconversion interface, and reco'rded on the digital data records. This signal isprimarily intended for use in developing the time statistics of the frequencyselective fading.
There was no direct calibration of the individual magnitudes of the band-edgesignal. However, the differential signal was calibrated by using precision attenuators to measure the tilt and notch variations in dB. Other data, such as describedin Section 3.4, provide similar frequency selective fade information at a differentrf carrier, and a correlation between the two sets of data can be p€!rformed in thedata analysis procedures.
3.7 Angle Diversity MeasurementsThe angle diversity measurements described by Hubbard (1979) on the SNI-LP link
were continued during this experiment. A separate dual receiver (furnished by ITS)was used at LP to monitor one of ·the PMTC analog radio frequencies. The receiver is
9
tuneable over the range 7.1 to 8.4 GHz~ and it provides two independent log-linearRSL outputs for recording. Two 1.2~m (4-ft) parabolic antennas were previouslymounted on the LP tower for these measurements. One antenna was aligned to an onpath elevation. The other was tilted slightly in elevation to provide the ang1eof-arrival diversity.
The angle diversity measurements were performed only on an occasional basis.Data were recorded on a paper strip-chart recorder for visual on-site monitoring.Periodically, these data signals were recorded on both digital and analog magnetictape for later analysis in the ITS laboratories. The objective of these measurements isto determine the feasibility of angle diversity reception as an adaptivetechnique to specific types of multipath in a digital transmission channel. Whenthese measurements were performed, certain periods of time were devoted to measuringthe impulse response of the channel directly over the angle diversity paths. thiswas accomplished by removing the input lines to the PN probe recieverfrom the PMTCantennas, and connecting them to the two angle diversity antennas. Specific timesand duration of these measurements were determined on-site, based on channel conditions and system performance parameters.
Further details of this form of angle diversity, and performance improvementmay be found in the report by Hartman and Smith (J97S).
4. DATA ACQUISTION SYSTEMSThree data acquisition systems were used in this experiment; two digital
systems and one analog system.The two digital systems are fundamentally the same, each configured for the
assimilation of analog data through an appropriate AID conversion interface. Bothsystems contained the appropriate interface cards for a BCD or ASCII coded digitaldata input. The BCD interface was used for the burst-error analyzer noted in Section 3.3. The ASCII interface was provided in the second system to accommodate anerrored-second instrument used in the DRAMA radio measurements (see Appendix).
The heart of each data system was a minicomputer CPU (DEC/LSI-l1). Each had akeyboard for operator interface and control t and a dual floppy-disc for data storageand for program development/operation. The primary data storage medium on eachsystem was digital magnetic tape. Both systems were capable of 1600 bpi, phaseencoded recording. A basic block diagram of the systems is shown in Figure 1.
Each of the digital systems contained an integral calendar and time of dayclock. These were synchronized with PMTC range timet so that each data record was
10
~ DIGITAL~ ....
---I
---I
r=>Cl..Z~
ANALOG..
TERMINAL/PRINTER
:LS I -11 102
M1NICOMPUTER SYSTEM
,f
DUAL FLOPPY DISC
OPERATING MESSAGESCODE 3 REGISTRYHOURLY AND 24 HOUR RSL DISTRIBUTION
DIGITAL......------
MAGNETIC TAPE
16 AID DATA CHANNELS3 16-BIT PARALLEL DIGITAL DATA
DI GI TAL BURS T-ERROR DATA
RSL (AGC) DISTRIBUTION DATA ARCHIVED
Figure 1. Block diagram of the digital data acquisition system used in the radio experiment.
precisely time-tagged to the same reading. The synchronizing source was the IRIG Btime code distributed to various sites at PMTC.
The analog data system was composed of magnetic tape recorders, strip chartrecorders, thermal printers, storage oscilloscope with camera, and spectrum analyzers. Some of these instruments and their application have been mentioned previously. Details of the data formats and applications of these instruments areprovided in the following subsections, interspersed with the corresponding detailsfor the digital acquisition systems.
4.1 Digital Radio Performance DataThe primary digital radio performance parameters and signals were recorded in
the all-digital acquisition systems. The analog signals described in Sections 3.4and 3.5, were interfaced to the digital data acquisition system through 12 bit AIDconverter cards with an integral multiplexer. The sampling rate ranged from 10 to2000 samples/s, based on the Nyquist requirement for each of the analog signals.These data were temporarily stored in the CPU for later transfer to digital magnetictape. The basic data format was designed first to compile the AID (analog) datainto a block, and then to follow this with the burst-error data described below. Eachrecord file was headed by a time-of-day entry, which also serves as a file identifier.
The burst-error data for the PMTC radio consisted of those entries noted inSection 3.3. They were formatted into a 10 digit BCD arrangement within the MK-4instrument. The data were compiled into a first-in first-out (FIFO) type buffer,which is 256 data words in depth. At the maximum (estimated) rate of burst-erroractivity (4 k bytes/s), this FIFO buffer was capable of storing approximately 250 msof data. While these data were accumulating, the digital acquisition system wasrecording the analog signal samples. Following this, the burst-error FIFO contentswere read and recorded into the same record file on digital tape. A record fileconsisted of 5 s of data, timed by the internal data system clock.
The burst-error data acquisition system was initiated by the first errordetected in any sequence of error activity. During periods of error-free operation,the digital system did not record data. However, the RSL data continued to be readinto the system, and rather than record the signals on the digital tape, they werecompiled into cumulative distributions for periods of 1 hour and 24 hours. These
distributions were recorded on floppy-discs in the computer system.The first-register in the MK-4 system counts the number of error-free coarse
sync periods, where the coarse sync may be arbitrary in period, within specified
12
limits. For this experiment, the course sync period was derived from the PN codesync signal so that an unambiguous record of the error-free clock periods to thefirst error following a sync pulse could be maintained. The actual value was chosento correspond with the instrument characteristic that all of the counters wouldoverflow with a count in excess of 105. For example, in a burst-error situation, inorder to keep the count of error-free bits from any sync pulse (or previous burst)from becoming ambiguous (prevent counter overflow), the coarse sync could not exceedthe product of the bit period (0.02235 pS for 44.736 Mb/s) times 105. A coarsesync period of less than 2.235 ms meets this criteron.
The coarse sync period used for the tests was derived directly from the PN wordsync signal (from the PTS-107Error Detector Receiver). The following are thespecifications selected for the tests:
PN Code Length: (215_1) = 32,767 bitsBit Rate: 44.736 Mb/sBit Time: 1/44.736 ~s = 0.022353362 ~s
PN Sync Period: 32,767 x 0.022353362 = 0.732452611 ms(Coarse Sync for MK-4 Burst Error Analyzer).
During error-free periods of performance, the burst-error analyzer continuedto register the number of error-free coarse sync periods. Again, this counteroverflow value is 105. Thus, to reach an overflow count, the total time lapse wasapproximately:
. 50.73245 ms~x 10 = 73.245 s.
The output of the burst error analyzer is a data "Code 311 for· a sync counteroverflow. This output was tabulated on the terminal printer of the data system foreach of the above intervals during error-free periods. A real time clock entry wasalso made on the printer to assure that these error-free data periods comprised acontinuous record of performance. This record also provided a check of propersystems performance during the error-free periods of time. We reemphasize the fac.tthat the digital data acquisition system is idle during error-free periods, and didnot assimilate the error-free coarse sync periods.
Another data entry into the digital system was the switch status of the diversity digital radio. This was a l-bit entry, which was coded to identify whichdiversity receiver was in the selected operating mode during any data entry. Otherstatus and alarm signals from the digital receivers were recorded in the samemanner, using a l6-bit interface (I/O) board in the computer acquisition system.The board was read every 0.1 s during a data record.
13
The IF signal spectra from the PMTC digital radio were recorded on analogmagnetic tape, along with the PN probe data noted below in Section 4.2. The verticaloutput signals from the two spectrum analyzers were fed to an analog combining circuit, and the two spectral functions were recorded on a single track of the tape. A
'control circuit was operated synchronously with the PN probe timing signal so thatthe output spectrum from one receiver followed that of the other in time. Thus thespectra information could be recorded on a single tape track. To accomplish this,one spectrum analyzer was set to trigger on the return trace of the first instrument.Both spectral functions, one for each diversity receiver, were recorded for eachsecond, along with the channel impulse function.
4.2 PN Probe and Other DataThe PN probe impulse response data were recorded in the digital acquisition
system noted at the beginning of this section. The power impulse as well as the coand q~ad- phase functions from each receiver channel were recorded in the digitalmode, where each signal was sampled in the AID interface as noted in Section 3.6.The RSL data and the band-edge signal from the probe receiver were also recorded inthe digital system.
An analog tape recorder was used as a back-up data system~ and as an on-siteplayback system to permit data monitoring. The analog records also contain the
I
power impulse response from each diversity channel, the RSL record for each channel,a sync signal for the impulse data, the band-edge differential signal, and the IRIGB time code. These data were recorded on an as-needed basis, rather than continuously. The tape recorder was used during only the most significant events of theexperiment, and during periods when the receiving site was left unmanned.
Other on-site instruments included a storage-type oscilloscope and camera,which was used to monitor the impulse response data. The camera was useful forproviding quick and permanent records of unusual response functions, or to providea time-sequence record of the dynamics of the response. The BER measurement made onthe PN probe signal was recorded on a thermal line printer. These data were not
permanently retained for analyses. They were used primarily for on-site monitorpurposes only.
The analog tape recorder was also used periodically to record the signals fromthe angle diversity tests.
14
5. DATA FORMATTING AND PROCESSING METHODSA complete list of all of the signals recorded for the digital radio per
formance tests are shown in Table 1. A description of each and the purpose forthe record was given above in Section 4. In this section, we will describe theformatting of these data, and outline the analysis procedures.
As stated in the previous section, any long periods of error-free performancefor the digital radio was registered on the terminal/printer of the dataacquisition system. An example of these entries is shown in Figure 2~. A "Code 311
on the record corresponds to an error-free period, counted as the number of errorfree sync periods as noted in Section 3.3. An error-free sync period and its overflow condition was defined in Section 4.1. Thus, each Code 3 message on theterminal represents 73 s of error-free data. Figure 2 shows a continuum of theseentries, interspersed with periods of error data. The periods of error are indicated on the fig~re with the drafted arrows, along with the duration of the recordeddata on magnetic tape. Figure 2 also shows a typical message that was printed onthe terminal for information to the system operator. In this instance, an end-oftape message is seen, and the record shows that a new tape was mounted and thedata system restarted with a loss of data of approximately 3 minutes. Each entryis identified with the date (month/day) followed by the time of the entry (Zulu).
During error data, two distinct protocols were used to direct the computersystem to transfer all buffered data to the magnetic tape. These weY~e:
1. any time that error data were received in the storage buffer; and2. any change in the receiver status/alarm signals at the 0.1 s
intervals.Thus, at any time that either of the above conditions was met, the entire datafile in the storage buffers was written to the magnetic tape. The bufferscontained 5 s of data, and these were recorded as a single record. A data recordis composed of four distinct blocks, organized as follows:
1 - Date and time (Z), which serves to identify each record. Number ofdata entries in block No.4.
2 - A/D data (16 x 50 grid)3 - Digital receiver status (100 ms intervals)4 - Digital burst-error data (100 ms timing marks)
A typical example of one 5 s data record, as read from the magnetic tape, is shownin Figure 3. The data blocks listed above are numbered accordingly in this figure.
15
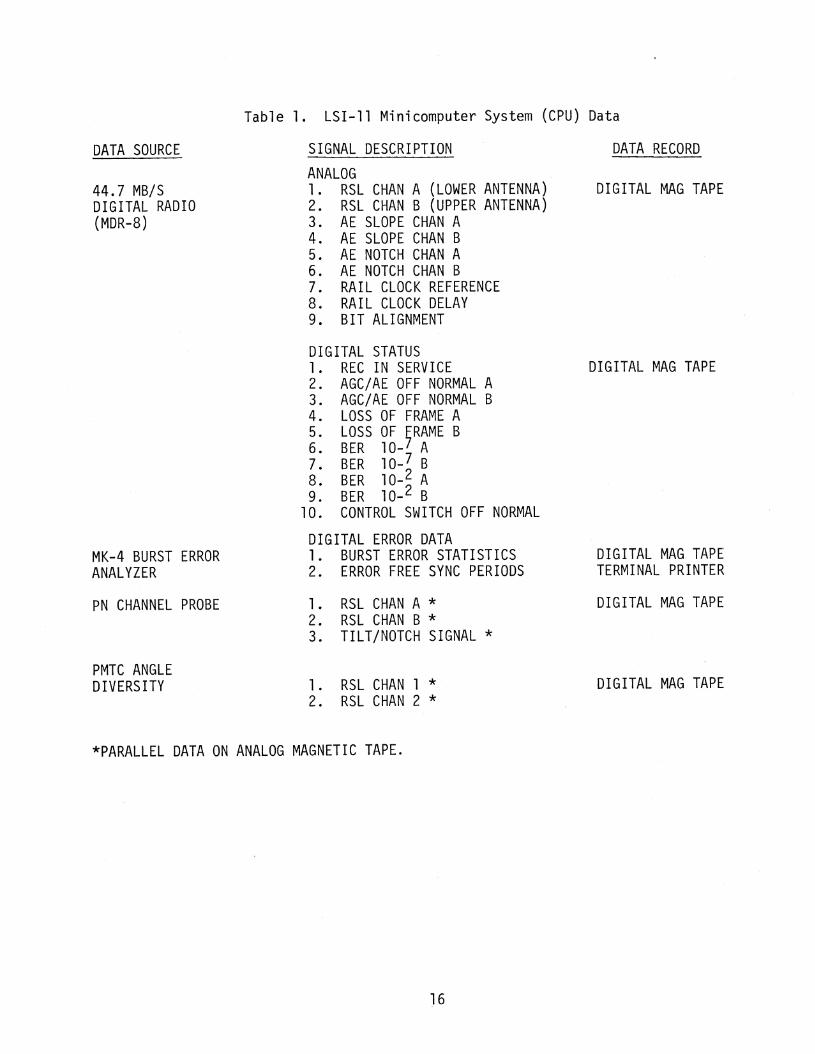
Table 1. LSI-ll Minicomputer System (CPU) Data
DATA SOURCE
44.7 MB/SDIGITAL RADIO(MDR-8)
MK-4 BURST ERRORANALYZER
PN CHANNEL PROBE
PMTC ANGLEDIVERSITY
SIGNAL DESCRIPTIONANALOG1. RSL CHAN A (LOWER ANTENNA)2. RSL CHAN B (UPPER ANTENNA)3. AE SLOPE CHAN A4. AE SLOPE CHAN B5. AE NOTCH CHAN A6. AE NOTCH CHAN B7. RAIL CLOCK REFERENCE8. RAIL CLOCK DELAY9. BIT ALIGNMENT
DIGITAL STATUS1. REC IN SERVICE2. AGC/AE OFF NORMAL A3. AGC/AE OFF NORMAL B4. LOSS OF FRAME A5. LOSS OF FRAME B6. BER 10-~ A7. BER 10-2 B
98. BER 11
00-2 A
. BER - B10. CONTROL SWITCH OFF NORMAL
DIGITAL ERROR DATA1. BURST ERROR STATISTICS2. ERROR FREE SYNC PERIODS
1. RSL CHAN A *2. RSL CHAN B *3. TILT/NOTCH SIGNAL *
1. RSL CHAN 1 *2. RSL CHAN 2 *
DATA RECORD
DIGITAL MAG TAPE
DIGITAL MAG TAPE
DIGITAL MAG TAPETERMINAL PRINTER
DIGITAL MAG TAPE
DIGITAL MAG TAPE
*PARALLEL DATA ON ANALOG MAGNETIC TAPE.
16
CODE 3 12/22 7: 8: ~)
CODE 3 12/22 7: 81 6CODE 3 12/22 7: 9: 2~l
CODE 3 °1 ;:'~/22 7:10:38CODE 3 12/22 7~11:51---.... 2 :16 --. MAGNETIC TAPE DATA ENTRIESCODE 3 12/22 7:14: ~~
CODE 3 12/22 7 · 11::° • ~ ()• ~J.I- --..... 2:02CODE 3 12/22 7 '17' r.>".). .'_'----.... 3:10CODE 3 12/~~2 7:20:3i~
WAIT FOR °rAPE 1°0 ~~ E::W I t~1)
'THEN MOUNT NEW TAPE: ~ ~1IT RE'rURN KEY TO RESTART PROGRAMPAUSE ---CODE 3 12/22 7'~3'48.1__ \,. ---....
2 :02(:ODE 3 1{0~/22 7 : 2 ~:j : ~) ()
COI)E 3 12/22 7' ".>7' ..s.,..,. "'-..... 1 : 38(:ODE 3 1 ;:'~/22 7 : 2E3: 41CODE 3 12/22 7:2S):5~5
CODE 3 12/22 7: 3'1 : 8CO.DE 3 12/22 7: 3;,:,~: 21CODE 3 1;,~/22 7: 3:~: 34CODE 3 12/~~2 7:3'~:4{3
CC)DE 3 12/22 7: 3(:): 1CODE 3 1~?/22 7:37:1 AtCODE 3 °1 ;':~/2;~ 7: 3El: 2?CODE 3 12/22 7:3(y:41CODE 3 12/2~~ 7 : 4 () : ~)·4
CODE 3 12/22 7: 4~~: ~7
CODE 3 12/2;~ 7 : 4~5 : ~~ 0CC}l)E 3 1 ;.:.~ 1 ;~ ;~ 7:44:34CODE 3 "12/2~~ 7:4~5:4:7
CODE 3 1 ~:~ /22 7:47: 0CODE :~ 12/22 7:4E~:13
CODE 3 12/22 7:4(}>:2:7CODE 3 12/22 7:50:40C()DE 3 12/22 7:51:53CODE 3 12/22 7:531 6CODE 3 1;,~/22 7:54~20
CODE 3 12/22 7: 5~:;: 59--"" 1 : 39CODE 3 12/~~2 7:57:12CODE 3 1 ~~ /~.?2 7 : 5(l :2~)CODE 3 12/22 7:59:3B
Figure 2. An example of the terminal/printer record from the digital dataacquisition system. Periods between entries greater than 73 s(indicated by the arrows)show the times when error data wererecorded on the magnetic tape.
17
CD 12 22 7 24 37 98
·<1.107 -:1.082 -74~, -B28 -2048 -2048 209 122 -3~~O -36 -:1.5 -463 -882 -1263 -:1.593 -1758-1 j.05 -1096 -741 -828 -2048 -2048 19B 123 -31 j. -33 -13 -462 -882 -1261 -1.589 -:1.760-11,09 -1107 -744 -·831 -2048 -2048 :1.91 !..!.tl -313 -34 -13 -46:1. -083 -1257 -1589 -:1.759·-11,09 -11l5 -750 ··837 -2048 -2048 173 126 -3:1.5 -34 -15 -46~5 -879 -1260 -1595 -1.765-1109 -1122 ··742 -834 -2048 -2048 1~;4 103 -327 -35 -:1.5 -460 -885 -1260 -1599 -l,769-1113 -1130 -725 -830 ·.. 2048 ··2048 133 79 -341 -36 -:1.5 -462 -879 -1261 -1604 -1773-1107 -1.136 -708 -825 -2048 -2048 112 52 --358 -37 -1.3 -·466 -88l -l261 -1609 -1778·-:1.104 -1137 -701 -830 -2048 -2048 93 23 -379 -38 -:1.5 -462 -879 -1261 -1610 -1.775-1111 -1137 -707 -B36 -2048 -2048 76 2 -402 -37 -:1.5 -458 -877 -1260 -1609 -1779-1120 -1136 -708 -828 -2048 -2048 1..6 -11 -417 -39 -:1.3 -460 -875 -1257 -1604 -1773-1132 -1132 -708 -822 -2048 -·2048 62 -22 -429 -40 -15 -462 -877 -1255 -1599 -:1.777-1149 -1127 -716 ··819 ··2048 -2048 67 -28 -440 -4:1- -15 -461 -877 -12~j3 -1596 -1777-:1.149 -111b ·.. 711 -809 -2048 -204R 79 -29 -442 -41 -14 -461 -875 -1250 -1588 -1773·-1134 ·.. 1100 ·.. 697 -B06 -2048 -21"·.8 B(7 -21 -436 -40 -16 -460 -876 -1248 -1582 -1771·.. 1100 ··1089 -661 -805 -2048 ··2048 91 -9 -423 -40 -16 -463 -875 -:1.249 -1578 -1768'-1055 -1086 ·.. 610 -809 -2048 -2048 91 2 -411 -38 -14 -458 -876 -1248 -1580 -1761-1033 -1077 -525 -812 -2048 ··2048 99 11 -405 -39 -15 -460 ··877 -1247 -1573 -:1.745-·10l8 -1.072 -541 -814 -2048 -2048 103 19 -40j. -36 -16 -360 -·730 -1154 -1526 -1703
-982 --1.0b8 -732 -'815 -2048 -2048 -104 17 -398 -37 -15 ~476 -893 -1228 -1550 -·1711-964 -10f,8 -831 -·814 -2048 -·2048 110 18 -397 -38 -14 -478 -906 -1256 -1565 -1709-937 -lol)8 -866 -814 --2048 -2048 109 ?c· -390 -39 -:1.5 -469 -895 -1259 -1575 -:1.701.....,-886 -·:1.0l,3 ·.,8B4 -822 "·204B --2048 109 39 -377 -38 -:1.5 -468 -889 -1257 -1575 -1695--849 -lObS ···984 ··827 -2048 ··204B 107 46 -370 -41 -14 -465 -888 -1258 -1578 -1679-i'BS -:1.075 -1:1.28 ·.. 030 --2048 -2048 109 45 -369 -37 -lb -462 ··885 ··1257 ·-1580 -:1.664-778 -1002 -123:1. -831 -·2048 -·2048 113 41 -375 -37 -14 -464 -881 -1258 ··1580 -1640-·851 -l080 ··120b -826 ·.. 2048 ··2048 :l20 41 -305 -37 -16 -457 -877 -1253 -1578 -1635-908 -l077 -112~j -806 -2048 -2040 j.27 33 -397 -37 -15 -4~;9 -876 -1 ~~53 -1.579 -1654
CD -992 -:1.07:1. ·.. 961 --7B7 -2048 ··2048 j.33 38 -401 -48 -13 -455 -·873 -1247 -1 ~jB3 -1675--10~.;4 -1.063 -883 ··773 -2048 -2048 1 ")C" 43 -397 -40 -14 -455 -876 -1249 -1~580 -1702... ;J
·<1.082 ·.. :1.060 ··8b9 -763 -2048 -2048 :1.:1.8 38 -39b ··38 ··:1.4 ··456 -875 -1249 -1.584 -1732--iOB7 -1057 -El68 -759 -2048 ·<.~048 123 31:' -39~j -39 -17 -45? -874 -·:1.250 -:1.583 -1745..,-1090 -1041 ··859 -7b5 -2048 -2048 127 39 -386 -38 -17 -4~)9 -875 -1247 -1583 -1748..·1066 •. 1. 035 ···869 -769 -2048 -2048 137 4:~ -378 -38 -14 -462 -879 -1247 -1579 -1749-1043 -1.027 --090 -769 -2048 -2048 134 53 -369 -37 -17 -458 -877 -1248 -1577 -1743--1046 -1025 -890 -767 --2048 -2048 135 51. -373 -37 -14 -459 -877 -1248 -1577 -1734-1031 -1006 -895 -763 -2048 -2048 145 52 -3b9 -37 -18 -466 -·877 -1254 -1573 -1731-.. 1003 -990 ·-909 -757 -2048 -2048 154 55 -361 -36 -14 -4~j9 -8b6 -1234 -1567 -1721
-975 -979 -926 -744 -2048 -2048 143 63 -357 -37 -16 -455 -8t)1 -1219 -1557 -1706-944 --957 -911 -765 -2048 -2048 132 56 -349 -35 -14 -460 -834 -1175 -1537 -1684-922 ·-944 -845 -804 -2048 -2043 135 52 -3:j3 -37 -14 -437 -744 -1059 -1460 -1635-928 -·943 -797 -867 -1855 -1776 143 52 -359 -35 -15 -304 -511 --893 -1329 -1559
-1222 -950 -745 -907 -2BO -1~;66 150 59 -398 -39 -14 -69 -158 -637 -·1119 -1446-1303 -964 -758 -909 -109 -1586 158 58 -398 -37 -14 -189 -330 -707 -1121 -1500-1303 -990 -798 -875 -128 -1660 165 59 -385 -37 -15 -284 -491 --812 -j.170 -1556-1263 -1024 -773 -830 -275 -J,785 179 71 -~/-1 -36 -15 -358 -643 -940 -1239 -1601-1259 -1040 -768 -809 -282 -1893 197 80 -362 -37 -14 ·..384 -7~~8 -10:~6 -1311 -1643-1266 -1054 -793 -793 -274 -2014 201 79 -3bO ··36 -:1.6 -40:1. -786 --1:1.21 -1385 -1685-1255 -1069 -796 -791 -314 -2048 229 87 -352 -35 -17 -42~j -040 -1195 -1453 -1726-1249 -1079 -762 -790 -341 -2048 243 97 ·-347 -35 -13 -434 -ElbB -1255 -1514 -:1.761-1216 -1082 -752 -793 -405 -2048 252 99 -336 -34 -16 -449 -884 -:1.278 -1550 -1788
~ 177701.) :1.77706 j,77706 17'?706 l7?/Ot> 177706 1. 77706 :1.77706 f77706 177706 177706 1.?770b :l.7770b :l.7770c) 17770b
CD 1~S2706 152706 152706 157706 1~i7706 1. :j7706 152706 152706 152706 :1.52706 152706 :1.57706 157706 1~:j7706 1.57706 157706i"5'7706 1~:i7706 157706~ 177706 177706 .mi:QI 15{)702~ 152706 152706 152706 156706~ :t. ~j7706 157706157706 157706
40 'lO 40 40 40 40 40 40 40 40 40 40 40 40 40 4040 40 40 40 4u 40 40 40 40 40 40 40 40 40 40 40
CD40 40 40 40 40 40 177302 177020 177777 177306 6027 214?1 177302 171.043 177777 1~j7706
6047 32030 40 157702 171.022 177777 157706 6051 2142j. 157702 171002 177777 157706 6030 31030 i'577'06g02l 32030 157712 6040 33022 156702 171221 :1.77777 40 156706 6042 30024 156702 171046 177777 1567066060 23424 156702 171101 177777 152706 6051 23424 40 40 40 40 40 40 40 40
40 40
0 DATA BLOCK NO.
Figure 3. An example of one 5 s data record read from the digital magnetictape. The four independent data blocks are numbered in the figure;their content is described in the text.
18
The A/D records in block No.2 are for the 16 channels from left to right, andthe entries are printed in decimal values. Block No. 3 contains the receiverstatus/alarm data, entered in an octal code for the 16 bits of information.The data in block No. 4 are the burst-error data as recorded from the MK-4 instrument. The entry "40" represents the 100 ms timing marks within the block, duringwhich no error or alarm data were received. Starting after the 38th time mark(3.8 s after the record time in block No.1) the data indicate that either a burstof error or a receiver status signal was received. The data entries are treated ingroups of three octal numbers, which show the digital st~tus of all three I/Oboards in this block. An interpretation of some of these octal entries is givenlater in this section.
Details of the error performance data are given in Table 2, where the Codenumbers are identified (including the Code 3 discussed above). The distributiondata accompanying each Code is also given in Table 2.
A complete analysis of the recorded data has not been made at this writing.Some analyses are in process by PMTC, and a detailed analysis is anticipated as anew project at ITS. This section is provided merely to indicate the manner inwhich the data were formatted, and the methods for compiling the results. It canbe seen, for example, that a complete distribution of error-free time can be readilycompiled by totalizing the time for Code 3 entries. In like manner, the following
are examples of the statistical data that will be developed in future analyses fromthe error data:
1. distribution of the lengths of error-free sync periods (from Code 0 and
Code 1 data);2. distribution of error-free gaps (Code 1 and Code 2 data);3. distribution of error-bursts;4. distribution of the number of subsequent error bursts;5. distribution of the error-free periods between bursts (>gap length);6. distribution of error-burst lengths;7. distribution of the number of errors within a burst;8. distribution of the ratio of burst length to error count within a
burst; and9. distribution of sync-loss counts and duration.
The above list is not exhaustive, but it includes the major distributions that canbe readily obtained with the proper search program of the data tapes. Since thesedata are essentially synchronous with the propagation-oriented data, the potential
19
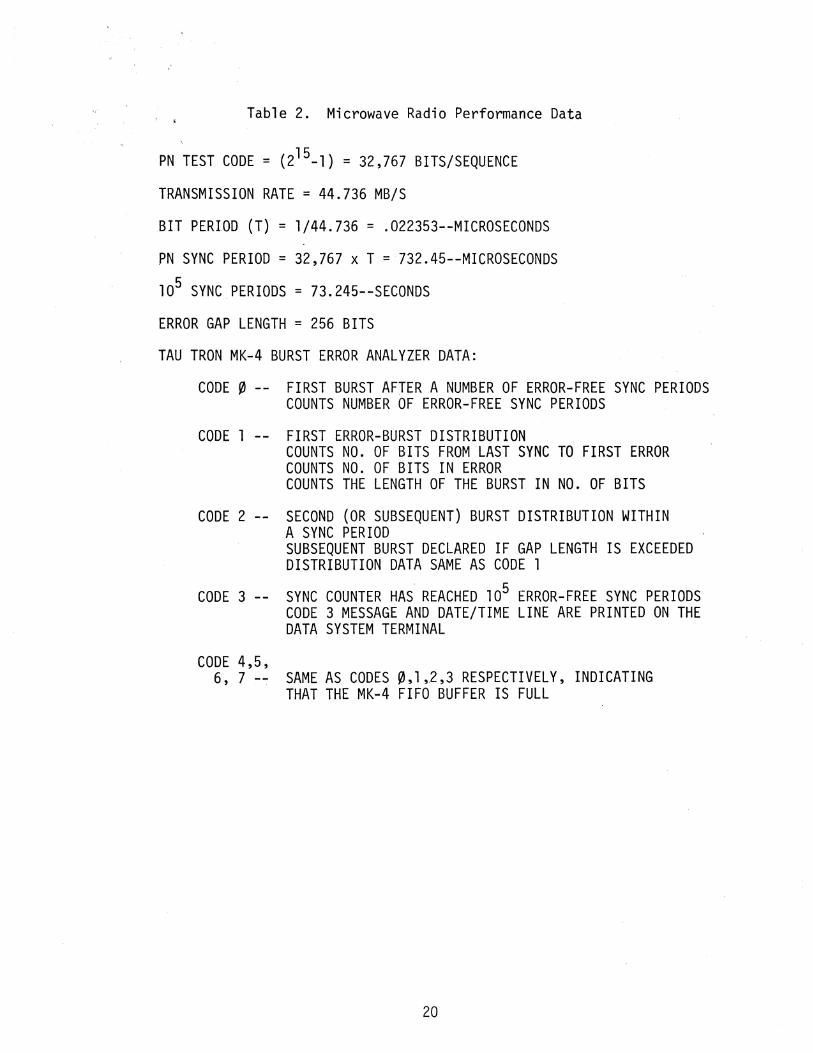
Table 2. Microwave Radio Performance Data
PN TEST CODE = (215_1) = 32,767 BITS/SEQUENCE
TRANSMISSION RATE = 44.736 MB/S
BIT PERIOD (T) = 1/44.736 = e022353--MICROSECONDS
PN SYNC PERIOD = 32,767 x T = 732.45--MICROSECONDS
105 SYNC PERIODS = 73.245--SECONDS
ERROR GAP LENGTH = 256 BITS
TAU- TRON MK-4 BURST ERROR ANALYZER DATA:
CODE 0 -- FIRST BURST AFJERA NUMBER OF ERROR-FREE SYNC PERIODSCOUNTS NUMBER OF ERROR-FREE SYNC PERIODS
CODE 1 -- FIRST ERROR-BURST DISTRIBUTIONCOUNTS NO. OF BITS FROM LAST SYNC TO FIRST ERRORCOUNTS NO. OF BITS IN ERRORCOUNTS THE LENGTH OF THE BURST IN NO. OF BITS
CODE 2 -- SECOND (OR SUBSEQUENT) BURST DISTRIBUTION WITHINA SYNC PERIODSUBSEQUENT BURST DECLARED IF GAP LENGTH IS EXCEEDEDDISTRIBUTION DATA SAME AS CODE 1
CODE 3 -- SYNC COUNTER HAS' REACHED 105 ERROR-FREE SYNC PERIODSCODE 3 MESSAGE AND DATE/TIME LINE ARE PRINTED ON THEDATA SYSTEM TERMINAL
CODE 4,5,6, 7 -- SAME AS CODES 0, 1 ,.2 ,3 RESPECTIVELY, INDICATING
THAT THE MK-4 FIFO BUFFER IS FULL
20
for meaningful studies of the correspondence between these data is quite high. Asone example, consider the corr1elation between spectral distortions nleasured bythe "tilt ll and IInotch li signals in the A/D data bank, and the detailE~d error analysislisted above. The results will illustrate what the most important performanceparameters are and should lead to conclusions toward methods of improving the performance. This aspect, coupled with an evaluation of the meteorological descriptionof the transmission channel, offers an approach to the analysis that encompassesall of the system and propagation variables.
The status/alarm data from the experiment expand the concepts noted above.For example, distributions of the diversity switching and duration of time that agiven receiver is selected are also available from the data. Referring to Table 1,other significant parameters for analyses are:
1. Rail clock statistics2. Bit alignment characteristics3. BER alarm distribution for independent diversity receivers4. Loss of frame data for each diversity receiver.
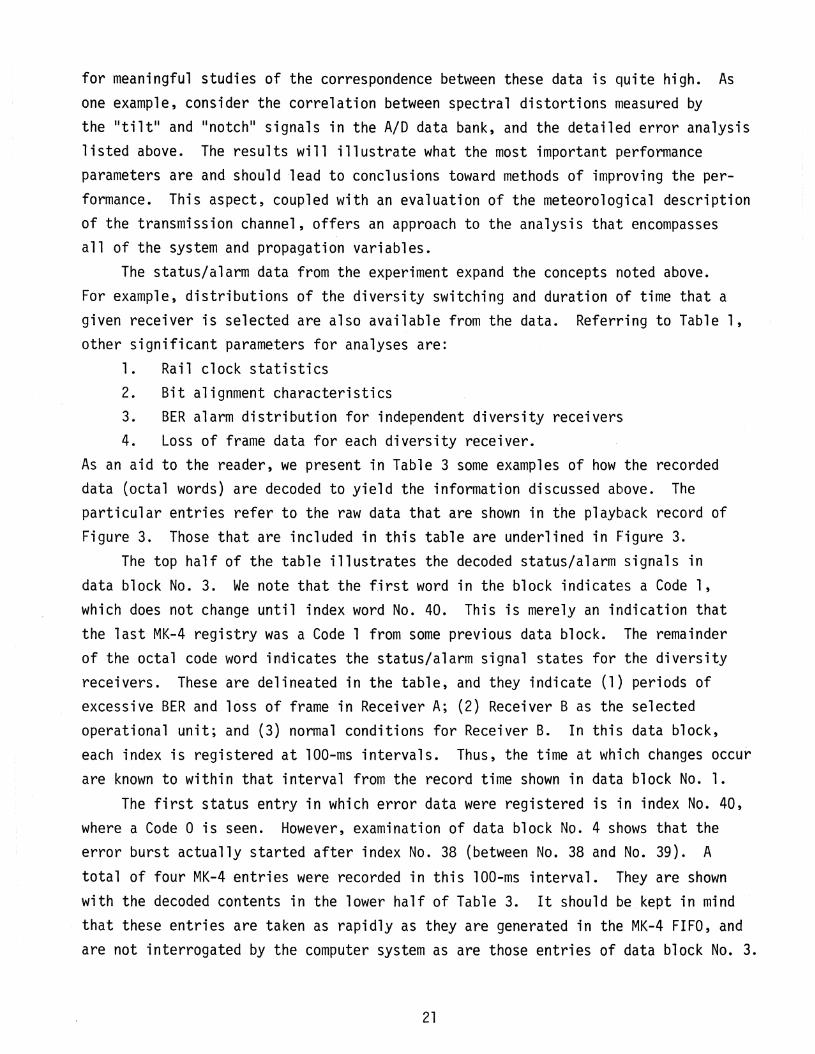
As an aid to the reader, we present in Table 3 some examples of how the recordeddata (octal words) are decoded to yield the information discussed above. Theparticular entries refer to the raw data that are shown in the playback record ofFigure 3. Those that are included in this table are underlined in Figure 3.
The top half of the table illustrates the decoded status/alarm signals indata block No.3. We note that the first word in the block indicates a Code 1,which does not change until index word No. 40. This is merely an indication thatthe last MK-4 registry was a Code 1 from some previous data block. The remainderof the octal code word indicates the status/alarm signal states for the diversityreceivers. These are delineated in the table, and they indicate (1) periods ofexcessive BER and loss of frame in Receiver A; (2) Receiver B as the selectedoperational unit; and (3) normal conditions for Receiver B. In this data block,each index is registered at 100-ms intervals. Thus, the time at which changes occurare known to within that interval from the record time shown in data. block No.1.
The first status entry in which error data were registered is in index No. 40,where a Code 0 is seen. However, examination of data block No. 4 shows that theerror burst actually started after index No. 38 (between No. 38 and No. 39). A
total of four MK-4 entries were recorded in this 100-ms interval. They are shownwith the decoded contents in the lower half of Table 3. It should be kept in mindthat these entries are taken as rapidly as they are generated in the MK-4 FIFO, andare not interrogated by the computer system as are those entries of data block No.3.
21
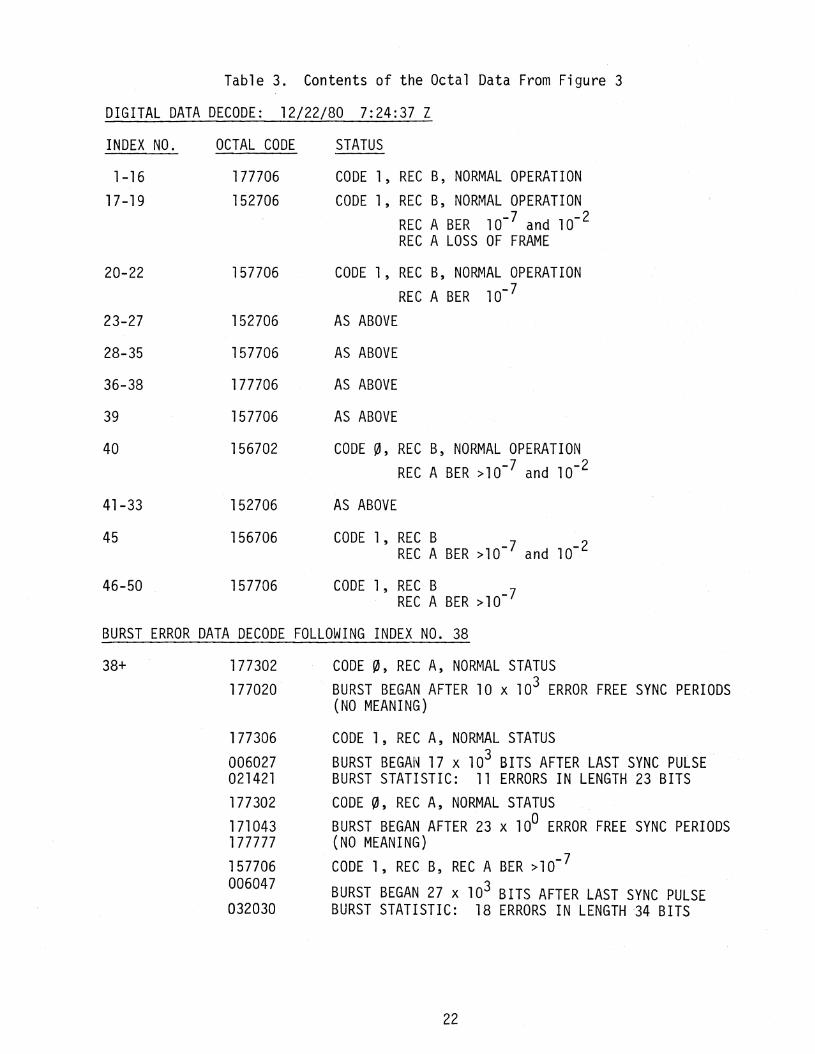
Table 3. Contents of the Octal Data From Figure 3
DIGITAL DATA DECODE: 12/22/80 7:24:37 Z
INDEX NO.
1-1617-19
20-22
23-27
28-35
36-38
39
40
OCTAL CODE
177706152706
157706
152706
157706
177706
157706
156702
STATUS
CODE 1, REC B, NORMAL OPERATIONCODE 1, REC B, NORMAL OPERATION
REC A BER 10-7 and 10- 2REC A LOSS OF FRAME
CODE 1, REC B, NORMAL OPERATIONREC ABER 10- 7
AS ABOVE
AS ABOVE
AS ABOVE
AS ABOVE
CODE ~, REC B, NORMAL OPERATIONREC A BER >10- 7 and 10-2
41-33
45
152706
156706
AS ABOVE
CODE 1, REC BREC A BER >10- 7 and 10- 2
157706 CODE 1, REC B -7REC A BER >10
BURST ERROR DATA DECODE FOLLOWING INDEX NO. 38
46-50
38+ 177302177020
177306006027021421177302171043177777157706006047032030
CODE~, REC A, NORMAL STATUSBURST BEGAN AFTER 10 x 103 ERROR FREE SYNC PERIODS(NO MEANING)
CODE 1, REC A, NORMAL STATUSBURST BEGAN 17x 103 BITS AFTER LAST SYNC PULSEBURST STATISTIC: 11 ERRORS IN LENGTH 23 BITSCODE ~, REC A, NORMAL STATUSBURST BEGAN AFTER 23 x 100 ERROR FREE SYNC PERIODS(NO MEANING)CODE 1, REC B, REC A BER >10- 7
BURST BEGAN 27 x 103 BITS AFTER LAST SYNC PULSEBURST STATISTIC: 18 ERRORS IN LENGTH 34 BITS
22
The sequence of events during the time between the 38th and 39th index can begleened from the decoded entries in Table 3 (lower half). They show that thesystem switches to Receiver A in-service, and that this data burst occurred 10,000error-free sync periods following the last error burst (approximately 7 s previous).
The first error in the burst came 17,000 bit-times after the last sync pulse. Theburst itself contained 11 errors in a burst length of 23 bits. Th~= third group inthe series shows that another burst started after 23 error-free sync periods. Thisburst started with an error l~7,OOO bits after the last sync pulse; it contained 18errors in a length of 34 bits. The fourth group of octal words also shows thatanother receiver swit~h to Receiver B was made. All of this activity tookplace within a 100 ms interval (between the 38th and 39th index). A further lookat data block No.4 in FigurE~ 3 shows that more burst-error data were receivedbetween indices 39 and 40; a total of six 3-word entries that we have not decoded.
The above example has been presented only to convey a sense of the methodsused in both collecting these data and analyzing their results and meaning. The ITSis currently in the process of developing the computer routines and programs thatwill automatically retrieve, decode, and display these results in accordance withthe analysis summaries outlined earlier in this section. When this project iscompleted, a technical report in the NTIA series will be published.
6. PRELIMINARY RESULTS AND DISCUSSIONThree specific periods of data acquired during the experiment have been
analyzed and they are presented in this section as preliminary results. The selecteddata will illustrate the performance measure, the correspondence of the propagationfactors, and some special measurement results. The preliminary data analysis doesnot include any summary of the burst-error statistics.
The first two samples of data that were analyzed were taken from periods oftime when the measured multi path in the transmission channel was considered to beboth "typical" and "severe.1I These characteristics are based on the magnitude of
the delayed components, and the dynamic behavior as observed in the PN ChannelProbe Data. A fairly typical period during the experiment was seen on 7 August 1981.
The transmission channel was characterized by a strong superrefractive layer withits base at an elevation between 335 and 396 m (1100 to 1300 ft) above mean sea
level (msl). The layer produced atmospheric multipath with delays on the order of6 to 8 ns, where the delayed component was occasionally greater in magnitude than
the more direct response. The multipath was observed in both diversity receive
23
channels, but generally not at the same time. A detailed description of the impulseresponse data (multipath) that are found to be quite typical for the PMTC test linkcan be found in the report by Hubbard (1979). Examples of the meteorological data(refractive index profiles) are given later in this section.
The type of multipath propagation that is created by the refractive layer overthis path can be visualized from Figure 4. The figure is a ray-trace cross sectionl
produced in a computer program, where the refractive index profile (computed fromradiosonde data) is used to represent the propagation medium. In this case, theprofile is shown as the modified refractivity in M-units (Bean and Dutton, 1966).
One terminal of the LP-SNI link is indicated on the elevation ordinate. The outerterminal is shown at a distance of approximately 56.5 nmi (104 km). The multipathenvironment at the latter terminal is quite obvious from this figure. Other methodsfor relating the meteorological data and the measured multi path delays have beenshown by Hubbard (1979; 1982). We include Figure 4 as one example of the ray-tracemethod. Examples of a graphical method are presented below.
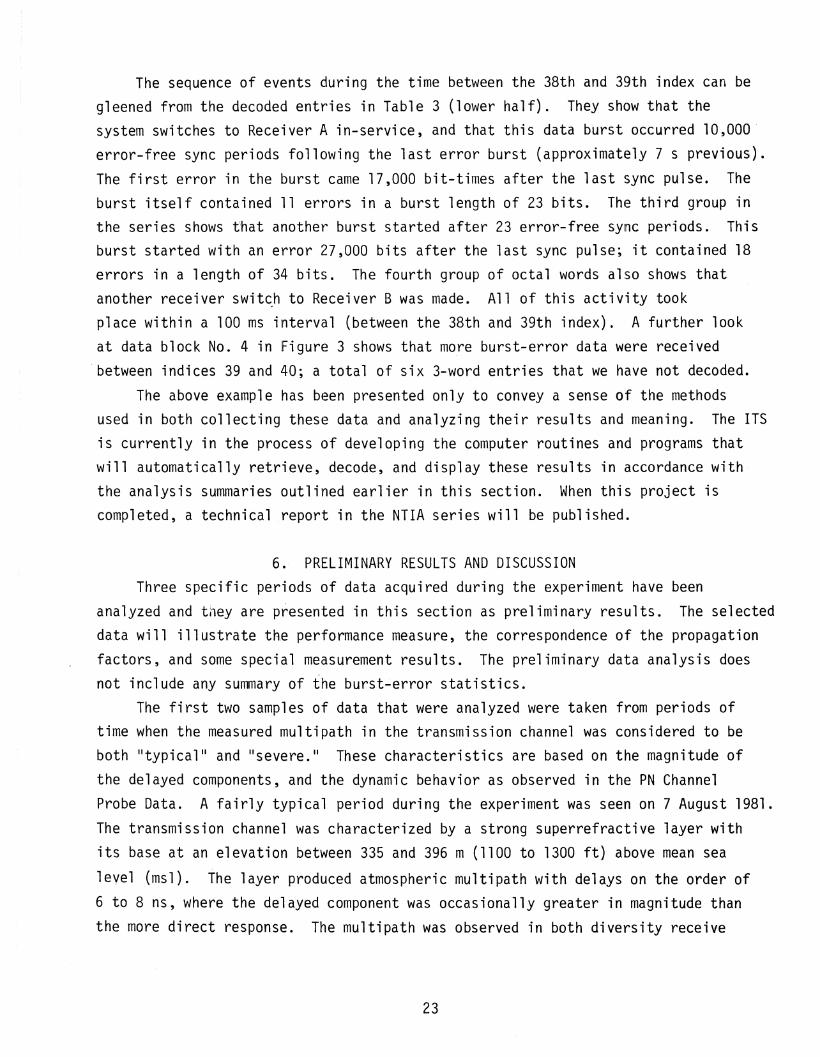
Figure 4 illustrates that under the refractive conditions for the tests on7 August 1981, the primary multipath is a result of surface reflection. Thiscondition is created, however, by the elevated layer. This fact is confirmed fromthe ray-trace result shown in Figure 5. Here, a standard-atmosphere profile is usedto characterize the propagation, and there is no resulting surface or other multi
path from within the main lobe of the antenna patterns.The data that have been analyzed for 7 August 1981 are summarized in Tables 4
and 5. At this time, both the PMTC radio and the DRAMA radio were under test overthe same space-diversity link configuration. The performance data for each radiois therefore shown in the tables, and a direct comparison of their performance canbe made. However, several important aspects must be considered before any quantitative
conclusions are drawn on the basis of these data. These are:1. The PMTC radio operates with a form of adaptive equalization in each
receiver, which compensates for certain multi path distortionsin the baseband signal (Hartman and Allen, 1979). The DRAMA radio
did not use any form of adaptive equalization.2. The two radio systems were operating over precisely the same space
diversity paths, but at different radio frequencies. Multipath
propagation does not necessarily manifest itself on different
1Courtesy of the PMTC Geophysics Laboratory (by permission).
24
92
~_J f) E ! ~~ FT. -7lsJ W .r: ..r:rst VI tsJ V1~ tsl IS! rszts! ISJ ts1 ~,
- - hl h.J~ V1 t'Sl VI;I lSI tsl tsJ, ts1 IS! ~
! ,:~ I (.:~
.,.,.....<.0c:~(1)
~.-......1-1
::::r):::Irpc<.03c: 0(/)0c-t' .........,..........~rp
CO 0-.....
AJ:0
---I-<
Orl[TlfT}-[LJII 11 11
IrsJ~lS1
14S0 FT .
I~
1[1~
zz
---~~,~'~-""""~,~... -/"t"";"~-:/'i#.;rl~;r.\~;,\,~~,~~~~~~* "
~~~~Z, "H.~t.r"'. ~\·~'\\\'W\.-·~~~'''·" tr n Z---"'-'/~'j ""'''''!l 'i;l"\~ \ "~~~~h ts:! y'l v I
-Y~1!i!iljl'l~1\W\\\\\~\~~~~~~~,,~~~~.~,\~,- l~ lSi IS! -1 ~..-.,. '90"~~?£~011/(11"1 't \~~ ~~~":-;:--.,~ /L!~, 1, ., , , , :-'::.~,'-.k/':/~ h!;t·lil,.' \\ ~~"'''~ 0 0 0 0 -nA1 23~~ / Ji/i/jill'l' \\~~~~~~ fT1 rt1 fT1 ~]] ~~~~~~/JIII 1/" \~\"\~'.:-~,~~" Gl U1 G1 J (1Z
~~ti( j/~' :;! r j I \\\~~~,~~~ '-l fT13
r? $"~;o;n,,-~'" I 'I \" ":'''''~~'''-::~ I~ ~".o//~~~, ~ I /, \" ""-. 0...~~~~~~m Jn~~. ~':'~~~-Lfl" \ " ..., " ~':..~." ~ ..,~ r-I 'I ~ ,. ~. :'>"'" ~N ; \ " ......, '-,....... L-
:)'V:).."~''''''.>t'-'"').~~:gj..~:",,\.\. ~ ",,~~~~ 0:'A~ \. ".......,;,<.. -' ,'" J..~\.'\..... "'... ...........""'" .............{j.~.:F\?-...'l''9.~~v~~~~~~~"""""" . ~~,~ OJ U1ll- 'k~v<, \~~l\\\...,\'\.ZZZ, , " "', '",- ~,,_ U1,:;...; ,", '~~'\\'\\\'\\ , ...., "'""""'-- .......' " ~""";~\\(\\\\\\~~~~~"""''''' ",\, ... \. \'.\'... \ '\ .... , '- , " I
a , ,", \\"'\\'\\,\\{\ \ '\ '- ' ...', , '- '- ::-- :::~, I W -f.... , \ 'l\~m. \ ,.... " "... ..... rn.%'\.. .... ','t"\'t\\\ \ , '- '- ..... '-
\ '\ , , '~'{i,;\t\!'n\\,\ \', ' ';:, , , ..... ::: '" _- , , ',', "",,\\\\t\,,'\\ '\, '\ ' '," '.::: ~ ~ N 0
' , \wmn\\, '\ , , , "'", , ~~ 8~-l\~ ',....'\\'~nm~l\\\"' .... '\ .... ,..... , " ','..: :::~ z" '\ "'tr.:n~t. \'" '- '- ......
" , , ',\tttmum" \ '\ '\ , ','.... .... ........"..... '. ~...... •" , , " '\ m:::1m~i \ \ " , ' , " " " ..... " "" " ,,,nmm \" '\, "" ""9~ .p." , ". ... "r.:::mn \ \ \. \. .........., "....."" , ""-mll ..,'.......""" .......... \" ,,,"' \. , •'\ \\n::tat' \ '\ \.
'" , '- \ • \tC:tI I t" " .\. ..
c-t's:;lJ::sc-t'
-sQJ'<
IIc+-ss:;lJn(l)
(')
-sotiltil
Vl(1)(')
c-t'.....o::s
cr~
c-t":::r(1)
r""0I
(.I)
Z......
,.....
. ~
(1)....,~s:;lJ(')
c-t'.....
::s7'
,0::s
<.....
.....
c-t''<-0~o....,..........ms:;lJ::s0-
~(1)(/)
c:.....
lSJIS!
lSJ01
!SJW
IS1,.......lSJ10
lSJLt1
~:r-
~fl1
~N
i i • -----n--,-~--------i • ----r----~--l---_____,
1. ~ L __ ._. .f . ...I __.~ __~ fl _ . L t________ J II
RRNGE IN N.MI. 7
lSJ-
E2== 0.5:0EI==-0.5:0DE: 121.02
f--Irc
r-
l'
5:00
[[ 1000
o It I I i I fr::l lSJ ~:l tsJ 5J IS]vl ~ itl ~ ~
PHTC ftJ fTl I'll ::r :rS£OPHYSI<.:S M U I' 1fT 5DIVISION -. ~ I
MODIFIEDREFRRC1" I V I TY
s:rn00 T
~S:0(J .
Y000 " -r-R I .u...r-
~ 35:r10 1- I .,. rsJLt1:r
Z 3000
:25:00 -~WNm ::J 2000
Figure 5. The ray-trace cross section for propagation in a standard atmosphere over the LP-SNI link.
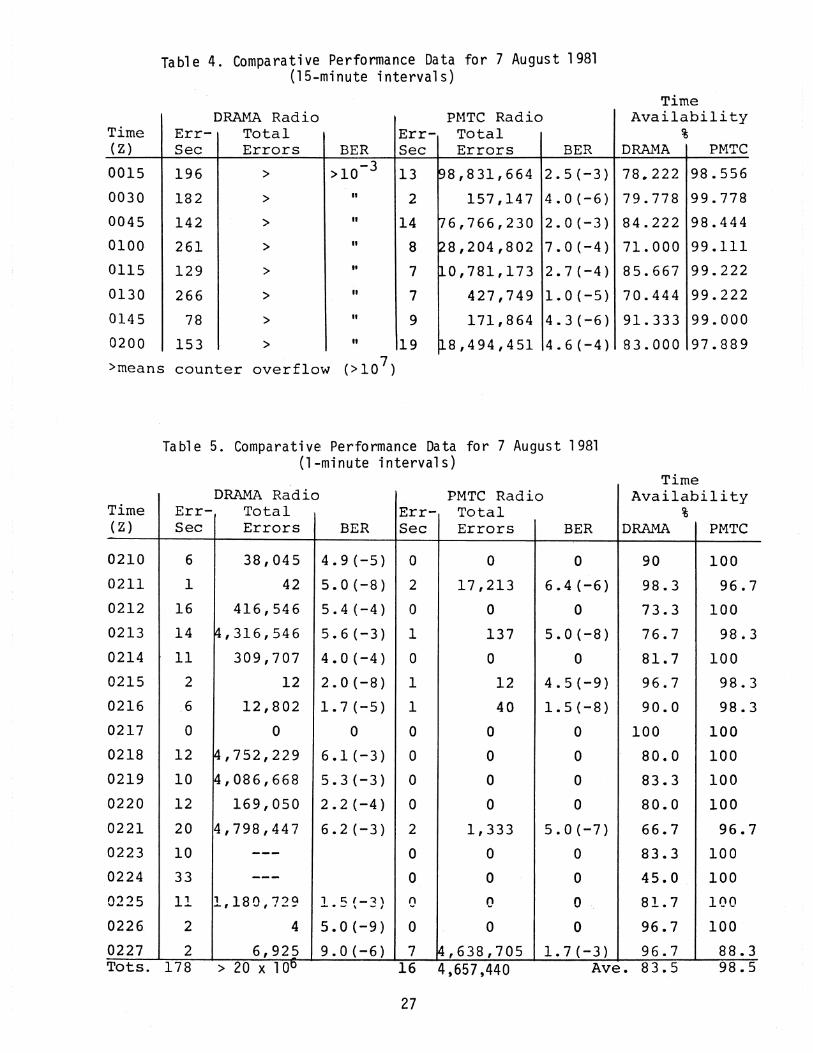
Table 4. Comparative Performance Data for 7 August 1981(15-minute intervals)
TimeDRAMA Radio P~1TC Radio Availability
Time Err- Total Err- Total %(Z) Sec Errors BER Sec Errors BER DRAMA PMTC
0015 196 > >10- 3 13 S8,831,664 2.5(-3) 78.222 98.556
0030 182 > " 2 157,147 4.0(-6) 79.778 99.778
0045 142 > II 14 i16,766,230 2.0(-3) 84.222 98.444
0100 261 > " 8 r28,204,802 7.0(-4) 71.000 99.111
0115 129 > ,. 7 1l0,781,173 2.7(-4) 85.667 99.222
0130 266 > II 7 427,749 1.0(-5) 70.444 99.222
0145 78 > " 9 171,864 4.3(-6) 91.333 99.000
0200 153 > " 19 118,494,451 4.6(-4) 83.000 97.8897>means counter overflow (>10 )
Table 5. Comparative~ Performance Data for 7 August 1981(l-minute intervals)
Time
98.5Ave. 83.516 4,657 ,440
27
Tot s • 1 7 8 > 20 x 10
DRAMA Radio PMTC Radio AvailabilityTime Err- Total Err- Total %(Z) Sec Errors BER Sec Errors BER DRAMA PMTC
0210 6 38,045 4.9(-5} 0 0 0 90 100
0211 1 42 5.0(-8) 2 17,213 6.4(-6) 98.3 96.7
0212 16 416,546 5 • 4( -4 ) 0 0 0 73.3 100
0213 14 ~,316,546 5.6(-3) 1 137 5.0(-8) 76.7 98.3
0214 11 309,707 4.0(-4} a 0 0 81.7 100
0215 2 12 2.0(-8} 1 12 4.5(-9) 96.7 98.3
0216 .6 12,802 1.7(-5) 1 40 1.5(-8) 90.0 98.3
0217 0 0 0 0 a 0 100 100
0218 12 ~,752,229 6.1(-3) a 0 0 80.0 100
0219 10 4,086,668 5.3(-3) a 0 0 83.3 100
0220 12 169,050 2.2(-4) a a 0 80.0 100
0221 20 4,798,447 6.2 (-3) 2 1,333 5.0(-7) 66.7 96.7
0223 10 --- 0 0 0 83.3 100
0224 33 --- 0 0 0 45.0 100
0225 11 1,180,729 ,~(-~, 0 0 0 81.7 100--. - \ - I
0226. 2 4 5.0(-9) 0 0 0 96.7 100
0227 2 6,925 9.0(-6) 7 ~,638,705 1.7(-3) 96.7 88.310
carrier frequencies at the same instants of time. Statistically, onemight expect this disparity to vanish over a sufficient length of time.However, the data sample in Table 4 is not deemed to be long enough forsuch a conclusion. (This aspect will be treated in future analyses.)
3. The two radios both use diversity switching from one receiver to theother. However, the algorithms used for switching decisions are quitedifferent (discussed later in this section).
4. The two radio systems operate with different modulation methods andmission bit rates. The PMTC mission bit rate was 44.7 Mb/s. TheDRAMA radio was operated in a QPR mode with an aggregate bit rate of26.112 Mb/s (composed of two mission bit streams of 12.928 Mb/s each).The spectra of the mission signal of the two systems are however, comparable. The bandwidths are approximately 20 MHz and 14 MHz, respectively.
The results in Table 4 show that neither of the two digital radios performed wellin themultipathenvironment. In each 15 min. interval, the total bit-error countin the DRAMA radio data exceeded the allotted counter capacity (107 bits), so theseresults were lost. Over the entire 2-hour sample, the DRAMA radio registerednearly 18 times more errored-seconds than did the PMTC system. This factor isroughly the same when the data are compared on the basis of total errored-seconds,or on the average of the l5-min. interval data. A significant portion of thisdifference in performance can probably be attributed to the adaptive equalizercompensation in the PMTC radio. However, the other factors noted above may also becontributors to this rather disparate result.
The time availability factors given in Tables 4 and 5 are calculated as theratio of error-free seconds to the number of seconds in the interval. These valuesindicate that the PMTC system performance was significantly better overall. However, the HER performance of this radio was much lower than desired.
Following the two-hour test shown in Table 4, a single 15-min. interval wasanalyzed where the data were accumulated in l-min.intervals. These results areshown in Table 5. The errored-second data for each radio shows that this interval
is very close to the median of the l5-min. intervals in Table 4. The DRAMA radioregistered an excess of 20xl06 bit-errors in the interval, which is equivalent toa BER of approximately 1.7xlO-3. The overall BER for the PMTC radio is on the
order of 1.2xlO-4; only about one order of magnitude better. However, it can beseen that the short-term (within the minute) data are considerably different. Thelast ent~ (0227Z) for the PMTC radio obviously has the greatest impact on theBER for the interval, as it consists of 'about 99.5% of all the errors made. If
28
this minute of data were dropped from the summary, the PMTC radio BER for the inter-7val becomes 4.7xlO .
If a criterion for system outages is based on minutes in which the BER>10-6,the short interval of data in Table 5 would show that:
1. The DRAMA radio was below the performance threshold for 13 minutes;approximately 87% of the time.
2. The PMTC radio was below the threshold for 2 (non-consecutive) minutes;approximately 13% of the time.
Another way of measuring or comparing performance is based on the error-freeseconds, which has been done in Tables 4 and 5 and listed as time availability (TA).On this basis, the difference in performance is not quite as extreme as thosebased on BER or BER/threshold t but it is still a considerable difference. Thesevarious measures of performance illustrate a problem that deserves greater attention. The measure used shou"ld be one that is most reflective of the performance ormission requirements of the system. For the tests reported here, the most meaningful data are considered to be the error-free seconds performance measure, with adetailed analyses (to.be performed) that will characterize the distribution oferrors within an errored-second and the distribution of the errored-seconds.
The performance data and the propagation data for the period 18-20 August 1981was of particular interest. During this time, two 24-hour periods were observedthat could be described as b~~ing among the best and worst performance periods.An interesting sidelight is that the two periods were contiguous. The performancedata for each of these periods are presented in Table 6.
The first 24-hour run shows results that are near the desired performance forthe PMTC radio (99.999% TA). However, in this period of mild multipath, the DRAMAradio performed below the desired or expected level. The errored-seconds areseen to be about 250 times higher, and the BER is worse by 4 orders of magnitude.The loss-of-sync data differ by a factor of 30.
The second 24-hour run (J9-20 Aug.) represents a typically severe period ofmultipath activity. Here, the errored-seconds differ by a factor of approximately
·5, and the BER performance factors are nearly the same for the two radios. However,the TA factor for the DRAMA radio has decreased by about 15 percentage points compared to less than 3 for the PMTC radio. Other status/alarm data may be compared
from the entries in Table 6. Note, however, that some of these data are for
individual receivers in the PMTC radio. The loss-of-frame sync and the BER alarmdata for the DRAMA radio are for both receivers combined. The relative performance factor for this run (based on TA) is seen to be 1.15, which is close to that
29

Table 6. PMTC Radio Performance Data18-20 August 1981
PERFORMANCEPARAMETER
PMTC Radio
2000Z18 Aug
(1300 PDT)
toTIME
2000Z 2000Z19 Aug 19 Aug
(1300 PDT) (1300 PDT)to 2000Z
20 Aug(1300 PDT)
No. Errored-Seconds
Total Bit Errors
Average BER
BER >10- 7 (Rec. A)
BER>10-7 (Rec. B)
Loss of Frame (Rec. A)
Loss of Frame (Rec. B)
Diversity Signal Loss
Oi vers i ty Frame Loss
Diversity Sync Loss
%Error-Free Sec. (TA)
DRAMA Radio
2 2,311
34,581 > 109
9.1xl0- 9 6.2xl0-4
127 9,450
63 1] ,811
2 5,484
22 6, 195
0 0
0 1,232
0 1 ,245
99.9976 97.3252
No. Errored-Seconds 497 10,147 **Total Bit Errors 47,525,214 399,761,740
Average BER 4.3xl0-5 4.6x10⁻⁴
No. Rec. Switches 1,056 13,125
Loss of Frame Sync 697 29,71 9
BER 10- 3 (A1arm ) 8,319 540,772
%Error-Free Sec. (TA) 99.4248 84.7643
** Based on 18.5 hours of data; 5.5 hours lost when data system ran out of tape.
30
calculated for other test periods. The loss of data for the DRAMA radio would havean effect on this result.
In the following paragraphs, we will discuss the results shown in Table 6 w1threspect to the propagation and meteorological data.
The refractivity structures in the atmosphere for the dates 18 and 19 Augustwere obtained from the PMTC radiosonde data. We include plots of these profilesas examples to convey the source of the atmospheric multipath, and essentially toclose the loop on the related analyses used in the data processing; i.e., the radioperformance data, the propagation (impulse response) data, and finally the meteorological data.
The refractivity data were measured and furnished to ITS by the PMTC Geophysics Laboratory. This group obtains at least two soundings of the atmosphereeach day; one taken on the coast at Point Mugu and a second sounding from SNI. Thesedata have proven to be invaluable in analyzing the source of multipath over theLP-SNI link. The techniques that have been used are reported by Hubbard (1979).Specific examples of these analyses are presented later in this section.
Figures 6 and 7 show the refractivity structure measured on 18 August 1981.Figure 6 shows the profiles as they appeared near LP (Point Mugu data), and Figure 7shows the companion soundings made at SNI. Note that a very strong inversion/ductinglayer is seen in both sets of profiles, and that it was ve~ stable in elevation for aperiod of several hours between soundings. Several other features should be noted:
1. The gradient of the layer is extremely superrefractive; well abovea trapping value.
2. The layer is tilted downward off the LP coastline, as its elevationis approximately 150 m (500 ft) lower at SNI during the soundingsof late afternoon and evening.
3. The layer is well above the normal propagation path, as can be seenfrom its height with respect to the LP and SNI terminal elevationsshown on the ordinates of the figures.
In the references noted previously, it has been shown that this refractive
condi,tion on the LP-SNI link produces multipath delays that correspond geometrically
with the boundaries of the layer. When the refractive layer is as high above the
path as it is in this cas~, the layer is not well illuminated by the link antennas.
Thus, the multipath components are typically long in delay but low in magnitude.This is consistent with the data measured in the experiment on this date. However,when the refractive layer is tilted in elevation, the possibility of significantmultipath is increased.
31
1000 TPM 1734 Z
I800
Plv1 11 39 Z
(/) 6000::W.-w:E:
STANDARDz0.....-tt-<::
l~ LP:::-.....400--!
LJ.J
SNI
20
280 300 320
N UNITS
340 360
Figure 6. Refractive index profiles measured at Point Mugu on18 August 1981.
32
1000T
I
800
\
\~STANDARD
'" ""-
" " ~~ TRAPPING.,'; SNI
I!
200 ;
I
V')6000:::
L..LJt-w:E:
z0...... SNI 1620Zt-c:r:::- LPw i'"
-J 400 ILLJ
280 ,300 320
N UNI TS
340
Figure 7. Refractive index profiles measured at San Nicolas Island (SNI)on 18 August 1981.
33
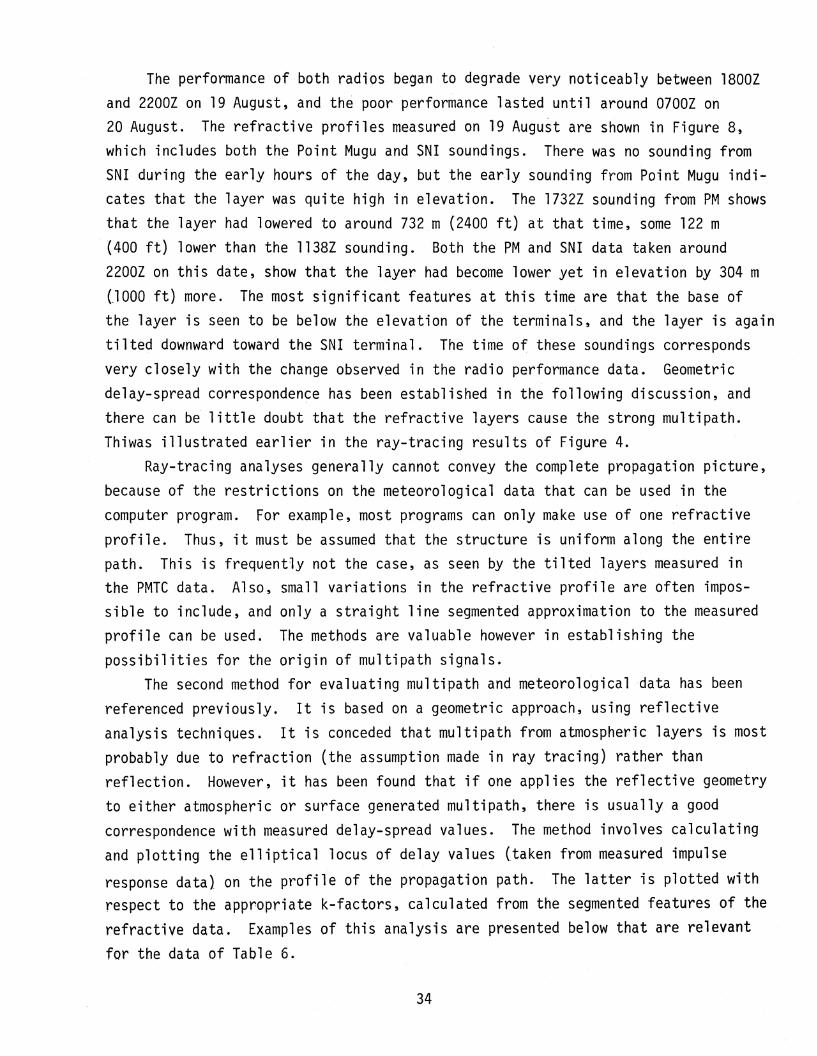
The performance of both radios began to degrade very noticeably between 1800Z
and 2200Z on 19 August, and the poor performance lasted until around 0700Z on20 August. The refractive profiles measured on 19 August are shown in Figure 8,which includes both the Point Mugu and SNI soundings. There was no sounding fromSNI during the early hours of the day, but the early sounding from Point Mugu indicates that the layer was quite high in elevation. The 1732Z sounding from PM showsthat the layer had lowered to around 732 m (2400 ft) at that time, some 122 m(400 ft) lower than the 1138Z sounding. 'Both the PM and SNI data taken around2200Z on this date, show that the layer had become lower yet in elevation by 304 m(1000 ft) more. The most significant features at this time are that the base ofthe layer is seen to be below the elevation of the terminals, and the layer is againtilted downward toward the SNI terminal. The time of these soundings correspondsvery closely with the change observed in the radio performance data. Geometricdelay-spread correspondence has been established in the following discussion, andthere can be little doubt that the refractive layers cause the strong multipath.Thiwas illustrated earlier in the ray-tracing results of Figure 4.
Ray-tracing analyses generally cannot convey the complete propagation picture,because of the restrictions on the meteorological data that can be used in thecomputer program. For example, most programs can only make use of ohe refractiveprofile. Thus, it must be assumed that the structure is uniform along the entirepath. This is frequently not the case, as seen by the tilted layers measured inthe PMTCdata. Also, small variations in the refractive profile are often impossible to include, and only a straight line segmented approximation to the measuredprofile can be used. The methods are valuable however in establishing thepossibilities for the origin of multipath signals.
The second method for evaluating multipath and meteorological data has beenreferenced previously. It is based on a geometric approach, using reflectiveanalysis techniques. It is conceded that multipath from atmospheric layers is mostprobably due to refraction (the assumption made in ray tracing) rather thanreflection. However, it has been found that if one applies the reflective geometryto either atmospheric or surface generated multipath, there is usually a goodcorrespondence with measured delay-spread values. The method involves calculatingand plotting the elliptical locus of delay values (taken from measured impulse
response data} on the profile of the propagation path. The latter is plotted withrespect to the appropriate k-factors, calculated from the segmented features of therefractive data. Examples of this analysis are presented below that are relevant
for the data of Table 6.
34
1000
---------~PM 1138Z
800
\\
\\
LP \2220Z
'"'
"'-"-
" ........~ TRAPPING............
SNI
(/) 60ex:w;-w~
z0 .~ I~
< ~
> l~LLJ
4°1~
w
ii~I;
2°1
280 300 320
N UNITS
340 360
Figure 8. Refractive index profiles measured at Point Mugu (PM) ~ndSan Nicolas Island (SNI) on 19 August 1981.
35
For these. examples we use the multipath data measured at PMTC on 18-19 August1981, where the time delays were on the order of 5 and 14 ns. These values weremeasured over a period of approximately 4 hours between 2200-0230Z (1500-1930 PDT).The corresponding radiosonde data for this period are given in Figures 6 and 7; thePM 2250Z profile and SnI 2029Z profile, respectively. These profiles show thata very strong refractive layer was persistent over the path, slightly lower inelevation at the SNI terminal. Below the layer, and down to an elevation lowerthan that of the two radio terminals, th~ refractivity gradient is near a standardvalue (k=4/3). Note however, that both refractive profiles show that a subrefractive condition (slopes more positive than standard) was measured nearer thesurface. The SNI sounding did not contain data lower than that plotted, so thesubrefractive region is not traceable all the way to the surface. The subrefractivecondition is important, as it can explain the origin of some of the measured multipath.
Figure 9 has been plotted to illustrate the above conditions. The superrefractive layer is shown in the shaded area, plotted on the basis of a 4/3(standard refractivity) earth radius. This k-factor also applies to the solid lineplot of the s~rface profile. The radio terminals are seen to be within the standardrefractivity region. Thus, the direct-path radio rays are plotted as straight linesbetween the terminals. For the measured delay-spread values of 5 and 14 ns, twolocii (half-ellipse for each) have been plotted on the figure. These Fresnel ellipsoids define the locus of all points from which multipath signals could emanate withthe given delay value, if the signals were reflected. Note that the 14 ns ellipseis tangential to the refractive layer, and clearly indicates that this is the sourceof the measured multipath with that delay value.
The source of the shorter 5 ns delay is not, however, as well defined. We notethat this ellipse does not correspond to any meteorological feature, and it isnot tangential to the 4/3 earth profile. However, the subrefractive gradients at
the lower elevation in the radiosonde data Become important in this case. The PMsounding shows a near-zero gradient, and the SNI sounding shows a significant,positive gradient. These gradients will definitely affect the propagation near theearth's surface.
One method of analyzing the subrefractive region in the graphical form isincluded in Figure 9. First, the boundary between the k=4/3 region apd the subrefractive region has been sketched near the elevation of 200 meters. Theapproximate level of the boundary is taken from the two profile curves of the
36
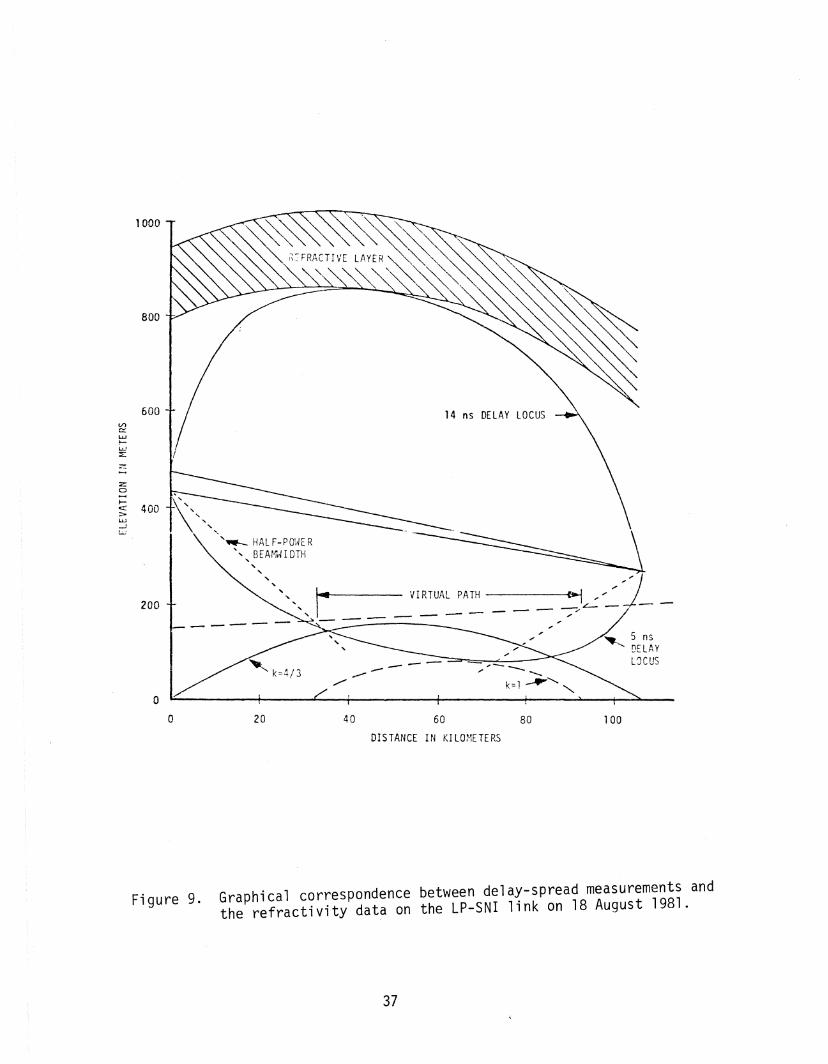
t '>
100
,5 nsDELAYL~CUS
60 80
DISTANCE IN KILOMETERS
4020
, k=4/3
14 ns DELAY LOCUS
-------~"~ HALF-pm~ER -.-
'''" BEAr1rl IOTH" " """" r VIRTU.l\~A:' ~~~:-J--
------------
oo
800
200
1000
600U")0:::w~
w~
z
z0
;::c:!: 400:>w-'
Figure 9. Graphical correspondence between delay-spread measurements andthe refractivity data on the LP-SNI link on 18 August 1981.
37
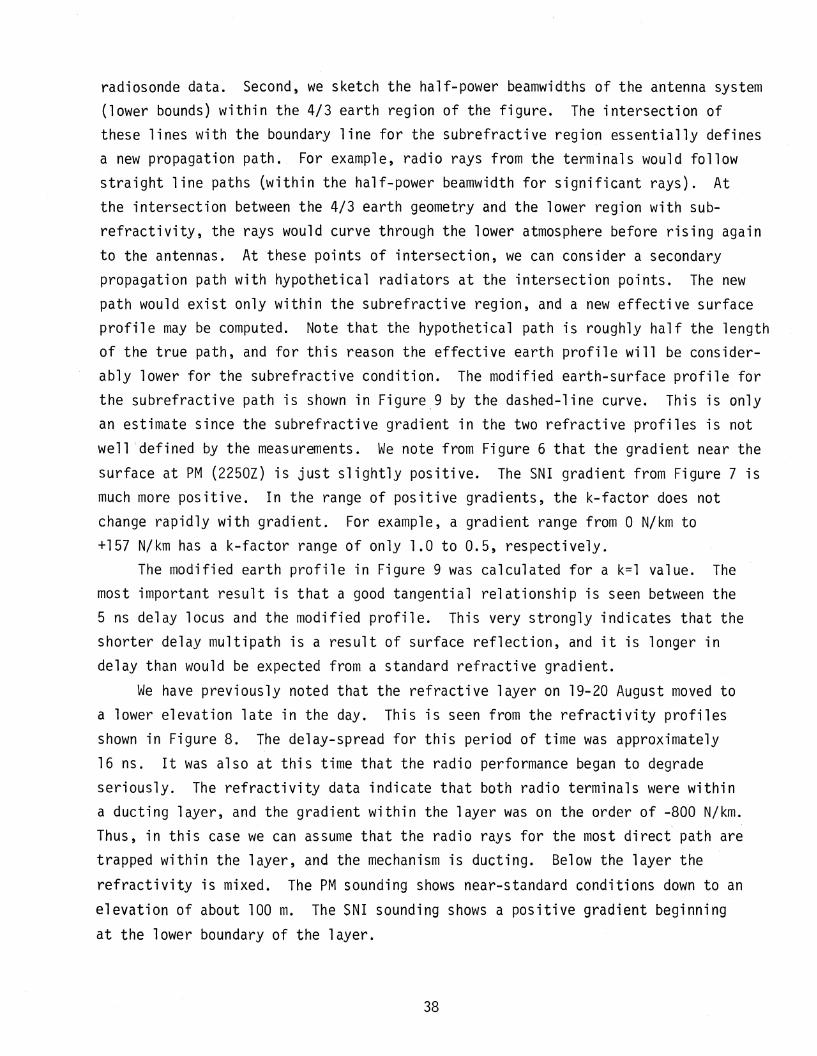
radiosonde data. Second, we sketch the half-power beamwidths of the antenna system(lower bounds) within the 4/3 earth region of the figure. The intersection ofthese lines with the boundary line for the subrefractive region essentially definesa new propagation path. For example, radio rays from the terminals would followstraight line paths (within the half-power beamwidth for significant rays). Atthe intersection between the 4/3 earth geometry and the lower region with subrefractivity, the rays would curve through the lower atmosphere before rising again
to the antennas. At these points of intersection, we can consider a secondarypropagation path with hypothetical radiators at the intersection points. The new
path would exist only within the subrefractive region, and a new effective surfaceprofile may be computed. Note that the hypothetical path is roughly half the lengthof the true path, and for this reason the effective earth profile will be considerably lower for the subrefractive condition. The modified earth-surface profile forthe subrefractive path is shown in Figure.9 by the dashed-line curve. This is onlyan estimate since the subrefractive gradient in the two refractive profiles is notwell 'defined by the measurements. We note from Figure 6 that the gradient near the
surface at PM (2250Z) is just slightly positive. The SNI gradient from Figure 7 ismuch more positive. In the range of positive gradients, the k-factor does notchange rapidly with gradient. For example, a gradient range from 0 N/km to+157 N/km has ak-factor range of only 1.0 to 0.5, respectively.
The modified earth profile in Figure 9 was calculated for a k=l value. Themost important result is that a good tangential relationship is seen between the5 ns delay locus and the modified profile. This very strongly indicates that theshorter delay multipath is a result of surface reflection, and it is longer indelay than would be expected from a standard refractive gradient.
We have previously noted that the refractive layer on 19-20 August moved toa lower elevation late in the day. This is seen from the refractivity profilesshown in Figure 8. The delay-spread for this period of time was approximately
16 nSf It was also at this time that the radio performance began to degrade
seriously. The refractivity data indicate that both radio terminals were withina ducting layer, and the gradient within the layer was on the order of -800 N/km.Thus, in this case we can assume that the radio rays for the most direct path aretrapped within the layer, and the mechanism is ducting. Below the layer the
refractivity is mixed. The PM sounding shows near-standard conditions down to an
elevation of about 100 m. The SNI sounding shows a posi'tive gradient beginning
at the lower boundary of the layer.
38
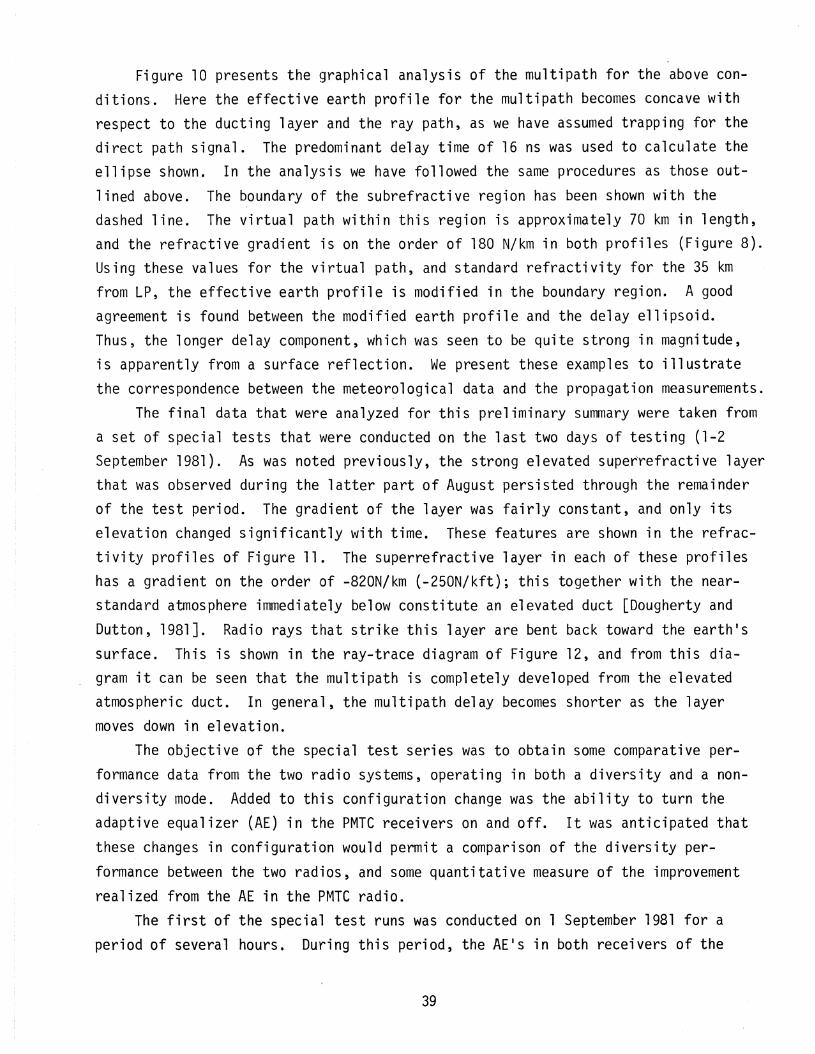
Figure 10 presents the ~~raphical analysis of the multipath for the above conditions. Here the effective earth profile for the multipath becomes concave withrespect to the ducting layer and the ray path, as we have assumed trapping for thedirect path signal. The predominant delay time of 16 ns was used to calculate theellipse shown. In the analysis we have followed the same procedures as those out
lined above. The boundary of the subrefractive region has been shown with thedashed line. The virtual path within this region is approximately 70 km in length,and the refractive gradient 'is on the order of 180 N/km in both profiles (Figure 8).Using these values for the virtual path, and standard refractivity for the 35 kmfrom LP~ the effective earth profile is modified in the boundary region. A goodagreement is found between the modified earth profile and the del~y ellipsoid.Thus, the longer delay component, which was seen to be quite strong in magnitude,is apparently from a surface reflection. We present these examples to illustratethe correspondence between the meteor~logical data and the propagation measurements.
The final data that were analyzed for this preliminary summary were taken from
a set of special tests that were conducted on the last two days of testing (1-2September 1981). As was noted previously, the strong elevated supe~refractive layerthat was observed during the latter part of August persisted through the remainderof the test period. The gradient of the layer was fairly constant, and only itselevation changed significantly with time. These features are shown in the refractivity profiles of Figure 11. The superrefractive layer in each of these profileshas a gradient on the order of -820N/km (-250N/kft); this together with the nearstandard atmosphere immediately below constitute an elevated duct [Dougherty and
Dutton, 1981J. Radio rays that strike this layer are bent back toward the earth'ssurface. This is shown in the ray-trace diagram of Figure 12, and from this diagram it can be seen that the multipath is completely developed from the elevatedatmospheric duct. In general, the multipath delay becomes shorter as the layermoves down in elevation.
The objective of the special test series was to obtain some comparative performance data from the two radio systems, operating in both a diversity and a non·diversity mode. Added to this configuration change was the ability to turn theadaptive equalizer (AE) in the PMTC receivers on and off. It was anticipated that
these changes in configuration would permit a comparison of the diversity per
formance between the two radios~ and some quantitative measure of the improvement
realized from the AE in the PMTC radio.The first of the special test runs was conducted on 1 September 1981 for a
period of several hours. During this period, the AEls in both receivers of the
39
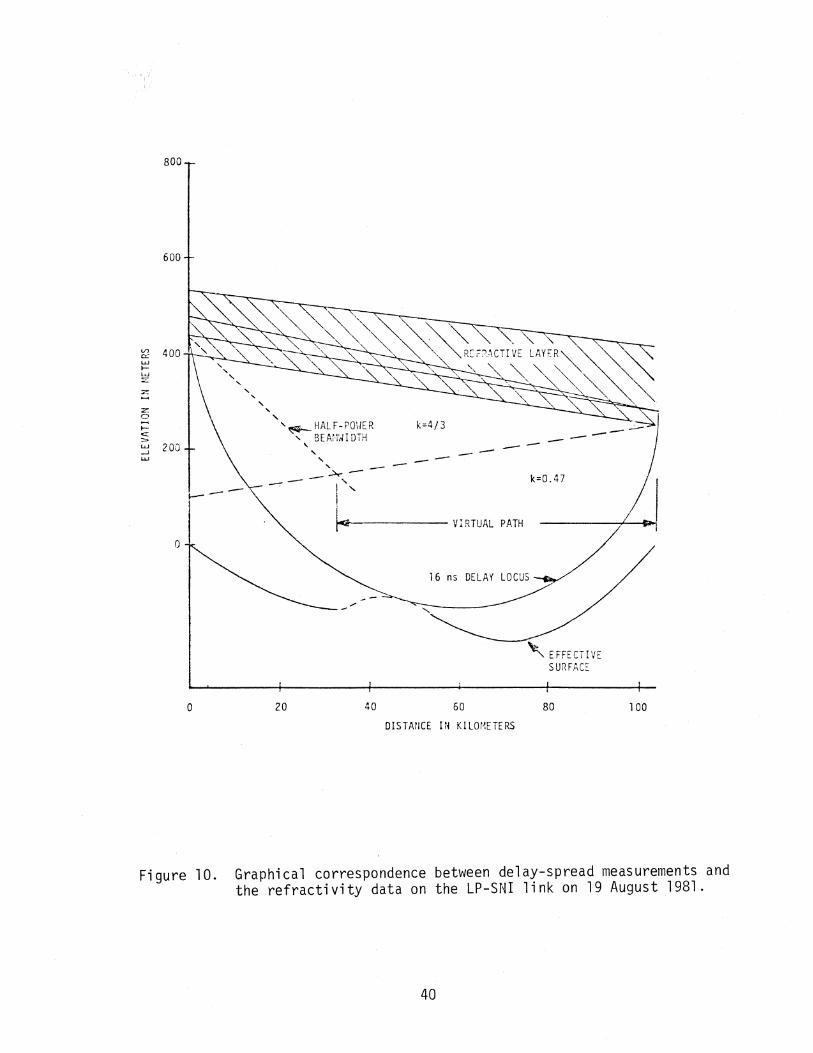
800
600
--- ---- --k=4/3
~ 400w~
l..u:.::z-z:o.....<::>~ 200w
o
"-"""-
"" ,"""~HAL F-PO\'IER
" BE Ai'i'tJ I DTH,"""~ -----"7'---- I"
~---- i
~,----- VIRTUAL PATH
k=0.47
,I ...,
16 ns DELAY LOCUS
o 20 40 60
DIS TAneE INK I Lor'~ETE RS
80 100
Figure 10. Graphical correspondence between delay-spread measurements andthe refractivity data on the LP-SNI link on 19 August 1981.
40
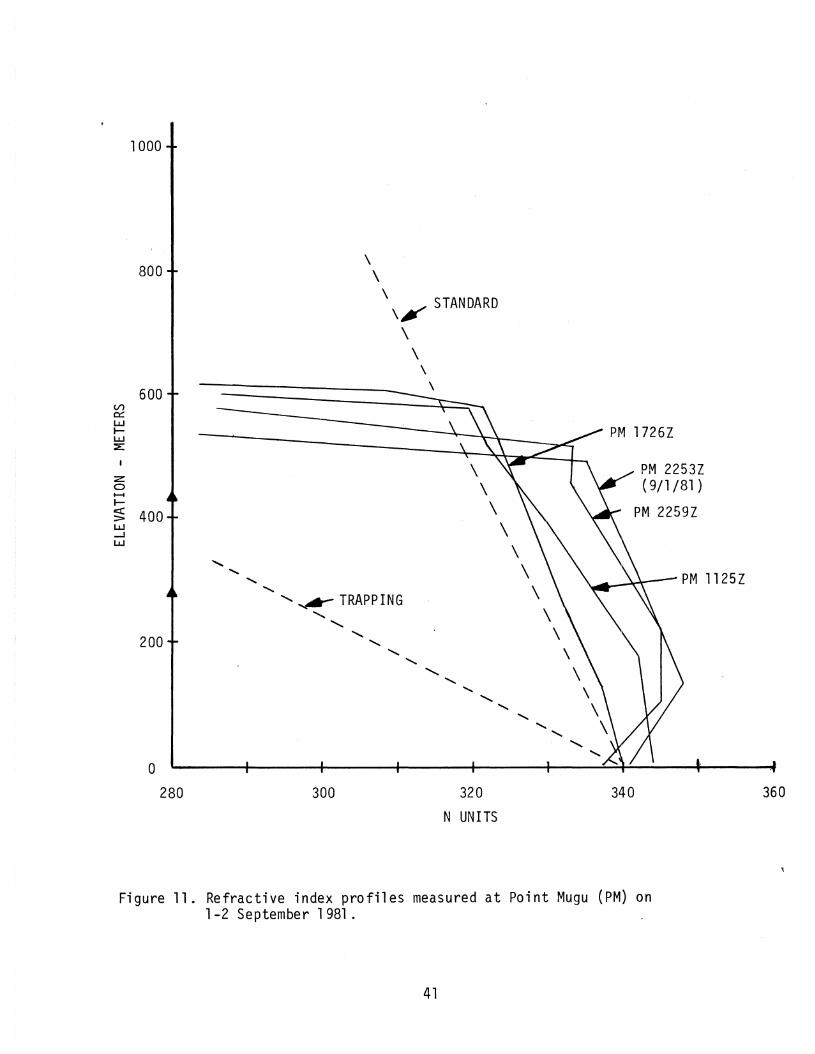
1000
Figure 11. Refractive index profiles measured at Point Mugu (PM) on1-2 September 1981.
41
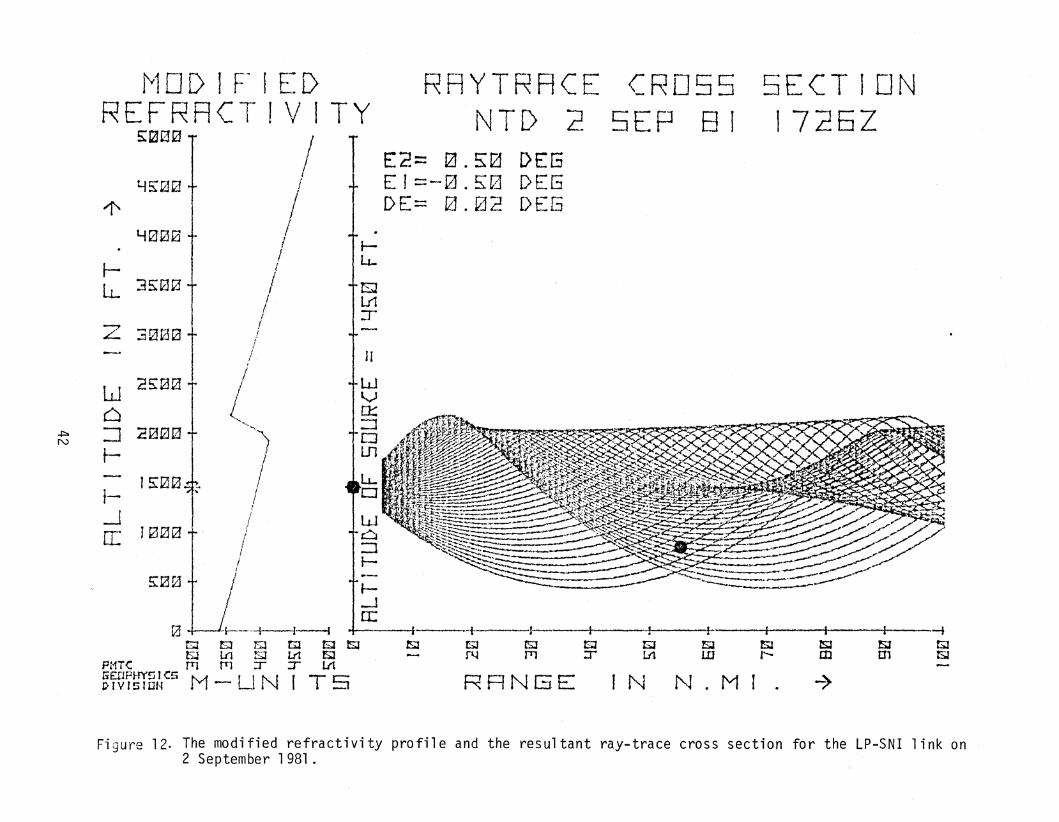
I -1 ! i--i 1 -iSJ G101 tsJ
lS"JOJ
._)
SECTION1725Z
S1r-.....
5'JW
GJlJ1
CROSS5EP 81
IN N.MI.
G1:r
tsJJT1
~N
RRNGE
tsJ
RRYTRRCENT[) 2
E2= 0.5:0 DEBEI==-0.~0 DEGDE::: 0.02 DES
JI
fLt-
EJLt1:r
f--.Jrr.:o +---J-i- 1 1---1 +- f .. I 1
t:J rsJ E:J [iJ EJ ~ts:J lt1 ~ Lrt lSJ
PZ1T<: fT1 fT1 :r ::r 1.f1riErlPHY5 r<:5 M LJ NIT 5t>tVlstDN - --
fv10[) I F" I EDREFRRC1- I V I TY
/i
III/
I/l
!l/
/
/I,"'''j
I
/I/;!!II
S:~fj0
45:00
l'1.1000.
~LL 35:00
Z 3000
W 25:00
C~ :J 20£210N
l-
t-Js:rzt3
-la: J000
5:t30
Figure 12. The modified refractivity profile and the resultant ray-trace cross section ~r the LP-SNI link on2 September 1981.
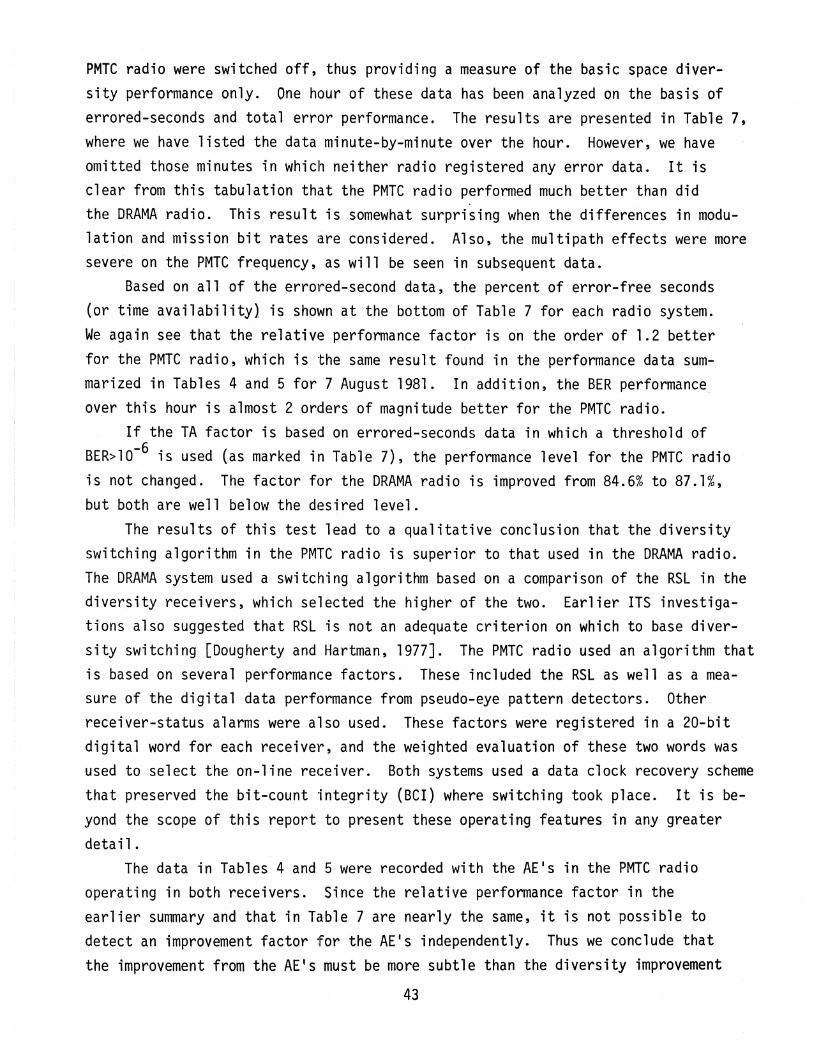
PMTC radio were switched off, thus providing a measure of the basic space diversity performance only. One hour of these data has been analyzed on the basis oferrored-seconds and total error performance. The results are presented in Table 7,where we have listed the data minute-by-minute over the hour. However, we haveomitted those minutes in which neither radio registered any error data. It isclear from this tabulation that the PMTC radio performed much better than didthe DRAMA radio. This result is somewhat surprising when the differences in modulation and mission bit rates are considered. Also, the multipath effects were moresevere on the PMTC frequency, as will be seen in subsequent data.
Based on all of the errored-second data, the percent of error-free secondsCor time availability} is shown at the bottom of Table 7 for each radio system.We again see that the relative performance factor ;s on the order of 1.2 betterfor the PMTC radio, which is the same result found in the performance data summarized in Tables 4 and 5 for 7 August 1981. In addition, the BER performanceover this hour is almost 2 orders of magnitude better for the PMTC radio.
If the TA factor is based on errored-seconds data in which a threshold ofBER>lO-6 is used (as marked in Table 7), the performance level for the PMTC radiois not changed. The factor for the DRAMA radio is improved from 84.6% to 87.1%,but both are well below the desired level.
The results of this test lead to a qualitative conclusion that the diversityswitching algorithm in the PMTC radio is superior to that used in the DRAMA radio.The DRAMA system used a switching algorithm based on a comparison of the RSL in thediversity receivers, which selected the higher of the two. Earlier ITS investigations also suggested that RSL is not an adequate criterion on which to base diversity switching [Dougherty and Hartman, 1977J. The PMTC radio used ,an algorithm thatis based on several performance factors. These included the RSL as well as a measure of the digital data performance from pseudo-eye pattern detectors. Otherreceiver-status alarms were also used. These factors were registered in a 20-bitdigital word for each receiver, and the weighted evaluation of these two words wasused to select the on-line receiver. Both systems used a data clock recovery schemethat preserved the bit-count integrity (BCI) where switching took place. It is beyond the scope of this report to present these operating features in any greaterdetail.
The data in Tables 4 and 5 were recorded with the AEls in the PMTC radiooperating in both receivers. Since the relative performance factor ;n theearlier summary and that in Table 7 are nearly the same, it is not possible todetect an improvement factor for the AE's independently. Thus we conclude thatthe improvement from the AE's must be more subtle than the diversity improvement
43
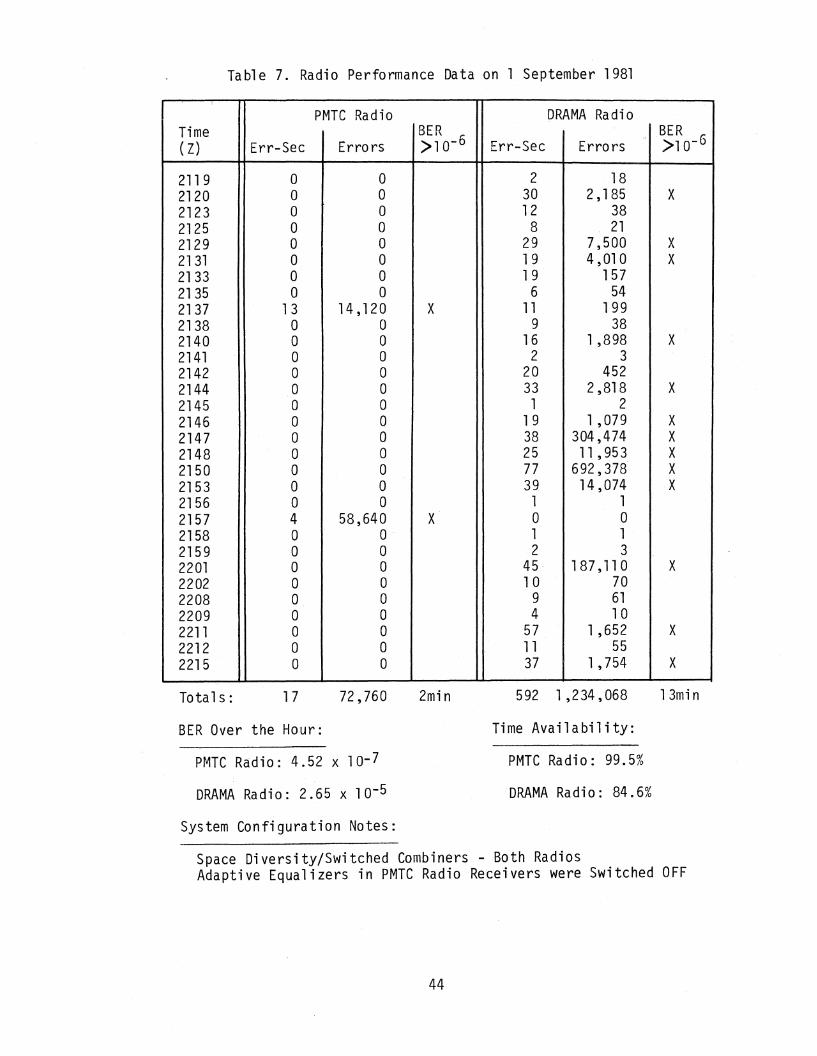
Table 7. Radio Performance Data on 1 September 1981
PMTC Radio DRAMA RadioTime BER BER( Z) Err-Sec Errors >10- 6 Err-Sec Errors >10- 6
211 9 0 0 2 182120 0 0 30 2, 185 X2123 0 0 12 382125 0 0 8 212129 0 0 29 7,500 X2131 0 0 19 4,01 0 X2133 0 0 19 1572135 0 0 6 542137 13 14,120 X 11 1992138 0 0 9 382140 0 0 16 1,898 X2141 0 0 2 32142 0 0 20 4522144 0 0 33 2,818 X2145 0 0 1 22146 0 0 19 1 ,079 X2147 0 0 38 304,474 X2148 0 0 25 11 , 953 X2150 0 0 77 692,378 X2153 0 0 39 14,074 X2156 0 0 1 12157 4 58,640 X 0 02158 0 0 1 12159 0 0 2 32201 0 0 45 187 ,11 0 X2202 0 0 10 702208 0 0 9 612209 0 0 4 102211 0 0 57 1 ,652 X2212 0 0 11 552215 0 0 37 1,754 X
Total s : 17 72,760 2min 592 1,234,068 13mi n
BEROver the Hour:
PMTC Radio: 4.52 x 10- 7
DRAMA Radio: 2.65 x 10⁻⁵
Time Availability:
PMTC Radio: 99.5%
DRAMA Radio: 84.6%
System Configuration Notes:
Space Diversity/Switched Combiners - Both RadiosAdaptive Equalizers in PMTC Radio Receivers were Switched OFF
44
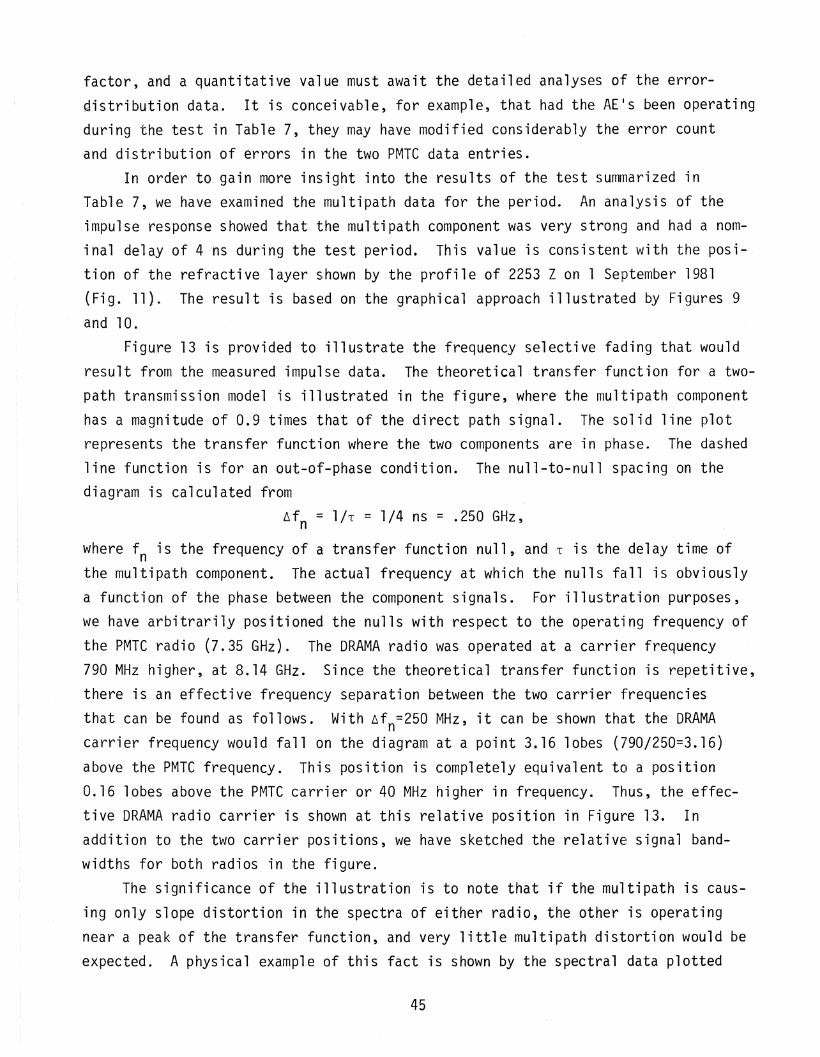
factor, and a quantitative value must await the detailed analyses of the errordistribution data. It is conceivable, for example, that had the AEls been operating
during the test in Table 7, they may have modified considerably the error count
and distribution of errors in the two PMTC data entries.In order to gain more insight into the results of the test summarized in
Table 7, we have examined the multipath data for the period. An analysis of theimpulse response showed that the multi path component was very stron~~ and had a nominal delay of 4 ns during the test period. This value is consistent with the position of the refractive layer shown by the profile of 2253 Z on 1 September 1981(Fig. 11). The result is based on the graphical approach illustrated by Figures 9
and 10.Figure 13 is provided to illustrate the frequency selective fading that would
result from the measured impulse data. The theoretical transfer function for a twopath transmission model is illustrated in the figure, where the multipath componenthas a magnitude of 0.9 times that of the direct path signal. The solid line plotrepresents the transfer function where the two components are in phase. The dashed
line function is for an out-of-phase condition. The null-to-null spacing on thediagram is calculated from
~fn = liT = 1/4 ns = .250 GHz,
where fnis the frequenc)' of a transfer function null, and T is the delay time ofthe multipath component. The actual frequency at which the nulls fall is obviouslya function of the phase between the component signals. For illustration purposes,we have arbitrarily positioned the nulls with respect to the operating frequency of
the PMTC radio (7.35 GHz). The DRAMA radio was operated at a carrier frequency790 MHz higher, at 8.14 GHz. Since the theoretical transfer function is repetitive,there is an effective frequency separation between the two carrier frequencies
that can be found as follows. With ~fn=250 MHz, it can be shown that the DRAMAcarrier frequency would fallon the diagram at a point 3.16 lobes (?90/250=3.16)
above the PMTC frequency. This position is completely equivalent to a position0.16 lobes above the PMTC carrier or 40 MHz higher in frequency. Thus, the effective DRAMA radio carrier is shown at this relative position in Figure 13. Inaddition to the two carrier positions, we have sketched the relative! signal bandwidths for both radios in the figure.
The significance of the illustration is to note that if the multipath is caus
ing only slope distortion in the spectra of either radio, the other is operatingnear a peak of the transfer function, and very little multipath distortion would beexpected. A physical example of this fact is shown by the spectral data plotted
45
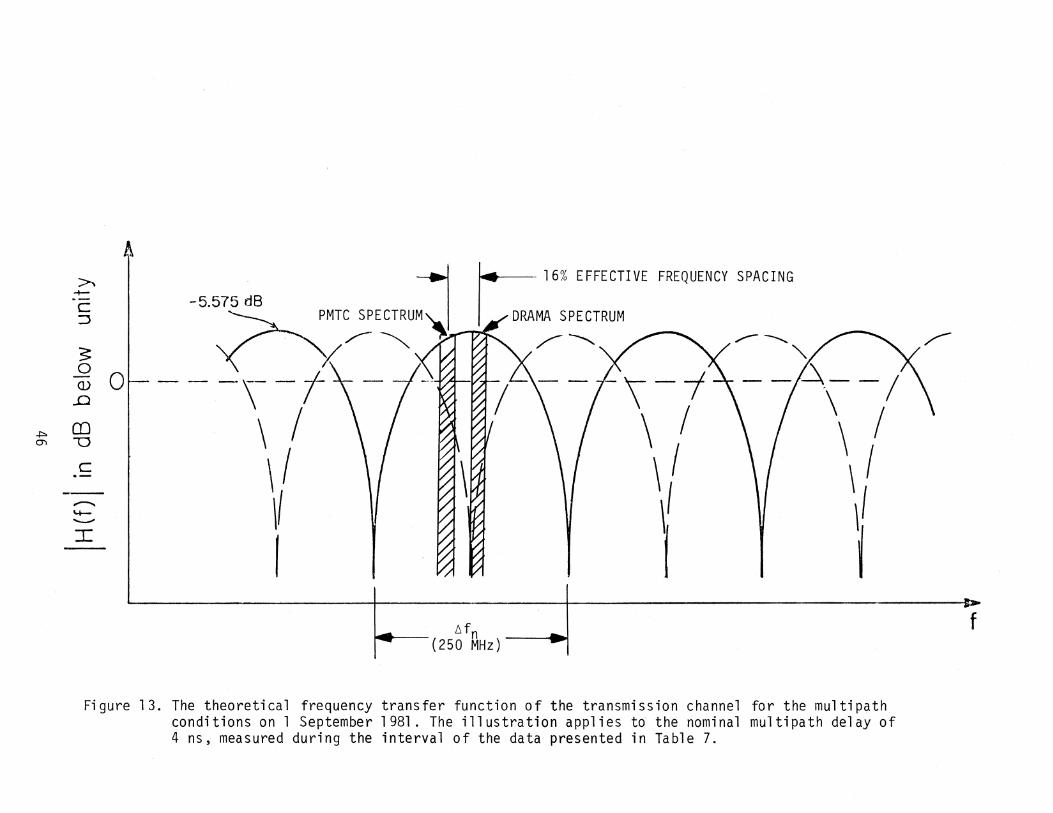
,,--~ ~. ~ /
"- _,~,__ /\ /\ I
\ I
~
\-i\ I\ I
\'I
DRAMA SPECTRUM
/~
.... - 16% EFFECTIVE FREQUENCY SPACING~
t-to-- I -5.575 dBc:J
30
0---(])
.D
~ OJ0) -0
C.----~
'-+-~
:r.:
l'1fn(250 MHz)
f
Figure 13. The theoretical frequency transfer function of the transmission channel ~r the multipathconditions on 1 September 1981. The illustration applies to the nominal multipath delay of4 ns, measured during the interval of the data presented in Table 7.
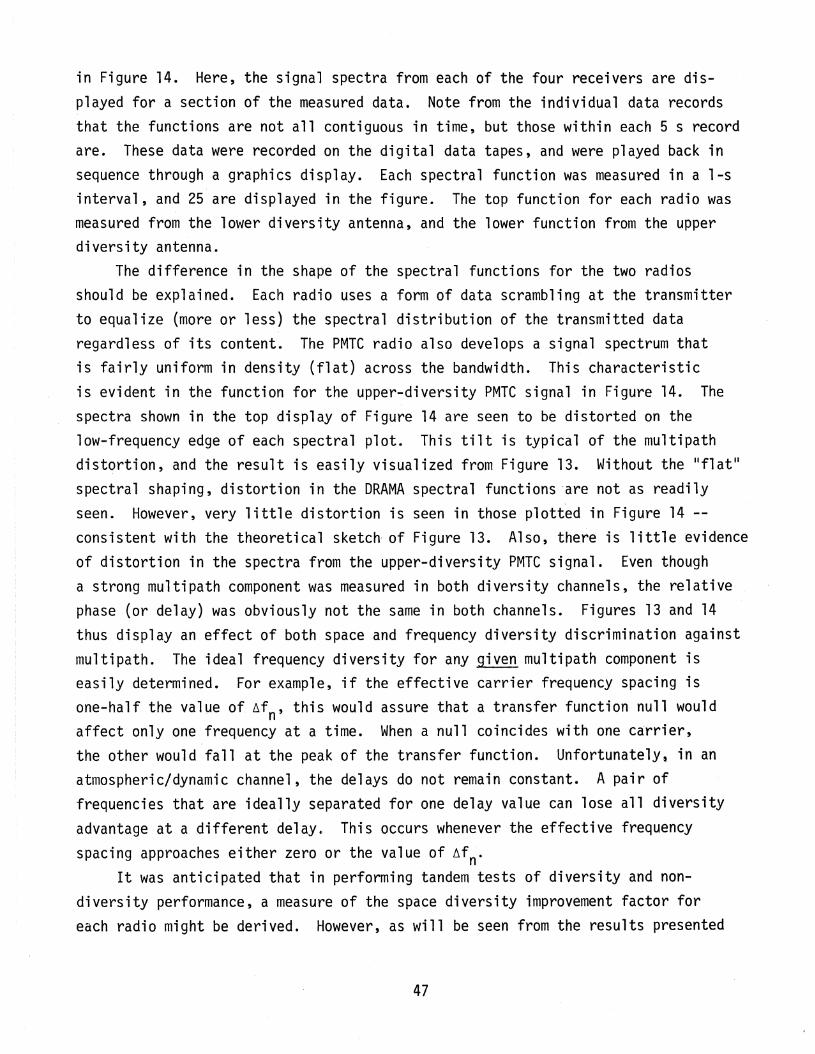
in Figure 14. Here, the signal spectra from each of the four receivers are displayed for a section of the measured data. Note from the individual data recordsthat the functions are not all contiguous in time, but those within leach 5 s recordare. These data were recorded on the digital data tapes, and were played back insequence through a graphics display. Each spectral function was measured in a l~s
interval, and 25 are displayed in the figure. The top function for each radio wasmeasured from the lower diversity antenna, and the lower function from the upperdiversity antenna.
The difference in the shape of the spectral functions for the two radiosshould be explained. Each radio uses a form of data scrambling at the transmitterto equalize (more or less) the spectral distribution of the transmitted dataregardless of its content. The PMTC radio also develops a signal spectrum thatis fairly uniform in density (flat) across the bandwidth. This characteristicis evident in the function for the upper-diversity PMTC signal in Figure 14. Thespectra shown in the top display of Figure 14 are seen to be distorted on thelow-frequency edge of each spectral plot. This tilt is typical of the multipathdistortion, and the result is E~asily visualized from Figure 13. Without the IIf1at il
spectral shaping, distortion in the DRAMA spectral functions 'are not as readilyseen. However, very little distortion is seen in those plotted in Figure 14 -consistent with the theoretical sketch' of Figure 13. Also, there is little evidenceof distortion in the spectra from the upper-diversity PMTC signal. Even thougha strong multipath compon~~nt was measured in both diversity channels, the relativephase (or delay) was obviously not the same in both channels. Figures 13 and 14thus display an effect of both space and frequency diversity discrimination againstmultipath. The ideal frequency diversity for any given multipath component iseasily determined. For example, if the effective carrier frequency spacing isone-half the value of ~fn' this would assure that a transfer function null wouldaffect only one frequency at a time. When a null coincides with one carrier,the other would fall at the peak of the transfer function. UnfortunatelYt in anatmospheric/dynamic channel, the delays do not remain constant. A pair offrequencies that are ideally sE~parated for one delay value can lose all diversityadvantage at a different delay~ This occurs whenever the effective frequencyspacing approaches either zero or the value of ~fn.
It was anticipated that in performing tandem tests of diversity and nondiversity performance, a measure of the space diversity improvement factor foreach radio might be derived. However, as will be seen from the results presented
47
2147: 06Z 2147:16Z 2147:21Z 2147:26Z
Low Antenna
i.
11l!/ I
t !
t,l(l( "
t II
High Antenna
lInJ ~." ~• j
i jIn:·.·.: In·~.:..' . . .;, , : .
•J I
(;' " 'i ;~ I 'I
~ ~ ~ j r J I ~ J
nnf I
JLow AntennaJ
I: ~ f ~
'.' ;1 ::• 1 ~ , J
~00
[.:.' ~.'.:..•. ' I:.•.'.' !.•..•... ' I.·... : ;.....:..:.•..• ' :.;...•.... i '.'.:,.. i ~.·.•:.I I' I.'.':.. ' ' :.•~.': ' ::' j '.'" 1 ...1:.f.. l.J ..... 1 '.'.: ! ..:.... ; rI,'.:.·.', '.'..... ' '" : '.. 1 '" '.'J ~, ) ~ ~ 1 ~ ~ J J I ~ j j j f J ) ~ J ~ J I j )High Antenna
Figure 14. A sample of the received signal spectra measured from both radios during the interval oftest data given in Table 7.
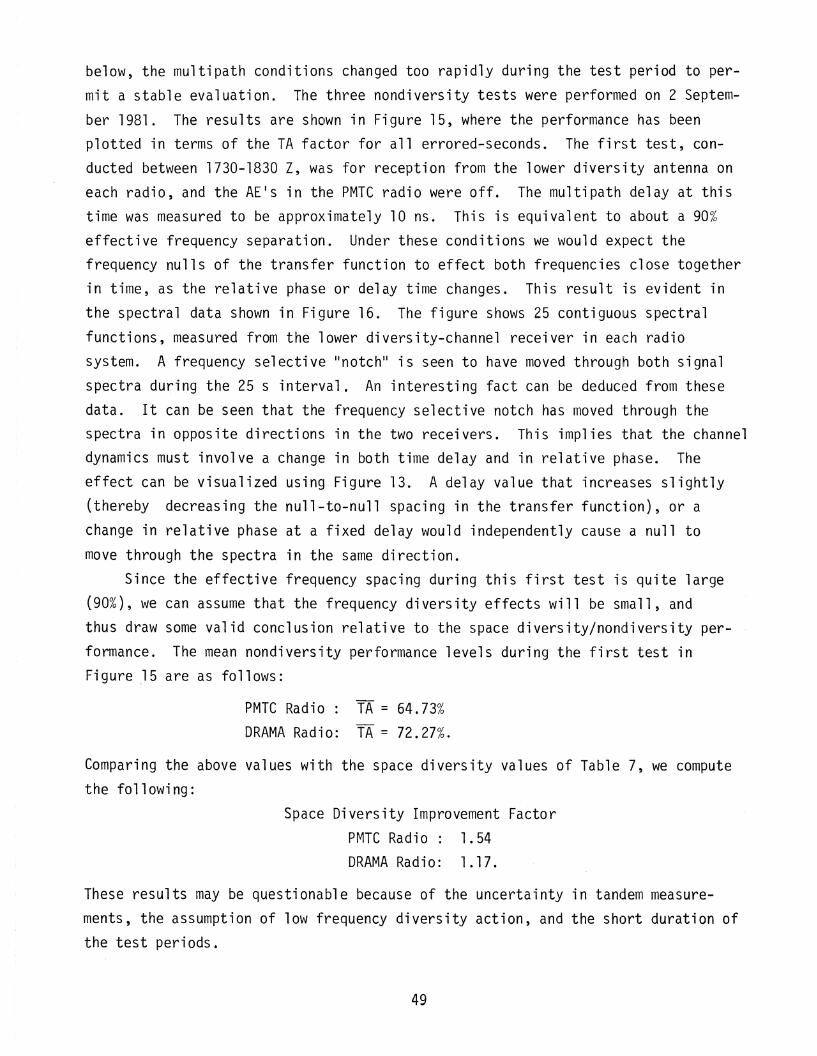
below, the multipath conditions changed too rapidly during the test period to permit a stable evaluation. The three nondiversity tests were performed on 2 Septem
ber 1981. The results are shown in Figure 15, where the performance has beenplotted in terms of the TA factor for all errored-seconds. The first test, conducted between 1730-1830 Z, was for reception from the lower divers"ity antenna oneach radio, and the AEls in the PMTC radio were off. The multipath delay at thistime was measured to be approximately 10 ns. This is equivalent to about a 90%effective frequency separation. Under these conditions we would expect thefrequency nulls of the transfer function to effect both frequencies close togetherin time, as the relative phase or delay time changes. This result is evident in
the spectral data shown in Figure 16. The figure shows 25 contiguous spectral
functions, measured from the lower diversity-channel receiver in each radiosystem. A frequency selective II notchl! is seen to have moved through both signal
spectra during the 25 s interval. An interesting fact can be deduced from thesedata. It can be seen that the frequency selective notch has moved through thespectra in opposite directions in the two receivers. This implies that the channeldynamics must involve a change in both time delay and in relative phase. Theeffect can be visualized using Figure 13. A delay value that increases slightly(thereby decreasing the null-to-null spacing in the transfer function), or a
change in relative phase at a fixed delay would independently cause a null to
move through the spectra in the same direction.Since the effective frequency spacing during this first test is quite large
(90%), we can assume that the frequency diversity effects will be small, andthus draw some valid conclusion relative to the space diversity/nondiversity performance. The mean nondiversity performance levels during the first test inFigure ,15 are as follows:
PMTC RadioDRAMA Rad ~i 0:
TA = 64.73%TA = 72.27%.
Comparing the above values with the space diversity values of Table 7, we computethe following:
Space Diversity Improvement FactorPMTC Radio: 1.54DRAMA Radio: 1.17.
These results may be questionable because of the uncertainty in tandem measurements, the assumption of low frequency diversity action, and the short duration ofthe test periods.
49
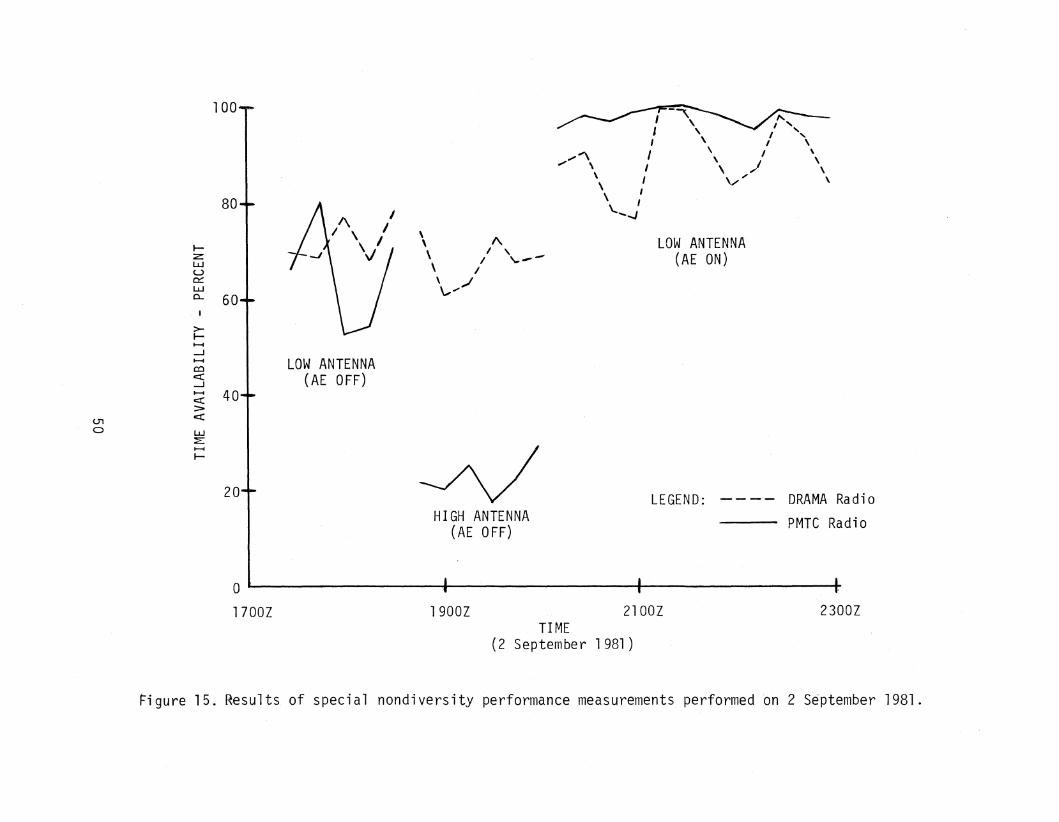
LOW ANTENNA(AE ON)
LEGEND: ---- DRAMA Radio
PMTC Radio
-~I \I ,I \
\.,.,~ I \ I
.,., \ I ,;'
\ I \/"\ I\ I
\.."..J
HIGH ANTENNA(AE OFF)
,\ '"\ I ,
\ I \.. ........ --\ I\,-'~
100
80
.....ZlJ.JU0::::lJ.J0.. 60
I
>-..........-J.....
I LOW ANTENNAca~ (AE OFF)-J..... 40~:>
U1 ~
a lJ.J~..........
20
2300Z2100Z1900Z
o · I I I
1700ZTIME
(2 September 1981)
~igure 15. Results of special nondiversity performance measurements performed on2 S~ptember 1981.
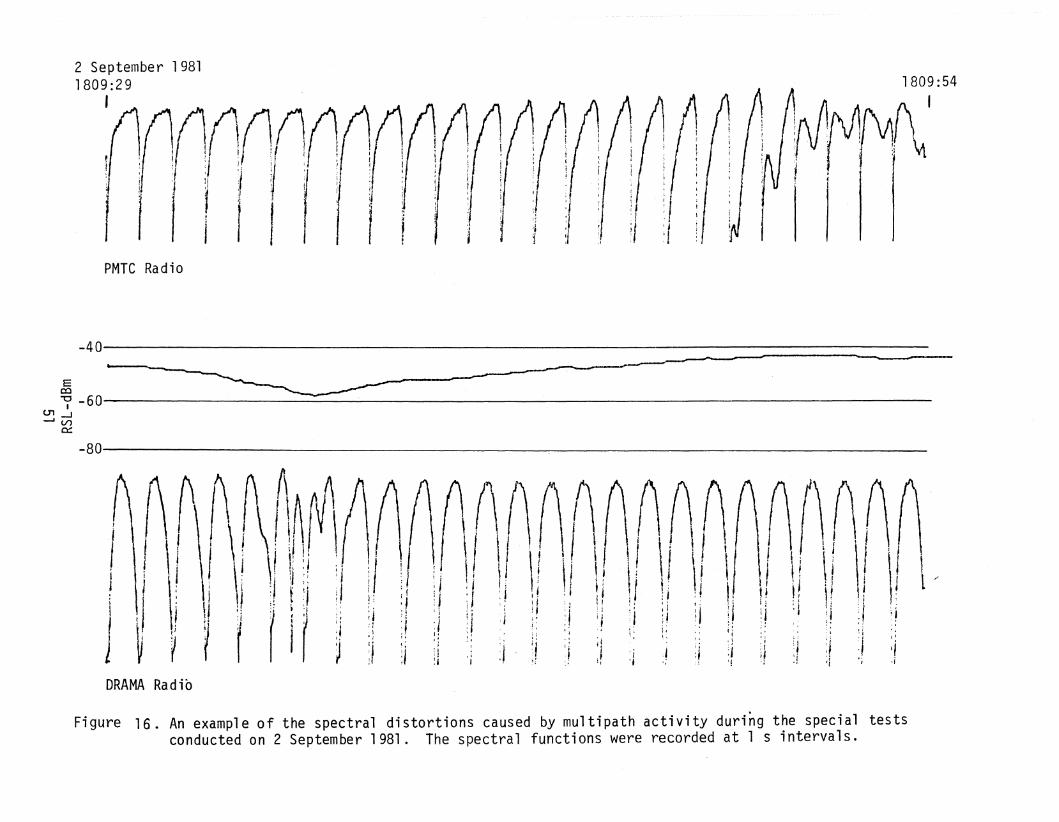
Jt,
:tij
1
II~4
:.(11(,.(1(1.(\1]~ ;.. J '."~'. ;f .1. 1...f ,f I 'f . ,
: ;l :/ i ;J ~ ;J I : ~ t : I.
I 1 I I I I ,
2 September 19811809:29
I
PMTC Radio
-40---------------------------------------
-80---------------...,..-------------
Eco'i' -60 ----
O"l-J--IV)
0:::
f\ 0, ,"" ""J
l' ,I!; I I \1 iJ 'I! \ I i I r I,I ' j Ii j t!i l' ! i I·:I :! ~I ;!
:; !i::1 :, Ii;i .; .i
JrI l ~ I! .: !, i!
t ; ;'
:/ : ' : :j
, I I \I \1 \\I \.. ' Ii ~:! :.1! \I L ' , :1 t,' ;1, l t ; l.' dI 1 \j \I ~I :i:;1 :;
1 ~ ~ ~ r r II !DRAMA Radio
Figure 16. An example of the spectral distortions caused by multipath activity during the special testsconducted on 2 September 1981. The spectral functions were recorded at 1 s intervals.
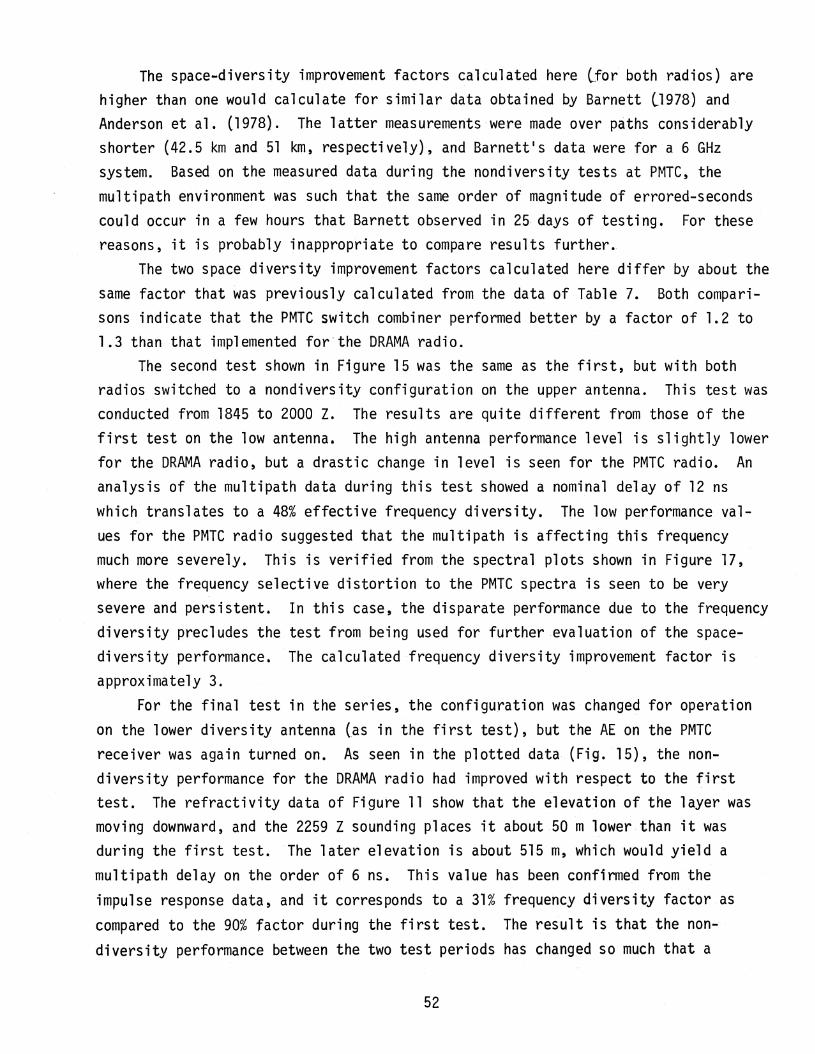
The space-diversity improvement factors calculated here lfor both radios) arehigher than one would calculate for similar data obtained by Barnett l1978) andAnderson et ale (1978). The latter measurements were made over paths considerablyshorter (42.5 km and 51 km, respectively), and Barnett1s data were for a 66Hzsystem. Based on the measured data during the nondiversity tests at PMTC, themultipath environment was such that the same order of magnitude of errored-secondscould occur in a few hours that Barnett observed in 25· days of testing. Forthesereasons, it is probably inappropriate to compare results further.
The two space diversity improvement factors calculated here differ by about the
same factor that was previously calculated from the data of Table 7. Both compari~
sons indicate that the PMTC switch combiner performed better by a factor of 1.2 to1.3 than that implemented for'the DRAMA radio.
The second test shown in Figure 15 was the same as the first, but with bothradios switched to a nondiversity configuration on the upper antenna. This test wasconducted from 1845 to 2000 Z. The results are quite different from those of thefirst test on the low antenna. The high antenna performance level is slightly lowerfor the DRAMA radio, but a drastic change in level is seen for the PMTC radio. Ananalysis of the multipath data during this test showed a nominal delay of 12 ns
which translates to a 48% effective frequency diversity. The low performance values for the PMTC radio suggested that the multipath is affecting this frequencymuch more severely. This is verified from the spectral plots shown in Figure 17,where the frequency selective distortion to the PMTC spectra is seen to be verysevere and persistent. In this case, the disparate performance due to the frequencydiversity precludes the test from being used for further evaluation of the spacediversity performance. The calculated frequency diversity improvement factor isapproximately 3.
For the final test in the series, the configuration was changed for operation
on the lower diversity antenna (as in the first test), but the AE on the PMTCreceiver was again turned on. As seen in the plotted data (Fig. 15), the nondiversity performance for the DRAMA radio had improved with respect to the firsttest. The refractivity data of Figure 11 show that the elevatfonof the layer wasmoving downward, and the 2259 Z sounding places it about 50 m10wer than it wasduring the first test. The later elevation is about 515 m, which would yield a
multipath delay on the order of 6 ns. This value has been confirmed from the
impulse response da-ta, and it corresponds to a 31% frequency diversity factor as
compared to the 90% factor during the first test. The result is that the non
diversity performance between the two test periods has changed so much that a
52
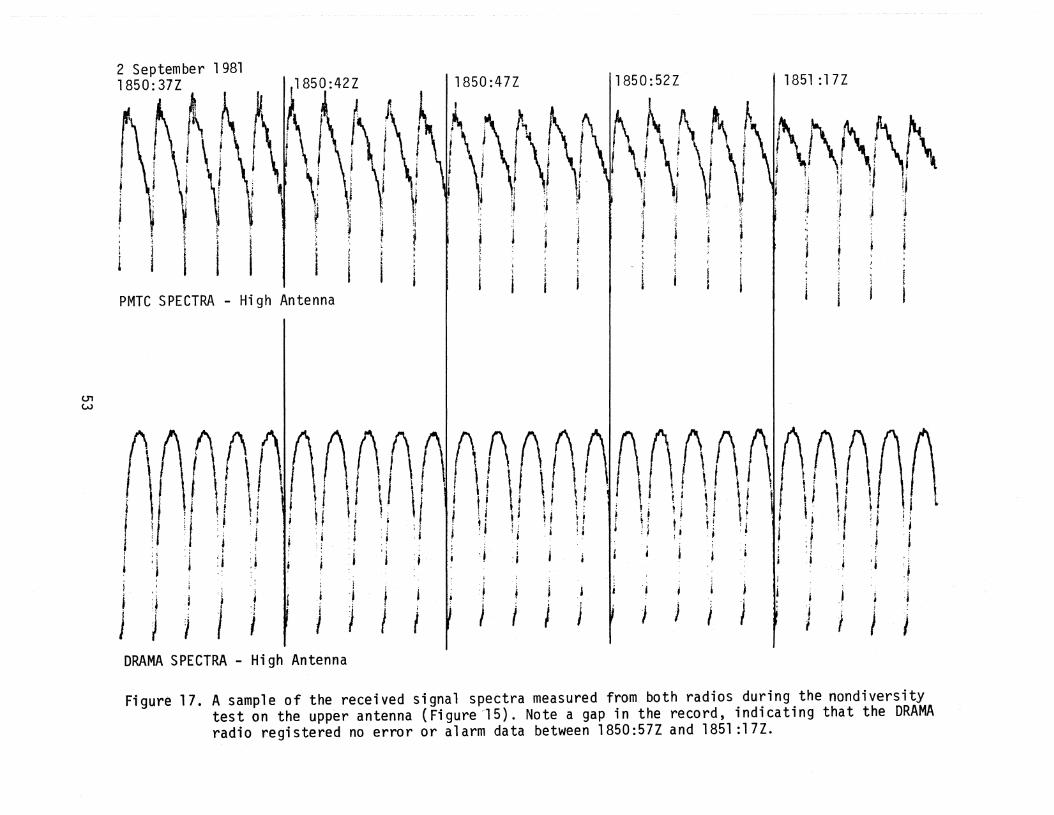
1851 :17Z1850:52Z
-
~~ ~~ f\. ~ {' t\I\~ h ~·1; \; \I~ ! Ii 11 ~
:1 i ::;i ':;:.:
~ .j i ,,. (,
f' ,t\jI I:i :j:f 'I
1
1850 :47Z
\1~ ~
,1850:42Z
t\ t t tl \ I :\ I
\r I \t~! t' ~;
;; I-
~
~
t
I
2 September 19811850:37Z
h.
(\ t
, \ i• 1
1 \i t~ J ~, ~ t~ , ~
I II I
PMTC SPECTRA - High Antenna
j 'I
rt t
~i I
~'i , i
J 'j,
:
JJ, 'I
I I Ii
f i J J II / I i
J J I
DRAMA SPECTRA - High Antenna
(J'l
W
T\I \'i ;I ~ ·! , I
, :i• .i
J 'j if '\. I \ 'I I Ii \ ~Ii' . i '.I " t , t J ( ~; .', i ; :j :!'j J: : . ,J ,. : :. I ~ ; ~
:. ,i j j ; • i .
(\, t
; J ~
~ i.~
j
Figure 17. A sample of the received signal spectra measured from both radios during the nondiversitytest on the upper antenna (Figure15). Note a gap in the record, indicating that the DRAMAradio registered no error or alarm data between 1850:57Z and 1851 :17Z.
reference for use in evaluating the improvement due to the AE in the PMTC systemis lost. Again we find that this factor has eluded us~ and must await the moredetailed analyses of the error distribution data.
The results of these special tests illustrate a basic problem that can developwhen quantitative results are sought from measurements made sequentially in time.The preferred test arrangement in any dynamic environment would make- use of simultaneous measurements for different system configurations. Future tests beingplanned for the DRAMA radio on the PMTC link will provide the capability for parallel configuration tests.
7. SUMMARY AND CONCLUSIONSThis report describes a comprehensive test program, in which the performance
of digital microwave radios was measured over an LOS link that is subject to verystrong multi path propagation. The initial objective of the program was to evaluatethe performance of a commercial radio for the Pacific Missile Test Center (PMTC)over a crucial link in the range communication/data system. The PMTC radio operates at a T3 mission bit rate ~4.7 Mb/s} in an 8-PSK mode -in the 7-GHz band. Thisradio had been purchased and installed on a PMTC link, and configured for spacediversity. Earlier multi path measurements performed by ITS (Hubbard, 1979) hadconcluded that this system might require a quad-diversity (frequency and space)configuration to meet the PMTC transmission reliability requirements. In order todetermine how the system would actually perform in a multi path environment, aspace diversity configuration was established, using the existing facilities foran analog radio. The digital radio was then dedicated to a test mode for thisprogram.
The ITS was tasked to design the test procedures and data acquisition systems.To augment theexperiment~ the ITS Channel Probe was installed over the samediversity paths (multiplexed with the test radio), so that a direct measure of themultipath conditions could be obtained simultaneously with the radio performancedata. In addition, the pertinent meteorological data for the microwave channelwere furnished by the PMTC Geophysics Division and were used to correlate thepropagation conditions. The report provides a number of examples of how thesevarious measures relate to each other.
The basic measure of performance for the radio was selected to be that of an
errored-second. However, a more detailed set of error data were acquired throughthe use of a burst-error distribution analyzer. The details of these data aregiven in Sections 3 and 4 of this report. Section 3 presents a description of all
54
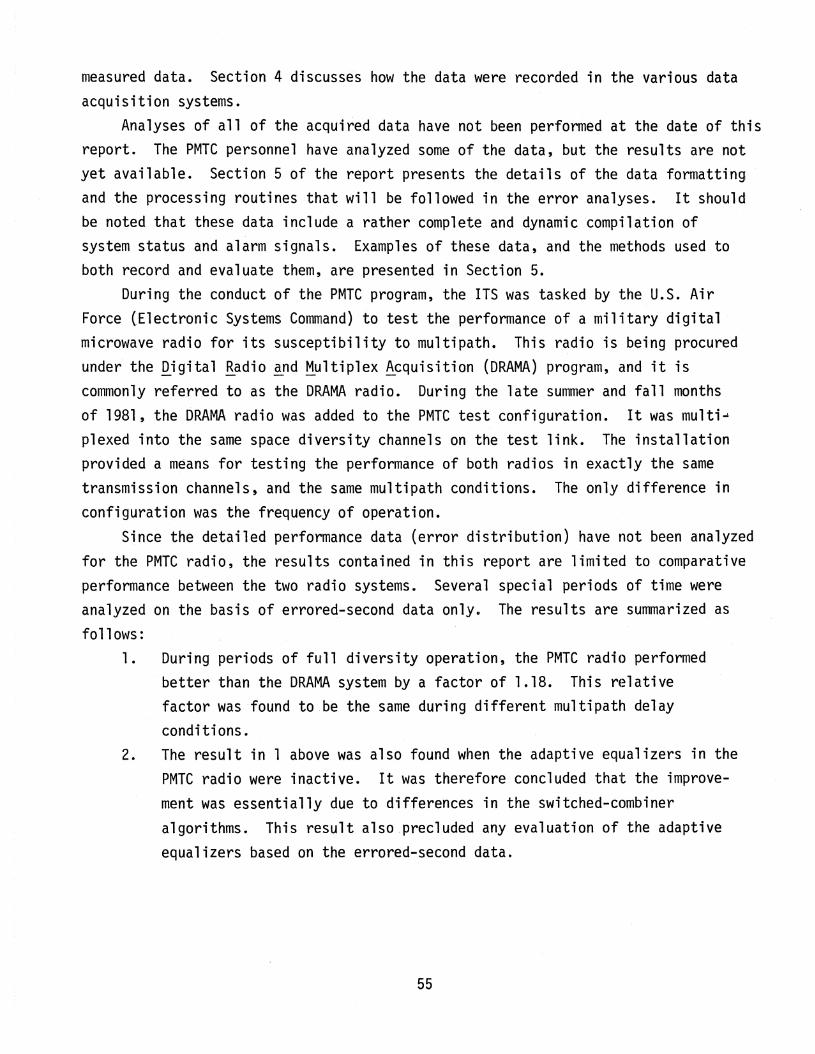
measured data. Section 4 discusses how the data were recorded in the various dataacquisition systems.
Analyses of all of the acqui~ed data have not been performed at the date of thisreport. The PMTC personnel have analyzed some of the data, but the results are notyet available. Section 5 of the report presents the details of the data formatting;and the processing routines that will be followed in the error analyses. It shouldbe noted that these data include a rather complete and dynamic compilation ofsystem status and alarm signals. Examples of these data, and the methods used toboth record and evaluate them, are presented in Section 5.
During the conduct of the PMTC program, the ITS was tasked by the U.S. AirForce (Electronic Systems Command) to test the performance of a military digitalmicrowave radio for its susceptibility to multipath. This radio is being procuredunder the ~igital Radio El_nd !1.ultiplex ~cquisition (DRAMA) program, Clnd it iscommonly referred to as the DRAMA radio. During the late summer and fall monthsof 1981, the DRAMA radio w.as a.dded to the PMTC test configuration. It was multi ..plexed into the same space diversity channels on the test link. ThE~ installationprovided a means for testing the performance of both radios in exactly the sametransmission channels, and the same mult;path conditions. The only difference inconfiguration was the frequency of operation.
Since the detailed performance data (error distribution) have not been analyzedfor the PMTC radio, the Y'esults contained in this report are limited to comparativeperformance between the two radio systems. Several special periods of time wereanalyzed on the basis of errored-second data only. The results are summarized asfollows:
1. During periods of full diversity operation, the PMTC radio performedbetter than the DRAMA system by a factor of 1.18. This relativefactor was found to be the same during different multipath delayconditions.
2. The result in 1 above was also found when the adaptive equalizers in thePMTC radio were inactive. It was therefore concluded that the improvement was essentially due to differences in the switched-combineralgorithms. This result also.precluded any evaluation of the adaptiveequalizers based on the errored-second data.
55
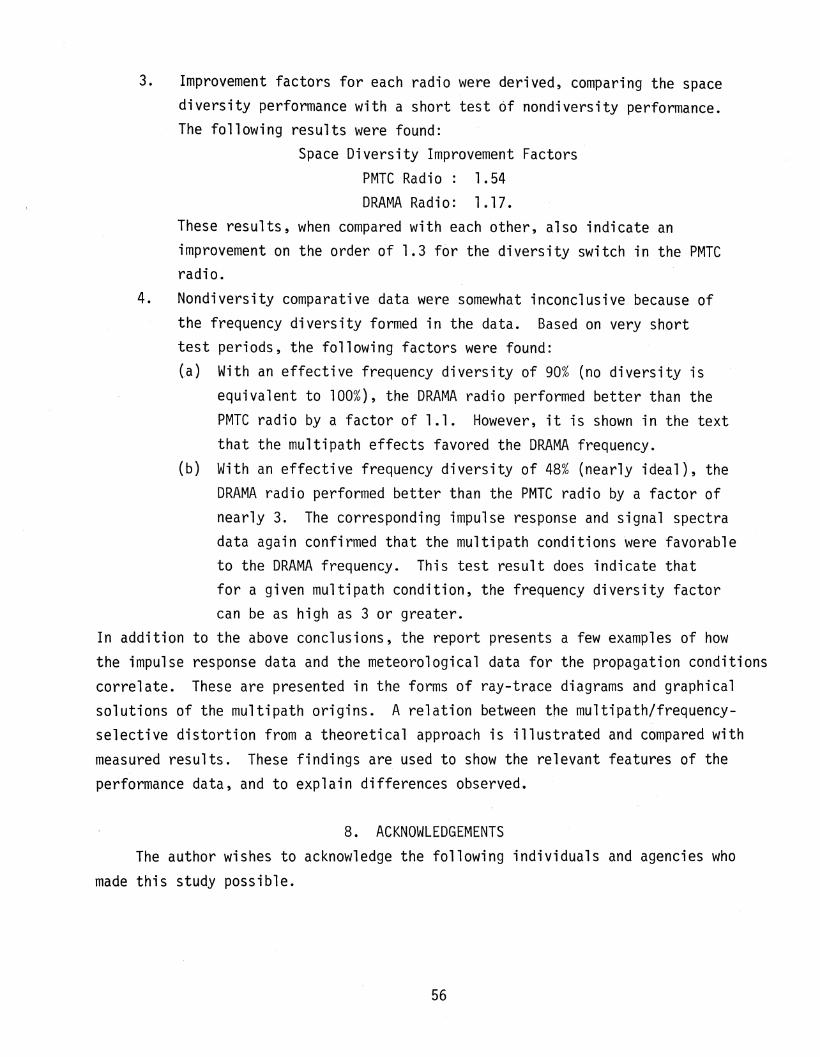
3. Improvement factors for each radio were derived, comparing the spacediversity performance with a short test of nondiversity performance.The following results were found:
Space Diversity Improvement FactorsPMTC Radio: 1.54DRAMA Radio: 1.17.
These results, when compared with each other, also indicate animprovement on the order of 1.3 for the diversity switch in the PMTCradio.
4. Nondiversity comparative data were somewhat inconclusive because ofthe frequency diversity formed in the data. Based on very shorttest periods, the following factors were found:(a) With an effective frequency diversity of 90% (no diversity is
equivalent to 100%), the DRAMA radio performed better than thePMTC radio by a factor of 1.1. However, it is shown in the textthat the multipath effects favored the DRAMA frequency.
(b) With an effective frequency diversity of 48% (nearly ideal), theDRAMA radio performed better than the PMTC radio by a factor ofnearly 3. The corresponding impulse response and signal spectradata again confirmed that the multipath conditions were favorableto the DRAMA frequency. This test result does indicate thatfor a given multipath condition, the frequency diversity factorcan be as high as 3 or greater.
In addition to the above conclusions, the report presents a few examples of howthe impulse response data and the meteorological data for the propagation conditionscorrelate. These are presented in the forms of ray-trace diagrams and graphicalsolutions of the multipath origins. A relation between the multipath/frequencyselective distortion from a theoretical approach is illustrated and compared withmeasured results. These findings are used to show the relevant features of theperformance data, and to explain differences observed.
8. ACKNOWLEDGEMENTSThe author wishes to acknowledge the following individuals and agencies who
made this study possible.
56
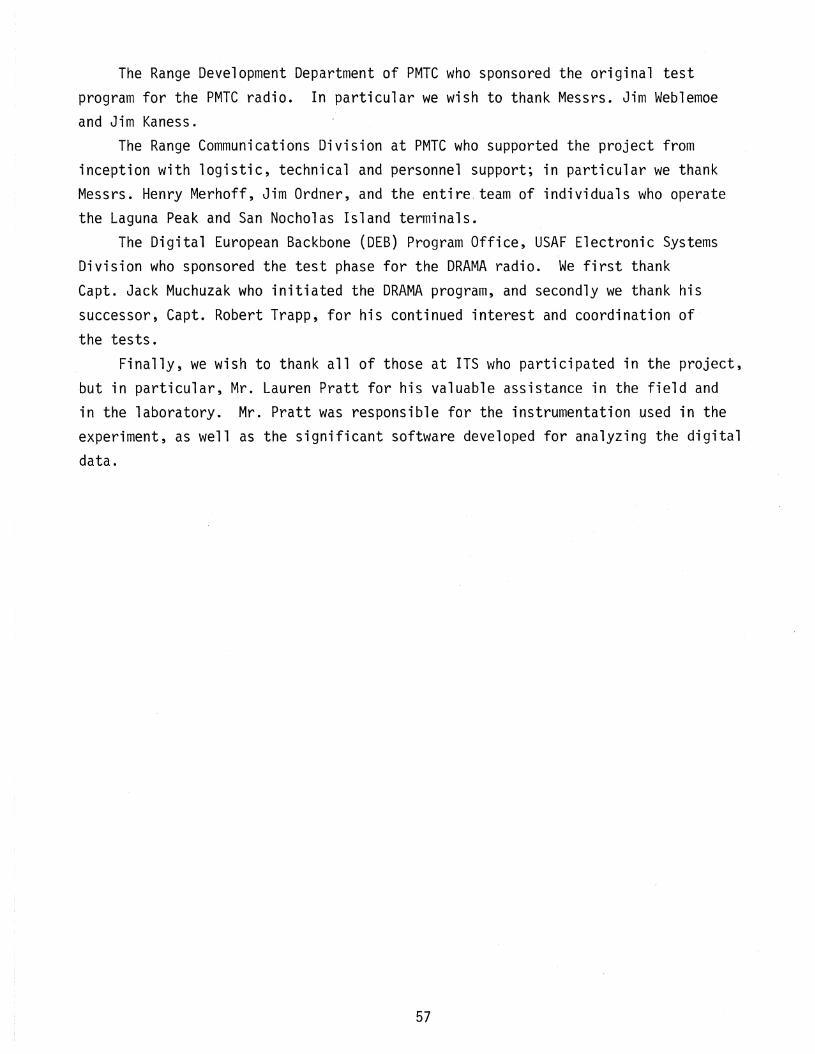
The Range Development Department of PMTC who sponsored the original testprogram for the PMTC radio. In particular we wish to thank Messrs. Jim Weblemoeand Jim Kaness.
The Range Communications Division at PMTC who supported the project frominception with logistic, technical and personnel support; in particular we thankMessrs. Henry Merhoff, Jim Ordner, and the entire. team of individuals who operatethe Laguna Peak and San Nocholas Island terminals.
The Digital European Backbone (DEB) Program Office, USAF Electronic SystemsDivision who sponsored the test phase for the DRAMA radio. We first thankCapt. Jack Muchuzak who initiated the DRAMA program, and secondly we thank hissuccessor, Capt. Robert Trapp, for his continued interest and coordination ofthe tests.
Finally, we wish to thank all of those at ITS who participated in the project,but in particular, Mr. Lauren Pratt for his valuable assistance in the field andin the laboratory. Mr. Pratt was responsible for the instrumentation used in theexperiment, as well as the significant software developed for analyzing the digital
data.
57

9. REFERENCES
,Anderson, C.W'., S. Barber, and R. Patel (1978), The effect of selective fadingon digital radio, International Communications Conference, Toronto, Canada,June.
Barnett, W.I. (1978), Measured performance of a high capacity 6 GHz digital radiosystem, International Communications Conference, Toronto, Ontario, Canada,June.
Bean, B.R., and E.J. Dutton (1966), Radio meteorology, NBS Monograph 92, March.
Dougherty, H.T., and W.J. Hartman (1977), Performance of a 400 Mbit/s System Overa Line-of-Sight Path, IEEE Trans. Comm·, COM-25, No.4, April, pp. 427-432.
Dougherty, H.T., and E.J. Dutton (1981), The role of elevated ducting for radioservice and interference fields, NTIA Report 81-69, March. (NTIS Access. No.PB 81-206138.)
Hartman, P.R., and E.W. Allen (1979), An adaptive equalizer for correction ofmultipath distortion in a 90 Mb/s 8 PSK system, International Conference onCommunications, Boston, MA, Conference Record, Vol. 1, June.
Hartman, W.J., and D. Smith (1975), Tilting antennas to reduce line-of-sightmicrowave link fading, Federal Aviation Administration Report No. FAA-RD-75-38,February.
Hubbard, R.W. (1979), Investigation of digital microwave communications in a strongmeteorological ducting environment, NTIA Report 79-24, Au~ust. (NTIS Access.PB 301212/AS.)
Linfield, R.F., R.W. Hubbard, and L.E. Pratt (1976), Transmission channel characterization by impulse response measurements, OT Report 76-96, August. (NTISAccess. No. PB 258577.)
PMTC (1976), Communications Capability, Capabilities Development Department, PacificMissile Test Center, Pt. Mugu, California.
58
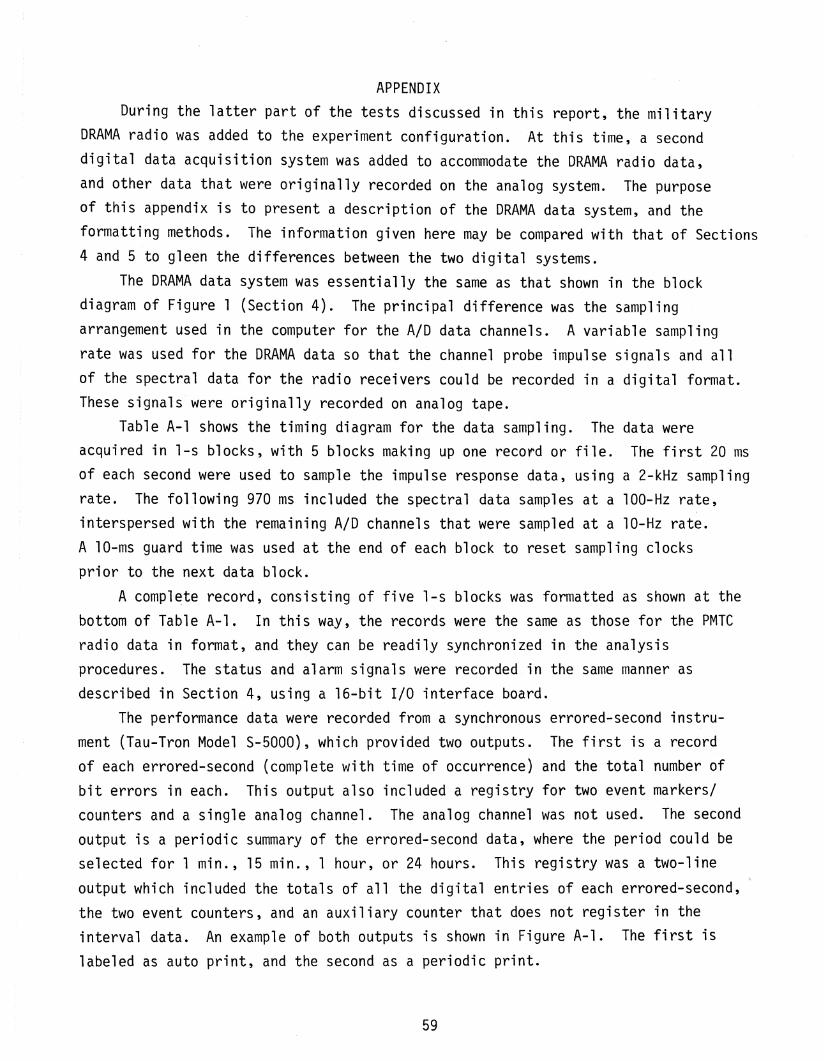
APPENDIXDuring the latter part of the tests discussed in this report, the military
DRAMA radio was added to the experiment configuration. At this time, a seconddigital data acquisition system was added to accommodate the DRAMA radio data,and other data that were originally recorded on the analog system. The purposeof this appendix is to present a description of the DRAMA data system, and theformatting methods. The information given here may be compared with that of Sections4 and 5 to gleen the differences between the two digital systems.
The DRAMA data system was essentially the same as that shown in the blockdiagram of Figure 1 (Section 4). The principal difference was the samplingarrangement used in the computer for the A/D data channels. A variable samplingrate was used for the DRAMA data so that the channel probe impulse signals and allof the spectral data for the radio receivers could be recorded in a digital format.These signals were originally recorded on analog tape.
Table A-l shows the timing diagram for the data sampling. The data wereacquired in l-s blocks, with 5 blocks making up one record or file. The first 20 msof each second were used to sample the impulse response data, using a 2-kHz samplingrate. The following 970 ms included the spectral data samples at a 100-Hz rate,interspersed with the remaining A/D channels that were sampled at a 10-Hz rate.A lO-ms guard time was used at the end of each block to reset sampling clocksprior to the next data block.
A compl~te record, consisting of five l-s blocks was formatted as shown at thebottom of Table A-l. In this way, the records were the same as thosE~ for the PMTCradio data in format, and they can be readily synchronized in the analysisprocedures. The status and alarm signals were recorded in the same manner asdescribed in Section 4, using a 16-bit I/O interface board.
The performance data were recorded from a synchronous errored-sf~cond instrument (Tau-Tron Model 5-5000), which provided two outputs. The first is a recordof each errored-second (complete with time of occurrence) and the total number ofbit errors in each. This output also included a registry for two event markers/counters and a single analog channel. The analog channel was not used~ The secondoutput is a periodic summary of the errored-second data, where the period could beselected for 1 min., 15 min., 1 hour, or 24 hours. This registry was a two-line
output which included the totals of all the digital entries of each errored-second,the two event counters, and an auxiliary counter that does not register in theinterval data. An example of both outputs is shown in Figure A-l. The first islabeled as auto print, and the second as a periodic print.
59
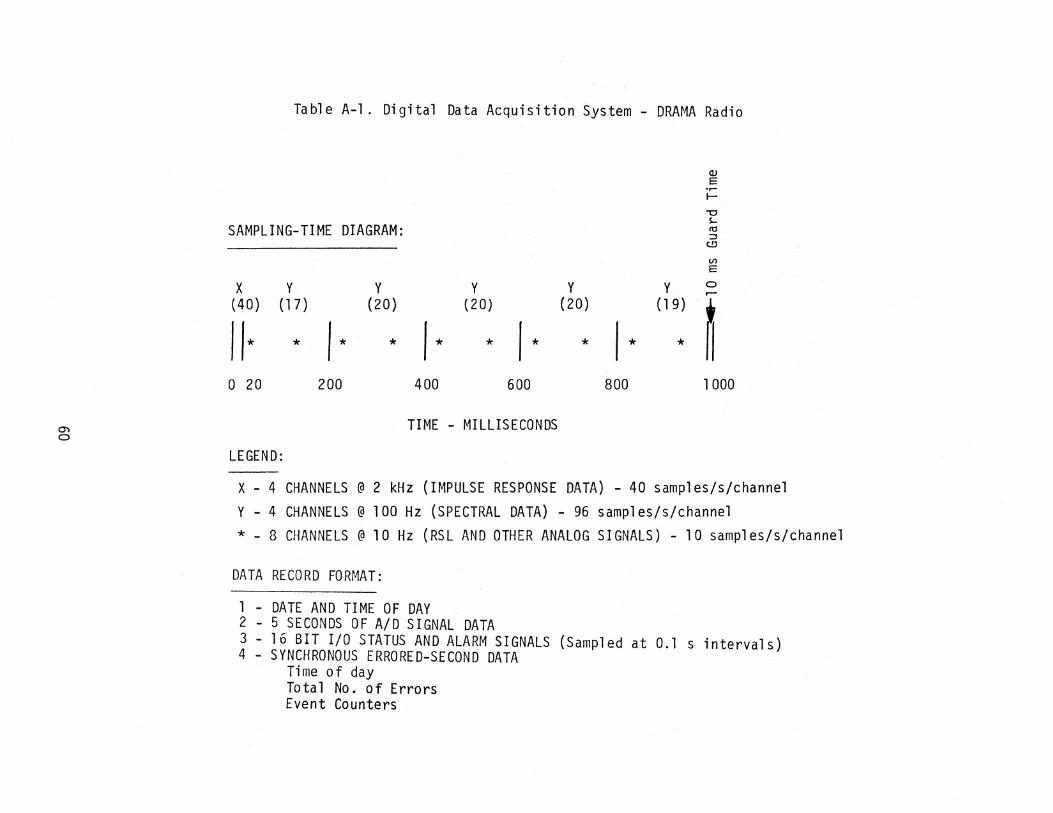
Table A-l. Digital Data Acquisition System - DRAMA Radio
SAMPLING-TIME DIAGRAM:
x Y Y Y Y(40) (17) (20) (20 ) (20)
II* * I* * I * * I * * I *
o 20 200 400 600 800
Q) TIME - MILLISECONDS0
LEGEND:
QJ
Ee,...I-
-0s-tU::s
(!)
VlE
Y ar--
(19)
~*
1000
x - 4 CHANNELS @ 2 kHz (IMPULSE RESPONSE DATA) - 40 samples/s/channelY - 4 CHANNELS @100 Hz (SPECTRAL DATA) - 96 samples/s/channel* - 8 CHANNELS @10 Hz (RSLAND OTHER ANALOG SIGNALS) - 10 samples/s/channel
DATA RECORD FORMAT:
1 - DATE AND TIME OF DAY2 - 5 SECONDS OF A/D SIGNAL DATA3 - 16 BIT I/O STATUS AND ALARM SIGNALS (Sampled at 0.1 s intervals)4 - SYNCHRONOUS ERRORED-SECOND DATA
Time of dayTotal No. of ErrorsEvent Counters
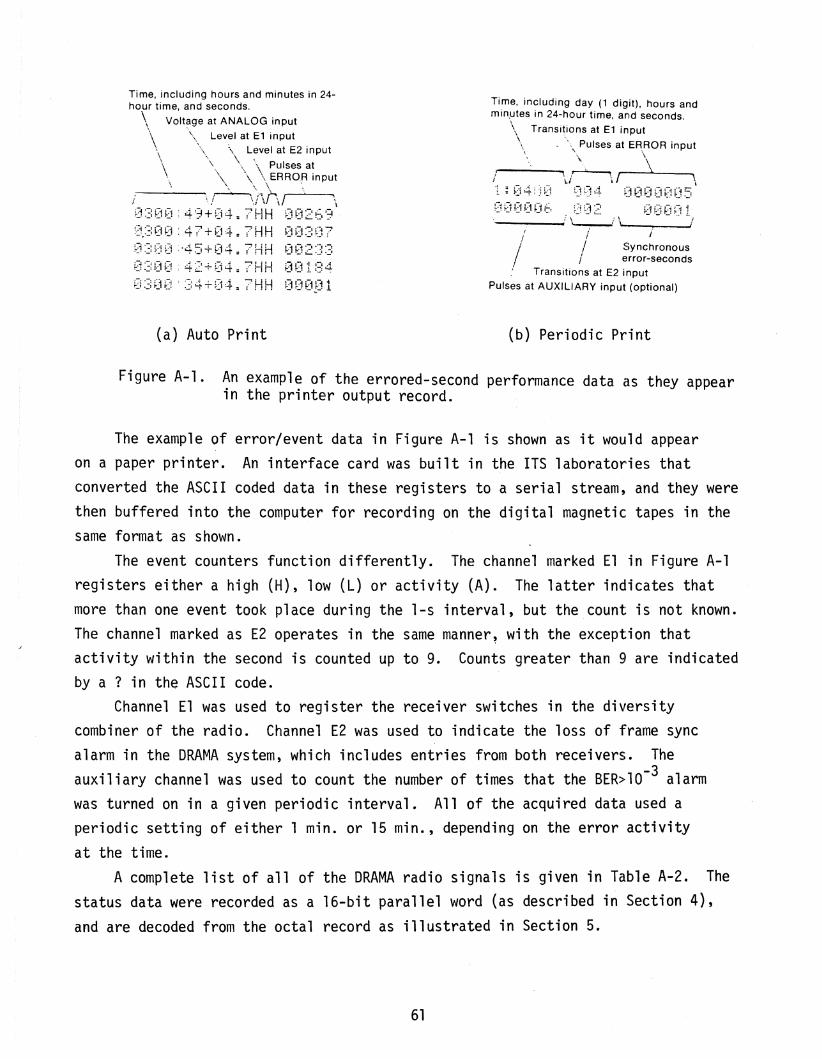
Time, including hours and minutes in 24hour time, and seconds.
\ Voltage at ANALOG input\ "\ Level at E1 input\\ \\ \. Level at E2 input. "\
\ \ '-\ '\ Pulses at\ '\" '\\ \\ERRO.,R input
" f--~--\ r\J~ J ~,J ,~~ \
J300~49+04:7HH 00269Q300:47+04:7HH 00307~J :::~ ~~i ~=i :.45+ ~1 4 = 7HH ~j 02 :~: :30300:42+04:7HH 001840300:34+04:7HH 00091
(a) Auto Print
Time, including day (1 digit), hours andmin,utes in 24-hour time, and seconds.
\ Transitions at E1input
\ ~ -\ Pulses at ERROR input'\. \
\J} 1 ..~r ,
....1 &1 ,
1 ~ 0 4 ! :1 ~j L=i ~~1 4 0 ~J 0 0 0 0 5C! 0 0 0 0 6 ~~j ~:-1 :::: ~J 1~1 e0 1.--_....! '-----:' L, -.....J
I I i
II/Synchronous
, / error-secondsTransitions at E2 input
Pulses at AUXILIARY input (optional)
(b) Periodic Print
Figure A-l. An example of the errored-second performance data as they appearin the printer output record.
The example of error/event data in Figure A-l is shown as it would appearon a paper printer. An interface card was built in the ITS laboratories thatconverted the ASCII coded data in these registers to a serial stream, and they werethen buffered into the computer for recording on the digital magnetic tapes in thesame format as shown.
The event counters function differently. The channel marked El in Figure A-lregisters either a high (H), low (L) or activity (A). The latter indicates thatmore than one event took place during the l-s interval, but the count is not known.The channel marked as E2 operates in the same manner~ with the exception thatactivity within the second is counted up to 9. Counts greater than 9 are indicatedby a ? in the ASCII code.
Channel El was used to register the receiver switches in the diversitycombiner of the radio. Channel E2 was used to indicate the loss of frame syncalarm in the DRAMA system" which includes entries from both receivers. Theauxiliary channel was used to count the number of times that the BER>lO-3 alarmwas turned on in a given periodic interval. All of the acquired data used aperiodic setting of either 1 min. or 15 min., depending on the error activityat the time.
A complete list of all of the DRAMA radio signals is given in Table A-2. Thestatus data were recorded as a l6-bit parallel word (as described in Section 4),and are decoded from the octal record as illustrated in Section 5.
61
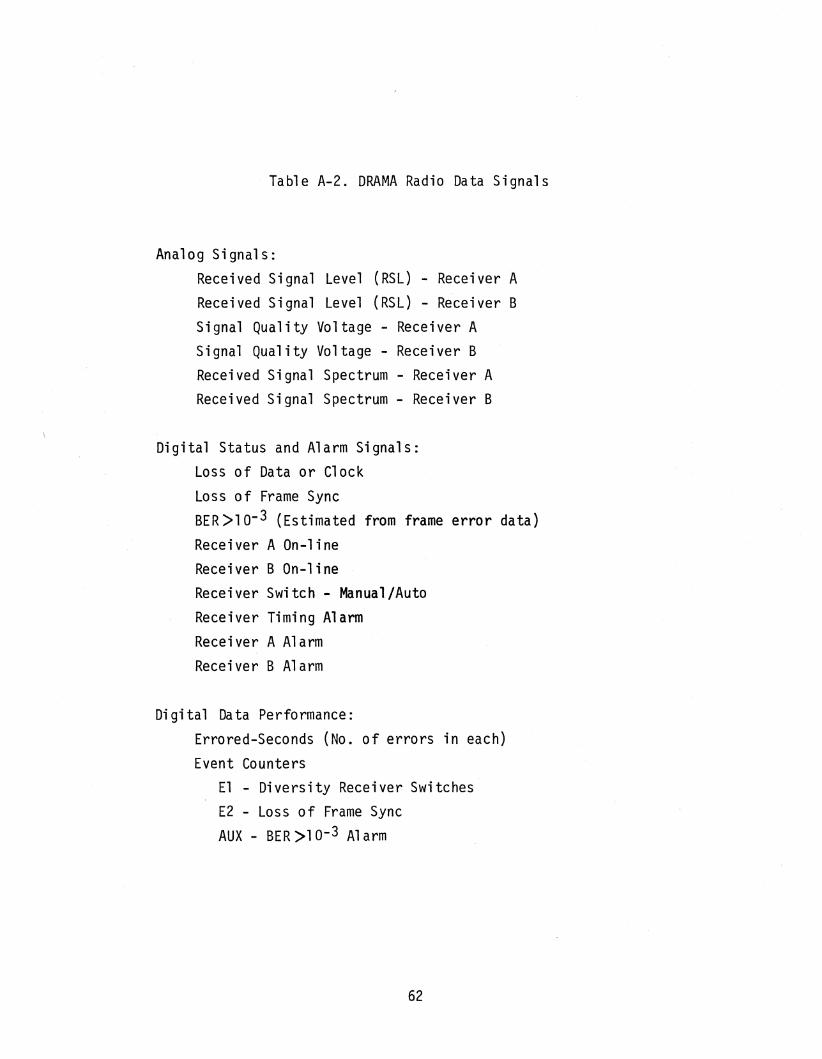
Table A-2. DRAMA Radio Data Signals
Analog Signals:
Received Signal Level (RSL) - Receiver AReceived Signal Level (RSL) - Receiver BSignal Quality Voltage - Receiver ASignal Quality Voltage - Receiver BReceived Signal Spectrum - Receiver AReceived Signal Spectrum - Receiver B
Digital Status and Alarm Signals:Loss of Data or Clock
Loss of Frame SyncBER>10-3 (Estimated from frame error data)
Receiver A On-lineReceiver BOn-lineRecei ver Swi tch - Manual/AutoReceiver Timing AlarmReceiver A AlarmReceiver B Alarm
Digital Data Performance:
Errored-Seconds (No. of errors in each)Event Counters
E1 - Diversity Receiver SwitchesE2 - Loss of Frame SyncAUX - BER >10-3 A1 arm
62
FORM NTIA-29(4-80)
U.S. DEPARTMENT OF COMMERCE !
NAT'L. TELECOMMUNICATIONS AND INFORMATION ADMINISTRATION
BIBLIOGRAPHIC DATA SHEET
1. PUBLICATION NO.
NTIA Report 83-126
2. Gov't Accession ,No. 3. Recipient's Accession No.
4. TITLE AND SUBTITLE
DIGITAL MICROWAVE TRANSMISSION TESTS AT THE PACIFICMISSILE TEST CENTER, PT. MUGU, CALIFORNIA
7. AUTHOR(S)
R.W. Hubbard8. PERFORMING ORGANIZATION NAME AND ADDF~ESS
Institute for Telecommunication SciencesNational Telecommunications and Information
AdministrationU.S. Department of Commerce~ Boulder_ Colorado 80303
11. Sponsoring Organization Name and Address
Department of the NavyPacific Missile Test CenterPoint Mugu, California 93042
14. SUPPLEMENTARY NOTES
5. Publication Da1te
June 19836. Performing Or~lanization Code
NTIA/ITS.N49. Project/Task/VVork Unit No.
9103543
10. Contract/Grant No.MIPRN6312630MP31554
12. Type of Report and Period Covered
Technical Reoort13.
15. ABSTRACT (A 200-word or less factual summary of most significant information. If document includes a significant bibliography or literaturesurvey, mention it here.)
This report describes an experiment designed to measure the performance ofdigital microwave radio systems in a line-of-sight (LOS) link that is subject tostrong atmospheric multipath. It outlines the measurements made to characterizethe propagation medium, the status of space-diversity receiver systems equippedwith switched combiners~ and the burst error-statistics caused by the multipathenvironment. The results presented in this report compare the performance oftwo radios, operating simultaneously in the same transmission channel. Detailederror distribution data have not yet been analyzed.
16. Key Words (Alphabetical order, separated by semicolons)
adaptive equalization; atmospheric multipath; digital communications; impulseresponse
17. AVAILABILITY STATEMENT
rn UNLIMITED.
o FOR OFFICIAL DISTRIBUTION.
*U.S. GOVERNMENT PRINTING OFFICE: 1983-679-8!J9/353
18. Security Class. (This report)
Unclassified19. Security Class. (This page)
Unclassified
20. Number of pages
7621. Price:

II
I
I
I
I
I
III
I
I
I
I
I
I
II
I
I
I
I
I
I
III
I
I
I
I
I
II
II
I
I
I
I
II
I
II
I
I
I
II
I
I
II
I
I
II
I
I
I
II
I
II
I
I
I
I
II
II
I
I
I
I
I
III
I
I
I
I
I
I
II
I
I
I
I
I
I
III
I
I
I
I
I
II
II
I
I
I
I
II
II


I
III
II
I
II
III
II
I
II
I
II
II
I
II
I
IIII
III
III
II
I
II
III
III
II
I
II
I
II
II
I
III
IIII
III
III
II
III
III
II
I
II
I
II
I
II
II
I
III
IIII
III
IIIII
III
III
II
I
II
I
II
II
I
II
I
III
IIII
III
I