Embed Size (px)
Citation preview
Adobe 2014 Digital Marketing Optimization Survey Results
2014 Digital Marketing Optimization Survey resultsTop lessons learned from the leaders
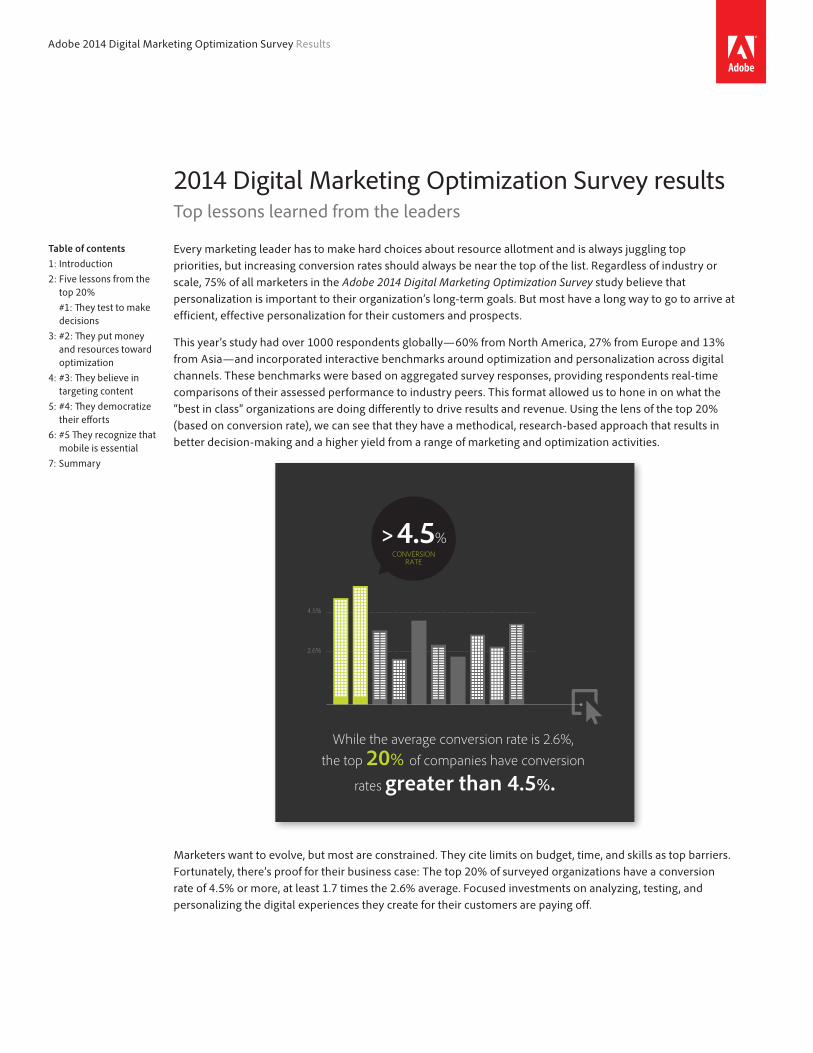
Every marketing leader has to make hard choices about resource allotment and is always juggling top priorities, but increasing conversion rates should always be near the top of the list. Regardless of industry or scale, 75% of all marketers in the Adobe 2014 Digital Marketing Optimization Survey study believe that personalization is important to their organization’s long-term goals. But most have a long way to go to arrive at efficient, effective personalization for their customers and prospects.
This year’s study had over 1000 respondents globally—60% from North America, 27% from Europe and 13% from Asia—and incorporated interactive benchmarks around optimization and personalization across digital channels. These benchmarks were based on aggregated survey responses, providing respondents real-time comparisons of their assessed performance to industry peers. This format allowed us to hone in on what the “best in class” organizations are doing differently to drive results and revenue. Using the lens of the top 20% (based on conversion rate), we can see that they have a methodical, research-based approach that results in better decision-making and a higher yield from a range of marketing and optimization activities.
While the average conversion rate is 2.6%,
the top 20% of companies have conversion
rates greater than 4.5%.
4.5%
2.6%
4.5%CONVERSION
RATE
>
Marketers want to evolve, but most are constrained. They cite limits on budget, time, and skills as top barriers. Fortunately, there’s proof for their business case: The top 20% of surveyed organizations have a conversion rate of 4.5% or more, at least 1.7 times the 2.6% average. Focused investments on analyzing, testing, and personalizing the digital experiences they create for their customers are paying off.
Table of contents1: Introduction2: Five lessons from the
top 20% #1: They test to make
decisions3: #2: They put money
and resources toward optimization
4: #3: They believe in targeting content
5: #4: They democratize their efforts
6: #5 They recognize that mobile is essential
7: Summary
2Adobe 2014 Digital Marketing Optimization Survey Results
Five lessons from the top 20%
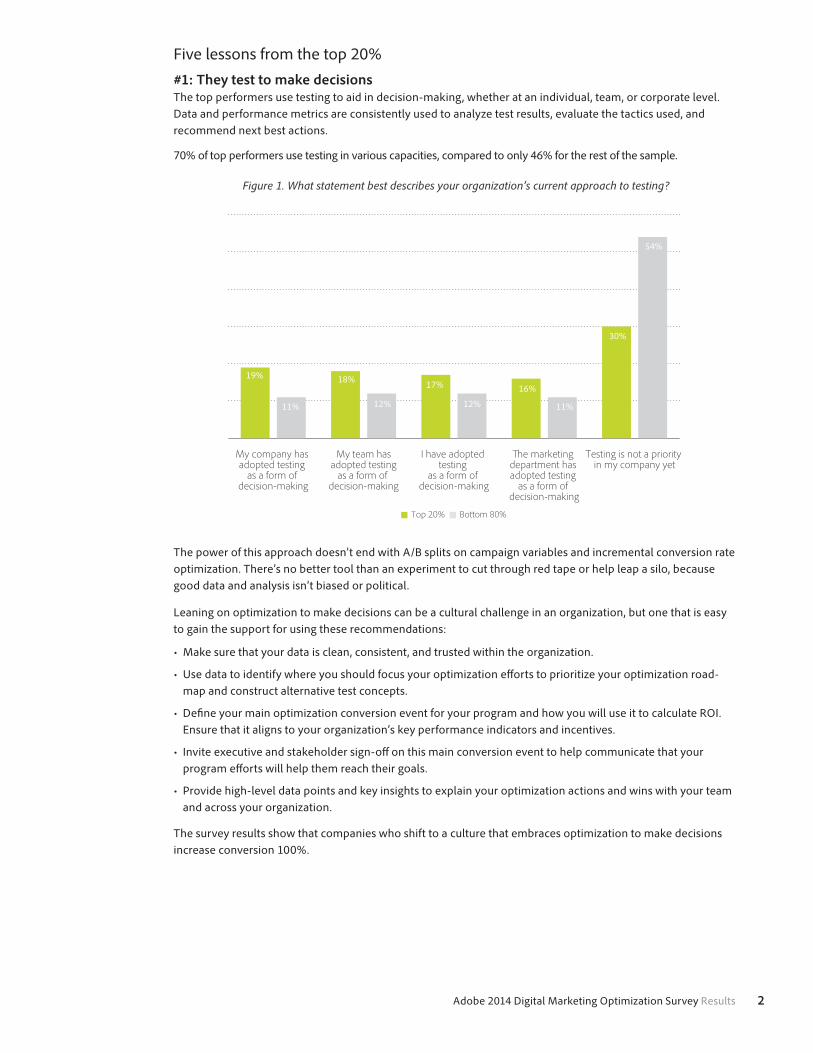
#1: They test to make decisionsThe top performers use testing to aid in decision-making, whether at an individual, team, or corporate level. Data and performance metrics are consistently used to analyze test results, evaluate the tactics used, and recommend next best actions.
70% of top performers use testing in various capacities, compared to only 46% for the rest of the sample.
Testing is not a priority in my company yet
�e marketing department has adopted testing
as a form of decision-making
I have adopted testing
as a form of decision-making
My team has adopted testing
as a form of decision-making
My company has adopted testing
as a form of decision-making
Top 20% Bo�om 80%
19%
11%
18%
12%
17%
12%
16%
11%
30%
54%
Figure 1. What statement best describes your organization’s current approach to testing?
The power of this approach doesn’t end with A/B splits on campaign variables and incremental conversion rate optimization. There’s no better tool than an experiment to cut through red tape or help leap a silo, because good data and analysis isn’t biased or political.
Leaning on optimization to make decisions can be a cultural challenge in an organization, but one that is easy to gain the support for using these recommendations:
• Make sure that your data is clean, consistent, and trusted within the organization.
• Use data to identify where you should focus your optimization efforts to prioritize your optimization road-map and construct alternative test concepts.
• Define your main optimization conversion event for your program and how you will use it to calculate ROI. Ensure that it aligns to your organization’s key performance indicators and incentives.
• Invite executive and stakeholder sign-off on this main conversion event to help communicate that your program efforts will help them reach their goals.
• Provide high-level data points and key insights to explain your optimization actions and wins with your team and across your organization.
The survey results show that companies who shift to a culture that embraces optimization to make decisions increase conversion 100%.
3Adobe 2014 Digital Marketing Optimization Survey Results
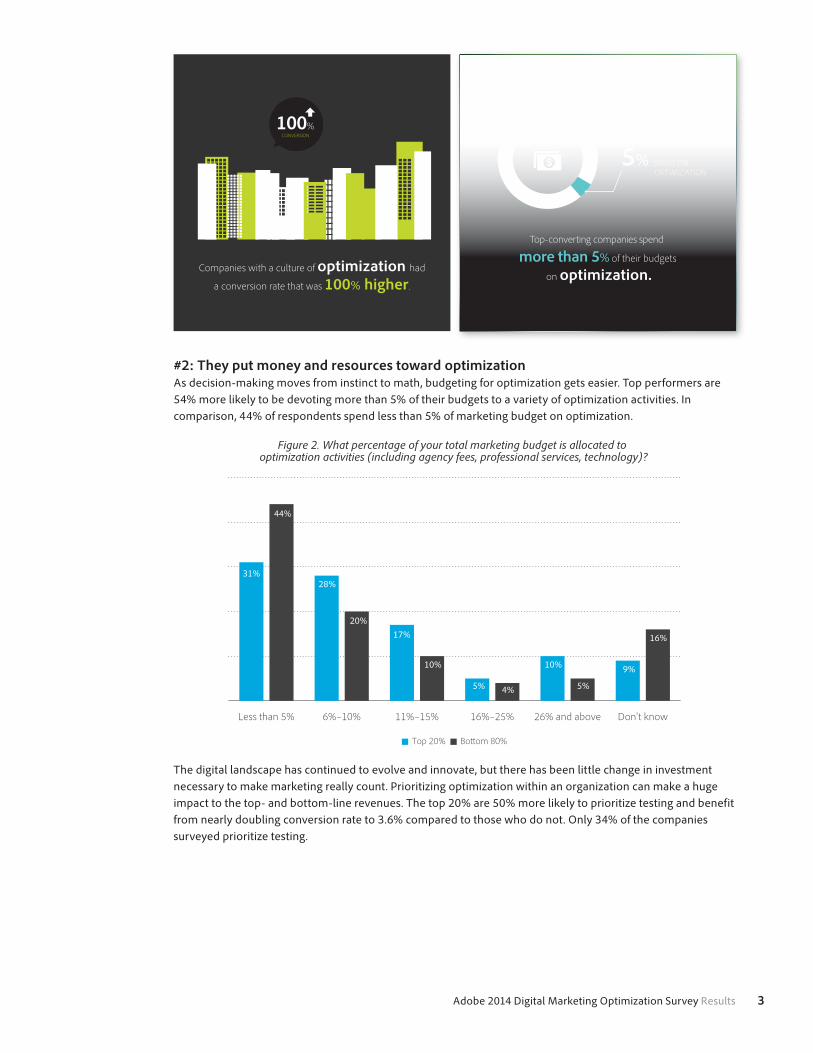
Top-converting companies spend
more than 5% of their budgets
on optimization.
5% SPENT ON OPTIMIZATION
100%CONVERSION
Companies with a culture of optimization had
a conversion rate that was 100% higher.
#2: They put money and resources toward optimizationAs decision-making moves from instinct to math, budgeting for optimization gets easier. Top performers are 54% more likely to be devoting more than 5% of their budgets to a variety of optimization activities. In comparison, 44% of respondents spend less than 5% of marketing budget on optimization.
Don't know26% and above16%–25%11%–15%6%–10%Less than 5%
Top 20% Bo�om 80%
31%
44%
28%
20%
17%
10%10%
5% 5%4%
16%
9%
Figure 2. What percentage of your total marketing budget is allocated to optimization activities (including agency fees, professional services, technology)?
The digital landscape has continued to evolve and innovate, but there has been little change in investment necessary to make marketing really count. Prioritizing optimization within an organization can make a huge impact to the top- and bottom-line revenues. The top 20% are 50% more likely to prioritize testing and benefit from nearly doubling conversion rate to 3.6% compared to those who do not. Only 34% of the companies surveyed prioritize testing.
4Adobe 2014 Digital Marketing Optimization Survey Results
It’s a cyclical process: More budget toward optimization efforts yields higher conversion rates and revenue to then fund into additional activities. Start with small wins to demonstrate the proof points and gain momentum for larger investments.
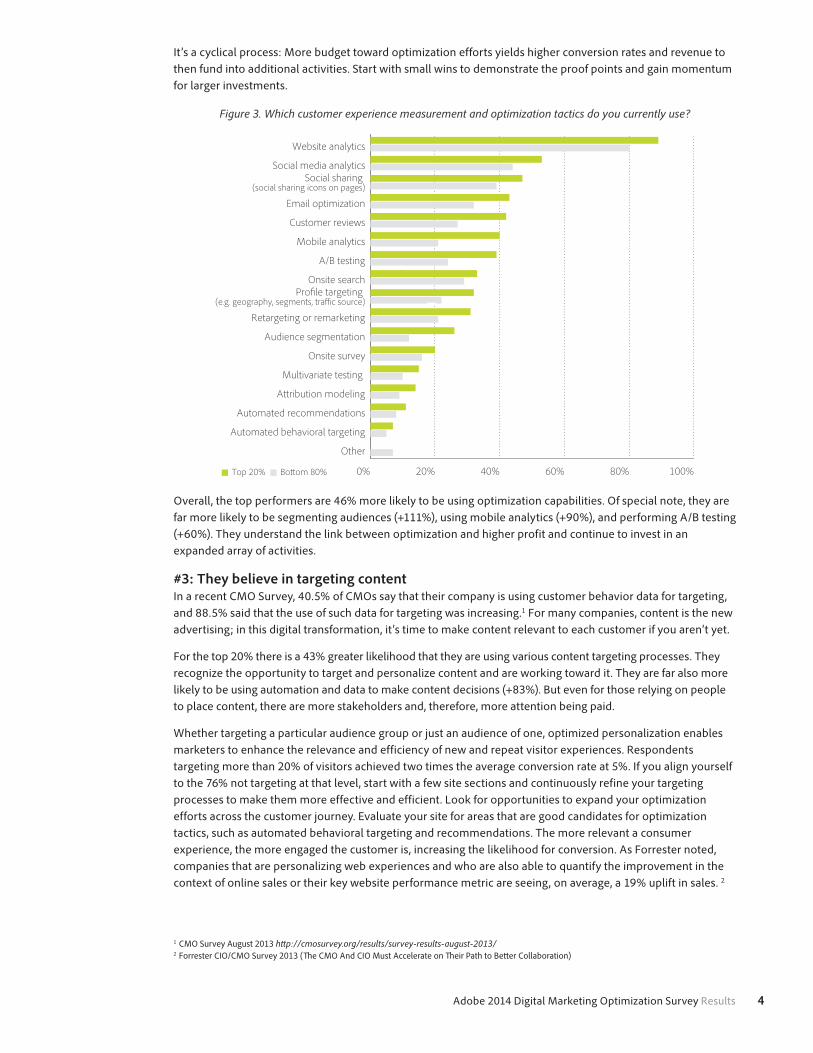
0% 20% 40% 60% 80% 100%
Other
Automated behavioral targeting
Automated recommendations
A�ribution modeling
Multivariate testing
Onsite survey
Audience segmentation
Retargeting or remarketing
Pro�le targeting (e.g. geography, segments, tra�c source)
Onsite search
A/B testing
Mobile analytics
Customer reviews
Email optimization
Social sharing (social sharing icons on pages)
Social media analytics
Website analytics
Top 20% Bo�om 80%
Figure 3. Which customer experience measurement and optimization tactics do you currently use?
Overall, the top performers are 46% more likely to be using optimization capabilities. Of special note, they are far more likely to be segmenting audiences (+111%), using mobile analytics (+90%), and performing A/B testing (+60%). They understand the link between optimization and higher profit and continue to invest in an expanded array of activities.
#3: They believe in targeting contentIn a recent CMO Survey, 40.5% of CMOs say that their company is using customer behavior data for targeting, and 88.5% said that the use of such data for targeting was increasing.1 For many companies, content is the new advertising; in this digital transformation, it’s time to make content relevant to each customer if you aren’t yet.
For the top 20% there is a 43% greater likelihood that they are using various content targeting processes. They recognize the opportunity to target and personalize content and are working toward it. They are far also more likely to be using automation and data to make content decisions (+83%). But even for those relying on people to place content, there are more stakeholders and, therefore, more attention being paid.
Whether targeting a particular audience group or just an audience of one, optimized personalization enables marketers to enhance the relevance and efficiency of new and repeat visitor experiences. Respondents targeting more than 20% of visitors achieved two times the average conversion rate at 5%. If you align yourself to the 76% not targeting at that level, start with a few site sections and continuously refine your targeting processes to make them more effective and efficient. Look for opportunities to expand your optimization efforts across the customer journey. Evaluate your site for areas that are good candidates for optimization tactics, such as automated behavioral targeting and recommendations. The more relevant a consumer experience, the more engaged the customer is, increasing the likelihood for conversion. As Forrester noted, companies that are personalizing web experiences and who are also able to quantify the improvement in the context of online sales or their key website performance metric are seeing, on average, a 19% uplift in sales. 2
1 CMO Survey August 2013 http://cmosurvey.org/results/survey-results-august-2013/2 Forrester CIO/CMO Survey 2013 (The CMO And CIO Must Accelerate on Their Path to Better Collaboration)
5Adobe 2014 Digital Marketing Optimization Survey Results
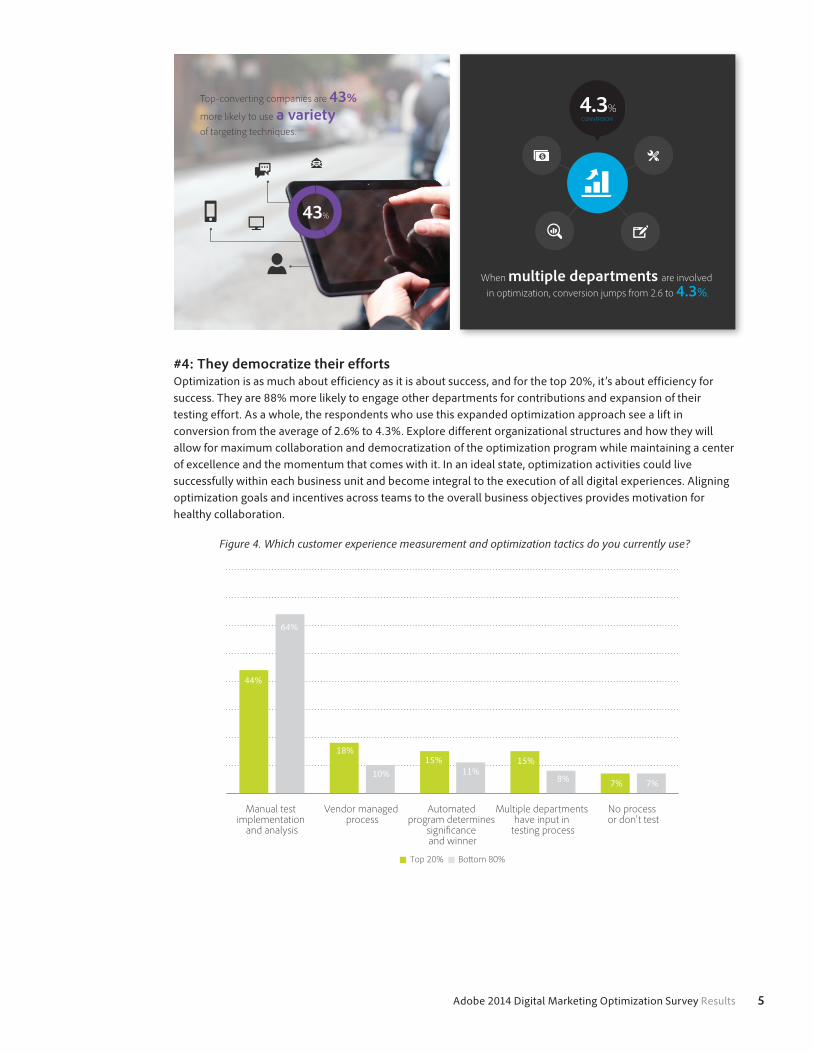
4.3%CONVERSION
When multiple departments are involved
in optimization, conversion jumps from 2.6 to 4.3%.
43%
Top-converting companies are 43%
more likely to use a variety of targeting techniques.
#4: They democratize their effortsOptimization is as much about efficiency as it is about success, and for the top 20%, it’s about efficiency for success. They are 88% more likely to engage other departments for contributions and expansion of their testing effort. As a whole, the respondents who use this expanded optimization approach see a lift in conversion from the average of 2.6% to 4.3%. Explore different organizational structures and how they will allow for maximum collaboration and democratization of the optimization program while maintaining a center of excellence and the momentum that comes with it. In an ideal state, optimization activities could live successfully within each business unit and become integral to the execution of all digital experiences. Aligning optimization goals and incentives across teams to the overall business objectives provides motivation for healthy collaboration.
No process or don't test
Multiple departments have input in
testing process
Automated program determines
signi�cance and winner
Vendor managed process
Manual test implementation
and analysis
Top 20% Bo�om 80%
44%
64%
18%
10%15%
11%15%
8% 7%7%
Figure 4. Which customer experience measurement and optimization tactics do you currently use?
6Adobe 2014 Digital Marketing Optimization Survey Results
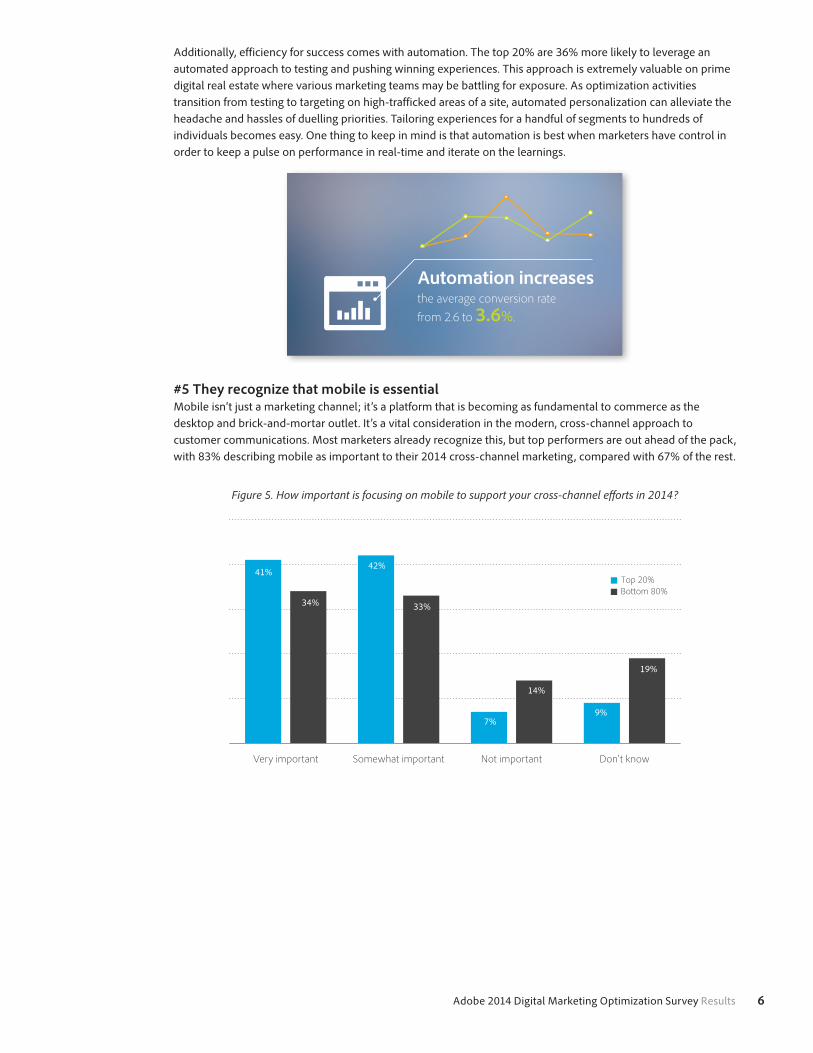
Additionally, efficiency for success comes with automation. The top 20% are 36% more likely to leverage an automated approach to testing and pushing winning experiences. This approach is extremely valuable on prime digital real estate where various marketing teams may be battling for exposure. As optimization activities transition from testing to targeting on high-trafficked areas of a site, automated personalization can alleviate the headache and hassles of duelling priorities. Tailoring experiences for a handful of segments to hundreds of individuals becomes easy. One thing to keep in mind is that automation is best when marketers have control in order to keep a pulse on performance in real-time and iterate on the learnings.
Automation increases the average conversion rate
from 2.6 to 3.6%.
#5 They recognize that mobile is essential Mobile isn’t just a marketing channel; it’s a platform that is becoming as fundamental to commerce as the desktop and brick-and-mortar outlet. It’s a vital consideration in the modern, cross-channel approach to customer communications. Most marketers already recognize this, but top performers are out ahead of the pack, with 83% describing mobile as important to their 2014 cross-channel marketing, compared with 67% of the rest.
Don't knowNot importantSomewhat importantVery important
Top 20%Bo�om 80%
41%
44%
34%
42%
33%
14%
7%9%
19%
Figure 5. How important is focusing on mobile to support your cross-channel e�orts in 2014?
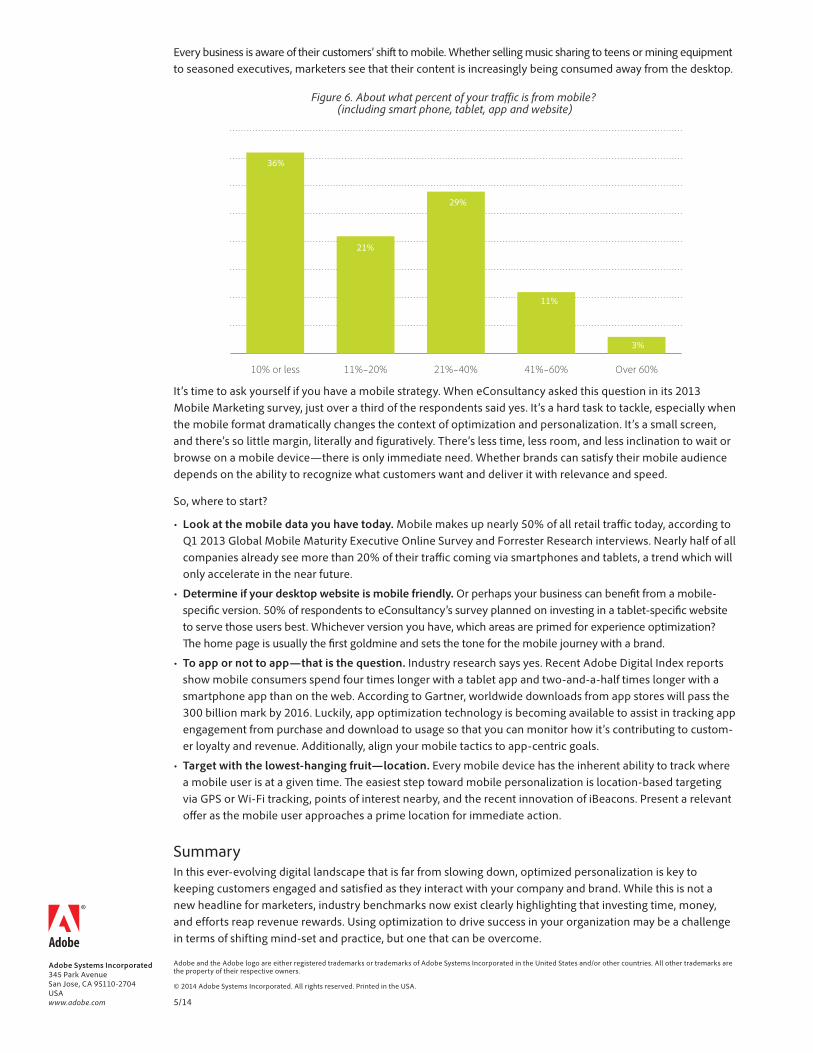
Every business is aware of their customers’ shift to mobile. Whether selling music sharing to teens or mining equipment to seasoned executives, marketers see that their content is increasingly being consumed away from the desktop.
Over 60%41%–60%21%–40%11%–20%10% or less
36%
21%
29%
11%
3%
Figure 6. About what percent of your tra�c is from mobile? (including smart phone, tablet, app and website)
It’s time to ask yourself if you have a mobile strategy. When eConsultancy asked this question in its 2013 Mobile Marketing survey, just over a third of the respondents said yes. It’s a hard task to tackle, especially when the mobile format dramatically changes the context of optimization and personalization. It’s a small screen, and there’s so little margin, literally and figuratively. There’s less time, less room, and less inclination to wait or browse on a mobile device—there is only immediate need. Whether brands can satisfy their mobile audience depends on the ability to recognize what customers want and deliver it with relevance and speed.
So, where to start?
• Look at the mobile data you have today. Mobile makes up nearly 50% of all retail traffic today, according to Q1 2013 Global Mobile Maturity Executive Online Survey and Forrester Research interviews. Nearly half of all companies already see more than 20% of their traffic coming via smartphones and tablets, a trend which will only accelerate in the near future.
• Determine if your desktop website is mobile friendly. Or perhaps your business can benefit from a mobile-specific version. 50% of respondents to eConsultancy’s survey planned on investing in a tablet-specific website to serve those users best. Whichever version you have, which areas are primed for experience optimization? The home page is usually the first goldmine and sets the tone for the mobile journey with a brand.
• To app or not to app—that is the question. Industry research says yes. Recent Adobe Digital Index reports show mobile consumers spend four times longer with a tablet app and two-and-a-half times longer with a smartphone app than on the web. According to Gartner, worldwide downloads from app stores will pass the 300 billion mark by 2016. Luckily, app optimization technology is becoming available to assist in tracking app engagement from purchase and download to usage so that you can monitor how it’s contributing to custom-er loyalty and revenue. Additionally, align your mobile tactics to app-centric goals.
• Target with the lowest-hanging fruit—location. Every mobile device has the inherent ability to track where a mobile user is at a given time. The easiest step toward mobile personalization is location-based targeting via GPS or Wi-Fi tracking, points of interest nearby, and the recent innovation of iBeacons. Present a relevant offer as the mobile user approaches a prime location for immediate action.
SummaryIn this ever-evolving digital landscape that is far from slowing down, optimized personalization is key to keeping customers engaged and satisfied as they interact with your company and brand. While this is not a new headline for marketers, industry benchmarks now exist clearly highlighting that investing time, money, and efforts reap revenue rewards. Using optimization to drive success in your organization may be a challenge in terms of shifting mind-set and practice, but one that can be overcome.
Adobe Systems Incorporated 345 Park Avenue San Jose, CA 95110-2704 USA www.adobe.com
Adobe and the Adobe logo are either registered trademarks or trademarks of Adobe Systems Incorporated in the United States and/or other countries. All other trademarks are the property of their respective owners.
© 2014 Adobe Systems Incorporated. All rights reserved. Printed in the USA.
5/14