Embed Size (px)
Citation preview

Interim statement Q1 2017 / 2018
Digital in the box.
Heidelberg Group
2
INTERIM STATEMENT FOR THE FIRST QUARTER OF 2017/2018
Figures
¬ Incoming orders total € 629 million
¬ Net sales up year-on-year at € 495 million
¬ EBITDA excluding restructuring result well above previous year at € 14 million;
EBIT excluding restructuring result slightly negative at € – 3 million
¬ Net result after taxes € – 16 million
¬ Free cash flow including purchase prices for acquisitions amounts to € – 13 million
¬ Leverage well below target level of 2 at 1.2
¬ Focus remains on annual and medium-term targets
Facts
¬ Heidelberg presents new growth strategy: “Heidelberg goes digital!” – strategic focus on the topics of
technology leadership, digital transformation and operational excellence
¬ At China Print 2017, Heidelberg presents itself as a pioneer in the digitization of the industry
with the slogan “Simply smart”
¬ With the acquisition of the software provider DOCUFY, Heidelberg strengthens the digital platforms
business area and expands its range of Industry 4.0 products
¬ Heidelberg strengthens its coatings and pressroom chemicals business in the EMEA region with the
acquisition of this area from Fujifilm
¬ Higher efficiency in logistics thanks to optimization of tariff model in this area and acquisition of
logistics center
¬ Capital market rewards Heidelberg’s digitization strategy: convertible bond almost completely
converted into equity; interest costs fall by around € 5 million a year
¬ Moody’s upgrades company rating to B2
NotesFrom the 2017 / 2018 financial year, “special items” will be reported as the “restructuring result” and in the corresponding items of the income statement.
The segments were reorganized as of April 1, 2017, as part of the adjustment of the corporate strategy. The figures for the 2016 / 2017 financial year were restated accordingly.

3
Interim statement Q1 2017 / 2018
Key figures at a glance Overall assessment of business development
At the end of the 2016 / 2017 financial year, Heidelberg pres-
ented its strategy “Heidelberg goes digital!”, which aims to
generate growth and increase profitability with a focus on
the topics of digital transformation, technology leadership
and operational excellence.
The new strategic approaches and goals have a direct
impact on business structures and organization: To accel-
erate Heidelberg’s digital transformation, there was a reor-
ganization of the segments and functional responsibilities
and of the regional market and service organization at the
start of financial year 2017 / 2018. Particular importance was
attached to the efficient networking of business units. The
businesses bundled in the previous segments Heidelberg
Equipment (HDE) and Heidelberg Services (HDS) are being
restructured into the Heidelberg Digital Technology (HDT)
and Heidelberg Digital Business and Services (HDB) seg-
ments. The Heidelberg Financial Services segment will con-
tinue to exist unchanged.
With the acquisition of Fujifilm’s coatings and press-
room chemicals business for the EMEA region and of the
software provider DOCUFY, Heidelberg has also strength-
ened its position in key growth areas. Together with the
optimization of the tariff model for the logistics area, the
purchase of the previously rented property in which our
logistics center is located will lead to significantly higher
logistics efficiency.
In the first quarter of the 2017 / 2018 financial year, sales
increased to € 495 million, but the incoming orders of € 629
million were down as expected compared to the same quar-
ter of the previous year, in which particularly high incom-
ing orders had been recorded due to the drupa trade show.
Compared to the end of the financial year (€ 497 million),
the order backlog increased by more than 20 percent to
€ 603 million as of June 30, 2017.
The China Print 2017 trade show in mid-May, at which
Heidelberg presented the digital future of the print media
industry according to the slogan “Simply smart”, provided
a boost to sales and incoming orders in the key market of
China, both of which increased year-on-year.
The only slightly negative operating result represents a
significant improvement compared to the same quarter of
the previous year, which was also negatively impacted by
costs for the drupa trade show. Combined with the further
improved financial result, this also led to a considerable
improvement in the result after taxes against the previous
year.
Figures in € millions Q1 2016 / 2017
Q1 2017 / 2018
Incoming orders 804 629
Order backlog 768 603
Net sales 486 495
EBITDA excluding restructuring result 1) 1 14
in percent of net sales 0.2 2.8
Result of operating activities excluding restructuring result 2) – 16 – 3
Restructuring result – 3 0
Financial result – 16 – 13
Net result before taxes – 35 – 15
Net result after taxes – 37 – 16
Equity 167 382
Net debt 3) 263 234
Leverage 4) 1.8 1.2
Cash flow – 17 1
Free cash flow 6 – 13
Earnings per share in € – 0.14 – 0.06
Number of employees at end of quarter (excluding trainees) 11,523 11,445
1) Result of operating activities before interest, taxes, depreciation and amortization, excluding restructuring result (previously: special items)
2) Previously: Result of operating activities excluding special items3) Net total of financial liabilities and cash and cash equivalents
and current securities4) Ratio of net debt to EBITDA excluding restructuring result for the last four quarters

Heidelberg Group
4
Net sales and results of operations Interim consolidated income statement
¬ At € 495 million, net sales were up around 2 percent
year-on-year and thus in line with the forecasts. This
increase was particularly attributable to Western
Europe and China.
¬ At € 14 million, ebitda excluding restructuring result was considerably better than in the same quar-
ter of the previous year (€ 1 million), while ebit excluding restructuring result amounted to € – 3 million
(same quarter of previous year: € – 16 million). The
EBITDA margin excluding restructuring result came
to 2.8 percent.
¬ As a result of the reduced financing costs, the finan-
cial result improved to € – 13 million (same quarter
of previous year: € – 16 million).
¬ Taking into account taxes on income, the net result after taxes improved significantly to € – 16 million
compared to the previous year’s figure (€ – 37 million).
Figures in € millions Q1 2016 /2017 Q1 2017 /2018
Net sales 486 495
Change in inventories / other own work capitalized 104 84
Total operating performance 590 579
EBITDA excluding restructuring result 1) 1 14
Result of operating activities excluding restructuring result 1) – 16 – 3
Restructuring result 1) – 3 0
Result of operating activities – 19 – 3
Financial result – 16 – 13
Net result before taxes – 35 – 15
Taxes on income 2 0
Net result after taxes – 37 – 16
1) Previously: EBITDA and / or result of operating activities excluding special items
5
Interim statement Q1 2017 / 2018
Net assets
Equity and liabilities
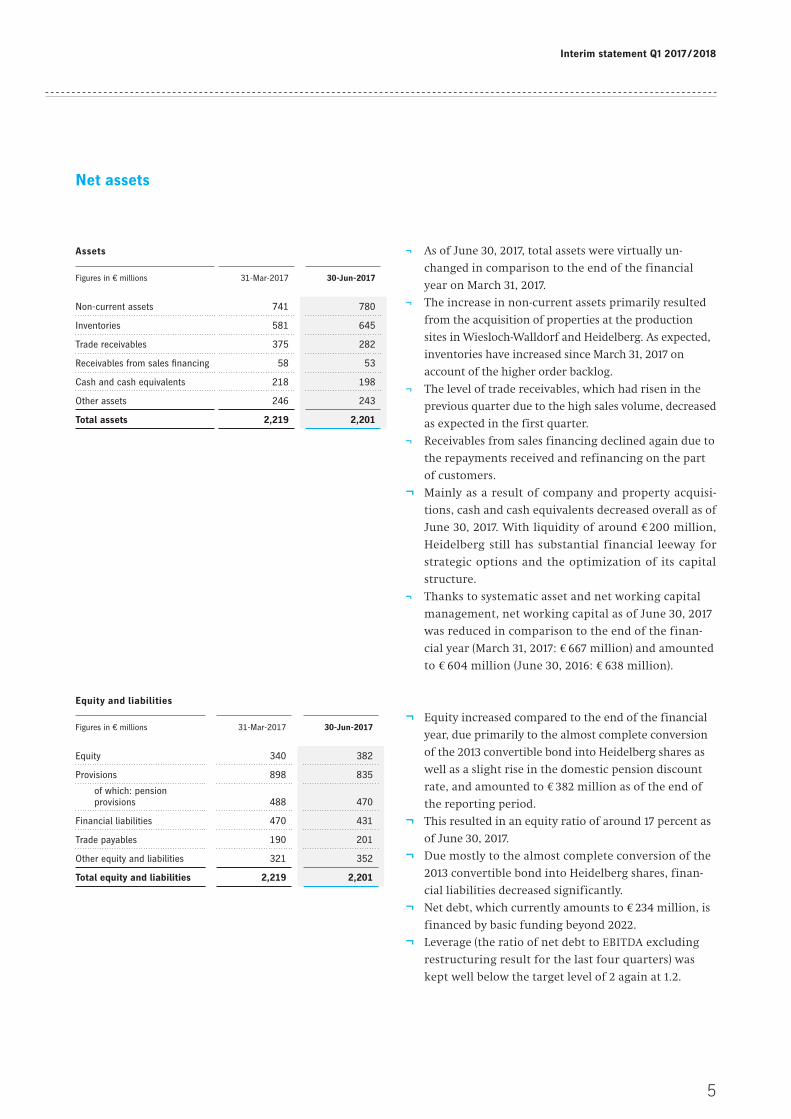
Figures in € millions 31-Mar-2017 30-Jun-2017
Non-current assets 741 780
Inventories 581 645
Trade receivables 375 282
Receivables from sales financing 58 53
Cash and cash equivalents 218 198
Other assets 246 243
Total assets 2,219 2,201
Figures in € millions 31-Mar-2017 30-Jun-2017
Equity 340 382
Provisions 898 835
of which: pension provisions 488 470
Financial liabilities 470 431
Trade payables 190 201
Other equity and liabilities 321 352
Total equity and liabilities 2,219 2,201
¬ As of June 30, 2017, total assets were virtually un-
changed in comparison to the end of the financial
year on March 31, 2017.
¬ The increase in non-current assets primarily resulted
from the acquisition of properties at the production
sites in Wiesloch-Walldorf and Heidelberg. As expected,
inventories have increased since March 31, 2017 on
account of the higher order backlog.
¬ The level of trade receivables, which had risen in the
previous quarter due to the high sales volume, de creased
as expected in the first quarter.
¬ Receivables from sales financing declined again due to
the repayments received and refinancing on the part
of customers.
¬ Mainly as a result of company and property acquisi-
tions, cash and cash equivalents decreased overall as of
June 30, 2017. With liquidity of around € 200 million,
Heidelberg still has substantial financial leeway for
strategic options and the optimization of its capital
structure.
¬ Thanks to systematic asset and net working capital
management, net working capital as of June 30, 2017
was reduced in comparison to the end of the finan-
cial year (March 31, 2017: € 667 million) and amounted
to € 604 million (June 30, 2016: € 638 million).
¬ Equity increased compared to the end of the financial
year, due primarily to the almost complete conversion
of the 2013 convertible bond into Heidelberg shares as
well as a slight rise in the domestic pension discount
rate, and amounted to € 382 million as of the end of
the reporting period.
¬ This resulted in an equity ratio of around 17 percent as
of June 30, 2017.
¬ Due mostly to the almost complete conversion of the
2013 convertible bond into Heidelberg shares, finan-
cial liabilities decreased significantly.
¬ Net debt, which currently amounts to € 234 million, is
financed by basic funding beyond 2022.
¬ Leverage (the ratio of net debt to EBITDA excluding
restructuring result for the last four quarters) was
kept well below the target level of 2 again at 1.2.
Assets
Heidelberg Group
6
Financial position Interim consolidated statement of cash flows
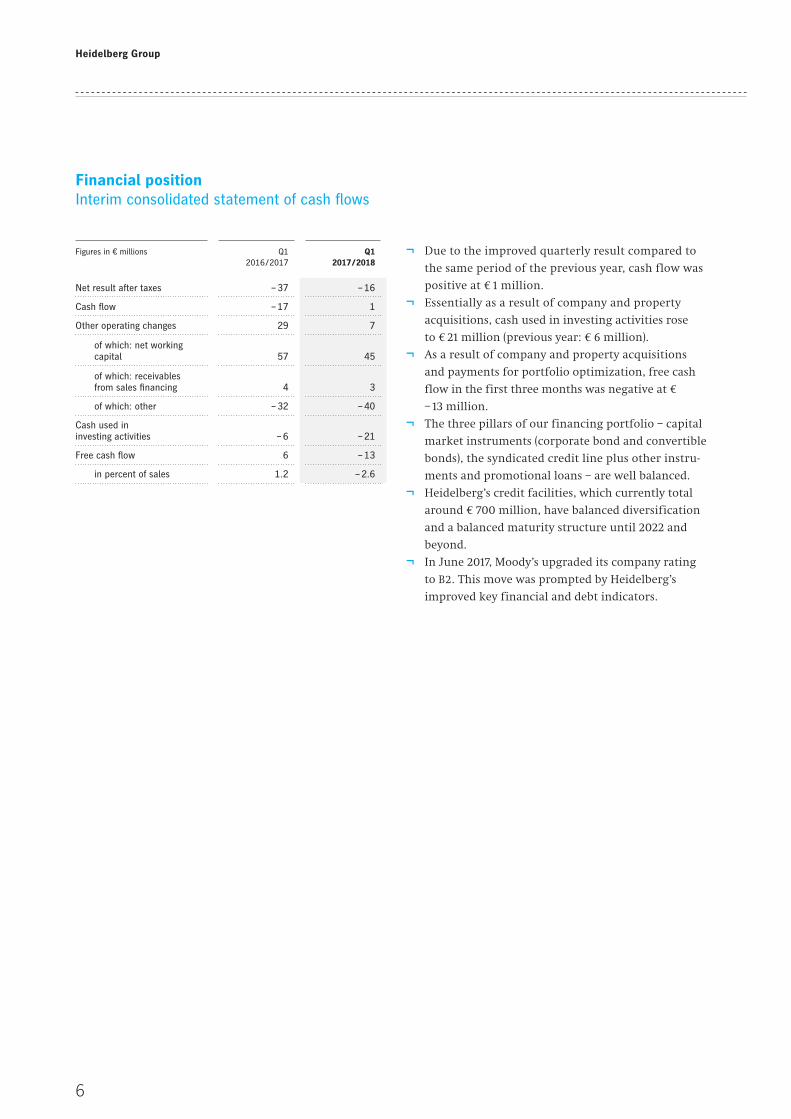
Figures in € millions Q1 2016 / 2017
Q1 2017 / 2018
Net result after taxes – 37 – 16
Cash flow – 17 1
Other operating changes 29 7
of which: net working capital 57 45
of which: receivables from sales financing 4 3
of which: other – 32 – 40
Cash used in investing activities – 6 – 21
Free cash flow 6 – 13
in percent of sales 1.2 – 2.6
¬ Due to the improved quarterly result compared to
the same period of the previous year, cash flow was
positive at € 1 million.
¬ Essentially as a result of company and property
acquisitions, cash used in investing activities rose
to € 21 million (previous year: € 6 million).
¬ As a result of company and property acquisitions
and payments for portfolio optimization, free cash
flow in the first three months was negative at €
– 13 million.
¬ The three pillars of our financing portfolio – capital
market instruments (corporate bond and convertible
bonds), the syndicated credit line plus other instru-
ments and promotional loans – are well balanced.
¬ Heidelberg’s credit facilities, which currently total
around € 700 million, have balanced diversification
and a balanced maturity structure until 2022 and
beyond.
¬ In June 2017, Moody’s upgraded its company rating
to B2. This move was prompted by Heidelberg’s
improved key financial and debt indicators.
7
Interim statement Q1 2017 / 2018
Segments
As part of the adjustment of the corporate strategy, the seg-
ments were reorganized as of April 1, 2017. The figures for
the 2016 / 2017 financial year have been restated accordingly.
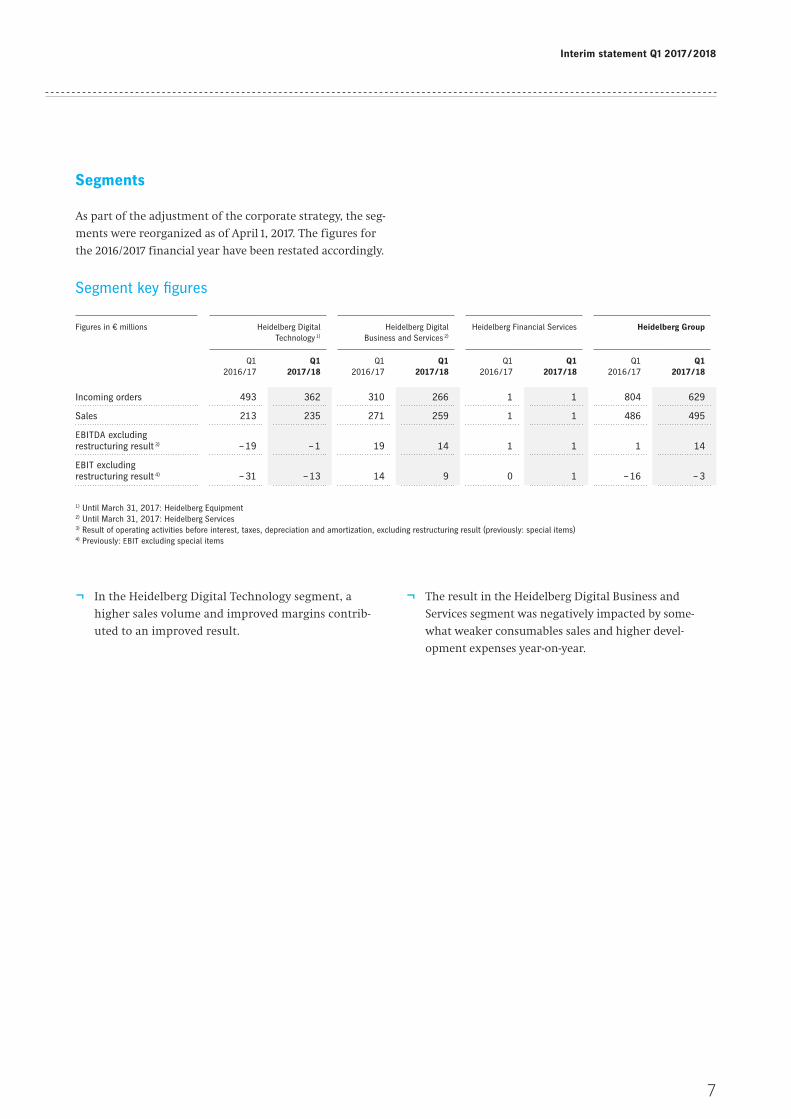
Segment key figures
¬ In the Heidelberg Digital Technology segment, a
higher sales volume and im proved margins contrib-
uted to an improved result.
Figures in € millions Heidel berg Digital Technology 1)
Heidel berg Digital Business and Services 2)
Heidel berg Financial Services Heidel berg Group
Q12016 / 17
Q1 2017 / 18
Q12016 / 17
Q1 2017 / 18
Q12016 / 17
Q1 2017 / 18
Q12016 / 17
Q1 2017 / 18
Incoming orders 493 362 310 266 1 1 804 629
Sales 213 235 271 259 1 1 486 495
EBITDA excluding restructuring result 3) – 19 – 1 19 14 1 1 1 14
EBIT excluding restructuring result 4) – 31 – 13 14 9 0 1 – 16 – 3
1) Until March 31, 2017: Heidelberg Equipment 2) Until March 31, 2017: Heidelberg Services 3) Result of operating activities before interest, taxes, depreciation and amortization, excluding restructuring result (previously: special items) 4) Previously: EBIT excluding special items
¬ The result in the Heidelberg Digital Business and
Services segment was negatively impacted by some-
what weaker consumables sales and higher devel-
opment expenses year-on-year.
Heidelberg Group
8
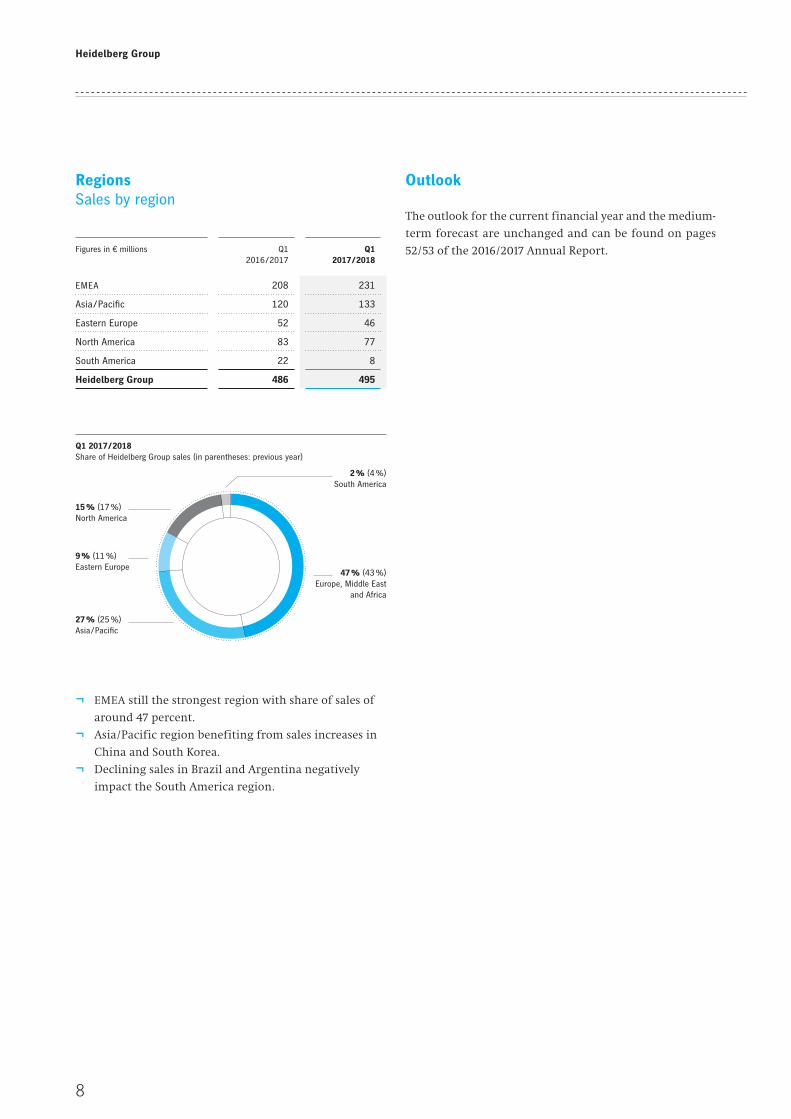
Figures in € millions Q1 2016 / 2017
Q1 2017 / 2018
EMEA 208 231
Asia / Pacific 120 133
Eastern Europe 52 46
North America 83 77
South America 22 8
Heidel berg Group 486 495
Q1 2017 / 2018 Share of Heidelberg Group sales (in parentheses: previous year)
47 % (43 %)Europe, Middle East
and Africa
2 % (4 %)South America
15 % (17 %)North America
9 % (11 %)Eastern Europe
27 % (25 %)Asia / Pacific
¬ EMEA still the strongest region with share of sales of
around 47 percent.
¬ Asia / Pacific region benefiting from sales increases in
China and South Korea.
¬ Declining sales in Brazil and Argentina negatively
impact the South America region.
Outlook
The outlook for the current financial year and the medium-
term forecast are unchanged and can be found on pages
52 / 53 of the 2016 / 2017 Annual Report.
Regions Sales by region
9
Interim statement Q1 2017 / 2018
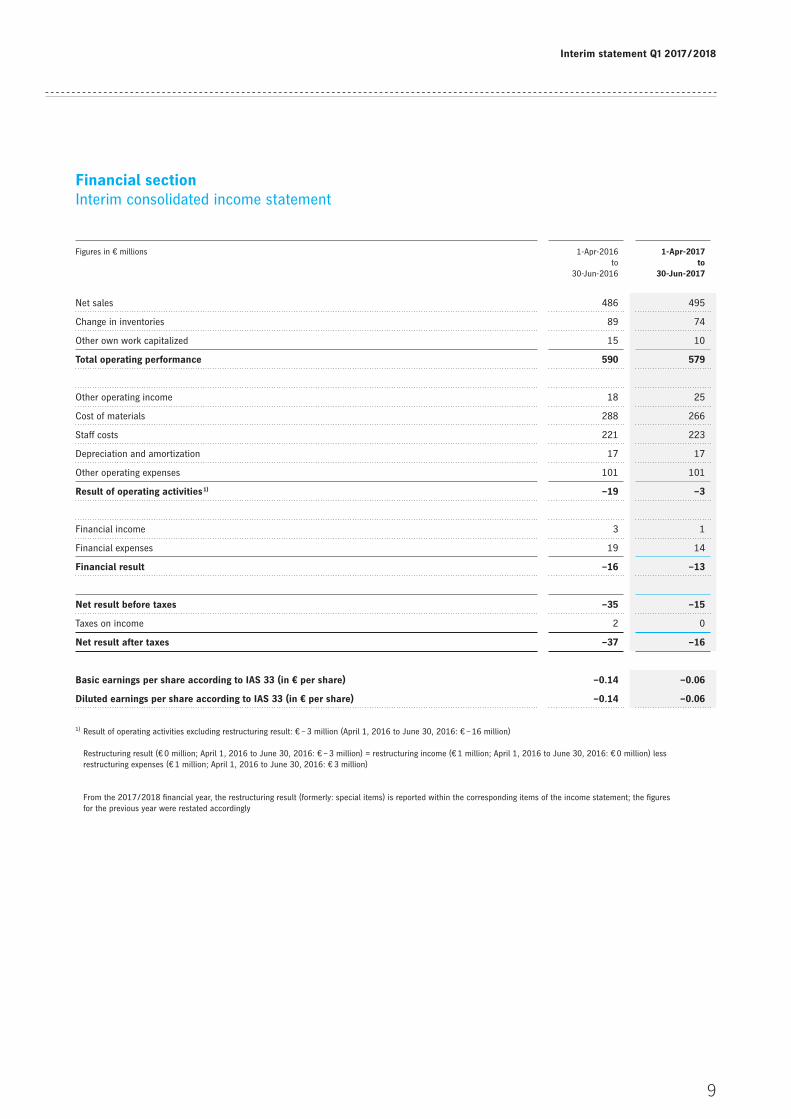
Financial section Interim consolidated income statement
Figures in € millions 1-Apr-2016to
30-Jun-2016
1-Apr-2017to
30-Jun-2017
Net sales 486 495
Change in inventories 89 74
Other own work capitalized 15 10
Total operating performance 590 579
Other operating income 18 25
Cost of materials 288 266
Staff costs 221 223
Depreciation and amortization 17 17
Other operating expenses 101 101
Result of operating activities 1) –19 –3
Financial income 3 1
Financial expenses 19 14
Financial result –16 –13
Net result before taxes –35 –15
Taxes on income 2 0
Net result after taxes –37 –16
Basic earnings per share according to IAS 33 (in € per share) –0.14 –0.06
Diluted earnings per share according to IAS 33 (in € per share) –0.14 –0.06
1) Result of operating activities excluding restructuring result: € – 3 million (April 1, 2016 to June 30, 2016: € – 16 million) Restructuring result (€ 0 million; April 1, 2016 to June 30, 2016: € – 3 million) = restructuring income (€ 1 million; April 1, 2016 to June 30, 2016: € 0 million) less restructuring expenses (€ 1 million; April 1, 2016 to June 30, 2016: € 3 million) From the 2017 / 2018 financial year, the restructuring result (formerly: special items) is reported within the corresponding items of the income statement; the figures for the previous year were restated accordingly
Heidelberg Group
10
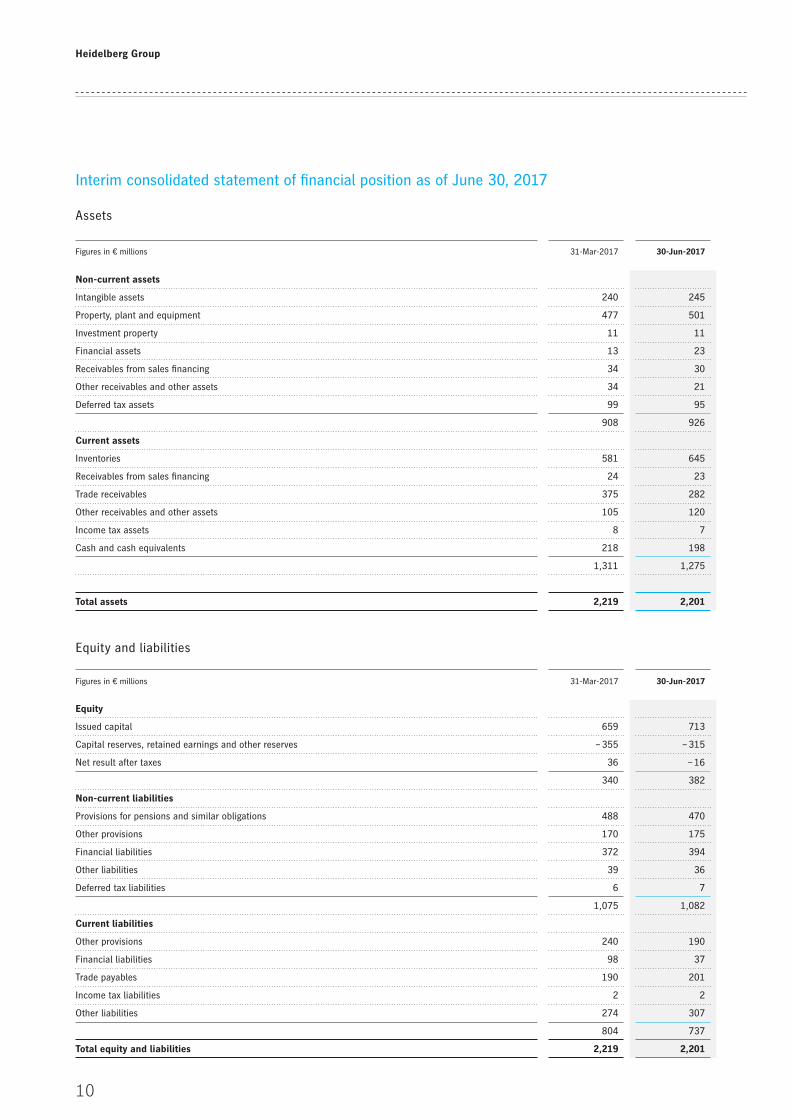
Interim consolidated statement of financial position as of June 30, 2017
Figures in € millions 31-Mar-2017 30-Jun-2017
Non-current assets
Intangible assets 240 245
Property, plant and equipment 477 501
Investment property 11 11
Financial assets 13 23
Receivables from sales financing 34 30
Other receivables and other assets 34 21
Deferred tax assets 99 95
908 926
Current assets
Inventories 581 645
Receivables from sales financing 24 23
Trade receivables 375 282
Other receivables and other assets 105 120
Income tax assets 8 7
Cash and cash equivalents 218 198
1,311 1,275
Total assets 2,219 2,201
Equity and liabilities
Assets
Figures in € millions 31-Mar-2017 30-Jun-2017
Equity
Issued capital 659 713
Capital reserves, retained earnings and other reserves – 355 – 315
Net result after taxes 36 – 16
340 382
Non-current liabilities
Provisions for pensions and similar obligations 488 470
Other provisions 170 175
Financial liabilities 372 394
Other liabilities 39 36
Deferred tax liabilities 6 7
1,075 1,082
Current liabilities
Other provisions 240 190
Financial liabilities 98 37
Trade payables 190 201
Income tax liabilities 2 2
Other liabilities 274 307
804 737
Total equity and liabilities 2,219 2,201

11
Interim statement Q1 2017 / 2018
Interim consolidated statement of cash flows as of June 30, 2017
Figures in € millions 1-Apr-2016to
30-Jun-2016
1-Apr-2017to
30-Jun-2017
Net result after taxes –37 –16
Depreciation, amortization, write-downs, and write-ups 1) 19 17
Change in pension provisions 3 2
Change in deferred tax assets / deferred tax liabilities / tax provisions –2 –2
Result from disposals 0 0
Cash flow –17 1
Change in inventories –82 –73
Change in sales financing 4 3
Change in trade receivables / payables 108 92
Change in other provisions –38 –32
Change in other items of the statement of financial position 37 17
Other operating changes 29 7
Cash generated by operating activities 12 8
Intangible assets / property, plant and equipment / investment property
Investments –25 –24
Income from disposals 4 1
Financial assets / company acquisitions
Investments 0 –8
Cash investment 15 10
Cash used in investing activities –6 –21
Change in financial liabilities –66 –3
Cash used in financing activities –66 –3
Net change in cash and cash equivalents –60 –16
Cash and cash equivalents at the beginning of the reporting period 215 218
Currency adjustments 2 –4
Net change in cash and cash equivalents –60 –16
Cash and cash equivalents at the end of the reporting period 157 198
Cash generated by operating activities 12 8
Cash used in investing activities –6 –21
Free cash flow 6 –13
1) Relates to intangible assets, property, plant and equipment, investment property and financial assets
Heidelberg Group
12
Important noteThis interim statement contains forward-looking statements based on assumptions and estimates by the management of Heidelberger Druckmaschinen Aktiengesellschaft. Although the Management Board is of the opinion that these assumptions and estimates are realistic, actual future developments and results may deviate substantially from these forward-looking statements due to various factors. These factors could, for instance, include changes in the overall economic situation, exchange rates and interest rates, as well as changes within the print media industry. Heidelberger Druckmaschinen Aktiengesellschaft provides no guarantee and assumes no liability for future developments and results deviating from the assumptions and estimates made in this interim statement. Heidelberg neither intends nor assumes any obligation to update the assumptions and estimates made in this interim statement to reflect events or developments occurring after the publication of this interim statement.
In individual cases, rounding may result in discrepancies concerning the totals and percentages contained in this interim statement.
This report is a non-binding English convenience translation of the German interim statement of Heidelberger Druckmaschinen Aktiengesellschaft. The Company disclaims responsibility for any misunderstanding or misinterpretation due to this translation.
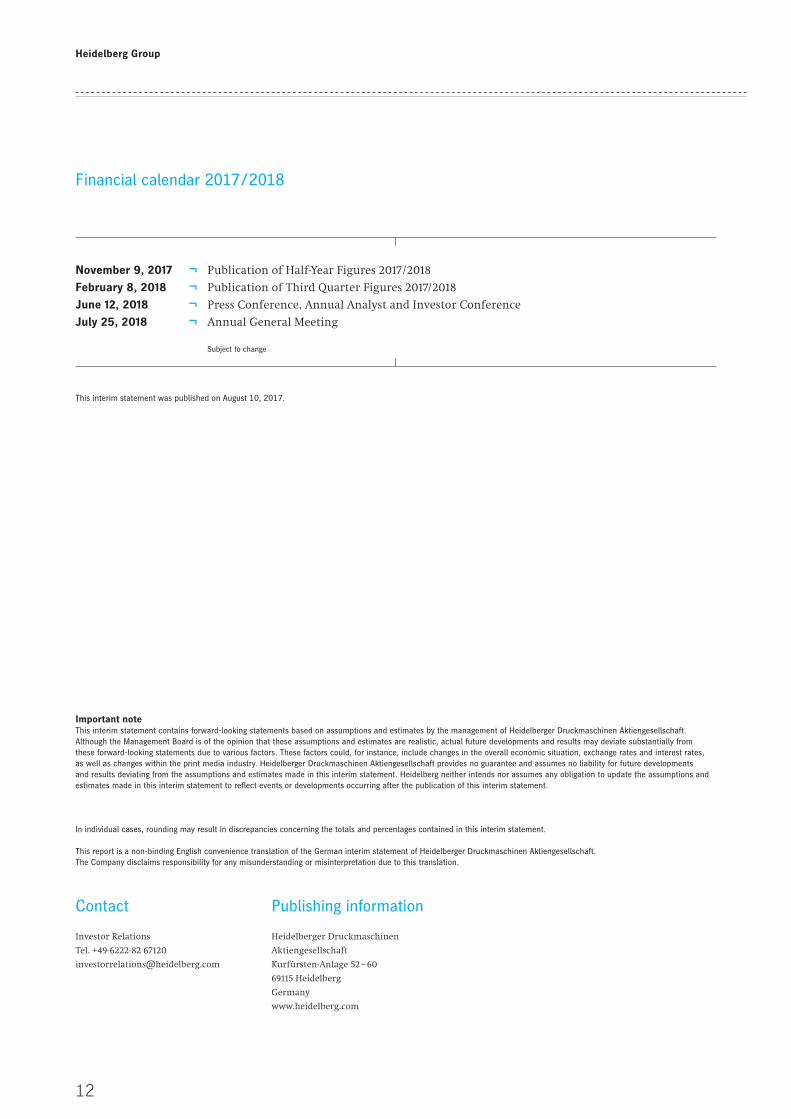
This interim statement was published on August 10, 2017.
Financial calendar 2017 / 2018
November 9, 2017 ¬ Publication of Half-Year Figures 2017 / 2018
February 8, 2018 ¬ Publication of Third Quarter Figures 2017/ 2018
June 12, 2018 ¬ Press Conference, Annual Analyst and Investor Conference
July 25, 2018 ¬ Annual General Meeting
Subject to change
Contact Publishing information
Investor Relations Heidelberger Druckmaschinen
Tel. +49-6222-82 67120 Aktiengesellschaft
[email protected] Kurfürsten-Anlage 52 – 60
69115 Heidelberg
Germany
www.heidelberg.com