Embed Size (px)
Citation preview
Digital Imaging and Remote Sensing Laboratory
Real-World Stepwise Real-World Stepwise Spectral UnmixingSpectral Unmixing
Real-World Stepwise Real-World Stepwise Spectral UnmixingSpectral Unmixing
Daniel NewlandDr. John Schott
Digital Imaging and Remote Sensing LaboratoryCenter for Imaging Science
May 7, 1999
Digital Imaging and Remote Sensing Laboratory
OutlineOutlineOutlineOutline
• Objective
• Unmixing Background
• Data and Preparation
• Results
• Conclusions
Digital Imaging and Remote Sensing Laboratory
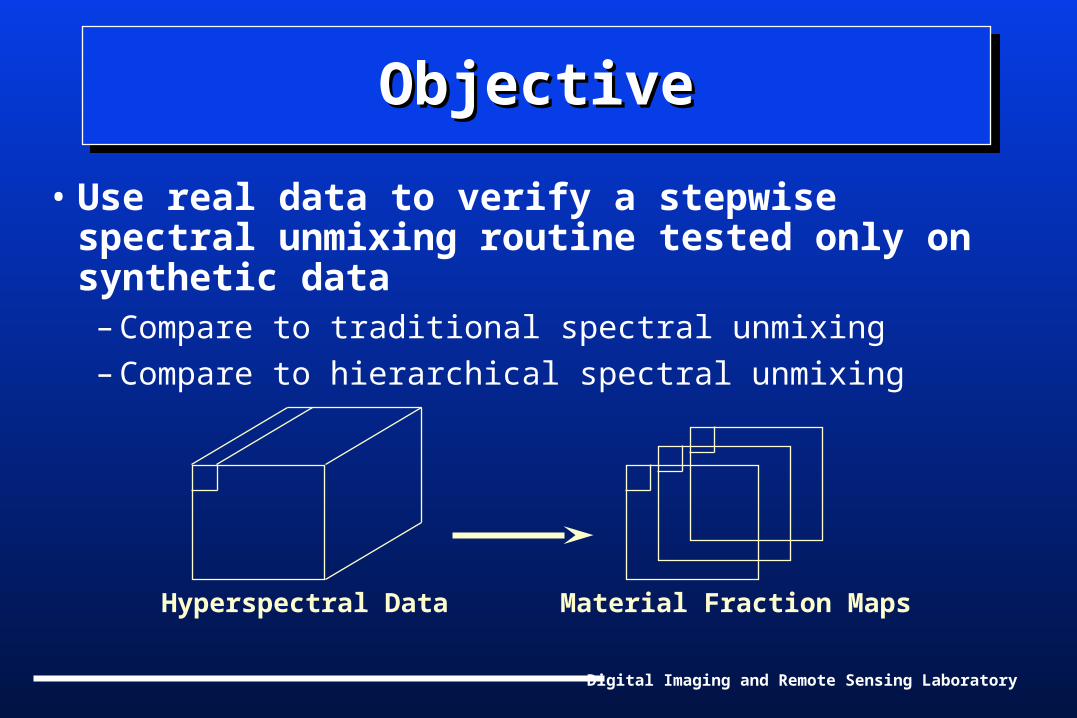
ObjectiveObjectiveObjectiveObjective
• Use real data to verify a stepwise spectral unmixing routine tested only on synthetic data
– Compare to traditional spectral unmixing– Compare to hierarchical spectral unmixing
Hyperspectral Data Material Fraction Maps
Digital Imaging and Remote Sensing Laboratory
OutlineOutlineOutlineOutline
• Objective
• Unmixing Background
• Data and Preparation
• Results
• Conclusions
Digital Imaging and Remote Sensing Laboratory
Operating ScenarioOperating ScenarioOperating ScenarioOperating Scenario
• Remote sensing by airborne or spaceborne imagers
• Finite flux reaching sensor causes spatial-spectral resolution trade-off
• Hyperspectral data has hundreds of bands of spectral information
• Spectrum characterization allows subpixel analysis and material identification
Digital Imaging and Remote Sensing Laboratory
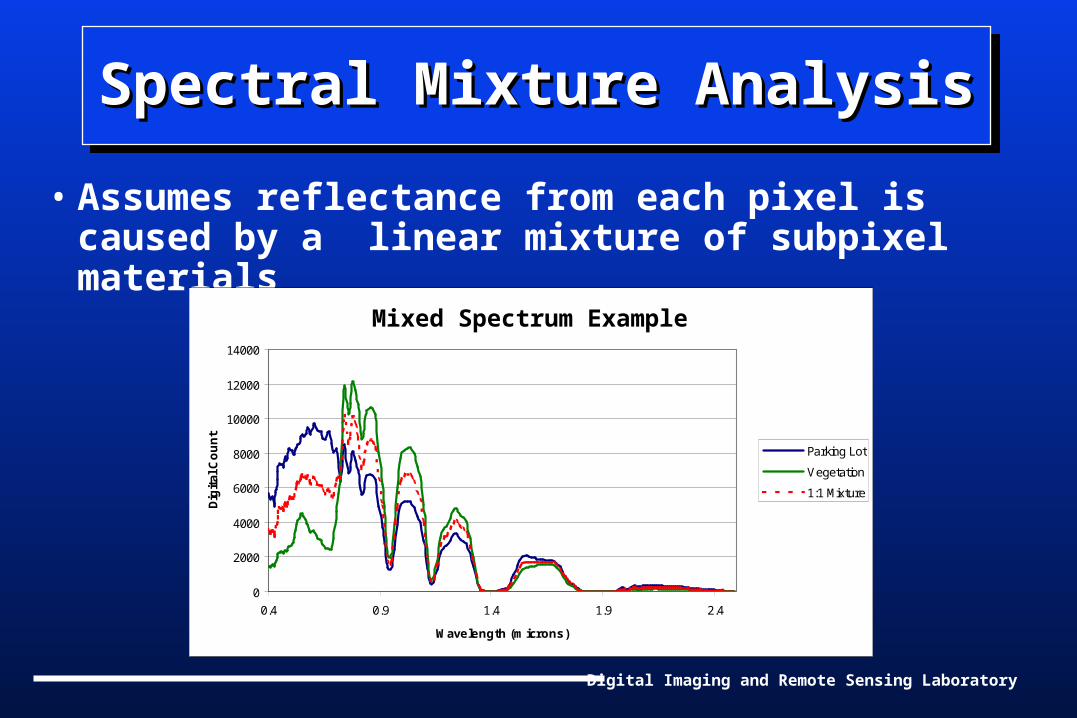
Spectral Mixture AnalysisSpectral Mixture AnalysisSpectral Mixture AnalysisSpectral Mixture Analysis
• Assumes reflectance from each pixel is caused by a linear mixture of subpixel materials
Mixed Spectra Example
0
2000
4000
6000
8000
10000
12000
14000
0.4 0.9 1.4 1.9 2.4
Wavelength (microns)
Dig
ital
Co
un
t
Parking Lot
Vegetation
1:1 Mixture
Mixed Spectrum Example
Digital Imaging and Remote Sensing Laboratory
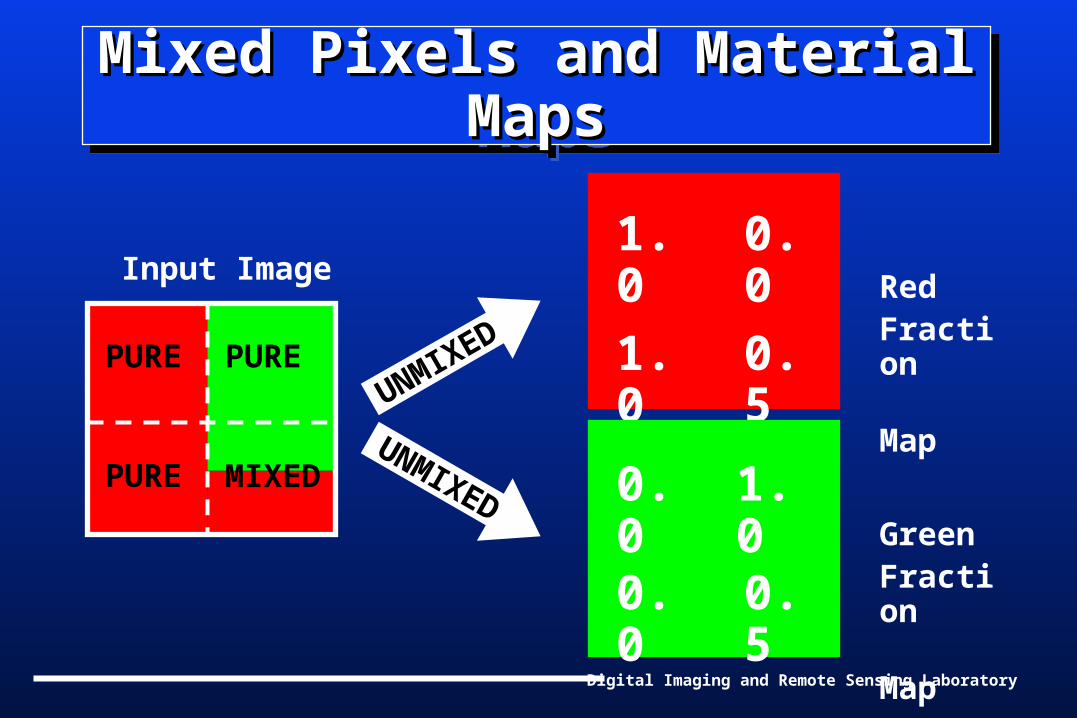
Mixed Pixels and Material MapsMixed Pixels and Material MapsMixed Pixels and Material MapsMixed Pixels and Material Maps
Input Image1.0
1.0
0.0
0.5
1.00.0
0.0 0.5
Red Fraction Map
Green Fraction Map
UNMIXED
UNMIXEDPUREPURE
PURE MIXED
Digital Imaging and Remote Sensing Laboratory
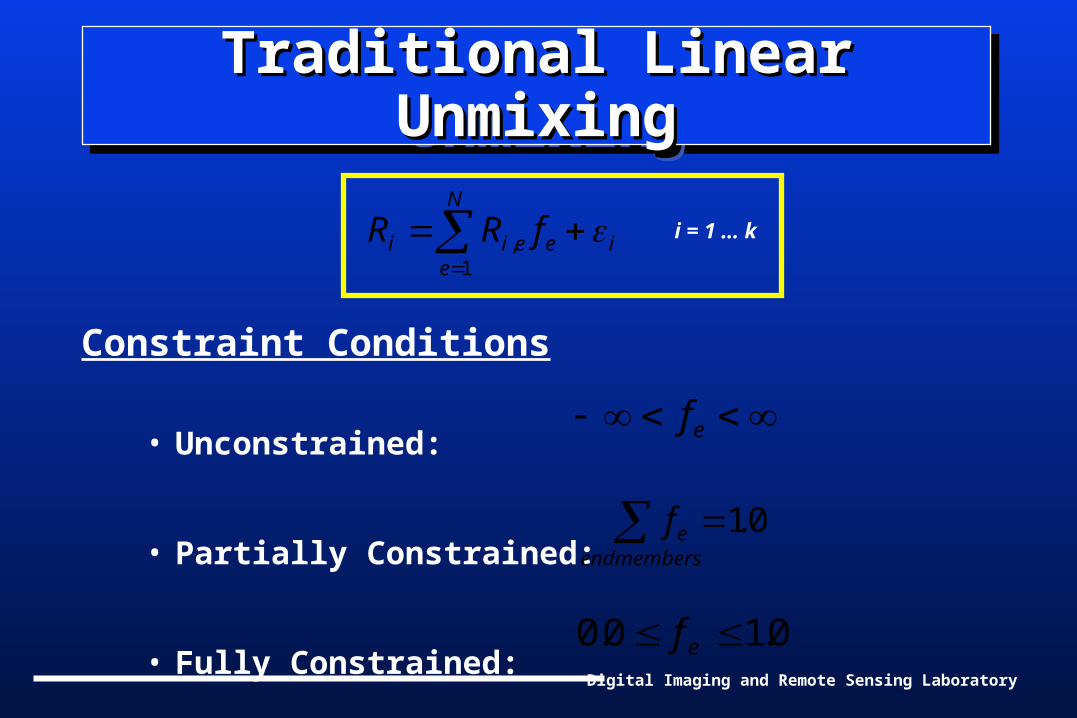
i
N
eeeii fRR
1,
i = 1 … k
Constraint Conditions
• Unconstrained:
• Partially Constrained:
• Fully Constrained:
feendmembers 10.
0 0 10. . f e
ef
Traditional Linear UnmixingTraditional Linear UnmixingTraditional Linear UnmixingTraditional Linear Unmixing
Digital Imaging and Remote Sensing Laboratory
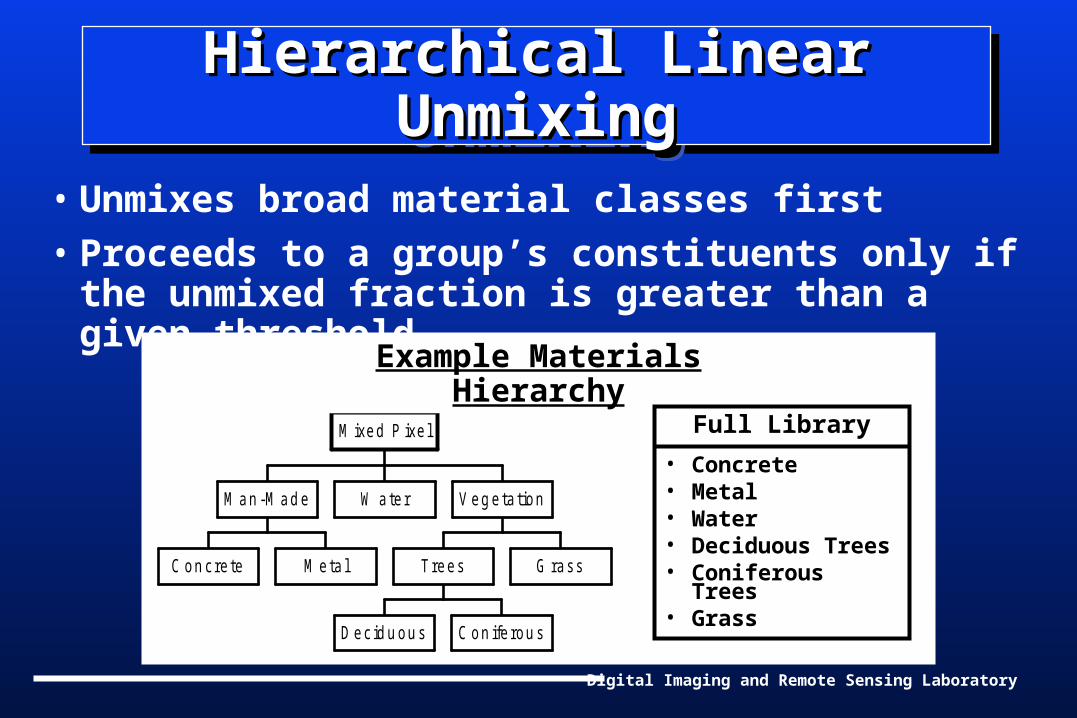
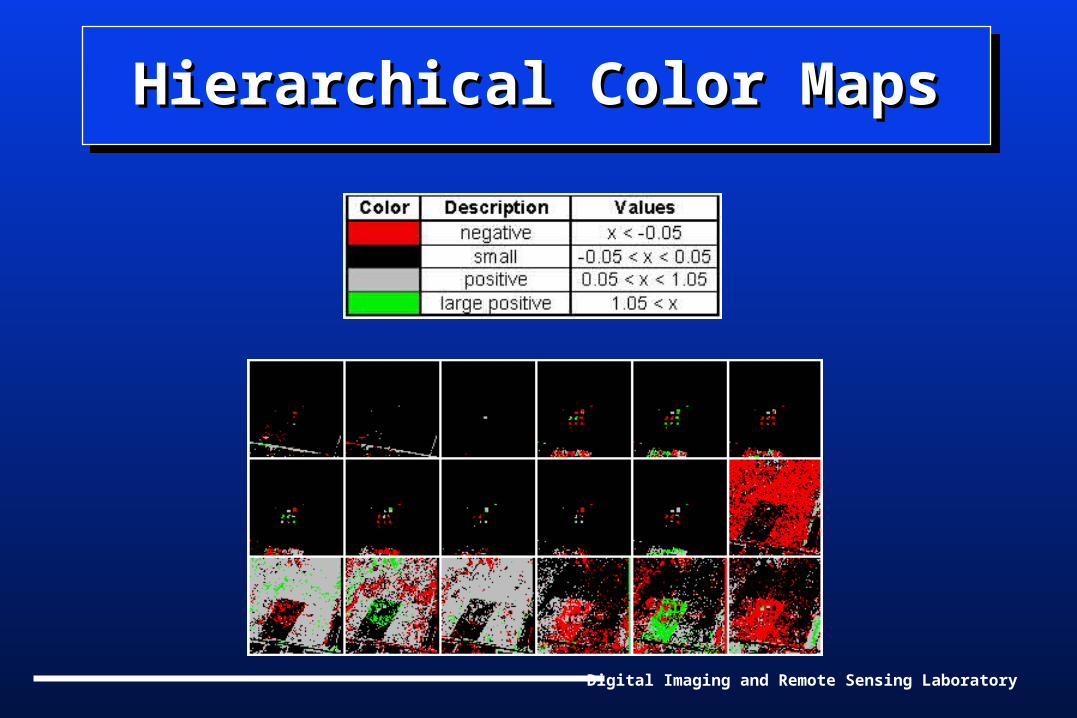
• Unmixes broad material classes first
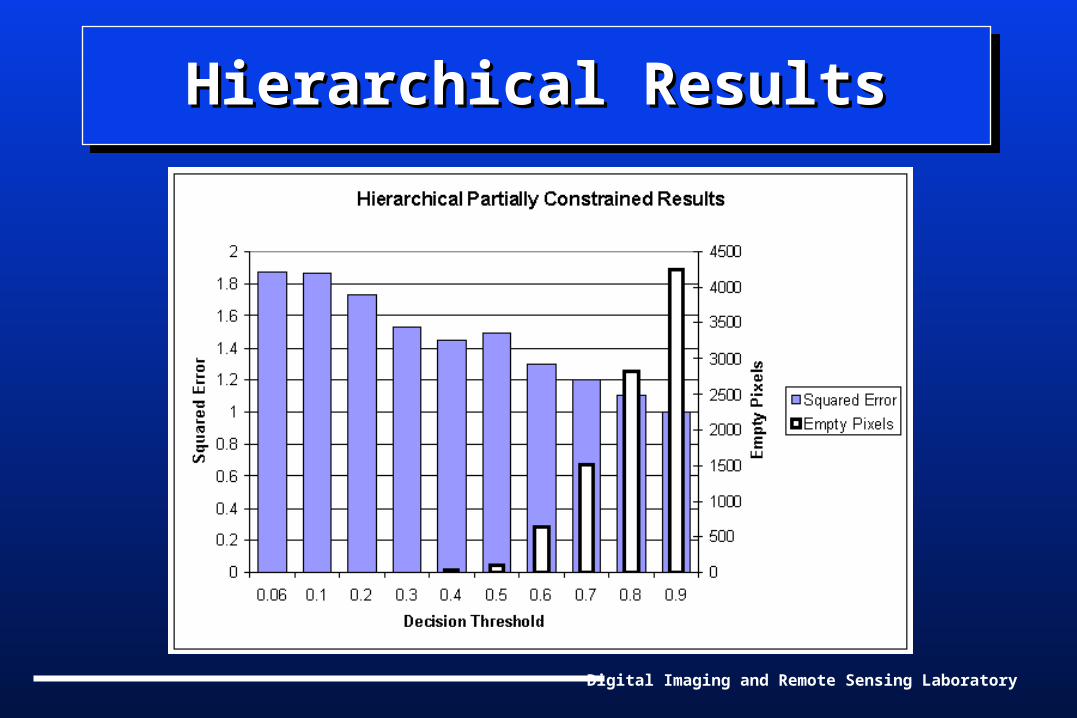
• Proceeds to a group’s constituents only if the unmixed fraction is greater than a given threshold
Hierarchical Linear UnmixingHierarchical Linear UnmixingHierarchical Linear UnmixingHierarchical Linear Unmixing
C on c re te M eta l
M an -M ad e W ater
D ec id u ou s C on ife rou s
Trees G rass
V eg eta tion
M ixed P ixe l
Example Materials Hierarchy
Full Library
• Concrete• Metal• Water• Deciduous Trees• Coniferous Trees• Grass
Digital Imaging and Remote Sensing Laboratory
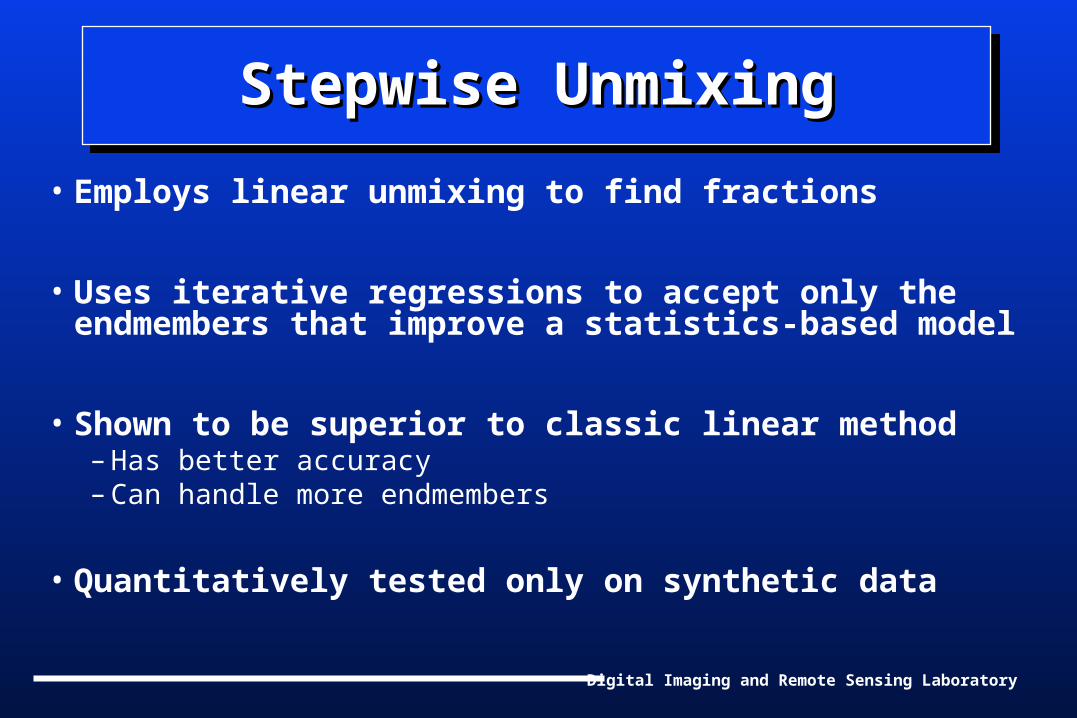
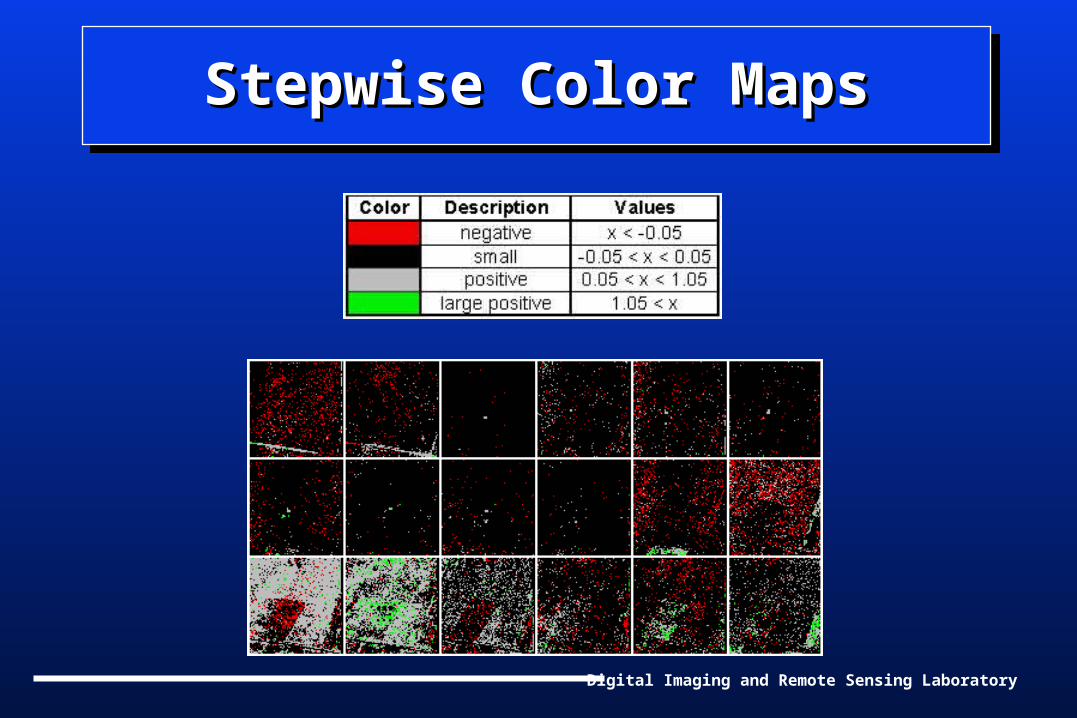
Stepwise UnmixingStepwise UnmixingStepwise UnmixingStepwise Unmixing
• Employs linear unmixing to find fractions
• Uses iterative regressions to accept only the endmembers that improve a statistics-based model
• Shown to be superior to classic linear method – Has better accuracy– Can handle more endmembers
• Quantitatively tested only on synthetic data
Digital Imaging and Remote Sensing Laboratory
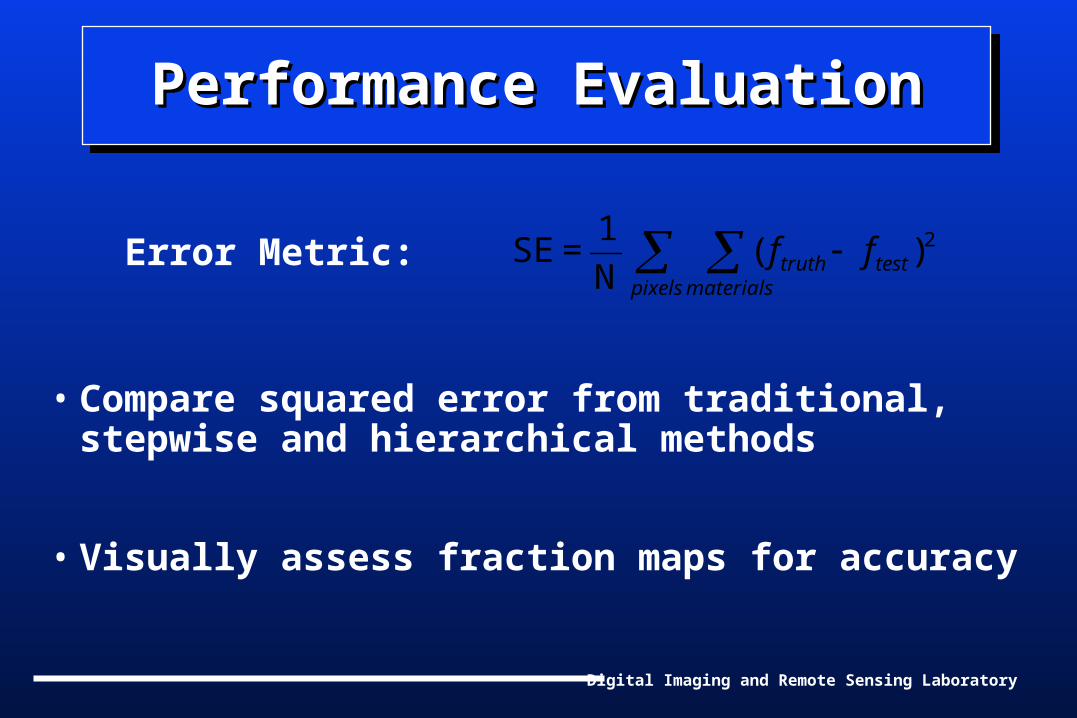
Performance EvaluationPerformance EvaluationPerformance EvaluationPerformance Evaluation
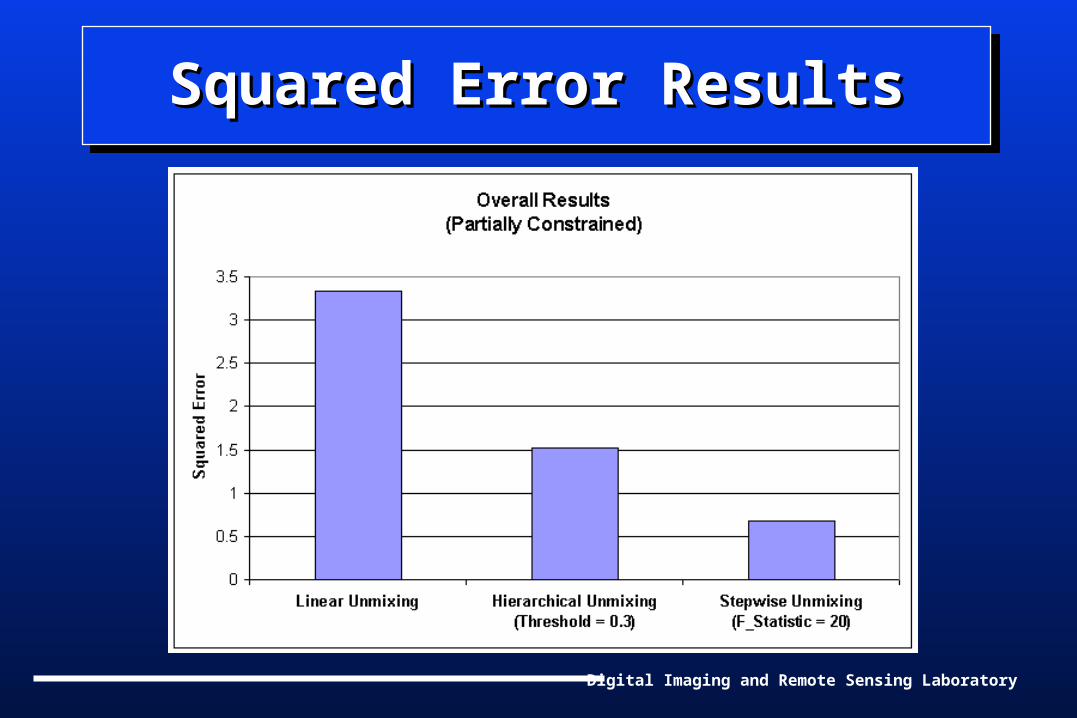
• Compare squared error from traditional, stepwise and hierarchical methods
• Visually assess fraction maps for accuracy
Error Metric: 2)(N
1 = SE test
pixels materialstruth ff
Digital Imaging and Remote Sensing Laboratory
OutlineOutlineOutlineOutline
• Objective
• Unmixing Background
• Data and Preparation
• Results
• Conclusions
Digital Imaging and Remote Sensing Laboratory
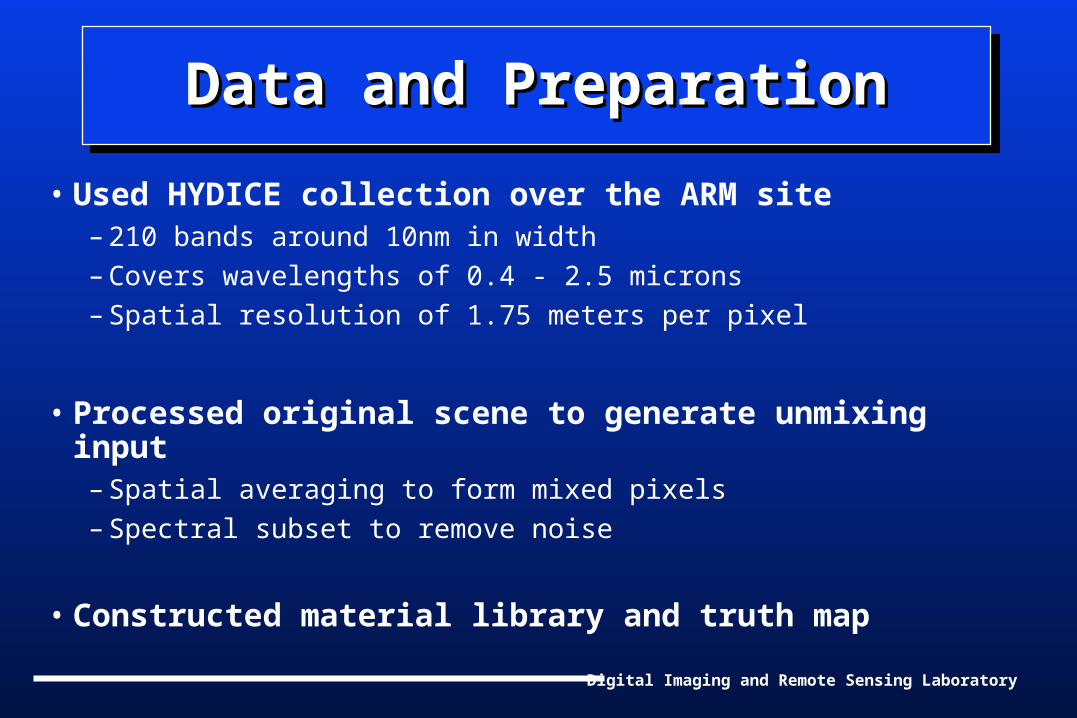
Data and PreparationData and PreparationData and PreparationData and Preparation
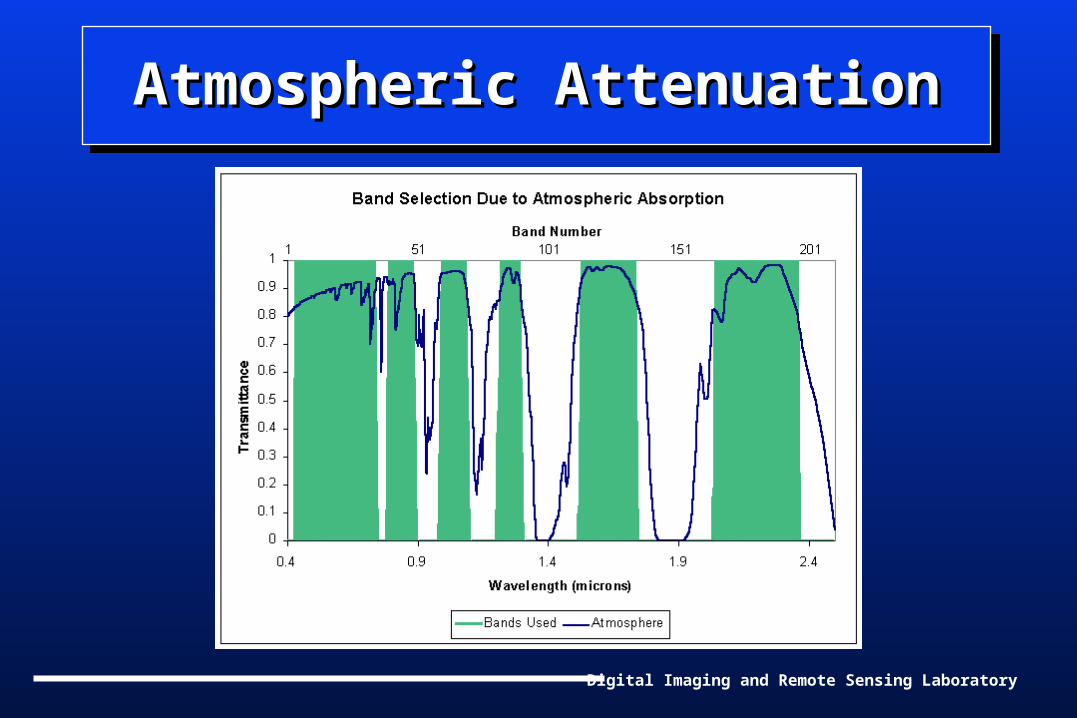
• Used HYDICE collection over the ARM site– 210 bands around 10nm in width– Covers wavelengths of 0.4 - 2.5 microns– Spatial resolution of 1.75 meters per pixel
• Processed original scene to generate unmixing input – Spatial averaging to form mixed pixels– Spectral subset to remove noise
• Constructed material library and truth map
Digital Imaging and Remote Sensing Laboratory
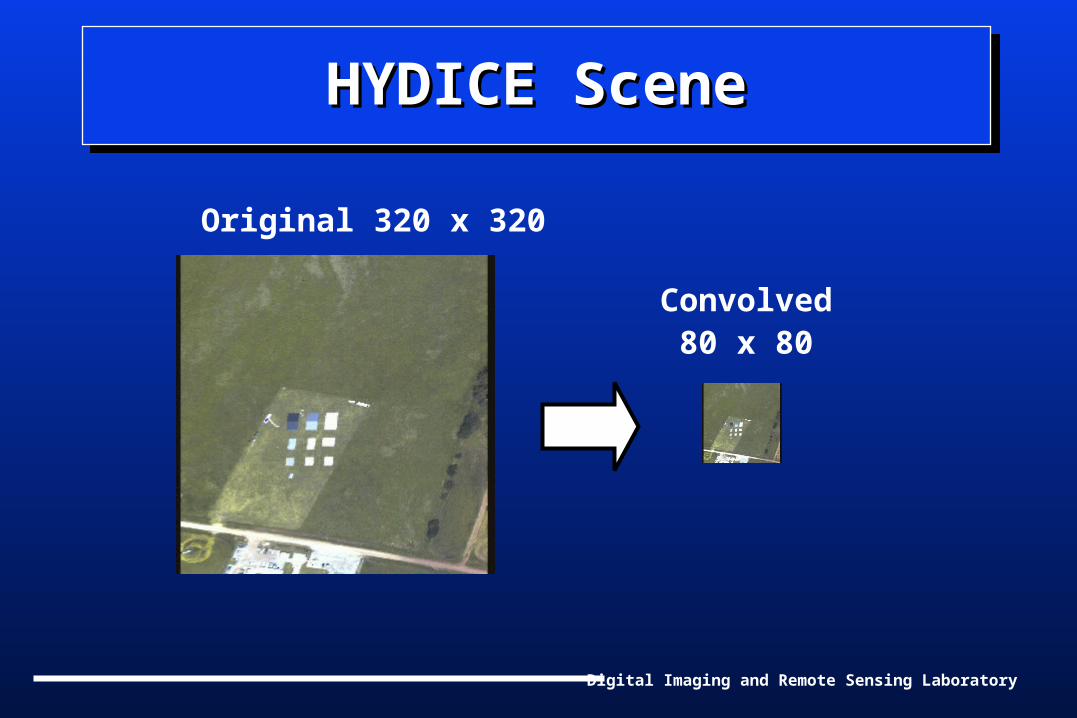
HYDICE SceneHYDICE SceneHYDICE SceneHYDICE Scene
Original 320 x 320
Convolved80 x 80
Digital Imaging and Remote Sensing Laboratory
Atmospheric AttenuationAtmospheric AttenuationAtmospheric AttenuationAtmospheric Attenuation
Digital Imaging and Remote Sensing Laboratory
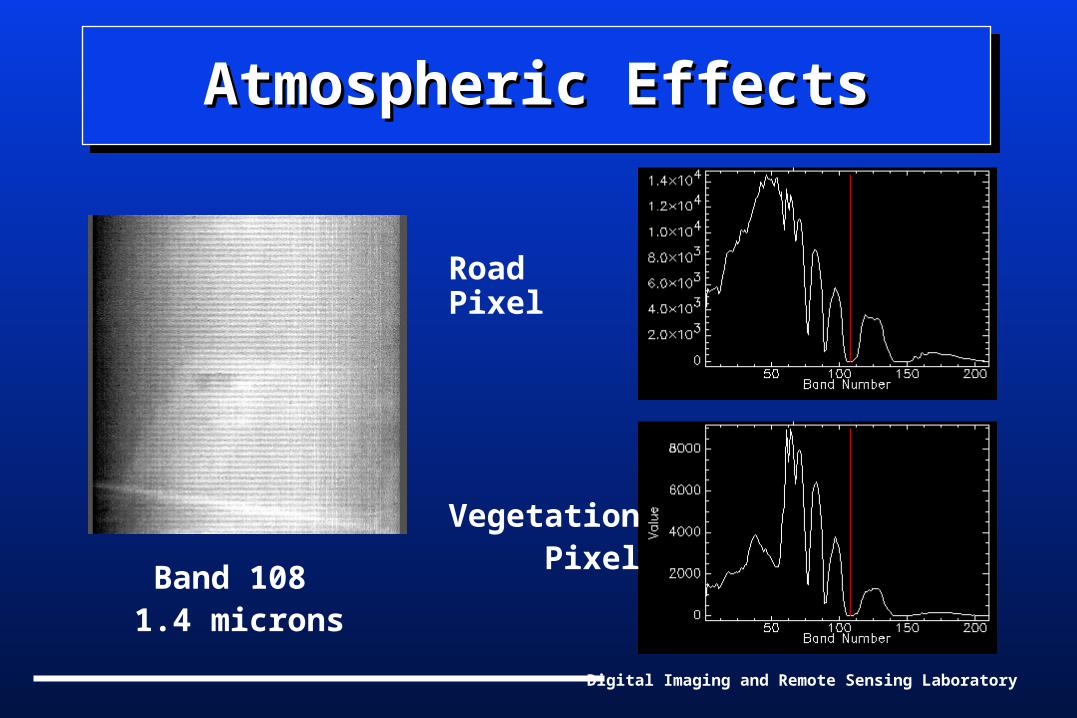
Atmospheric EffectsAtmospheric EffectsAtmospheric EffectsAtmospheric Effects
Band 108 1.4 microns
Road Pixel
Vegetation Pixel
Digital Imaging and Remote Sensing Laboratory
Endmember SelectionEndmember SelectionEndmember SelectionEndmember Selection
• Endmembers are simply material types– Broad classification: road, grass, trees…– Fine classification: dry soil, moist soil...
• Used image-derived endmembers to produce spectral library
– Average reference spectra from “pure” sample pixels– Chose 18 distinct endmembers
Digital Imaging and Remote Sensing Laboratory
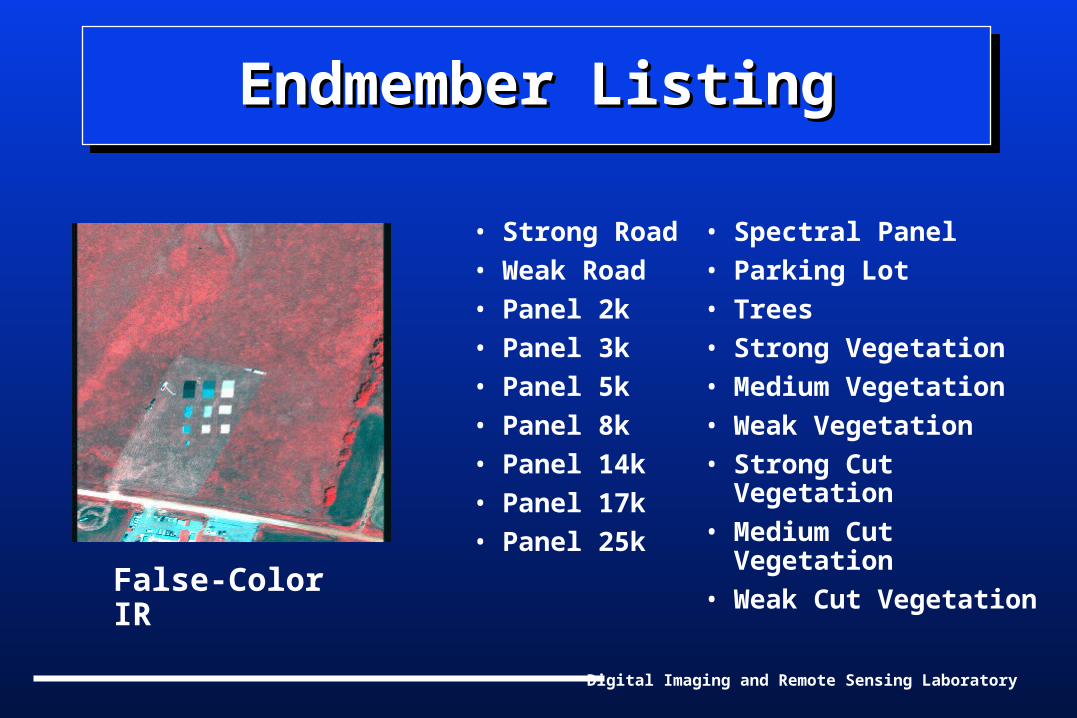
Endmember ListingEndmember ListingEndmember ListingEndmember Listing
• Strong Road
• Weak Road
• Panel 2k
• Panel 3k
• Panel 5k
• Panel 8k
• Panel 14k
• Panel 17k
• Panel 25k
• Spectral Panel
• Parking Lot
• Trees
• Strong Vegetation
• Medium Vegetation
• Weak Vegetation
• Strong Cut Vegetation
• Medium Cut Vegetation
• Weak Cut Vegetation
False-Color IR
Digital Imaging and Remote Sensing Laboratory
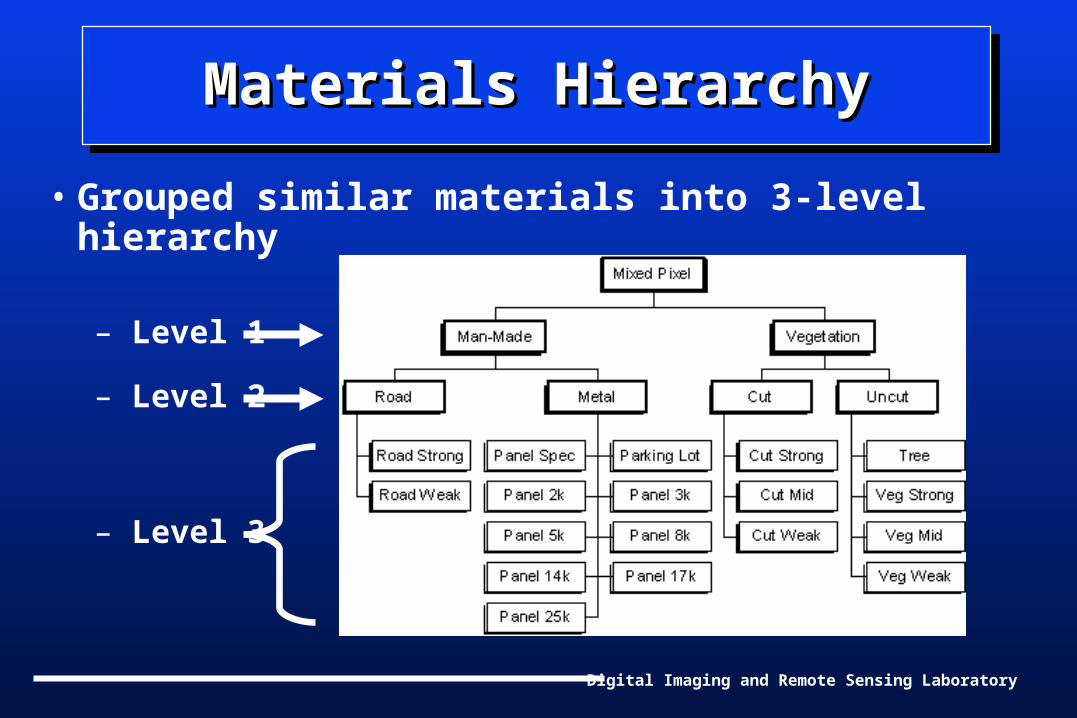
Materials HierarchyMaterials HierarchyMaterials HierarchyMaterials Hierarchy
• Grouped similar materials into 3-level hierarchy
– Level 1
– Level 2
– Level 3
Digital Imaging and Remote Sensing Laboratory
Truth Map CreationTruth Map CreationTruth Map CreationTruth Map Creation
• Realistic classification required automated procedure
• Tested classification routines available in ENVI
• Chose Minimum Distance to the Mean classifier
Digital Imaging and Remote Sensing Laboratory
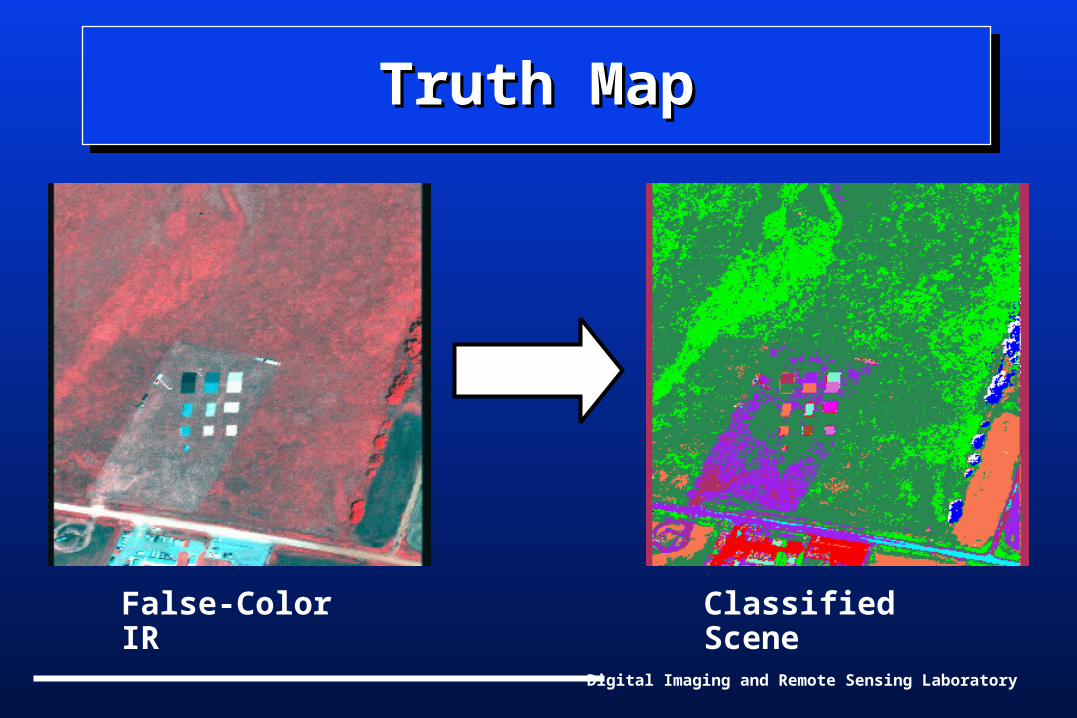
Truth MapTruth MapTruth MapTruth Map
False-Color IR Classified Scene
Digital Imaging and Remote Sensing Laboratory
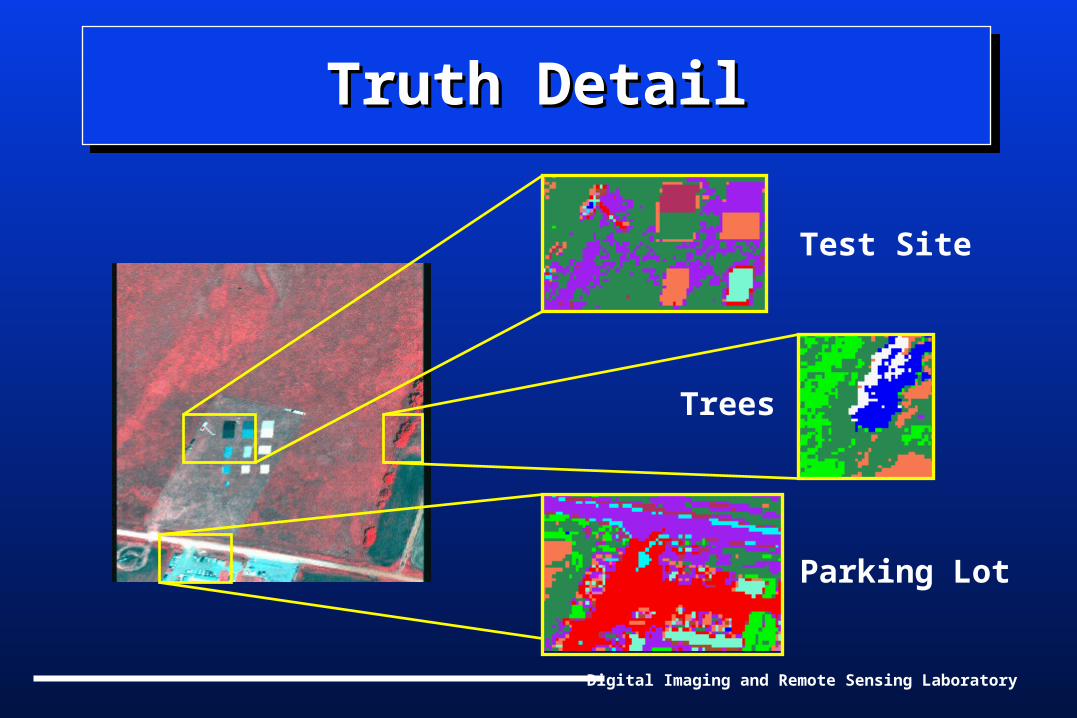
Truth DetailTruth DetailTruth DetailTruth Detail
Test Site
Trees
Parking Lot
Digital Imaging and Remote Sensing Laboratory
Tools for AnalysisTools for AnalysisTools for AnalysisTools for Analysis
• Data processed with ENVI and IDL
• Three unmixing routines written in IDL
• IDL support programs
Digital Imaging and Remote Sensing Laboratory
OutlineOutlineOutlineOutline
• Objective
• Unmixing Background
• Data and Preparation
• Results
• Conclusions
Digital Imaging and Remote Sensing Laboratory
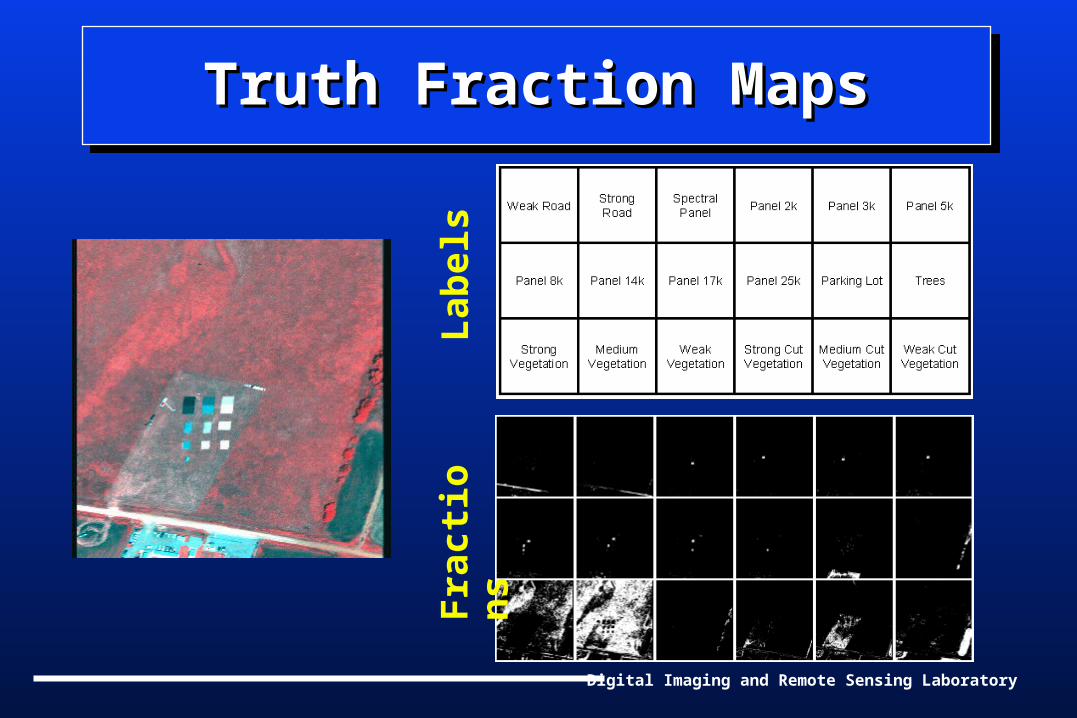
Truth Fraction MapsTruth Fraction MapsTruth Fraction MapsTruth Fraction Maps
Lab
els
Fra
ctio
ns
Digital Imaging and Remote Sensing Laboratory
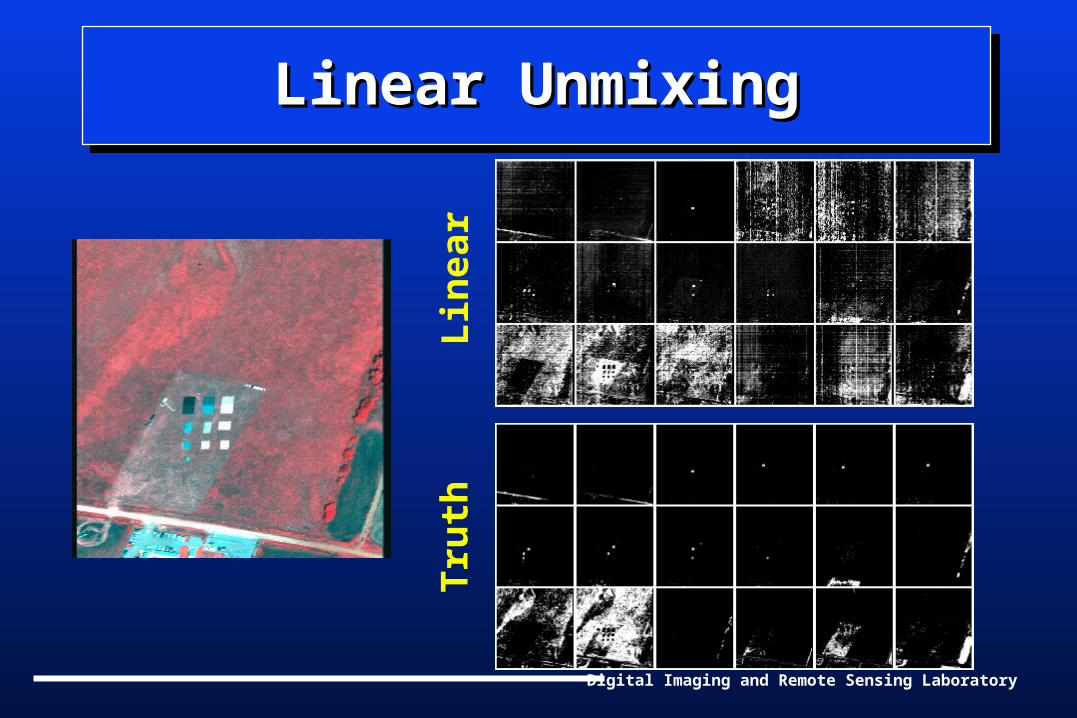
Linear UnmixingLinear UnmixingLinear UnmixingLinear Unmixing
Lin
ear
Tru
th
Digital Imaging and Remote Sensing Laboratory
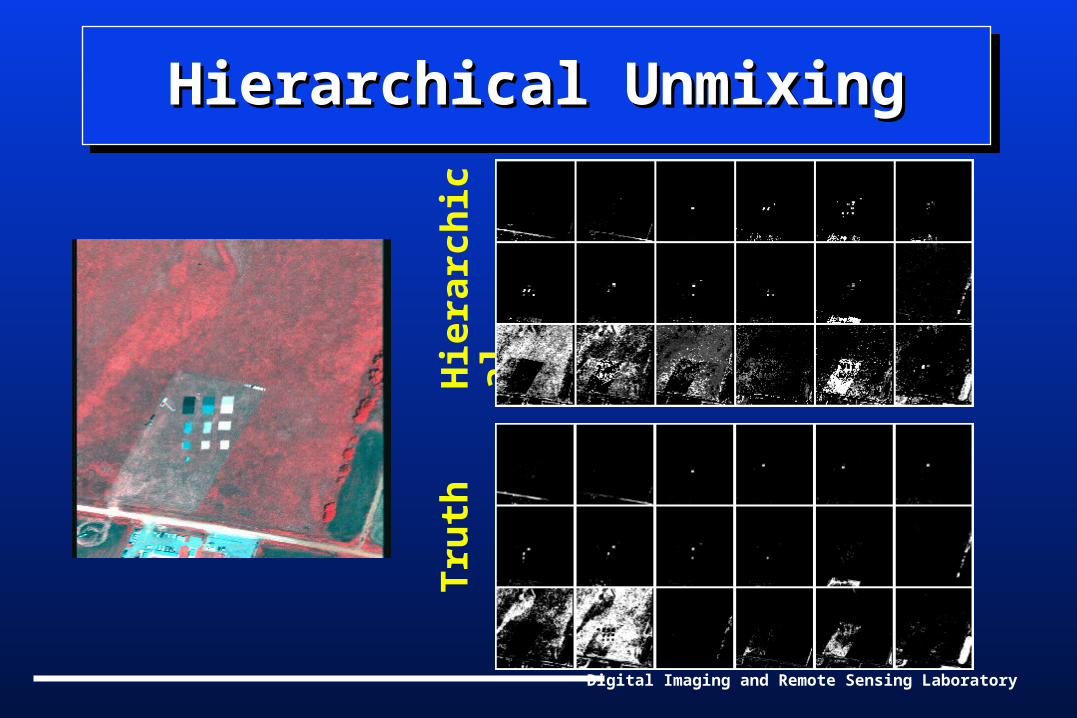
Hierarchical UnmixingHierarchical UnmixingHierarchical UnmixingHierarchical Unmixing
Hie
rarc
hic
alT
ruth
Digital Imaging and Remote Sensing Laboratory
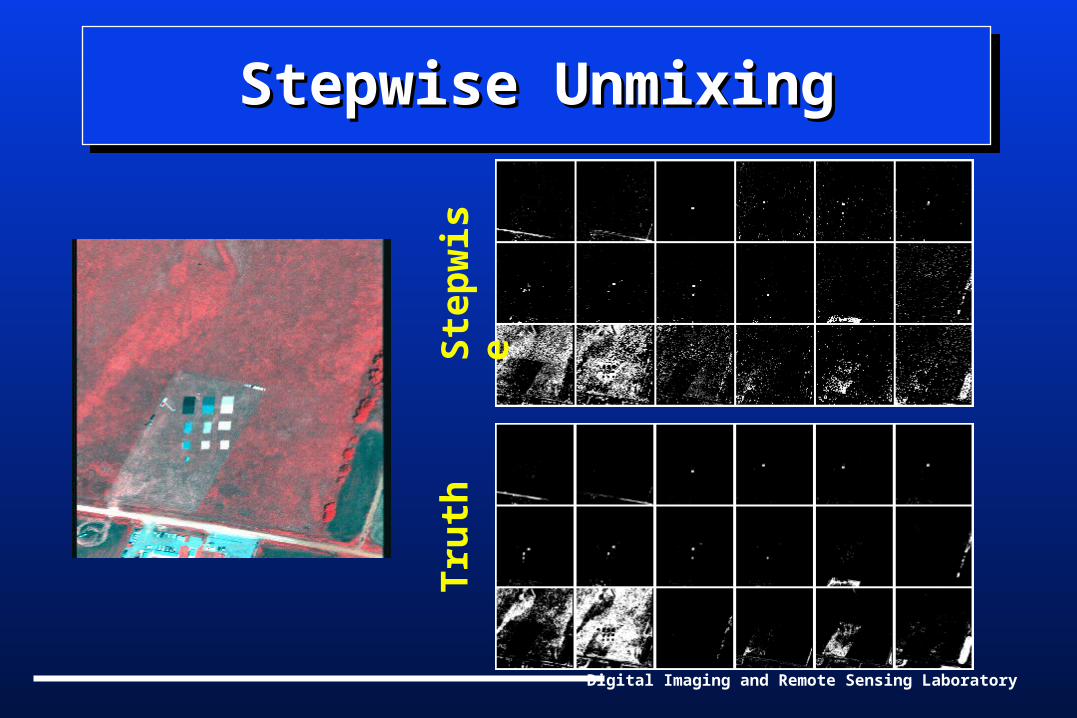
Stepwise UnmixingStepwise UnmixingStepwise UnmixingStepwise Unmixing
Ste
pw
ise
Tru
th
Digital Imaging and Remote Sensing Laboratory
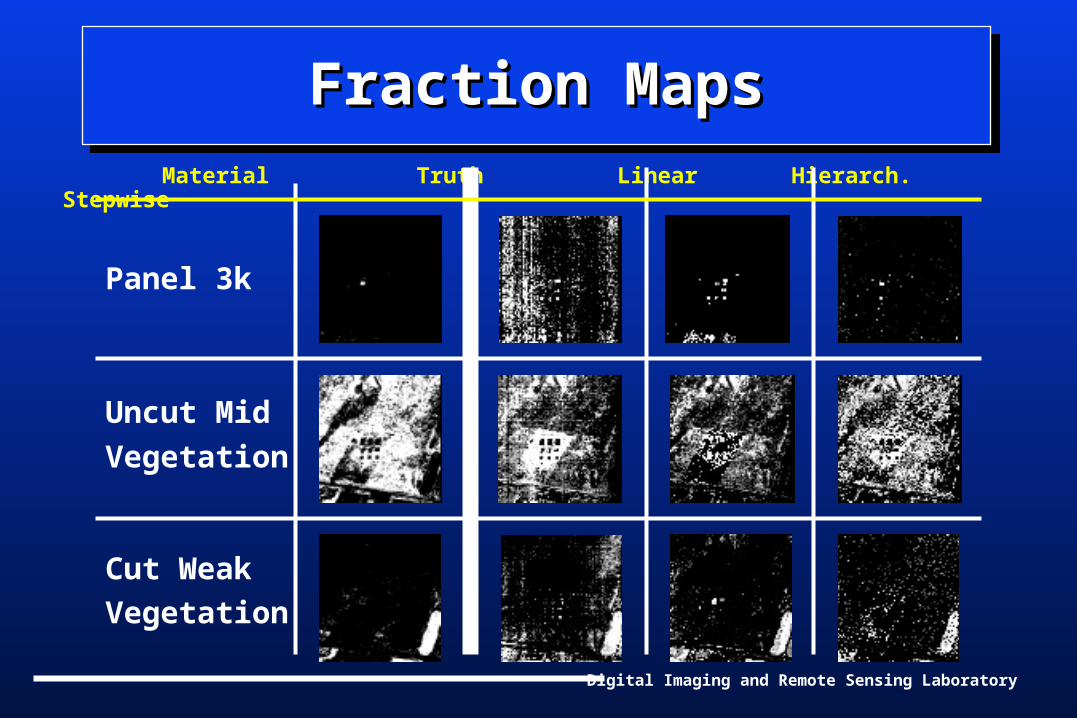
Fraction MapsFraction MapsFraction MapsFraction Maps
Material Truth Linear Hierarch. Stepwise
Panel 3k
Uncut Mid
Vegetation
Cut Weak
Vegetation
Digital Imaging and Remote Sensing Laboratory
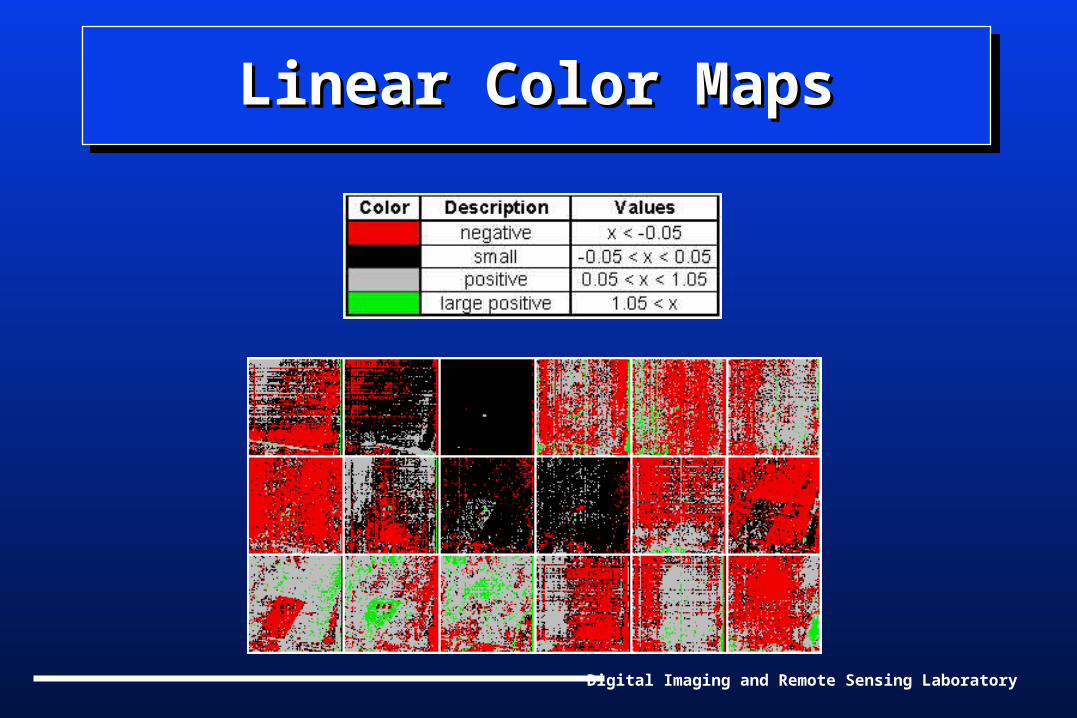
Linear Color MapsLinear Color MapsLinear Color MapsLinear Color Maps
Digital Imaging and Remote Sensing Laboratory
Hierarchical Color MapsHierarchical Color MapsHierarchical Color MapsHierarchical Color Maps
Digital Imaging and Remote Sensing Laboratory
Stepwise Color MapsStepwise Color MapsStepwise Color MapsStepwise Color Maps
Digital Imaging and Remote Sensing Laboratory
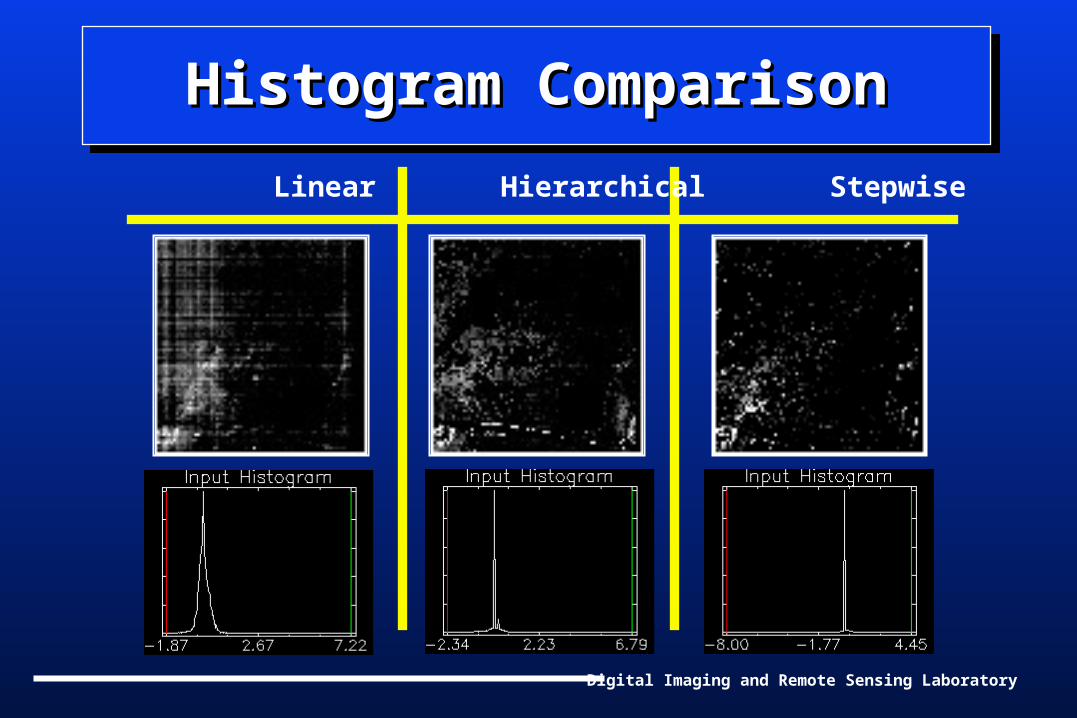
Histogram ComparisonHistogram ComparisonHistogram ComparisonHistogram Comparison
Linear Hierarchical Stepwise
Digital Imaging and Remote Sensing Laboratory
Squared Error ResultsSquared Error ResultsSquared Error ResultsSquared Error Results
Digital Imaging and Remote Sensing Laboratory
Hierarchical ResultsHierarchical ResultsHierarchical ResultsHierarchical Results
Digital Imaging and Remote Sensing Laboratory
OutlineOutlineOutlineOutline
• Objective
• Unmixing Background
• Data and Preparation
• Results
• Conclusions
Digital Imaging and Remote Sensing Laboratory
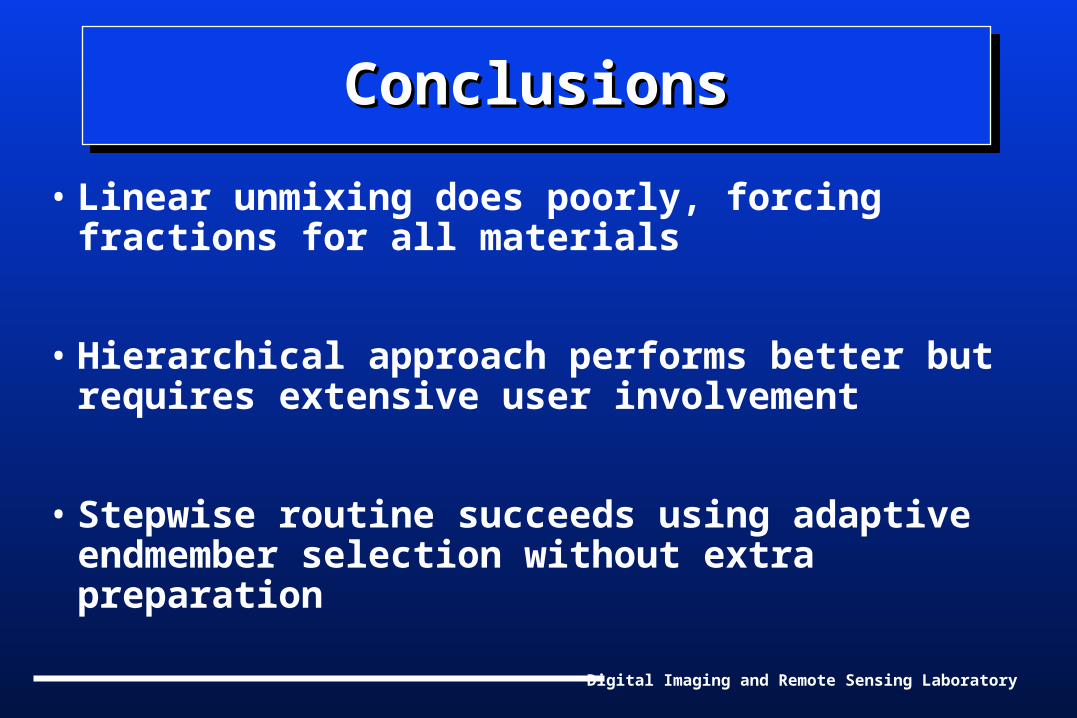
ConclusionsConclusionsConclusionsConclusions
• Linear unmixing does poorly, forcing fractions for all materials
• Hierarchical approach performs better but requires extensive user involvement
• Stepwise routine succeeds using adaptive endmember selection without extra preparation
Digital Imaging and Remote Sensing Laboratory
Special ThanksSpecial ThanksSpecial ThanksSpecial Thanks
Dr. John Schott
Daisei Konno
Lee Sanders
Francois Alain
Digital Imaging and Remote Sensing Laboratory
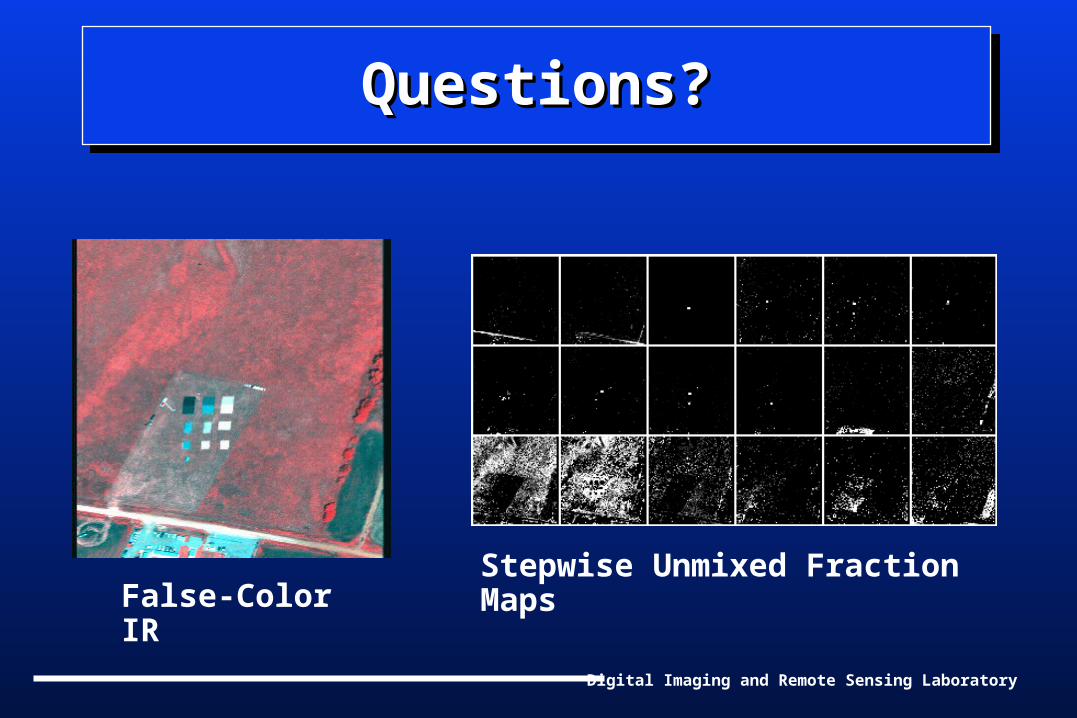
Questions?Questions?Questions?Questions?
False-Color IRStepwise Unmixed Fraction Maps