Embed Size (px)
Citation preview
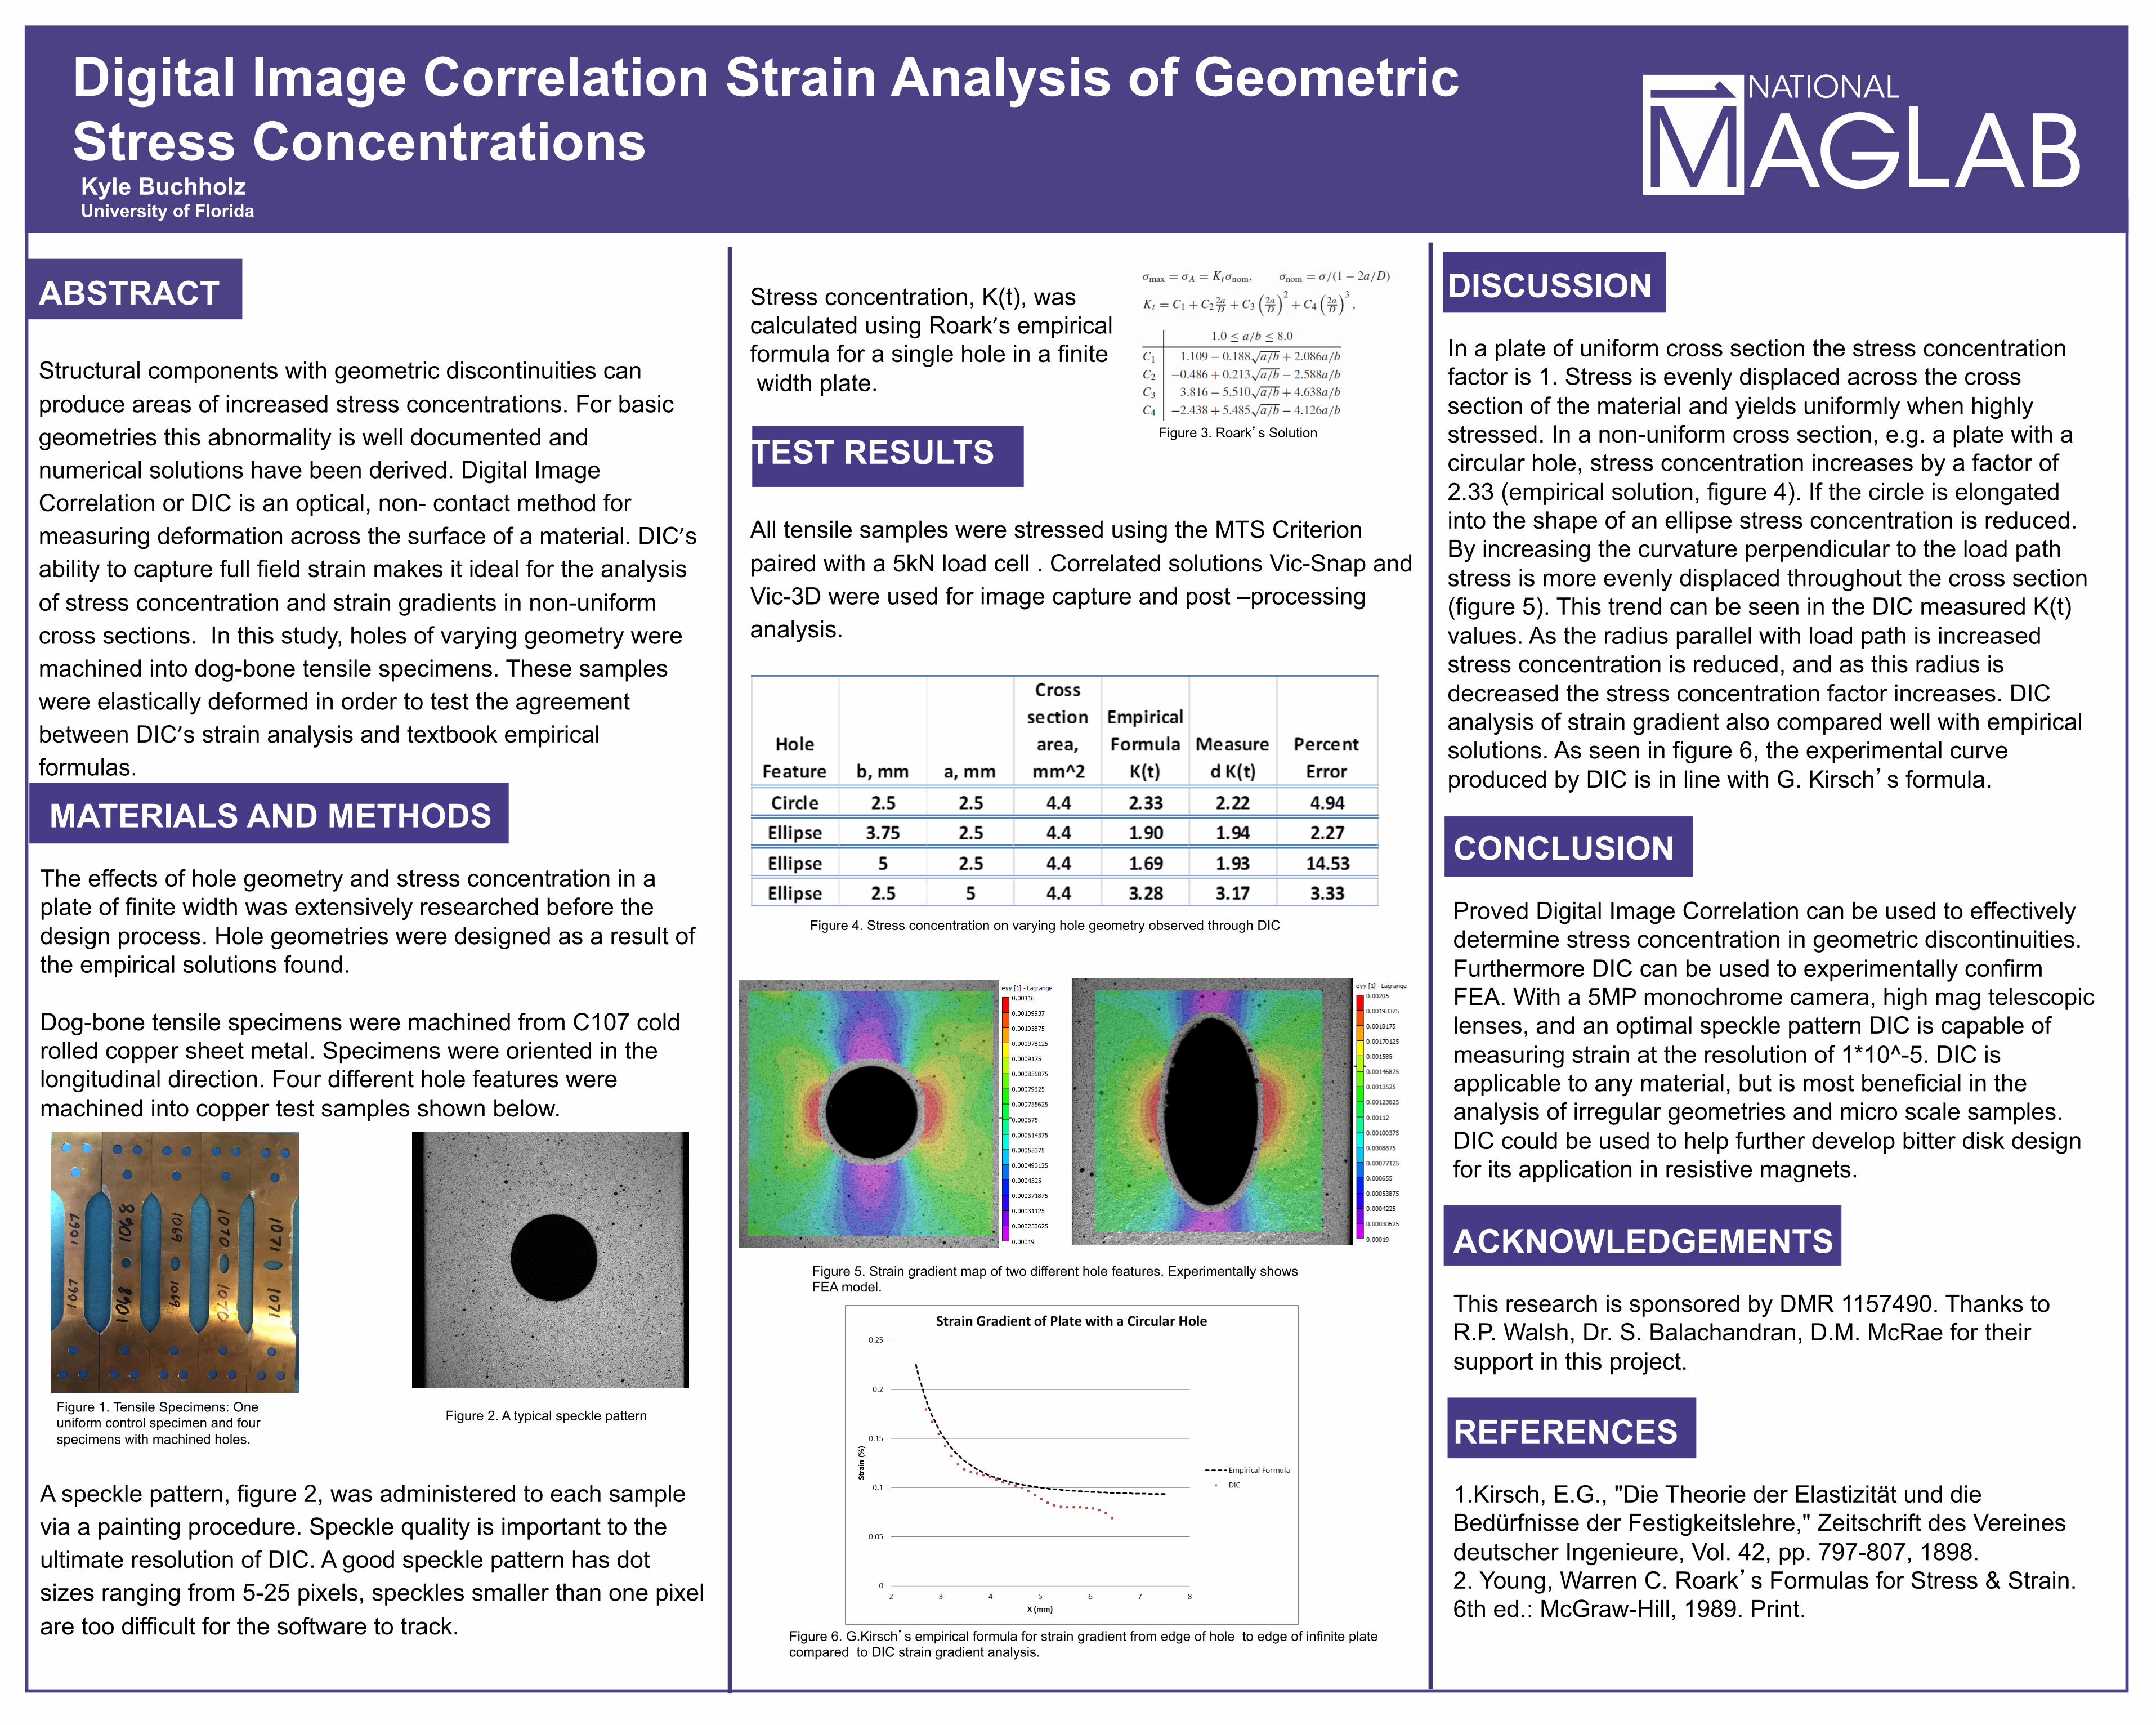
ABSTRACT
Structural components with geometric discontinuities can produce areas of increased stress concentrations. For basic geometries this abnormality is well documented and numerical solutions have been derived. Digital Image Correlation or DIC is an optical, non- contact method for measuring deformation across the surface of a material. DIC’s ability to capture full field strain makes it ideal for the analysis of stress concentration and strain gradients in non-uniform cross sections. In this study, holes of varying geometry were machined into dog-bone tensile specimens. These samples were elastically deformed in order to test the agreement between DIC’s strain analysis and textbook empirical formulas.
Digital Image Correlation Strain Analysis of Geometric Stress Concentrations Kyle Buchholz University of Florida
MATERIALS AND METHODS The effects of hole geometry and stress concentration in a plate of finite width was extensively researched before the design process. Hole geometries were designed as a result of the empirical solutions found. Dog-bone tensile specimens were machined from C107 cold rolled copper sheet metal. Specimens were oriented in the longitudinal direction. Four different hole features were machined into copper test samples shown below.
A speckle pattern, figure 2, was administered to each sample via a painting procedure. Speckle quality is important to the ultimate resolution of DIC. A good speckle pattern has dot sizes ranging from 5-25 pixels, speckles smaller than one pixel are too difficult for the software to track.
TEST RESULTS
All tensile samples were stressed using the MTS Criterion paired with a 5kN load cell . Correlated solutions Vic-Snap and Vic-3D were used for image capture and post –processing analysis.
DISCUSSION In a plate of uniform cross section the stress concentration factor is 1. Stress is evenly displaced across the cross section of the material and yields uniformly when highly stressed. In a non-uniform cross section, e.g. a plate with a circular hole, stress concentration increases by a factor of 2.33 (empirical solution, figure 4). If the circle is elongated into the shape of an ellipse stress concentration is reduced. By increasing the curvature perpendicular to the load path stress is more evenly displaced throughout the cross section (figure 5). This trend can be seen in the DIC measured K(t) values. As the radius parallel with load path is increased stress concentration is reduced, and as this radius is decreased the stress concentration factor increases. DIC analysis of strain gradient also compared well with empirical solutions. As seen in figure 6, the experimental curve produced by DIC is in line with G. Kirsch’s formula. ST CONCLUSION Proved Digital Image Correlation can be used to effectively determine stress concentration in geometric discontinuities. Furthermore DIC can be used to experimentally confirm FEA. With a 5MP monochrome camera, high mag telescopic lenses, and an optimal speckle pattern DIC is capable of measuring strain at the resolution of 1*10^-5. DIC is applicable to any material, but is most beneficial in the analysis of irregular geometries and micro scale samples. DIC could be used to help further develop bitter disk design for its application in resistive magnets.
Stress concentration, K(t), was calculated using Roark’s empirical formula for a single hole in a finite width plate.
Figure 1. Tensile Specimens: One uniform control specimen and four specimens with machined holes.
Figure 3. Roark’s Solution
Figure 4. Stress concentration on varying hole geometry observed through DIC
Figure 5. Strain gradient map of two different hole features. Experimentally shows FEA model.
Figure 6. G.Kirsch’s empirical formula for strain gradient from edge of hole to edge of infinite plate compared to DIC strain gradient analysis.
ACKNOWLEDGEMENTS This research is sponsored by DMR 1157490. Thanks to R.P. Walsh, Dr. S. Balachandran, D.M. McRae for their support in this project.
REFERENCES 1.Kirsch, E.G., "Die Theorie der Elastizität und die Bedürfnisse der Festigkeitslehre," Zeitschrift des Vereines deutscher Ingenieure, Vol. 42, pp. 797-807, 1898. 2. Young, Warren C. Roark’s Formulas for Stress & Strain. 6th ed.: McGraw-Hill, 1989. Print.
Figure 2. A typical speckle pattern