Embed Size (px)
Citation preview

Digital Healthcare
Healthcare Delivery is currently undergoing a global transformation – with
Digital Healthcare Technologies leading the way. Companies such as BT
Health, Blueprint Health, BUPA, Microsoft, Telefonica Digital and Rockhealth -
are all shaping novel and emerging Digital Healthcare Technologies - bringing
new and innovative business propositions to market.

Atlantic Force: Digital Healthcare
Next-Generation Social Enterprise (NGSE) Business Models
– are driving emerging Digital Healthcare service providers.
The Digital Social Enterprise is all about doing things better today
in order to deliver a better tomorrow. Digital Healthcare is driven
by rapid response to changing social conditions so that we can
create and maintain increased stakeholder value - and everyone
share in a brighter future for our stakeholders to enjoy today.….

Atlantic Force: Digital Healthcare Map

Value Pathways in Digital Healthcare
• One of the key obstacles to rolling out the Digital Healthcare Ecosystem is bio-medical
data availability, immediacy and liquidity - the flow of clinical data to every stakeholder -
including patients, clinical practitioners, service providers and fund holders. Many
stakeholders are now using “Big Data” methods to overcome this challenge, as part of
a modern data architecture. This section describes some example Digital Healthcare
use cases, a Digital Healthcare reference architecture and how “Big Data” methods
can resolve the risks, issues and problems caused by poor clinical data latency.
• In January 2013, McKinsey & Company published a report entitled “The ‘Big Data’
Revolution in Healthcare”. The report points out how big data is creating value in five
“new value pathways” allowing data to flow more freely between stakeholders. The
Diagram below is a summary of five of these new value pathway use cases and an
example of how “Big Data” can be used to address each use case. Examples are
taken from the Clinical Informatics Group at UC Irvine Health - many of their use
cases are described in the UCIH case study.
CASE STUDY 1: – Medical Analytics Digital Healthcare Value Pathways

Pathway Benefit “Big Data” Use Case
Patient Health
and Wellbeing
Patients can build stakeholder value
by taking an active role in their own
health, wellbeing and treatment,
including disease prevention.
Predictive Analytics: Heart patients weigh themselves at home
with scales that transmit data wirelessly to their health center.
Algorithms analyze the data and flag patterns that indicate a
high risk of readmission, alerting a physician.
Patient
Monitoring
Patients get the most timely and
appropriate diagnoses, treatment and
clinical intervention available.
Real-time Monitoring: Patient vital statistics are transmitted
from wireless sensors every minute. If vital signs cross certain
risk thresholds, staff can attend to the patient immediately.
Healthcare
Provisioning
Healthcare Provider capabilities
matched to the complexity of the
assignment— for instance, nurses or
physicians’ assistants performing
tasks that do not require a doctor.
Also the specific selection of the
provider with the best outcomes.
Historical EMR Analysis: Big Data reduces the cost to store
data on clinical operations, allowing longer retention of data on
staffing decisions and clinical outcomes. Analysis of this data
allows administrators to promote individuals and practices that
achieve the best results.
Patient Value
Proposition
Ensure cost-effectiveness of care
provision, such as tying Healthcare
Provider reimbursement to patient
outcomes, or eliminating fraud, waste,
or abuse in the system.
Medical Device Management: Biomedical devices stream geo-
location and biomedical sensor data to manage patient clinical
outcomes from medical equipment. The biomedical team know
where all the patients and equipment are, so they don’t waste
time searching for a location. Over time, determine the usage of
different biomedical devices, and use this information to make
rational decisions about when to repair or replace equipment.
Digital
Innovation
The identification of new therapies
and approaches to delivering care,
across all aspects of the system and
improving Medical Analytics engines
themselves.
Collaborative Research : Clinical Researchers attached to
hospitals can access patient data stored in Hadoop Cluster
“Big Data” Stores for discovery, then present the anonymous
sample data to their Internal Review Board for approval, without
ever having seen uniquely identifiable information.
CASE STUDY 1: – Medical Analytics Digital Healthcare Value Pathways


• Changing demographics and regulations are putting tremendous pressure on the
healthcare sector to make significant improvements in care quality, cost control,
clinical management, organizational efficiency and regulatory compliance. To stay
viable, it is paramount to effectively address issues such as missed and mis-
diagnosis, coding error, over / under treatment regimes, unnecessary procedures
and medications, insurance fraud, delayed diagnosis, lack of preventive health
screening and proactive health maintenance. To that end, better collaboration
across and beyond the organization with improved information sharing, and a
holistic approach to capture clinical insights across the organization are critical.
• In an environment prevalent with multiple unstructured data silos and traditional
analytics focused on structured data, healthcare organizations struggle to
harness 90% of their core data - which is mostly medical images, biomedical data
streams and unstructured free text found in clinical notes across multiple
operational domains. Connecting healthcare providers directly with patient data
reduces risk, errors and unnecessary treatments; thus enabling better
understanding of how delivery affects outcomes - and uncovering actionable
clinical insights in order that proactive and preventive measures decrease the
incidence of avoidable diseases.
Digital Healthcare Digital Healthcare

• Digital Healthcare is a cluster of new and emerging applications and technologies
that exploit digital, mobile and cloud platforms for treating and supporting patients.
The term is necessarily general as this novel and exciting Digital Healthcare
innovation approach is being applied to a very wide range of social and health
problems, ranging from monitoring patients in intensive care, general wards, in
convalescence or at home – to helping doctors make better and more accurate
diagnoses, improving drugs prescription and referral decisions for clinical treatment.
• Digital Healthcare has evolved from the need for more proactive and efficient
healthcare delivery, and seeks to offer new types of prevention and care at reduced
cost – using methods that are only possible thanks to sophisticated technology.
• Digital Healthcare Technologies – Bioinformatics and Medical Analytics. Novel
and emerging high-impact Biomedical Health Technologies such as Bioinformatics
and Medical Analytics are transforming the way that Healthcare Service Providers
can deliver Digital Healthcare globally – Digital Health Technology entrepreneurs,
investors and researchers becoming increasingly interested in and attracted to this
important and rapidly growing Life Sciences industry sector. Bioinformatics and
Medical Analytics utilises Big Data / Analytics to provide actionable Clinical insights.
Bioinformatics and Medical Analytics Digital Healthcare Technologies

• Healthcare is undergoing a global transformation – with Digital Healthcare
Technologies leading the way. Companies such as BT Health, Blueprint Health,
BUPA, Cisco, ElationEMR , Huawei, GE Healthcare, Microsoft, Telefonica Digital
and Rockhealth - are all developing novel and emerging Digital Healthcare
technologies - from Mobile Devices and Smart Apps to “Big Data” Analytics -
bringing new and exciting Digital Healthcare business propositions to market.
• Private Equity and Corporate Investment Funds are pouring seed-money and
Capital into Digital Health start-up ventures - in the hope of funding a “quick win”.
Applied Proteomics has just received an investment of $28 million from Genting
Berhad, Domain Associates and Vulcan Capital. The State of Essen in Germany
has recently invested 55m Euros on a SAP HANA Digital Health Proof-of-concept.
• Telefónica Digital is sponsoring research into Smart Wards with St. Thomas's
Hospital in London. At the Institute of Digital Healthcare, part of the Science City
Research Alliance, researchers are not only looking to develop biomedical
technologies, but to base this firmly on a pragmatic understanding of both the
benefits and limitations of integrating biomedical technologies within the existing
range of commercial Digital Healthcare products and services currently on offer.
Digital Healthcare Digital Healthcare Technologies

• Case Study 1 – HP Autonomy Medical Analytics. Changing healthcare service
provisioning, regulation and patient demographics are putting increasing pressure
on the healthcare industry to make significant improvements in care quality, cost
management, organizational efficiency and compliance. Priorities include the need
to address challenging issues such as misdiagnosis, coding error, over / under
treatment, unnecessary procedures and medications, fraud, delayed diagnosis,
lack of preventive screening and proactive health maintenance. Improved
collaboration within the organization with better information sharing, and a holistic
approach to capture and action medical insights across the organization are crucial
to success.
• Case Study 2 – Telefónica Digital was created as a Special Purpose Vehicle to lead
Telefónica’s transformation into an M2M / M2C / C2C Digital Services provider -
cloud computing / digital telecommunications value added network services
(VANS). Telefónica Digital is the vehicle for launch / bringing to market digital
products and services - which will help to improve the lives of customers by
leveraging the power of digital technology. This ranges from developing new
technologies for healthcare providers to communicate with other stakeholders, to
helping Healthcare Providers, Life Sciences businesses and government Health
Departments discover actionable clinical insights, address new opportunities,
improve operations, increase efficiency.
Case Studies Summary – Digital Healthcare Transformation Digital Healthcare Technologies

The Cone™ – Digital Healthcare

The Cone™ – Patient Model
The Cone™ - Patient Model – turning Biomedical Data Streams into Actionable Medical
Insights…
• Acute – (10%) Active Patient Monitoring – Alerts and Alarms • Chronic – (20%) Passive Monitoring – Biomedical Data Streaming • Casuals – (30%) Walk-in – Treat On-demand • Indifferent – (40%) See Annually – Health-check / Review

Electronic Medical Records (EMR)

The Cone™ - Patient Types
Acute - 10%
Chronic- 20%
Casuals - 30%
Indifferent - 40%
The Cone™ Patient
Biomedical Analytics
Actionable Medical Insights
Presentation
Clustering
Biomedical Profile Biomedical Epidemiology – Groups (Streams), Types (Segments)
Hybrid Cone – 3 Dimensions Biomedical Analytics

The Cone™ - Eight Primitives
Primitive Domain Function Product
Who ? People - Patient EMR SalesForce.com
What ? Event Appointment, Walk-in,
Referral, 1st Responders
and Emergency Services
Primary Care, GPs
Healthcare Provider
Hospitals, Clinics
Why ? Motivation Triage - Acute / Chronic Biomedical Analytics
Where ? Places - Location GIS / GPS / Analytics Geospatial Analytics
When ? Time / Date Procedure Biomedical Analytics
How ? Biomedical Data Streaming Medical Data Smart Devices / Apps
Mobile Platforms, IoT
Which ? Clinical Procedure Investigate, Diagnose,
Treatment, Follow-up
Nurse, Consultant
Via ? Referral Channel
Delivery Partner
Healthcare Service
Delivery, Procedure
Healthcare Provider
Hospitals, Clinics

The Cone™ – EIGHT PRIMITIVES
Event
Dimension
Party
Dimension Geographic
Dimension
Motivation
Dimension
Time
Dimension
Data
Dimension
Cone™
MEDIA
FACT
WHO ? WHAT ? WHERE ?
HOW ? WHEN ? WHY ?
• Indifferent
• Casuals
• Chronic
• Acute
• Temperature
• Breathing Rate
• Heart Rate
• Blood Pressure
• Blood Sugar
• Brain Activity
• Consultation
• Clinical Tests
• Diagnosis
• Treatment
• Appointment
• Attendance
• Phone Call
• Letter
• Location
• Attitude
• Movement
• Region / Country
• State / County
• City / Town
• Street / Building
• Postcode
• Person
• Organisation
Procedure
Dimension
WHICH ?
• Procedure
• Prescription
Channel
Dimension
VIA ?
• Channel / Partner
• Hospital / Clinic
Patient Data
Delivery Channel
Environment
Data
Subject
Location
Biomedical Data
Event
• Referral
• Walk-in
Motivation
Patient
Time / Date
Version 3 –
Healthcare

CASE STUDY 1: – HP Autonomy Medical Analytics - actionable insights from clinical data
• HP Healthcare Analytics delivers a robust and integrated set of core and healthcare industry specific capabilities which organises and interprets unstructured data in context - designed to harness this untapped clinical data and unlock actionable medical insights. This helps to improve care quality by connecting healthcare providers directly with their data through self-service analytics; providing intelligence for more accurate diagnoses so reducing errors, risk and unnecessary treatments; enabling better understanding of how delivery affects outcomes and uncovering insights for preventive measures to decrease the rate of avoidable diseases.
• Changing demographics and regulations are putting tremendous pressure on the healthcare industry to make significant improvements in care quality, cost management, organizational efficiency and compliance. To stay viable, it is paramount to effectively address issues such as misdiagnosis, coding error, over/under treatment, unnecessary procedures and medications, fraud, delayed diagnosis, lack of preventive screening and proactive health maintenance. To that end, better collaboration within the organization with improved information sharing, and a holistic approach to capture actionable insights across the organization becomes crucial.
• In an environment prevalent with multiple unstructured data silos and traditional analytics focused on structured data, healthcare organizations struggle to harness 90%* of their core data - which is mostly medical images, biomedical data streams and unstructured free text found in clinical notes across multiple operational domains. This rich and rapidly growing data asset containing significant biomedical intelligence supports actionable Clinical Insights..
CASE STUDY 1: – Medical Analytics Digital Healthcare Technologies
The Biomedical Cone™ Converting Data Streams into Actionable Insights
Salesforce
Anomaly 42
Cone
Unica
End User
BIG DATA
ANALYTICS
BIOMEDICAL DATA
Patient Monitoring
Platform
INTERVENTION
• Treatment
• Smart Apps
The Cone™ Patient
Biomedical Analytics
Actionable Medical Insights
Electronic Medical Records
(EMR)
• Geo-demographics
• Streaming
• Segmentation
• Households
PATIENT RECORDS
• Medical History
• Key Events
Insights
Insights Insights
Anomaly
42 Unica
Biomedical
Data Streaming
People, Places
and Events
Health
Campaigns
• Clinical and Biomedical Data
• Images – X-Ray, CTI, MRI
• Procedures and Interventions
• Prescriptions and Treatment
Social
Media
EXPERIAN
Mosaic

CASE STUDY 2: – Digital Healthcare SMAC – Smart, Mobile, Analytics, Cloud
• Digital Healthcare is a cluster of new and emerging applications and technologies that exploit digital, mobile, analytic and cloud platforms for treating and supporting patients. Digital Healthcare is necessarily generic as this novel and exciting Digital Healthcare innovation approach is being applied to a very wide range of social and health problems, ranging from monitoring patients in intensive care, general wards, in convalescence or at home – to helping doctors make better and more accurate diagnoses, improving drugs prescription and referral decisions for clinical treatment.
• Digital Healthcare has evolved from the need for more proactive and efficient healthcare delivery, and seeks to offer new types of prevention and care at reduced cost – using methods that are only possible thanks to sophisticated technology.
• Telefónica Digital is sponsoring research into Smart Wards with St. Thomas's Hospital in London. At the Institute of Digital Healthcare, part of the Science City Research Alliance, researchers are not only looking to develop new technologies, but to base this firmly on a pragmatic understanding of both the benefits and limitations of integration with commercial Digital Healthcare products which are currently on offer.
CASE STUDY 2: – SMAC Digital Healthcare Digital Healthcare Technologies

CASE STUDY 1: – Medical Analytics Data Science in Digital Healthcare

CASE STUDY 4: – Digital Healthcare in the Cloud
• Digital Healthcare is a cluster of new and emerging applications and technologies that exploit digital, mobile, analytic and cloud platforms for treating and supporting patients. Digital Healthcare is necessarily generic as this novel and exciting Digital Healthcare innovation approach is being applied to a very wide range of social and health problems, ranging from monitoring patients in intensive care, general wards, in convalescence or at home – to helping doctors make better and more accurate diagnoses, improving drugs prescription and referral decisions for clinical treatment.
• Digital Healthcare has evolved from the need for more proactive and efficient healthcare delivery, and seeks to offer new types of prevention and care at reduced cost – using methods that are only possible thanks to sophisticated technology.
• Telefónica Digital is sponsoring research into Smart Wards with St. Thomas's Hospital in London. At the Institute of Digital Healthcare, part of the Science City Research Alliance, researchers are not only looking to develop new technologies, but to base this firmly on a pragmatic understanding of both the benefits and limitations of integration with commercial Digital Healthcare products which are currently on offer.
CASE STUDY 4: – Digital Healthcare Digital Healthcare Technologies

CASE STUDY 5: – HP Autonomy Medical Analytics - actionable insights from clinical data
• HP Healthcare Analytics delivers a robust and integrated set of core and healthcare industry specific capabilities which organises and interprets unstructured data in context - designed to harness this untapped clinical data and unlock actionable medical insights. This helps to improve care quality by connecting healthcare providers directly with their data through self-service analytics; providing intelligence for more accurate diagnoses so reducing errors, risk and unnecessary treatments; enabling better understanding of how delivery affects outcomes and uncovering insights for preventive measures to decrease the rate of avoidable diseases.
• Changing demographics and regulations are putting tremendous pressure on the healthcare industry to make significant improvements in care quality, cost management, organizational efficiency and compliance. To stay viable, it is paramount to effectively address issues such as misdiagnosis, coding error, over/under treatment, unnecessary procedures and medications, fraud, delayed diagnosis, lack of preventive screening and proactive health maintenance. To that end, better collaboration within the organization with improved information sharing, and a holistic approach to capture actionable insights across the organization becomes crucial.
• In an environment prevalent with multiple unstructured data silos and traditional analytics focused on structured data, healthcare organizations struggle to harness 90%* of their core data - which is mostly medical images, biomedical data streams and unstructured free text found in clinical notes across multiple operational domains. This rich and rapidly growing data asset containing significant biomedical intelligence is exploited using HP Medical Analytics,.
CASE STUDY 5: – Medical Analytics Digital Healthcare Technologies
The Cone™ – Actionable Clinical Insights

Digital Healthcare

Digital Healthcare Technologies
These are some of the most important DIGITAL HEALTH CATEGORIES.....
• Digital Imaging – (MRI / CTI / X-Ray / Ultrasound)
• Robotic Surgery – (Microsurgery / Remote Surgery)
• Patient Monitoring – (Clinical Trials / Health / Wellbeing)
• Biomedical Data – (Data Streaming / Biomedical Analytics)
• Emergency Incident Management – (Response Team Alerts)
• Epidemiology – (Disease Transmission / Contact Management)
Here are some of the most important DIGITAL MONITORING SMART APPS.....
• Activity Monitor – (Pedometer / GPS)
• Position Monitor – (Falling / Fainting / Fitting)
• Sleep Monitor – (Light Sleep / Deep Sleep / REM)
• Cardiac Monitor – (Heart Rhythm / Blood Pressure)
• Blood Monitor – (Glucose / Oxygen / Liver Function)
• Breathing Monitor – (Breathing Rate / Blood Oxygen Level)

Digital Healthcare Technologies
These are some of the most influential FUTURE DIGITAL HEALTH leaders: -
– Huawei - John Frieslaar (Digital Futures)
– Cisco - Andrew Green (Digital Healthcare)
– ElationEMR - Kyna Fong (Digital Imaging)
– Microsoft - John Coplin (Digital Healthcare)
– Google - Eze Vidra (Head of Campus at Tech City)
– GE Healthcare - Catherine Yang (Digital Healthcare)
– MIT – Prof Alex “Sandy” Pentland (Digital Epidemiology)
– Telefónica Digital – Mathew Key – CEO (Digital Healthcare)
– Open University – Dr. Blain Price (Digital Patient Monitoring)
– UCLA – Prof. Larry Smarr (FuturePatient – Digital Patient Monitoring)
– Telefónica – Dr. Mike Short CBE (Digital Futures and the Smart Ward)
– Thames Valley Health Innovation and Education Cluster – David Doughty
– Department of Business, Industry & Skills – Richard Foggie, KTN Executive
– Science City Research Alliance – Sarah Knaggs (Strategic Project Manager)

Digital Healthcare – Executive Summary
• Digital Healthcare is a cluster of new and emerging applications and technologies that exploit digital, mobile
and cloud platforms for treating and supporting patients. The term "Digital Healthcare" is necessarily broad
and generic as this novel and exciting Bioinformatics and Medical Analytics innovation driven approach is
applied to a very wide range of social and health problems - from monitoring patients in intensive care,
general wards, in convalescence or at home – to helping general practitioners make better informed and
more accurate diagnoses, improving the effect of prescription and referral decisions for clinical treatment.
• Bioinformatics and Medical Analytics utilises Data Science to provide actionable clinical insights. Digital
Healthcare has evolved from the need for more proactive and efficient healthcare service delivery, and
seeks to offer new and improved types of pro-active and preventive monitoring and medical care at reduced
cost – using methods that are only possible thanks to emerging SMAC Digital Technology.
Digital Healthcare Technologies – Bioinformatics and Medical Analytics: -
Digital Patient Monitoring •
Biomedical Data Streaming •
Biomedical Data Science and Analytics •
Epidemiology, Clinical Trials, Morbidity and Actuarial Outcomes •
• Novel and emerging high-impact Biomedical Health Technologies such as Bioinformatics and Medical
Analytics are transforming the way that Healthcare Service Providers can deliver Digital Healthcare globally
– Digital Health Technology entrepreneurs, investors and researchers becoming increasingly interested in
and attracted to this important and rapidly expanding Life Sciences industry sector.


Digital Healthcare – Executive Summary
• While many industries can benefit from SMAC digital technology – Smart Devices, Mobile Platforms,
Analytics and the Cloud – this is especially the case for Life Sciences, Pharma and Healthcare
industry sectors – resulting in more accurate diagnosis, improved treatment regimes, more reliable
prognosis, better patient monitoring, care and clinical outcomes. Let’s take a look at some of the
Digital Technologies that are bringing significant improvements and benefits to Healthcare
• Today, thanks to the regulatory compliance requirements for HIPAA, HITEC, PCI DSS and ISO
27001, the reluctance to adopt Digital Technology has been overcome, and Digital Healthcare
adoption is gaining increased traction. Many of the security features required for data protection and
patient confidentiality are being addressed by Digital Healthcare service providers, therefore relieving
healthcare delivery organizations from tedious and complex security and data protection frameworks.
Biomedical Data Analytics:
• The exploitation of data by applying analytical methods such as statistics, predictive and quantitative
models to patient segments or groups of the population will provide better insights and achieve better
outcomes. As far back as 2010, there was evidence that: “93 percent of healthcare providers
identified the digital information explosion as the major factor which will drive organizational change
over the next 5 years.”
(Related article: Cloud and healthcare: A revolution is coming)

Digital Healthcare – Executive Summary
Data Security and Privacy:
• Today, thanks to the regulatory compliance requirements for HIPAA, HITEC, PCI DSS and ISO 27001, reluctance to adopt emerging technologies is starting to be addressed and digital technology is beginning to gain traction - bear in mind also that many of the security features required for data security and protection are addressed by the service providers, therefore relieving the healthcare organization from tedious and complex security frameworks.
Mobility: • Mobility Services, where Smart Devices, Smart Apps, Mobile Platforms and Cloud
Infrastructure is providing the backbone for medical personnel to access all sorts of patient information from any place, any where - and from a wide range of mobile devices.
Collaboration with patients: • Mobility means that complete patient records are now available to healthcare professionals
anytime, anywhere – allowing physicians to access historical patient case records , images and clinical data to fine-tune their diagnosis and make informed decisions on treatment – thus reducing diagnosis latency, increasing accuracy and improving patient care and clinical outcomes from initial consultation to specialist referrals. Some scenarios are illustrated in the following: -
• Physician Collaboration Solutions (PCS) • • PCS solutions offers video conferencing to facilitate remote consultations and care
continuity, allowing patients to be viewed remotely. PCS allows physicians to consult with patients and even perform remote robotic surgery. This is dubbed “tele-health solutions.”

Digital Healthcare – Executive Summary
• Electronic Medical Records (EMR) • • Every piece of information pertaining to a specific is recorded and stored. The solution is
designed to capture and provide a patient’s data at any time of the patient’s monitoring cycle, including the complete medical records and history.
• Patient Information Exchange (PIE) • • This allows for the healthcare information to be shared electronically across organizations
within a region, community or hospital system. There are currently several Digital Healthcare cloud service providers addressing this market, taking the role of collecting and distributing medical information from and among multiple organizations.
• The New York Times has published an interesting article illustrating the use of the cloud in healthcare - leveraging big data in the cloud to manage patient relationships and clinical outcomes.
Collaboration among peers: • Technology can provide medical assistance to doctors in the field, b e it in remote areas or
in emergency relief operations through satellite communications. Refer to the Remote Assistance for Medical Teams Deployed Abroad (T4MOD project) which could easily find its place in the Digital Healthcare cloud space.

Digital Futures: - Creating new roles and value chains

Digital Healthcare - Overview
Digital Futures: - Creating new roles and value chains Novel and emerging Biomedical Health Technologies are transforming the way that
Healthcare Providers can deliver Healthcare globally – with Digital Health Technology entrepreneurs and investors becoming increasingly attracted to this
rapidly growing industry sector.
Healthcare Delivery is currently undergoing a global transformation – with Digital Healthcare Technologies leading the way. Companies such as BT Health, Blueprint
Health, BUPA, Microsoft (John Coplin), Telefonica Digital (Dr. Mike Shaw) and Rockhealth - are all shaping novel and emerging Digital Healthcare Technologies -
bringing new and innovative business propositions to market.


Changing the patient experience
• Advances in technology are already changing patient experiences - making
healthcare better, easier, more accurate and more efficient for physicians, patients,
hospital staff and administrators are
• These changes will no doubt affect the role of hospitals and emergency departments.
As continuous monitoring of biometric data becomes the norm, the ER will be used
as a dispatch center, with patients' information reaching the hospital before they do.
This will eliminate wait times and decrease the risk of disease transmission,
especially important when immune-compromised patients face hours in the ER.
• All of these advances translate into one main objective: improving patient outcomes.
With access to more powerful tools that are cheaper, faster and better than their
predecessors, patient outcomes are certain to improve. People will become
increasingly responsible for their own health. This will lead to more effective care, as
people will be able to detect problems much earlier in the process. Patients will no
longer put off appointments for years because personal health will be ever-present.
This will reduce healthcare costs on several levels and change the type of medical
professionals the industry needs most.
Diagnostics @ Point of Care
• Point of Care Diagnostics: Technology promises to put the burden of care and
diagnosis directly in the hands of patients. The Qualcomm Tricorder XPRIZE
Challenge is sponsoring a $10 million race to develop a handheld, non-invasive
electronic device that can diagnose 15 diseases and track 5 vital signs in the
field. Patients would no longer have to go to a doctor's office or hospital.
Instead, a device in their homes would analyze their data, diagnose the problem
and send their information up to the cloud, where a physician could treat them
remotely. Such a device could make healthcare more accessible in rural areas
and developing nations.
• One of the devices up for the challenge is being developed by Scanadu, which
also has an electronic urinanalysis stick, similar to a pregnancy test, which
performs up to 9 different tests and sends the results through the cloud to the
treating physician, eliminating the need for routine lab visits.

Biomedical Robotics
• Robotics: Robotics are quickly advancing medical treatment. Ekso Bionics has
already launched the first version of its exoskeleton, which enables paraplegics to
stand and walk independently. This revolutionary technology allows a person who has
spent 20 years in a wheelchair to stand on her own. This holds huge promise for the
next generation of robotics.
• Robotic home health care workers are on the horizon. Honda’s robot ASIMO is a
humanoid robot with the ability to navigate through crowds and objects using sensor
technology. Fully autonomous, in the future, we’ll see ASIMO and similar robots in the
home to help when you’re sick or elderly – or just need an extra set of hands. The
possibilities for technology and healthcare really are endless. Now, just think of all the
things your own personal Rosie the Robot will do ….
• BCI and BBIs: As brain-computer interfaces become more advanced, healthcare will
incorporate more complex human-computer connections. The uses range from
helping people manage pain to controlling robotic limbs. Harvard University
researchers recently created the first brain-to-brain interface that allowed a human to
control a rat's tail — and another human's movements — with his mind, proving that
controlled robotic limbs have far-reaching possibilities for patients.

Biomedical Robotics
• Artificial intelligence: IBM's Watson Super Computer is just the first step toward
using artificial intelligence in medicine. The supercomputer, which defeated two
human champions on "Jeopardy!" two years ago, has gone to medical school.
Watson not only gives the top 3 probabilities for a diagnosis, but what physicians
most appreciate is Watson gives the evidence behind these probabilities.
• IBM opened up their API for anyone to use – whether you are 2 kids in a garage or a
Fortune 500 company. Why would they give their technology to their competitors?
Easy. Because Watson improves with use. So the more people and organizations use
Watson, the faster it learns, the better it becomes.
• Biomedical 3D printing: California-based research company Organovo has printed
human liver tissue to test drug toxicity on specific sections of the liver. Although
printing organs for transplants may still be far off, this technology could be used in the
near future with individual patients to test their toxicity reactions to specific drugs.
• Recently researchers have printed out exact replicas of kidneys with tumors for
simulated surgery before going into a patient. These 3D printed kidneys are
transparent so the surgeons can discern where the blood vessels are located. In one
case, this reduced the amount of time a patient’s blood flow to the organ was
interrupted from 22 minutes to 8 minutes during surgery.

The Bacteriophage Revolution
• The emergence of pathogenic bacteria resistant to many, if not most, currently
available anti-microbial agents has become a critical clinical problem in modern
medicine - particularly in the concomitant increase in immuno-suppressed patients.
The concern that the treatment of disease is re-entering the “pre-antibiotics” era
has become real, and the development of alternative anti-infection modalities is
now one of the highest priorities of modern medicine and biomedical technology.
• Prior to the discovery and widespread use of antibiotics, it was suggested that
bacterial infections could be prevented and/or treated by the administration of
viruses which attacked bacteria - bacteriophages. Although the early clinical
studies with bacteriophages were not vigorously pursed in the United States and
Western Europe, phages continued to be utilized in the former Soviet Union and
Eastern Europe. The results of these studies were extensively published in non-
English (primarily Russian, Georgian, and Polish) journals and, therefore, were not
readily available to the western scientific community. In this review, we briefly
describe the history of bacteriophage anti-microbial research in the former Soviet
Union and the reasons that the clinical use of bacteriophages failed to take root in
the West. Further, we share our thoughts about future prospects for phage therapy
in biomedical research – the Bacteriophage Revolution.
• .

Digital Healthcare – Technical Appendices

HP – Outlook for 2015 Biomedical Analytics
HP Autonomy Medical Analytics - actionable insights from clinical data
• HP Healthcare Analytics delivers a robust and integrated set of core and healthcare industry
specific capabilities which organises and interprets unstructured data in context - designed to
harness this untapped clinical data and unlock actionable medical insights. This helps to improve
care quality by connecting healthcare providers directly with their data through self-service
analytics; providing intelligence for more accurate diagnoses so reducing errors, risk and
unnecessary treatments; enabling better understanding of how delivery affects outcomes and
uncovering insights for preventive measures to decrease the rate of avoidable diseases.
• Changing demographics and regulations are putting tremendous pressure on the healthcare
industry to make significant improvements in care quality, cost management, organizational
efficiency and compliance. To stay viable, it is paramount to effectively address issues such as
misdiagnosis, coding error, over/under treatment, unnecessary procedures and medications,
fraud, delayed diagnosis, lack of preventive screening and proactive health maintenance. To that
end, better collaboration within the organization with improved information sharing, and a holistic
approach to capture actionable insights across the organization becomes crucial.
• In an environment prevalent with multiple unstructured data silos and traditional analytics focused
on structured data, healthcare organizations struggle to harness 90%* of their core data - which is
mostly medical images, biomedical data streams and unstructured free text found in clinical notes
across multiple operational domains. This rich and rapidly growing data asset containing
significant biomedical intelligence supports actionable Clinical Insights..

IBM – Outlook for 2015 Wave-form Analytics
IBM Infosphere - Excel Medical Streaming Analytics Platform
• Excel Medical Electronics’ BedMasterEx software is the industry leader in acquisition and storage of complex physiological data (waveforms, vital signs, and clinical alarms) acquired from hospital patient monitoring networks and medical devices.
• Excel Medical Electronics has tightly integrated their BedMasterEx solution with IBM’s InfoSphere Streams to create a groundbreaking new platform to analyze volumes of unstructured clinical data in real time with the goal of creating predictive medical algorithms. In conjunction with IBM Watson Research Center, IBM and Excel Medical Engineers developed adapters to the BedMasterEx system.
• These adapters feed data for both real time analytics and retrospective research databases. The Excel Medical Streaming Analytics Platform provides a common development channel among academic researchers to collaborate and speed up validation of algorithms.

IBM – Outlook for 2015 Mobile Access Platforms
IBM and the Boston Children Hospital • This is exemplified by the recent announcement from IBM and the Boston Children
Hospital, creating “the world’s first cloud-based global education technology platform to transform how paediatric medicine is taught and practiced around the world. The initiative aims to improve the exchange of medical knowledge on the care of critically ill children, no matter where they live.”
• As with everything, you have to be aware of a few shortcomings, the most significant of all being data security and breach of confidentiality. This recurrent theme acted as an inhibitor to healthcare embracing cloud technology. While many cloud providers are now claiming to be able to ensure compliance with HIPAA, the healthcare organizations do still have to figure out how exactly to address these requirements in a cloud environment.
• The organizations now entrusting their cloud providers to host sensitive data and infrastructure do need to understand that they are actually handing over sensitive data to the cloud provider. This in turn will imply the need to explore how the cloud provider will indeed provide the level of security, the quality of service and the availability of the stored information.
• While the healthcare industry is starting to embrace cloud computing, we can already foresee the tremendous potential of this technology leveraging on big data and analytics and all the applications that may come from its many uses. While there might be shortcomings, these are far outweighed by the benefits for both the industry and the patients. What do you think?

Microsoft – Outlook for 2015
• Big Data in Digital Healthcare offers a path towards clinical insight and medical
advances through a culture-challenging information strategy and effective data
management. The global amount of data and internet content is expected to reach
a staggering 5,247 gigabytes per person by 2020. Translated into physical terms,
there are twice as many bytes of data in the world than there are litres of water in
our oceans – that’s a lot of data out there to manage. Further fuelling the rapid
increase in data abundance are falling hardware costs coupled with the
proliferation of vast amounts of machine-generated data in the Cloud from fixed
and mobile appliances, devices and sensors.
• At Microsoft, our goal is to bring Data Science, its applications, information and
Biomedical Data insights to one billion people through secure, scalable and easy-
to-use enterprise-class tools. Data Science and Big Data are driving clinical insight
and medical advances, are fast becoming the major factor for competitive
advantage and business growth. Big Data is just one of several important
trends because through the strategic use of information, businesses can innovate
more quickly, lower operational costs, improve clinical outcomes and drive up
patient health and wellbeing.

Oracle – Outlook for 2015
• The number of new and emerging technologies that employ ubiquitous appliances, monitors,
sensors and devices in order to generate, transmit. store and analyse vast amounts of automatic
machine-generated data will continue to grow as consumers embrace their new digital lifestyles. For
one example, wearable digital technology will start to enter the mainstream market and begin
generating vast amounts of new consumer data from which companies will be able to draw new
meaningful insights. In 2015 we expect big data to finally go mainstream and emerge at a scale
much more significant than just a simple tool for capturing and analysing digital consumer insights.
Scientific Research • Advanced scientific research is a game played in the minutiae of life, in the place where discoveries
made on the tiniest scale can have enormous implications for the entire human population. Projects
are often long and labour-intensive, as researchers conduct a seemingly endless number of iterative
analyses on these microscopic events as they look for trends that point to new discoveries.
Health and Life Sciences • Data Science and Big Data have the potential to drive meaningful progress in the biomedical field,
particularly as health experts seek cures for life-threatening illnesses that affect more and more
people each year. In the medical research arena, for example, the ability to consolidate health data
from patients in hospitals all over the world and trend it in real-time against demographic and
geographic epidemiology, treatment and prescriptive factors - weather, local social customs and
family history becomes very powerful. Armed with the new insights that big data analyses will give
them, medical professionals can focus their efforts and accelerate the race to cure terminal disease.

SAP – Outlook for 2015
• SAP is a Growth Company. SAP wishes to elevate itself to become a trusted innovator for all
of their customers – whether it’s achieving business outcomes, simplifying everything through
the cloud or driving business efficiency and growth using Mobile and In-memory Computing.
• Industry Focused. In 2013 SAP was global the market leader for supplying ERP application
software across 25 different Industry Sectors – and will continue to increase its Industry Sector
focus to make SAP HANA the standard business platform for world-class Industry Sector
applications and process execution.
• The Digital Enterprise. SAP grew its mobile, cloud and in-memory computing businesses
heavily in 2013 and will continue to strengthen its transition into products supporting the Digital
Enterprise area even more so in 2015. BIW (Business Information Warehouse) and ECC6 (ERP
Central Components version 6) Business Suite – will ultimately be fully integrated into Cloud,
Mobile and SAP HANA High-availability Analytics in-memory computing platform environments.
• Key Technology Platforms and Industry Sector areas for SAP in 2015 include the following: -
1. Digital Healthcare
2. Multi-channel Retail
3. Financial Technology
1. Cloud Services
2. The Mobile Enterprise
3. In-memory Computing
Industry Sectors Technologies

Healthcare: - SAP Solution Roadmap
• Patient Experience and Journey – Patient Administration and Billing – Patient Relationship Management
• Clinical Delivery – Clinical Treatment and Care
• Digital Imaging – (MRI / CTI / X-Ray / Ultrasound)
• Robotic Surgery – (Microsurgery / Remote Surgery)
• Patient Monitoring – (Clinical Trials / Health / Wellbeing)
• Biomedical Data – (Data Streaming / Biomedical Analytics)
• Emergency Incident Management – (Response Team Alerts)
• Epidemiology – (Disease Transmission / Contact Management)
– Enterprise Healthcare Mobility (Mobile Devices / Smart Apps) • Activity Monitor – (Pedometer / GPS)
• Position Monitor – (Falling / Fainting / Fitting)
• Sleep Monitor – (Light Sleep / Deep Sleep / REM)
• Cardiac Monitor – (Heart Rhythm / Blood Pressure)
• Blood Monitor – (Glucose / Oxygen / Liver Function)
• Breathing Monitor – (Breathing Rate / Blood Oxygen Level)
• Care Collaboration – Connected Care – Referral Management

From sports to scientific research, a surprising range of industries will begin to find value in big data.....

“Big Data” in Digital Healthcare
“Big Data” in Pharma / Life Sciences
• Big data now plays an important role in medical and clinical research. Digital Patient Records are now being harvested and analysed in large-scale patient population studies – which are yielding actionable clinical insights. The UK Government has made anonymised patient records from the National Health Service openly available. Medical Centres, Research Institutes and Pharma / Life Sciences funding agencies have all made major investments in this area.

Big Data” in Clinical Medicine
“Big Data” in Clinical Medicine
• Big data plays an important role in medical and clinical research and has been exploited in clinical data studies. Major research institute centres and funding agencies have made large investments in the arena. For example, the National Institutes of Health recently committed US $100 million for the big data to Knowledge (BD2K) initiative [40]. The BD2K defines “biomedical” big data as large datasets generated by research groups or individual investigators and as large datasets generated by aggregation of smaller datasets. The most well-known examples of medical big data are databases maintained by the Medicare and Healthcare Cost and Utilization Project (with over 100 million observations).
• One of the differences between medical big data and large datasets from other disciplines is that clinical big data are often collected based on protocols (ie, fixed forms) and therefore are relatively structured, partially due to the extraction process that simplify raw data as mentioned above. This feature can be traced back to the Framingham Heart Study [41], which has followed a cohort in the town of Framingham, Massachusetts since 1948. Vast amounts of data have been collected through the Framingham Heart Study, and the analysis has informed our understanding of heart diseases, including the effects of diet, exercise, medications, and obesity on risk [42]. There are many other clinical databases with different scopes, including but not limited to, prevalence and trend studies, risk factor studies, and enotype-phenotype studies.

“Big Data” – Analysing and Informing
• SENSE LAYER – Remote Monitoring and Control – WHAT and WHEN? – Remote Sensing – Sensors, Monitors, Detectors, Smart Appliances / Devices
– Remote Viewing – Satellite. Airborne, Mobile and Fixed HDCCTV
– Remote Monitoring, Command and Control – SCADA
• GEO-DEMOGRAPHIC LAYER – People and Places – WHO and WHERE? – Person and Social Network Directories - Personal and Social Media Data
– Location and Property Gazetteers - Building Information Models (BIM)
– Mapping and Spatial Analysis – Landscape Imaging & mapping, Global Positioning (GPS) Data
– Temporal / Geospatial data feeds –Weather and Climate, Land Usage, Topology / Topography
• INFORMATION LAYER – “Big Data” and Data Set “mashing” – HOW and WHY? – Content – Structured and Unstructured Data and Content
– Information – Atomic Data, Aggregated, Ordered and Ranked Information
– Transactional Data Streams – Smart Devices, EPOS, Internet, Mobile Networks

“Big Data” – Analysing and Informing
• SERVICE LAYER – Real-time and Predictive Analytics – WHAT / WHEN NEXT? – Global Mapping and Spatial Analysis - GIS
– Service Aggregation, Intelligent Agents and Alerts
– Data Analysis, Data Mining and Statistical Analysis
– Optical and Wave-form Analysis and Recognition, Pattern and Trend Analysis an Extrapolation
• COMMUNICATION LAYER – Mobile Enterprise Platforms and the Smart Grid – Connectivity - Smart Devices, Smart Apps, Smart Grid
– Integration - Mobile Enterprise Application Platforms (MEAPs)
– Backbone – Wireless and Optical Next Generation Network (NGE) Architectures
• INFRASTRUCTURE LAYER – Cloud Service Platforms – Public, Mixed / Hybrid, Enterprise, Private, Secure and G-Cloud Cloud Models
– Infrastructure – Network, Storage and Servers
– Applications – COTS Software, Utilities, Enterprise Services
– Security – Principles, Policies, Users, Profiles and Directories, Data Protection


National Institute for Medical Research
• NIMR is one of the world's leading medical research institutes, dedicated to studying important questions about the life processes that are relevant to all aspects of health.
Francis Crick Institute

Digital Healthcare Skills Matrix
Cluster Theory – Digital

Digital Healthcare Skills Matrix
Cluster Theory – Digital
Abiliti: Future Systems
Slow is smooth, smooth is fast.....
.....advances in “Big Data” have lead to a revolution in Chronic Patient Management, Clinical Trials,
Epidemiology, Morbidity, Actuarial Science, Biomedical profiling, forecasting and predictive modelling – but it
takes both human ingenuity, and time, for Biomedical and Healthcare Models to develop and mature.....
Digital Futures: - Creating new roles and value chains

Digital Healthcare
• Digital Healthcare is a cluster of new and emerging applications and technologies
that exploit digital, mobile and cloud platforms for treating and supporting patients.
The term is necessarily general as this novel and exciting Digital Healthcare
innovation approach is being applied to a very wide range of social and health
problems, ranging from monitoring patients in intensive care, general wards, in
convalescence or at home – to helping doctors make better and more accurate
diagnoses, improving drugs prescription and referral decisions for clinical treatment.
• Digital Healthcare has evolved from the need for more proactive and efficient
healthcare delivery, and seeks to offer new types of prevention and care at reduced
cost – using methods that are only possible thanks to sophisticated technology.
• Digital Healthcare Technologies – Bioinformatics and Medical Analytics. Novel
and emerging high-impact Biomedical Health Technologies such as Bioinformatics
and Medical Analytics are transforming the way that Healthcare Service Providers
can deliver Digital Healthcare globally – Digital Health Technology entrepreneurs,
investors and researchers becoming increasingly interested in and attracted to this
important and rapidly growing Life Sciences industry sector. Bioinformatics and
Medical Analytics utilises Data Science to provide actionable Clinical insights.


Digital Healthcare Technologies
Scalable Enterprise Waveform Analytics Platform for Pharma
• Neural ID provides the only collaborative bio-signal analytics
platform spanning the pharmaceutical lifecycle. From Discovery
through Clinical and Health Information, Neural ID delivers a
scalable enterprise solution addressing the industry’s productivity
crisis. Our flagship product, IWS, delivers expert-driven machine
learning, massive data reduction and an interoperable data format to
help customers make better decisions, faster.
• Neural ID’s enterprise software platform is used by the world's
leading companies to deliver cutting-edge biosignal analytics,
including 4 of the top 10 pharmaceutical companies.

Helix Health Solutions
• Streaming Analytics - Physiological Wave-form Analysis Platform Excel Medical Electronics has developed a groundbreaking new research platform for analyzing volumes of unstructured data in real time by integrating their BedMasterEx data acquisition solution with IBM’s® InfoSphere™ Streams technology. Complex and high frequency medical data such as physiological waveforms have gone relatively unstudied in the healthcare industry due to substantial technology barriers.

Digital Healthcare Technologies
Medical Education and Remote Diagnostics
• Capabilities in Remote Diagnostics and Medical Education are evolving rapidly.
Companies that are innovating on this front and encompassing solutions such as
crowd-sourcing and peer-2-peer learning. Some of those companies really taking
advantage of the explosion in Biomedical “Big Data' include HP, GE Healthcare,
Siemens Healthcare, Boardvitals and AgileMD
Secure Storage and Sharing of Biomedical Information
• Box is a platform that is HIPAA and HITECH compliant for secure capture,
storage and management of Protected Personal Health Information (PPHI).
Medical Service Provider's Tools
• More and more service providers continue to jump on board with the new
Medical Service Provider's Tools that are out there. Two companies that are
particularly interesting are Clinicast and Reify Health (currently in beta test)

Digital Healthcare Technologies
Digital Diagnostics Tools
• Researchers are now taking advantage of new and emerging biomedical technologies which integrate with Mobile Phones and other Smart Devices in order to add diagnostic capabilities to the arsenal of the general and clinical physician. One company that looks promising in the future is Cellscope - FDA approved.
• Proteus Digital Health takes endoscopy to an extraordinary new level. This device is housed in a small capsule which can be swallowed - and contains a range of sensors and detectors, automatically streaming continuous digital information – and even images - to Mobile Phones and other Smart Devices. The device is capable of monitoring and tracking how the patient’s alimentary canal and digestive system behaves when an oral drug is being administered or when food or drink is being consumed. Nephosity - imaging - FDA approved.
• Dexcom markets a device that monitors blood glucose levels which is tucked neatly under the skin of the patient’s abdomen - FDA approved. Google are trialling a soft contact lens with an embedded bluetooth device and a sensor that monitors blood glucose levels - which continuously streams blood glucose level data to a monitoring service in the cloud, via a bluetooth mobile phone connection.

Digital Healthcare Technologies
Patient Communities – Chronic Disease Management • Reducing the cost of treating chronic illness is a major goal – because it can
dramatically improve health indices in populations of individuals suffering from chronic long-term illness Focusing on those highest-cost patient population's is an exciting approach that a number of companies are exploring. Chronic Disease management can be improved by supporting care providers and extenders that take on the task of assisting with the healthcare and improving the outcomes of these high-cost patients.
• Patients that have chronic illness have a variety of needs. Some patients require planned, regular interactions with support to their carers, focusing on function and prevention of acute episodes and complications. Community Healthcare Coaches can provide ongoing assessments in compliance with the treatment plan. Another important issue could be behavioural modification, and an organised support system for the patient. Planned interactions are overseen by the Primary Care Leader and any further intervention must be initiated by the medical practitioner and directed by clinically relevant information systems and continuing follow-up plans.
– Companies that are providing Chronic Disease Management software for
Patient Communities include: - Omada Health, Wallgreens and Safeway Health

Digital Healthcare Technologies
Electronic Medical Records (EMR's)
• EMR's are Active web applications that can intervene directly in order to effect
positive patient outcomes. “Prioritising positive patient care becomes a natural
consequence when the EMR is built with the intent of facilitating the patient-
physician relationship. EMR's focus on supporting the physician – so that the
physician can focus on treating the patient” - says Kyna Fong - ElationEMR
• Companies developing Active Patient Management in order to promote positive
Medical Outcomes include the following Digital Health Technology providers: -
– ElationEMR, GEHealthcare, Curemd and Drchrono and 5 O'Clock Records,
CareCloud between them offer a variety of web-based EMR‘s in addition to General
Practice patient administration systems and revenue cycle management solutions
– DoseSpot is an e-prescribing platform. Medopad and Practice Fusion are EMR's
which are marketed to community practitioners and doctors in primary health groups.

Digital Healthcare Technologies
Telemedicine
• With systems such as Teladoc you can obtain an on-line consultation from a consultant physician or specialist anywhere in the world via an on-line video-link. Teladoc is bringing this facility over to the 'brick and mortar' side by working on the development of walk-in patient kiosks situated in Health Centres and high-street Pharmacies .
Grid Computing World
• Community Grid for grid computing applications - Mobile Phones and other smart devices will make use of sensor and imaging technology to gather passive and active data for statistical analysis and diagnosis via Remote Healthcare Monitoring and Emergency Event Management Centres.
Care Delivery
• Delivery of care can always be improved. Some of the winners in this category are going to be: -
– One Medical, Sherpaa, Metamed (personalized medical research) and Statphone (patient transfers).

Digital Healthcare Technologies
Behavioural Health Analytics
• Patient Behaviour Analysis is the diagnostic tool of the future. Every patient has
unique genetic characteristic and environmental exposure - habits and behaviour
patterns - and any changes to those everyday habits and behaviour patterns may
be an indicator of a change in health status requiring intervention or a predictive
determinant of the future path a patient may take in terms of health and wellbeing.
Mobile Phones and other smart devices will make use of sensor and imaging
technology to gather passive and active data for statistical analysis and diagnosis.
Biomedical “Big Data” Management and Analytics
• Anapsis and EMBI, focus on Biomedical “Big Data” Management and
Analytics. This service is highly customisable for every client.
• Ginger.io is another example of a Behavioural Analytics platform. Ginger.io
examines patterns of everyday activity which are used as points of entry for
understanding larger issues such as paediatrics requirements, geriatrics needs
and mental health care for schemes such as Care in the Community and Assisted
Living at Home.
Digital Healthcare Technologies
Transitional Care • "Care transitions" is a term that describes the flow of patients from clinical
settings to settings in the community - which are socially more appropriate
relative to their needs. Every patient's needs change over time. Patients may
encounter a Primary Care Provider, a hospital physician, the nursing team
and even Social Services before they are “whisked off" to a nursing facility or
care home. Promising companies in the area of Care Transition include: -
– Care At Hand, Independa and OpenPlacement
• Companies such as these are building Smart Apps for Mobile Phones and
other smart devices which will make use of sensor and imaging technology for
streaming data to monitoring services that will bring new possibilities in the
transition from Intensive Care Units and General Hospital Wards, into a
convalescent nursing facility or care home and on into other patient care
schemes such as Care in the Community and Assisted Living at Home.

Digital Healthcare Technologies
Patient Management and Patient Administration Systems
• Integrated new clinical and back-office Patient Management and Patient Administration Systems will be in demand to manage the changing landscape of healthcare services provisioning, funding and cross-charging.
• Some of the challenges that are being addressed range from the simple capture at source of one-off chargeable consultation, medication and point medical procedures – to fully-featured clinical billing systems for managing the provision of complex multi-stage and continuous medication and clinical procedures, re-charging costs and administering payments from Primary Care budget holders and Health Insurance Companies – or patients themselves.
• Solutions from those companies listed below are of interest: -
• Medmonk, Medikly, Simplee, Cake Health, Castlight Healthcare, SwiftPayMD.


Digital Healthcare Technologies - Bioinformatics
• Healthcare is undergoing a global transformation – with Digital Healthcare
Technologies leading the way. Companies such as BT Health, Blueprint Health,
BUPA, Cisco, ElationEMR , Huawei, GE Healthcare, Microsoft, Telefonica Digital
and Rockhealth - are all developing novel and emerging Digital Healthcare
technologies - from Mobile Devices and Smart Apps to “Big Data” Analytics -
bringing new and exciting Digital Healthcare business propositions to market.
• Private Equity and Corporate Investment Funds are pouring seed-money and
Capital into Digital Health start-up ventures - in the hope of funding a “quick win”.
Applied Proteomics has just received an investment of $28 million from Genting
Berhad, Domain Associates and Vulcan Capital. The State of Essen in Germany
has recently invested 55m Euros on an SAP Digital Health Proof-of-concept.
• Telefónica Digital is sponsoring research into Smart Wards with St. Thomas's
Hospital in London. At the Institute of Digital Healthcare, part of the Science
City Research Alliance, researchers are not only looking to develop biomedical
technologies, but to base this firmly on a pragmatic understanding of both the
benefits and limitations of integrating biomedical technologies within the existing
range of commercial Digital Healthcare products and services currently on offer.

Wave-form Analytics
• • WAVE-FORM ANALYTICS • is an analytical tool based on Time-frequency Wave-
form analysis – which has been “borrowed” from spectral wave frequency analysis in
Physics. Deploying the Wigner-Gabor-Qian (WGQ) spectrogram – a method which
exploits wave frequency and time symmetry principles – demonstrates a distinct trend
forecasting and analysis capability in Wave-form Analytics. Trend-cycle wave-form
decomposition is a critical technique for testing the validity of multiple (compound)
dynamic wave-series models competing in a complex array of interacting and inter-
dependant cyclic systems - waves driven by both deterministic (human actions) and
stochastic (random, chaotic) paradigms in the study of complex cyclic phenomena.
• • WAVE-FORM ANALYTICS in “BIG DATA” • is characterised as periodic alternate
sequences of, high and low trends regularly recurring in a time-series – resulting in
cyclic phases of increased and reduced periodic activity – Wave-form Analytics
supports an integrated study of complex, compound wave forms in order to identify
hidden Cycles, Patterns and Trends in Big Data. The existence of fundamental stable
characteristic frequencies in large aggregations of time-series Economic data sets
(“Big Data”) provides us with strong evidence and valuable information about the
inherent structure of Business Cycles. The challenge found everywhere in business
cycle theory is how to interpret very large scale / long period compound-wave
(polyphonic) temporal data sets which are non-stationary (dynamic) in nature.

Wave-form Analytics
Track and Monitor
Investigate and
Analyse
Scan and Identify
Separate and Isolate
Communicate Discover
Verify and Validate Disaggregate
Background Noise
Individual Wave
Composite Waves
Wave-form Characteristics
"Big Data” Analytics – Profiling and Clustering
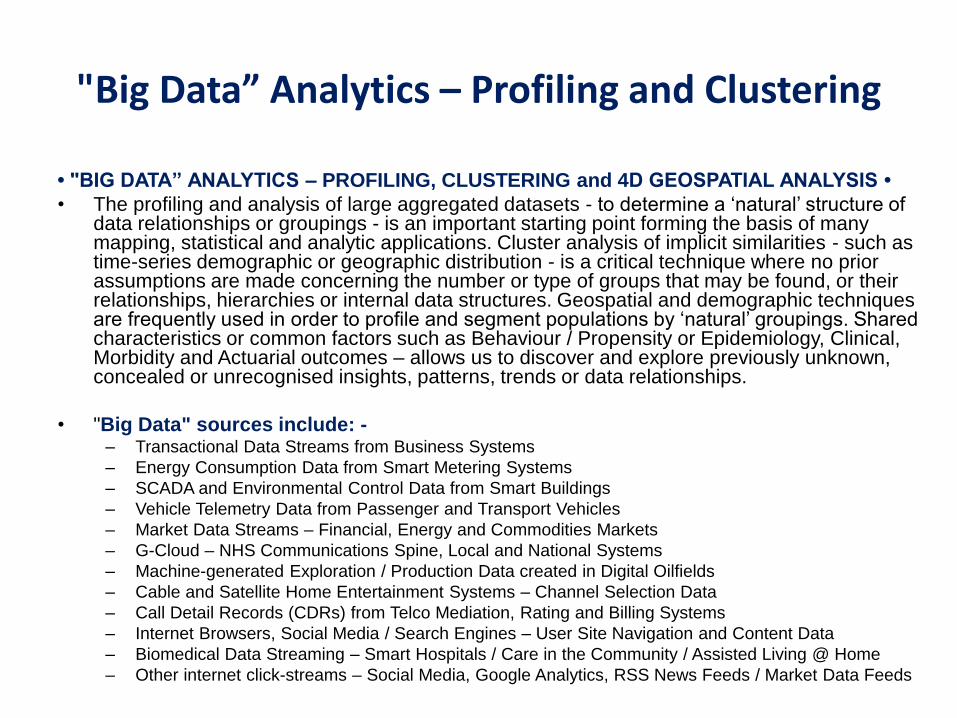
• "BIG DATA” ANALYTICS – PROFILING, CLUSTERING and 4D GEOSPATIAL ANALYSIS •
• The profiling and analysis of large aggregated datasets - to determine a ‘natural’ structure of data relationships or groupings - is an important starting point forming the basis of many mapping, statistical and analytic applications. Cluster analysis of implicit similarities - such as time-series demographic or geographic distribution - is a critical technique where no prior assumptions are made concerning the number or type of groups that may be found, or their relationships, hierarchies or internal data structures. Geospatial and demographic techniques are frequently used in order to profile and segment populations by ‘natural’ groupings. Shared characteristics or common factors such as Behaviour / Propensity or Epidemiology, Clinical, Morbidity and Actuarial outcomes – allows us to discover and explore previously unknown, concealed or unrecognised insights, patterns, trends or data relationships.
• "Big Data" sources include: - – Transactional Data Streams from Business Systems
– Energy Consumption Data from Smart Metering Systems
– SCADA and Environmental Control Data from Smart Buildings
– Vehicle Telemetry Data from Passenger and Transport Vehicles
– Market Data Streams – Financial, Energy and Commodities Markets
– G-Cloud – NHS Communications Spine, Local and National Systems
– Machine-generated Exploration / Production Data created in Digital Oilfields
– Cable and Satellite Home Entertainment Systems – Channel Selection Data
– Call Detail Records (CDRs) from Telco Mediation, Rating and Billing Systems
– Internet Browsers, Social Media / Search Engines – User Site Navigation and Content Data
– Biomedical Data Streaming – Smart Hospitals / Care in the Community / Assisted Living @ Home
– Other internet click-streams – Social Media, Google Analytics, RSS News Feeds / Market Data Feeds

The Temporal Wave – 4D Geospatial Analytics
• The Temporal Wave is a novel and innovative method for Visual Modelling and Exploration
of Geospatial “Big Data” - simultaneously within a Time (history) and Space (geographic)
context. The problems encountered in exploring and analysing vast volumes of spatial–
temporal information in today's data-rich landscape – are becoming increasingly difficult to
manage effectively. In order to overcome the problem of data volume and scale in a Time
(history) and Space (location) context requires not only traditional location–space and
attribute–space analysis common in GIS Mapping and Spatial Analysis - but now with the
additional dimension of time–space analysis. The Temporal Wave supports a new method
of Visual Exploration for Geospatial (location) data within a Temporal (timeline) context.
• This time-visualisation approach integrates Geospatial (location) data within a Temporal
(timeline) data along with data visualisation techniques - thus improving accessibility,
exploration and analysis of the huge amounts of geo-spatial data used to support geo-
visual “Big Data” analytics. The temporal wave combines the strengths of both linear
timeline and cyclical wave-form analysis – and is able to represent data both within a Time
(history) and Space (geographic) context simultaneously – and even at different levels of
granularity. Linear and cyclic trends in space-time data may be represented in combination
with other graphic representations typical for location–space and attribute–space data-
types. The Temporal Wave can be used in roles as a time–space data reference system,
as a time–space continuum representation tool, and as time–space interaction tool.

BIOMEDICAL DATA - CASE-BASED AND
STREAM-BASED CLASSICATION
Yang Hang Department of Computer and Information Science University of Macau, Macau [email protected] Simon Fong Department of Computer and Information Science University of Macau, Macau [email protected] Andy Ip Faculty of Science and Technology University of Macau, Macau [email protected] Sabah Mohammed Department of Computer Science Lakehead University Thunder Bay, Canada [email protected]
CASE-BASED AND STREAM-BASED CLASSICATION IN BIOMEDICAL DATA - University of Macau

Bioinformatics and Medical Analytics
• Digital Healthcare Technologies – Bioinformatics and Medical Analytics.
Novel and emerging high-impact Biomedical Health Technologies such as
Bioinformatics and Medical Analytics are transforming the way that Healthcare
Service Providers can deliver Digital Healthcare globally – Digital Health
Technology entrepreneurs, investors and researchers becoming increasingly
interested in and attracted to this important and rapidly growing Life Sciences
industry sector. Bioinformatics and Medical Analytics utilises Data Science to
provide actionable Clinical insights.

Bioinformatics

Bioinformatics
• Advances in “Big Data” have lead to a revolution in Chronic and Acute Patient
Monitoring and Management, Clinical Trials, Epidemiology, Morbidity, Actuarial
Science, Biomedical profiling, forecasting and outcome predictive modelling.
• There are two major families of biomedical data which are commonly to be found in
Bioinformatics – firstly, case-based Biomedical data (which consist of historical
record archival data sets), and secondly, stream-based Biomedical data (which are
dynamic signal streams captured in real-time from Medical Equipment – scanners,
sensors or monitors – or any other scientific equipment that you may care to think of..... )
• Profiling and Cluster Analysis has proven its effectiveness over traditional decision-tree
classification for revealing interesting patterns and trends in data-mining of static case-
based clinical data sets . These techniques are, however, used mainly for pattern and
trend detection in historic case-based data - rather than classification, diagnosis or
biomedical event prediction in Biomedical Metrics data which is streamed from Medical
Equipment. The application of Wave-form Analytics to the data mining of dynamic real-
time biomedical data streams has not previously been explored by other researchers -
despite biomedical signal processing techniques having existed for several decades.
CASE-BASED AND STREAM-BASED CLASSICATION IN BIOMEDICAL DATA - University of Macau

Bioinformatics
• Computer Science researchers at the University of Macau have examined the impact
of data mining techniques against static Historic biomedical datasets and dynamic,
continuous Real-time biomedical data streams. The Macau research team have
demonstrated that the two very different bio-medical workflows – consisting of static
case-based and dynamic stream-based data mining for diagnostics classification –
both require radically different Data Mining techniques. In a Simulation Programme
for conducting experiments in the analysis of these two types of biomedical data. a
comparison of the two data mining techniques (case-based and stream-based), the
researchers observed that case-based diagnostic classification data mining has a
higher accuracy – but, because it runs in batch-mode in order to support numerous
multiple database scans – it is much slower than stream-based data mining methods
• Stream-based imaging and analytics has a very low latency but achieves a relatively
lower accuracy - unless the dataset size reaches a critical very large-scale or size –
Biomedical “Big Data”. The researchers propose a new method of Data Profiling –
Cluster Analysis - to resolve the problem of needing multiple batch scanning passes
or steps using classification decision trees – in the long-running multiple database
scanning stages during data mining of dynamic, real-time Biomedical data-streams.
CASE-BASED AND STREAM-BASED CLASSICATION IN BIOMEDICAL DATA - University of Macau

Bioinformatics
• Biomedical datasets pose certain challenges to bioinformatics because of their inherent
natures of high-dimensionality, huge volume, and demand for extremely high accuracy (as
this often involves life-and-death interventions). Recent advances in biomedical sensing
and monitoring technologies further step up the challenges as datasets are generated from
real-time time-series Biomedical data streams – e.g. foetal cardiograms, where multiple
diagnostic features are automatically and continuously being measured through streaming
processing and displaying wave-form signals and images. The problem with current data
mining methods is the Medical datasets must be delimited (finite) - and the long latency to
construct or even to refresh a diagnostics model. A fundamental question for the research
project: - could traditional data mining methods effectively support the mining of dynamic,
continuous, machine-generated, large-scale and real-time biomedical data streams? No !
• Many biomedical imaging analytics and signal processing methods currently exist which
can detect anomalous patterns out of the general “noise” from the incoming data streams
– but it is deemed necessary to have additionally a decision support technique that offers
accurate diagnosis predication based on the latest updates of the incoming signal streams.
Traditional data-mining - for example, induction-based decision-tree diagnostic taxonomy
and classification, works by multiple file scanning passes – against a finite and structured
set of data – repeated many times over in order to build up a taxonomic diagnosis model.
CASE-BASED AND STREAM-BASED CLASSICATION IN BIOMEDICAL DATA - University of Macau

Bioinformatics
• The researchers from the University of Macau have generalised this method as “Historic
Case-based data mining” - which has been widely applied in the following fields of bio-
medical data for statistical analysis / prognosis of chronic and acute disease outcomes: -
– Endocrine System metric diagnoses
– Geriatric adult’s healthcare outcomes etc.
– Paediatric children’s healthcare outcomes
– Heart and Lung transplant patient monitoring
– Traditional Chinese medicine - efficacy and effectiveness
– Clinical Trials, Epidemiology, Morbidity and Actuarial Science
• Recently a new group of data mining algorithms – “Real-time data-stream mining” –
which developed from internet click-stream processing originated by Google – have been
further developed and enhanced for handling large volumes of continuous high-speed
Biomedical data-streams. Stream-based data-mining may address the challenges of
processing high-volume, real-time biomedical data or signals. The main requirement - that
of acquiring timely decisions for intervention from the data mining model – is the data
mining run-time must be significantly less than the velocity of the incoming data streams.
CASE-BASED AND STREAM-BASED CLASSICATION IN BIOMEDICAL DATA - University of Macau

Bioinformatics
• The other unique requirement is that we are no longer able to take for granted that a full and
continuous long-timeline data is always going to be available – compared with long-exposure
data collection, new and emerging data stream mining algorithms can now process relatively
short-term, small and incomplete datasets in a single pass, allowing a clinical decision can be
made instantaneously – within specific parameters of accuracy. These requirements fit in very
well with biomedical applications - especially those that involve dynamic monitoring and real-
time diagnostic analytics, and / or chronic and acute medical event and outcome prediction .
• Previous Biomedical data streaming research has evaluated the differences between traditional
Historic (batch) and real-time (dynamic) data mining applications - but only against non-medical
(financial markets data streaming) data-streams and artificially generated medical data-streams,
• To the best of the research team’s knowledge, this is the first documented attempt to exploit real-
time data stream mining techniques using dynamic bio-medical datasets. The prime objective of
the University of Macau research project was to investigate how well Biomedical data-stream
mining performs against dynamic real-time bio-medical datasets, and to evaluate their respective
diagnostic and medical event prediction accuracy – especially in the use of Wave-form and
Imaging Analytics over real-time traditional diagnostic classification methods.
CASE-BASED AND STREAM-BASED CLASSICATION IN BIOMEDICAL DATA - University of Macau
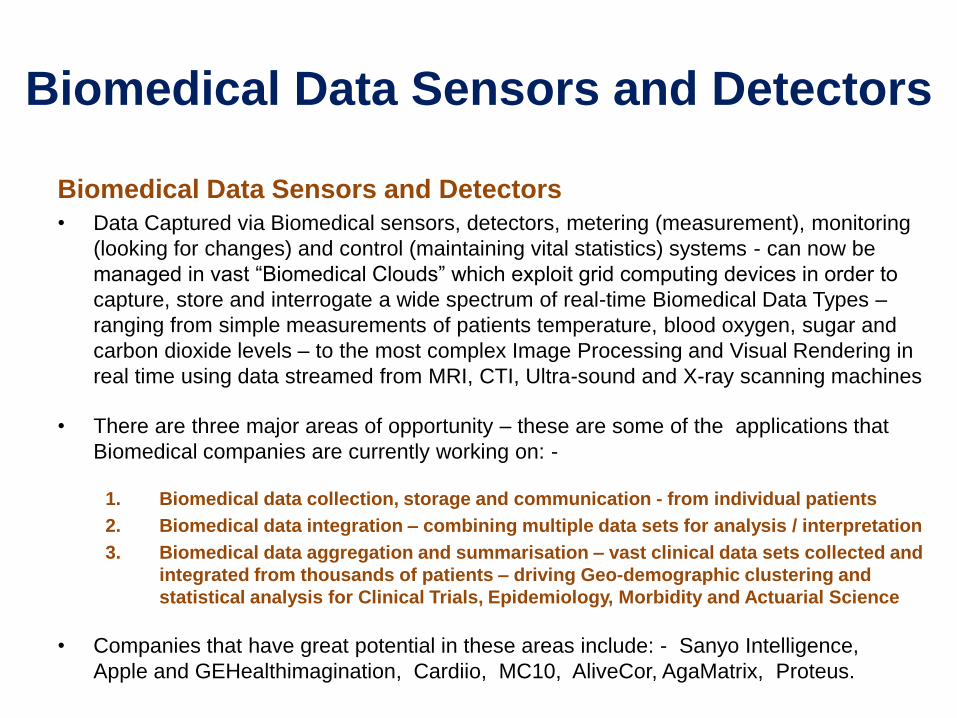
Biomedical Data Sensors and Detectors
Biomedical Data Sensors and Detectors
• Data Captured via Biomedical sensors, detectors, metering (measurement), monitoring
(looking for changes) and control (maintaining vital statistics) systems - can now be
managed in vast “Biomedical Clouds” which exploit grid computing devices in order to
capture, store and interrogate a wide spectrum of real-time Biomedical Data Types –
ranging from simple measurements of patients temperature, blood oxygen, sugar and
carbon dioxide levels – to the most complex Image Processing and Visual Rendering in
real time using data streamed from MRI, CTI, Ultra-sound and X-ray scanning machines
• There are three major areas of opportunity – these are some of the applications that
Biomedical companies are currently working on: -
1. Biomedical data collection, storage and communication - from individual patients
2. Biomedical data integration – combining multiple data sets for analysis / interpretation
3. Biomedical data aggregation and summarisation – vast clinical data sets collected and
integrated from thousands of patients – driving Geo-demographic clustering and
statistical analysis for Clinical Trials, Epidemiology, Morbidity and Actuarial Science
• Companies that have great potential in these areas include: - Sanyo Intelligence,
Apple and GEHealthimagination, Cardiio, MC10, AliveCor, AgaMatrix, Proteus.
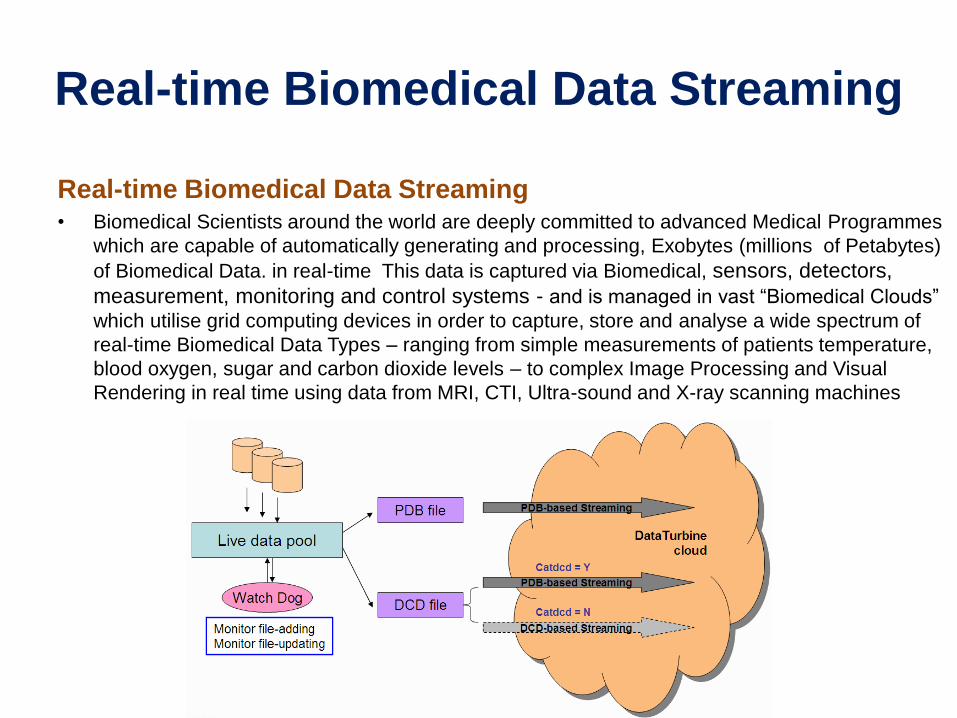
Real-time Biomedical Data Streaming
Real-time Biomedical Data Streaming • Biomedical Scientists around the world are deeply committed to advanced Medical Programmes
which are capable of automatically generating and processing, Exobytes (millions of Petabytes)
of Biomedical Data. in real-time This data is captured via Biomedical, sensors, detectors,
measurement, monitoring and control systems - and is managed in vast “Biomedical Clouds”
which utilise grid computing devices in order to capture, store and analyse a wide spectrum of
real-time Biomedical Data Types – ranging from simple measurements of patients temperature,
blood oxygen, sugar and carbon dioxide levels – to complex Image Processing and Visual
Rendering in real time using data from MRI, CTI, Ultra-sound and X-ray scanning machines

Real-tIme bioMEdical data Streaming (RIMES)

Real-time Biomedical Data Streaming
Real-time Biomedical Data Streaming
• Most of these Biomedical datasets are huge – potentially containing Exobytes
(millions of Petabytes ) of Biomedical “Big Data”. Biomedical Data Streams are
composed of machine-generated metering, sensing and monitoring data captured by
scientific instruments deployed in support of large-scale Biomedical Research
programs. Biomedical Software features intelligent agents and alerts which can
automatically trigger alarms and interventions. Various types of biomedical data are
supported by the Biomedical Cloud environment, including .pdb and .dcd files.
• As Biomedical Data in the working repository is continuously updated, appended
image frames may be streamed to an RBNB Data-turbine Cloud by the RIMES
Synchronisation client - which ensures that data from the Biomedical Data Stream is
continuously synchronized with the Biomedical Data Cloud. User Clinicians may
deploy various extended user services over the core biomedical grid computing
features and mass storage systems – including various Biomedical Software Portals,
such as intelligent agents and alerts, visualization and analytics tools portals – which
are continuously processing incoming dynamic real time biomedical data streams.
Biomedical Data and Analytics: - Management Principles

Data Management Principles
• Driving economic value out of data is a complex task and one that requires sophisticated enterprise-
level data management software. This is apparent right now but will become even more obvious as
cloud architectural models become ever more sophisticated and ubiquitous. In the world of hybrid
cloud for example, a lot of attention has been focused on the movement of workloads from one cloud
to another. The ability to move an application from one service provider to another or from one
private cloud to a public cloud is one of the main attractions of a hybrid cloud model. What tends to be
over looked in the discussion though is the data that is associated with the workload and how that
moves through this ecosystem.
Data Management Principles
• Data Sovereignty – Data stored in a country should be subject to the data laws prevalent in that
country. This is especially acute for customer data and many countries have amended their data laws
to ensure that customer data created in-country stays in-country. This can be difficult to regulate as
workloads and their data are moved to the cloud, especially in a public cloud model. There is an
element of trust of the service provider that is required.
• Data Gravity – Moving data about from one platform to another is problematic. Data storage is
persistent and resides some physical place unlike an application that is being processed at the
compute layer or data that is transferred over a network. In essence, data has inertia and data
movement takes time.

Data Management Principles
• Data Classification – Not all data is created equal. Being able to classify data and apply suitable
policies to the treatment of that data is essential. This actually is the higher order capability, and the
basis for really deriving value out of the data, allowing data analysis technologies do their work.
• Data Privacy – This needs little explanation. Data privacy laws are continually being updated (and
usually getting tighter). Cloud service providers, whether public, private or hyperscalar need to be as
cognizant of the need for data privacy just as much as enterprises running on-prem data centers. If
anything they need to be even more vigilant given their systems are often multi-tenanted, storing data
from a large number of customers, some of whom may even be competitors.
• Data Governance, Data Ownership – All roughly the same broad topic as Data Stewardship and
Data Custody. Data, especially in the context of an enterprise, needs to be governed properly.
Auditable processes need to be established and individuals held responsible for following them. Phil
Brotherton has written eloquently about what he calls ‘the value of data control’ in the cloud and why
choosing the right partners to deliver a hybrid cloud is essential if data stewardship issues are to be
fully addressed.
• Data Replication – Allied to the movement of data question. Data needs to be replicated for a
plethora of reasons such as backup and recovery, high availability, compliance obligations etc. The
legality of where copies are data are stored is an interesting question related to the data sovereignty
issue noted above..

Data Management Principles
• Data Security – IT security as an overarching topic has been at the top of CIOs agenda for the last
several years and I doubt it will ever drop off their lists. As we start to employ more cloud based
architectural paradigms, the IT security issue will only intensify. Data protection and anti-data
leakage technologies will continue to be essential in protecting the integrity of data, whether held in
on-premise data centers or in the cloud.
• Data Escrow – What happens to your data when your cloud service provider goes belly-up? Getting
it back came be very expensive – read what happened when 2e2 shut its data center last year or
Nirvanix, a cloud storage vendor who went into administration last year giving its customers two
weeks to retrieve their data (at their own expense). The lesson here is if you outsource you data
processing provisioning to a service provider, you do not outsource the ownership of the data nor
your responsibility. As an old boss of mine used to say “there’s a fine line between delegation and
abrogation of responsibility”. After looking up the word I understood what he meant about crossing
that line.
• Data Asset Management – Deriving value out of data is a complex task and one that requires
sophisticated enterprise-level data management software. This is apparent right now but will become
even more obvious as cloud architectural models become ever more sophisticated and ubiquitous. In
the world of hybrid cloud for example, a lot of attention has been focused on the movement of
workloads from one cloud to another. The ability to move an application from one service provider to
another or from one private cloud to a public cloud is one of the main attractions of a hybrid cloud
model. What tends to be over looked in the discussion though is the data that is associated with the
workload and how that moves through this ecosystem.

Data Management Principles
• Data Storage – The storage of data is a means to an end. Why do we implement storage arrays at
all? Essentially it is to manage all the data that our stakeholders create and to do so in the most
effective way possible: - ffective from both a cost and a performance perspective. The relationship
between storage systems and data management is therefore intrinsic. Storage systems tend to have
similar non-functional requirements. The major criteria are: -
1. Performance – will it give me the throughput and the latency that my users need in order to get
access to the data they want?
2. Reliability – how often will it break down? how often will data be unavailable if at all?
3. Scalability – how many disks can I add? how much data can it store?
4. Ease of Use - how complex will it be? how can the data I store on it be tracked, backed up,
restored etc?
• Data storage and data management are intrinsically linked - these are complex storage issues which
big storage vendors have been addressing for 30 years or more. However when I think about
storage today, I am drawn much more to the latter than the former. Certainly storage hardware
vendors have differentiated technologies that provide the bedrock for data management, but it is in
the complexities of the data management layer where I believe the true action lies and differentiation
will be observed.

Data Management Principles
• In summary, Data Management is set to be an extremely critical area of IT over the next few decades.
The Internet of Things is now being flooded with the ubiquitous presence of pervasive smart devices
– in particular, in the Wearable Technology, Future Homes and Smart Cities categories. It isn’t just
about the vast volumes of data that we are now seeing with the Internet of Things and the tsunami
wave of machine-generated data from connected devices - it also about the abstraction of numerous
storage capabilities from hardware into software and the emergence of the so-called software-defined
Software Data Storage Platforms. As the future unfolds – data density can only get more intense.

Alex Osterwalder invented the Internet of Things Business Canvas in 2008

A Business Model for the Internet of Things
• Studies from Cisco, IBM, Microsoft, McKinsey, Gartner, Forrester and other
companies are now indicating a tremendous surge in growth of several
consumer categories and product areas in the Internet of Things – often referred
to as the Internet of Everything Everywhere. The Internet of Things is now being
flooded with the ubiquitous presence of pervasive smart devices – in particular,
Wearable Technology, Future Homes and Smart Cities categories. The number
of internet connected devices on our bodies, in our homes and around our cities
is only one example demonstrating how fast IOT / IEE technology is growing.
• The Internet of Things Business Canvas splits the IOT business model into
two distinct streams, the physical and the digital. Amazing new opportunities are
now being created through connecting and integrating physical devices into
digital communications – revealing fascinating social insights that we have never
appreciated before. Connecting the unconnected, the physical and the digital
streams are pivotal to the delivery of this new value proposition. Consumers are
embracing for example, Wearable Technology, Future Homes and Smart Cities
in almost every aspect of their daily life. Small start-ups funded by the crowd are
offering all kinds of services based on connected devices - on a massive scale.

A Business Model for the Internet of Things
Claropartners have developed a business model template for the Internet of Things

Digital Product Lifecycle Strategy
Digital Product Lifecycle Strategy

Digital Product Lifecycle Strategy
• Everything around us has a lifecycle. It is born, it grows, it ages, and it ultimately dies. It’s easy to spot a lifecycle in action everywhere you look. As a person is born, grows, ages, and dies – then so does a star, a tree, a bee, or a civilization – and so does a company, a product, a technology or a market - everything goes around in a lifecycle of it own.

Digital Product Lifecycle Strategy
• Everything around us has a lifecycle. It is born, it grows, it ages, and it ultimately dies.
It’s easy to spot a lifecycle in action everywhere you look. As a person is born, grows,
ages, and dies – then so does a star, a tree, a bee, or a civilization – and so does a
company, a product, a technology or a market - everything has a lifecycle of it own.
• All lifecycles exist within a dynamic tension between system development and
system stability. When an entity is born, and during it’s early its development - it
has low stability. As it grows, both its development and stability increase until it
reaches maturity. After peaking, its ability to develop diminishes over time while its
stability keeps increasing over time. Finally, it becomes so stable that it ultimately dies
and, at that moment, it loses all stability as well.
• That’s the basics of all lifecycles. We can try to optimize the path or slow the effects of
aging, but ultimately every system makes this lifecycle progression. Of course, not
all systems follow a bell curve like the picture below. Some might die a premature
death. Others are a flash in the pan. A very few live long and prosper - but from
insects to stars and everything in between, we can say that all things comes into
being, grows, matures, ages, and ultimately fades away. Such is the way of life.

Digital Product Lifecycle Strategy
• Everything has a lifecycle. It is born, it grows, it ages, and it ultimately dies. It’s easy
to spot a lifecycle in action everywhere you look. As a person is born, grows, ages,
and dies – as does a star, a tree, a bee, or a civilization – and so does a company, a
product, or a market - everything has a lifecycle of it own.

Digital Product Lifecycle Strategy
Investment
Product Lifecycle
Product Launch
Product Development
Product Planning
Death
Plateau
Product Maturity
Decline
Aging
Early Growth
Migrate Customers
to new Products
Withdraw
Innovation Prototype / Pilot / Proof-of-concept
Cash Cow Cease Investment

Digital Product Lifecycle Strategy
• What do the principles of adaptation and lifecycles have to do with your business
strategy? Everything. Just as a parent wouldn’t treat her child the same way if she’s
three or thirty years old, you must treat your strategy differently depending on the
lifecycle stage. And when it comes to your business strategy, there are actually three
lifecycles you must manage. They are the product, market, and execution lifecycles: -
– The product lifecycle refers to the assets you make available for sale.
– The market lifecycle refers to the type of customers to whom you sell.
– The execution lifecycle refers to your company’s ability to execute.
• In order to execute on a successful strategy, the stages of all three lifecycles must be in
close alignment with each other. If not, like a pyramid with one side out of balance, it will
collapse on itself and your strategy will fail. Why? Because aligning the product, market,
and execution lifecycles gives your business the greatest probability of getting new
energy from the environment now and capitalizing on emerging growth opportunities in
the future. The goal of any digital product strategy is to get new energy from the
environment, now and in the future.) As we will see, aligning all three lifecycles also
decreases your probability of making major strategic product placement mistakes.


Digital Product Lifecycle Strategy
• Each lifecycle please note that each stage blends into the next. Although every
lifecycle may have distinct stages, this is really only for convenience. There’s no
real, definitive, clean and clear break where you know when one stage has ended
and another begins. In addition, there are three basic prerequisites that you must
have before you can pursue any strategy.
• First, the strategy must be aligned with the company vision and values. Second, the
company must have or be able to get the resources – including staff, technology,
and capital – to execute the strategy. Third, the company must have or be able to
develop the core capabilities to execute the strategy. For now, I am going to assume
that you have all three prerequisites in place and that you’re currently acting on, or
about to act on, a strategy that meets these basic requirements.
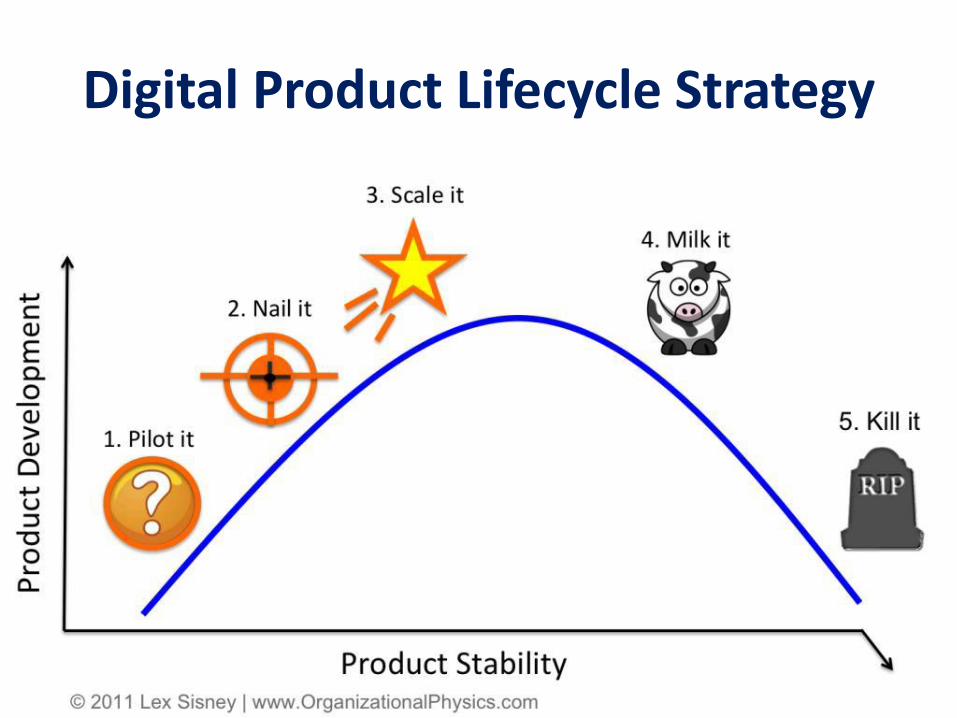
Digital Product Lifecycle Strategy

Digital Product Lifecycle – End-phase

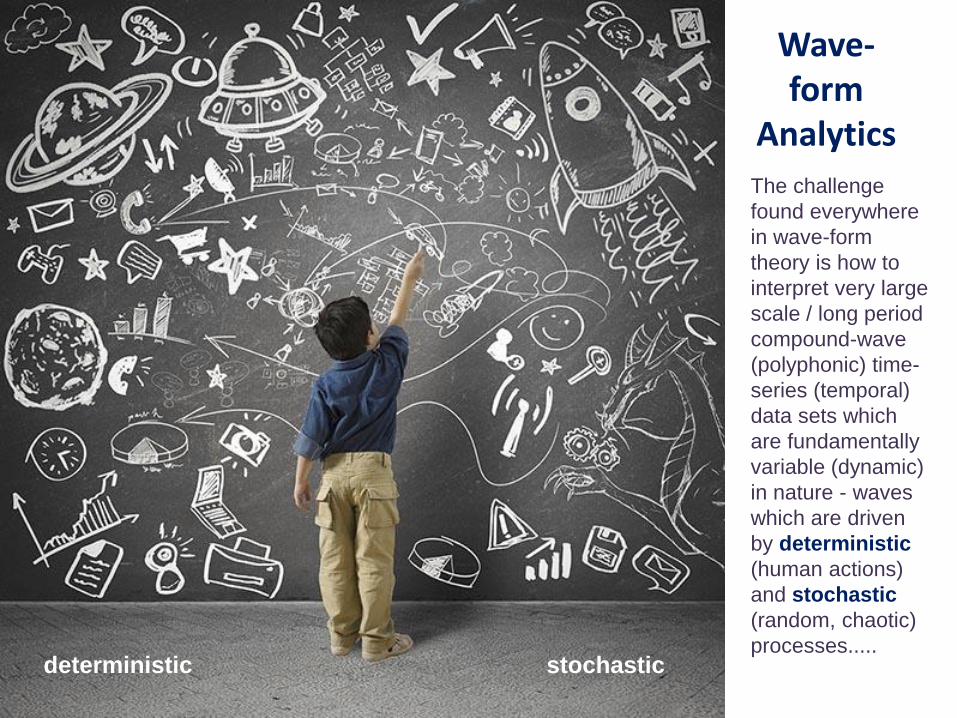
Wave-form
Analytics
• The challenge
found everywhere
in wave-form
theory is how to
interpret very large
scale / long period
compound-wave
(polyphonic) time-
series (temporal)
data sets which
are fundamentally
variable (dynamic)
in nature - waves
which are driven
by deterministic
(human actions)
and stochastic
(random, chaotic)
processes..... deterministic stochastic

deterministic stochastic

Wave-form Analytics
• The challenge found everywhere in wave-form theory is how to interpret very large scale / long period compound-wave (polyphonic) time-series (temporal) data sets which are radically non-stationary (dynamic) in nature - waves which are driven by both deterministic (human actions) and stochastic (random, chaotic) processes.....
deterministic stochastic

Wave-form Analytics in Cycles
• Wave-form Analytics is a new analytical tool “borrowed” from spectral wave
frequency analysis in Physics – and is based on Time-frequency Wave-form
analysis – a technique which exploits the wave frequency and time symmetry
principle. This is introduced here for the first time in the study of human activity
waves, and in the field of economic cycles business cycles, patterns and trends.
• Trend-cycle decomposition is a critical technique for testing the validity of multiple
(compound) dynamic wave-form models competing in a complex array of
interacting and inter-dependant cyclic systems in the study of complex cyclic
phenomena - driven by both deterministic and stochastic (probabilistic) paradigms.
• In order to study complex periodic economic phenomena there are a number of
competing analytic paradigms – which are driven by either deterministic methods
(goal-seeking - testing the validity of a range of explicit / pre-determined / pre-
selected cycle periodicity value) and stochastic (random / probabilistic / implicit -
testing every possible wave periodicity value - or by identifying actual wave
periodicity values from the “noise” – by analysing harmonic resonance and
interference patterns in order to discover the fundamental original frequencies).

Wave-form Analytics in Cycles
• The existence of fundamental stable characteristic frequencies in large aggregations
of time-series economic data sets (“Big Data”) provides us with strong evidence and
valuable information about the inherent structure of Business Cycles. The challenge
found everywhere in business cycle theory is how to interpret very large scale / long
period compound-wave (polyphonic) time series data sets which are in nature
dynamic (non-stationary) waves. Fundamental constraints for Friedman's rational
arbitrageurs are the selection of valid reference points and a preferred time-scale
from large data sets containing economic observations – this will be re-examined
later from the viewpoint of source data ambiguity and dynamic cycle instability.
• Wave-form Analytics is a new analytical too based on Time-frequency analysis – a
technique which exploits the wave frequency and time symmetry principle. A variety
of competing deterministic and stochastic methods, including the first difference
(FD) and Hodrick-Prescott (HP) filter - may be deployed with the mixed case of
multiple-frequency overlaid cycles and background system noise, using repetitive
estimation and elimination techniques. The FD filter does not produce any clear
picture of multiple business cycles – however, the HP filter provides us with strong
empiric evidence for pattern recognition of multiple co-impacting business cycles.

Wave-form Analytics
Track and Monitor
Investigate and
Analyse
Scan and Identify
Separate and Isolate
Communicate Discover
Verify and Validate Disaggregate
Background Noise
Individual Wave
Composite Waves
Wave-form Characteristics

Wave-form Analytics in Cycles
• Biological, Sociological, Economic and Political systems all tend to demonstrate
Complex Adaptive System (CAS) behaviour - which appears to be more similar
in nature to biological behaviour in a living organism than to Disorderly, Chaotic,
Stochastic Systems (“Random” Systems). For example, the remarkable
adaptability, stability and resilience of market economies may be demonstrated by
the impact of Black Swan Events causing stock market crashes - such as oil price
shocks (1970-72) and credit supply shocks (1927- 1929 and 2008 onwards).
Unexpected and surprising Cycle Pattern changes have historically occurred
during regional and global conflicts being fuelled by technology innovation-driven
arms races - and also during US Republican administrations (Reagan and Bush -
why?). Just as advances in electron microscopy have revolutionised biology -
non-stationary time series wave-form analysis has opened up a new space for
Biological, Sociological, Economic and Political system studies and diagnostics.
• The Wigner-Gabor-Qian (WGQ) spectrogram method demonstrates a distinct
capability for identifying revealing multiple and complex superimposed cycles or
waves within dynamic, noisy and chaotic time-series data sets – without the need
for using repetitive individual wave-form estimation and elimination techniques.

The Temporal Wave – 4D Geospatial Analytics
• The Temporal Wave is a novel and innovative method for Visual Modelling and Exploration
of Geospatial “Big Data” - simultaneously within a Time (history) and Space (geographic)
context. The problems encountered in exploring and analysing vast volumes of spatial–
temporal information in today's data-rich landscape – are becoming increasingly difficult to
manage effectively. In order to overcome the problem of data volume and scale in a Time
(history) and Space (location) context requires not only traditional location–space and
attribute–space analysis common in GIS Mapping and Spatial Analysis - but now with the
additional dimension of time–space analysis. The Temporal Wave supports a new method
of Visual Exploration for Geospatial (location) data within a Temporal (timeline) context.
• This time-visualisation approach integrates Geospatial (location) data within a Temporal
(timeline) data along with data visualisation techniques - thus improving accessibility,
exploration and analysis of the huge amounts of geo-spatial data used to support geo-
visual “Big Data” analytics. The temporal wave combines the strengths of both linear
timeline and cyclical wave-form analysis – and is able to represent data both within a Time
(history) and Space (geographic) context simultaneously – and even at different levels of
granularity. Linear and cyclic trends in space-time data may be represented in combination
with other graphic representations typical for location–space and attribute–space data-
types. The Temporal Wave can be used in roles as a time–space data reference system,
as a time–space continuum representation tool, and as time–space interaction tool.


Wave-form Analytics
Track and Monitor
Investigate and
Analyse
Scan and Identify
Separate and Isolate
Communicate Discover
Verify and Validate Disaggregate
Background Noise
Individual Wave
Composite Waves
Wave-form Characteristics

Wave-form Analytics
• • WAVE-FORM ANALYTICS • is an analytical tool based on Time-frequency Wave-
form analysis – which has been “borrowed” from spectral wave frequency analysis in
Physics. Deploying the Wigner-Gabor-Qian (WGQ) spectrogram – a method which
exploits wave frequency and time symmetry principles – demonstrates a distinct trend
forecasting and analysis capability in Wave-form Analytics. Trend-cycle wave-form
decomposition is a critical technique for testing the validity of multiple (compound)
dynamic wave-series models competing in a complex array of interacting and inter-
dependant cyclic systems - waves driven by both deterministic (human actions) and
stochastic (random, chaotic) paradigms in the study of complex cyclic phenomena.
• • WAVE-FORM ANALYTICS in “BIG DATA” • is characterised as periodic alternate
sequences of, high and low trends regularly recurring in a time-series – resulting in
cyclic phases of increased and reduced periodic activity – Wave-form Analytics
supports an integrated study of complex, compound wave forms in order to identify
hidden Cycles, Patterns and Trends in Big Data. The existence of fundamental stable
characteristic frequencies in large aggregations of time-series Economic data sets
(“Big Data”) provides us with strong evidence and valuable information about the
inherent structure of Business Cycles. The challenge found everywhere in business
cycle theory is how to interpret very large scale / long period compound-wave
(polyphonic) temporal data sets which are non-stationary (dynamic) in nature.
Wave-form Analytics in Big Data
• Wave-form Analytics is a new analytical tool “borrowed” from spectral wave
frequency analysis in Physics – and is based on Time-frequency Wave-form
analysis – a technique which exploits the wave frequency and time symmetry
principle. This is introduced here for the first time in the study of human activity
waves, and in the field of morbidity and epidemiology cycles, patterns and trends.
• Trend-cycle decomposition is a critical technique for testing the validity of multiple
(compound) dynamic wave-form models competing in a complex array of
interacting and inter-dependant cyclic systems in the study of complex cyclic
phenomena - driven by both deterministic and stochastic (probabilistic) paradigms.
• In order to study complex periodic morbidity and epidemiology phenomena there
are a number of competing analytic paradigms – which are driven by either
deterministic methods (goal-seeking - testing the validity of a range of explicit / pre-
determined / pre-selected cycle periodicity value) and stochastic (random /
probabilistic / implicit - testing every possible wave periodicity value - or by
identifying actual wave periodicity values from the “noise” – by analysing harmonic
resonance and interference patterns to find the fundamental frequencies).

Wave-form Analytics in Big Data
• The strong evidence of stable characteristic frequencies in large biomedical data set
aggregations (“Big Data”) provides us with some insights and valuable information
into the structure of natural pandemic and famine cycles. A fundamental challenge
found everywhere in morbidity and epidemiology cycle theory is how to interpret the
very large scale / long period compound-wave (polyphonic) time series data sets
which are dynamic (non-stationary) in nature. The role of time scale and preferred
reference from clinical and statistical observation are fundamental constraints for
Friedman's rational arbitrageurs – which will be re-examined later from the viewpoint
of source data ambiguity and dynamic cycle instability.
• Wave-form Analytics is a new analytical too based on Time-frequency analysis – a
technique which exploits the wave frequency and time symmetry principle. A variety
of competing deterministic and stochastic methods, including the first difference
(FD) and Hodrick-Prescott (HP) filter - may be deployed with the mixed case of
multiple-frequency overlaid cycles and background system noise, using repetitive
estimation and elimination techniques. The FD filter does not produce any clear
picture of multiple business cycles – however, the HP filter provides us with strong
empiric evidence for pattern recognition of multiple co-impacting morbidity cycles.
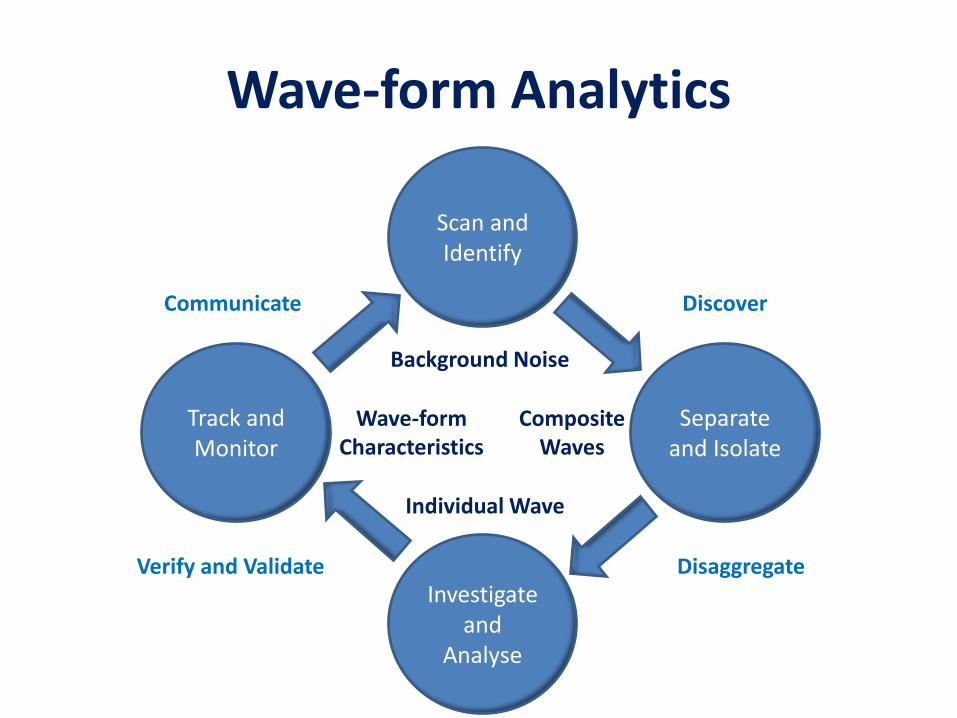
Wave-form Analytics
Track and Monitor
Investigate and
Analyse
Scan and Identify
Separate and Isolate
Communicate Discover
Verify and Validate Disaggregate
Background Noise
Individual Wave
Composite Waves
Wave-form Characteristics

Wave-form Analytics in Big Data
• Biological, Sociological, Economic and Political systems all tend to demonstrate
Complex Adaptive System (CAS) behaviour - which appears to be more similar
in nature to biological behaviour in an organism than to Disorderly, Chaotic,
Stochastic Systems (“Random” Systems). For example, the remarkable
adaptability, stability and resilience of market economies may be demonstrated by
the impact of Black Swan Events causing stock market crashes - such as oil price
shocks (1970-72) and credit supply shocks (1927- 1929 and 2008 onwards).
Unexpected and surprising Cycle Pattern changes have historically occurred
during regional and global conflicts being fuelled by technology innovation-driven
arms races - and also during US Republican administrations (Reagan and Bush -
why?). Just as advances in electron microscopy have revolutionised biology -
non-stationary time series wave-form analysis has opened up a new space for
Biological, Sociological, Economic and Political system studies and diagnostics.
• The Wigner-Gabor-Qian (WGQ) spectrogram method demonstrates a distinct
capability for identifying revealing multiple and complex superimposed cycles or
waves within dynamic, noisy and chaotic time-series data sets – without the need
for using repetitive individual wave-form estimation and elimination techniques.
The Temporal Wave
• The Temporal Wave is a novel and innovative method for Visual Modelling and Exploration
of Geospatial “Big Data” - simultaneously within a Time (history) and Space (geographic)
context. The problems encountered in exploring and analysing vast volumes of spatial–
temporal information in today's data-rich landscape – are becoming increasingly difficult to
manage effectively. In order to overcome the problem of data volume and scale in a Time
(history) and Space (location) context requires not only traditional location–space and
attribute–space analysis common in GIS Mapping and Spatial Analysis - but now with the
additional dimension of time–space analysis. The Temporal Wave supports a new method
of Visual Exploration for Geospatial (location) data within a Temporal (timeline) context.
• This time-visualisation approach integrates Geospatial (location) data within a Temporal
(timeline) data along with data visualisation techniques - thus improving accessibility,
exploration and analysis of the huge amounts of geo-spatial data used to support geo-
visual “Big Data” analytics. The temporal wave combines the strengths of both linear
timeline and cyclical wave-form analysis – and is able to represent data both within a Time
(history) and Space (geographic) context simultaneously – and even at different levels of
granularity. Linear and cyclic trends in space-time data may be represented in combination
with other graphic representations typical for location–space and attribute–space data-
types. The Temporal Wave can be used in roles as a time–space data reference system,
as a time–space continuum representation tool, and as time–space interaction tool.

Digital Healthcare – Technical Appendices

The Digital Enterprise
Digital Technology • The term Digital Technologies is used to describe the exploitation of digital resources in order to
discover, analyse, create, exploit, communicate and consume useful information within a digital context. This encompasses the use of various Smart Devices and Smart Apps, Next Generation Network (NGN) Digital Communication Architectures, web 2.0 and mobile programming tools and utilities, mobile and digital media e-business / e-commerce platforms, and mobile and digital media software applications: -
• Cloud Services
– Secure Mobile Payments / On-line Gaming / Digital Marketing / Automatic Trading
– Automatic Data – Machine-generated Data for Remote Sensing, Monitoring and Control
• Mobile – Smart Devices, Smart Apps, Apps Shops and the Smart Grid
• Social Media Applications – FaceBook, LinkedIn, MySpace, Spotify, Twitter, U-Tube, WhatsApp
• Digital and Social Customer Relationship Management – eCRM and sCRM
• Multi-channel Retail – Home Shopping, e-commerce and e-business platforms
• Next Generation Network (NGN) Digital Communication Architectures – 4G, Wifi
• Next Generation Enterprise (NGE) – Digital Enterprise Target Operating Models (eTOM)
• Big Data – Discovery of hidden relationships between data items in vast aggregated data sets
• Fast Data – Data Warehouse Engines, Data Marts, Data Mining, Real-time / Predictive Analytics
• Smart Buildings – Security, Environment Control, Smart Energy, Multimedia/Entertainment Automation


SMAC – Social, Mobile, Analytics, Cloud
OVERVIEW
• While Social, Mobile, Analytics and Cloud technologies add a new dimension
to the Telco 2.0 business operating model and technology landscape, to fully
maximize their value - consider the whole to be greater than sum of its parts.....
• The formula for the Future of Work is centred around SMAC - Social, Mobile,
Analytics and Cloud – integrated on a single technology stack, where every
function enables all of the others to maximize their cumulative impact. This is the
foundation of a new Enterprise Architecture model delivering Digital Technology
that supports an organization that is fully integrated in real-time – and is thus
more lean, agile, connected, collaborative productive and customer-focussed.
SMAC – Social, Mobile, Analytics, Cloud
• Social Media, Virtual Communities, Digital Ecosystems
• Mobile Communication Platforms / Smart Devices / Smart Apps
• Analytics / Data Science / Big Data / Hadoop / SSDs / GPUs
• Cloud Services Platforms

MOBILE ENTERPRISE (MEAP’s) - Vendors & Technologies

SMAC – Smart, Mobile, Analytics, Cloud
• Today’s SMAC Stack™ - ‘the fifth wave’ of IT architecture - is happening faster
than anything that has ever come before. By 2020, as many as 30 billion fixed
devices will be connected to the internet and 70 billion mobile computing devices
will be connected to the Cloud. Enterprises will be managing 50 times the amount
of data than they do currently. So SMAC will have a multiplying effect on
businesses and increase productivity across the organization – whilst placing a
massive burden on Service Providers of future Digital Communications
Technology Stacks, Platforms and Architectures.
THE SMAC EFFECT
• In all Industries across the business landscape, the SMAC Stack™ is eroding the
century-old blueprint of value chains and spawning new, highly distributed, digital
business models, social networks, virtual communities and digital ecosystems.
The power of SMAC technology platforms is released by treating SMAC as an
integrated digital stack – as core components combine to create a massive
multiplying effect when they are integrated and deployed together.

Chart showing the growth of Smart-phones as compared to PCs. This remarkable trend has got all of the PC
manufacturers worried - they are all looking into transitioning into the manufacture of Smart-phones, PDAs and
Tablets. Now is the time to enter the Digital Enterprise and Mobile Platform marketplace - before its too late,,,,,
The Mobile Enterprise – Outlook for 2015

• CONVERTING DATA STREAMS INTO REVENUE STREAMS • SMAC Digital Technologies • describes the use of digital resources in order to discover, analyse, create, exploit, communicate and consume useful information within a digital context. This encompasses the deployment of Enterprise 2.0 Target Operating Model (eTOM) and development of Smart Devices and Smart Apps, Next Generation Network (NGN) Mobile Communication Architectures (4G / LTE), Analytics, Data Science and Big Data supported by Cloud Computing and integrated with Network API Services for access by OTT Business Partners, Value-added Service Providers (VARs) and other 3rd Party consumer platforms. Data sources include the following: - • Transactional Data Streams from Business Systems • Energy Consumption Data from Smart Metering Systems • SCADA and Environmental Control Data from Smart Buildings • Vehicle Telemetry Data from Passenger and Transport Vehicles • Market Data Streams – Financial, Energy and Commodities Markets • G-Cloud – NHS Communications Spine, Local and National Systems • Cable and Satellite Home Entertainment Systems – Channel Selection Data • Call Detail Records (CDRs) from Telco Mediation, Rating and Billing Systems • Machine-generated data from Computer-aided Design and Manufacturing Systems • Internet Browsers, Social Media and Search Engines – User Site Navigation and Content Data • Biomedical Data Streaming – Smart Hospitals / Care in the Community / Assisted Living @ Home • Other internet click-streams – Social Media, Google Analytics, RSS News / Market Data Feeds
• Geo-demographic techniques are frequently used in order to profile and segment population segments or clusters by ‘natural’ groupings - common behavioural traits, Epidemiology, Clinical Trial, Morbidity or Actuarial outcomes, along with many other shared characteristics and common factors – in order to discover and explore previously unknown, concealed or unrecognised patterns, trends and data relationships.
SMAC – Smart, Mobile, Analytics, Cloud

From sports to scientific research, a surprising range of industries will begin to find value in big data.....

Hadoop Clustering and Managing Data.....
Managing Data Transfers in Networked Computer Clusters using Orchestra
To illustrate I/O Bottlenecks, we studied Data Transfer impact in two clustered computing systems: -
Hadoop - using trace from a 3000-node cluster at Facebook
Spark a MapReduce-like framework with iterative machine learning + graph algorithms.
Mosharaf Chowdhury, Matei Zaharia, Justin Ma, Michael I. Jordan, Ion Stoica
University of California, Berkeley
{mosharaf, matei, jtma, jordan, istoica}@cs.berkeley.edu

Hadoop Framework
• The workhorse relational database has been the tool of choice for businesses for well over 20 years now. Challengers have come and gone but the trusty RDBMS is the foundation of almost all enterprise systems today. This includes almost all transactional and data warehousing systems. The RDBMS has earned its place as a proven model that, despite some quirks, is fundamental to the very integrity and operational success of IT systems around the world.
• The relational database is finally showing some signs of age as data volumes and network speeds grow faster than the computer industry's present compliance with Moore's Law can keep pace with. The Web in particular is driving innovation in new ways of processing information as the data footprints of Internet-scale applications become prohibitive using traditional SQL database engines.
• When it comes to database processing today, change is being driven by (at least) four factors:
– Speed. The seek times of physical storage is not keeping pace with improvements in network speeds.
– Scale. The difficulty of scaling the RDBMS out efficiently (i.e. clustering beyond a handful of servers is notoriously hard.)
– Integration. Today's data processing tasks increasingly have to access and combine data from many different non-relational sources, often over a network.
– Volume. Data volumes have grown from tens of gigabytes in the 1990s to hundreds of terabytes and often petabytes in recent years.
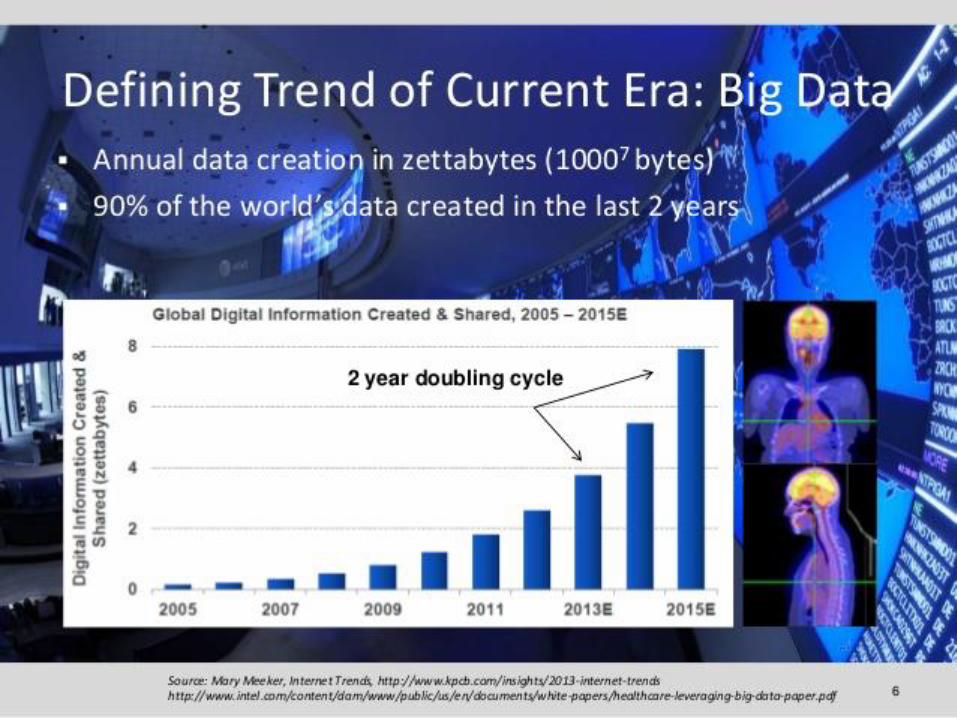

RDBMS and Hadoop: Apples and Oranges?
• Below is Figure 1 - a comparison of the overall differences between
Database RDBMS and MapReduce-based systems such as Hadoop
• From this it's clear that the MapReduce model cannot replace the
traditional enterprise RDBMS. However, it can be a key enabler of a
number of interesting scenarios that can considerably increase
flexibility, turn-around times, and the ability to tackle problems that
weren't possible before.
• With Database RDBMS platforms, SQL-based processing of data sets
tends to fall away and not scale linearly after a specific volume ceiling,
usually just a handful of nodes in a cluster. With MapReduce, you can
consistently obtain performance gains by increasing the size of the
cluster. In other words, double the size of Hadoop cluster and a job will
run twice as fast - quadruple it will rub four times faster - its the same
linear relationship, irrespective of data volume and throughput.
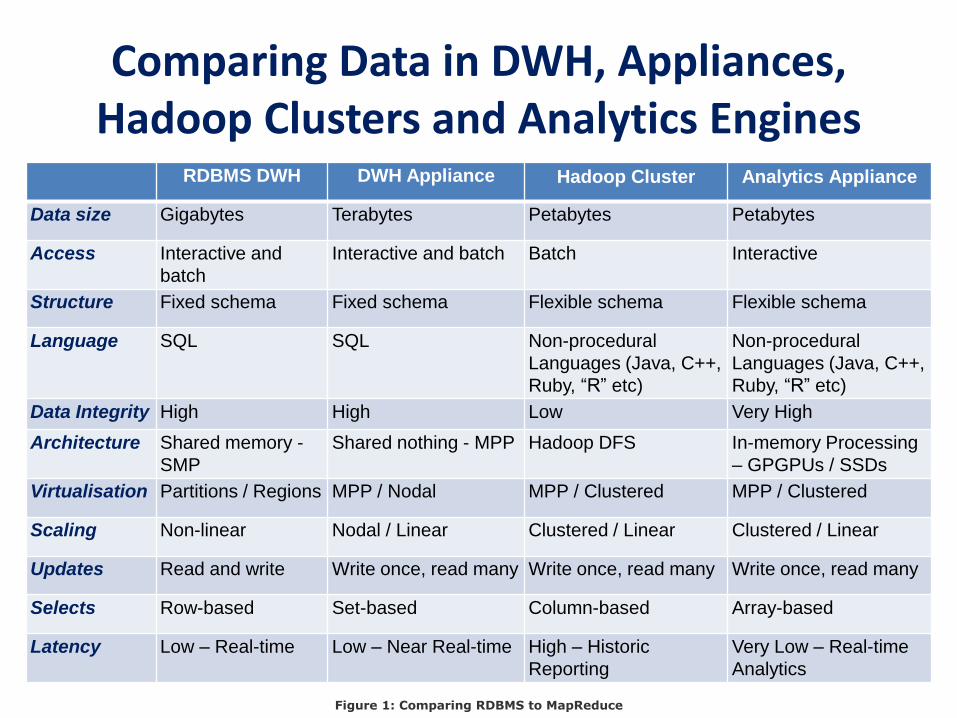
Comparing Data in DWH, Appliances, Hadoop Clusters and Analytics Engines
RDBMS DWH DWH Appliance Hadoop Cluster Analytics Appliance
Data size Gigabytes Terabytes Petabytes Petabytes
Access Interactive and
batch
Interactive and batch Batch Interactive
Structure Fixed schema Fixed schema Flexible schema Flexible schema
Language SQL SQL Non-procedural
Languages (Java, C++,
Ruby, “R” etc)
Non-procedural
Languages (Java, C++,
Ruby, “R” etc)
Data Integrity High High Low Very High
Architecture Shared memory -
SMP
Shared nothing - MPP Hadoop DFS In-memory Processing
– GPGPUs / SSDs
Virtualisation Partitions / Regions MPP / Nodal MPP / Clustered MPP / Clustered
Scaling Non-linear Nodal / Linear Clustered / Linear Clustered / Linear
Updates Read and write Write once, read many Write once, read many Write once, read many
Selects Row-based Set-based Column-based Array-based
Latency Low – Real-time Low – Near Real-time High – Historic
Reporting
Very Low – Real-time
Analytics
Figure 1: Comparing RDBMS to MapReduce

Hadoop Framework
• These datasets would previously have been very challenging and expensive to take on with a traditional RDBMS using standard bulk load and ETL approaches. Never mind trying to efficiently combining multiple data sources simultaneously or dealing with volumes of data that simply can't reside on any single machine (or often even dozens). Hadoop deals with this by using a distributed file system (HDFS) that's designed to deal coherently with datasets that can only reside across distributed server farms. HDFS is also fault resilient and so doesn't impose the overhead of RAID drives and mirroring on individual nodes in a Hadoop compute cluster, allowing the use of truly low cost commodity hardware.
• So what does this specifically mean to enterprise users that would like to improve their data processing capabilities? Well, first there are some catches to be aware of. Despite enormous strengths in distributed data processing and analysis, MapReduce is not good in some key areas that the RDMS is extremely strong in (and vice versa). The MapReduce approach tends to have high latency (i.e. not suitable for real-time transactions) compared to relational databases and is strongest at processing large volumes of write-once data where most of the dataset needs to be processed at one time. The RDBMS excels at point queries and updates, while MapReduce is best when data is written once and read many times.
• The story is the same with structured data, where the RDBMS and the rules of database normalization identified precise laws for preserving the integrity of structured data and which have stood the test of time. MapReduce is designed for a less structured, more federated world where schemas may be used but data formats can be much looser and freeform.
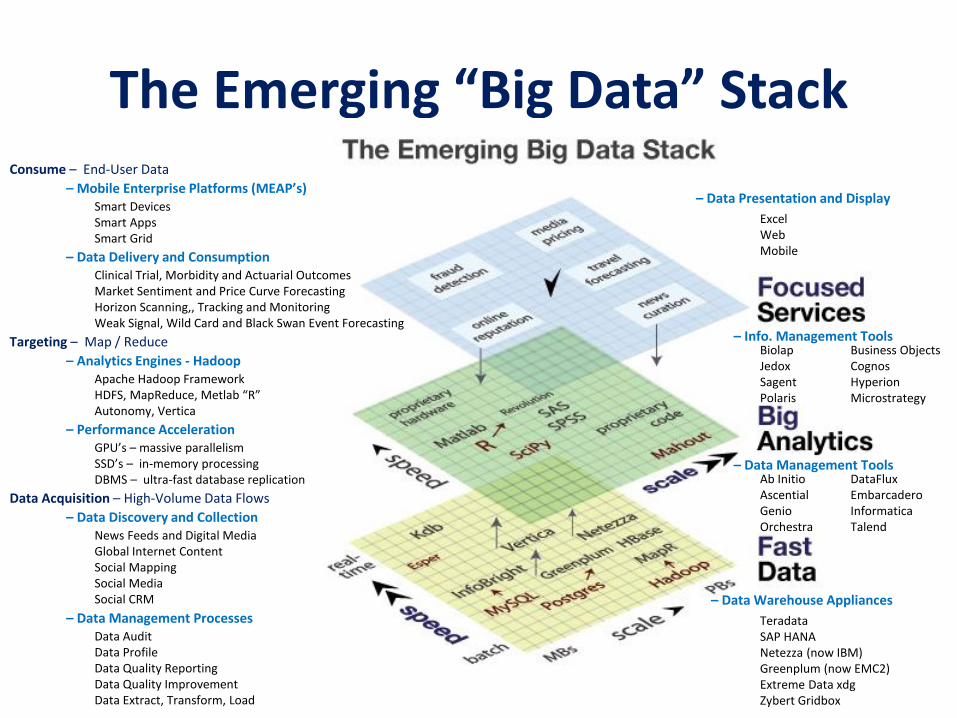
The Emerging “Big Data” Stack
Targeting – Map / Reduce
Consume – End-User Data
Data Acquisition – High-Volume Data Flows
– Mobile Enterprise Platforms (MEAP’s)
Apache Hadoop Framework HDFS, MapReduce, Metlab “R” Autonomy, Vertica
Smart Devices Smart Apps Smart Grid
Clinical Trial, Morbidity and Actuarial Outcomes Market Sentiment and Price Curve Forecasting Horizon Scanning,, Tracking and Monitoring Weak Signal, Wild Card and Black Swan Event Forecasting
– Data Delivery and Consumption
News Feeds and Digital Media Global Internet Content Social Mapping Social Media Social CRM
– Data Discovery and Collection
– Analytics Engines - Hadoop
– Data Presentation and Display
Excel Web Mobile
– Data Management Processes Data Audit Data Profile Data Quality Reporting Data Quality Improvement Data Extract, Transform, Load
– Performance Acceleration GPU’s – massive parallelism SSD’s – in-memory processing DBMS – ultra-fast database replication
– Data Management Tools DataFlux Embarcadero Informatica Talend
– Info. Management Tools Business Objects Cognos Hyperion Microstrategy
Biolap Jedox Sagent Polaris
Teradata SAP HANA Netezza (now IBM) Greenplum (now EMC2) Extreme Data xdg Zybert Gridbox
– Data Warehouse Appliances
Ab Initio Ascential Genio Orchestra


Hadoop Framework
• Each of these factors is presently driving interest in alternatives that are significantly better at dealing with these requirements. I'll be clear here: The relational database has proven to be incredibly versatile and is the right tool for the majority of business needs today. However, the edge cases for many large-scale business applications are moving out into areas where the RDBMS is often not the strongest option. One of the most discussed new alternatives at the moment is Hadoop, a popular open source implementation of MapReduce. MapReduce is a simple yet very powerful method for processing and analyzing extremely large data sets, even up to the multi-petabyte level. At its most basic, MapReduce is a process for combining data from multiple inputs (creating the "map"), and then reducing it using a supplied function that will distill and extract the desired results. It was originally invented by engineers at Google to deal with the building of production search indexes. The MapReduce technique has since spilled over into other disciplines that process vast quantities of information including science, industry, and systems management. For its part, Hadoop has become the leading implementation of MapReduce.
• While there are many non-relational database approaches out there today (see my emerging IT and business topics post for a list), nothing currently matches Hadoop for the amount of attention it's receiving or the concrete results that are being reported in recent case studies. A quick look at thelist of organizations that have applications powered by Hadoop includes Yahoo! with over 25,000 nodes (including a single, massive 4,000 node cluster), Quantcast which says it has over 3,000 cores running Hadoop and currently processes over 1PB of data per day, and Adknowledge who uses Hadoop to process over 500 million clickstream events daily using up to 200 nodes

HP HAVEn Big Data Platform

Informatica / Hortonworks Vibe

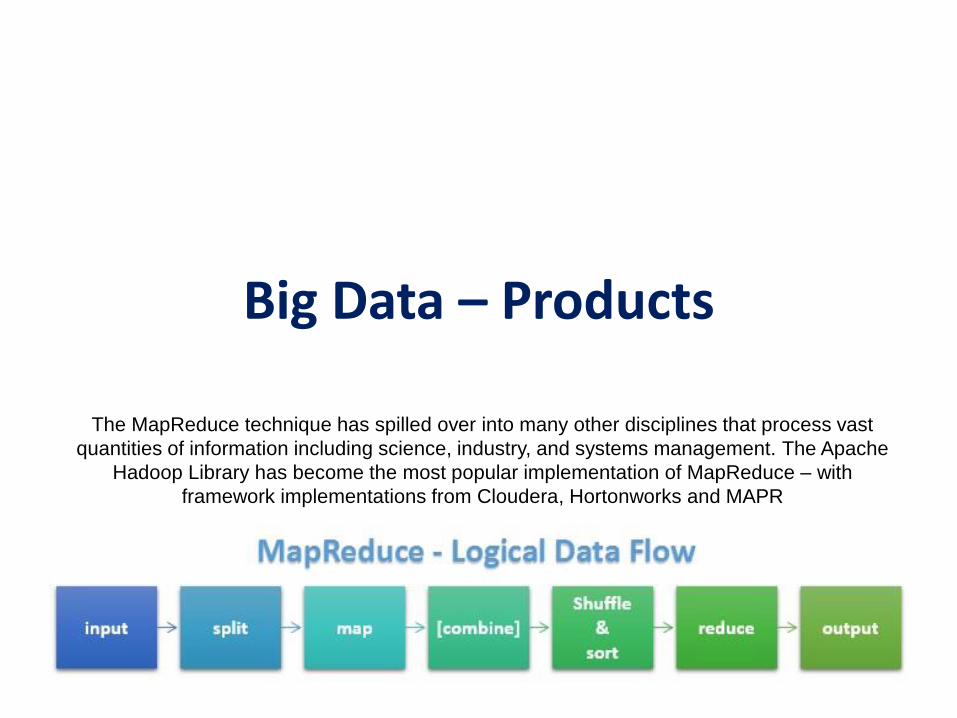
Big Data – Products
The MapReduce technique has spilled over into many other disciplines that process vast
quantities of information including science, industry, and systems management. The Apache
Hadoop Library has become the most popular implementation of MapReduce – with
framework implementations from Cloudera, Hortonworks and MAPR

Split-Map-Shuffle-Reduce Process
Big Data Consumers
Split Map Shuffle Reduce
Key / Value Pairs Actionable Insights Data Provisioning Raw Data

Apache Hadoop Component Stack
HDFS
MapReduce
Pig
Zookeeper
Hive
HBase
Oozie
Mahoot
Hadoop Distributed File System (HDFS)
Scalable Data Applications Framework
Procedural Language – abstracts low-level MapReduce operators
High-reliability distributed cluster co-ordination
Structured Data Access Management
Hadoop Database Management System
Job Management and Data Flow Co-ordination
Scalable Knowledge-base Framework

Data Management Component Stack
Informatica
Drill
Millwheel
Informatica Big Data Edition / Vibe Data Stream
Data Analysis Framework
Data Analytics on-the-fly + Extract – Transform – Load Framework
Flume
Sqoop
Scribe
Extract – Transform - Load
Extract – Transform - Load
Extract – Transform - Load
Talend Extract – Transform - Load
Pentaho Extract – Transform – Load Framework + Data Reporting on-the-fly

Big Data Storage Platforms
Autonomy
Vertica
MongoDB
HP Unstructured Data DBMS
HP Columnar DBMS
High-availability DBMS
CouchDB Couchbase Database Server for Big Data with NoSQL / Hadoop
Integration
Pivotal Pivotal Big Data Suite – GreenPlum, GemFire, SQLFire, HAWQ
Cassandra Cassandra Distributed Database for Big Data with NoSQL and
Hadoop Integration
NoSQL NoSQL Database for Oracle, SQL/Server, Couchbase etc.
Riak Basho Technologies Riak Big Data DBMS with NoSQL / Hadoop
Integration
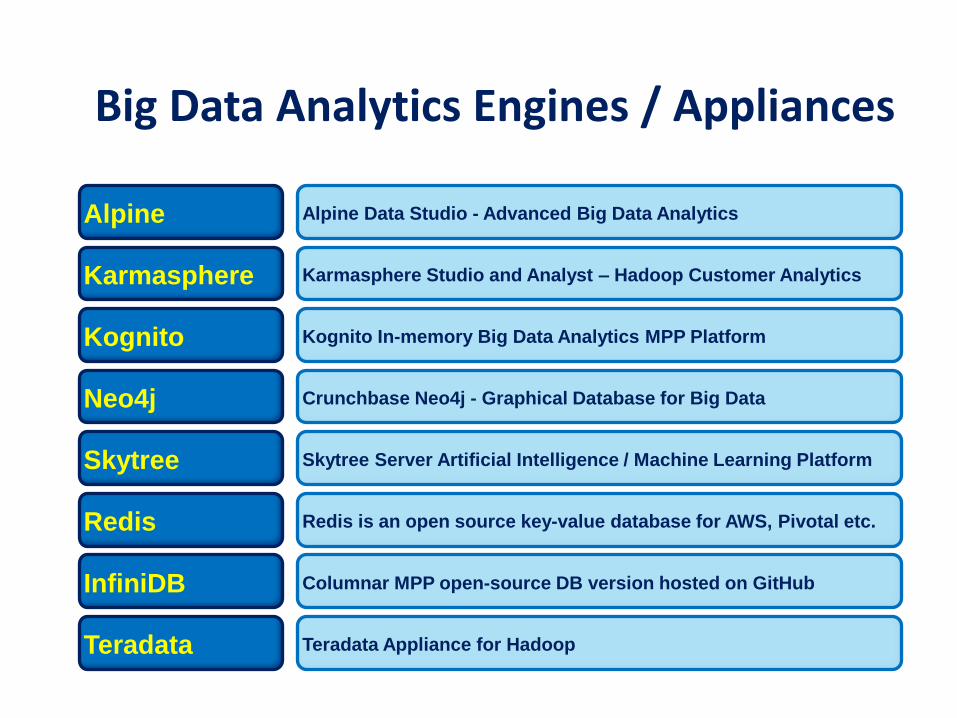
Big Data Analytics Engines and Appliances
Alpine
Karmasphere
Kognito
Alpine Data Studio - Advanced Big Data Analytics
Karmasphere Studio and Analyst – Hadoop Customer Analytics
Kognito In-memory Big Data Analytics MPP Platform
Skytree
Redis
Skytree Server Artificial Intelligence / Machine Learning Platform
Redis is an open source key-value database for AWS, Pivotal etc.
Teradata Teradata Appliance for Hadoop
Neo4j Crunchbase Neo4j - Graphical Database for Big Data
InfiniDB Columnar MPP open-source DB version hosted on GitHub
Big Data Analytics Engines / Appliances

Big Data Analytics and Visualisation Platforms
Tableaux Tableaux - Big Data Visualisation Engine
Eclipse Symentec Eclipse - Big Data Visualisation
Mathematica Mathematical Expressions and Algorithms
StatGraphics Statistical Expressions and Algorithms
FastStats Numerical computation, visualization and programming toolset
MatLab
R
Data Acquisition and Analysis Application Development Toolkit
“R” Statistical Programming / Algorithm Language
Revolution Revolution Analytics Framework and Library for “R”
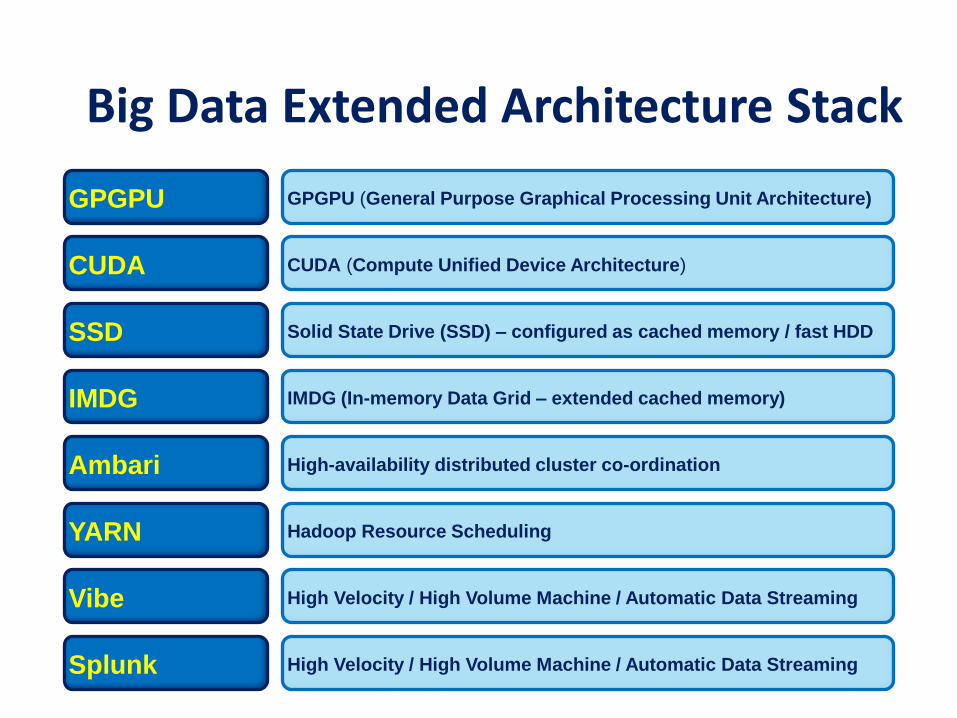
Hadoop / Big Data Extended Infrastructure Stack
SSD Solid State Drive (SSD) – configured as cached memory / fast HDD
CUDA CUDA (Compute Unified Device Architecture)
GPGPU GPGPU (General Purpose Graphical Processing Unit Architecture)
IMDG IMDG (In-memory Data Grid – extended cached memory)
Vibe
Splunk
High Velocity / High Volume Machine / Automatic Data Streaming
High Velocity / High Volume Machine / Automatic Data Streaming
Ambari High-availability distributed cluster co-ordination
YARN Hadoop Resource Scheduling
Big Data Extended Architecture Stack

Cloud-based Big-Data-as-a-Service and Analytics
AWS Amazon Web Services (AWS) – Big Data-as-a-Service (BDaaS)
Elastic Compute Cloud (ECC) and Simple Storage Service (S3)
1010 Data Big Data Discovery, Visualisation and Sharing Cloud Platform
SAP HANA SAP HANA Cloud - In-memory Big Data Analytics Appliance
Azure Microsoft Azure Data-as-a-Service (DaaS) and Analytics
Anomaly 42 Anomaly 42 Smart-Data-as-a-Service (SDaaS) and Analytics
Workday Workday Big-Data-as-a-Service (BDaaS) and Analytics
Google Cloud Google Cloud Platform – Cloud Storage, Compute Platform,
Firebrand API Resource Framework
Apigee Apigee API Resource Framework

Gartner Magic Quadrant for BI and Analytics Platforms

Hadoop Framework Distributions
FEATURE Hortonworks Cloudera MAPR Pivotal
Open Source Hadoop Library Yes Yes Yes Pivotal HD
Support Yes Yes Yes Yes
Professional Services Yes Yes Yes Yes
Catalogue Extensions Yes Yes Yes Yes
Management Extensions Yes Yes Yes
Architecture Extensions Yes Yes
Infrastructure Extensions Yes Yes
Library
Support
Services
Catalogue
Job Management
Library
Support
Services
Catalogue
Hortonworks Cloudera MAPR
Library
Support
Services
Catalogue
Job Management
Resilience
High Availability
Performance
Pivotal
Library
Support
Services
Catalogue
Job Management
Resilience
High Availability
Performance

Gartner Magic Quadrant for BI

Data Warehouse Appliance / Real-time Analytics Engine Price Comparison
Manufacturer Server
Configuration Cached Memory
Server
Type
Software
Platform Cost (est.)
SAP HANA
(BO BW)
32-node (4
Channels x 8 CPU)
1.3 Terabytes
SMP Proprietary $ 6,000,,000
Teradata 20-node (2
Channels x 10 CPU)
1 Terabyte
MPP Proprietary $ 1,000,000
Netezza
(now IBM)
20-node (2
Channels x 10 CPU)
1 Terabyte
MPP Proprietary $ 180,000
IBM ex5 (non-HANA
configuration)
32-node (4
Channels x 8 CPU)
1.3 Terabytes
SMP Proprietary $ 120,000
Greenplum (now
Pivotal)
20-node (2
Channels x 10 CPU)
1 Terabyte
MPP Open Source $ 20,000
XtremeData xdb 20-node (2
Channels x 10 CPU)
1 Terabyte
MPP Open Source $ 18,000
Zybert Gridbox 48-node (4
Channels x 12 CPU)
20 Terabytes
SMP Open Source $ 60,000

Risk Research Philosophies and
Investigative Methods • This section aims to discuss Risk Research Philosophies in detail, in order to develop
a general awareness and understanding of the options - and to describe a rigorous
approach to Research Methods and Scope as a mandatory precursor to the full
Research Design. Denzin and Lincoln (2003) and Kvale (1996) highlight how
different Research Philosophies can result in much tension amongst stakeholders.
• When undertaking any research of either a Scientific or Humanistic nature, it is most
important to consider, compare and contrast all of the varied and diverse Research
Philosophies and Paradigms that are available to the researcher and supervisor -
along with their respective treatments of ontology and epistemology issues.
• Since Research Philosophies and paradigms often describe dogma, perceptions,
beliefs and assumptions about the nature of reality and truth (and knowledge of that
reality) - they can radically influence the way in which the research is undertaken,
from design through to outcomes and conclusions. It is important to understand and
discuss these contrasting aspects in order that approaches congruent to the nature
and aims of the particular study or inquiry in question, are adopted - and to ensure
that researcher and supervisor biases are understood, exposed, and mitigated.

Risk Research Methods
• When undertaking any research of either a Scientific or Humanistic nature, it is most important for the researcher and supervisor to consider, compare and contrast all of the varied and diverse Research Philosophies and Paradigms, Data Analysis Methods and Techniques available - along with the express implications of their treatment of ontology and epistemology issues....,

Risk Research
• Traditional approaches to risk studies and risk management are based upon the
paradigm of risk as an event adequately characterised by a single feature. This
simplistic conceptualisation of risk leads to the use of analysis tools and models
which do not reliably integrate qualitative and quantitative information or model the
interconnectivity of the dynamic behaviour of risks. For complex systems, like an
economy or financial organisations, a new paradigm or philosophy is required to
understand how the constituent parts interact to create behaviours not predictable
from the ‘sum of the parts’. Systems theory provides a more robust conceptual
framework which views risk as an emerging property arising from the complex and
adaptive interactions which occur within companies, sectors and economies.
• Risk appetite is a concept that many practitioners find confusing and hard to
implement. The fundamental problem is that there is no common measure for all
risks, and it is not always clear how different risk factors should be limited in order to
remain within an overall “appetite”. Attempts are generally made to force everything
into an impact on profit or capital but this is problematic when businesses and risk
decisions become more complex. There is a lack of real understanding about how
they would propagate, or indeed how the appetite may shift or evolve to have a
preference for specific risks.

Risk Research
• By thinking holistically, risk appetite can be viewed as “our comfort and preference for
accepting a series of interconnected uncertainties related to achieving our strategic
goals”. By making those uncertainties and the connectivity of the underlying drivers
explicit, it is possible for decision makers to define their risk appetite and monitor
performance against it more effectively. The ability to link multiple factors back to
financial outcomes also makes the challenge of expressing risk appetite in those
terms more tractable.
• Similarly, the identification and assessment of emerging risks can become more
robust by using a systems approach that enables a clearer understanding of the
underlying dynamics that exist between the key factors of the risks themselves. It is
possible to identify interactions in a system that may propagate hitherto unseen risks.
Emerging risks can be viewed as evolving risks from a complex system. It is also
known that such systems exhibit signals in advance of an observable change in
overall performance. Knowing how to spot and interpret those signs is the key to
building a scientific and robust emerging risk process. Also it is becoming increasingly
clear that risk appetite and emerging risks are interconnected in numerous complex
relationships over many layers.

Risk Research
• Assuming that strategic goals are already identified, establishing a risk appetite framework
comprises two distinct parts, one top down and the other bottom up. First, it is necessary
to describe how much uncertainty about the achievement of specific business goals is
acceptable, and what the key sources of that uncertainty are. Second, it is necessary to
identify the key operational activities or actions which contribute towards each source of
uncertainty and then apply the necessary limits to those activities to maintain performance
within the desired risk appetite.
• Systems techniques used in the case study proved extremely effective at helping
businesses to explain their understanding of how uncertainty arises around their business
goals. Cognitive mapping was used to elicit a robust understanding of the business
dynamics creating uncertainty in business goals. This process was useful for engaging the
business and capturing their collective knowledge of the risk appetite problem.
• By carrying out a mathematically based analysis on the cognitive maps it is possible to
quickly and objectively identify which parts of the description are most important in driving
explaining the uncertainties we are attempting to constrain. It also highlights areas which
have not been particularly well described or understood, prompting further discussion and
analysis. This provides a hypothesis for our risk appetite, and associated limit, framework.

Risk Research
Bayesian Networks
• Bayesian Networks are proposed as a mechanism to provide a dynamic model of how
various risk factors connect and interact. This links the behaviour of the operational
activities to the levels of risk they produce and can be parameterised through a
combination of qualitative and quantitative data. Bayesian Networks permit evidence
to propagate up and down the model, providing the business with a robust method for
determining risk limits by setting the level of risk to be at the risk appetite point and
observing what level the limits should be to ensure compliance with this level of risk.
• Alternatively, the observed indicator values can be entered and the implied level of
risk is computed. Making this linkage explicit provides a mechanism for companies to
understand more immediately where their risk exposure is coming from and how to
control it.
Risk = Impact x Probability

Risk Complexity Map

Enterprise Risk Management
Avoid / Mitigate
Discover
Prioritise
Evaluate
Scan and Identify
Track and Monitor Investigate and Research
Publish and Socialise
Risk Register and Balance Sheet Provisioning
Threat Categories and Risk Analysis
Risk Avoidance and Mitigation
Risk Scenarios and Impact Analysis
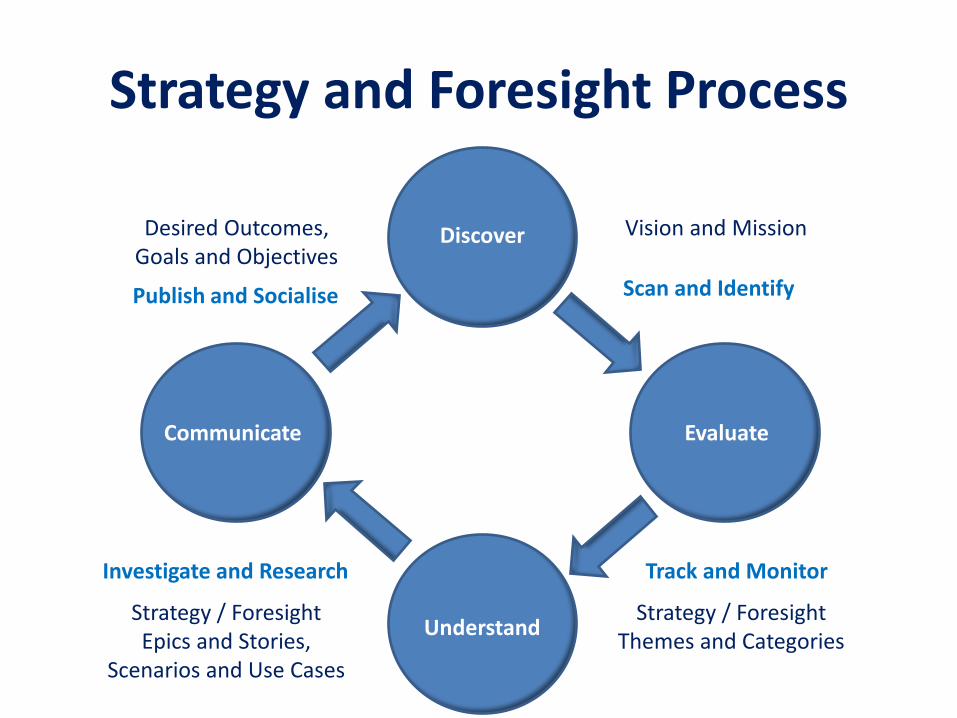
Strategy and Foresight Process
Communicate
Discover
Understand
Evaluate
Scan and Identify
Track and Monitor Investigate and Research
Publish and Socialise
Desired Outcomes, Goals and Objectives
Vision and Mission
Strategy / Foresight Epics and Stories,
Scenarios and Use Cases
Strategy / Foresight Themes and Categories

Horizon Scanning
Publish and
Socialise
Investigate and
Research
Scan and Identify
Track and Monitor
Communicate Discover
Understand Evaluate
Horizon Scanning – Human Activity
Environment Scanning – Natural Phenomena

Horizon Scanning, Tracking and Monitoring
Disease / Pandemics
Horizon Scanning
Geo-political Shock Wave
Socio-Demographic Shock Wave
Economic Shock Wave
Technology Shock Wave
Ecological Shock Wave
Biomedical Shock Wave
Environment Shock Wave
Climate Shock Wave
Culture Change
Climate Change
Innovation
Money Supply / Commodity Price / Sovereign Default
War, Terrorism, Revolution
Population Curves / Extinction Human Activity / Natural Disasters
Horizon Scanning
Environment Scanning
Human Activity
Natural Phenomena
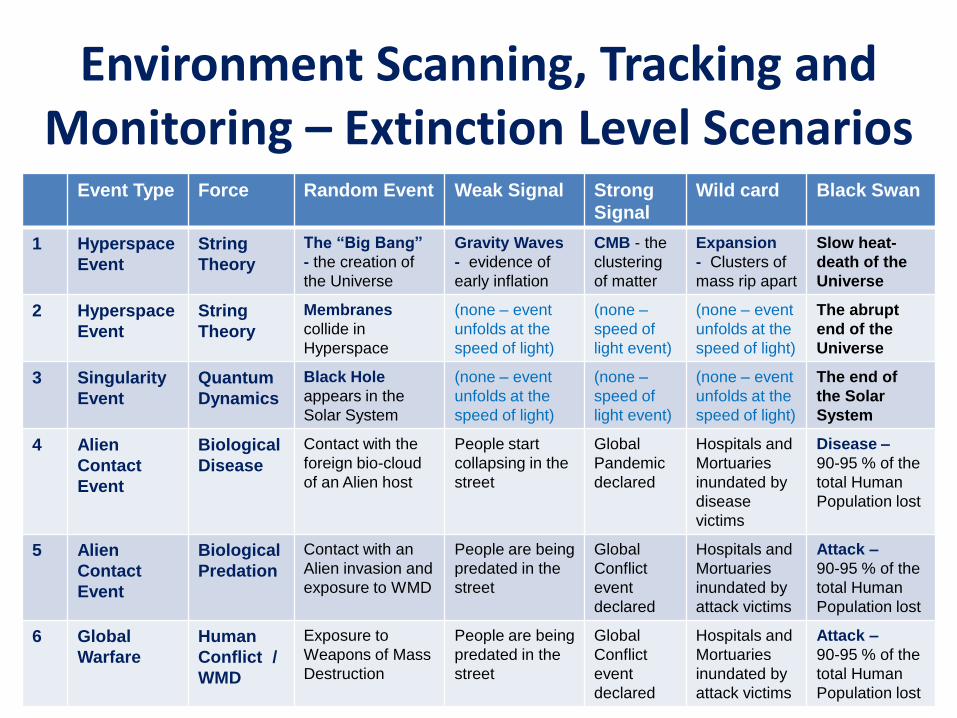
Environment Scanning, Tracking and Monitoring – Extinction Level Scenarios
Event Type Force Random Event Weak Signal Strong
Signal
Wild card Black Swan
1 Hyperspace
Event
String
Theory
The “Big Bang”
- the creation of
the Universe
Gravity Waves
- evidence of
early inflation
CMB - the
clustering
of matter
Expansion
- Clusters of
mass rip apart
Slow heat-
death of the
Universe
2 Hyperspace
Event
String
Theory
Membranes
collide in
Hyperspace
(none – event
unfolds at the
speed of light)
(none –
speed of
light event)
(none – event
unfolds at the
speed of light)
The abrupt
end of the
Universe
3 Singularity
Event
Quantum
Dynamics
Black Hole
appears in the
Solar System
(none – event
unfolds at the
speed of light)
(none –
speed of
light event)
(none – event
unfolds at the
speed of light)
The end of
the Solar
System
4 Alien
Contact
Event
Biological
Disease
Contact with the
foreign bio-cloud
of an Alien host
People start
collapsing in the
street
Global
Pandemic
declared
Hospitals and
Mortuaries
inundated by
disease
victims
Disease –
90-95 % of the
total Human
Population lost
5 Alien
Contact
Event
Biological
Predation
Contact with an
Alien invasion and
exposure to WMD
People are being
predated in the
street
Global
Conflict
event
declared
Hospitals and
Mortuaries
inundated by
attack victims
Attack –
90-95 % of the
total Human
Population lost
6 Global
Warfare
Human
Conflict /
WMD
Exposure to
Weapons of Mass
Destruction
People are being
predated in the
street
Global
Conflict
event
declared
Hospitals and
Mortuaries
inundated by
attack victims
Attack –
90-95 % of the
total Human
Population lost

Weak Signals and Wild Cards
Publish and
Socialise
Investigate and
Research
Scan and Identify
Track and Monitor
Communicate Discover
Understand Evaluate
Random Event
Strong Signal
Weak Signal
Wild Card

Scenario Planning and Impact Analysis
• Scenario Planning and Impact Analysis is the archetypical method for futures studies
because it embodies the central principles of the discipline:
– The future is uncertain - so we must prepare for a wide range of possible, probable
and alternative futures, not just the future that we desire (or hope) will happen.....
– It is vitally important that we think deeply and creatively about the future, else we run
the risk of being either unprepared for, or surprised by events – or even both.....
• Scenarios contain the stories of these multiple futures - from the Utopian to the Dystopian,
from the preferred to the expected, from the Wild Card to the Black Swan - in forms which
are analytically coherent and imaginatively engaging. A good scenario grabs our attention
and says, ‘‘Take a good look at this future. This could be your future - are you prepared ?’’
• As consultants and organizations have come to recognize the value of scenarios, they
have also latched onto one scenario technique – a very good one in fact – as the default
for all their scenario work. That technique is the Royal Dutch Shell / Global Business
Network (GBN) matrix approach, created by Pierre Wack in the 1970s and popularized by
Schwartz (1991) in the Art of the Long View and Van der Heijden (1996) in Scenarios: The
Art of Strategic Conversations. In fact, Millett (2003, p. 18) calls it the ‘‘gold standard of
corporate scenario generation.’’

Scenario Planning and Impact Analysis
Published Scenarios
Evaluated Scenarios
Monte Carlo
Simulation
Discovered Scenarios
Communicate Discover
Understand Evaluate
Non-linear Models
Cluster Analysis
Profile Analysis
Impact Analysis
SCENARIO

From sports to scientific research, a surprising range of industries will begin to find value in big data.....

4D Geospatial Analytics • The profiling and analysis of
large aggregated datasets in
order to determine a ‘natural’
structure of groupings provides
an important technique for many
statistical and analytic
applications. Cluster analysis
on the basis of profile similarities
or geographic distribution is a
method where no prior
assumptions are made
concerning the number of
groups or group hierarchies and
internal structure. Geo-
demographic techniques are
frequently used in order to
profile and segment populations
by ‘natural’ groupings - such as
common behavioural traits,
Clinical Trial, Morbidity or
Actuarial outcomes - along with
many other shared
characteristics and common
factors.....

4D Geospatial Analytics – The Temporal Wave
• The Temporal Wave is a novel and innovative method for Visual Modelling and Exploration
of Geospatial “Big Data” - simultaneously within a Time (history) and Space (geographic)
context. The problems encountered in exploring and analysing vast volumes of spatial–
temporal information in today's data-rich landscape – are becoming increasingly difficult to
manage effectively. In order to overcome the problem of data volume and scale in a Time
(history) and Space (location) context requires not only traditional location–space and
attribute–space analysis common in GIS Mapping and Spatial Analysis - but now with the
additional dimension of time–space analysis. The Temporal Wave supports a new method
of Visual Exploration for Geospatial (location) data within a Temporal (timeline) context.
• This time-visualisation approach integrates Geospatial (location) data within a Temporal
(timeline) data along with data visualisation techniques - thus improving accessibility,
exploration and analysis of the huge amounts of geo-spatial data used to support geo-
visual “Big Data” analytics. The temporal wave combines the strengths of both linear
timeline and cyclical wave-form analysis – and is able to represent data both within a Time
(history) and Space (geographic) context simultaneously – and even at different levels of
granularity. Linear and cyclic trends in space-time data may be represented in combination
with other graphic representations typical for location–space and attribute–space data-
types. The Temporal Wave can be used in roles as a time–space data reference system,
as a time–space continuum representation tool, and as time–space interaction tool.

4D Geospatial Analytics – London Timeline

4D Geospatial Analytics – London Timeline
• How did London evolve from its creation as a Roman city in 43AD into the crowded, chaotic cosmopolitan megacity we see today? The London Evolution Animation takes a holistic view of what has been constructed in the capital over different historical periods – what has been lost, what saved and what protected.
• Greater London covers 600 square miles. Up until the 17th century, however, the capital city was crammed largely into a single square mile which today is marked by the skyscrapers which are a feature of the financial district of the City.
• This visualisation, originally created for the Almost Lost exhibition by the Bartlett Centre for Advanced Spatial Analysis (CASA), explores the historic evolution of the city by plotting a timeline of the development of the road network - along with documented buildings and other features – through 4D geospatial analysis of a vast number of diverse geographic, archaeological and historic data sets.
• Unlike other historical cities such as Athens or Rome, with an obvious patchwork of districts from different periods, London's individual structures scheduled sites and listed buildings are in many cases constructed gradually by parts assembled during different periods. Researchers who have tried previously to locate and document archaeological structures and research historic references will know that these features, when plotted, appear scrambled up like pieces of different jigsaw puzzles – all scattered across the contemporary London cityscape.

History of Digital Epidemiology
• Doctor John Snow (15 March 1813 – 16
June 1858) was an English physician and a
leading figure in the adoption of anaesthesia
and medical hygiene. John Snow is largely
credited with sparking and pursuing a total
transformation in Public Health and epidemic
disease management and is considered one
of the fathers of modern epidemiology in part
because of his work in tracing the source of
a cholera outbreak in Soho, London, in 1854.
• John Snows’ investigation and findings into
the Broad Street cholera outbreak - which
occurred in 1854 near Broad Street in the
London district of Soho in England - inspired
fundamental changes in both the clean and
waste water systems of London, which led to
further similar changes in other cities, and a
significant improvement in understanding of
Public Health around the whole of the world.

History of Digital Epidemiology
• The Broad Street cholera outbreak of
1854 was a major cholera epidemic or
severe outbreak of cholera which
occurred in 1854 near Broad Street in
the London district of Soho in England .
• This cholera outbreak is best known for
statistical analysis and study of the
epidemic by the physician John Snow
and his discovery that cholera is spread
by contaminated water. This knowledge
drove improvement in Public Health with
mass construction of sanitation facilities
from the middle of the19th century.
• Later, the term "focus of infection" would
be used to describe factors such as the
Broad Street pump – where Social and
Environmental conditions may result in the outbreak of local infectious diseases.

History of Digital Epidemiology • It was the study of
cholera epidemics, particularly in Victorian England during the middle of the 19th century, which laid the foundation for epidemiology - the applied observation and surveillance of epidemics and the statistical analysis of public health data.
• This discovery came at a time when the miasma theory of disease transmission by noxious “foul air” prevailed in the medical community.

History of Digital Epidemiology
Modern epidemiology has its origin with the study of Cholera
Broad Street cholera outbreak of 1854

History of Digital Epidemiology
Modern epidemiology has its origin with the study of Cholera.
• It was the study of cholera epidemics, particularly in Victorian England
during the middle of the 19th century, that laid the foundation for the science
of epidemiology - the applied observation and surveillance of epidemics and
the statistical analysis of public health data. It was during a time when the
miasma theory of disease transmission prevailed in the medical community.
• John Snow is largely credited with sparking and pursuing a transformation in
Public Health and epidemic disease management from the extant paradigm
in which communicable illnesses were thought to have been carried by
bad, malodorous airs, or "miasmas“ - towards a new paradigm which would
begin to recognize that virulent contagious and infectious diseases are
communicated by various other means – such as water being polluted by
human sewage. This new approach to disease management recognised that
contagious diseases were either directly communicable through contact with
infected individuals - or via vectors of infection (water, in the case of cholera)
which are susceptible to contamination by viral and bacterial agents.

History of Digital Epidemiology • This map is John Snow’s
famous plot of the 1854 Broad Street Cholera Outbreak in London. By plotting epidemic data on a map like this, John Snow was able to identify that the outbreak was centred on a specific water pump.
• Interviews confirmed that outlying cases were from people who would regularly walk past the pump and take a drink. He removed the handle off the water pump and the outbreak ended almost overnight.
• The cause of cholera (bacteria Vibria cholerae) was unknown at the time, and Snow’s important work with cholera in London during the 1850s is considered the beginning of modern epidemiology. Some have even gone so far as to describe Snow’s Broad Street Map as the world’s first GIS.

History of Digital Epidemiology
Broad Street cholera outbreak of 1854
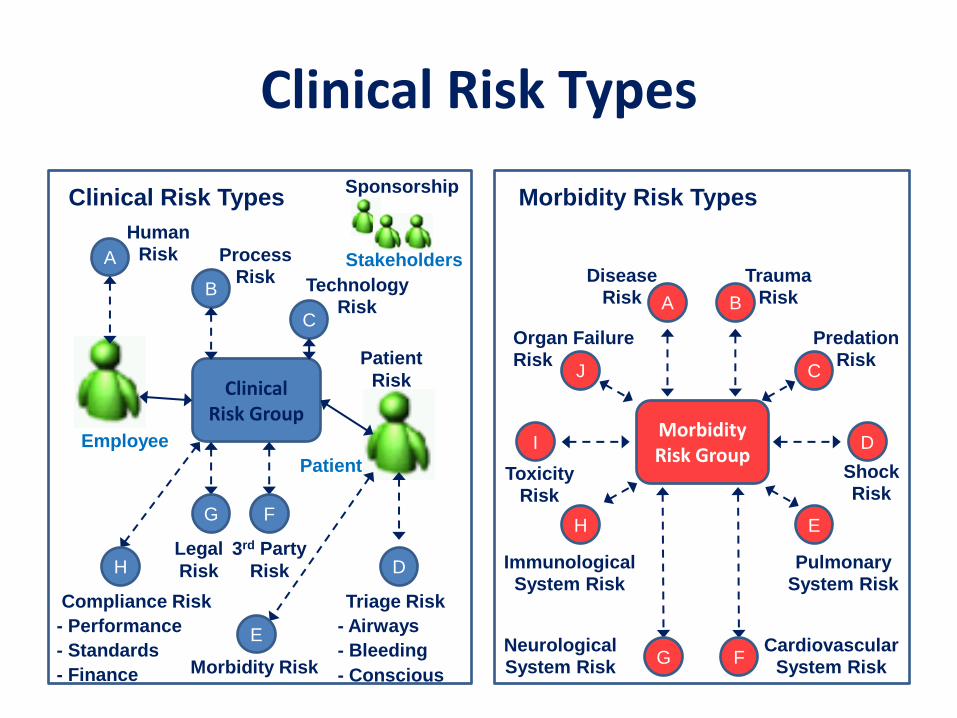
Clinical Risk Types
Clinical Risk Types
Clinical Risk Group
Employee
Patient
B
A
Human Risk Process
Risk
D
Morbidity Risk Types
Morbidity Risk Group
C
Legal Risk
F
3rd Party Risk
G
C
Technology Risk
Trauma Risk
E
Morbidity Risk
H E
J
G
A
I D
Immunological System Risk
Sponsorship
Stakeholders Disease
Risk
Shock Risk
Cardiovascular
System Risk
Pulmonary System Risk
Toxicity Risk
Organ Failure Risk
- Airways
- Conscious
- Bleeding
Triage Risk
- Performance
- Finance
- Standards
Compliance Risk
H
Patient Risk
Neurological
System Risk F
B
Predation Risk

Risk Complexity Map
• Case Study • Pandemics

• Case Study • Pandemics
• Pandemics - during a pandemic episode, such as the recent Ebola outbreak, current
policies emphasise the need to ground decision-making on empiric evidence. This section
studies the tension that remains in decision-making processes when their is a sudden and
unpredictable change of course in an outbreak – or when key evidence is weak or ‘silent’.
• The current focus in epidemiology is on the ‘known unknowns’ - factors with which we are
familiar in the pandemic risk assessment processes. These risk processes cover, for
example, monitoring the course of the pandemic, estimating the most affected age groups,
and assessing population-level clinical and pharmaceutical interventions. This section
looks for the ‘unknown unknowns’ - factors with a silence or lack of evidence, factors which
we have only limited or weak understanding in the pandemic risk assessment processes.
• Pandemic risk assessment shows that any developing, new and emerging or sudden and
unpredictable change in the pandemic situation does not accumulate a robust body of
evidence for decision making. These uncertainties may be conceptualised as ‘unknown
unknowns’, or “silent evidence”. Historical and archaeological pandemic studies indicate
that there may well have been evidence that was not discovered, known or recognised.
This section looks at a new method to discover “silent evidence” - unknown factors - that
affect pandemic risk assessment - by focusing on the tension under pressure that impacts
upon the actions of key decision-makers in the pandemic risk decision-making process.

Antonine Plague (Smallpox ) AD 165-180

Pandemic Black Swan Events Black Swan Pandemic Type / Location Impact Date
Malaria For the entirety of human history,
Malaria has been a pathogen
The Malaria pathogen kills more
humans than any other disease 20 kya – present
Smallpox (Antonine Plague) Smallpox Roman Empire / Italy Smallpox is the 2nd worst killer 165-180
Black Death (Plague of Justinian) Bubonic Plague – Roman Empire 50 million people died 6th century
Black Death (Late Middle Ages) Bubonic Plague – Europe 75 to 200 million people died 1340–1400
Smallpox Amazonian Basin Indians 90% Amazonian Indians died 16th century
Tuberculosis Western Europe, 18th - 19th c 900 deaths per 100,000 pop. 18th - 19th c
Syphilis Global pandemic – invariably fatal 10% of Victorian men carriers 19th century
1st Cholera Pandemic Global pandemic Started in the Bay of Bengal 1817-1823
2nd Cholera Pandemic Global pandemic (arrived in London in 1832) 1826-1837
Spanish Flu Global pandemic 50 million people died 1918
Smallpox Global pandemic 300 million people died in 20th c Eliminated 20th c
Poliomyelitis Global pandemic Contracted by up to 500,000
persons per year 1950’s/1960’s 1950’s -1960’s
AIDS Global pandemic – mostly fatal 10% Sub-Saharans are carriers Late 20th century
Ebola West African epidemic – 50% fatal Sub-Saharan Africa epicentre Late 20th century

For the entirety of human history, Malaria has been the most lethal pathogen to attack man

Pandemic Black Swan Event Types
Type Force Epidemiology Black Swan Event
1 Malaria Parasitic
Biological
Disease
The Malaria pathogen has killed more humans than any other disease. Human
malaria most likely originated in Africa and has coevolved along with its hosts,
mosquitoes and non-human primates. The first evidence of malaria parasites
was found in mosquitoes preserved in amber from the Palaeogene period that
are approximately 30 million years old. Malaria may have been a human
pathogen for the entire history of the species. Humans may have originally
caught Plasmodium falciparum from gorillas. About 10,000 years ago, a period
which coincides with the development of agriculture (Neolithic revolution) -
malaria started having a major impact on human survival. A consequence was
natural selection for sickle-cell disease, thalassaemias, glucose-6-phosphate
dehydrogenase deficiency, ovalocytosis, elliptocytosis and loss of the Gerbich
antigen (glycophorin C) and the Duffy antigen on erythrocytes because such
blood disorders confer a selective advantage against malaria infection (balancing
selection). The first known description of malaria dates back 4000 years to 2700
B.C. China where ancient writings refer to symptoms now commonly associated
with malaria. Early malaria treatments were first developed in China from
Quinghao plant, which contains the active ingredient artemisinin, re-discovered
and still used in anti-malaria drugs today. Largely overlooked by researchers is
the role of disease and epidemics in the fall of Rome. Three major types of
inherited genetic resistance to malaria (sickle-cell disease, thalassaemias, and
glucose-6-phosphate dehydrogenase deficiency) were all present in the
Mediterranean world 2,000 years ago, at the time of the Roman Empire.


Pandemic Black Swan Event Types
Type Force Epidemiology Black Swan Event
2 Smallpox Viral
Biological
Disease
The history of smallpox holds a unique place in medical history. One of the
deadliest viral diseases known to man, it is the first disease to be treated by
vaccination - and also the only disease to have been eradicated from the
face of the earth by vaccination. Smallpox plagued human populations for
thousands of years. Researchers who examined the mummy of Egyptian
pharaoh Ramses V (died 1157 BCE) observed scarring similar to that from
smallpox on his remains. Ancient Sanskrit medical texts, dating from about
1500 BCE, describe a smallpox-like illness. Smallpox was most likely
present in Europe by about 300 CE. – although there are no unequivocal
records of smallpox in Europe before the 6th century CE. It has been
suggested that it was a major component of the Plague of Athens that
occurred in 430 BCE, during the Peloponnesian Wars, and was described
by Thucydides. A recent analysis of the description of clinical features
provided by Galen during the Antonine Plague that swept through the
Roman Empire and Italy in 165–180, indicates that the probable cause was
smallpox. In 1796, after noting Smallpox immunity amongst milkmaids –
Edward Jenner carried out his now famous experiment on eight-year-old
James Phipps, using Cow Pox as a vaccine to confer immunity to Smallpox.
Some estimates indicate that 20th century worldwide deaths from smallpox
numbered more than 300 million. The last known case of wild smallpox
occurred in Somalia in 1977 – until recent outbreaks in Pakistan and Syria.

Pandemic Black Swan Event Types
Type Force Epidemiology Black Swan Event
3 Bubonic
Plague
Bacterial
Biological
Disease
The Bubonic Plague – or Black Death – was one of the most devastating
pandemics in human history, killing an estimated 75 to 200 million people
and peaking in Europe in the years 1348–50 CE. The Bubonic Plague is a
bacterial disease – spread by fleas carried by Asian Black Rats - which
originated in or near China and then travelled to Italy, overland along the Silk
Road, or by sea along the Silk Route. From Italy the Black Death spread
onwards through other European countries. Research published in 2002
suggests that the Black Death began in the spring of 1346 in the Russian
steppe region, where a plague reservoir stretched from the north-western
shore of the Caspian Sea into southern Russia. Although there were
several competing theories as to the etiology of the Black Death, analysis of
DNA from victims in northern and southern Europe published in 2010 and
2011 indicates that the pathogen responsible was the Yersinia pestis
bacterium, possibly causing several forms of plague. The first recorded
epidemic ravaged the Byzantine Empire during the sixth century, and was
named the Plague of Justinian after emperor Justinian I, who was infected
but survived through extensive treatment. The epidemic is estimated to have
killed approximately 50 million people in the Roman Empire alone. During
the Late Middle Ages (1340–1400) Europe experienced the most deadly
disease outbreak in history when the Black Death, the infamous pandemic
of bubonic plague, peaked in 1347, killing one third of the human population.

Pandemic Black Swan Event Types
Type Force Epidemiology Black Swan Event
4 Syphilis Bacterial
Biological
Disease
Syphilis - the exact origin of syphilis is unknown. There are two primary
hypotheses: one proposes that syphilis was carried from the Americas to
Europe by the crew of Christopher Columbus, the other proposes that
syphilis previously existed in Europe but went unrecognized. These are
referred to as the "Columbian" and "pre-Columbian" hypotheses. In late 2011
newly published evidence suggested that the Columbian hypothesis is valid.
The appearance of syphilis in Europe at the end of the 1400s heralded
decades of death as the disease raged across the continent. The first
evidence of an outbreak of syphilis in Europe were recorded in 1494/1495
in Naples, Italy, during a French invasion. First spread by returning French
troops, the disease was known as “French disease”, and it was not until
1530 that the term "syphilis" was first applied by the Italian physician and
poet Girolamo Fracastoro. By the 1800s it had become endemic, carried by
as many as 10% of men in some areas - in late Victorian London this may
have been as high as 20%. Invariably fatal, associated with extramarital sex
and prostitution, syphilis was accompanied by enormous social stigma. The
secretive nature of syphilis helped it spread - disgrace was such that many
sufferers hid their symptoms, while others carrying the latent form of the
disease were unaware they even had it. Treponema pallidum, the syphilis
causal organism, was first identified by Fritz Schaudinn and Erich Hoffmann
in 1905. The first effective treatment (Salvarsan) was developed in 1910
by Paul Ehrlich which was followed by the introduction of penicillin in 1943.

Pandemic Black Swan Event Types
Type Force Epidemiology Black Swan Event
5 Tuberculosis Bacterial
Biological
Disease
Tuberculosis - the evolutionary origins of the Mycobacterium tuberculosis
indicates that the most recent common ancestor was a human-specific
pathogen, which encountered an evolutionary bottleneck leading to
diversification. Analysis of mycobacterial interspersed repetitive units has
allowed dating of this evolutionary bottleneck to approximately 40,000 years
ago, which corresponds to the period subsequent to the expansion of Homo
sapiens out of Africa. This analysis of mycobacterial interspersed repetitive
units also dated the Mycobacterium bovis lineage as dispersing some 6,000
years ago. Tuberculosis existed 15,000 to 20,000 years ago, and has been
found in human remains from ancient Egypt, India, and China. Human
bones from the Neolithic show the presence of the bacteria, which may be
linked to early farming and animal domestication. Evidence of tubercular
decay has been found in the spines of Egyptian mummies, and TB was
common both in ancient Greece and Imperial Rome. Tuberculosis reached
its peak the 18th century in Western Europe with a prevalence as high as
900 deaths per 100,000 - due to malnutrition and overcrowded housing with
poor ventilation and sanitation. Although relatively little is known about its
frequency before the 19th century, the incidence of Scrofula (consumption)
“the captain of all men of death” is thought to have peaked between the end
of the 18th century and the end of the 19th century. With advent of HIV there
has been a dramatic resurgence of tuberculosis with more than 8 million
new cases reported each year worldwide and more than 2 million deaths.

Pandemic Black Swan Event Types
Type Force Epidemiology Black Swan Event
6 Cholera Bacterial
Biological
Disease
Cholera is a severe infection in the small intestine caused by the bacterium
vibrio cholerae, contracted by drinking water or eating food contaminated
with the bacterium. Cholera symptoms include profuse watery diarrhoea and
vomiting. The primary danger posed by cholera is severe dehydration, which
can lead to rapid death. Cholera can now be treated with re-hydration and
prevented by vaccination. Cholera outbreaks in recorded history have
indeed been explosive and the global proliferation of the disease is seen by
most scholars to have occurred in six separate pandemics, with the seventh
pandemic still rampant in many developing countries around the world. The
first recorded instance of cholera was described in 1563 in an Indian medical
report. In modern times, the story of the disease begins in 1817 when it
spread from its ancient homeland of the Ganges Delta in the bay of Bengal
in North East India - to the rest of the world. The first cholera pandemic
raged from 1817-1823, the second from 1826-1837 The disease reached
Britain during October 1831 - and finally arrived in London in 1832 (13,000
deaths) with subsequent major outbreaks in 1841, 1848 (21,000 deaths)
1854 (15,000 deaths) and 1866. Surgeon John Snow – by studying the
outbreak cantered around the Broad Street well in 1854 – traced the source
of cholera to drinking water which was contaminated by infected human
faeces – ending the “miasma” or “bad air” theory of cholera transmission.

Pandemic Black Swan Event Types
Type Force Epidemiology Black Swan Event
7 Poliomyelitis Viral
Biological
Disease
The history of poliomyelitis (polio) infections extends into prehistory.
Ancient Egyptian paintings and carvings depict otherwise healthy people
with withered limbs, and children walking with canes at a young age.[3] It is
theorized that the Roman Emperor Claudius was stricken as a child, and this
caused him to walk with a limp for the rest of his life. Perhaps the earliest
recorded case of poliomyelitis is that of Sir Walter Scott. At the time, polio
was not known to medicine. In 1773 Scott was said to have developed "a
severe teething fever which deprived him of the power of his right leg." The
symptoms of poliomyelitis have been described as: Dental Paralysis,
Infantile Spinal Paralysis, Essential Paralysis of Children, Regressive
Paralysis, Myelitis of the Anterior Horns and Paralysis of the Morning.
In 1789 the first clinical description of poliomyelitis was provided by the
British physician Michael Underwood as "a debility of the lower extremities”.
Although major polio epidemics were unknown before the 20th century, the
disease has caused paralysis and death for much of human history. Over
millennia, polio survived quietly as an endemic pathogen until the 1880s
when major epidemics began to occur in Europe; soon after, widespread
epidemics appeared in the United States. By 1910, frequent epidemics
became regular events throughout the developed world, primarily in cities
during the summer months. At its peak in the 1940s and 1950s, polio would
maim, paralyse or kill over half a million people worldwide every year
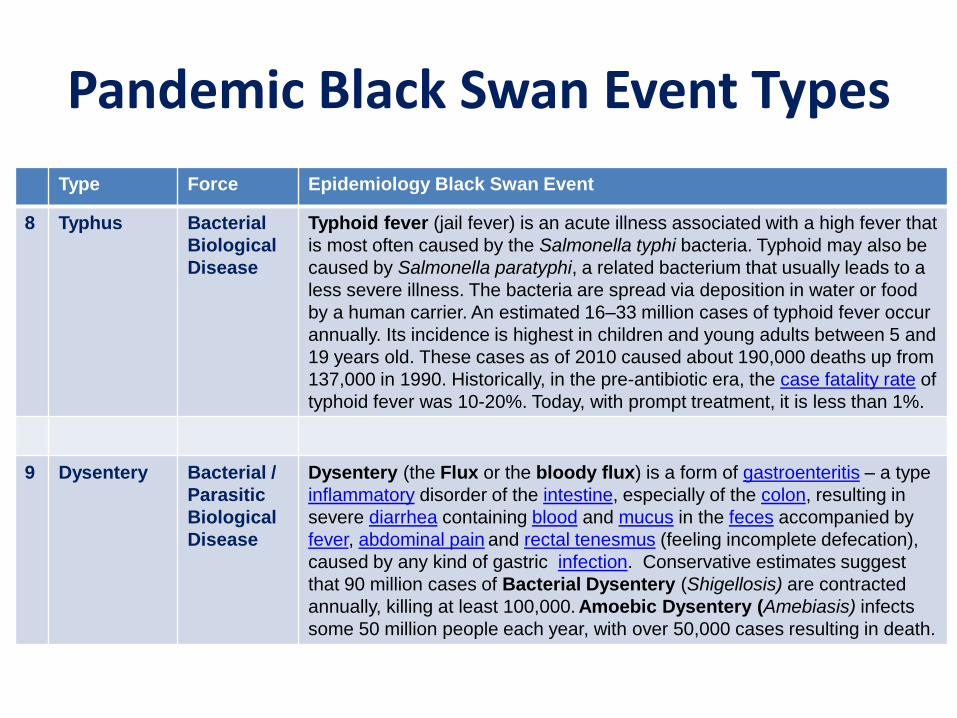
Pandemic Black Swan Event Types
Type Force Epidemiology Black Swan Event
8 Typhus Bacterial
Biological
Disease
Typhoid fever (jail fever) is an acute illness associated with a high fever that
is most often caused by the Salmonella typhi bacteria. Typhoid may also be
caused by Salmonella paratyphi, a related bacterium that usually leads to a
less severe illness. The bacteria are spread via deposition in water or food
by a human carrier. An estimated 16–33 million cases of typhoid fever occur
annually. Its incidence is highest in children and young adults between 5 and
19 years old. These cases as of 2010 caused about 190,000 deaths up from
137,000 in 1990. Historically, in the pre-antibiotic era, the case fatality rate of
typhoid fever was 10-20%. Today, with prompt treatment, it is less than 1%.
9 Dysentery Bacterial /
Parasitic
Biological
Disease
Dysentery (the Flux or the bloody flux) is a form of gastroenteritis – a type
inflammatory disorder of the intestine, especially of the colon, resulting in
severe diarrhea containing blood and mucus in the feces accompanied by
fever, abdominal pain and rectal tenesmus (feeling incomplete defecation),
caused by any kind of gastric infection. Conservative estimates suggest
that 90 million cases of Bacterial Dysentery (Shigellosis) are contracted
annually, killing at least 100,000. Amoebic Dysentery (Amebiasis) infects
some 50 million people each year, with over 50,000 cases resulting in death.

Pandemic Black Swan Event Types
Type Force Epidemiology Black Swan Event
10 Spanish
Flu
Viral
Biological
Disease
In the United States, the Spanish Flu was first observed in Haskell County,
Kansas, in January 1918, prompting a local doctor, Loring Miner to warn the
U.S. Public Health Service's academic journal. On 4th March 1918, army cook
Albert Gitchell reported sick at Fort Riley, Kansas. A week later on 11th March
1918, over 100 soldiers were in hospital and the Spanish Flu virus had now
reached Queens New York. Within days, 522 men had reported sick at the
army camp. In August 1918, a more virulent strain appeared simultaneously
in Brest, Brittany-France, in Freetown, Sierra Leone, and in the U.S, in Boston,
Massachusetts. It is estimated that in 1918, between 20-40% of the worlds
population became infected by Spanish Flu - with 50 million deaths globally.
11 HIV / AIDS Viral
Biological
Disease
AIDS was first reported in America in 1981 – and provoked reactions which
echoed those associated with syphilis for so long. Many of the earliest cases
were among homosexual men - creating a climate of prejudice and moral
panic. Fear of catching this new and terrifying disease was also widespread
among the public. The observed time-lag between contracting HIV and the
onset of AIDS, coupled with new drug treatments, changed perceptions.
Increasingly it was seen as a chronic but manageable disease. The global
story was very different - by the mid-1980s it became clear that the virus had
spread, largely unnoticed, throughout the rest of the world. The nature of this
global pandemic varies from region to region, with poorer areas hit hardest. In
parts of sub-Saharan Africa nearly 1 in 10 adults carries the virus - a statistic
which is reminiscent of the spread of syphilis in parts of Europe in the 1800s.

Pandemic Black Swan Event Types
Type Force Epidemiology Black Swan Event
12 Ebola Haemorrhagic
Viral
Biological
Disease
Ebola is a highly lethal Haemorrhagic Viral Biological Disease, which has
caused at least 16 confirmed outbreaks in Africa between 1976 and 2015.
Ebola Virus Disease (EVD) is found in wild great apes and kills 50% to 90% of
humans infected - making it one of the deadliest diseases known to man. It is
so dangerous that it is considered to be a potential Grade A bioterrorism agent
– on a par with anthrax, smallpox, and bubonic plague. The current outbreak
of EVD has seen confirmed cases in Guinea, Liberia and Sierra Leone,
countries in an area of West Africa where the disease has not previously
occurred. There were also a handful of suspected cases in neighbouring Mali,
but these patients were found to have contracted other diseases
For each epidemic, transmission was quantified in different settings (illness in
the community, hospitalization, and traditional burial) and predictive analytics
simulated various epidemic scenarios to explore the impact of medical control
interventions on an emerging epidemic. A key medical parameter was the
rapid institution of control measures. For both epidemic profiles identified,
increasing the rate of hospitalization reduced the predicted epidemic size.
Over 4000 suspected cases of EVD have been recorded, with the majority of
them in Guinea. The current outbreak has currently resulted in over 2000
deaths. These figures will continue to rise as more patients die and as test
results confirm that they were infected with Ebola.

Pandemic Black Swan Event Types
Ebola is a highly lethal Haemorrhagic Viral Biological Disease, which has
caused at least 16 confirmed outbreaks in Africa between 1976 and 2015.

Pandemic Black Swan Event Types
Type Force Epidemiology Black Swan Event
13 Future
Bacterial
Pandemic
Infections
Bacterial
Biological
Disease
Bacteria were most likely the real killers in the 1918 Flu Pandemic - the vast
majority of deaths in the 1918–1919 influenza pandemic resulted as a result of
secondary bacterial pneumonia, caused by common upper respiratory-tract
bacteria. Less substantial data from the subsequent 1957 and 1968 Flu
pandemics are consistent with these findings. If severe pandemic influenza is
largely a problem of viral-bacterial co-pathogenesis, pandemic planning needs
to go beyond addressing the viral cause alone (influenza vaccines and
antiviral drugs). The diagnosis, prophylaxis, treatment and prevention of
secondary bacterial pneumonia - as well as stockpiling of antibiotics and
bacterial vaccines – should be high priorities for future pandemic planning.
14 Future
Viral
Pandemic
infections
Viral
Biological
Disease
What was Learned from Reconstructing the 1918 Spanish Flu Virus
Comparing pandemic H1N1 influenza viruses at the molecular level yields key
insights into pathogenesis – the way animal viruses mutate to cross species.
The availability of these two H1N1 virus genomes separated by over 90 years,
provided an unparalleled opportunity to study and recognise genetic properties
associated with virulent pandemic viruses - allowing for a comprehensive
assessment of emerging influenza viruses with human pandemic potential.
There are only four to six mutations required within the first three days of viral
infection in a new human host, to change an animal virus to become highly
virulent and infectious to human beings. Candidate viral gene pools for future
possible Human Pandemics include Anthrax, Lassa Fever, Rift Valley Fever,
EVD, SARS, MIRS, H1N1 Swine Flu (2009) and H7N9 Avian / Bat Flu (2013).

Abiliti: Digital Technology
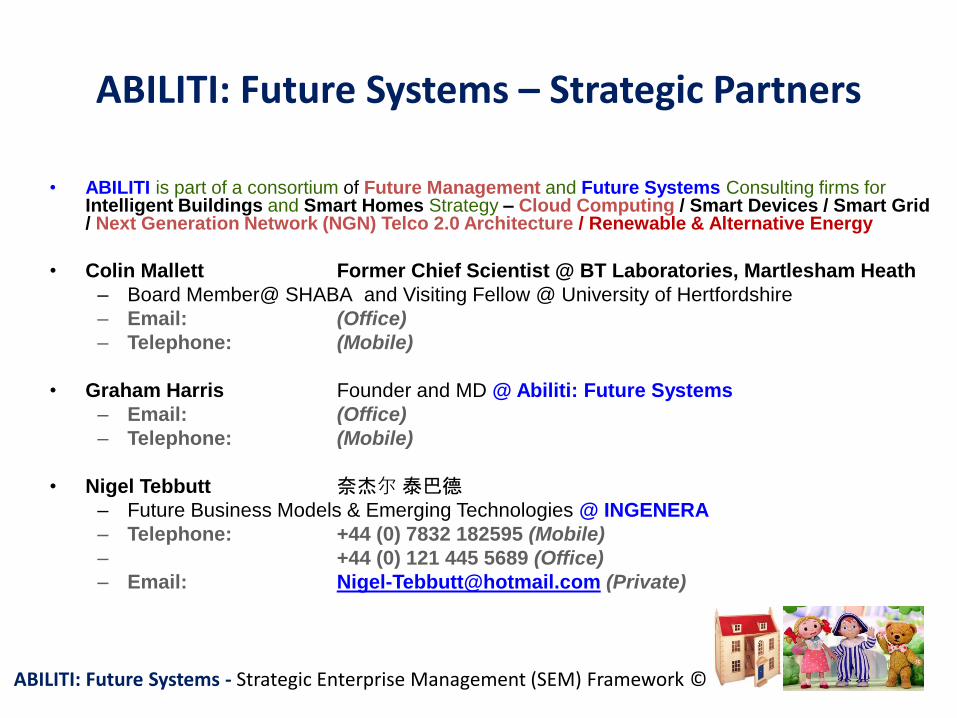
ABILITI: Future Systems – Strategic Partners
• ABILITI is part of a consortium of Future Management and Future Systems Consulting firms for Intelligent Buildings and Smart Homes Strategy – Cloud Computing / Smart Devices / Smart Grid / Next Generation Network (NGN) Telco 2.0 Architecture / Renewable & Alternative Energy
• Colin Mallett Former Chief Scientist @ BT Laboratories, Martlesham Heath
– Board Member@ SHABA and Visiting Fellow @ University of Hertfordshire
– Email: (Office)
– Telephone: (Mobile)
• Graham Harris Founder and MD @ Abiliti: Future Systems
– Email: (Office)
– Telephone: (Mobile)
• Nigel Tebbutt 奈杰尔 泰巴德
– Future Business Models & Emerging Technologies @ INGENERA
– Telephone: +44 (0) 7832 182595 (Mobile)
– +44 (0) 121 445 5689 (Office)
– Email: [email protected] (Private)
ABILITI: Future Systems - Strategic Enterprise Management (SEM) Framework ©