Embed Size (px)
Citation preview

Digital Environments and WATERS Observatories
Dr. Richard P. Hooper,President,
Consortium of Universities for the Advancement of Hydrologic Science, Inc.
Why Observatories?Some Conceptual Bases
• Pragmatic goal: “Transcending the uniqueness of place”– Systematic and coherent observations for testing
hypotheses in many places to determine their generality
• Lofty goal: “Reliably predict water quantity and quality anywhere in the U.S. as a function of…”
• Modeling goal: “Move from prediction at point (e.g., watershed outlet) to continuous, dynamic fields (e.g., entire river)” (from discharge and heads to fluxes and flowpaths)
-Mathematical Formulae-Solution Techniques
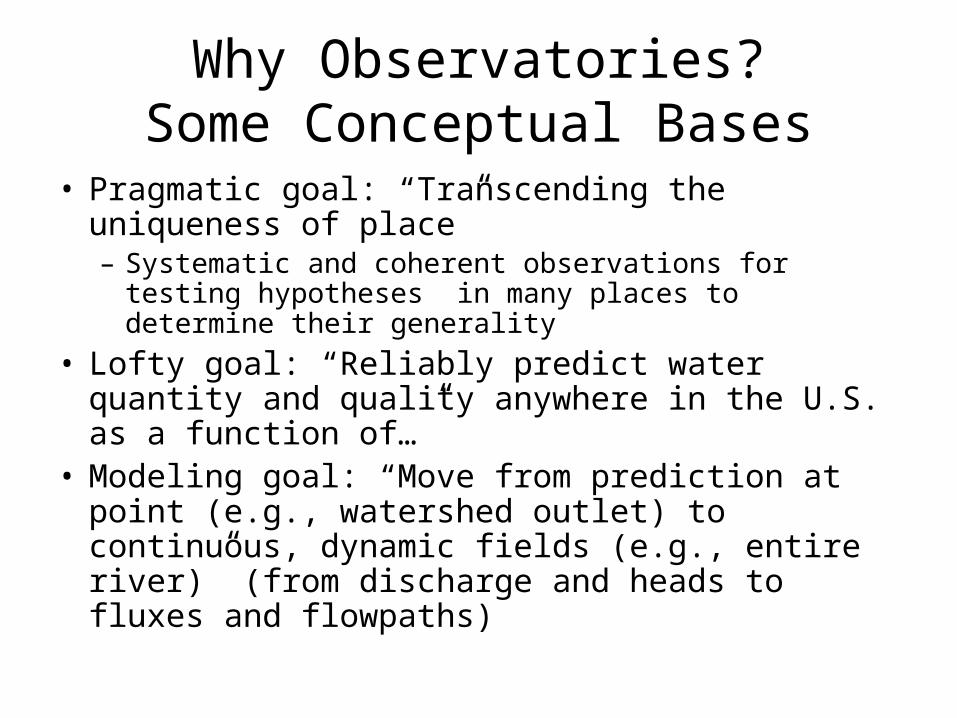
Abstractions in Modeling
Physical World
ConceptualFrameworks
DataRepresentation
ModelRepresentations
“Digital Environment”Real World
Measurements
•Theory/Process Knowledge•Perceptions of this place•Intuition
Water quantity and quality
MeteorologyRemote sensing
GeographicallyReferenced
Mapping
Validation
DNA SequencesVegetation SurveyHydrologist
Q, Gradient, Roughness?
HillslopeContribution?
SnowmeltProcesses?
Biogeochemist
Hyporheic exchange?
Mineralogy? Chemistry?
Redox Zones?
DOC Quality?
Geomorphologist
Glaciated Valley
Perifluvial
Well sorted?Thalweg?
Aquatic Ecologist
Backwater habitat
Substrate Size, Stability?Benthic Community
Oligotrophic?Carbon source?
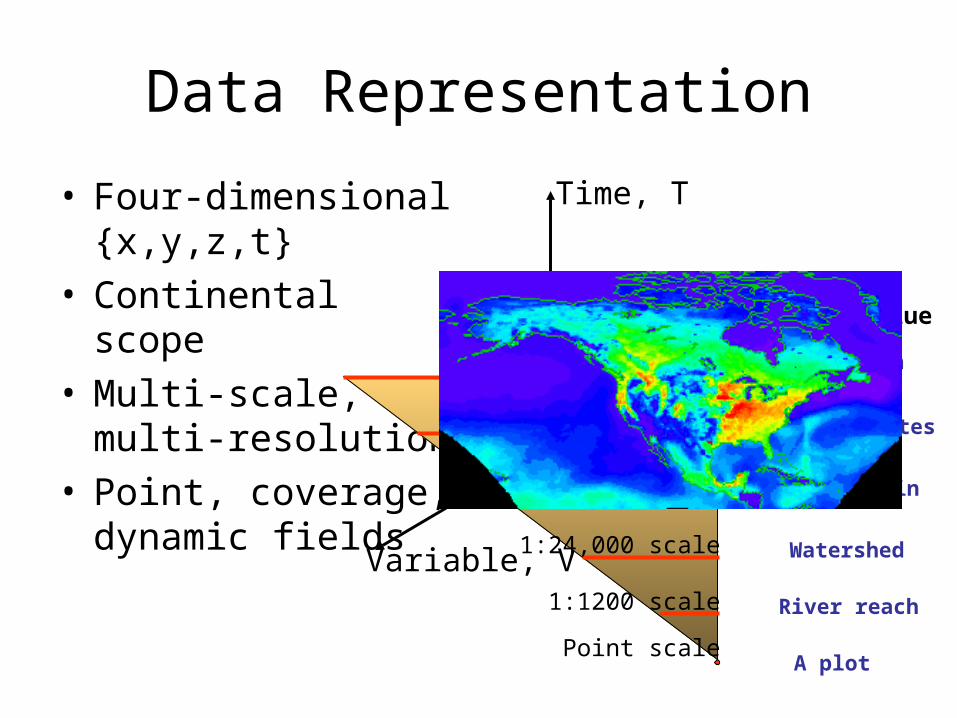
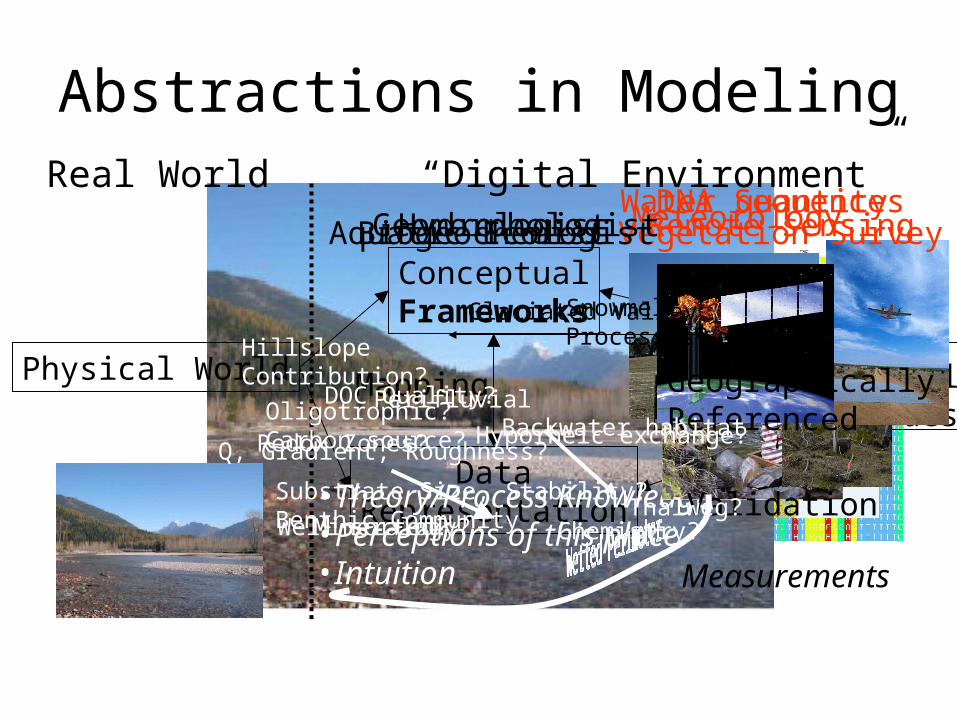
Data Representation
• Four-dimensional {x,y,z,t}
• Continental scope• Multi-scale, multi-
resolution• Point, coverage,
dynamic fieldsSpace, L
Time, T
Variable, V
DA data value
1:1200 scale
United States1:500,000 scale
River Basin1:100,000 scale
Watershed1:24,000 scale
River reach
Point scaleA plot
1:1,000,000 scale North American and Global

Digital Continent
• Integrating monitoring and research data yields a single body of information for the country
• Observatories contribute intensive information to this body
• Observatories are placed within context of climate, geology, soils, etc. but are not assumed to be representative of an area.
• Digital environments may be watersheds, aquifers, river reaches, or any region that is part of the continent
Inference Space
• “Transcending place” means testing hypotheses in areas thought to be similar (in some attributes).
• Digital watershed will enable identification of “similar” areas and (some) data about that spot.
• Observatories will enable inference about similar regions (e.g., presumably one can infer more about Delaware R. from Potomac than about Rio Grande).
DEs are the foundation of EOs
• Collaboration of Mission and Science Agencies– DE contains both monitoring and research data– DE supports hypothesis test, decision support
systems, mgmt models
• Interdisciplinary communication– Scientists can access multiple conceptualizations to
improve understanding– Everyone benefits from context provided
• Incentives must exist for people and agencies to want to contribute (and they do!)

HIS 1.0 (1 Nov 2006)
– Point Time Series• Discovery and Publication• Agencies
– USGS NWIS – NCDC– EPA Storet
• [LTER Trends]
– Static Federation to Observatory Test Beds

Digital Environments
• Data Representation– Need to develop integrated 4-dimensional
data base– Add coverages (easy) and fields (more
complicated)
• Conceptual Frameworks and Modeling– Testbeds: can single data representation fulfill
diverse set of science needs?– LTER Sevilleta Site
HIS Extensions
• Integration of Weather Data– Work with NCAR (Olga Wilhelmini); prototype on Ohio– Move from gridded to watershed-based delivery of data
• Hydrogeology– Constructing stratigraphy for continent
• Geologic Framework– Geomorphic and geologic history
• Incorporation of human dimension– Transportation; structures– Permits, Toxic Release Inventory, etc. – Flood plain (contribution from real estate sector?)– FEMA Lidar products
• Explicit development of AK, HI, PR beyond CONUS
WATERS Design
• Digital environments provide flexibility—watersheds or problemsheds
• DE’s embedded within a single Digital Continent that provides context
• CI is the key to observatories
Beyond WATERS
• Critical Zone Observatories (GEO)– 2 sites selected Spring 2007, $1M/yr each
• Other large-scale PI-led projects– Illinois Carbon/Water Cycle– HydroKansas– SAHRA and NCED Field Facilities– LTER Sites
WATERS and CUAHSI
• Community Engagement– Web site (template ready)– Coordinating Committee (Pedro Alvarez (Rice), Jean
Bahr (Wisc), Dave Goodrich (ARS), Peter Goodwin (Idaho)
• Geophysical characterization– HMF-Geophysics (Rosemary Knight, Stanford)
• Digital Observatories – HIS Project
WATERS People
NSF Program Officers• Pat Brezonik (ENG)• Doug James (GEO)CLEANER Program Office• Jami Montgomery (Ex. Dir)• Barbara Minsker (PI)• Jerry Schnoor (co-PI)• Chuck Haas (co-PI)CUAHSI Staff• Rick Hooper, Ex. Dir• Wendy Graham, Chair• Claire Welty, Chair-Elect
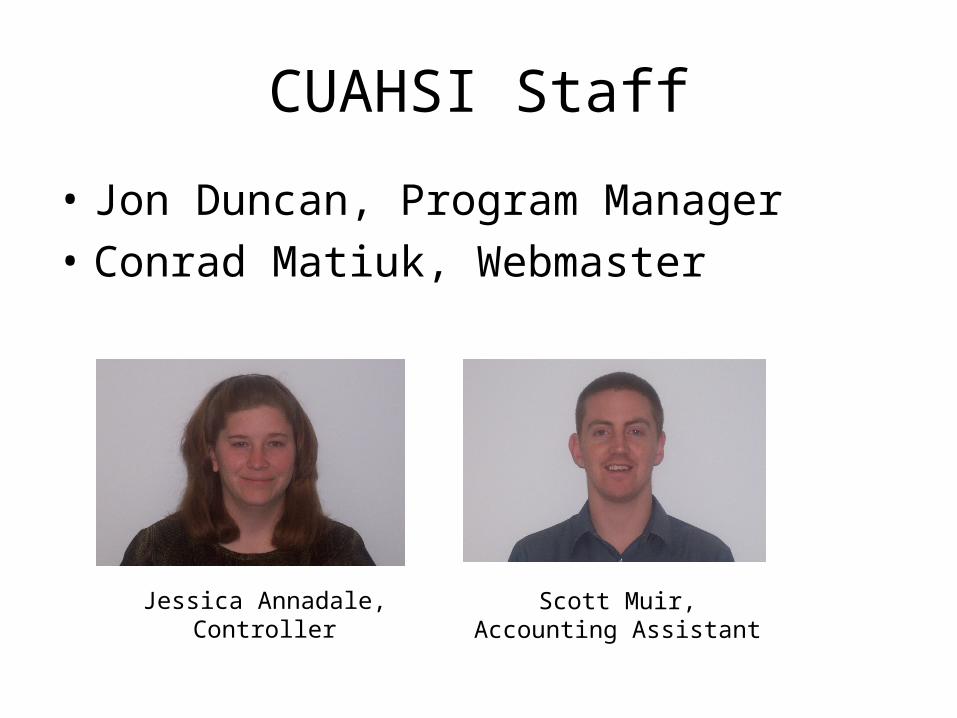
CUAHSI Staff
• Jon Duncan, Program Manager
• Conrad Matiuk, Webmaster
Jessica Annadale,Controller
Scott Muir,Accounting Assistant