Embed Size (px)
Citation preview

28 July 2021
Digital Consumer Bank
H1’21
Earnings Presentation
2
Important InformationNon-IFRS and alternative performance measures
This presentation contains, in addition to the financial information prepared in accordance with International Financial Reporting Standards (“IFRS”) and derived from our financial statements,alternative performance measures (“APMs”) as defined in the Guidelines on Alternative Performance Measures issued by the European Securities and Markets Authority (ESMA) on 5 October 2015(ESMA/2015/1415en) and other non-IFRS measures (“Non-IFRS Measures”). These financial measures that qualify as APMs and non-IFRS measures have been calculated with information fromSantander Group; however those financial measures are not defined or detailed in the applicable financial reporting framework nor have been audited or reviewed by our auditors. We use theseAPMs and non-IFRS measures when planning, monitoring and evaluating our performance. We consider these APMs and non-IFRS measures to be useful metrics for our management and investorsto compare operating performance between accounting periods, as these measures exclude items outside the ordinary course performance of our business, which are grouped in the “managementadjustment” line and are further detailed in Section 3.2 of the Economic and Financial Review in our Directors’ Report included in our Annual Report on Form 20-F for the year ended 31 December2020. Nonetheless, these APMs and non-IFRS measures should be considered supplemental information to, and are not meant to substitute IFRS measures. Furthermore, companies in our industryand others may calculate or use APMs and non-IFRS measures differently, thus making them less useful for comparison purposes. For further details on APMs and Non-IFRS Measures, including itsdefinition or a reconciliation between any applicable management indicators and the financial data presented in the consolidated financial statements prepared under IFRS, please see the 2020Annual Report on Form 20-F filed with the U.S. Securities and Exchange Commission on 26 February 2021, as well as the section “Alternative performance measures” of the annex to the BancoSantander, S.A. (“Santander”) Q2 2021 Financial Report, published as Inside Information on 28 July 2021. These documents are available on Santander’s website (www.santander.com). Underlyingmeasures, which are included in this presentation, are non-IFRS measures.
The businesses included in each of our geographic segments and the accounting principles under which their results are presented here may differ from the included businesses and local applicableaccounting principles of our public subsidiaries in such geographies. Accordingly, the results of operations and trends shown for our geographic segments may differ materially from those of suchsubsidiaries.
Forward-looking statements
Santander advises that this presentation contains “forward-looking statements” as per the meaning of the U.S. Private Securities Litigation Reform Act of 1995. These statements may be identifiedby words like “expect”, “project”, “anticipate”, “should”, “intend”, “probability”, “risk”, “VaR”, “RoRAC”, “RoRWA”, “TNAV”, “target”, “goal”, “objective”, “estimate”, “future” and similar expressions.Found throughout this presentation, they include (but are not limited to) statements on our future business development, economic performance and shareholder remuneration policy. However, anumber of risks, uncertainties and other important factors may cause actual developments and results to differ materially from our expectations. The following important factors, in addition toothers discussed elsewhere in this presentation, could affect our future results and could cause materially different outcomes from those anticipated in forward-looking statements: (1) generaleconomic or industry conditions of areas where we have significant operations or investments (such as a worse economic environment; higher volatility in the capital markets; inflation or deflation;changes in demographics, consumer spending, investment or saving habits; and the effects of the COVID-19 pandemic in the global economy); (2) exposure to various market risks (particularlyinterest rate risk, foreign exchange rate risk, equity price risk and risks associated with the replacement of benchmark indices); (3) potential losses from early repayments on our loan and investmentportfolio, declines in value of collateral securing our loan portfolio, and counterparty risk; (4) political stability in Spain, the United Kingdom, other European countries, Latin America and the US (5)changes in legislation, regulations, taxes, including regulatory capital and liquidity requirements, especially in view of the UK exit of the European Union and increased regulation in response tofinancial crisis; (6) our ability to integrate successfully our acquisitions and related challenges that result from the inherent diversion of management’s focus and resources from other strategicopportunities and operational matters; and (7) changes in our access to liquidity and funding on acceptable terms, in particular if resulting from credit spreads shifts or downgrade in credit ratings forthe entire group or significant subsidiaries.
3
Important Information
Numerous factors could affect our future results and could cause those results deviating from those anticipated in the forward-looking statements. Other unknown or unpredictable factorscould cause actual results to differ materially from those in the forward-looking statements.
Forward-looking statements speak only as of the date of this presentation and are informed by the knowledge, information and views available on such date. Santander is not required toupdate or revise any forward-looking statements, regardless of new information, future events or otherwise.
No offer
The information contained in this presentation is subject to, and must be read in conjunction with, all other publicly available information, including, where relevant any fuller disclosuredocument published by Santander. Any person at any time acquiring securities must do so only on the basis of such person’s own judgment as to the merits or the suitability of the securities forits purpose and only on such information as is contained in such public information having taken all such professional or other advice as it considers necessary or appropriate in thecircumstances and not in reliance on the information contained in this presentation. No investment activity should be undertaken on the basis of the information contained in this presentation.In making this presentation available Santander gives no advice and makes no recommendation to buy, sell or otherwise deal in shares in Santander or in any other securities or investmentswhatsoever.
Neither this presentation nor any of the information contained therein constitutes an offer to sell or the solicitation of an offer to buy any securities. No offering of securities shall be made in theUnited States except pursuant to registration under the U.S. Securities Act of 1933, as amended, or an exemption therefrom. Nothing contained in this presentation is intended to constitute aninvitation or inducement to engage in investment activity for the purposes of the prohibition on financial promotion in the U.K. Financial Services and Markets Act 2000.
Historical performance is not indicative of future results
Statements about historical performance or accretion must not be construed to indicate that future performance, share price or future (including earnings per share) in any future period willnecessarily match or exceed those of any prior period. Nothing in this presentation should be taken as a profit forecast.
Third Party Information
In particular, regarding the data provided by third parties, neither Santander, nor any of its administrators, directors or employees, either explicitly or implicitly, guarantees that these contents are exact, accurate, comprehensive or complete, nor are they obliged to keep them updated, nor to correct them in the case that any deficiency, error or omission were to be detected. Moreover, in reproducing these contents by any means, Santander may introduce any changes it deems suitable, may omit partially or completely any of the elements of this document, and in case of any deviation between such a version and this one, Santander assumes no liability for any discrepancy.
4
Index
1
Strategy and business
2
Results
3
Concluding remarks
4
Appendix
5
Strategy and business
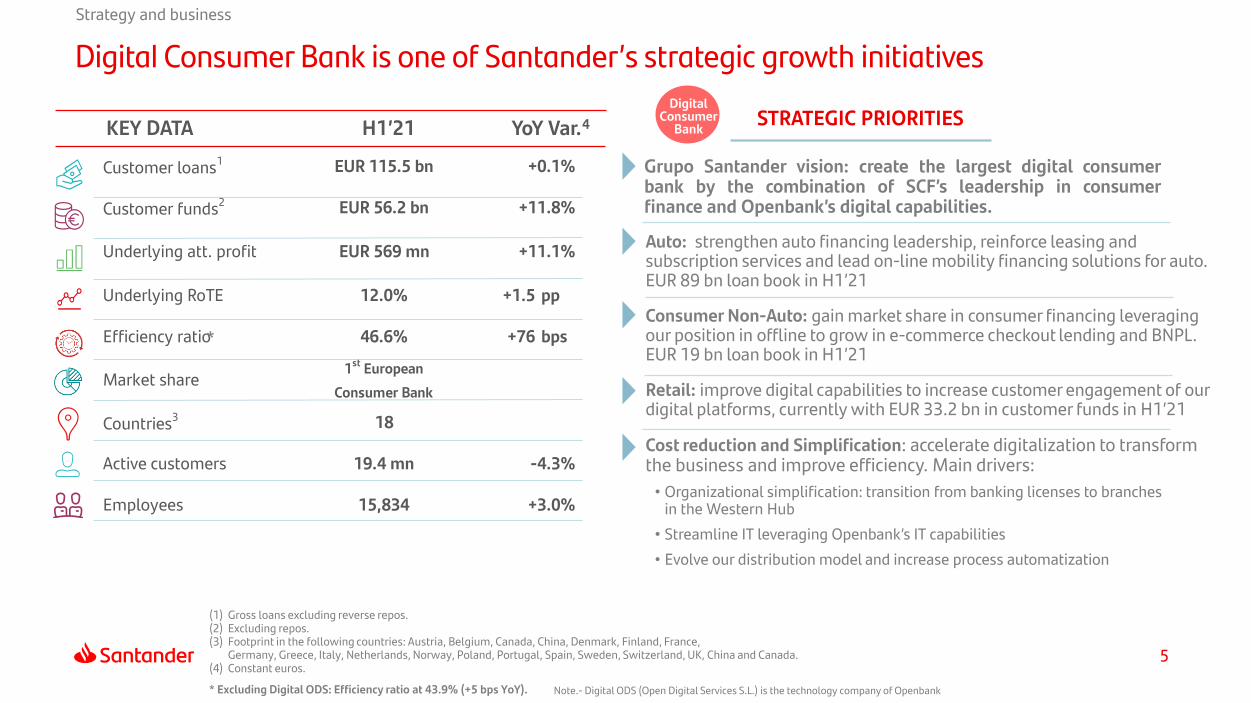
Digital Consumer Bank is one of Santander’s strategic growth initiatives
(1) Gross loans excluding reverse repos.(2) Excluding repos.(3) Footprint in the following countries: Austria, Belgium, Canada, China, Denmark, Finland, France,
Germany, Greece, Italy, Netherlands, Norway, Poland, Portugal, Spain, Sweden, Switzerland, UK, China and Canada.(4) Constant euros.
* Excluding Digital ODS: Efficiency ratio at 43.9% (+5 bps YoY).
KEY DATA H1’21 YoY Var.4
Customer loans1 EUR 115.5 bn
Customer funds2 EUR 56.2 bn
Underlying att. profit EUR 569 mn
Underlying RoTE 12.0% +1.5 pp
Efficiency ratio 46.6% +76 bps
Market share1st European
Consumer Bank
Countries3 18
Active customers 19.4 mn
Employees 15,834 +3.0%
+0.1%
+11.8%
-4.3%
+11.1%
*
STRATEGIC PRIORITIES
Grupo Santander vision: create the largest digital consumerbank by the combination of SCF’s leadership in consumerfinance and Openbank’s digital capabilities.
Auto: strengthen auto financing leadership, reinforce leasing and subscription services and lead on-line mobility financing solutions for auto. EUR 89 bn loan book in H1’21
Consumer Non-Auto: gain market share in consumer financing leveraging our position in offline to grow in e-commerce checkout lending and BNPL. EUR 19 bn loan book in H1’21
Retail: improve digital capabilities to increase customer engagement of our digital platforms, currently with EUR 33.2 bn in customer funds in H1’21
Cost reduction and Simplification: accelerate digitalization to transform the business and improve efficiency. Main drivers:
• Organizational simplification: transition from banking licenses to branches in the Western Hub
• Streamline IT leveraging Openbank’s IT capabilities
• Evolve our distribution model and increase process automatization
Note.- Digital ODS (Open Digital Services S.L.) is the technology company of Openbank
Digital Consumer
Bank
6
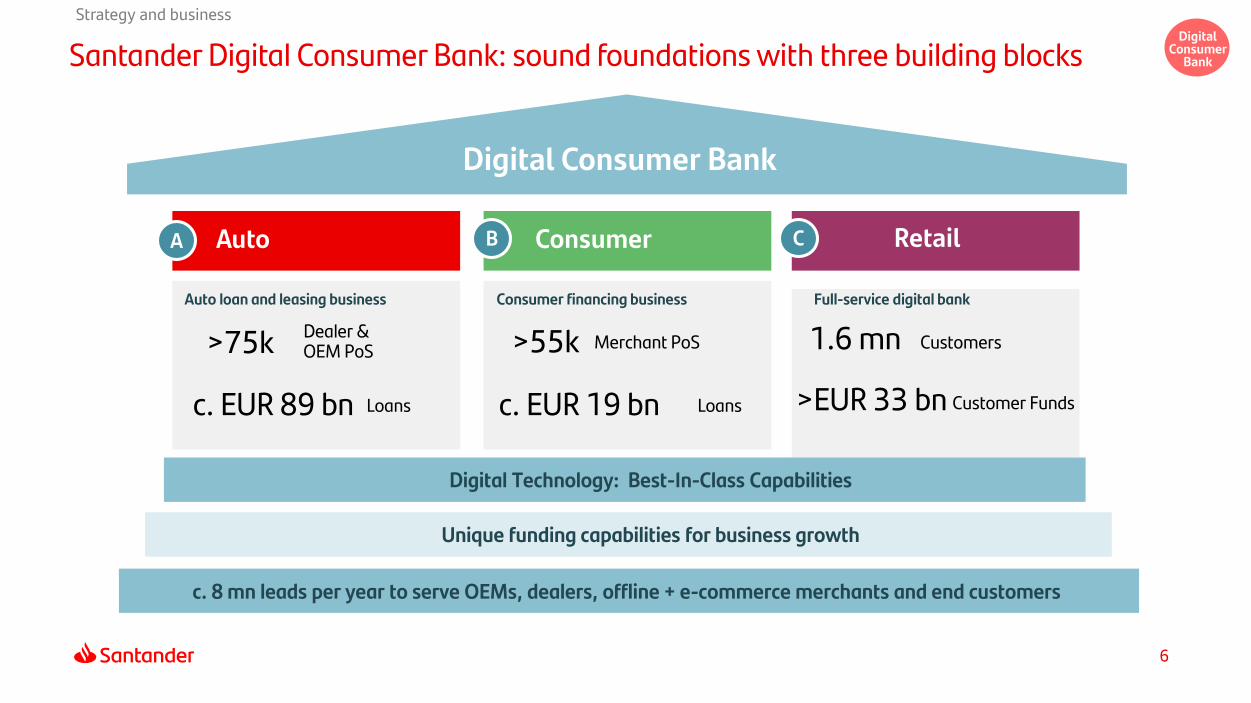
Santander Digital Consumer Bank: sound foundations with three building blocks
Auto
Auto loan and leasing business Consumer financing business Full-service digital bank
Consumer Retail
Unique funding capabilities for business growth
c. 8 mn leads per year to serve OEMs, dealers, offline + e-commerce merchants and end customers
Digital Consumer Bank
>55k Merchant PoS>75k Dealer & OEM PoS
c. EUR 19 bn Loansc. EUR 89 bn Loans Customer Funds>EUR 33 bn
1.6 mn Customers
A B C
Digital Technology: Best-In-Class Capabilities
Strategy and businessDigital
Consumer Bank
7
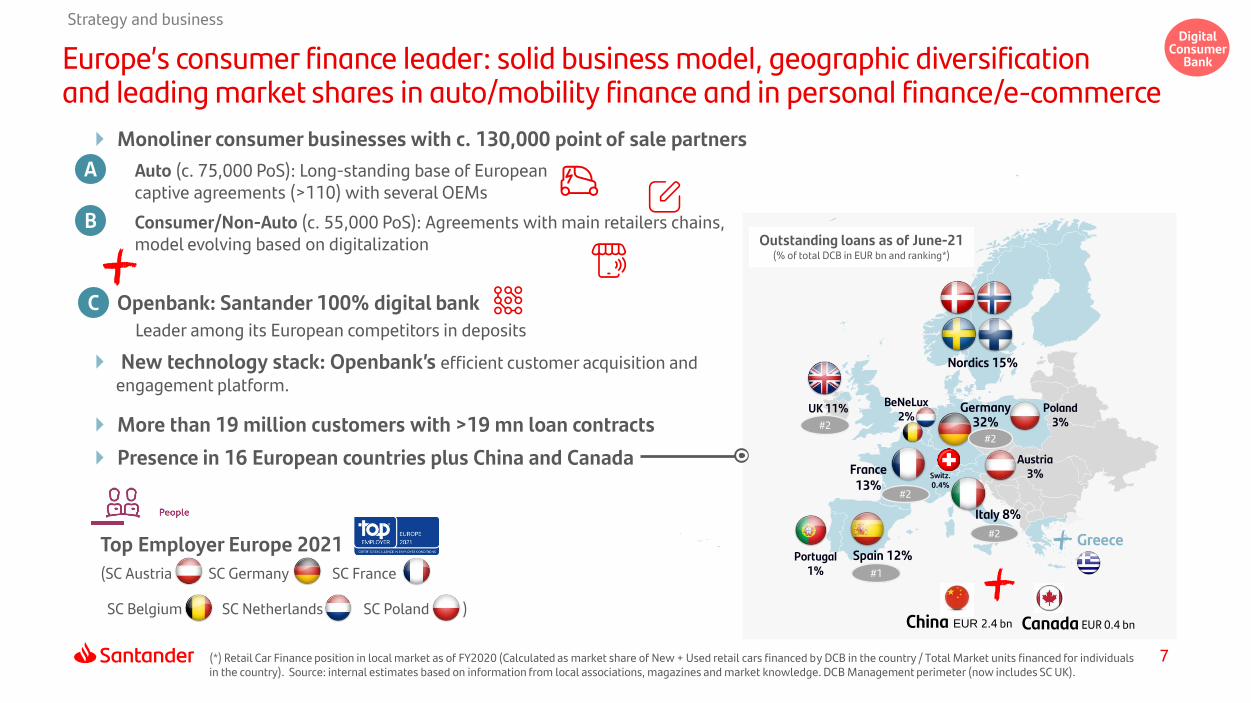
Monoliner consumer businesses with c. 130,000 point of sale partners
Auto (c. 75,000 PoS): Long-standing base of European captive agreements (>110) with several OEMs
Consumer/Non-Auto (c. 55,000 PoS): Agreements with main retailers chains, model evolving based on digitalization
Openbank: Santander 100% digital bank
Leader among its European competitors in deposits
New technology stack: Openbank’s efficient customer acquisition and engagement platform.
More than 19 million customers with >19 mn loan contracts
Presence in 16 European countries plus China and Canada
Strategy and business
Europe’s consumer finance leader: solid business model, geographic diversification and leading market shares in auto/mobility finance and in personal finance/e-commerce
Top Employer Europe 2021
(SC Austria SC Germany SC France
SC Belgium SC Netherlands SC Poland )
(*) Retail Car Finance position in local market as of FY2020 (Calculated as market share of New + Used retail cars financed by DCB in the country / Total Market units financed for individuals in the country). Source: internal estimates based on information from local associations, magazines and market knowledge. DCB Management perimeter (now includes SC UK).
A
B
C
BeNeLux 2%
UK 11%
Spain 12%
Poland 3%
Italy 8%
Germany 32%
France 13%
#2
#1
China CanadaEUR 2.4 bn EUR 0.4 bn
Nordics 15%
#2
Greece
#2
Austria 3%
Portugal1%
Switz.0.4%
#2
Outstanding loans as of June-21(% of total DCB in EUR bn and ranking*)
Digital Consumer
Bank
8
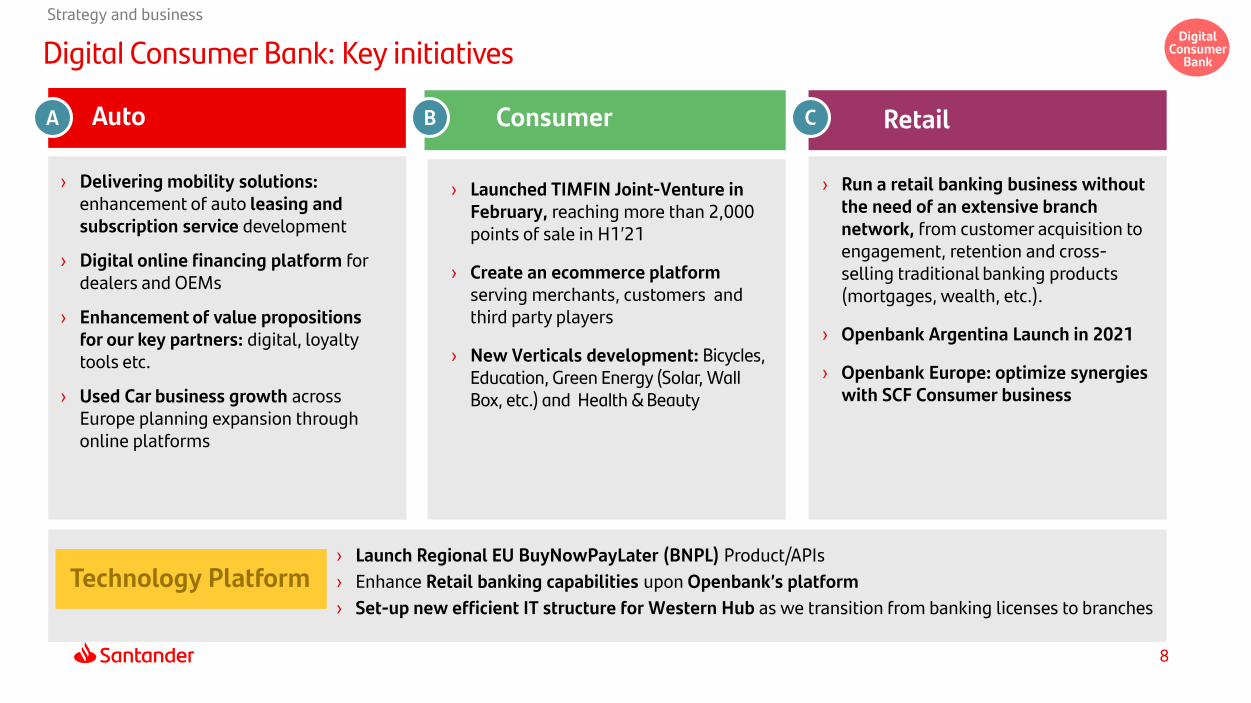
Digital Consumer Bank: Key initiatives
› Launch Regional EU BuyNowPayLater (BNPL) Product/APIs
› Enhance Retail banking capabilities upon Openbank’s platform
› Set-up new efficient IT structure for Western Hub as we transition from banking licenses to branches
› Run a retail banking business without the need of an extensive branch network, from customer acquisition to engagement, retention and cross-selling traditional banking products (mortgages, wealth, etc.).
› Openbank Argentina Launch in 2021
› Openbank Europe: optimize synergies with SCF Consumer business
› Launched TIMFIN Joint-Venture in February, reaching more than 2,000 points of sale in H1’21
› Create an ecommerce platform serving merchants, customers and third party players
› New Verticals development: Bicycles, Education, Green Energy (Solar, Wall Box, etc.) and Health & Beauty
› Delivering mobility solutions: enhancement of auto leasing andsubscription service development
› Digital online financing platform for dealers and OEMs
› Enhancement of value propositions for our key partners: digital, loyalty tools etc.
› Used Car business growth across Europe planning expansion through online platforms
Auto Consumer Retail
Technology Platform
A B C
Strategy and businessDigital
Consumer Bank
9
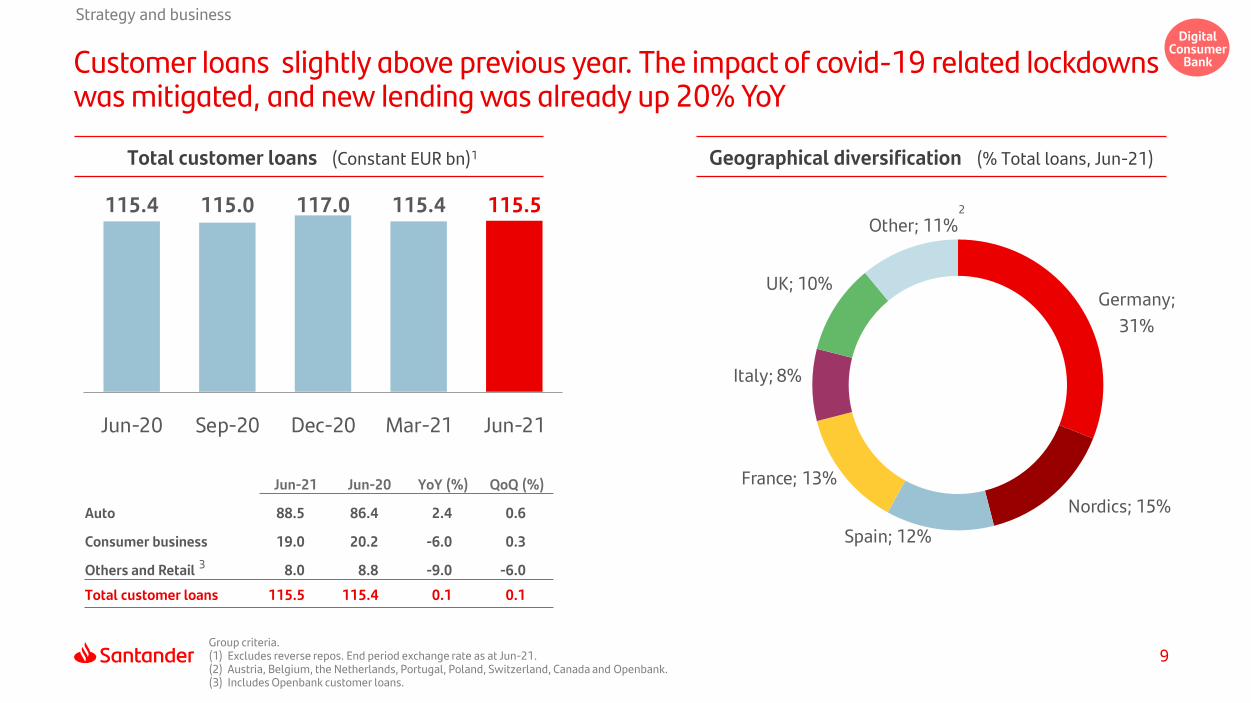
Germany;
31%
Nordics; 15%
Spain; 12%
France; 13%
Italy; 8%
UK; 10%
Other; 11%
Strategy and business
Customer loans slightly above previous year. The impact of covid-19 related lockdowns was mitigated, and new lending was already up 20% YoY
Total customer loans (Constant EUR bn)1 Geographical diversification (% Total loans, Jun-21)
2
Group criteria.(1) Excludes reverse repos. End period exchange rate as at Jun-21.(2) Austria, Belgium, the Netherlands, Portugal, Poland, Switzerland, Canada and Openbank.(3) Includes Openbank customer loans.
115.4 115.0 117.0 115.4 115.5
Jun-20 Sep-20 Dec-20 Mar-21 Jun-21
Auto
Jun-21 Jun-20 YoY (%) QoQ (%)
88.5 86.4 2.4 0.6
Consumer business 19.0 20.2 -6.0 0.3
3Others and Retail 8.0 8.8 -9.0 -6.0
Total customer loans 115.5 115.4 0.1 0.1
Digital Consumer
Bank
10
Strategy and business
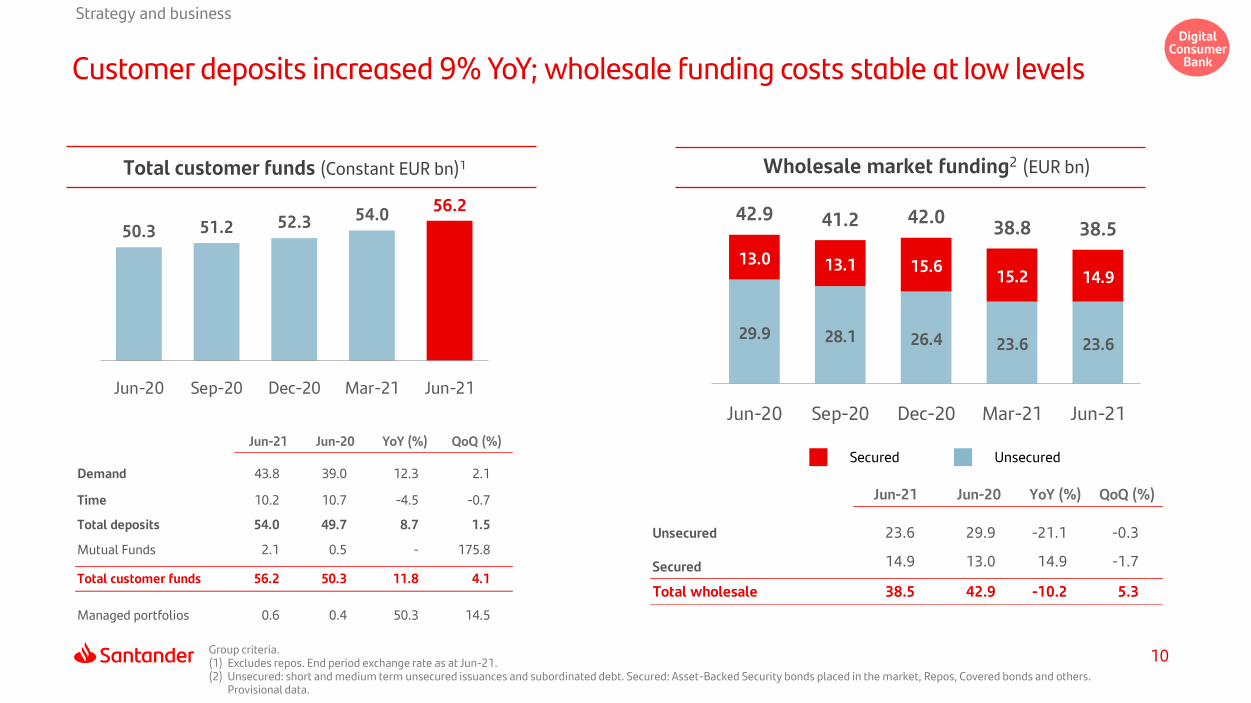
Customer deposits increased 9% YoY; wholesale funding costs stable at low levels
Total customer funds (Constant EUR bn)1
Group criteria.(1) Excludes repos. End period exchange rate as at Jun-21.(2) Unsecured: short and medium term unsecured issuances and subordinated debt. Secured: Asset-Backed Security bonds placed in the market, Repos, Covered bonds and others.
Provisional data.
50.3 51.2 52.3 54.056.2
Jun-20 Sep-20 Dec-20 Mar-21 Jun-21
Jun-21 Jun-20 YoY (%) QoQ (%)
Unsecured 23.6 29.9 -21.1 -0.3
Secured 14.9 13.0 14.9 -1.7
Total wholesale 38.5 42.9 -10.2 5.3
29.9 28.1 26.4 23.6 23.6
13.0 13.1 15.6 15.2 14.9
42.9 41.2 42.0 38.8 38.5
Jun-20 Sep-20 Dec-20 Mar-21 Jun-21
Wholesale market funding2 (EUR bn)
Secured UnsecuredJun-21 Jun-20 YoY (%) QoQ (%)
Demand 43.8 39.0 12.3 2.1
Time 10.2 10.7 -4.5 -0.7
Total deposits 54.0 49.7 8.7 1.5
Mutual Funds 2.1 0.5 - 175.8
Total customer funds 56.2 50.3 11.8 4.1
Managed portfolios 0.6 0.4 50.3 14.5
Digital Consumer
Bank
11
Index
1
Strategy and business
2
Results
3
Concluding remarks
4
Appendix
12
Results
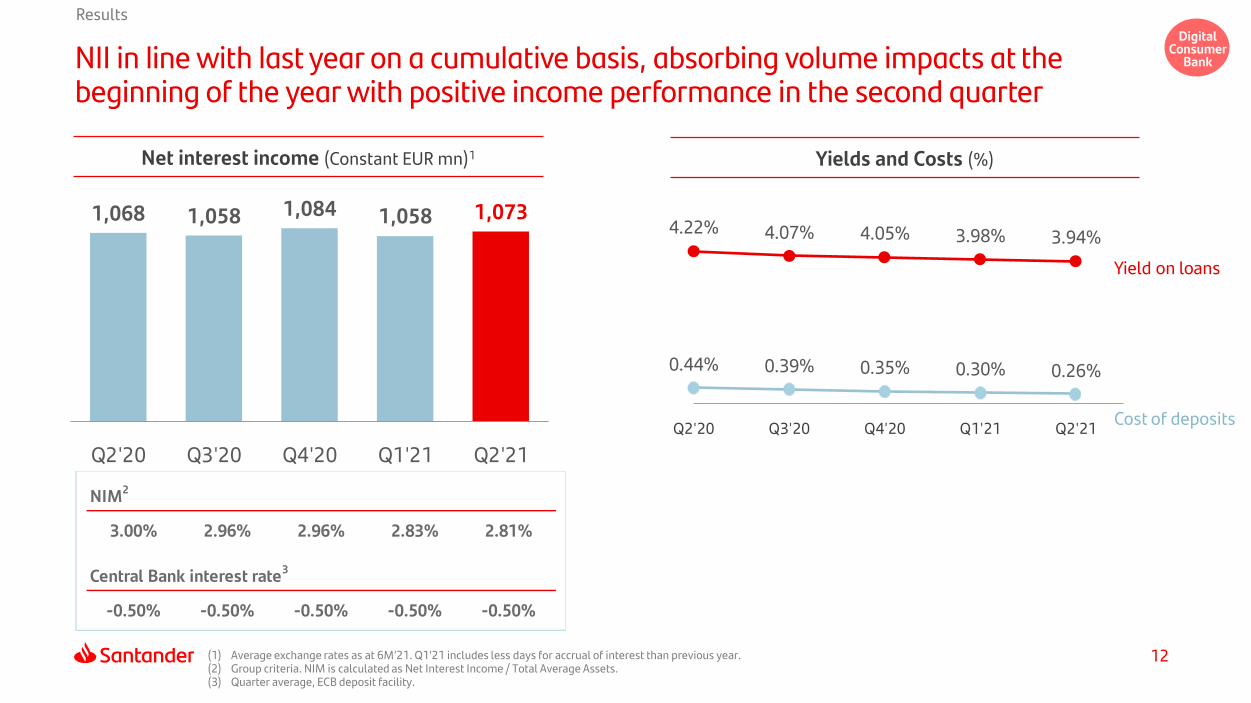
NII in line with last year on a cumulative basis, absorbing volume impacts at the beginning of the year with positive income performance in the second quarter
(1) Average exchange rates as at 6M’21. Q1’21 includes less days for accrual of interest than previous year.(2) Group criteria. NIM is calculated as Net Interest Income / Total Average Assets.(3) Quarter average, ECB deposit facility.
Net interest income (Constant EUR mn)1 Yields and Costs (%)
Yield on loans
Cost of deposits
1,068 1,058 1,084 1,058 1,073
Q2'20 Q3'20 Q4'20 Q1'21 Q2'21
4.22% 4.07% 4.05% 3.98% 3.94%
0.44% 0.39% 0.35% 0.30% 0.26%
Q2'20 Q3'20 Q4'20 Q1'21 Q2'21
NIM2
3.00% 2.96% 2.96% 2.83% 2.81%
Central Bank interest rate3
-0.50% -0.50% -0.50% -0.50% -0.50%
Digital Consumer
Bank
13
Results
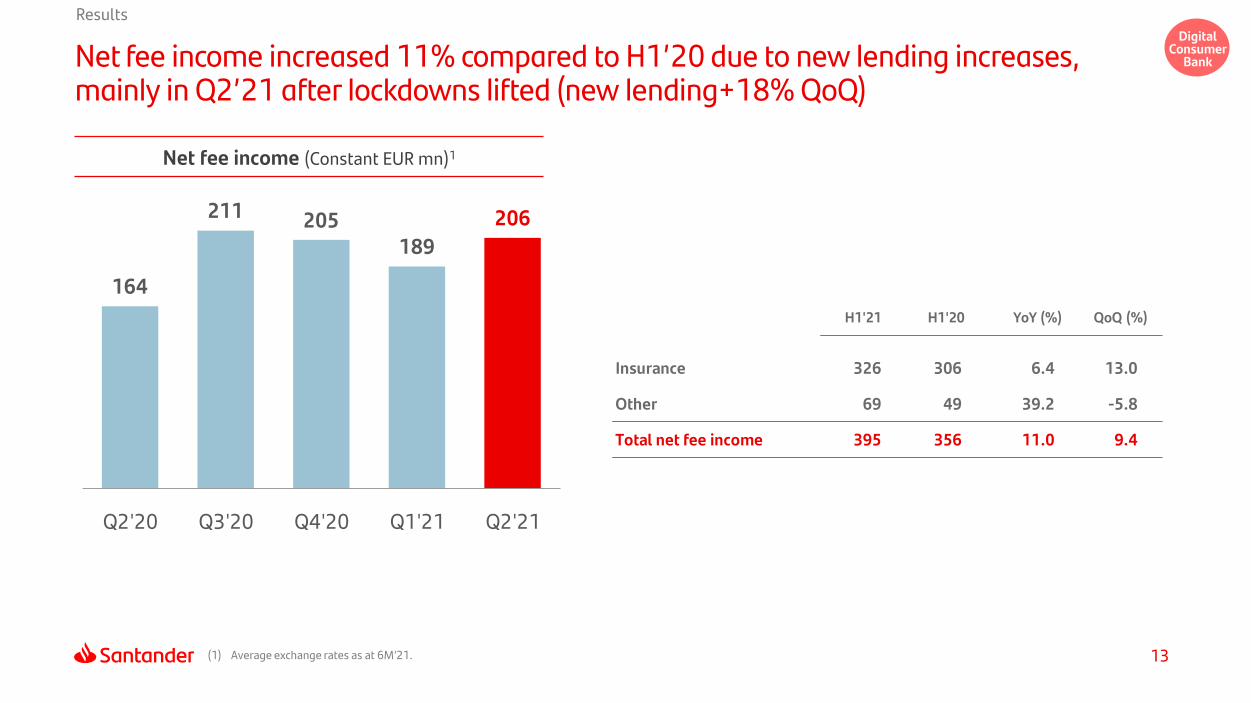
Net fee income increased 11% compared to H1’20 due to new lending increases, mainly in Q2’21 after lockdowns lifted (new lending+18% QoQ)
(1) Average exchange rates as at 6M’21.
Net fee income (Constant EUR mn)1
164
211 205 189
206
Q2'20 Q3'20 Q4'20 Q1'21 Q2'21
H1'21 H1'20 YoY (%) QoQ (%)
Insurance 326 306 6.4 13.0
Other 69 49 39.2 -5.8
Total net fee income 395 356 11.0 9.4
Digital Consumer
Bank
14
Results
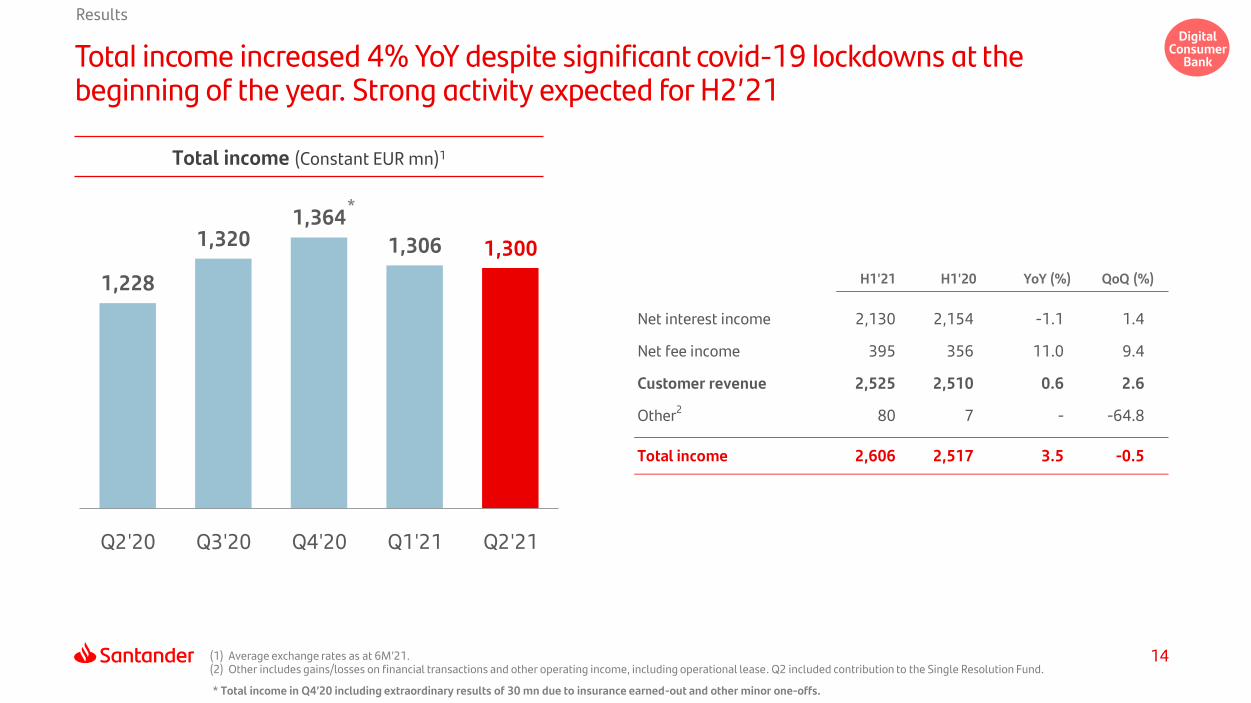
Total income increased 4% YoY despite significant covid-19 lockdowns at the beginning of the year. Strong activity expected for H2’21
(1) Average exchange rates as at 6M’21. (2) Other includes gains/losses on financial transactions and other operating income, including operational lease. Q2 included contribution to the Single Resolution Fund.
* Total income in Q4’20 including extraordinary results of 30 mn due to insurance earned-out and other minor one-offs.
Total income (Constant EUR mn)1
1,228
1,320 1,364
1,306 1,300
Q2'20 Q3'20 Q4'20 Q1'21 Q2'21
H1'21 H1'20 YoY (%) QoQ (%)
Net interest income 2,130 2,154 -1.1 1.4
Net fee income 395 356 11.0 9.4
Customer revenue 2,525 2,510 0.6 2.6
Other2 80 7 - -64.8
Total income 2,606 2,517 3.5 -0.5
*
Digital Consumer
Bank
15
Results
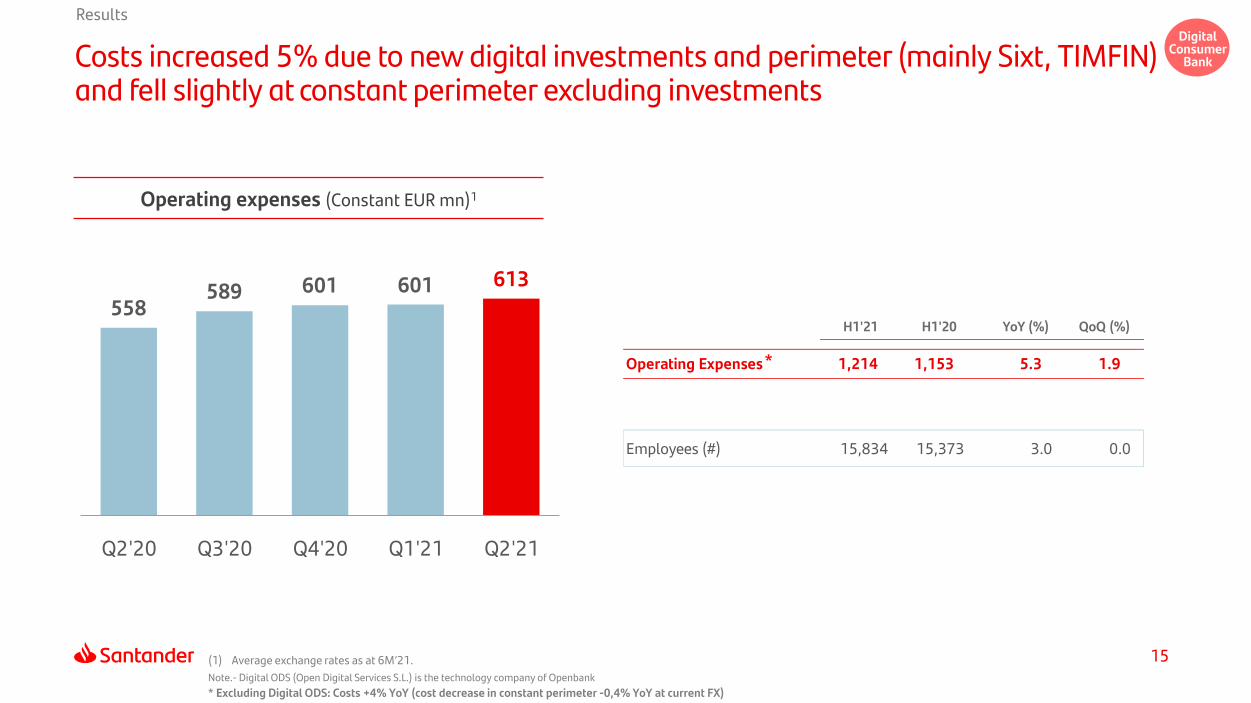
Costs increased 5% due to new digital investments and perimeter (mainly Sixt, TIMFIN) and fell slightly at constant perimeter excluding investments
(1) Average exchange rates as at 6M’21.
* Excluding Digital ODS: Costs +4% YoY (cost decrease in constant perimeter -0,4% YoY at current FX)
Operating expenses (Constant EUR mn)1
H1'21 H1'20 YoY (%) QoQ (%)
Operating Expenses 1,214 1,153 5.3 1.9
Employees (#) 15,834 15,373 3.0 0.0
558 589 601 601 613
Q2'20 Q3'20 Q4'20 Q1'21 Q2'21
*
Note.- Digital ODS (Open Digital Services S.L.) is the technology company of Openbank
Digital Consumer
Bank
16
Results
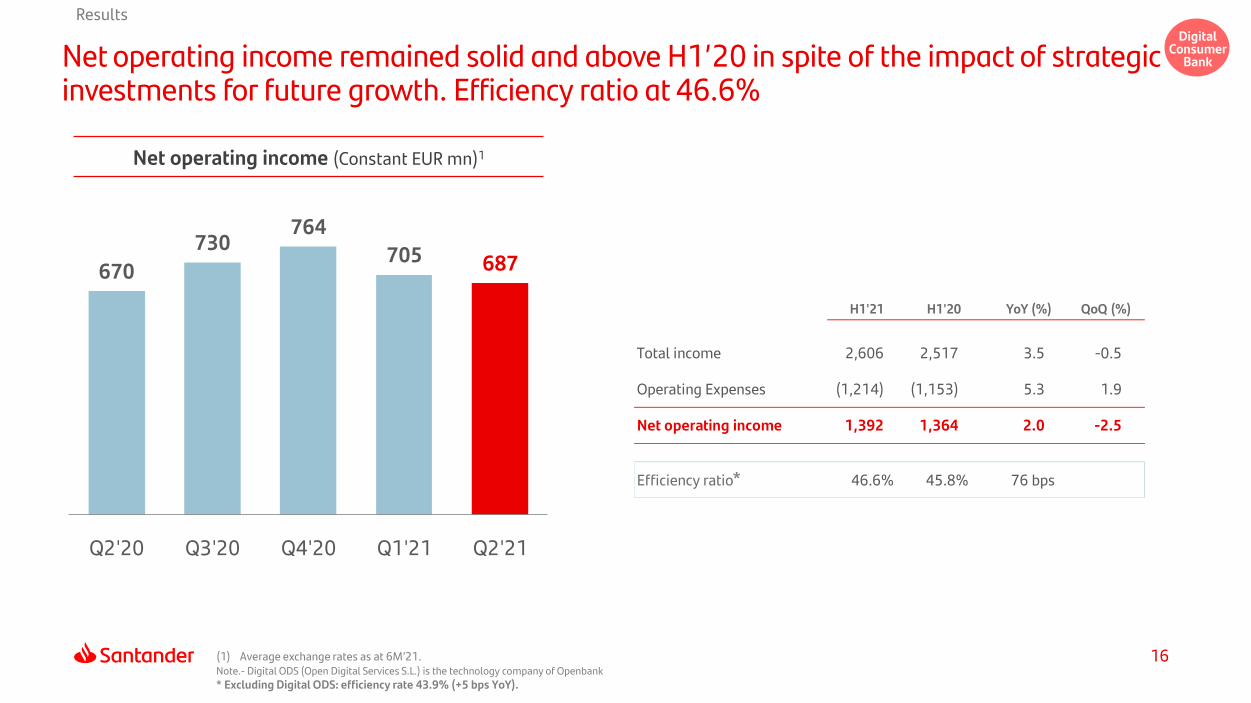
Net operating income remained solid and above H1’20 in spite of the impact of strategic investments for future growth. Efficiency ratio at 46.6%
* Excluding Digital ODS: efficiency rate 43.9% (+5 bps YoY).
Net operating income (Constant EUR mn)1
H1'21 H1'20 YoY (%) QoQ (%)
Total income 2,606 2,517 3.5 -0.5
Operating Expenses (1,214) (1,153) 5.3 1.9
Net operating income 1,392 1,364 2.0 -2.5
Efficiency ratio 46.6% 45.8% 76 bps
670
730 764
705 687
Q2'20 Q3'20 Q4'20 Q1'21 Q2'21
*
(1) Average exchange rates as at 6M’21.Note.- Digital ODS (Open Digital Services S.L.) is the technology company of Openbank
Digital Consumer
Bank
17
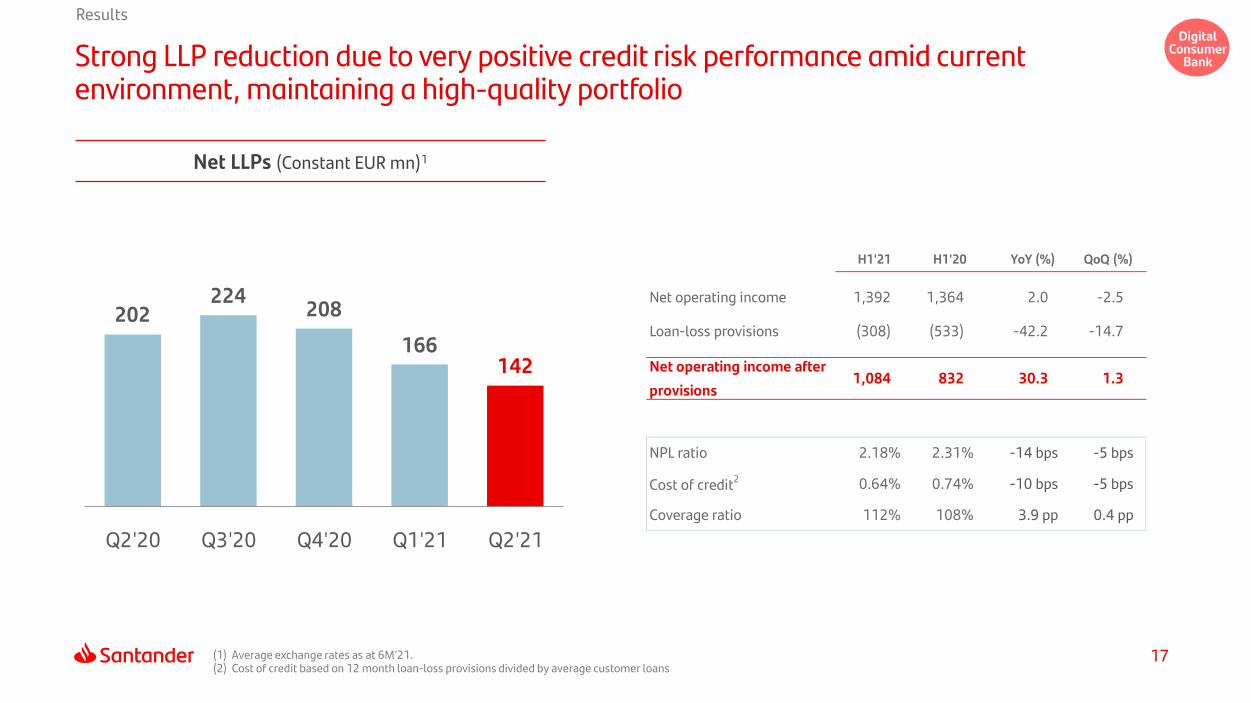
H1'21 H1'20 YoY (%) QoQ (%)
Net operating income 1,392 1,364 2.0 -2.5
Loan-loss provisions (308) (533) -42.2 -14.7
Net operating income after
provisions1,084 832 30.3 1.3
NPL ratio 2.18% 2.31% -14 bps -5 bps
Cost of credit2 0.64% 0.74% -10 bps -5 bps
Coverage ratio 112% 108% 3.9 pp 0.4 pp
Results
Strong LLP reduction due to very positive credit risk performance amid current environment, maintaining a high-quality portfolio
(1) Average exchange rates as at 6M’21. (2) Cost of credit based on 12 month loan-loss provisions divided by average customer loans
Net LLPs (Constant EUR mn)1
202 224
208
166 142
Q2'20 Q3'20 Q4'20 Q1'21 Q2'21
Digital Consumer
Bank
18
Results
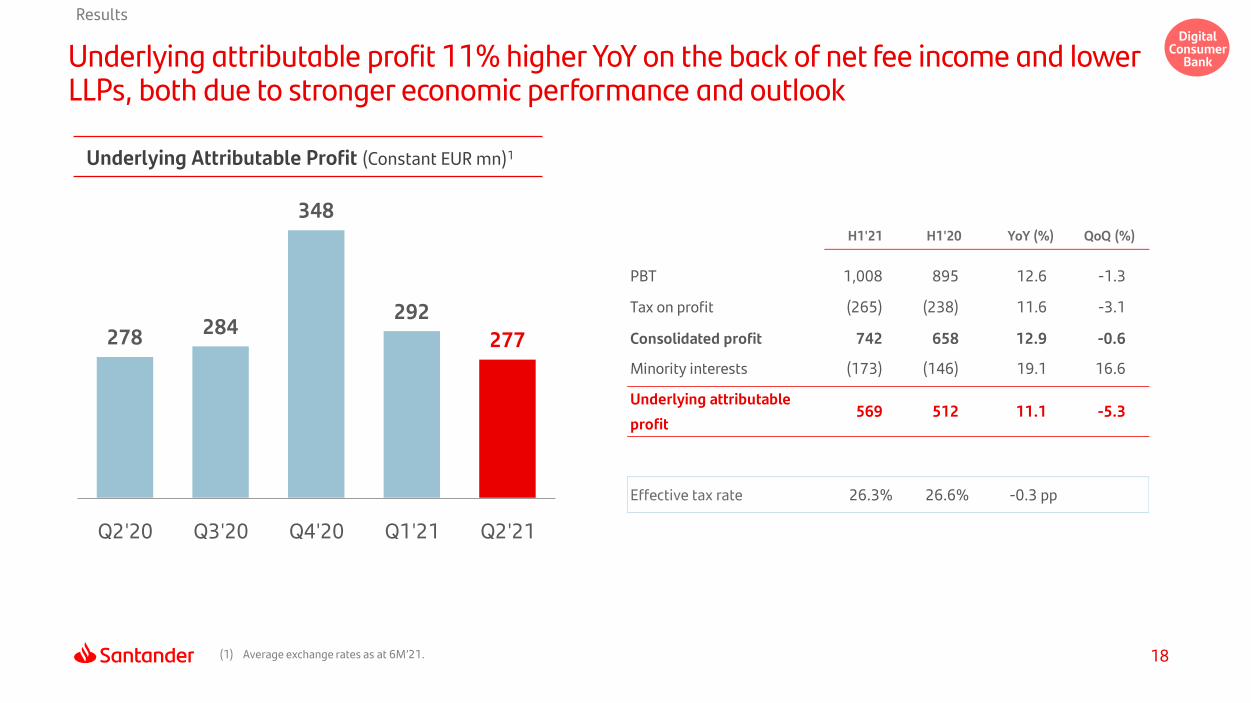
Underlying attributable profit 11% higher YoY on the back of net fee income and lower LLPs, both due to stronger economic performance and outlook
Underlying Attributable Profit (Constant EUR mn)1
278 284
348
292
277
Q2'20 Q3'20 Q4'20 Q1'21 Q2'21
(1) Average exchange rates as at 6M’21.
H1'21 H1'20 YoY (%) QoQ (%)
PBT 1,008 895 12.6 -1.3
Tax on profit (265) (238) 11.6 -3.1
Consolidated profit 742 658 12.9 -0.6
Minority interests (173) (146) 19.1 16.6
Underlying attributable
profit569 512 11.1 -5.3
Effective tax rate 26.3% 26.6% -0.3 pp
Digital Consumer
Bank
19
Index
1
Strategy and business
2
Results
3
Concluding remarks
4
Appendix
20
Concluding remarks
DCB is delivering profitable results in 2021…
(1) EU + EFTA + UK
Financial System
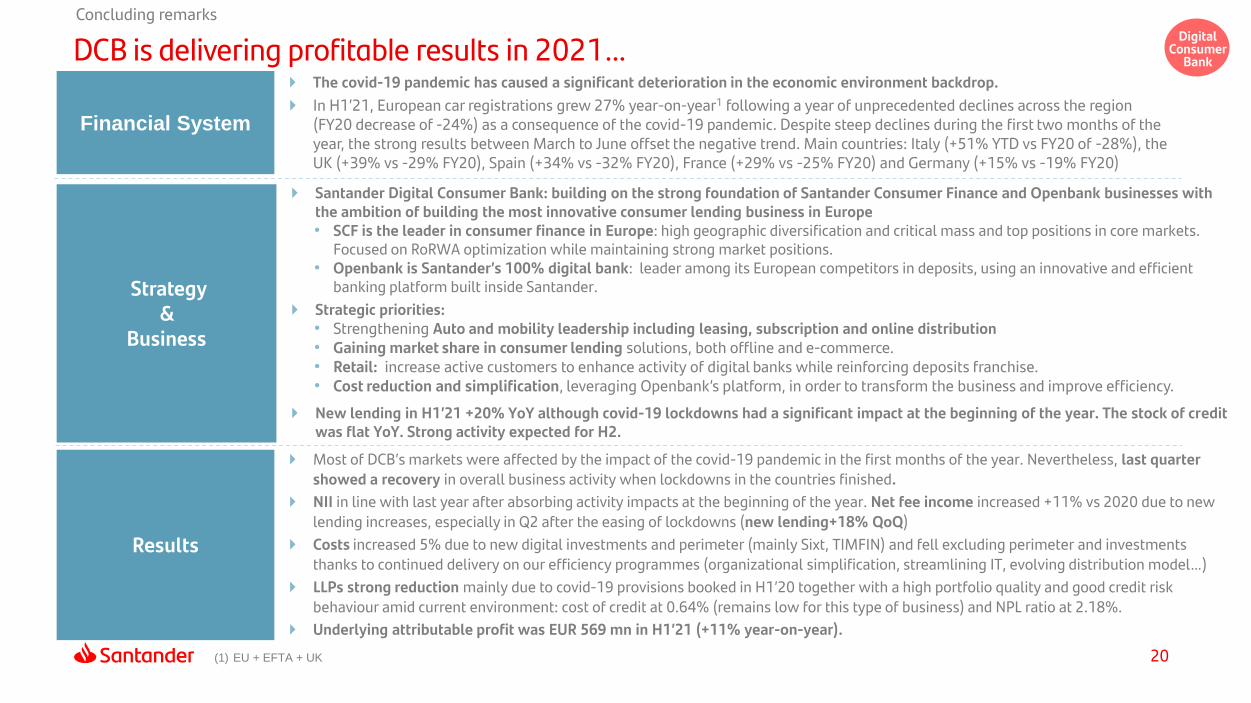
The covid-19 pandemic has caused a significant deterioration in the economic environment backdrop.
In H1’21, European car registrations grew 27% year-on-year1 following a year of unprecedented declines across the region (FY20 decrease of -24%) as a consequence of the covid-19 pandemic. Despite steep declines during the first two months of the year, the strong results between March to June offset the negative trend. Main countries: Italy (+51% YTD vs FY20 of -28%), the UK (+39% vs -29% FY20), Spain (+34% vs -32% FY20), France (+29% vs -25% FY20) and Germany (+15% vs -19% FY20)
Strategy &
Business
Santander Digital Consumer Bank: building on the strong foundation of Santander Consumer Finance and Openbank businesses withthe ambition of building the most innovative consumer lending business in Europe• SCF is the leader in consumer finance in Europe: high geographic diversification and critical mass and top positions in core markets.
Focused on RoRWA optimization while maintaining strong market positions.• Openbank is Santander’s 100% digital bank: leader among its European competitors in deposits, using an innovative and efficient
banking platform built inside Santander.
Strategic priorities: • Strengthening Auto and mobility leadership including leasing, subscription and online distribution• Gaining market share in consumer lending solutions, both offline and e-commerce.• Retail: increase active customers to enhance activity of digital banks while reinforcing deposits franchise.• Cost reduction and simplification, leveraging Openbank’s platform, in order to transform the business and improve efficiency.
New lending in H1’21 +20% YoY although covid-19 lockdowns had a significant impact at the beginning of the year. The stock of credit was flat YoY. Strong activity expected for H2.
Results
Most of DCB’s markets were affected by the impact of the covid-19 pandemic in the first months of the year. Nevertheless, last quarter
showed a recovery in overall business activity when lockdowns in the countries finished.
NII in line with last year after absorbing activity impacts at the beginning of the year. Net fee income increased +11% vs 2020 due to new
lending increases, especially in Q2 after the easing of lockdowns (new lending+18% QoQ)
Costs increased 5% due to new digital investments and perimeter (mainly Sixt, TIMFIN) and fell excluding perimeter and investments
thanks to continued delivery on our efficiency programmes (organizational simplification, streamlining IT, evolving distribution model…)
LLPs strong reduction mainly due to covid-19 provisions booked in H1’20 together with a high portfolio quality and good credit risk
behaviour amid current environment: cost of credit at 0.64% (remains low for this type of business) and NPL ratio at 2.18%.
Underlying attributable profit was EUR 569 mn in H1’21 (+11% year-on-year).
Digital Consumer
Bank
21
Concluding remarks
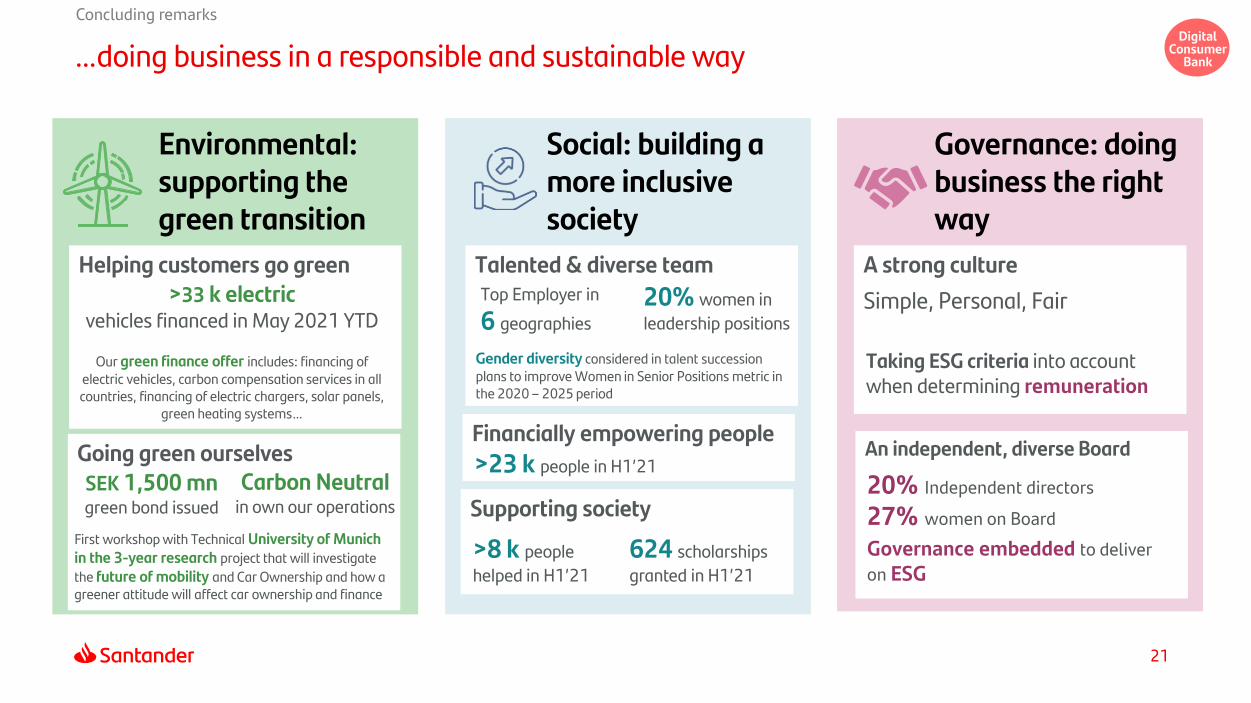
…doing business in a responsible and sustainable way
Going green ourselves
Environmental: supporting the green transition
Social: building a more inclusive society
Helping customers go green
SEK 1,500 mngreen bond issued
Carbon Neutral in own our operations
Financially empowering people
>33 k electricvehicles financed in May 2021 YTD
Our green finance offer includes: financing of electric vehicles, carbon compensation services in all countries, financing of electric chargers, solar panels,
green heating systems…
>23 k people in H1’21
Governance: doing business the right way
A strong culture
Simple, Personal, Fair
Supporting society
>8 k people
helped in H1’21
624 scholarships
granted in H1’21
Talented & diverse teamTop Employer in
6 geographies
20% women in
leadership positions
Taking ESG criteria into account when determining remuneration
Gender diversity considered in talent succession plans to improve Women in Senior Positions metric in the 2020 – 2025 period
An independent, diverse Board
20% Independent directors
27% women on Board
Governance embedded to deliver
on ESG
First workshop with Technical University of Munich in the 3-year research project that will investigate
the future of mobility and Car Ownership and how a greener attitude will affect car ownership and finance
Digital Consumer
Bank
22
Index
1
Strategy and business
2
Results
3
Concluding remarks
4
Appendix
23
Appendix
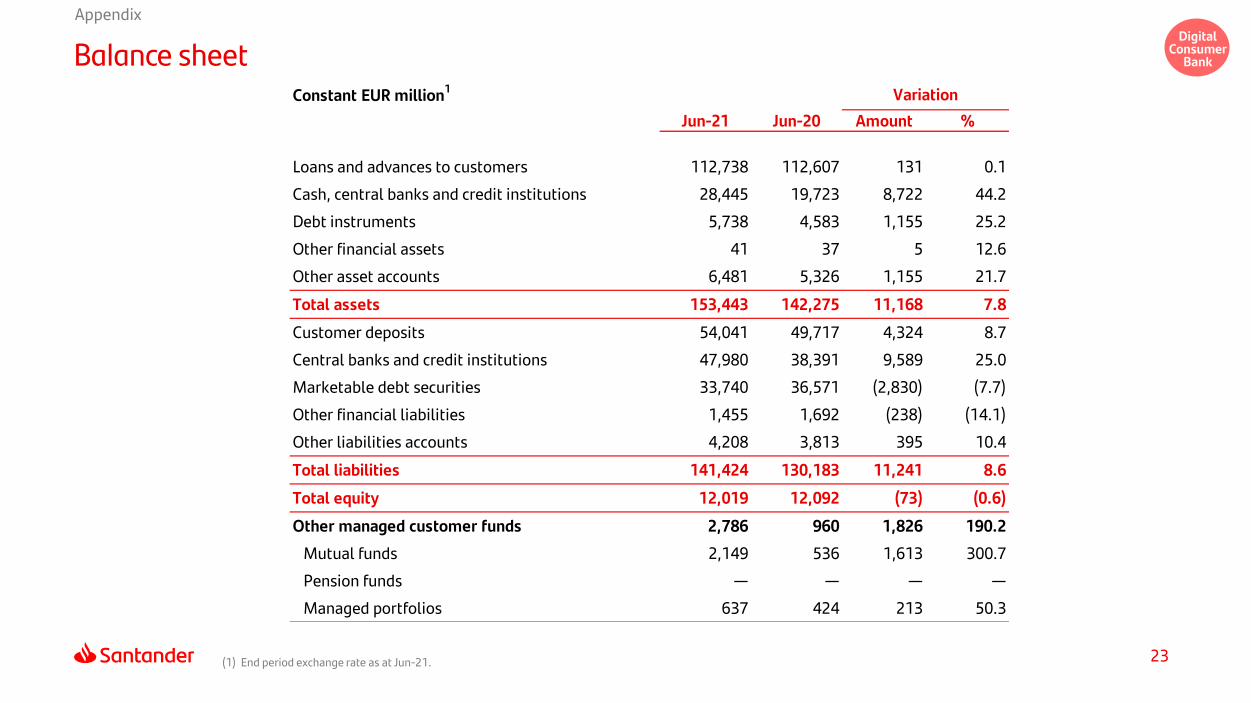
Balance sheet
(1) End period exchange rate as at Jun-21.
Constant EUR million1 Variation
Jun-21 Jun-20 Amount %
Loans and advances to customers 112,738 112,607 131 0.1
Cash, central banks and credit institutions 28,445 19,723 8,722 44.2
Debt instruments 5,738 4,583 1,155 25.2
Other financial assets 41 37 5 12.6
Other asset accounts 6,481 5,326 1,155 21.7
Total assets 153,443 142,275 11,168 7.8
Customer deposits 54,041 49,717 4,324 8.7
Central banks and credit institutions 47,980 38,391 9,589 25.0
Marketable debt securities 33,740 36,571 (2,830) (7.7)
Other financial liabilities 1,455 1,692 (238) (14.1)
Other liabilities accounts 4,208 3,813 395 10.4
Total liabilities 141,424 130,183 11,241 8.6
Total equity 12,019 12,092 (73) (0.6)
Other managed customer funds 2,786 960 1,826 190.2
Mutual funds 2,149 536 1,613 300.7
Pension funds — — — —
Managed portfolios 637 424 213 50.3
Digital Consumer
Bank
24
Change
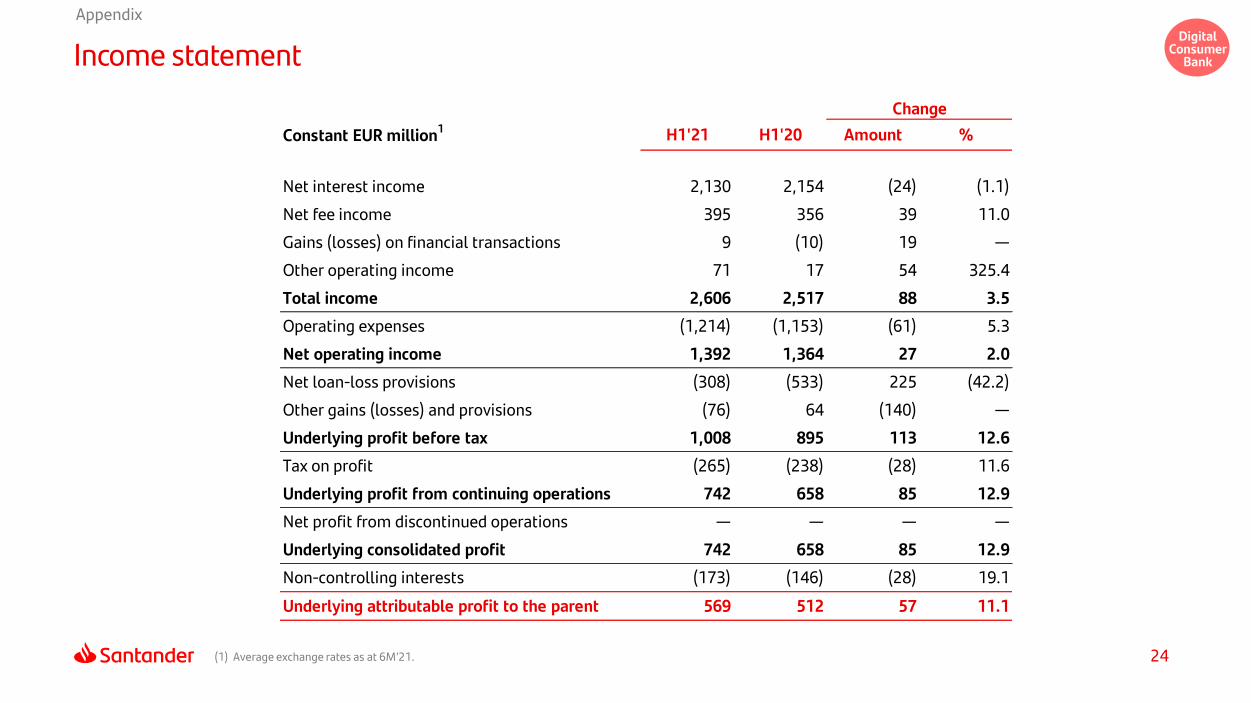
Constant EUR million1 H1'21 H1'20 Amount %
Net interest income 2,130 2,154 (24) (1.1)
Net fee income 395 356 39 11.0
Gains (losses) on financial transactions 9 (10) 19 —
Other operating income 71 17 54 325.4
Total income 2,606 2,517 88 3.5
Operating expenses (1,214) (1,153) (61) 5.3
Net operating income 1,392 1,364 27 2.0
Net loan-loss provisions (308) (533) 225 (42.2)
Other gains (losses) and provisions (76) 64 (140) —
Underlying profit before tax 1,008 895 113 12.6
Tax on profit (265) (238) (28) 11.6
Underlying profit from continuing operations 742 658 85 12.9
Net profit from discontinued operations — — — —
Underlying consolidated profit 742 658 85 12.9
Non-controlling interests (173) (146) (28) 19.1
Underlying attributable profit to the parent 569 512 57 11.1
Appendix
Income statement
(1) Average exchange rates as at 6M’21.
Digital Consumer
Bank
25
Appendix
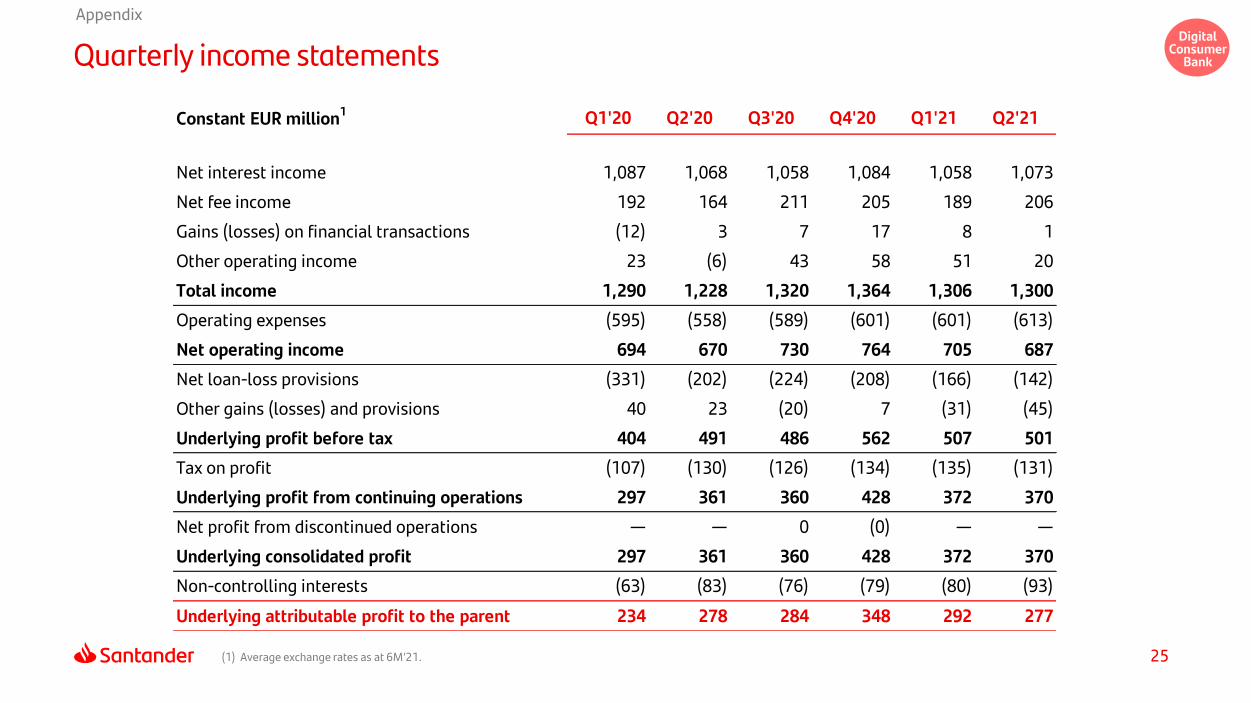
Quarterly income statements
(1) Average exchange rates as at 6M’21.
Constant EUR million1 Q1'20 Q2'20 Q3'20 Q4'20 Q1'21 Q2'21
Net interest income 1,087 1,068 1,058 1,084 1,058 1,073
Net fee income 192 164 211 205 189 206
Gains (losses) on financial transactions (12) 3 7 17 8 1
Other operating income 23 (6) 43 58 51 20
Total income 1,290 1,228 1,320 1,364 1,306 1,300
Operating expenses (595) (558) (589) (601) (601) (613)
Net operating income 694 670 730 764 705 687
Net loan-loss provisions (331) (202) (224) (208) (166) (142)
Other gains (losses) and provisions 40 23 (20) 7 (31) (45)
Underlying profit before tax 404 491 486 562 507 501
Tax on profit (107) (130) (126) (134) (135) (131)
Underlying profit from continuing operations 297 361 360 428 372 370
Net profit from discontinued operations — — 0 (0) — —
Underlying consolidated profit 297 361 360 428 372 370
Non-controlling interests (63) (83) (76) (79) (80) (93)
Underlying attributable profit to the parent 234 278 284 348 292 277
Digital Consumer
Bank

Thank You.
Our purpose is to help people and businesses prosper.
Our culture is based on believing that everything we do should be: