Embed Size (px)
Citation preview

DIFFERENTIATION OF RUSSIAN
REGIONS AND CITIES BY MEDIAN AGE
OF POPULATION AS A CONSEQUENCE
OF INTERNAL MIGRATION
Ilya Kashnitsky
National Research University Higher School of Economics
Institute of Demography
Moscow
Scientific adviser: Nikita Mkrtchan
BSPS 2013, Migration: interregional patterns
Swansea, Great Britain
9 September 2013

Maps of Russia
• Built on Census 2010 data
• Municipal district administrative
level (2343 items)
• Consequence of migration (mainly)
09.09.2013 2

09.09.2013 3

09.09.2013 4

09.09.2013 5

09.09.2013 6

09.09.2013 7

09.09.2013 8
2500 2000 1500 1000 500 0 500 1000 1500 2000 2500
0
5
10
15
20
25
30
35
40
45
50
55
60
65
70
75
80
85
90
95
100+
The demographic structure of the Kurchaloevskiy municipal district, Dagestan
Republic. Median age: 20 years.

09.09.2013 9
2500 2000 1500 1000 500 0 500 1000 1500 2000 2500
0
5
10
15
20
25
30
35
40
45
50
55
60
65
70
75
80
85
90
95
100+
The demographic structure of Norilsk, Krasnoyarskiy Krai. Median age: 33,7 years.

09.09.2013 10

Selectiveness of migration (age issue)
09.09.2013 11
Age specific profiles of intraregional migration (inflow, age group share in the total number of
migrants). Source: Rosstat, current migration record, 2010.
0
1
2
3
4
5
6
7
8
9
10
Altai Krai Kostromskaya Kurskaya Rostovskaya Bashkortostsn Rep

09.09.2013 12

09.09.2013 13

09.09.2013 14

09.09.2013 15

09.09.2013 16

Share of youths (16-29 years)
17 27.06.2013
Region Share of the youth age group (16-29 years) in
intraregional movements
Altai Krai 39,9
Kostromskaya obl. 36,9
Kurskaya obl. 48,2
Rostovskaya obl. 41,3
Bashkortostan Rep. 54,7
Source: Rosstat, current migration record, 2010
This age group is responsible for
40,5% of all interregional resettlements and
40% of all intraregional migrations
recorded in 2010 in Russia

09.09.2013 18

09.09.2013 19

09.09.2013 20

09.09.2013 21
The demographic structure of Pustoshkinskiy municipal district, Pskovskaya oblast’.
Median age: 48,8 years (51,4 for women!).
150 100 50 0 50 100 150
0
5
10
15
20
25
30
35
40
45
50
55
60
65
70
75
80
85
90
95
100+
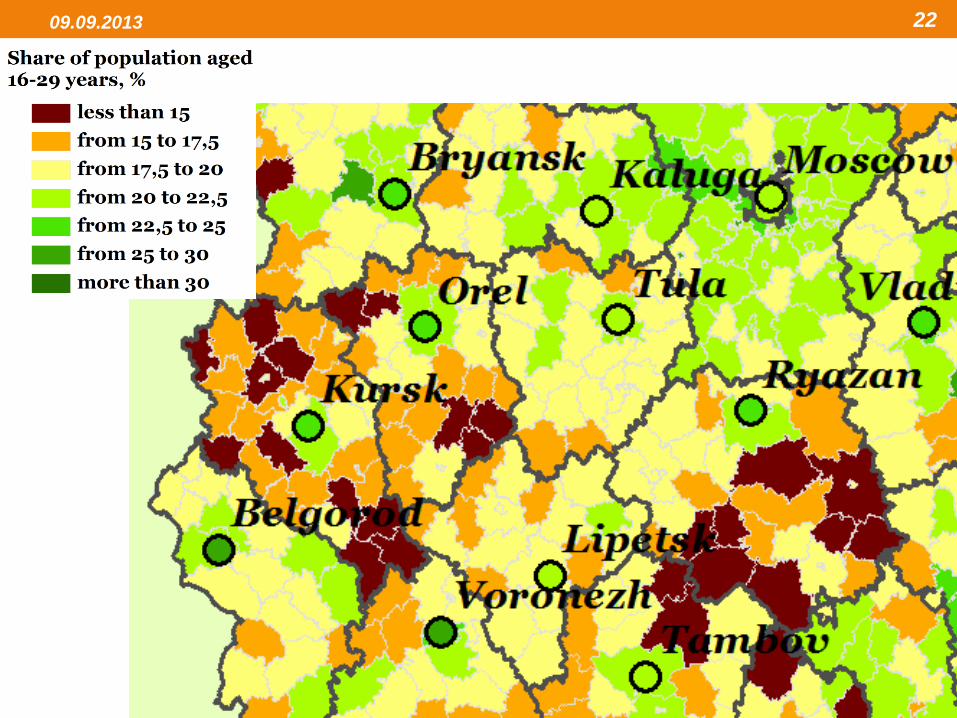
09.09.2013 22

09.09.2013 23

09.09.2013 24
09.09.2013 25
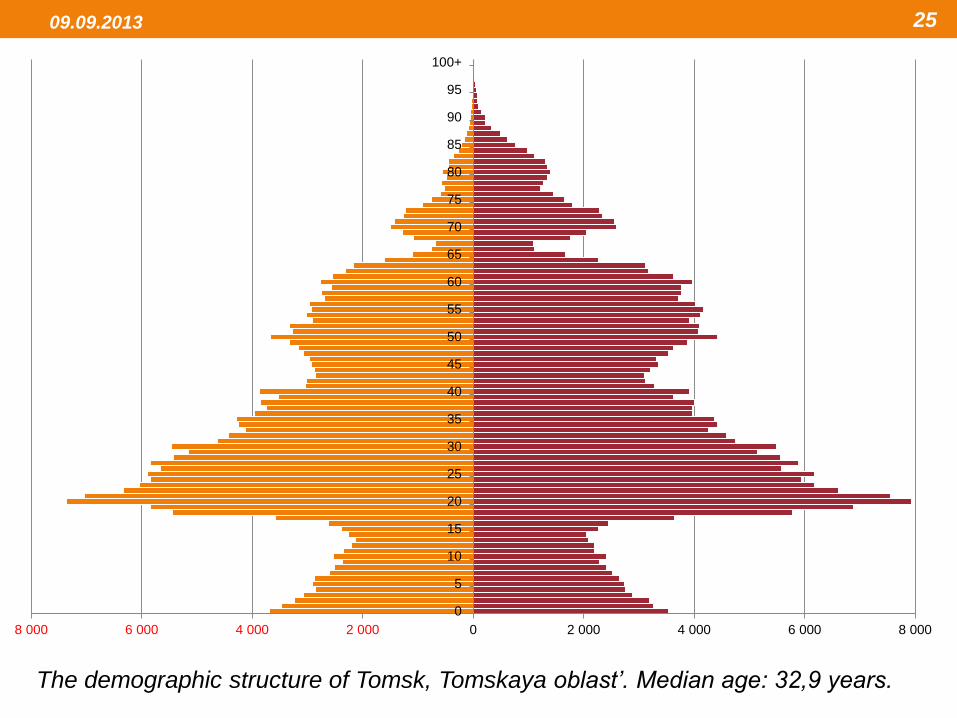
The demographic structure of Tomsk, Tomskaya oblast’. Median age: 32,9 years.
8 000 6 000 4 000 2 000 0 2 000 4 000 6 000 8 000
0
5
10
15
20
25
30
35
40
45
50
55
60
65
70
75
80
85
90
95
100+

09.09.2013 26

09.09.2013 27

Group of
territories
Mean value
Women
per 1000
men
Median age Burden on the
working age
population
The share
of the
young
(16-29
years)
The whole
population Men Women
(1) (2) (3) (4) (5) (6)
Regional centers 1218 36,3 33,6 39,1 57 24,5
More than 250 K 1169 37,6 34,8 40,5 58 22,1
More than 100 K 1160 37,7 34,7 40,7 64 21,6
Towns (< 100 K) 1140 37,6 34,7 40,6 64 20,7
Municipal districts 1118 39,7 36,7 42,6 70 19,1
Closed areas 982 33,7 30,7 37,4 50 26,7
RUSSIA 1125 39,0 36,0 42,0 67,8 19,8
09.09.2013 28
Source: Census 2010 data

The goal of the research is
• to see how the demographic
structures form under the influence
of migration
• to look the differences on municipal
level caused by internal migration
• to evaluate the scale of centripetal
youth migration
09.09.2013 29

Cohort research on youth migration
• 5 regions:
Altai Krai, Kostromskaya oblast’,
Kurskaya oblast’, Rostovskaya oblast’
and Bashkortostan Republic
• 5 cohorts:
from 1988 to 1992 years of birth
• 2 Censuses:
2002 and 2010
09.09.2013 30

Statistic discrepancy
Cohort of 1988-1992 years of bitrh
Region
Alt
ai
Kra
i
Ko
stro
msk
ay
a oblast’
Ku
rsk
ay
a
oblast’
Ro
sto
vsk
ay
a
oblast’
Ba
shk
ort
ost
a
n R
epu
bli
c
Population in 2002 183477 51412 84398 297503 346412
Population in 2010 172493 44446 74400 335303 324327
Dead in 2003-2010 1617 430 587 1968 2967
Change by the Censuses -10984 -6966 -9998 37800 -22085
Registered migration in 2003-2010 -5880 -1435 -583 1428 -1066
Discrepancy -3487 -5101 -8828 38340 -18052
Unaccounted change, % -1,9 -9,9 -10,5 12,9 -5,2
09.09.2013 31
Source: the Censuses 2002 and 2010, Rosstat, the current record.

09.09.2013 32

09.09.2013 33

Regional center’s migration attractiveness
• The idea:
to compare the cohort intensity of intraregional
migration by several adjacent one-year cohorts
(from 1988 to 1992 in our case)
• The task:
to calculate the intensity of migration for every
age of every cohort in every possible calendar
year
• The hypothesis:
by the means of this analysis we can roughly
judge the dynamics of regional center’s (centers)
migration attractiveness
09.09.2013 34

09.09.2013 35

Results
• Migration proves to be the main factor of
changes in the demographic structures
• The most depressive districts have lost more
than 60% of school graduates during the last
inter-Census period
• The remoteness of the peripheral district
determines the level of its depressiveness
• Every big center of migration attraction forms
a depressive ring around itself
• Author’s method of apprising the dynamics of
regional center’s (centers) migration
attractiveness
09.09.2013 36

Links for the maps
The whole gallery of maps (18) can be viewed
and downloaded here:
Via Google Drive https://drive.google.com/folderview?id=0B1Cid1hm5YLRRk5oQ09
Zd3FJX00&usp=sharing
Via Yandex Disk http://yadi.sk/d/4RNwbvgb6NGoo
Via Dropbox https://www.dropbox.com/sh/uxp809hqos4gtyk/po1grLna-w
09.09.2013 37
Ilya Kashnitsky [email protected]
+7(916)-037-38-12
National Research University
Higher School of Economics
Institute of Demography
Moscow, Russia