Embed Size (px)
Citation preview

Differentiating Employee Value Proposition for the Sales Force
Scott SandsGlobal Practice Leader, Sales Force EffectivenessHewitt Associates

2009 Total Rewards Conference & Exhibition2
Presentation OverviewElements of the Employee Value Proposition
Hypothesis 1: Sales people, as long suspected, will be highly motivated by short-term cash compensation
Hypothesis 2: Senior sales reps’ criteria evolve to be different from junior reps, specifically increasing value on non-compensation elements
Hypothesis 3: Both top performing and highly engaged reps will be more focused on “Selling Environment” factors than pure compensation, independent of geography
Findings and Conclusions

2009 Total Rewards Conference & Exhibition3
The WorldatWork’s EVP Model

2009 Total Rewards Conference & Exhibition4
Surveyed EVP Elements Specific to SalesDirect Financial Compensation
Base Salary
Target Incentive
Upside Availability
Equity
Indirect Financial CompensationHealthcare
Retirement
PTO
Company Car
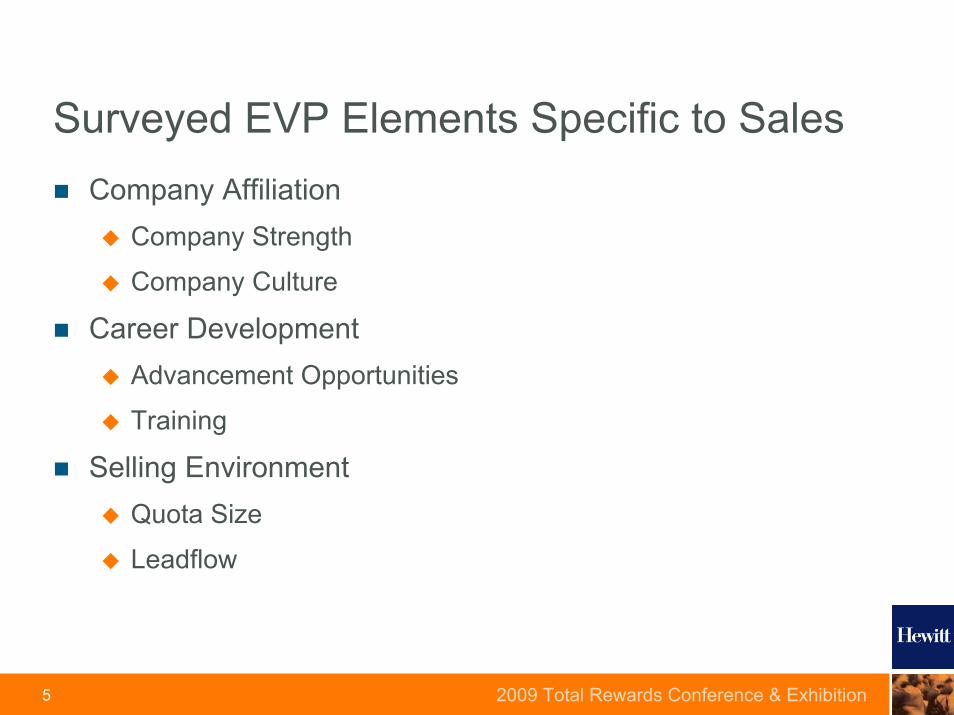
2009 Total Rewards Conference & Exhibition5
Surveyed EVP Elements Specific to SalesCompany Affiliation
Company Strength
Company Culture
Career DevelopmentAdvancement Opportunities
Training
Selling EnvironmentQuota Size
Leadflow

2009 Total Rewards Conference & Exhibition6
Survey MethodologyGathered responses from over 1200 sales representatives and first line managers
Used online survey tool
Combined “rate-and-rank” questions with a “conjoint lite”approach to determining trade-offs and preferences
Survey was open for two months during the Winter of 2009…a unique economic period
There is a relatively even mix of industries, seniority, geographies and hierarchy, but we are keeping the survey open to encourage more submissions and monitor change over time

2009 Total Rewards Conference & Exhibition7
Why did we feel this research was critical?The sales role is significantly different than other corporate roles:
IndependentRemoteDirect Line of Sight to Financial ResultsCustomer ContactPay PremiumRisk Intense
We did not see previous research addressing unique aspects of the sales role
Companies need high ROI tools for this economic period

2009 Total Rewards Conference & Exhibition8
We see sales teams leaning heavily on compensation, instead of other levers
We help our clients improve sales performance by getting the most out of their investments in sales people, creating a rewarding
environment for sales people and company shareholders
Realize Business Impact
Performance and Rewards
– Selling and Service Model
– Job Roles and Structure
– Deployment Planning
– Recruiting and Selection
– Career Paths
– Training and Development
– Compensation and Recognition
– Quotas and Measurement
– Performance Management
Talent Management
Organization Design
Creating a sales structure that is effective in meeting customer needs in an efficient manner…
Ensuring the availability of the right talent for the right role at the right time…
Maximizing the productivityof an engaged sales force to exceed business goals…
Align the Sales Force
Customer Insight
Business Strategies
Value Proposition
Competitive Dynamics
Understand Business Drivers

2009 Total Rewards Conference & Exhibition9
Even the sub-components of sales compensation have unique appeal
1. Business Objectives, Sales Strategy, & Roles
2.Eligibility
3.Target Pay Levels
6.Measures/Weights
5.Upside Opportunity
8.Quotas/Crediting
9.Payout Timing
4.Pay Mix
7.Mechanics
10.Administration
Competitive Aligned Effective

2009 Total Rewards Conference & Exhibition10
Hypothesis 1: Sales people are highly motivated by short-term cash compensation
Importance of Each Factor in Deciding Whether to Stay in Role or Take Another
0% 10% 20% 30% 40% 50% 60% 70% 80% 90% 100%
Company Car
Recognition Trip
Equity/Stock Grants
Value of Sales Leads Provided
Sales Training Provided
Quota Size
Paid Time Off
Company Culture
Company Strength
Retirement Benefits
Future Career Advancement
Health Benefits
Base Salary
Variable Incentive Opportunity
Perc
ent o
f Res
pond
ents
Not a Consideration Not Important, but Considered Important Critical

2009 Total Rewards Conference & Exhibition11
Importance of Each Factor in Motivating You to Perform
0% 10% 20% 30% 40% 50% 60% 70% 80% 90% 100%
Company Car
Recognition Trip
Sales Training Provided
Value of Sales Leads Provided
Equity/Stock Grants
Company Strength
Retirement Benefits
Paid Time Off
Company Culture
Health Benefits
Future Career Advancement
Quota Size
Base Salary
Variable Incentive Opportunity
Perc
ent o
f Res
pond
ents
Not a Consideration Not Important, but Considered Important Critical
Hypothesis 1: Sales people are highly motivated by short-term cash compensation

2009 Total Rewards Conference & Exhibition12
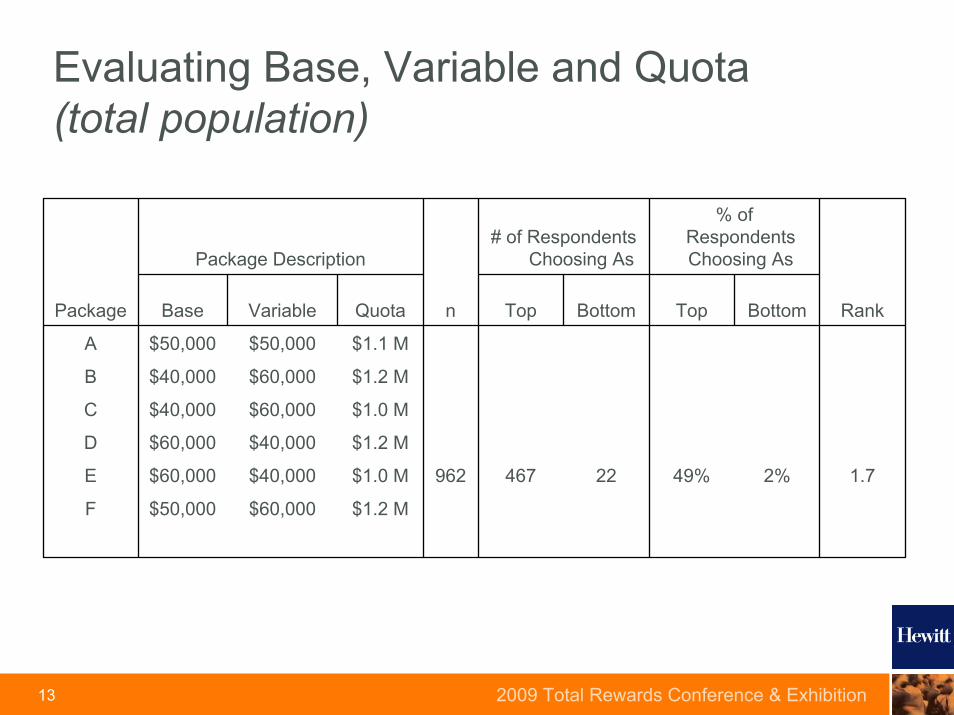
Evaluating Base, Variable and Quota(total population)
Package Description# of Respondents
Choosing As
% of Respondents Choosing As
Package Base Variable Quota n Top Bottom Top Bottom Rank
A $50,000 $50,000 $1.1 M 957 29 63 3% 7% 2.9
B $40,000 $60,000 $1.2 M 954 6 618 1% 65% 4.2
C $40,000 $60,000 $1.0 M 950 63 93 7% 10% 3.3
D $60,000 $40,000 $1.2 M 952 78 117 8% 12% 2.6
E $60,000 $40,000 $1.0 M 962 467 22 49% 2% 1.7
F $50,000 $60,000 $1.2 M 957 320 38 33% 4% 2.0
2009 Total Rewards Conference & Exhibition13
Evaluating Base, Variable and Quota(total population)
Package Description# of Respondents
Choosing As
% of Respondents Choosing As
Package Base Variable Quota n Top Bottom Top Bottom Rank
A $50,000 $50,000 $1.1 M 957 29 63 3% 7% 2.9
B $40,000 $60,000 $1.2 M 954 6 618 1% 65% 4.2
C $40,000 $60,000 $1.0 M 950 63 93 7% 10% 3.3
D $60,000 $40,000 $1.2 M 952 78 117 8% 12% 2.6
E $60,000 $40,000 $1.0 M 962 467 22 49% 2% 1.7
F $50,000 $60,000 $1.2 M 957 320 38 33% 4% 2.0

2009 Total Rewards Conference & Exhibition14
Evaluating Base, Variable and Quota(total population)
Package Description# of Respondents
Choosing As
% of Respondents Choosing As
Package Base Variable Quota n Top Bottom Top Bottom Rank
A $50,000 $50,000 $1.1 M 957 29 63 3% 7% 2.9
B $40,000 $60,000 $1.2 M 954 6 618 1% 65% 4.2
C $40,000 $60,000 $1.0 M 950 63 93 7% 10% 3.3
D $60,000 $40,000 $1.2 M 952 78 117 8% 12% 2.6
E $60,000 $40,000 $1.0 M 962 467 22 49% 2% 1.7
F $50,000 $60,000 $1.2 M 957 320 38 33% 4% 2.0

2009 Total Rewards Conference & Exhibition15
Evaluating Base, Variable and Quota(total population)
Package Description# of Respondents
Choosing As
% of Respondents Choosing As
Package Base Variable Quota n Top Bottom Top Bottom Rank
A $50,000 $50,000 $1.1 M 957 29 63 3% 7% 2.9
B $40,000 $60,000 $1.2 M 954 6 618 1% 65% 4.2
C $40,000 $60,000 $1.0 M 950 63 93 7% 10% 3.3
D $60,000 $40,000 $1.2 M 952 78 117 8% 12% 2.6
E $60,000 $40,000 $1.0 M 962 467 22 49% 2% 1.7
F $50,000 $60,000 $1.2 M 957 320 38 33% 4% 2.0

2009 Total Rewards Conference & Exhibition16
Evaluating Base, Variable and Quota(total population)
Package Description# of Respondents
Choosing As
% of Respondents Choosing As
Package Base Variable Quota n Top Bottom Top Bottom Rank
A $50,000 $50,000 $1.1 M 957 29 63 3% 7% 2.9
B $40,000 $60,000 $1.2 M 954 6 618 1% 65% 4.2
C $40,000 $60,000 $1.0 M 950 63 93 7% 10% 3.3
D $60,000 $40,000 $1.2 M 952 78 117 8% 12% 2.6
E $60,000 $40,000 $1.0 M 962 467 22 49% 2% 1.7
F $50,000 $60,000 $1.2 M 957 320 38 33% 4% 2.0

2009 Total Rewards Conference & Exhibition17
Evaluating Base, Variable and Quota(total population)
Package Description# of Respondents
Choosing As
% of Respondents Choosing As
Package Base Variable Quota n Top Bottom Top Bottom Rank
A $50,000 $50,000 $1.1 M 957 29 63 3% 7% 2.9
B $40,000 $60,000 $1.2 M 954 6 618 1% 65% 4.2
C $40,000 $60,000 $1.0 M 950 63 93 7% 10% 3.3
D $60,000 $40,000 $1.2 M 952 78 117 8% 12% 2.6
E $60,000 $40,000 $1.0 M 962 467 22 49% 2% 1.7
F $50,000 $60,000 $1.2 M 957 320 38 33% 4% 2.0

2009 Total Rewards Conference & Exhibition18
Evaluating Base, Variable and Quota(total population)
Package Description# of Respondents
Choosing As
% of Respondents Choosing As
Package Base Variable Quota n Top Bottom Top Bottom Rank
A $50,000 $50,000 $1.1 M 957 29 63 3% 7% 2.9
B $40,000 $60,000 $1.2 M 954 6 618 1% 65% 4.2
C $40,000 $60,000 $1.0 M 950 63 93 7% 10% 3.3
D $60,000 $40,000 $1.2 M 952 78 117 8% 12% 2.6
E $60,000 $40,000 $1.0 M 962 467 22 49% 2% 1.7
F $50,000 $60,000 $1.2 M 957 320 38 33% 4% 2.0

2009 Total Rewards Conference & Exhibition19
Evaluating Quota, Mix and Acceleration(total population)
Package Description# of Respondents
Choosing As
% of Respondents Choosing As
Package Quota Pay Mix
Above Quota
Acceleration n Top Bottom Top BottomAverage
Rank
A $1.1 M 50/50 2x 929 13 87 1% 9% 3.3
B $1.2 M 40/60 2x 925 3 612 0% 66% 4.1
C $1.0 M 40/60 3x 928 215 45 23% 5% 2.6
D $1.2 M 60/40 3x 936 448 21 48% 2% 1.6
E $1.0 M 60/40 2x 929 155 125 17% 13% 2.5
F $1.2 M 50/50 3x 934 102 37 11% 4% 2.1

2009 Total Rewards Conference & Exhibition20
Evaluating Quota, Mix and Acceleration(total population)
Package Description# of Respondents
Choosing As
% of Respondents Choosing As
Package Quota Pay Mix
Above Quota
Acceleration n Top Bottom Top BottomAverage
Rank
A $1.1 M 50/50 2x 929 13 87 1% 9% 3.3
B $1.2 M 40/60 2x 925 3 612 0% 66% 4.1
C $1.0 M 40/60 3x 928 215 45 23% 5% 2.6
D $1.2 M 60/40 3x 936 448 21 48% 2% 1.6
E $1.0 M 60/40 2x 929 155 125 17% 13% 2.5
F $1.2 M 50/50 3x 934 102 37 11% 4% 2.1

2009 Total Rewards Conference & Exhibition21
Evaluating Quota, Mix and Acceleration(total population)
Package Description# of Respondents
Choosing As
% of Respondents Choosing As
Package Quota Pay Mix
Above Quota
Acceleration n Top Bottom Top BottomAverage
Rank
A $1.1 M 50/50 2x 929 13 87 1% 9% 3.3
B $1.2 M 40/60 2x 925 3 612 0% 66% 4.1
C $1.0 M 40/60 3x 928 215 45 23% 5% 2.6
D $1.2 M 60/40 3x 936 448 21 48% 2% 1.6
E $1.0 M 60/40 2x 929 155 125 17% 13% 2.5
F $1.2 M 50/50 3x 934 102 37 11% 4% 2.1

2009 Total Rewards Conference & Exhibition22
Evaluating Quota, Mix and Acceleration(total population)
Package Description# of Respondents
Choosing As
% of Respondents Choosing As
Package Quota Pay Mix
Above Quota
Acceleration n Top Bottom Top BottomAverage
Rank
A $1.1 M 50/50 2x 929 13 87 1% 9% 3.3
B $1.2 M 40/60 2x 925 3 612 0% 66% 4.1
C $1.0 M 40/60 3x 928 215 45 23% 5% 2.6
D $1.2 M 60/40 3x 936 448 21 48% 2% 1.6
E $1.0 M 60/40 2x 929 155 125 17% 13% 2.5
F $1.2 M 50/50 3x 934 102 37 11% 4% 2.1

2009 Total Rewards Conference & Exhibition23
Evaluating Quota, Mix and Acceleration(total population)
Package Description# of Respondents
Choosing As
% of Respondents Choosing As
Package Quota Pay Mix
Above Quota
Acceleration n Top Bottom Top BottomAverage
Rank
A $1.1 M 50/50 2x 929 13 87 1% 9% 3.3
B $1.2 M 40/60 2x 925 3 612 0% 66% 4.1
C $1.0 M 40/60 3x 928 215 45 23% 5% 2.6
D $1.2 M 60/40 3x 936 448 21 48% 2% 1.6
E $1.0 M 60/40 2x 929 155 125 17% 13% 2.5
F $1.2 M 50/50 3x 934 102 37 11% 4% 2.1

2009 Total Rewards Conference & Exhibition24
Evaluating Quota, Mix and Acceleration(total population)
Package Description# of Respondents
Choosing As
% of Respondents Choosing As
Package Quota Pay Mix
Above Quota
Acceleration n Top Bottom Top BottomAverage
Rank
A $1.1 M 50/50 2x 929 13 87 1% 9% 3.3
B $1.2 M 40/60 2x 925 3 612 0% 66% 4.1
C $1.0 M 40/60 3x 928 215 45 23% 5% 2.6
D $1.2 M 60/40 3x 936 448 21 48% 2% 1.6
E $1.0 M 60/40 2x 929 155 125 17% 13% 2.5
F $1.2 M 50/50 3x 934 102 37 11% 4% 2.1

2009 Total Rewards Conference & Exhibition25
Evaluating Quota, Mix and Acceleration(total population)
Package Description# of Respondents
Choosing As
% of Respondents Choosing As
Package Quota Pay Mix
Above Quota
Acceleration n Top Bottom Top BottomAverage
Rank
A $1.1 M 50/50 2x 929 13 87 1% 9% 3.3
B $1.2 M 40/60 2x 925 3 612 0% 66% 4.1
C $1.0 M 40/60 3x 928 215 45 23% 5% 2.6
D $1.2 M 60/40 3x 936 448 21 48% 2% 1.6
E $1.0 M 60/40 2x 929 155 125 17% 13% 2.5
F $1.2 M 50/50 3x 934 102 37 11% 4% 2.1

2009 Total Rewards Conference & Exhibition26
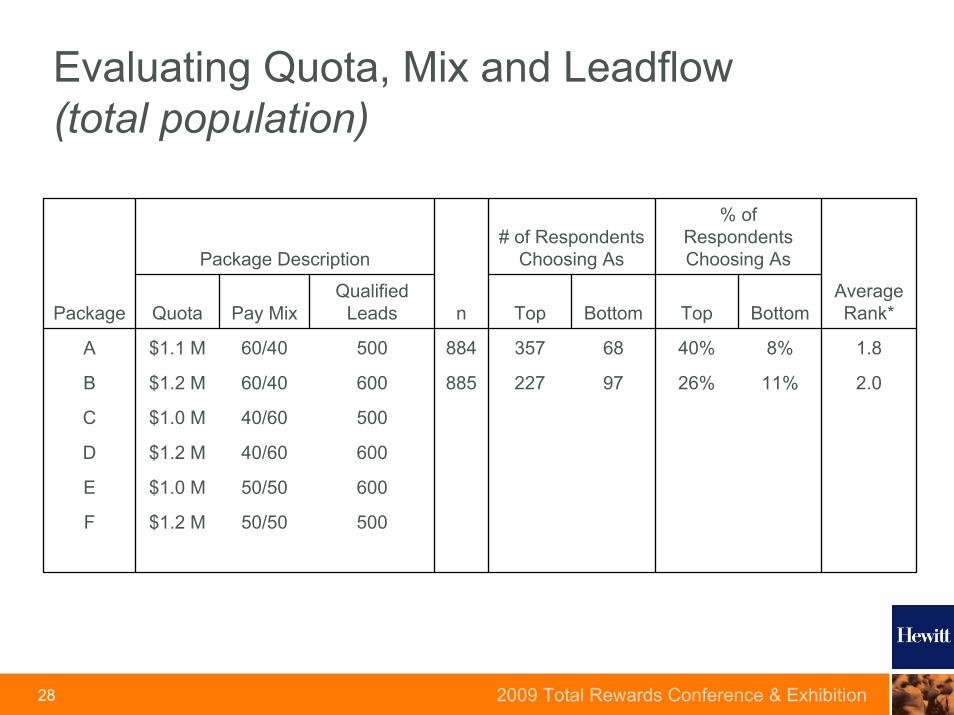
Evaluating Quota, Mix and Leadflow(total population)
Package Description# of Respondents
Choosing As
% of Respondents Choosing As
Package Quota Pay MixQualified
Leads n Top Bottom Top BottomAverage Rank*
A $1.1 M 60/40 500 884 357 68 40% 8% 1.8
B $1.2 M 60/40 600 885 227 97 26% 11% 2.0
C $1.0 M 40/60 500 882 102 214 12% 24% 3.2
D $1.2 M 40/60 600 882 54 358 6% 41% 3.4
E $1.0 M 50/50 600 888 129 21 15% 2% 2.1
F $1.2 M 50/50 500 885 22 124 2% 14% 3.0

2009 Total Rewards Conference & Exhibition27
Evaluating Quota, Mix and Leadflow(total population)
Package Description# of Respondents
Choosing As
% of Respondents Choosing As
Package Quota Pay MixQualified
Leads n Top Bottom Top BottomAverage Rank*
A $1.1 M 60/40 500 884 357 68 40% 8% 1.8
B $1.2 M 60/40 600 885 227 97 26% 11% 2.0
C $1.0 M 40/60 500 882 102 214 12% 24% 3.2
D $1.2 M 40/60 600 882 54 358 6% 41% 3.4
E $1.0 M 50/50 600 888 129 21 15% 2% 2.1
F $1.2 M 50/50 500 885 22 124 2% 14% 3.0
2009 Total Rewards Conference & Exhibition28
Evaluating Quota, Mix and Leadflow(total population)
Package Description# of Respondents
Choosing As
% of Respondents Choosing As
Package Quota Pay MixQualified
Leads n Top Bottom Top BottomAverage Rank*
A $1.1 M 60/40 500 884 357 68 40% 8% 1.8
B $1.2 M 60/40 600 885 227 97 26% 11% 2.0
C $1.0 M 40/60 500 882 102 214 12% 24% 3.2
D $1.2 M 40/60 600 882 54 358 6% 41% 3.4
E $1.0 M 50/50 600 888 129 21 15% 2% 2.1
F $1.2 M 50/50 500 885 22 124 2% 14% 3.0

2009 Total Rewards Conference & Exhibition29
Evaluating Quota, Mix and Leadflow(total population)
Package Description# of Respondents
Choosing As
% of Respondents Choosing As
Package Quota Pay MixQualified
Leads n Top Bottom Top BottomAverage Rank*
A $1.1 M 60/40 500 884 357 68 40% 8% 1.8
B $1.2 M 60/40 600 885 227 97 26% 11% 2.0
C $1.0 M 40/60 500 882 102 214 12% 24% 3.2
D $1.2 M 40/60 600 882 54 358 6% 41% 3.4
E $1.0 M 50/50 600 888 129 21 15% 2% 2.1
F $1.2 M 50/50 500 885 22 124 2% 14% 3.0

2009 Total Rewards Conference & Exhibition30
Evaluating Quota, Mix and Leadflow(total population)
Package Description# of Respondents
Choosing As
% of Respondents Choosing As
Package Quota Pay MixQualified
Leads n Top Bottom Top BottomAverage Rank*
A $1.1 M 60/40 500 884 357 68 40% 8% 1.8
B $1.2 M 60/40 600 885 227 97 26% 11% 2.0
C $1.0 M 40/60 500 882 102 214 12% 24% 3.2
D $1.2 M 40/60 600 882 54 358 6% 41% 3.4
E $1.0 M 50/50 600 888 129 21 15% 2% 2.1
F $1.2 M 50/50 500 885 22 124 2% 14% 3.0
2009 Total Rewards Conference & Exhibition31
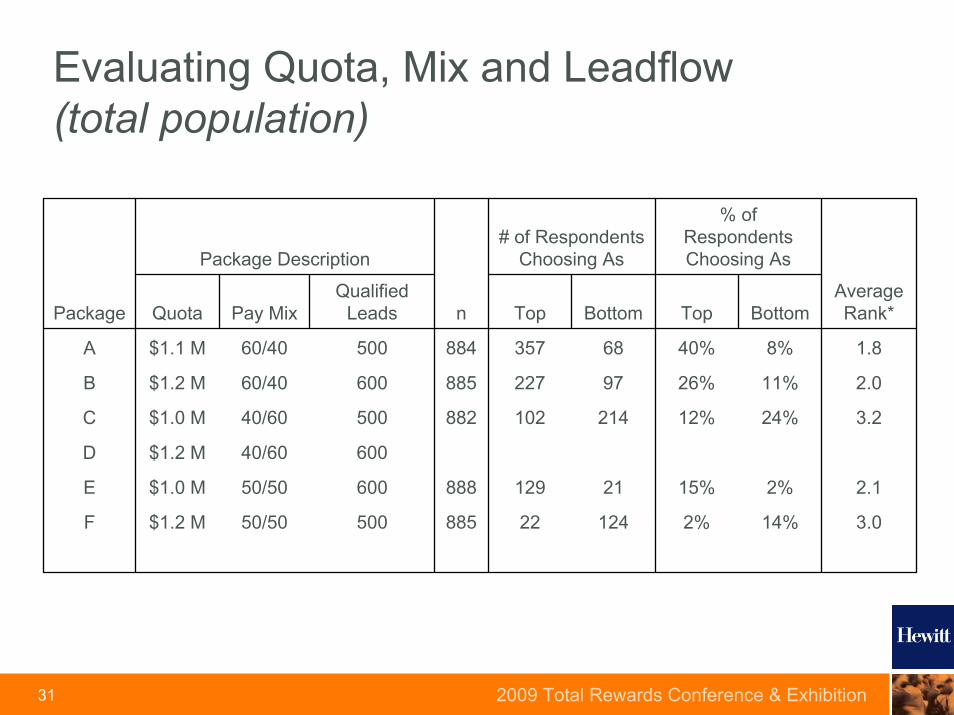
Evaluating Quota, Mix and Leadflow(total population)
Package Description# of Respondents
Choosing As
% of Respondents Choosing As
Package Quota Pay MixQualified
Leads n Top Bottom Top BottomAverage Rank*
A $1.1 M 60/40 500 884 357 68 40% 8% 1.8
B $1.2 M 60/40 600 885 227 97 26% 11% 2.0
C $1.0 M 40/60 500 882 102 214 12% 24% 3.2
D $1.2 M 40/60 600 882 54 358 6% 41% 3.4
E $1.0 M 50/50 600 888 129 21 15% 2% 2.1
F $1.2 M 50/50 500 885 22 124 2% 14% 3.0

2009 Total Rewards Conference & Exhibition32
Evaluating Quota, Mix and Leadflow(total population)
Package Description# of Respondents
Choosing As
% of Respondents Choosing As
Package Quota Pay MixQualified
Leads n Top Bottom Top BottomAverage Rank*
A $1.1 M 60/40 500 884 357 68 40% 8% 1.8
B $1.2 M 60/40 600 885 227 97 26% 11% 2.0
C $1.0 M 40/60 500 882 102 214 12% 24% 3.2
D $1.2 M 40/60 600 882 54 358 6% 41% 3.4
E $1.0 M 50/50 600 888 129 21 15% 2% 2.1
F $1.2 M 50/50 500 885 22 124 2% 14% 3.0

2009 Total Rewards Conference & Exhibition33
Each package has a different payout – rep confidence is critical to assessing value
Six Packages - Payout
$0.00$20,000.00$40,000.00$60,000.00$80,000.00
$100,000.00$120,000.00$140,000.00$160,000.00$180,000.00$200,000.00
1000 1200 1400 1600 1800 2000 2200 2400 2600 2800 3000
Avg. Lead Value
Payo
ut
ABCDEF

2009 Total Rewards Conference & Exhibition34
Importance of Each Factor in Deciding Whether to Stay in Role or Take Another
0% 10% 20% 30% 40% 50% 60% 70% 80% 90% 100%
Company Car
Recognition Trip
Equity/Stock Grants
Value of Sales Leads Provided
Sales Training Provided
Quota Size
Paid Time Off
Company Culture
Company Strength
Retirement Benefits
Future Career Advancement
Health Benefits
Base Salary
Variable Incentive Opportunity
Perc
ent o
f Res
pond
ents
Not a Consideration Not Important, but Considered Important Critical
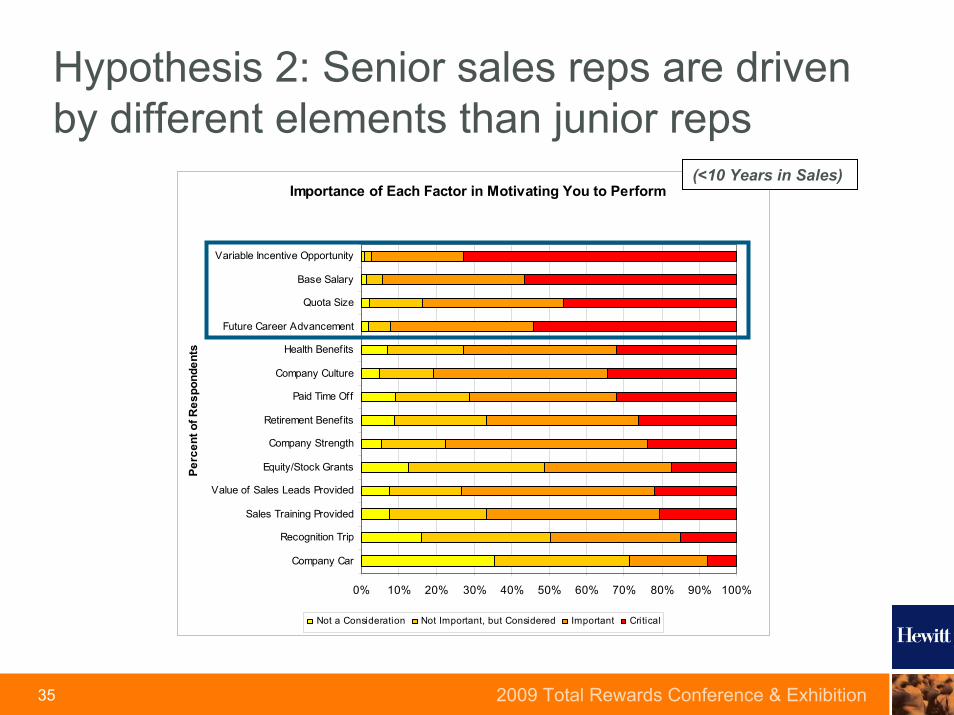
Hypothesis 2: Senior sales reps are driven by different elements than junior reps
(<10 Years in Sales)
2009 Total Rewards Conference & Exhibition35
Importance of Each Factor in Motivating You to Perform
0% 10% 20% 30% 40% 50% 60% 70% 80% 90% 100%
Company Car
Recognition Trip
Sales Training Provided
Value of Sales Leads Provided
Equity/Stock Grants
Company Strength
Retirement Benefits
Paid Time Off
Company Culture
Health Benefits
Future Career Advancement
Quota Size
Base Salary
Variable Incentive Opportunity
Perc
ent o
f Res
pond
ents
Not a Consideration Not Important, but Considered Important Critical
Hypothesis 2: Senior sales reps are driven by different elements than junior reps
(<10 Years in Sales)

2009 Total Rewards Conference & Exhibition36
Importance of Each Factor in Deciding Whether to Stay in Role or Take Another
0% 10% 20% 30% 40% 50% 60% 70% 80% 90% 100%
Company Car
Recognition Trip
Equity/Stock Grants
Value of Sales Leads Provided
Sales Training Provided
Quota Size
Paid Time Off
Company Culture
Company Strength
Retirement Benefits
Future Career Advancement
Health Benefits
Base Salary
Variable Incentive Opportunity
Perc
ent o
f Res
pond
ents
Not a Consideration Not Important, but Considered Important Critical
Hypothesis 2: Senior sales reps are driven by different elements than junior reps
(>10 Years in Sales)
XX

2009 Total Rewards Conference & Exhibition37
Importance of Each Factor in Motivating You to Perform
0% 10% 20% 30% 40% 50% 60% 70% 80% 90% 100%
Company Car
Recognition Trip
Sales Training Provided
Value of Sales Leads Provided
Equity/Stock Grants
Company Strength
Retirement Benefits
Paid Time Off
Company Culture
Health Benefits
Future Career Advancement
Quota Size
Base Salary
Variable Incentive Opportunity
Perc
ent o
f Res
pond
ents
Not a Consideration Not Important, but Considered Important Critical
Hypothesis 2: Senior sales reps are driven by different elements than junior reps
(>10 Years in Sales)
??

2009 Total Rewards Conference & Exhibition38
First Packages - Drivers by Sales Tenure
0%10%20%30%40%50%60%70%80%90%
Lessthan2yrs
2-5yrs 5-10yrs
10-15yrs
15-20yrs
20-25yrs
Over25yrs
Base SalaryQuotaTTC
Over time, base salary becomes less important as sales people select a package
XX
2009 Total Rewards Conference & Exhibition39
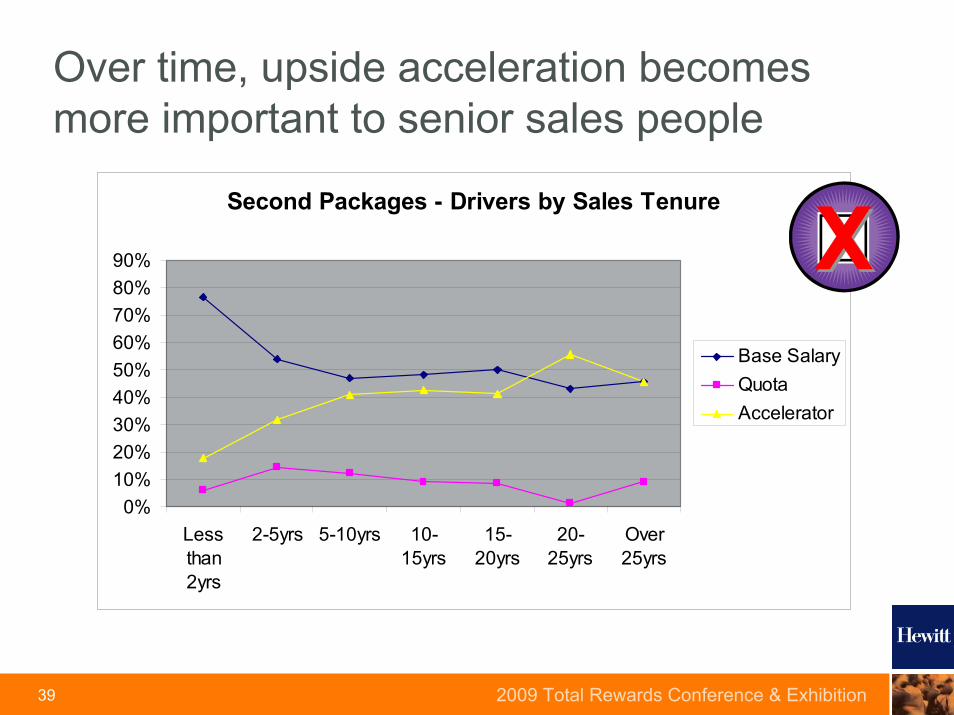
Second Packages - Drivers by Sales Tenure
0%10%20%30%40%50%60%70%80%90%
Lessthan2yrs
2-5yrs 5-10yrs 10-15yrs
15-20yrs
20-25yrs
Over25yrs
Base SalaryQuotaAccelerator
Over time, upside acceleration becomes more important to senior sales people
XX

2009 Total Rewards Conference & Exhibition40
Third Packages - Drivers by Sales Tenure
0%10%20%30%40%50%60%70%80%90%
100%
Lessthan2yrs
2-5yrs 5-10yrs 10-15yrs
15-20yrs
20-25yrs
Over25yrs
Base SalaryQuotaLeadflow
Over time, leadflow becomes moderately more important to senior sales people
XX

2009 Total Rewards Conference & Exhibition41
Importance of Each Factor in Deciding Whether to Stay in Role or Take Another
0% 10% 20% 30% 40% 50% 60% 70% 80% 90% 100%
Company Car
Recognition Trip
Equity/Stock Grants
Value of Sales Leads Provided
Sales Training Provided
Quota Size
Paid Time Off
Company Culture
Company Strength
Retirement Benefits
Future Career Advancement
Health Benefits
Base Salary
Variable Incentive Opportunity
Perc
ent o
f Res
pond
ents
Not a Consideration Not Important, but Considered Important Critical
Top performers’ selection criteria mirrored the overall populations’ priorities
(Top 10% Performers)
XX
2009 Total Rewards Conference & Exhibition42
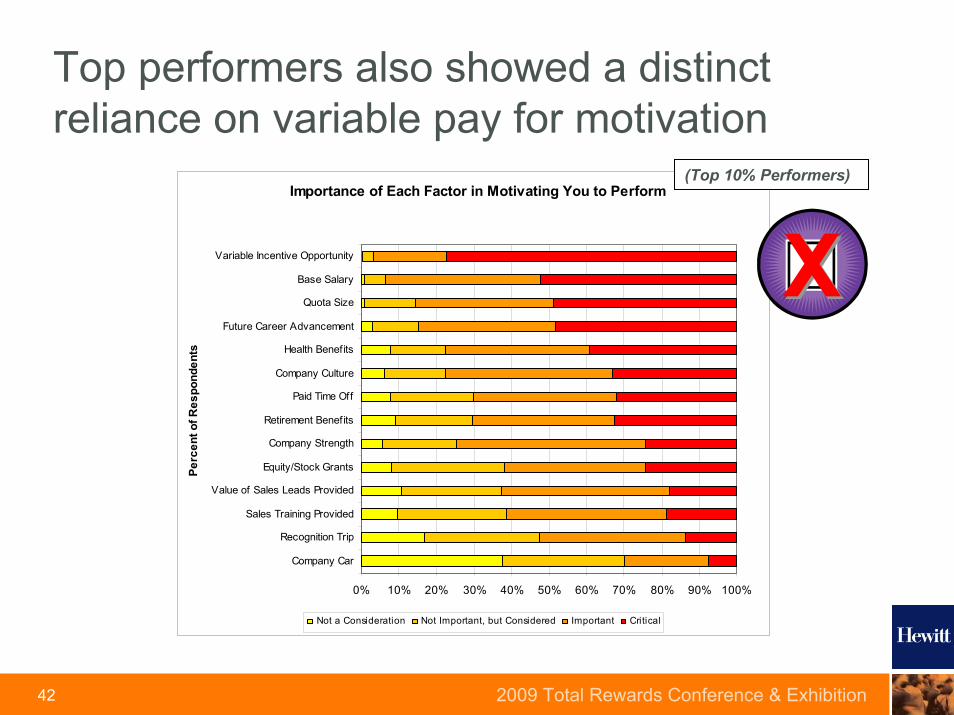
Importance of Each Factor in Motivating You to Perform
0% 10% 20% 30% 40% 50% 60% 70% 80% 90% 100%
Company Car
Recognition Trip
Sales Training Provided
Value of Sales Leads Provided
Equity/Stock Grants
Company Strength
Retirement Benefits
Paid Time Off
Company Culture
Health Benefits
Future Career Advancement
Quota Size
Base Salary
Variable Incentive Opportunity
Perc
ent o
f Res
pond
ents
Not a Consideration Not Important, but Considered Important Critical
Top performers also showed a distinct reliance on variable pay for motivation
(Top 10% Performers)
XX

2009 Total Rewards Conference & Exhibition43
Importance of Each Factor in Deciding Whether to Stay in Role or Take Another
0% 10% 20% 30% 40% 50% 60% 70% 80% 90% 100%
Company Car
Recognition Trip
Equity/Stock Grants
Value of Sales Leads Provided
Sales Training Provided
Quota Size
Paid Time Off
Company Culture
Company Strength
Retirement Benefits
Future Career Advancement
Health Benefits
Base Salary
Variable Incentive Opportunity
Perc
ent o
f Res
pond
ents
Not a Consideration Not Important, but Considered Important Critical
Highly engaged sales people tend to credit the strength of the company with their status
(Highly Engaged)

2009 Total Rewards Conference & Exhibition44
Importance of Each Factor in Motivating You to Perform
0% 10% 20% 30% 40% 50% 60% 70% 80% 90% 100%
Company Car
Recognition Trip
Sales Training Provided
Value of Sales Leads Provided
Equity/Stock Grants
Company Strength
Retirement Benefits
Paid Time Off
Company Culture
Health Benefits
Future Career Advancement
Quota Size
Base Salary
Variable Incentive Opportunity
Perc
ent o
f Res
pond
ents
Not a Consideration Not Important, but Considered Important Critical
Highly engaged sales people are still motivated by variable pay, but career rises
(Highly Engaged)
XX

2009 Total Rewards Conference & Exhibition45
What did sales people have to say?“All the above
compensation plans are only relevant if quotas are
set accurately. Without realistic quotas there will be a major lack of motivation.”
“Having a base salary that you can exist on is critical.
If I don't have to stress about making enough to
support my family - I work much harder to over
achieve on the incentive part of my compensation.”
“Six years ago I would have chosen the higher risk, lower base
pay and higher incentive plan because business was good and it
was easier to hit my quota.”
“Accelerators are no benefit if targets are set
so high that that they are unattainable.”
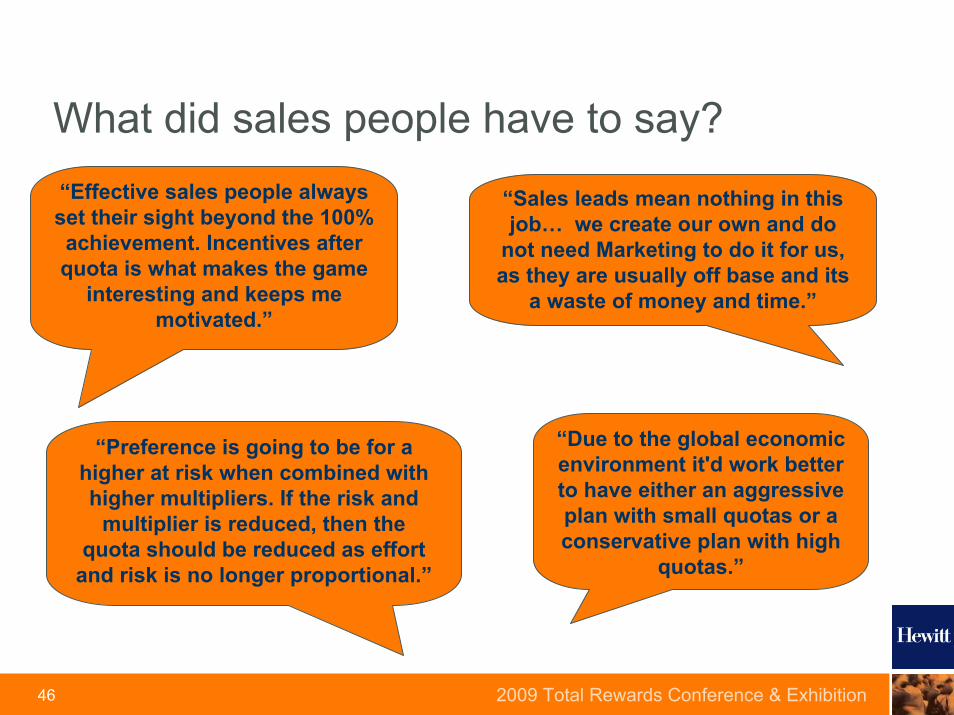
2009 Total Rewards Conference & Exhibition46
What did sales people have to say?“Effective sales people always set their sight beyond the 100% achievement. Incentives after quota is what makes the game
interesting and keeps me motivated.”
“Preference is going to be for a higher at risk when combined with higher multipliers. If the risk and
multiplier is reduced, then the quota should be reduced as effort
and risk is no longer proportional.”
“Sales leads mean nothing in this job… we create our own and do
not need Marketing to do it for us, as they are usually off base and its
a waste of money and time.”
“Due to the global economic environment it'd work better to have either an aggressive plan with small quotas or a conservative plan with high
quotas.”

2009 Total Rewards Conference & Exhibition47
What did sales people have to say?
“I'd like a careful balance of being able to make a lot of money when I hit big, but not having to
survive on Ramen noodles when I don't.”
“Base salary is used by the banks to determine my ability to secure a
loan, so it has disproportionate importance relative to other types of incentive… plus the taxes in my
country penalize bonuses.”
“Just as important as some of these factors is the
amount of authority the sales person has at the local
level… flexibility is critical to execution.”

2009 Total Rewards Conference & Exhibition48
What can we conclude?Hypothesis #1 – (Confirmed) – Variable incentive opportunity, followed by base pay dominated the attractors and motivators for almost all segments. Career advancement showed better than expected, especially with junior or Asian sales people. Company strength affected job selection and engagement.
Hypothesis #2 – (Mixed) – Base salary shows a marked decline in importance over a sales person’s career. TTC and accelerators show a marked increase in importance over time. Quotas and leadflow remain a tertiary consideration.
Hypothesis #3 – (Rejected) – Top performing and highly engaged sales people still care most about compensation, except in parts of Asia and Europe where career advancement and company strength matter most

2009 Total Rewards Conference & Exhibition49
Other interesting observations:While variable pay is stated as the top priority by almost all groups, most sales people currently choose base salary over other factors when presented with packages
Recognition and car allowances, often touted in sales organizations, may be prime opportunities for cost savings
Women tended to have a more balanced perspective, assessing a company’s culture, strength and benefits more than men
Half of all people surveyed viewed themselves as 90th
percentile performers… companies should harness that optimism in this economy

2009 Total Rewards Conference & Exhibition50
Additional InformationStop by our booth if you’d like more information
Elements of the Employee Value Proposition for SalesSales Compensation DesignSales Force Effectiveness
Hewitt’s Booth #909E-mail: [email protected]: 404.276.7876

2009 Total Rewards Conference & Exhibition51
Appendix

2009 Total Rewards Conference & Exhibition52
Composition of the SampleParticipants by Gender
Male74%
Female26%
n=940
Participants by Age
Over 601%
40 - 4929%
30 - 3947%
Under 3016%
50 - 597%
n=947
Percent of Participants Who are Engaged in Their Work
No70%
Yes30%
n=937
Participants by Performance Level
10%ile1%
25%ile2%
50%ile13%
90%ile49%
75%ile35%
n=950
Participants by Gender
Male74%
Female26%
n=940
Participants by Age
Over 601%
40 - 4929%
30 - 3947%
Under 3016%
50 - 597%
n=947
Percent of Participants Who are Engaged in Their Work
No70%
Yes30%
n=937
Participants by Performance Level
10%ile1%
25%ile2%
50%ile13%
90%ile49%
75%ile35%
n=950

2009 Total Rewards Conference & Exhibition53
Composition of the Sample
Participants by Salary as Percent of Total Income
0
50
100
150
200
250
0% 10%
20%
30%
40%
50%
60%
70%
80%
90%
100%
Fixed Salary as % of Total Income
Num
ber o
f Res
pond
ents
n=942
Participants by Sales Experience
0
50
100
150
200
250
300
Lessthan2yrs
2-5yrs 5-10yrs
10-15yrs
15-20yrs
20-25yrs
Over25yrs
Years in a Sales RoleN
umbe
r of R
espo
nden
tsn=949

2009 Total Rewards Conference & Exhibition54
Professional Biography — Scott SandsScott Sands is a Principal and Sales Force Effectiveness Practice Leader located in Atlanta, Georgia. He works with senior executives in large, global companies to identify opportunities for revenue growth, select the proper sales channels, refine selling processes and messages for specific market segments, staff organizations with the right type and number of sales professionals, set fair but challenging goals, and design motivational incentives. He has 18 years of experience in industry and with leading professional service firms, including Briggs & Sands Consulting, Sibson Consulting, The Alexander Group, and Watson Wyatt. His recent client work includes: Fortune 1000 telecommunications, technology, pharmaceutical, insurance, banking, energy, and heavy manufacturing companies including: Adobe, Assurant, AT&T, Avaya, British Petroleum, Broadcom, Cisco, Cox Communications, CSC, Dell, Electrolux, EMC, General Electric, Intelsat, Johnson & Johnson, Merial, MetLife, National Semiconductor, Nortel, Northrop Grumman, Qwest, Roche, SonyEricsson, Sprint, Symantec, Travelers, Unisource, Verizon, VeriSign, and WellCare.
Scott is a frequent author and speaker at national conferences. His work has appeared in Workspan, Selling Power, SAMA's Velocity, and Sales & Marketing Executive Review. In 2006, he co-authored the WorldatWork's bestselling book Sales Compensation Essentials. Scott holds a bachelor's degree in Electrical Engineering and Mathematics from Vanderbilt University and a MBA with a focus in Marketing and Organization Effectiveness from The University of Texas.
Scott oversees all dedicated Sales Force Effectiveness consulting resources in North America. He coordinates with global Hewitt Talent and Organization Consulting resources to ensure that this fast-growing segment delivers proven approaches, cutting-edge insight, and client business impact.