Embed Size (px)
Citation preview
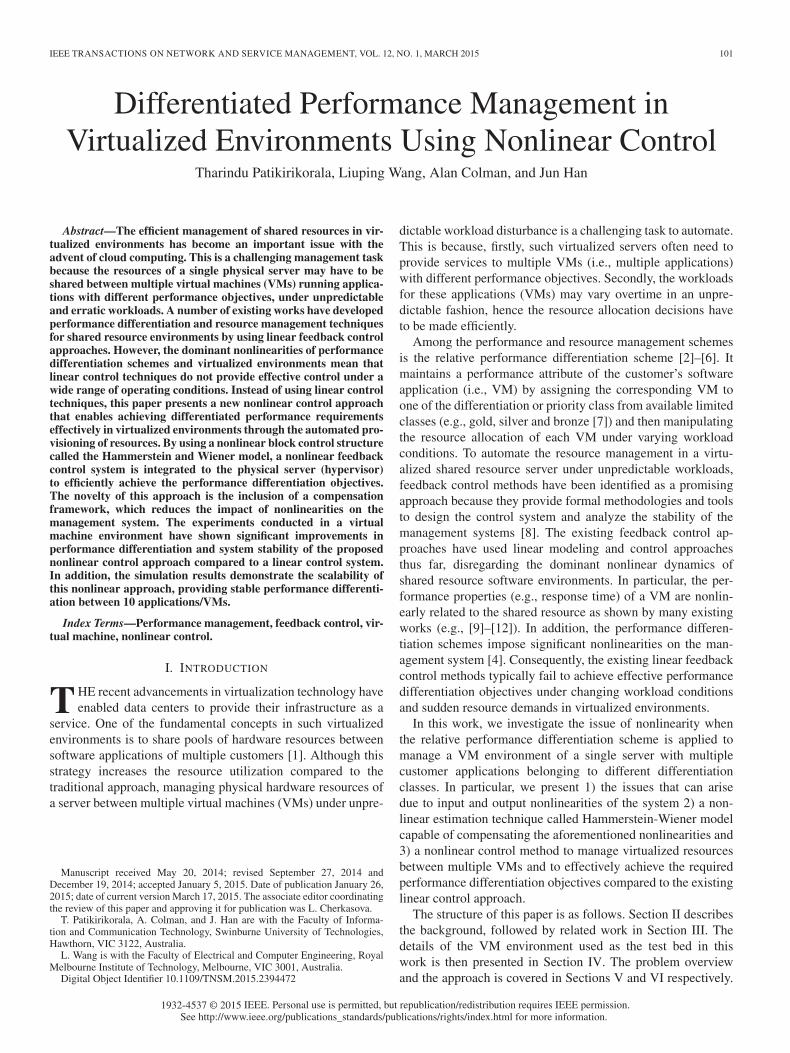
IEEE TRANSACTIONS ON NETWORK AND SERVICE MANAGEMENT, VOL. 12, NO. 1, MARCH 2015 101
Differentiated Performance Management inVirtualized Environments Using Nonlinear Control
Tharindu Patikirikorala, Liuping Wang, Alan Colman, and Jun Han
Abstract—The efficient management of shared resources in vir-tualized environments has become an important issue with theadvent of cloud computing. This is a challenging management taskbecause the resources of a single physical server may have to beshared between multiple virtual machines (VMs) running applica-tions with different performance objectives, under unpredictableand erratic workloads. A number of existing works have developedperformance differentiation and resource management techniquesfor shared resource environments by using linear feedback controlapproaches. However, the dominant nonlinearities of performancedifferentiation schemes and virtualized environments mean thatlinear control techniques do not provide effective control under awide range of operating conditions. Instead of using linear controltechniques, this paper presents a new nonlinear control approachthat enables achieving differentiated performance requirementseffectively in virtualized environments through the automated pro-visioning of resources. By using a nonlinear block control structurecalled the Hammerstein and Wiener model, a nonlinear feedbackcontrol system is integrated to the physical server (hypervisor)to efficiently achieve the performance differentiation objectives.The novelty of this approach is the inclusion of a compensationframework, which reduces the impact of nonlinearities on themanagement system. The experiments conducted in a virtualmachine environment have shown significant improvements inperformance differentiation and system stability of the proposednonlinear control approach compared to a linear control system.In addition, the simulation results demonstrate the scalability ofthis nonlinear approach, providing stable performance differenti-ation between 10 applications/VMs.
Index Terms—Performance management, feedback control, vir-tual machine, nonlinear control.
I. INTRODUCTION
THE recent advancements in virtualization technology haveenabled data centers to provide their infrastructure as a
service. One of the fundamental concepts in such virtualizedenvironments is to share pools of hardware resources betweensoftware applications of multiple customers [1]. Although thisstrategy increases the resource utilization compared to thetraditional approach, managing physical hardware resources ofa server between multiple virtual machines (VMs) under unpre-
Manuscript received May 20, 2014; revised September 27, 2014 andDecember 19, 2014; accepted January 5, 2015. Date of publication January 26,2015; date of current version March 17, 2015. The associate editor coordinatingthe review of this paper and approving it for publication was L. Cherkasova.
T. Patikirikorala, A. Colman, and J. Han are with the Faculty of Informa-tion and Communication Technology, Swinburne University of Technologies,Hawthorn, VIC 3122, Australia.
L. Wang is with the Faculty of Electrical and Computer Engineering, RoyalMelbourne Institute of Technology, Melbourne, VIC 3001, Australia.
Digital Object Identifier 10.1109/TNSM.2015.2394472
dictable workload disturbance is a challenging task to automate.This is because, firstly, such virtualized servers often need toprovide services to multiple VMs (i.e., multiple applications)with different performance objectives. Secondly, the workloadsfor these applications (VMs) may vary overtime in an unpre-dictable fashion, hence the resource allocation decisions haveto be made efficiently.
Among the performance and resource management schemesis the relative performance differentiation scheme [2]–[6]. Itmaintains a performance attribute of the customer’s softwareapplication (i.e., VM) by assigning the corresponding VM toone of the differentiation or priority class from available limitedclasses (e.g., gold, silver and bronze [7]) and then manipulatingthe resource allocation of each VM under varying workloadconditions. To automate the resource management in a virtu-alized shared resource server under unpredictable workloads,feedback control methods have been identified as a promisingapproach because they provide formal methodologies and toolsto design the control system and analyze the stability of themanagement systems [8]. The existing feedback control ap-proaches have used linear modeling and control approachesthus far, disregarding the dominant nonlinear dynamics ofshared resource software environments. In particular, the per-formance properties (e.g., response time) of a VM are nonlin-early related to the shared resource as shown by many existingworks (e.g., [9]–[12]). In addition, the performance differen-tiation schemes impose significant nonlinearities on the man-agement system [4]. Consequently, the existing linear feedbackcontrol methods typically fail to achieve effective performancedifferentiation objectives under changing workload conditionsand sudden resource demands in virtualized environments.
In this work, we investigate the issue of nonlinearity whenthe relative performance differentiation scheme is applied tomanage a VM environment of a single server with multiplecustomer applications belonging to different differentiationclasses. In particular, we present 1) the issues that can arisedue to input and output nonlinearities of the system 2) a non-linear estimation technique called Hammerstein-Wiener modelcapable of compensating the aforementioned nonlinearities and3) a nonlinear control method to manage virtualized resourcesbetween multiple VMs and to effectively achieve the requiredperformance differentiation objectives compared to the existinglinear control approach.
The structure of this paper is as follows. Section II describesthe background, followed by related work in Section III. Thedetails of the VM environment used as the test bed in thiswork is then presented in Section IV. The problem overviewand the approach is covered in Sections V and VI respectively.
1932-4537 © 2015 IEEE. Personal use is permitted, but republication/redistribution requires IEEE permission.See http://www.ieee.org/publications_standards/publications/rights/index.html for more information.
102 IEEE TRANSACTIONS ON NETWORK AND SERVICE MANAGEMENT, VOL. 12, NO. 1, MARCH 2015
Experimental results and comparative analysis conducted us-ing the aforementioned test-bed are provided in Section VII.Finally, we conclude with a discussion in Section VIII.
II. BACKGROUND
This section provides an overview of the relative perfor-mance differentiation scheme and linear control system designmethodology.
Relative performance differentiation scheme: In the perfor-mance differentiation scheme, the performance attributes of theclasses are maintained proportional to the performance differ-entiation factors derived from the business or system designrequirements. Let Pi, Qi be the specified differentiation factorand the actual performance attribute of interest respectivelyof a class i (i = 0, . . . n− 1), out of n number of classes.Between the pair of classes i and j, the management objective isto maintain Qj
Qi=
Pj
Pi(i = 0 . . . n− 1, i �= j) at runtime under
varying workload conditions. For instance, P1
P0= 2 means that
the performance attribute of class1 has to be maintained twiceas of class0.
To achieve the aforementioned relative performance differ-entiation, Lu et al. in [3] proposed a dynamic propositional re-source share allocation approach for a web server with multipleclasses. The resource share ratio Sj
Si(where Si and Sj , are the
amount of resources share for i and j classes respectively) ismanipulated at runtime to achieve the performance differen-tiation objectives of all the classes under changing workloadconditions.
Control system and design: The software system that is thetarget for control provides a set of performance metrics forproperties of interest (e.g., response time) referred to as outputs.The sensors monitor the outputs of the target system, whilethe control inputs (e.g., resource allocations) can be adjustedthrough the actuator to change the behavior of the system.Its main objective is to maintain the outputs of the systemsufficiently close to the target values (i.e., set point signals),by adjusting the control inputs.
The control system design generally consists of two mainsteps. Firstly, a formal relationship between the control inputsand outputs has to be constructed. In control theory this rela-tionship is referred to as the dynamic model of the system. Dueto the lack of first principle models to describe the behaviorof the software systems, system identification (SID) [13] istypically used to construct the system model using the measure-ments of input and output data [8]. This model of the system isthen utilized in the subsequent steps which include controllerdesign, simulation, analysis and testing using well establishedtools in control engineering.
III. RELATED WORK
Many control engineering approaches have been proposedfor data center management in the past few years. A surveyof such approaches can be found in [8]. Works in [7], [9],[14]–[16] have proposed different control techniques to man-age power and performance properties at an absolute value.Several techniques control response time by manipulating CPU
utilization in virtualized environments (e.g., [11], [12], [17]).However, these works only look at maintaining performanceproperties at an absolute or below a specified level, instead oflooking at performance differentiation techniques.
As discussed in the previous section, the relative performancedifferentiation scheme is important yet a hard control problem,due to the inherent nonlinearities caused by incorporating theratios of system outputs (see, [4]). In addition, works in [9],[11], [12] have shown that the relationship between the re-sponse time and CPU allocation of a single VM is nonlinear.As a result, significant nonlinearities are encountered whenapplying performance differentiation schemes in VM environ-ments. The relative performance differentiation scheme withfeedback control have been utilized to manage web servers[2]–[5], storage systems [18] and data centers [6]. They utilizelinear model and feedback control, limiting the operating rangeof the controller to a narrow region that can be linearized,disregarding the severe nonlinearities that exist in the relativeperformance differentiation scheme. These linear approachesface issues when sudden disturbances and conditions move thesystem to operate away form that narrow region.
Ying et al. in [4] discuss the nonlinearities in the input-output relationship and related issues of the relative differen-tiation scheme. They have investigated three different waysto formulate the input and output variables of the relativemanagement scheme to reduce the nonlinearity, while main-taining the scalability and applicability of feedback control.They further analyzed the coordination capabilities of thosethree formulations in the multiple feedback loops configura-tion. Their final results indicated that taking the ratios of theresponse time and resource caps of consecutive client classesbased on the priority is the most suitable formulation to applyfeedback control and implement effective coordination betweenloops. As a result, that approach was used in their subsequentpublications [3]. However, their work was limited to linearfixed gain control. Furthermore, adaptive control has beenutilized in [6], [18] to design relative performance managementsystems. Adaptive control approaches [19] can be categorizedas nonlinear. However, when the basic assumptions of slowlyvarying conditions and persistent excitation [19] are violatedthe management provided by an adaptive control system mayshow large transient responses and temporal instabilities whichcan lead to significant performance and resource managementissues [19], [20],
Fuzzy logic and machine learning techniques are among theother nonlinear approaches used for performance management.Works in [21]–[23] use fuzzy logic to capture the systembehaviour. The approach in [24] applies model-independentneural fuzzy control technique which has self-adaptive capa-bilities. These approaches require either expert knowledge orexpensive online learning techniques to derive the membershipfunctions and other design parameters. Machine learning ap-proaches [25], [26] on the other hand suffer because of thetime consuming training process. The main advantage of con-trol engineering techniques (proposed approach) compared tothese approaches is the systematic and formal design methodsavailable at the design time to compute and analyse the solutiondesign parameters.
PATIKIRIKORALA et al.: PERFORMANCE MANAGEMENT IN VM ENVIRONMENTS USING NONLINEAR CONTROL 103
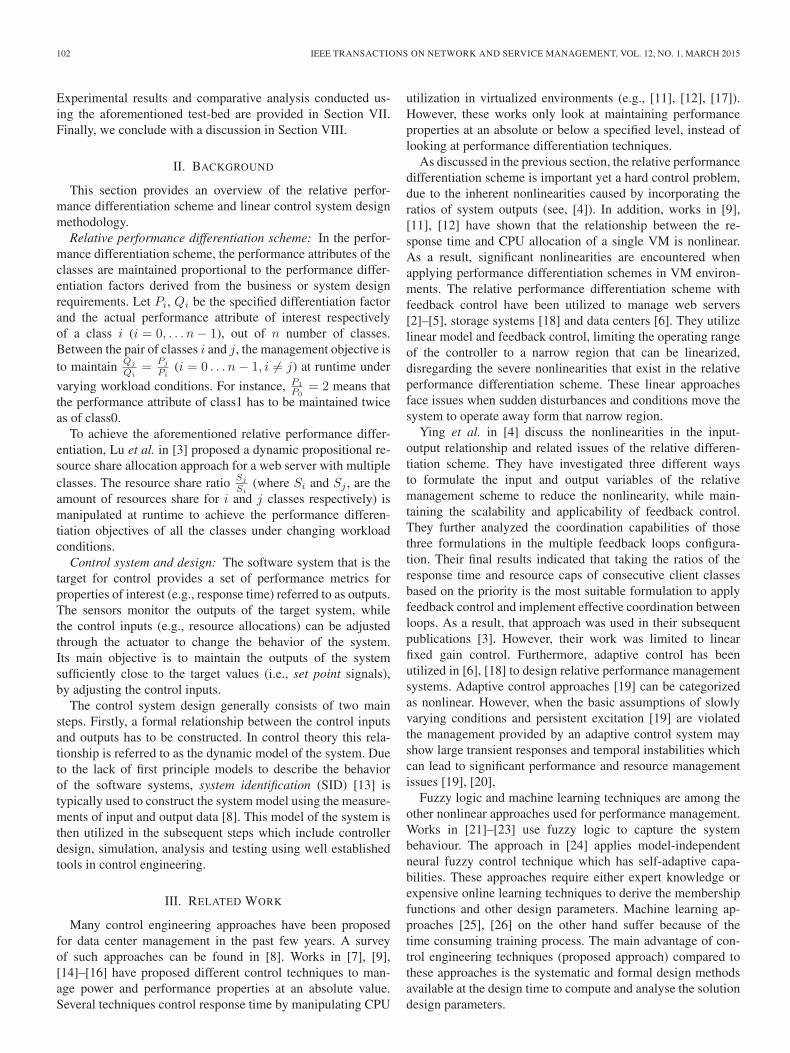
Fig. 1. Virtual machine environment and high-level control architecture.
In this work, instead of using linear or adaptive controlapproaches we use a nonlinear model called Hammerstein andWiener block structure to estimate the existing nonlinearities.By doing so, the static nonlinearities that exist in the VM envi-ronment are estimated together with its dynamics. A closed-loop control system equipped with a Propositional Integral(PI) feedback controller and a static nonlinearity compensatorframework is then developed. This control system is builtusing the established formal control system design techniques(e.g., system identification and pole-placement design [27]) toprovide a systematic design process.
IV. SYSTEM DESCRIPTION
Fig. 1 illustrates the architecture of the virtual machine en-vironment under consideration in this paper. It consists of threephysical machines (M1, M2 and M3).1 Server (M1) is runningon CentOS2 and acts as the shared resource infrastructure. Itis also equipped with Xen 2.63 hypervisor to manage virtualmachines (VMs). Using the Xen hypervisor, n VMs can bedeployed inside the server machine, which then operate as n in-dividual machines having separate network IPs. Each VM alsoruns on CentOS and has Apache Httpd 2.2 server installed, todeploy customer software applications. To represent the clientapplication, the RUBiS benchmark was used. RUBiS is a threetier ecommerce website modeling the behavior of ebay.com,which has been used in the existing literature to evaluate manyperformance management solutions (e.g., [11], [28]). As shownin Fig. 1, client simulators (so-called workload generators) weredeployed in M2, while the database of RUBiS benchmark wasdeployed in M3. All three machines were connected using anetwork switch, creating an isolated network between threemachines.
1M1: CPU is a Intel Core(2) Duo 2.33 GHZ processor with 4 GB memory,M2: CPU is a Intel Core(2) Duo 2.33 GHZ processor with 2 GB memory andM3: CPU is a Intel Core(2) Duo 2.33 and 2.99 GHZ processor with 3 GBmemory.
2Community enterprise operating system, which is one of the enterprise-class Linux distributions, http://www.centos.org/
3http://www.xen.org/
The management objective of this system is to control the av-erage response time of each customer application. To measurethe response time (R0, R1, . . . , Rn−1) a background (sensor)program was designed in JAVA and deployed in each VMto intercept the incoming and outgoing requests and computethe response time of each application in regular intervals. TheCPU capacity allocated to each VM by the hypervisor is themanipulated resource. Xen Hypervisor provides a credit-basedscheduling mechanism,4 which enables users to adjust the CPUcapacity of each VM dynamically. Using this functionality, anactuator was implemented in JAVA and deployed inside thecontrol system. The nonlinear control system runs on top ofthe CPU core which the hypervisor is running on. The sensorprograms computes the response time of each VM in 20 secondsample intervals and communicates the measured data to thenonlinear control system via a dedicated socket. Once the CPUcapacities have been calculated the control system executes theactuator, which implements the desired CPU capacities on theXen hypervisor.
To isolate the VMs from the hypervisor (Dom-0), the hy-pervisor was pinned on to a single core of the CPU of M1,while VMs were pinned to the other CPU core using vcpu-pin4
interface provided by Xen. By pinning VMs to a single core,we can effectively enable the CPU capacity sharing between allVMs. In a server with more than two cores the same approachcan be used by pining all the managed VMs on multiple cores,enabling all VMs to share CPU of multiple cores. In this case,the Xen credit scheduler balances the loads between multiplecores while implementing the assigned CPU capacities. EachVM was allocated with 1 GB of dedicated memory.
V. PROBLEM OVERVIEW AND ANALYSIS
In this section, we present an overview of the performancedifferentiation problem of a server with multiple VMs.
A. Assumptions
For the purposes of this paper we have made a number ofworking assumptions:
1) The CPU capacity is considered as the shared and mainbottlenecked resource that has to be managed dependingon the workload conditions.5
2) We assume that each VM deployed in the server isallocated a fixed amount of CPU capacity (Ci,min, wherei = 0, 1, . . . n− 1) during the entire operation (i.e., theminimum). This is to avoid starvation of resources underheavy workloads of other VMs. However, to achievethe required performance differentiation objectives, sparecapacity above this fixed allocation needs to be sharedbetween the VMs according to client demand in a waythat handles unpredictable workload surges. This dis-
cretionary CPU capacity is Ctotal −n−1∑i=0
Ci,min, where
4http://wiki.xen.org/wiki/Credit_Scheduler5In the system studied in this paper, the RUBiS benchmark has been modified
to simulate CPU bound operations.
104 IEEE TRANSACTIONS ON NETWORK AND SERVICE MANAGEMENT, VOL. 12, NO. 1, MARCH 2015
Ctotal is total CPU capacity (number of CPU cores ded-icated for VMs ∗ 100%). It is worth noting that Ctotal −n−1∑i=0
Ci,min > 0 for dynamic CPU capacity management.
Otherwise, the management problem converges to a purefixed or resource reservation scheme.
3) The number of VMs (say n) placed in a single physicalserver (or hypervisor) instance is known at the designtime. In this work we focus on a control system with astatic architecture. In the cases where the number of VMschanges over time a reconfiguring control architecture[8] is required. Our work in [29] has shown a successfulhybrid supervisory control approach to adapt the relativeperformance management architecture under VM migra-tions, i.e., variations in n at runtime.
B. Performance Management Problem Definition
The main control objective is to share the available CPU ca-pacity in an effective way to maintain the response time at levelsthat depending on the differentiation levels of VMs. We adoptthe relative performance management scheme combined witha feedback controller to solve the management problem. Thisis because it can directly incorporate differentiation levels intocontrol objectives and then compute resource shares from thetotal resources compared to the absolute management scheme[3]. Therefore, the control objectives are now specified basedon the relative performance differentiation scheme as follows.
Control objectives: According to the business requirementslet us assume the differentiation factors for the n VMs aredetermined statically or dynamically as Pi(k), i = 0 . . . n− 1.Then, the control objective according to the relative perfor-mance differentiation control scheme becomes maintaining theresponse time ratio of (i− 1)th and (i)th VMs Ri(k)
Ri−1(k), around
Pi(k)Pi−1(k)
while computing the CPU caps Ci(k), i = 0, 1 . . . n−1. Furthermore, the management system should honor the fol-lowing constraints, related to total resources availability and perVM CPU reservations at all times.
C0(k) ≥ C0,min, C1(k)≥C1,min, . . . , Cn−1(k) ≥ Cn−1,min
C0(k) + C1(k) + . . .+ Cn−1(k) = Ctotal. (1)
Example: Let us consider the VM environment described inSection IV with two VMs, VM0 and VM1. R0(k) and R1(k)are the response times of two VMs respectively at the kth
sample. Furthermore, the CPU caps are C0(k) and C1(k) whereC0(k) + C1(k) = Ctotal = 100% and C0,min, C1,min = 20%.According to the definition in Section II, the control input isthe ratio of CPU caps, represented by C0(k)
C1(k)and the output
variable is the ratio of average response time of the workloads,represented by R1(k)
R0(k). For notational simplicity let us denote
C0(k)C1(k)
and R1(k)R0(k)
as u(k) and y(k) respectively. The controlobjective of this control system is to maintain the responsetime ratio y(k) of VM0 and VM1 around P1(k)
P0(k)(i.e., the set
point) depending on the performance differentiation factors ofthe VMs P0(k), P1(k).
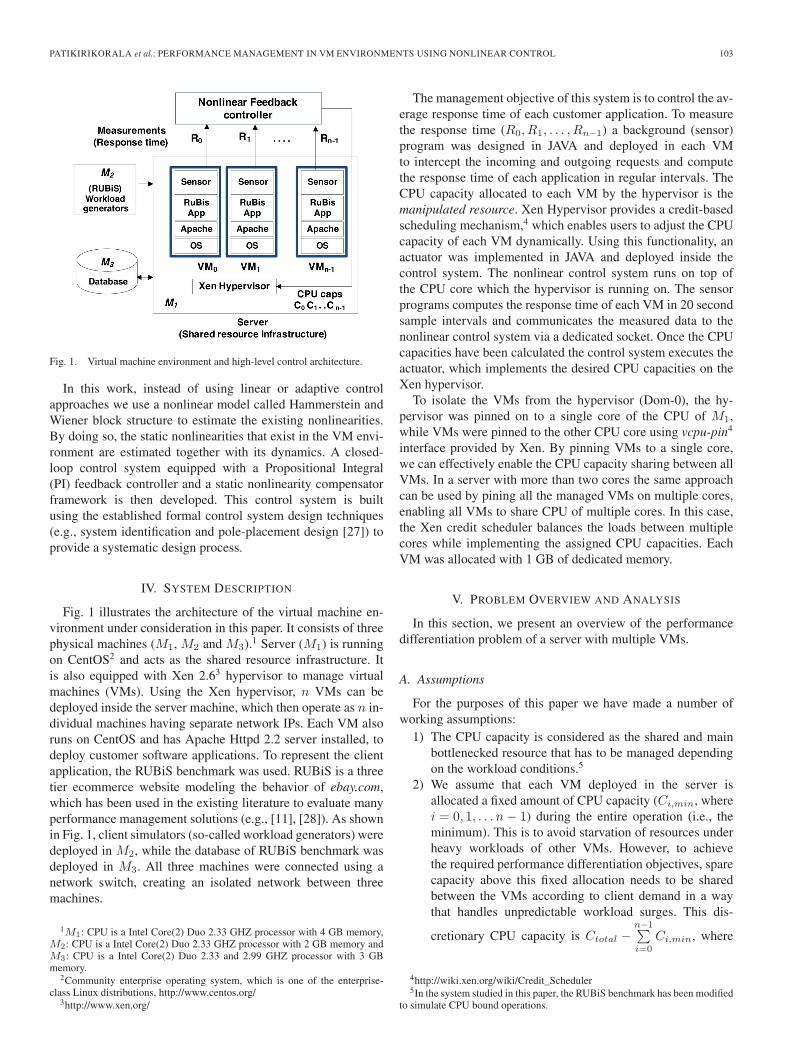
Fig. 2. Possible operating points of the system input.
C. Analysis of Nonlinearity
Input nonlinearity: When the above requirements and poli-cies are embedded in the design, the control input u = C0(k)
C1(k)can only take certain discrete values. These values can becomputed as follows:
C0
C1=
C0
Ctotal − C0. (2)
Then, by choosing C0 = 20, 21, . . . , 80, with Ctotal = 100,the control variable u = C0
C1takes value at 20
80 ,2179 , . . . ,
7921 ,
8020 .
When these data points are plotted (see Fig. 2), one of theobservations is that the operating points that the controller cantake are unequally spaced. Take the nominal operating pointas when both VMs get equal CPU caps, 50
50 . The spacingincreases towards the right side the nominal point whereasspacing decreases towards the left side of the nominal point.The nonlinearities caused by the discontinuous operating pointsexhibit the characteristics of static input nonlinearities, as theydo not vary with time. Such static input nonlinearities mayaffect the performance of a linear controller when it is operatingaway from the nominal operating region.
Output nonlinearity: The output y(
R1
R0
)of the VM environ-
ment exhibits a similar behavior to the input because of thedivision operation. However, it cannot be predetermined. Thisis because based on the workload variations R0 and R1 cantake a large range of values, causing the R1
R0ratio to have a large
set of values. For instance, if R0 = 0.4 (sec) and R1 = 1 (sec)then R1
R0= 2.5. Similarly, if R0 = 1 (sec) and R1 = 0.4 (sec)
then R1
R0= 0.4. Therefore, when R1 increases R1
R0increases at
a high rate. In contrast, when R0 increases R1
R0decays at a
high rate. The divider operator in the output creates an asym-metric behavior leading to this nonlinearity. Such nonlinearbehavior may also cause performance degradation in a linearcontroller [10], [30].
VI. APPROACH
This section presents the design details of proposed nonlin-ear management system used to achieve relative performancedifferentiation objectives in VM environments.
According to the analysis in Section V-C, the control systemdesigner must consider the aforementioned nonlinear dynamicsof the system. The hypothesis is that much better runtimeperformance and resource management can be achieved bycompensating the input and output nonlinearities that exist inthe system. One way to achieve this is by estimating the existingnonlinearities and then design components that compensatethese nonlinearities. The Hammerstein and Wiener block struc-ture model is well known in control literature to characterizeinput and output nonlinearities [31].
PATIKIRIKORALA et al.: PERFORMANCE MANAGEMENT IN VM ENVIRONMENTS USING NONLINEAR CONTROL 105
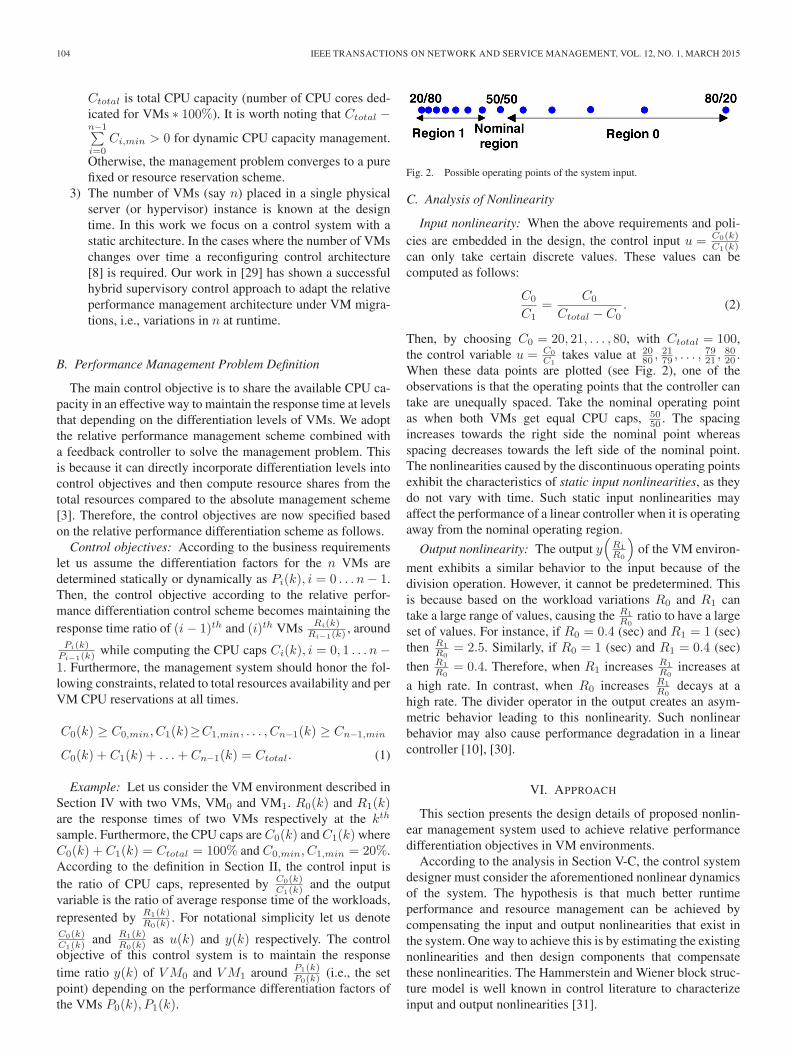
Fig. 3. Block diagram of Hammerstein-Wiener model and proposed non-linear control system. (a) Hammerstein and Wiener block structure model.(b) Hammerstein-Wiener control system (HWCS). (c) Hammerstein-Wienercontrol system for environment with n VMs.
As shown in Fig. 3(a), the Hammerstein-Wiener block struc-ture model has a linear block surrounded by two nonlinearblocks. The entire model can be divided into two segmentscalled Hammerstein and Wiener blocks. The Hammersteinmodel has a nonlinear component preceding a linear com-ponent. In contrast, the Wiener model has a linear compo-nent followed by a nonlinear component. The combinationof these two schemes is referred as the Hammerstein-Wienermodel. The nonlinear blocks capture the static nonlinearitiesin the system, while linear block captures the rest of thedynamics of the system. The variables u and y respectivelydenote the input and output of the Hammerstein-Wiener blockstructure. The intermediate variables v and w are, in general,not measurable.
In this work, we use the Hammerstein-Wiener model toformally estimate the nonlinear dynamics of the system andthen to remove or reduce the impact of these nonlinearitieson the control system. The novelty of the proposed manage-ment system design compared to the linear control systemarchitecture is that the integration of the pre-input and post-output compensators as shown in Fig. 3(b). In addition, eventhough the nonlinearities are explicitly considered in the controlsystem design we can still use a linear controller and availableformal design methodologies, which is an added advantage ofthe proposed control approach. In the following subsections, wepresent the design details of the compensators and controller.
A. Pre-Input Compensator Design
The nonlinear component is to capture the relationship be-tween the input variable (u) and the intermediate input vari-able (v). There are different types of system identificationand estimation algorithms to derive parameters for differentfunctions (e.g., linear, polynomials and splines) from inputand output data (e.g., [32]–[34]). However, if the nonlinearityis known at the design time the nonlinear function selectionand its parameter estimation process becomes easier. From theexample analyzed in Section V-C, the discontinuous operatingpoints may induce significant static input nonlinearity. If weimplement equally spaced operating points, a linear controllermay provide better performance in the entire operating region.As the input nonlinearity is known, a method to estimatethe nonlinearity is proposed here to avoid the complexity ofestimation based on nonlinear SID experiments.
Firstly, to compute the possible operating points (or therange of u) for the controller in the original system, wecan utilize equation (2) and calculate a point for each C0 ∈{C0,min, Ctotal −
∑n−1j=0(Cj,min)}. Here, we have computed
the operating points for a controller that manages the first pairof VMs, assuming that the rest of the VMs are guaranteed therequired minimum CPU cap of Ci,min. Let us represent thesep > 1 number of operating points as u = {u1, u2, . . . up}.
The next step is to replace these unequally spaced op-erating points in u with equally spaced operating points.Select an arbitrary vmin ≤ v ≤ vmax for the intermediate in-put variable v (the simulation results in [35] indicates thevalues selected for vmin and vmax has less/no effect onthe performance of the control system). With δv defined asδv = vmax−vmin
p−1 , the intermediate input variable takes its ownoperating points as v1 = vmin, v2 = v1 + δv, . . . , vl+1 = vl +δv, . . . , vp = vmax. Thirdly, map the individual values ul andvl in u and v sets to create data pairs, where l = 1, 2 . . . , p.Those data pairs are then used to obtain the analytical inversefunction (u = f−1(v)), to design a compensator. More pre-cisely, it is assumed that the f−1 is a polynomial of order m,and is defined for the kth data sample as
u(k) = f−1(v(k))
=α0 + α1v(k) + α2v(k)2 + . . .+ αmv(k)m
=φ(k)T θ (3)
where the coefficient vector θ = [α0α1 . . . αm]T and the datavector φ(i) = [1v(k) . . . v(k)m]T . The least squares estimate ofthe coefficient vector θ̂ is given by
θ̂ =
(p∑
i=1
φ(k)φ(k)T
)−1 p∑k=1
φ(i)u(k) (4)
which derives the coefficients of the polynomial.After the estimation of the f−1 function, it is used to imple-
ment the pre-input compensator and then integrated to the VMenvironment as shown in Fig. 3(b). The same compensation isdone for each controller, managing the class pair i− 1 and iaccording to the relative performance differentiation scheme.With this step, the static input nonlinearities existed in thesystem is compensated.
106 IEEE TRANSACTIONS ON NETWORK AND SERVICE MANAGEMENT, VOL. 12, NO. 1, MARCH 2015
B. Post-Output Compensator Design
After the integration of pre-input compensator, the systemis now reduced to a Wiener model. The output nonlinearityhowever cannot be estimated using the same approach inSection VI-A. This is because the static output nonlinearity isnot known and cannot be decoupled from the other dynamics ofthe system. In addition, there is no knowledge about the inter-mediate output variable (w) at the design time. Consequently,here the model structure and order of the output nonlinearand linear components of the Wiener model is estimated usingSID experiments. The predication error method [13] is one ofthe popular methods used to estimate the required parametersin SID. This predication error minimization problem can besolved using Gauss-Newton search method [36]. However, theWiener model is over-parameterized when parameters of bothlinear and nonlinear components are considered simultane-ously. Consequently, numerical problems will be encountered.To overcome this issue a simple solution is to fix some of theparameters of one of the components of the model (i.e., inlinear or nonlinear component) during the optimization searchprocess [36].
There are different types of identification strategies proposedand adopted in the literature to identify the Wiener modelbased on the above methodology, including the single step andtwo step approaches [37]–[39]. Basically, in the two step pro-cess the nonlinear and linear components are approximated intwo stages. In [37], [39] the nonlinear component is identifiedfirst followed by the linear component, where as in [38] thelinear block is identified first and then the nonlinear block.These two step approaches are known to capture the static non-linearities much better, however some of the linear or nonlineardynamics are coupled up to some extent in the component esti-mated at the first stage. In contrast, single step approaches [40],[41] estimate both components simultaneously. This approachrequires less effort in identification, but model accuracy is atrade-off [37].
In this work, a two-step identification process is utilized,consisting of two experiments to identify the Wiener system.The first is to identify the static output nonlinearity togetherwith the dynamics. Then, the inverse of the static output nonlin-earity is approximated and integrated into the system as shownin Fig. 3(b). Afterwards, the second experiment is conductedto identify the linear model parameters (see Section VI-C).This is because the first experiment is not sufficient to iden-tify the model parameters of the linear system as stated byKalafatis et al. in [40].
For the first SID experiment a sinusoidal input signal is usedto provide sufficient excitation6 [19]. The main difference com-pared to a non-compensated system is that now the intermediatevariable v is used as the input signal instead of the actual controlinput u. The variable v is assigned a range of values following asinusoidal curve while applying suitable workloads for the firstpair of VMs for a sufficient amount of time. The (v − y) datapairs are then divided into two sets called estimation set and thetest set for cross validation [13], [42].
6The input signal should consist of frequency components to ensure theexcitation of important dynamics of the system.
To represent the linear block of the Wiener structure we usean autoregressive exogenous input (ARX) model as follows:ARX(n, m, d)
w(k) =
n∑i=0
aiw(k − i) +
m∑j=0
ajv(k − d− j) (5)
where, n,m—the order of the model, (ai, bj)—the parametersof the model, d—delay, k—the current sample instance.
A polynomial is a preferred choice to represent the outputnonlinearity and widely adopted in the literature (e.g., [37],[41], [44]). Consequently, to represent the output nonlinearblock, a polynomial of degree r is used. Then, different modelstructures (n,m, d, r) are fitted to the input-output (v − y) dataof the estimation set using the nlhw command, which is aMatlab: system identification toolbox [43] implementation ofiterative Gauss-Newton search method.
The above identification process computes the model pa-rameters for linear block which is a function of v and w [seeequation (5)] and the output nonlinear block is a function ofw and y, y = g(w). However, to compensate the estimatedoutput nonlinearity, the inverse of the output nonlinearity hasto be derived, i.e., w = g−1(y). For this particular purpose,given that we have y data from the SID experiment, the data ofthe intermediate variable w has to be calculated. To calculatew data, the input signal data (v) of the SID experiment isinputted into the linear model identified above. The (w − y)data pairs are then used to estimate an inverse of the outputnonlinearity g−1(y) using a suitable type of function. Thelog functions (of the form alog(y(k)) + c, where a and care the coefficients of the function, and are estimated duringthe model fitting process) have provided much better modelfit with low computational overhead as shown in [35]. Theg−1(y) function is then implemented and integrated to theVM environment as a software component at the each output[see Fig. 3(b)].
C. Linear Model Design
Although we identified a linear model in the previous section,the accuracy of this model is insufficient because a modelparameter [a0 in equation (5)] was fixed to resolve the over-parameterization issue. As mentioned in previous section, thenext step is therefore to derive the linear component of theHammerstein-Wiener model using the second SID experiment.A specifically designed (persistently exciting) input signal isapplied into the system and the output is observed for a suf-ficient period of time. Typically, pseudo random signals orsinusoidal signals are used. The input signal has to be designedusing the points of v set, because after integration of thetwo compensators, the system operates with the transformedvariables v and w. The values from set v is randomly selected(i.e., a pseudo random signal) and passed through the compen-sator to be implemented in the system while applying suitableworkloads for VM0 and VM1 in this second SID experiment.Then, the gathered data samples are used to estimate an ARXmodel as shown in equation (5).
PATIKIRIKORALA et al.: PERFORMANCE MANAGEMENT IN VM ENVIRONMENTS USING NONLINEAR CONTROL 107
D. Controller Design
The next step is to design the feedback controller basedon the Hammerstein-Wiener model. By integrating the non-linear compensators, the system can be assumed to be linear.Consequently, we do not have to design a complex nonlinear(e.g., fuzzy, neural network based) controller. With the linearmodel identified in Section VI-C, we can design a linear con-troller using the existing linear controller design techniques.Although any linear controller can be used, here we adoptthe Propositional Integral (PI) controller, which is one of thewidely adopted controllers due to their robustness, disturbancerejection capabilities and simplicity [8]. The equation of the PIcontroller is shown in equation (6) for the case of Hammerstein-Wiener model. Due to the introduction of the compensators,the controller is operating with v and w, compared to thestandard PI algorithm. The controller calculates v(k) for k > 0,given v(0), which is converted to the control input by u(k) =f−1(v(k)). e(k) represents the control error, computed byg−1(y(k))− g−1(r(k)), where r is the set point of the originalsystem and Kp and Ki are the propositional and integral gainsof the PI controller respectively. Note that the original set point(differentiation ratio) inputted into the post-output compensatorto transform r in to w range. There are several well establishedformal techniques to aid the designer in selecting the gains ofthe controller given the linear model identified in Section VI-C(e.g., pole-placement method [27]). After the integration of thePI controller, the final closed-loop control system takes thestructure of Fig. 3(b).
v(k) = v(k − 1) + (Kp +Ki)e(k)−Kpe(k − 1). (6)
Furthermore, umin and umax, which are the minimum andmaximum values of the input u (see Section VI-A) have tobe translated and implemented in the Hammerstein-Wienercontrol system. In the Hammerstein-Wiener controller, theselimits correspond to vmin and vmax. The control inputs v(k)generated by the controller is compared with vmin and vmax ineach sample and rounded-off to the corresponding limit if theyare exceeded.
The HWCS control system in Fig. 3(b) is then used tomanage each consecutive VM pair as shown in Fig. 3(c). Thatmeans according to the relative performance differentiationscheme [3] there are c number of controllers in an environmentwith n VMs, where c = 1, . . . , n− 1. Each control systemfollows the same architecture of Fig. 3(b) implementing samepre-input and output compensation functions and controller
parameters. Given the set point(
Pi
Pi−1
)and response time ratio(
Ri
Ri−1
)computed by the sensor, cth controller computes the
CPU cap ratio for the i− 1 and ith VMs. However, this ratiocannot be directly implemented in the Xen hypervisor, becauseit accepts only individual CPU caps Ci(k), i = 0, 1, . . . n− 1.The resource cap ratios uc(k), c = 1, . . . n− 1 calculated bythese controllers therefore have to be decoded back to the indi-vidual CPU cap (Ci(k), i = 0, 1, . . . n− 1) for each VM. Thealgorithm used for this calculation can be found in [35]. Thisalgorithm has extended the algorithm presented in [3]. The ma-jor modification is the conversion of values (vc(k)) computed
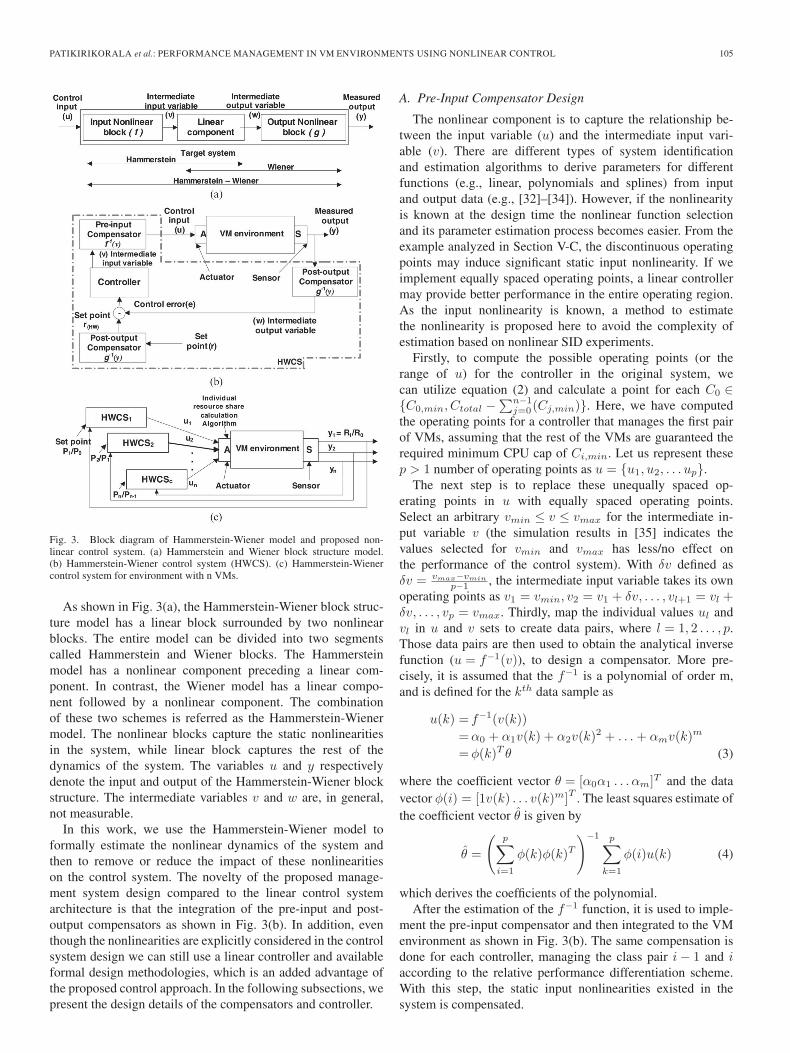
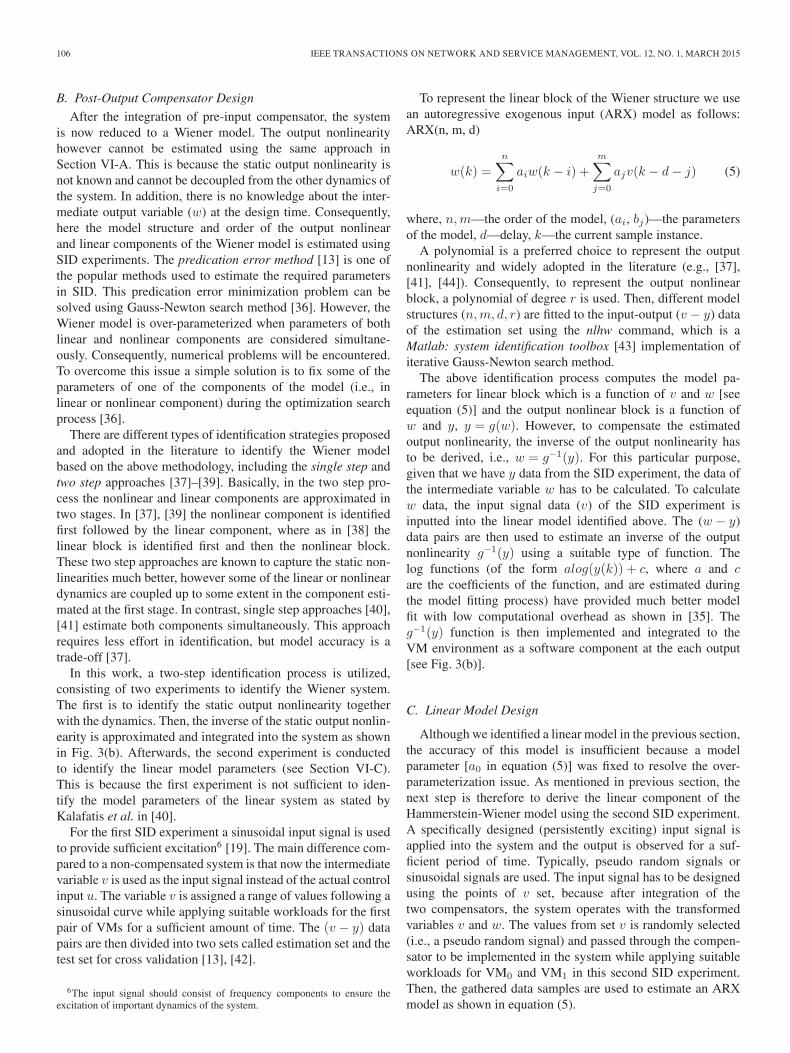
Fig. 4. The model fit of the inverse input and output nonlinearity. (a) Inputnonlinearity. (b) Output nonlinearity.
by the nonlinear control system to the original system inputsuc(k) using f−1 function, before computing the individual CPUcaps for each VM.
VII. EXPERIMENTATION
This section presents details of the experiments con-ducted using the physical test bed covered in Section IV.In Sections VII-A and VII-B, environments with two and threeVMs are considered respectively under different operating con-ditions to evaluate the proposed nonlinear control approach. Toinvestigate scalability of the proposed approach, Section VII-Cpresents the results from a simulated shared resource environ-ment with 10 VMs.
A. Environment With Two VMs
The VM environment has 2 VMs, hence n = 2. The CPUcaps for VM0 and VM1 are C0(k) and C1(k) respectively,where C0(k) + C1(k) = Ctotal = 100% and C0,min, C1,min
are 20%7 (see Section V-B). First, the control system designdetails will be covered before going into the experiment results.
1) System Modeling and Controller Design: This sectiongives the design details of the two compensators and thecontroller.
The pre-input compensator: To design the pre-input com-pensator the possible operating points for u were calculatedas 20
80 , . . . , 1, . . . ,8020 , which consist of 61 operating points.
Then, the points of the intermediate variable v were selectedas values −15,−14.5, . . . , 0 . . . 14.5, 15 by setting δv = 0.5,vmin = −15 and vmax = 15.
Following the design process in Section VI-A, a fifth orderpolynomial was used in the estimation of the inverse inputnonlinear function [see equation (7)] with a goodness of fitof 1. Fig. 4(a) shows the model fit. This function was thenimplemented as a software component (i.e., the pre-input com-pensator) and integrated to the control system of the VMenvironment, similar to Fig. 3(b).
u(k) =f−1(v(k))=p1 ∗ v(k)5+p2 ∗ v(k)4+ p3 ∗ v(k)3+p4 ∗ v(k)2+p5 ∗ v(k)+p6 (7)
where, p1=4.168e− 007, p2=9.343e− 006, p3=0.0001018,p4 = 0.002822, p5 = 0.08073 and p6 = 1.004.
The post-output compensator: Following the design processin Section VI-B, a sinusoidal signal was designed with (−10,
7The 20% is a design parameter, which can be changed based on the systemsettings and design requirements.
108 IEEE TRANSACTIONS ON NETWORK AND SERVICE MANAGEMENT, VOL. 12, NO. 1, MARCH 2015
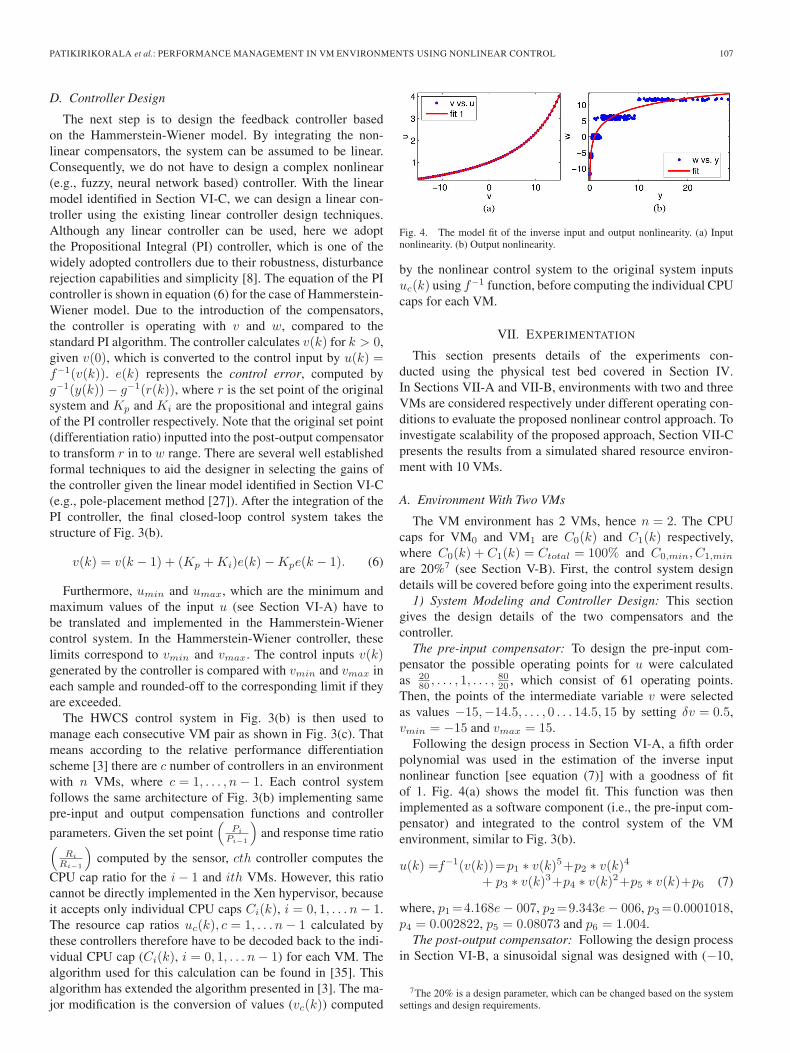
Fig. 5. Performance of the LCS and HWCS under high workloads and equal differentiation ratio. (a) LCS output. (b) HWCS output. (c) LCS control signal.(d) HWCS control signal.
−5, 0, 5, 10) values of set v. As workloads for each RUBiSapplication in VMs, 100 concurrent users were simulated.From this SID experiment, response time (output) data for 500sample periods were gathered, which were then divided intoestimation and test data sets. Data samples between the 1st to350th samples were included in the estimation set and the restwere used as the test set. A 2nd order ARX model and 4thorder polynomial was sufficient to represent the system as aWiener model with a R2 fit of 0.70. The linear model was thensimulated to compute w data set, which was subsequently usedto estimate the output inverse nonlinear function represented bythe equation (8) close to 0.96 fit (see Fig. 4(b)).
w(k) = g−1(y(k)) = 4.04log(y(k))− 0.01. (8)
The controller: For the second SID experiment, a pseudorandom input signal and workloads of 100 concurrent userswere used. The estimated linear model is given in equation (9)with 0.81 model fit.
w(k + 1) = 0.57w(k) + 0.52v(k). (9)
The final step is to implement the Hammerstein-Wiener con-trol system (called as HWCS) using the linear model and pole-placement design method [27]. The finalized parameters afterplacing poles at 0.5 are Kp = 0.62, Ki = 0.48 and v(0) = 0.
The comparison with a linear control system: To comparethe differentiated performance management provided by theHWCS in this VM environment, we have also implemented alinear control system (called as LCS) using the linear modelin equation (10). The same data used in the second SID exper-iment was used to construct this model. Furthermore, similarto the HWCS implementation poles were placed at 0.5 and acontroller was designed with Kp and Ki being 0.15 and 0.15respectively and u(0) = 1.
y(k + 1) = 0.51y(k) + 1.70u(k). (10)
It is also noteworthy that we implemented and tested anadaptive control system (using recursive least squares [19] andPI control algorithms [27]) corresponding to adaptive controlapproaches [6], [18] in existing literature. The adaptive con-troller was significantly difficult to tune and failed to providestable performance under changing conditions (see, [35]). Theanalysis revealed that under closed-loop identification, the largegains computed by the adaptive controller generated largetransient responses, subsequently leading to instability, whichthe controller was not able to recover from.
2) Experiment Results: This section compares the perfor-mance differentiation capabilities of the nonlinear and linearcontrol systems designed in Section VII-A1 under differentsettings.
a) Separate high workloads with equal differentiation fac-tors: This experiment compares the performance of LCS andHWCS when the performance differentiation factors of bothVMs in the environment are equal, i.e., P0, P1 = 1. However,here the concurrent number of users increases suddenly atseparate time periods requiring efficient CPU management.Until the 20th sample 100 concurrent users were simulated forVM0 and VM1. Then, at the 20th sample the VM0 workloadincreases to 200 concurrent users. This could be a scenariowhere a high resource demand for the VM0 RUBiS applica-tion, while application in VM1 is at a lower workload rate.Afterwards, at the 70th sample the VM0 workload drops againto 100 concurrent users. Then, at the 110th sample, VM1
receives workloads from 200 concurrent users suddenly. Theseworkload settings are such that both VMs require more thanCmin,i CPU capacity to cater the demand. The output andcontrol signals of the LCS and HWCS are shown in Fig. 5.8
First, let us analyze the performance of the control systems inthe region where VM0 gets more resources (between 20th and70th samples). The settling times of the LCS and HWCS areapproximately 20 and 8 samples respectively. This means thatthe settling time has been improved significantly by the newnonlinear control approach. The contributing factor to this im-provement is the output nonlinearity. Due to significant outputnonlinearity in this output region, variations in the output signalhave been damped out, so that the linear controller takes timeto reject the workload disturbance and adjust the CPU caps.In contrast, the output nonlinearity compensated HWCS rejectsthe disturbance much more efficiently compared to LCS. Then,after settling down, both control systems provide similar steadystate behavior, achieving the set point with small errors. At the110th sample when VM1 receives a high workload demandingmore resources, Fig. 5(a) shows that the performance of LCSis significantly poor. The behavior of LCS is highly unstablewith large steady state error. The control signal (CPU allocationdecisions) of LCS illustrated in Fig. 5(c) shows highly oscilla-tory behavior, which led to this unstable behavior at the output.The reason for this behavior is the issue of input nonlinearitydiscussed in Section V-C. When VM1 requires more resources,
8Each arrow on top of the figure indicates a workload distribution change.
PATIKIRIKORALA et al.: PERFORMANCE MANAGEMENT IN VM ENVIRONMENTS USING NONLINEAR CONTROL 109
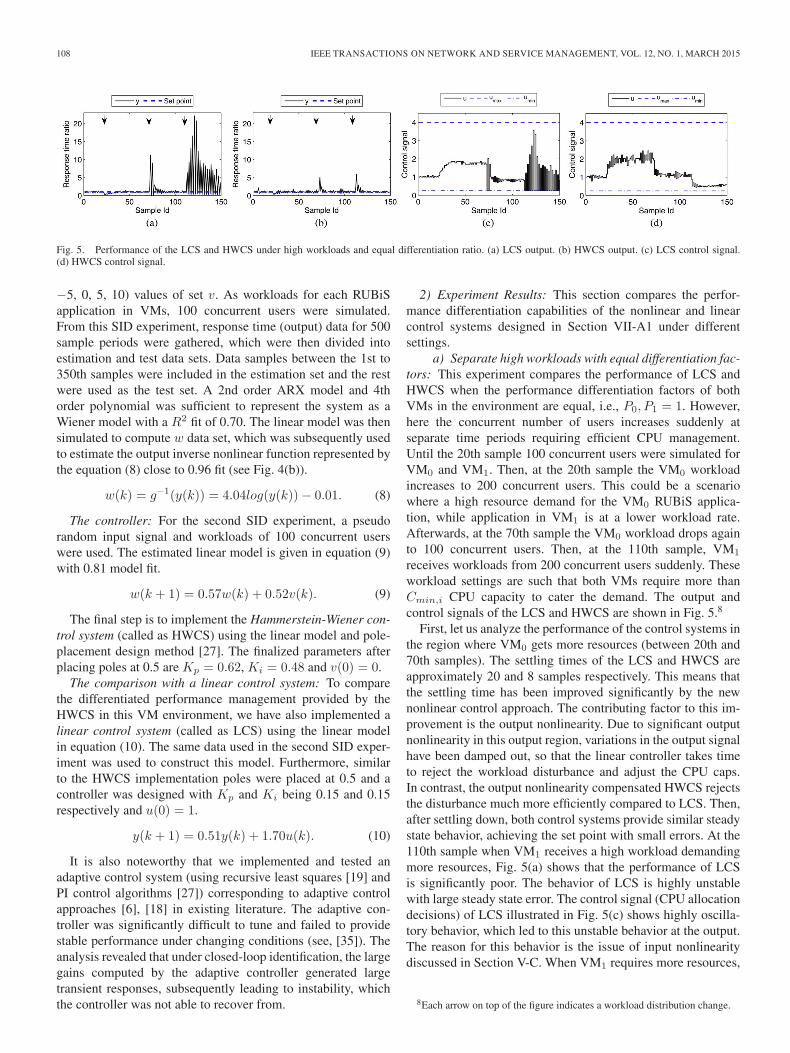
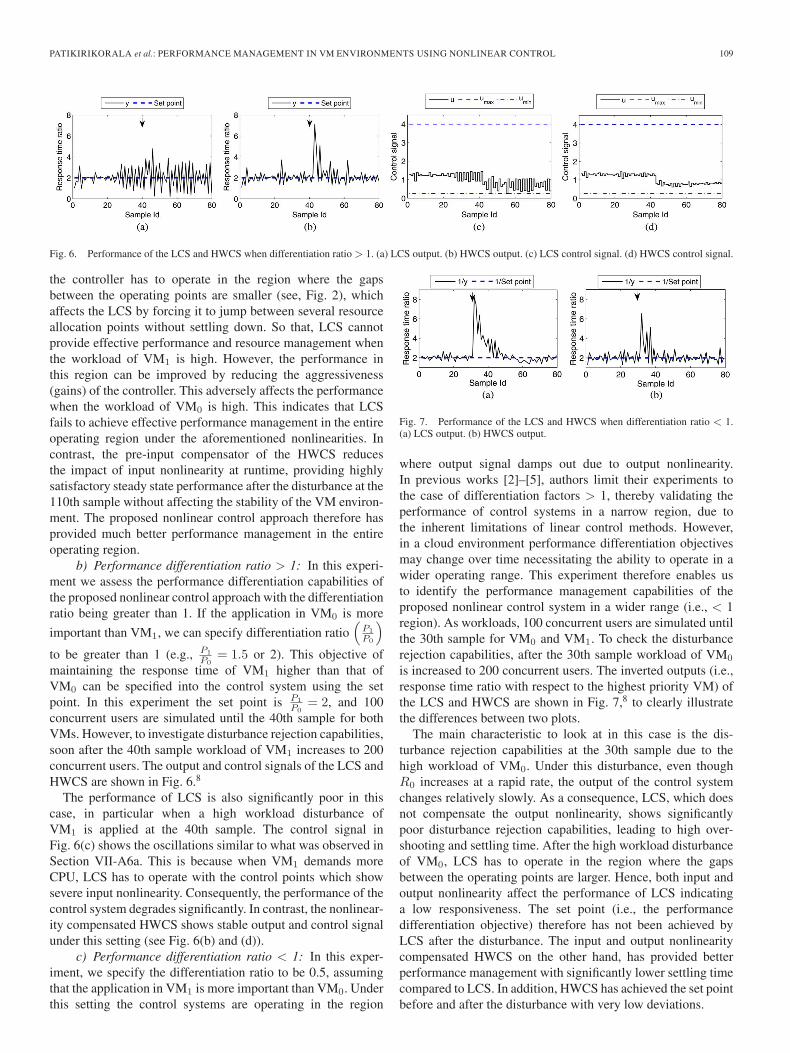
Fig. 6. Performance of the LCS and HWCS when differentiation ratio > 1. (a) LCS output. (b) HWCS output. (c) LCS control signal. (d) HWCS control signal.
the controller has to operate in the region where the gapsbetween the operating points are smaller (see, Fig. 2), whichaffects the LCS by forcing it to jump between several resourceallocation points without settling down. So that, LCS cannotprovide effective performance and resource management whenthe workload of VM1 is high. However, the performance inthis region can be improved by reducing the aggressiveness(gains) of the controller. This adversely affects the performancewhen the workload of VM0 is high. This indicates that LCSfails to achieve effective performance management in the entireoperating region under the aforementioned nonlinearities. Incontrast, the pre-input compensator of the HWCS reducesthe impact of input nonlinearity at runtime, providing highlysatisfactory steady state performance after the disturbance at the110th sample without affecting the stability of the VM environ-ment. The proposed nonlinear control approach therefore hasprovided much better performance management in the entireoperating region.
b) Performance differentiation ratio > 1: In this experi-ment we assess the performance differentiation capabilities ofthe proposed nonlinear control approach with the differentiationratio being greater than 1. If the application in VM0 is more
important than VM1, we can specify differentiation ratio(
P1
P0
)to be greater than 1 (e.g., P1
P0= 1.5 or 2). This objective of
maintaining the response time of VM1 higher than that ofVM0 can be specified into the control system using the setpoint. In this experiment the set point is P1
P0= 2, and 100
concurrent users are simulated until the 40th sample for bothVMs. However, to investigate disturbance rejection capabilities,soon after the 40th sample workload of VM1 increases to 200concurrent users. The output and control signals of the LCS andHWCS are shown in Fig. 6.8
The performance of LCS is also significantly poor in thiscase, in particular when a high workload disturbance ofVM1 is applied at the 40th sample. The control signal inFig. 6(c) shows the oscillations similar to what was observed inSection VII-A6a. This is because when VM1 demands moreCPU, LCS has to operate with the control points which showsevere input nonlinearity. Consequently, the performance of thecontrol system degrades significantly. In contrast, the nonlinear-ity compensated HWCS shows stable output and control signalunder this setting (see Fig. 6(b) and (d)).
c) Performance differentiation ratio < 1: In this exper-iment, we specify the differentiation ratio to be 0.5, assumingthat the application in VM1 is more important than VM0. Underthis setting the control systems are operating in the region
Fig. 7. Performance of the LCS and HWCS when differentiation ratio < 1.(a) LCS output. (b) HWCS output.
where output signal damps out due to output nonlinearity.In previous works [2]–[5], authors limit their experiments tothe case of differentiation factors > 1, thereby validating theperformance of control systems in a narrow region, due tothe inherent limitations of linear control methods. However,in a cloud environment performance differentiation objectivesmay change over time necessitating the ability to operate in awider operating range. This experiment therefore enables usto identify the performance management capabilities of theproposed nonlinear control system in a wider range (i.e., < 1region). As workloads, 100 concurrent users are simulated untilthe 30th sample for VM0 and VM1. To check the disturbancerejection capabilities, after the 30th sample workload of VM0
is increased to 200 concurrent users. The inverted outputs (i.e.,response time ratio with respect to the highest priority VM) ofthe LCS and HWCS are shown in Fig. 7,8 to clearly illustratethe differences between two plots.
The main characteristic to look at in this case is the dis-turbance rejection capabilities at the 30th sample due to thehigh workload of VM0. Under this disturbance, even thoughR0 increases at a rapid rate, the output of the control systemchanges relatively slowly. As a consequence, LCS, which doesnot compensate the output nonlinearity, shows significantlypoor disturbance rejection capabilities, leading to high over-shooting and settling time. After the high workload disturbanceof VM0, LCS has to operate in the region where the gapsbetween the operating points are larger. Hence, both input andoutput nonlinearity affect the performance of LCS indicatinga low responsiveness. The set point (i.e., the performancedifferentiation objective) therefore has not been achieved byLCS after the disturbance. The input and output nonlinearitycompensated HWCS on the other hand, has provided betterperformance management with significantly lower settling timecompared to LCS. In addition, HWCS has achieved the set pointbefore and after the disturbance with very low deviations.
110 IEEE TRANSACTIONS ON NETWORK AND SERVICE MANAGEMENT, VOL. 12, NO. 1, MARCH 2015
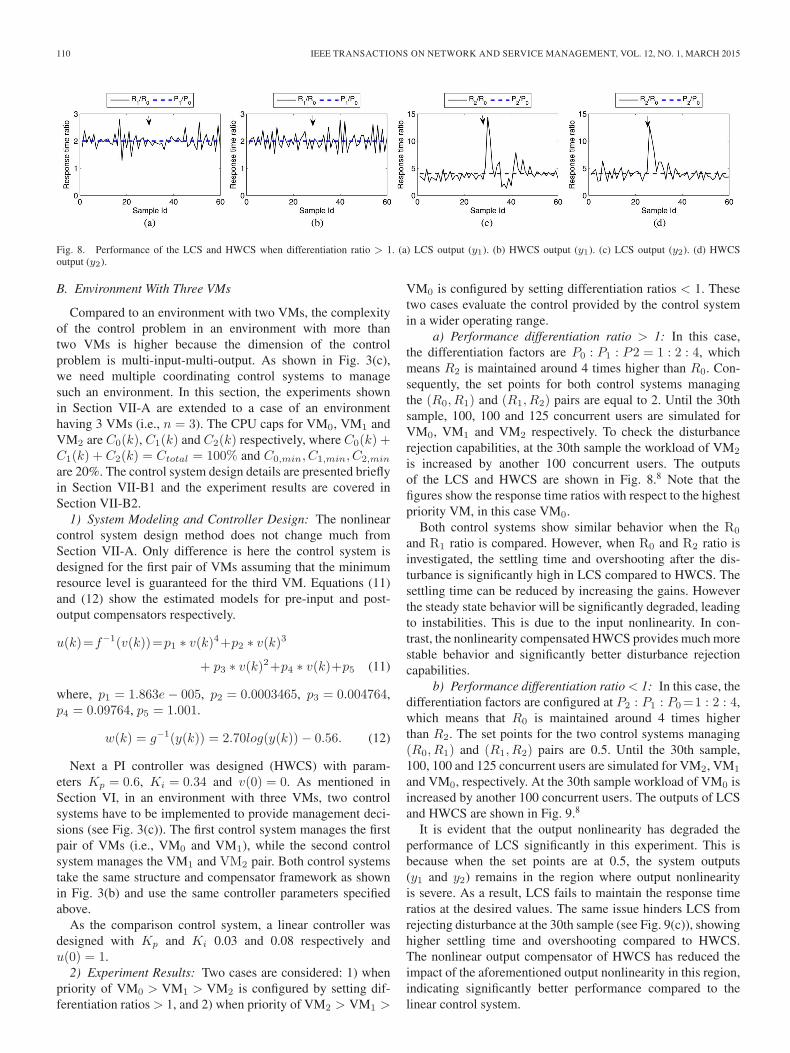
Fig. 8. Performance of the LCS and HWCS when differentiation ratio > 1. (a) LCS output (y1). (b) HWCS output (y1). (c) LCS output (y2). (d) HWCSoutput (y2).
B. Environment With Three VMs
Compared to an environment with two VMs, the complexityof the control problem in an environment with more thantwo VMs is higher because the dimension of the controlproblem is multi-input-multi-output. As shown in Fig. 3(c),we need multiple coordinating control systems to managesuch an environment. In this section, the experiments shownin Section VII-A are extended to a case of an environmenthaving 3 VMs (i.e., n = 3). The CPU caps for VM0, VM1 andVM2 are C0(k), C1(k) and C2(k) respectively, where C0(k) +C1(k) + C2(k) = Ctotal = 100% and C0,min, C1,min, C2,min
are 20%. The control system design details are presented brieflyin Section VII-B1 and the experiment results are covered inSection VII-B2.
1) System Modeling and Controller Design: The nonlinearcontrol system design method does not change much fromSection VII-A. Only difference is here the control system isdesigned for the first pair of VMs assuming that the minimumresource level is guaranteed for the third VM. Equations (11)and (12) show the estimated models for pre-input and post-output compensators respectively.
u(k)=f−1(v(k))=p1 ∗ v(k)4+p2 ∗ v(k)3
+ p3 ∗ v(k)2+p4 ∗ v(k)+p5 (11)
where, p1 = 1.863e− 005, p2 = 0.0003465, p3 = 0.004764,p4 = 0.09764, p5 = 1.001.
w(k) = g−1(y(k)) = 2.70log(y(k))− 0.56. (12)
Next a PI controller was designed (HWCS) with param-eters Kp = 0.6, Ki = 0.34 and v(0) = 0. As mentioned inSection VI, in an environment with three VMs, two controlsystems have to be implemented to provide management deci-sions (see Fig. 3(c)). The first control system manages the firstpair of VMs (i.e., VM0 and VM1), while the second controlsystem manages the VM1 and VM2 pair. Both control systemstake the same structure and compensator framework as shownin Fig. 3(b) and use the same controller parameters specifiedabove.
As the comparison control system, a linear controller wasdesigned with Kp and Ki 0.03 and 0.08 respectively andu(0) = 1.
2) Experiment Results: Two cases are considered: 1) whenpriority of VM0 > VM1 > VM2 is configured by setting dif-ferentiation ratios > 1, and 2) when priority of VM2 > VM1 >
VM0 is configured by setting differentiation ratios < 1. Thesetwo cases evaluate the control provided by the control systemin a wider operating range.
a) Performance differentiation ratio > 1: In this case,the differentiation factors are P0 : P1 : P2 = 1 : 2 : 4, whichmeans R2 is maintained around 4 times higher than R0. Con-sequently, the set points for both control systems managingthe (R0, R1) and (R1, R2) pairs are equal to 2. Until the 30thsample, 100, 100 and 125 concurrent users are simulated forVM0, VM1 and VM2 respectively. To check the disturbancerejection capabilities, at the 30th sample the workload of VM2
is increased by another 100 concurrent users. The outputsof the LCS and HWCS are shown in Fig. 8.8 Note that thefigures show the response time ratios with respect to the highestpriority VM, in this case VM0.
Both control systems show similar behavior when the R0
and R1 ratio is compared. However, when R0 and R2 ratio isinvestigated, the settling time and overshooting after the dis-turbance is significantly high in LCS compared to HWCS. Thesettling time can be reduced by increasing the gains. Howeverthe steady state behavior will be significantly degraded, leadingto instabilities. This is due to the input nonlinearity. In con-trast, the nonlinearity compensated HWCS provides much morestable behavior and significantly better disturbance rejectioncapabilities.
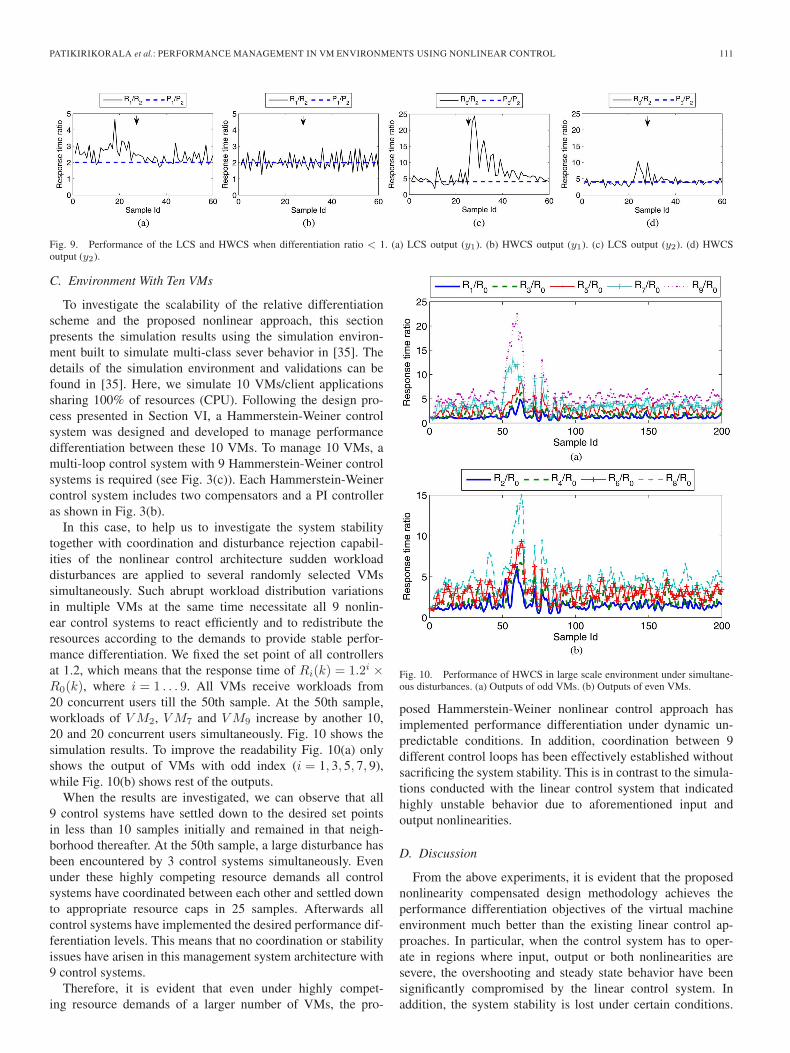
b) Performance differentiation ratio < 1: In this case, thedifferentiation factors are configured at P2 : P1 : P0=1 : 2 : 4,which means that R0 is maintained around 4 times higherthan R2. The set points for the two control systems managing(R0, R1) and (R1, R2) pairs are 0.5. Until the 30th sample,100, 100 and 125 concurrent users are simulated for VM2, VM1
and VM0, respectively. At the 30th sample workload of VM0 isincreased by another 100 concurrent users. The outputs of LCSand HWCS are shown in Fig. 9.8
It is evident that the output nonlinearity has degraded theperformance of LCS significantly in this experiment. This isbecause when the set points are at 0.5, the system outputs(y1 and y2) remains in the region where output nonlinearityis severe. As a result, LCS fails to maintain the response timeratios at the desired values. The same issue hinders LCS fromrejecting disturbance at the 30th sample (see Fig. 9(c)), showinghigher settling time and overshooting compared to HWCS.The nonlinear output compensator of HWCS has reduced theimpact of the aforementioned output nonlinearity in this region,indicating significantly better performance compared to thelinear control system.
PATIKIRIKORALA et al.: PERFORMANCE MANAGEMENT IN VM ENVIRONMENTS USING NONLINEAR CONTROL 111
Fig. 9. Performance of the LCS and HWCS when differentiation ratio < 1. (a) LCS output (y1). (b) HWCS output (y1). (c) LCS output (y2). (d) HWCSoutput (y2).
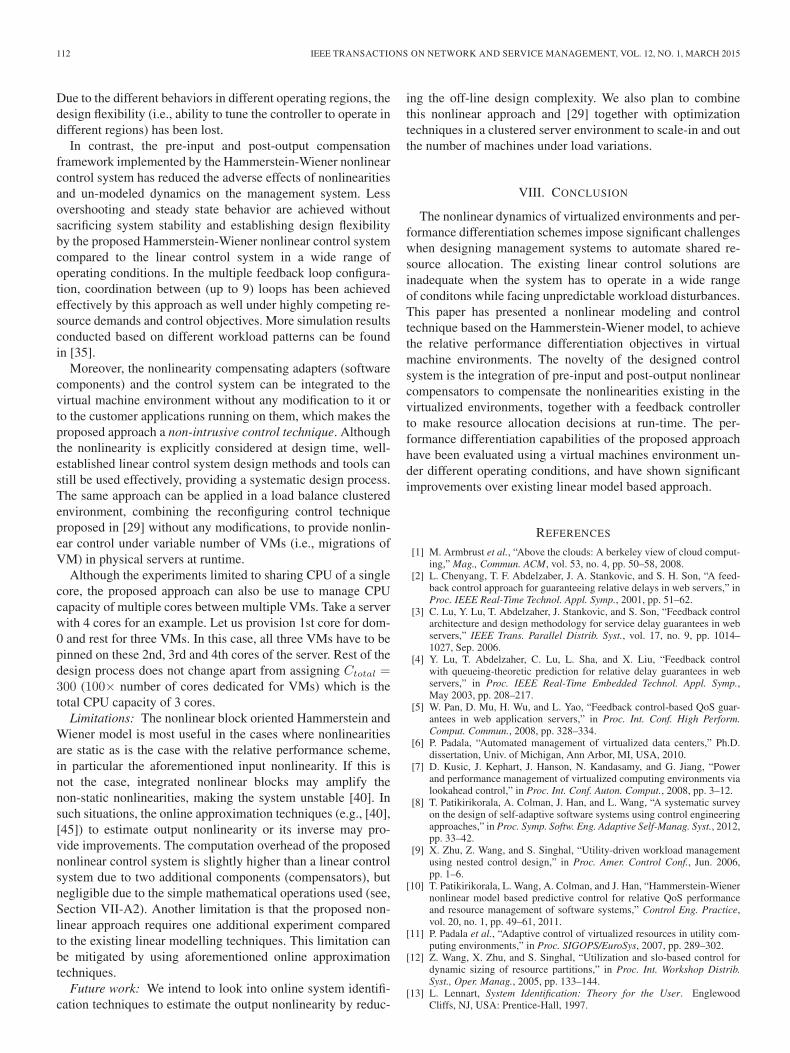
C. Environment With Ten VMs
To investigate the scalability of the relative differentiationscheme and the proposed nonlinear approach, this sectionpresents the simulation results using the simulation environ-ment built to simulate multi-class sever behavior in [35]. Thedetails of the simulation environment and validations can befound in [35]. Here, we simulate 10 VMs/client applicationssharing 100% of resources (CPU). Following the design pro-cess presented in Section VI, a Hammerstein-Weiner controlsystem was designed and developed to manage performancedifferentiation between these 10 VMs. To manage 10 VMs, amulti-loop control system with 9 Hammerstein-Weiner controlsystems is required (see Fig. 3(c)). Each Hammerstein-Weinercontrol system includes two compensators and a PI controlleras shown in Fig. 3(b).
In this case, to help us to investigate the system stabilitytogether with coordination and disturbance rejection capabil-ities of the nonlinear control architecture sudden workloaddisturbances are applied to several randomly selected VMssimultaneously. Such abrupt workload distribution variationsin multiple VMs at the same time necessitate all 9 nonlin-ear control systems to react efficiently and to redistribute theresources according to the demands to provide stable perfor-mance differentiation. We fixed the set point of all controllersat 1.2, which means that the response time of Ri(k) = 1.2i ×R0(k), where i = 1 . . . 9. All VMs receive workloads from20 concurrent users till the 50th sample. At the 50th sample,workloads of VM2, VM7 and VM9 increase by another 10,20 and 20 concurrent users simultaneously. Fig. 10 shows thesimulation results. To improve the readability Fig. 10(a) onlyshows the output of VMs with odd index (i = 1, 3, 5, 7, 9),while Fig. 10(b) shows rest of the outputs.
When the results are investigated, we can observe that all9 control systems have settled down to the desired set pointsin less than 10 samples initially and remained in that neigh-borhood thereafter. At the 50th sample, a large disturbance hasbeen encountered by 3 control systems simultaneously. Evenunder these highly competing resource demands all controlsystems have coordinated between each other and settled downto appropriate resource caps in 25 samples. Afterwards allcontrol systems have implemented the desired performance dif-ferentiation levels. This means that no coordination or stabilityissues have arisen in this management system architecture with9 control systems.
Therefore, it is evident that even under highly compet-ing resource demands of a larger number of VMs, the pro-
Fig. 10. Performance of HWCS in large scale environment under simultane-ous disturbances. (a) Outputs of odd VMs. (b) Outputs of even VMs.
posed Hammerstein-Weiner nonlinear control approach hasimplemented performance differentiation under dynamic un-predictable conditions. In addition, coordination between 9different control loops has been effectively established withoutsacrificing the system stability. This is in contrast to the simula-tions conducted with the linear control system that indicatedhighly unstable behavior due to aforementioned input andoutput nonlinearities.
D. Discussion
From the above experiments, it is evident that the proposednonlinearity compensated design methodology achieves theperformance differentiation objectives of the virtual machineenvironment much better than the existing linear control ap-proaches. In particular, when the control system has to oper-ate in regions where input, output or both nonlinearities aresevere, the overshooting and steady state behavior have beensignificantly compromised by the linear control system. Inaddition, the system stability is lost under certain conditions.
112 IEEE TRANSACTIONS ON NETWORK AND SERVICE MANAGEMENT, VOL. 12, NO. 1, MARCH 2015
Due to the different behaviors in different operating regions, thedesign flexibility (i.e., ability to tune the controller to operate indifferent regions) has been lost.
In contrast, the pre-input and post-output compensationframework implemented by the Hammerstein-Wiener nonlinearcontrol system has reduced the adverse effects of nonlinearitiesand un-modeled dynamics on the management system. Lessovershooting and steady state behavior are achieved withoutsacrificing system stability and establishing design flexibilityby the proposed Hammerstein-Wiener nonlinear control systemcompared to the linear control system in a wide range ofoperating conditions. In the multiple feedback loop configura-tion, coordination between (up to 9) loops has been achievedeffectively by this approach as well under highly competing re-source demands and control objectives. More simulation resultsconducted based on different workload patterns can be foundin [35].
Moreover, the nonlinearity compensating adapters (softwarecomponents) and the control system can be integrated to thevirtual machine environment without any modification to it orto the customer applications running on them, which makes theproposed approach a non-intrusive control technique. Althoughthe nonlinearity is explicitly considered at design time, well-established linear control system design methods and tools canstill be used effectively, providing a systematic design process.The same approach can be applied in a load balance clusteredenvironment, combining the reconfiguring control techniqueproposed in [29] without any modifications, to provide nonlin-ear control under variable number of VMs (i.e., migrations ofVM) in physical servers at runtime.
Although the experiments limited to sharing CPU of a singlecore, the proposed approach can also be use to manage CPUcapacity of multiple cores between multiple VMs. Take a serverwith 4 cores for an example. Let us provision 1st core for dom-0 and rest for three VMs. In this case, all three VMs have to bepinned on these 2nd, 3rd and 4th cores of the server. Rest of thedesign process does not change apart from assigning Ctotal =300 (100× number of cores dedicated for VMs) which is thetotal CPU capacity of 3 cores.
Limitations: The nonlinear block oriented Hammerstein andWiener model is most useful in the cases where nonlinearitiesare static as is the case with the relative performance scheme,in particular the aforementioned input nonlinearity. If this isnot the case, integrated nonlinear blocks may amplify thenon-static nonlinearities, making the system unstable [40]. Insuch situations, the online approximation techniques (e.g., [40],[45]) to estimate output nonlinearity or its inverse may pro-vide improvements. The computation overhead of the proposednonlinear control system is slightly higher than a linear controlsystem due to two additional components (compensators), butnegligible due to the simple mathematical operations used (see,Section VII-A2). Another limitation is that the proposed non-linear approach requires one additional experiment comparedto the existing linear modelling techniques. This limitation canbe mitigated by using aforementioned online approximationtechniques.
Future work: We intend to look into online system identifi-cation techniques to estimate the output nonlinearity by reduc-
ing the off-line design complexity. We also plan to combinethis nonlinear approach and [29] together with optimizationtechniques in a clustered server environment to scale-in and outthe number of machines under load variations.
VIII. CONCLUSION
The nonlinear dynamics of virtualized environments and per-formance differentiation schemes impose significant challengeswhen designing management systems to automate shared re-source allocation. The existing linear control solutions areinadequate when the system has to operate in a wide rangeof conditons while facing unpredictable workload disturbances.This paper has presented a nonlinear modeling and controltechnique based on the Hammerstein-Wiener model, to achievethe relative performance differentiation objectives in virtualmachine environments. The novelty of the designed controlsystem is the integration of pre-input and post-output nonlinearcompensators to compensate the nonlinearities existing in thevirtualized environments, together with a feedback controllerto make resource allocation decisions at run-time. The per-formance differentiation capabilities of the proposed approachhave been evaluated using a virtual machines environment un-der different operating conditions, and have shown significantimprovements over existing linear model based approach.
REFERENCES
[1] M. Armbrust et al., “Above the clouds: A berkeley view of cloud comput-ing,” Mag., Commun. ACM, vol. 53, no. 4, pp. 50–58, 2008.
[2] L. Chenyang, T. F. Abdelzaber, J. A. Stankovic, and S. H. Son, “A feed-back control approach for guaranteeing relative delays in web servers,” inProc. IEEE Real-Time Technol. Appl. Symp., 2001, pp. 51–62.
[3] C. Lu, Y. Lu, T. Abdelzaher, J. Stankovic, and S. Son, “Feedback controlarchitecture and design methodology for service delay guarantees in webservers,” IEEE Trans. Parallel Distrib. Syst., vol. 17, no. 9, pp. 1014–1027, Sep. 2006.
[4] Y. Lu, T. Abdelzaher, C. Lu, L. Sha, and X. Liu, “Feedback controlwith queueing-theoretic prediction for relative delay guarantees in webservers,” in Proc. IEEE Real-Time Embedded Technol. Appl. Symp.,May 2003, pp. 208–217.
[5] W. Pan, D. Mu, H. Wu, and L. Yao, “Feedback control-based QoS guar-antees in web application servers,” in Proc. Int. Conf. High Perform.Comput. Commun., 2008, pp. 328–334.
[6] P. Padala, “Automated management of virtualized data centers,” Ph.D.dissertation, Univ. of Michigan, Ann Arbor, MI, USA, 2010.
[7] D. Kusic, J. Kephart, J. Hanson, N. Kandasamy, and G. Jiang, “Powerand performance management of virtualized computing environments vialookahead control,” in Proc. Int. Conf. Auton. Comput., 2008, pp. 3–12.
[8] T. Patikirikorala, A. Colman, J. Han, and L. Wang, “A systematic surveyon the design of self-adaptive software systems using control engineeringapproaches,” in Proc. Symp. Softw. Eng. Adaptive Self-Manag. Syst., 2012,pp. 33–42.
[9] X. Zhu, Z. Wang, and S. Singhal, “Utility-driven workload managementusing nested control design,” in Proc. Amer. Control Conf., Jun. 2006,pp. 1–6.
[10] T. Patikirikorala, L. Wang, A. Colman, and J. Han, “Hammerstein-Wienernonlinear model based predictive control for relative QoS performanceand resource management of software systems,” Control Eng. Practice,vol. 20, no. 1, pp. 49–61, 2011.
[11] P. Padala et al., “Adaptive control of virtualized resources in utility com-puting environments,” in Proc. SIGOPS/EuroSys, 2007, pp. 289–302.
[12] Z. Wang, X. Zhu, and S. Singhal, “Utilization and slo-based control fordynamic sizing of resource partitions,” in Proc. Int. Workshop Distrib.Syst., Oper. Manag., 2005, pp. 133–144.
[13] L. Lennart, System Identification: Theory for the User. EnglewoodCliffs, NJ, USA: Prentice-Hall, 1997.
PATIKIRIKORALA et al.: PERFORMANCE MANAGEMENT IN VM ENVIRONMENTS USING NONLINEAR CONTROL 113
[14] X. Wang and Y. Wang, “Coordinating power control and performancemanagement for virtualized server clusters,” IEEE Trans. Parallel Distrib.Syst., vol. 22, no. 2, pp. 245–259, Feb. 2011.
[15] X. Wang, M. Chen, and X. Fu, “MIMO power control for high-densityservers in an enclosure,” IEEE Trans. Parallel Distrib. Syst., vol. 21,no. 10, pp. 1412–1426, Oct. 2010.
[16] J. Gong and C.-Z. Xu, “vPnP: Automated coordination of power andperformance in virtualized datacenters,” in Proc. Int. Workshop Qualityof Service, 2010, pp. 1–9.
[17] Z. Wang et al., “Autoparam: Automated control of application-level per-formance in virtualized server environments,” in Proc. Workshop Feed-back Control Implementation Des. Comput. Syst. Netw., 2007, pp. 2–7.
[18] Y. Lu, T. Abdelzaher, C. Lu, and G. Tao, “An adaptive control frameworkfor QoS guarantees and its application to differentiated caching,” in Proc.IEEE Int. Workshop Quality of Service, 2002, pp. 23–32.
[19] K. J. Åstrom and B. Wittenmark, Adaptive Control. Reading, MA, USA:Addison-Wesley, 1995.
[20] T. Patikirikorala, A. Colman, J. Han, and L. Wang, “A multi-modelframework to implement self-managing control systems for QoS manage-ment,” in Proc. Int. Symp. Softw. Eng. Adaptive Self-Manag. Syst., 2011,pp. 218–227.
[21] F. Tian, W. Xu, and J. Sun, “Web QoS control using fuzzy adaptive PIcontroller,” in Proc. 9th Int. Symp. DCABES, 2010, pp. 72–75.
[22] J. Xu, M. Zhao, J. Fortes, R. Carpenter, and M. Yousif, “Autonomicresource management in virtualized data centers using fuzzy logic-basedapproaches,” Cluster Comput., vol. 11, no. 3, pp. 213–227, Sep. 2008.
[23] J. Rao, Y. Wei, J. Gong, and C.-Z. Xu, “Qos guarantees and servicedifferentiation for dynamic cloud applications,” IEEE Trans. Netw. Serv.Manag., vol. 10, no. 1, pp. 43–55, Mar. 2013.
[24] P. Lama and X. Zhou, “Autonomic provisioning with self-adaptive neuralfuzzy control for percentile-based delay guarantee,” ACM Trans. Auton.Adapt. Syst., vol. 8, no. 2, pp. 9:1–9:31, Jul. 2013.
[25] T. Hayashi and S. Ohta, “Performance management of virtual machinesvia passive measurement and machine learning,” in Proc. 9th Int. Conf.UIC/ATC, Sep. 2012, pp. 533–538.
[26] S. Kundu, R. Rangaswami, A. Gulati, M. Zhao, and K. Dutta, “Mod-eling virtualized applications using machine learning techniques,” ACMSIGPLAN Notices, vol. 47, no. 7, pp. 3–14, Mar. 2012. [Online]. Avail-able: http://doi.acm.org/10.1145/2365864.2151028
[27] J. L. Hellerstein, Y. Diao, S. Parekh, and D. M. Tilbury, Feedback Controlof Computing Systems. Hoboken, NJ, USA: Wiley, 2004.
[28] Z. Wang et al., “Appraise: Application-level performance management invirtualized server environments,” IEEE Trans. Netw. Serv. Manag., vol. 6,no. 4, pp. 240–254, Dec. 2009.
[29] T. Patikirikorala, A. Colman, and J. Han, “Multi-mode-multi-modelsupervisory control framework for performance differentiation in vir-tual machine environments,” Swinburne University, Hawthorn, VIC,USA, Tech. Rep., 2014. [Online]. Available: http://www.ict.swin.edu.au/personal/tpatikirikorala/Research.htm
[30] T. Patikirikorala et al., “Dynamic performance management in multi-tenanted business process servers using nonlinear control,” in Proc.ICSOC, 2012, pp. 206–221.
[31] R. Pearson and M. Pottmann, “Gray-box identification of block-orientednonlinear models,” J. Process Control, vol. 10, no. 4, pp. 301–315,Aug. 2000.
[32] J. Voros, “An iterative method for Hammerstein-Wiener systems parame-ter identification,” J. Elect. Eng., vol. 55, no. 11/12, pp. 328–331, 2004.
[33] K. Narendra and P. Gallman, “An iterative method for the identificationof nonlinear systems using a Hammerstein model,” IEEE Trans. Autom.Control, vol. 11, no. 3, pp. 546–550, Jul. 1966.
[34] R. B. Abdennour, M. Ksouri, and F. M’Sahli, “Nonlinear model-basedpredictive control using a generalised Hammerstein model and its applica-tion to a semi-batch reactor,” Int. J. Adv. Manuf. Technol., vol. 20, no. 11,pp. 844–852, Nov. 2002.
[35] T. Patikirikorala, “Using nonlinear control of resources to achieve dif-ferential performance objectives in software systems,” Ph.D. dissertation,Swinburne Univ. of Tech., Hawthorn, VIC, Australia, 2013.
[36] A. Hagenblad, “Aspects of the identication of Wiener models,” Ph.D.dissertation, Linköpings Univ., Linköpings, Sweden, 2001.
[37] S. J. Norquay, A. Palazoglu, and J. Romagnoli, “Model predictive controlbased on Wiener models,” Chem. Eng. Sci., vol. 53, pp. 75–84, 1998.
[38] A. L. Cervantes, O. E. Agamennoni, and J. L. Figueroa, “A nonlinearmodel predictive control system based on Wiener piecewise linear mod-els,” J. Process Control, vol. 13, no. 7, pp. 655–666, Oct. 2003.
[39] S. Gerksic, D. Juricic, S. Strmcnik, and D. Matko, “Wiener model basednonlinear predictive control,” Int. J. Syst. Sci., vol. 31, no. 2, pp. 189–202,2000.
[40] A. D. Kalafatis, L. Wang, and W. R. Cluett, “Identification of Wiener-typenonlinear systems in a noisy environment,” Int. J. Control, vol. 66, no. 6,pp. 923–941, 1997.
[41] A. Kalafatis, N. Arifin, L. Wang, and W. R. Cluett, “A new approach to theidentification of pH processes based on the Wiener model,” Chem. Eng.Sci., vol. 50, no. 23, pp. 3693–3701, Dec. 1995.
[42] W. C. L. Wang, From Plant Data to Process Control:Ideas for ProcessIdentification and PID Design. New York, NY, USA: Taylor & Francis,2000.
[43] Matlab, Matlab System Identification Toolbox: MATHWORKS 2009a.[44] J. C. Gomez, A. Jutan, and E. Baeyens, “Wiener model identification and
predictive control of a pH neutralisation process,” IEEE Proc.-ControlTheory Appl., vol. 151, no. 3, pp. 329–338, May 2004.
[45] S. Gerksic, D. Juricic, and S. Strmcnik, “Adaptive implementation ofWiener model based nonlinear predictive control,” in Proc. IEEE ISIE,1999, vol. 3, pp. 1159–1164.
Authors’ photographs and biographies not available at the time of
publication.