Embed Size (px)
Citation preview
Differential stoichiometry among coreribosomal proteins
Nikolai Slavova,‡, Stefan Semraub, Edoardo Airoldia, Bogdan A. Budnika,Alexander van Oudenaardenb
aDepartment of Statistics and FAS Center for Systems Biology,Harvard University, Cambridge, MA 02138, USA
bHubrecht Institute, Royal Netherlands Academy of Arts and Sciences andUniversity Medical Center Utrecht, Uppsalalaan 8, 3584 CT, Utrecht, The Netherlands
‡To whom correspondence should be addressed: [email protected]
1
arX
iv:1
406.
0399
v2 [
q-bi
o.G
N]
15
Apr
201
5
Understanding the regulation and structure of ribosomes is essential to under-
standing protein synthesis and its deregulation in disease. While ribosomes
are believed to have a fixed stoichiometry among their core ribosomal proteins
(RPs), some experiments suggest a more variable composition. Testing such
variability requires direct and precise quantification of RPs. We used mass-
spectrometry to directly quantify RPs across monosomes and polysomes of
mouse embryonic stem cells (ESC) and budding yeast. Our data show that the
stoichiometry among core RPs in wild-type yeast cells and ESC depends both
on the growth conditions and on the number of ribosomes bound per mRNA.
Furthermore, we find that the fitness of cells with a deleted RP-gene is in-
versely proportional to the enrichment of the corresponding RP in polysomes.
Together, our findings support the existence of ribosomes with distinct protein
composition and physiological function.
Introduction
Ribosomes catalyze protein translation but have only a few characterized roles in regulating
translation (Mauro and Edelman, 2002; Xue and Barna, 2012). Rather, the most–studied molec-
ular regulatory mechanisms of translation are mediated by eukaryotic initiation factors, RNA
binding proteins, and microRNAs (Gingras et al, 1999; Hendrickson et al, 2009; Sonenberg
and Hinnebusch, 2009; Fabian and Sonenberg, 2012). The characterized catalytic role of the
ribosomes corresponds well to the model of the ribosome as a single complex with a fixed sto-
ichiometry: 4 ribosomal RNAs and 80 core RPs (Warner, 1999; Ben-Shem et al, 2010, 2011),
some of which are represented by several paralogous RPs. Despite the longstanding interest
in ribosome structure and function, the exact stoichiometry and possible heterogeneity of the
ribosomes have been challenging to measure directly (Weber, 1972; Westermann et al, 1976;
Hardy, 1975). Such measurements are enabled by modern quantitative mass spectrometry (MS);
reviewed by Bensimon et al (2012). Indeed, MS has transformed our understanding of protein
2
complexes, such as proteasomes (Wang et al, 2007) and nuclear pore complexes (Ori et al,
2013; Bui et al, 2013), by demonstrating variability among their protein subunits.
Studies of eukaryotic ribosomes (Mazumder et al, 2003; Galkin et al, 2007; Komili et al,
2007; Kondrashov et al, 2011; Topisirovic and Sonenberg, 2011; Horos et al, 2012; Lee et al,
2013; Tiruneh et al, 2013) have demonstrated that (i) genetic perturbations to the core RPs
specifically affect the translation of some mRNAs and not others and (ii) mRNAs coding
for core RPs are transcribed, spliced, and translated differentially across physiological con-
ditions (Ramagopal and Ennis, 1981; Ramagopal, 1990; Brauer et al, 2008; Parenteau et al,
2011; Slavov and Dawson, 2009; Slavov and Botstein, 2011; O’Leary et al, 2013; Slavov et al,
2014; Jovanovic et al, 2015). These results suggest the hypothesis (Mauro and Edelman, 2002;
Gilbert, 2011; Xue and Barna, 2012) that, depending on the tissue type and the physiologi-
cal conditions, cells can alter the stoichiometry among the core RPs comprising the ribosomes
and thus in turn alter the translational efficiency of distinct mRNAs. Alternatively, differential
RP-expression can reflect extra ribosomal functions of the RPs (Mazumder et al, 2003; Wool,
1996; Warner and McIntosh, 2009). Furthermore, polysomes (multiple ribosomes per mRNA)
from different cell–lines have similar core RP stoichiometries (Reschke et al, 2013). Thus, the
variable RP stoichiometry in the ribosomes of wild-type cells that is suggested by the ribosome
specialization hypothesis remains unproven.
Results
Differential stoichiometry among core RPs in mouse ESCs
To measure whether the stoichiometry among RPs can vary, we quantified RP levels in mono-
somes and polysomes from exponentially growing mouse embryonic stem cells (ESC). The
ribosomes were isolated by velocity–sedimentation in sucrose–gradients (Fig. 1A), and the pro-
teins from individual fractions were digested to peptides, labeled with tandem mass tags (TMT),
and quantified on Orbitrap Elite based on the MS2 intensities of the TMT reporter ions; see Ex-
tended View Appendix. The monosomal sample was quantified in two replicas (1a and 1b), and
3
the results indicate very high reproducibility (ρ = 0.92; Fig. 1B). To control for protease and
peptide biases, the proteins from each analyzed sucrose fraction were digested either by trypsin
(T) or by lys–C (L) and peptides from each digestion quantified independently. Because of the
different specificity of trypsin and lys-C, most RP peptides (1058) were identified and quantified
only in the trypsin or only in the lys–C digestion, while only 269 peptides were identified and
quantified in both digestions. Thus, peptide-specific biases (such as co-isolation interference)
cannot be shared between the two digestions.
The measured levels of a unique peptide (a peptide present in a single RP) reflect the levels
of the corresponding RP, post–translational modifications (PTMs) of the peptide (if any), and
measurement error. We quantify on average ten distinct RP–peptides per RP (Figure E1A), and
the levels of these peptides allow both the estimation of the RP levels and the consistency of
these estimates. To depict both the estimates and their consistency, we display the full distribu-
tions of relative levels of all peptides unique to an RP as boxplots in Fig. 1C, D. The RP levels
across the sucrose gradient (estimated as the median of the levels of unique peptides) indicate
that some RPs are enriched in monosomes (Fig. 1C), while other RPs are enriched in polysomes
(Fig. 1D). This enrichment is substantially higher than the measurement noise, consistent across
replicas and across distinct peptides, and highly statistically significant at false discovery rate
(FDR) < 10−6. The relative levels of all RPs with quantified unique peptides are displayed in
Fig. 2 to illustrate the global pattern of RP levels across monosomes and polysomes. This pat-
tern shows more RPs whose variability is consistent across replicas and enzymatic digestions.
In contrast, the levels of RPs buried in the core of the ribosomes remain constant, with estimates
fluctuating within the tight bounds of the measurement noise, Fig. 2. This fixed stoichiometry
among RPs constituting the ribosomal core suggests that even ribosomes lacking some surface
RPs likely have the same core structure; see Extended View Appendix.
In principle, if only a few peptides are quantified per RP, the measured peptide variability
might reflect reciprocal variability in corresponding PTM isoforms (if any) across the sucrose
gradients, e.g., the unmodified isoform is enriched in monosomes and a phosphorylated isoform
is enriched in polysomes. Such variable PTM isoforms (if any) are very interesting but cannot
4
explain the data for an RP quantified by dozens of peptides spanning the protein length and
indicating highly–consistent fold–changes across the sucrose gradient; see Fig. 1, Figure E1,
and Extended View Appendix. We further tested the RP variability with an independent method,
Western blots, and in another strain of mouse ESC. Consistent with the MS data in Fig. 2, the
Western Blots data (Figure E3) indicate that Rps29 and Rps14 are enriched in polysomes, Rpl11
is enriched in monosomes, and Rpl32 does not change beyond the measurement noise.
Differential stoichiometry among core RPs in yeast
Having found differential stoichiometry among mouse RPs, we sought to further explore (i)
whether such ribosome heterogeneity is conserved to budding yeast and (ii) whether the RP
stoichiometry can change with growth conditions and metabolic state. To this end, we employed
sucrose gradients to separate the ribosomes from yeast cells grown in minimal media with either
glucose or ethanol as the sole source of carbon and energy (Slavov et al, 2014); see Extended
View Appendix. Consistent with previous observations that the type and the concentration of
the carbon source influence the ratio of monosomes to polysomes (Ashe et al, 2000; Castelli
et al, 2011; Vaidyanathan et al, 2014), the ratio of monosomes to polysomes in our yeast cells
grown in 0.4 % ethanol (Fig. 3A) or in 0.2 % glucose (Fig. 3B) is higher than is typically
observed for yeast grown in rich media containing 2 % glucose. As in mouse, some RPs are
enriched in monosomes (Fig. 3C) and others in polysomes (Fig. 3D, E). This enrichment is
reproducible (correlation between replicas ρ = 97; Fig. 3F) and consistent across independent
unique peptides whose levels are shown as boxplot distribution in Fig. 3C-D.
The pattern of relative RP levels shown in Fig. 3C-E indicates that RP stoichiometry depends
on two factors: on the number of ribosomes per mRNA (as in mouse) and on the carbon source
in the growth media; the RP levels that are higher in glucose compared to ethanol also tend to
increase with the number of ribosomes per mRNA (Fig. 3C-E). Furthermore, the ratios between
the polysomal and monosomal levels of yeast RPs correlate to the corresponding ratios for their
mouse orthologs (Fig. 3G; p-value < 0.03), suggesting that the RP-stoichiometry differences
between monosomes and polysomes are conserved across yeast and mouse.
5
Many yeast RPs are represented by two highly-homologous paralogs, and we explored
whether the exchange among paralogs (one paralog substituting for the other) can account for
the measured differential stoichiometry in Fig. 3E. The levels of paralogs localized on the sur-
face of the ribosome, such as Rpl17a and Rpl17b, are positively correlated and thus inconsistent
with paralog–exchange across the analyzed ribosomes (Fig. 3E). In contrast, RPs embedded
deep in the core of the ribosomes either remain constant (the estimated fluctuations of their lev-
els are within errorbars) or their paralogs exchange (e.g., the levels of Rpl37a and Rpl37b are
anticorrelated; see Fig. 3E), indicating that each ribosome has a copy of Rpl37. In general, the
RPs whose levels differ the most among the different fractions are located on the surface of the
yeast ribosomes, as can be seen from their 3D colorcoded rendition in the Supporting PDB files
and Movie 1.
RP enrichment in polysomes correlates to fitness
Next, we tested the variability among RPs and its phenotypic consequences by independent fit-
ness measurements. Our observation that the RP stoichiometry depends on the number of ribo-
somes bound per mRNA parallels measurements of higher translational activity of polysomes
compared to monosomes (Warner et al, 1963; Goodman and Rich, 1963); some studies have
even reported that the translational activity per ribosome increases with the number of ribo-
somes bound per mRNA (Noll et al, 1963; Wettstein et al, 1963), but this finding has not been
widely reproduced. We therefore hypothesized that genetic deletions of RPs enriched in the
more active ribosomes – as compared to RPs enriched in less active ribosomes – may result
in a larger decrease of the translation rate and thus lower fitness. To test this hypothesis, we
computed the correlation (Fig. 4A) between the fitness of yeast strains with single RP–gene
deletions (Qian et al, 2012) and the corresponding relative RP levels measured in the tetra-
ribosomal fraction (4 ribosomes per mRNA). Consistent with our hypothesis, the fitness of
strains lacking RP–genes is inversely proportional to the relative levels of the corresponding
RPs in the tetra-ribosomes (Fig. 4A). Extending this correlation analysis to the RP–levels in all
sucrose fractions shown in Fig. 3E results in a correlation pattern (Fig. 4B) that further sup-
6
ports our hypothesis by showing the opposite dependence for fractions with fewer ribosomes
per mRNA: the fitness of strains lacking RP–genes is proportional to the relative levels of the
corresponding RPs in fractions with fewer ribosomes per mRNA (Fig. 4B). This correlation
pattern holds both for ethanol and for glucose carbon sources. To mitigate possible artifacts in
the fitness data due to potential chromosome duplications in the deletion strains, we computed
the correlations between the RP–levels and the fitness of the corresponding RP–deletion strains
only for RPs without paralogs (thus unlikely to be affected by chromosome duplication) and
found much higher magnitudes of the correlations (Fig. 4A, B). This result suggests that the
differential RP stoichiometry is not limited to paralogous RPs substituting for each other.
To further explore the functional significance of the differential RP stoichiometry, we ex-
amined whether polysome–enriched RPs are preferentially induced at higher growth–rates. We
previously found that the degree of growth-rate-dependent transcriptional induction varies sig-
nificantly across RPs (Brauer et al, 2008; Slavov and Botstein, 2011; Slavov et al, 2012). We
quantified the growth-rate responses of RPs by regressing their mRNA levels on growth-rates
and computing growth rate-slopes. The magnitudes of RP growth–rate slopes range from pos-
itive (mRNA levels increase with increasing growth rate) to negative (mRNA levels decrease
with increasing growth rate), see Figure E4. Analogously to our fitness analysis (Fig. 4A), we
correlated the growth-rate slopes to the relative RP levels from Fig. 3E. Consistent with our
hypothesis, the correlation pattern (Fig. 4C) indicates that the higher the growth–rate slope of
a RP, the higher its enrichment in sucrose-fractions corresponding to increasing numbers of
ribosomes per mRNA.
We extended our fitness analysis from yeast to mouse using the published depletion data
from CRISPR knockouts in human ESC (Shalem et al, 2014); see Extended View Appendix.
We used BLAST to identify the closest mouse orthologs of each human RP with depletion
data (Fig. 4D), and correlated the fitness of human ESC lacking the human RP orthologs to the
RP levels across sucrose fractions that we measured, Fig. 2. The correlation pattern (Fig. 4E)
is similar to the one in yeast (Fig. 4A-C) and highly significant, FDR < 0.1%. This pattern
indicates that the fitness of ESC lacking RP-genes is directly proportional to the relative RP
7
levels in monosomes and inversely proportional to the relative RP levels in polysomes. The
magnitude of this inverse proportionality increases with the number of ribosomes per mRNA
(Fig. 4E), consistent with our hypothesis. The fact that the fitness of human ESC lacking RPs
correlates significantly to the levels of the corresponding mouse orthologous RPs suggests that
the differential RP stoichiometry and its biological functions are likely conserved across mouse
and human. The magnitude of this correlation increases when the correlation is computed
based only on the orthologs whose sequences are over 80% identical between mouse and human
(Fig. 4E), providing further evidence for the conserved fitness consequences of the altered RP
stoichiometry.
Discussion
For decades, the ribosome has been considered the preeminent example of a large RNA–protein
complex with a fixed stoichiometry among the constituent core RPs (Warner, 1999; Ben-Shem
et al, 2010, 2011). However, the direct and precise measurements of RP–levels required to
support this view have been very challenging. Prior to our work, the most direct and precise
quantification of RP stoichiometry that we know of is based on measuring the radioactivity from
RPs labeled with 14C or 3H and separated on 2D–gels. Some of these studies (Weber, 1972;
Westermann et al, 1976) achieved very high precision (standard error < 10 %) and reported
over 2–fold deviation from 1 : 1 stoichiometry for multiple RPs. Other studies of prokaryotic
ribosomes (Hardy, 1975) achieved lower precision, and the deviation from 1 : 1 stoichiome-
try was within the experimental error of the measurements. The results reported in ref. (Weber,
1972; Westermann et al, 1976; Hardy, 1975) are all consistent with our findings, albeit our mea-
surements are limited to eukaryotic ribosomes. This prior work and our measurements reflect
population–averages across a heterogeneous pool of ribosomes and thus likely underestimate
the magnitude of the variability among RP stoichiometries.
A simple mechanism that may account for our observations is that the rates of translation
initiation and elongation depend on the RP composition. Ribosomes whose RP composition
8
corresponds to higher ratios between the initiation and the elongation rates are likely to be found
in fractions with multiple ribosomes per mRNA. Conversely, ribosomes whose RP composition
corresponds to lower ratios between the initiation and the elongation rates are likely to be found
in fractions with fewer ribosomes per mRNA. Indeed, increased growth–rate on glucose carbon-
source that we find associated with altered RP stoichiometry has been previously reported to be
associated with faster elongation rates (Bonven and Gulløv, 1979; Young and Bremer, 1976).
Our data show that the stoichiometry among RPs varies across ribosomes from different
sucrose fractions. However, velocity sedimentation in sucrose gradients is unlikely to perfectly
separate ribosomes based on their RP composition. For example, short mRNAs and the ri-
bosomes translating them can be found only in the fractions containing few ribosomes per
mRNA regardless of the efficiency of translation and the RP-composition of the ribosomes (Ar-
ava et al, 2003). Similarly, even the most highly translated mRNA that is likely to be translated
by polysome-type ribosomes will go through a stage when only a single ribosome is loaded and
thus will be found in the monosomal fraction. Other factors may also contribute to the mixing
of different ribosomes in each sucrose fraction, including variation in the mRNA length, any
degree of ribosome run-off, and mRNA shearing during sample handling, if any. None of these
factors, however, is likely to artifactually contribute to the differential RP stoichiometry that we
observe. Rather, the presence of ribosomes with different RP compositions in the same sucrose
fraction would average out and decrease the differences, resulting in underestimation of the RP
variability.
The conserved difference between monosomal and polysomal ribosomes (Fig. 3G) raises
the question about the activity of monosomes, especially given the lower estimates for their
transnational activity (Warner et al, 1963; Wettstein et al, 1963). The RP levels in Fig. 3E
indicate that the RP composition of trisomes in ethanol is more similar to the composition of
monosomes than to tetrasomes. This observation shows that monosomes may have similar RP
composition to polysomes, suggesting that the RP composition of monosomes is not necessarily
indicative of a non–functional state.
The correlations between RP–composition and fitness can be explained by the expectation
9
that the higher the translational activity of a ribosome, the higher the fitness cost of its pertur-
bation in rapidly growing stem cells. The key factor required for this expectation is the variable
ribosomal composition that we measured. The variable RP stoichiometry in the absence of
external perturbations suggests that cells use variable RP composition of their ribosomes as
a regulatory mechanism of protein translation. One such example might be the preferential
transcriptional induction of polysome-enriched RPs at higher growth rates (Fig. 4C).
Variable mammalian RPs, such as Rps4x, Rps14, Rps20, Rpl5, Rpl10, and Rpl27, directly
bind mRNAs (Castello et al, 2012; Kwon et al, 2013), and this binding might mediate transla-
tional regulation as previously suggested (Mauro and Edelman, 2002; Mazumder et al, 2003;
Xue et al, 2015). Furthermore, deletions or overexpressions of many of the variable RPs
(Fig. 1B) have well characterized phenotypes both in development and in cancer. For exam-
ple, the knockdown or haploinsufficiency of the polysomally enriched Rps19 (Fig. 1B) causes
Diamond Blackfan anemia by selectively affecting the synthesis of some proteins but not of
others (Horos et al, 2012). Interestingly, our data indicate that RPs that are frequently mutated
in cancers, such as Rpl5 and Rpl10 (De Keersmaecker et al, 2013; Lawrence et al, 2014), are
enriched in the monosomes (Fig. 1A and Fig. 2). Conversely, RPs whose (over)–expression
promotes cancer, such as Rpl30, Rps20, and Rpl39 (De Bortoli et al, 2006; Dave et al, 2014),
are enriched in the polysomes (Fig. 1B and Fig. 2). One interpretation, among others, of these
data is that loss of function of monosomally–enriched RPs or overexpression of polysomally–
enriched RPs might promote protein synthesis and cancer cell growth.
Materials and Methods
All yeast experiments used a prototrophic diploid strain (DBY12007) with a S288c background
and wild type HAP1 alleles (Hickman and Winston, 2007). We grew our cultures in a biore-
actor (LAMBDA Laboratory Instruments) using minimal media with the composition of yeast
nitrogen base (YNB) and supplemented with 2g/L D-glucose. Before inoculation, the reactor
was filled with 2L of minimal media and warmed up to a working temperature of 30oC.
10
Mouse embryonic stem cells (E14 10th passage) were grown as adherent cultures in 10 cm
plates with 10 ml DMEM/F12 media supplemented with 10 % knockout serum replacement,
nonessential amino acids (NEAA supplement), 0.1 mM β–mercapto–ethanol, 1 % penicillin
and streptomycin, leukemia inhibitory factor (LIF; 1,000 U LIF/ml), and 2i (GSK3β and Mek
1/2 inhibitors).
Both yeast and mouse embryonic stem cells were lysed by vortexing for 10 min with glass
beads in cold PLB (20 mM HEPES–KOH at pH 7.4, 1 % Triton X–100, 2 mM Magnesium
Acetate, 100 mM Potassium Acetate, 0.1 mg/ml cycloheximide, and 3 mM DTT). The crude
extracts obtained from this lysis procedure were clarified by centrifugation. The resulting su-
pernatants were applied to linear 11 ml sucrose gradients (10 % − 50 %) and spun at 35,000
rpm in a Beckman SW41 rotor either for 3 hours (for yeast samples) or for 2.5 hours (for mouse
samples). Twelve fractions from each sample were collected using a Gradient Station. More
details are available in the Extended View Appendix.
Data availability
The raw and processed MS data, and 3D structures of the yeast ribosomes color–coded accord-
ing to the RP levels from Fig. 3E are enclosed with this submission and can also be found at:
http://alum.mit.edu/www/nslavov/
Acknowledgments
We thank J. Cate and N. Lintner for helping us colorcode the variability of RPs on the 3D struc-
ture of the yeast ribosomes, P. Vaidyanathan for help with the sucrose gradients, R. Robert-
son for technical assistance, and M. Jovanovic, S. Kryazhimskiy, W. Gilbert, P. Vaidyanathan,
Y. Katz, G. Frenkel, D. Mooijman, J. Alvarez, D. Botstein, and A. Murray for discussions and
constructive comments. This work was funded by a grant from the National Institutes of Health
to A.v.O. (R01-GM068957) and Alfred P Sloan Research Fellowship to E.M.A.
11
Author Contributions
N.S designed research and experimental procedures. N.S., S.S., and B.B. performed experi-
ments and collected data. N.S., A.v.O., and E.A. analyzed the data. N.S., S.S., and A.v.O. dis-
cussed the results and wrote the manuscript.
Conflict of Interest
The authors declare no conflict of interest.
References
Arava Y, Wang Y, Storey JD, Liu CL, Brown PO, Herschlag D (2003) Genome-wide analy-
sis of mRNA translation profiles in Saccharomyces cerevisiae. Proceedings of the National
Academy of Sciences 100: 3889–3894
Ashe MP, Susan K, Sachs AB (2000) Glucose depletion rapidly inhibits translation initiation in
yeast. Molecular Biology of the Cell 11: 833–848
Ben-Shem A, de Loubresse NG, Melnikov S, Jenner L, Yusupova G, Yusupov M (2011) The
structure of the eukaryotic ribosome at 3.0 A resolution. Science 334: 1524–1529
Ben-Shem A, Jenner L, Yusupova G, Yusupov M (2010) Crystal structure of the eukaryotic
ribosome. Science 330: 1203–1209
Bensimon A, Heck AJ, Aebersold R (2012) Mass spectrometry-based proteomics and network
biology. Annual review of biochemistry 81: 379–405
Bonven B, Gulløv K (1979) Peptide chain elongation rate and ribosomal activity in Saccha-
romyces cerevisiae as a function of the growth rate. Molecular and General Genetics MGG
170: 225–230
12
Brauer MJ, Huttenhower C, Airoldi EM, Rosenstein R, Matese JC, Gresham D, Boer VM, Troy-
anskaya OG, Botstein D (2008) Coordination of Growth Rate, Cell Cycle, Stress Response,
and Metabolic Activity in Yeast. Mol Biol Cell 19: 352–367
Bui KH, von Appen A, DiGuilio AL, Ori A, Sparks L, Mackmull MT, Bock T, Hagen W,
Andres-Pons A, Glavy JS, et al (2013) Integrated structural analysis of the human nuclear
pore complex scaffold. Cell 155: 1233–1243
Castelli LM, Lui J, Campbell SG, Rowe W, Zeef LA, Holmes LE, Hoyle NP, Bone J, Selley
JN, Sims PF, et al (2011) Glucose depletion inhibits translation initiation via eIF4A loss and
subsequent 48S preinitiation complex accumulation, while the pentose phosphate pathway is
coordinately up-regulated. Molecular biology of the cell 22: 3379–3393
Castello A, Fischer B, Eichelbaum K, Horos R, Beckmann BM, Strein C, Davey NE,
Humphreys DT, Preiss T, Steinmetz LM, et al (2012) Insights into RNA biology from an
atlas of mammalian mRNA–binding proteins. Cell 149: 1393–1406
Dave B, Granados-Principal S, Zhu R, Benz S, Rabizadeh S, Soon-Shiong P, Yu KD, Shao Z,
Li X, Gilcrease M, et al (2014) Targeting RPL39 and MLF2 reduces tumor initiation and
metastasis in breast cancer by inhibiting nitric oxide synthase signaling. Proceedings of the
National Academy of Sciences : 201320769
De Bortoli M, Castellino RC, Lu XY, Deyo J, Sturla LM, Adesina AM, Perlaky L, Pomeroy
SL, Lau CC, Man TK, et al (2006) Medulloblastoma outcome is adversely associated with
overexpression of EEF1D, RPL30, and RPS20 on the long arm of chromosome 8. BMC
cancer 6: 223
De Keersmaecker K, Atak ZK, Li N, Vicente C, Patchett S, Girardi T, Gianfelici V, Geerdens
E, Clappier E, Porcu M, et al (2013) Exome sequencing identifies mutation in CNOT3 and
ribosomal genes RPL5 and RPL10 in T-cell acute lymphoblastic leukemia. Nature genetics
45: 186–190
13
Fabian MR, Sonenberg N (2012) The mechanics of miRNA-mediated gene silencing: a look
under the hood of miRISC. Nature structural molecular biology 19: 586–593
Galkin O, Bentley AA, Gupta S, Compton BA, Mazumder B, Kinzy TG, Merrick WC, Hat-
zoglou M, Pestova TV, Hellen CU, et al (2007) Roles of the negatively charged N-terminal
extension of Saccharomyces cerevisiae ribosomal protein S5 revealed by characterization of
a yeast strain containing human ribosomal protein S5. RNA 13: 2116–2128
Gilbert WV (2011) Functional specialization of ribosomes? Trends in biochemical sciences 36:
127–132
Gingras AC, Raught B, Sonenberg N (1999) eIF4 initiation factors: effectors of mRNA recruit-
ment to ribosomes and regulators of translation. Annual review of biochemistry 68: 913–963
Goodman HM, Rich A (1963) Mechanism of polyribosome action during protein synthesis.
Nature 199: 318–322
Hardy SJ (1975) The stoichiometry of the ribosomal proteins of Escherichia coli. Molecular
and General Genetics MGG 140: 253–274
Hendrickson DG, Hogan DJ, McCullough HL, Myers JW, Herschlag D, Ferrell JE, Brown PO
(2009) Concordant regulation of translation and mRNA abundance for hundreds of targets of
a human microRNA. PLoS biology 7: e1000238
Hickman M, Winston F (2007) Heme levels switch the function of Hap1 of Saccharomyces cere-
visiae between transcriptional activator and transcriptional repressor. Molecular and Cellular
Biology 27: 7414–7424
Horos R, IJspeert H, Pospisilova D, Sendtner R, Andrieu-Soler C, Taskesen E, Nieradka A,
Cmejla R, Sendtner M, Touw IP, et al (2012) Ribosomal deficiencies in Diamond–Blackfan
anemia impair translation of transcripts essential for differentiation of murine and human
erythroblasts. Blood 119: 262–272
14
Jovanovic M, Rooney MS, Mertins P, Przybylski D, Chevrier N, Satija R, Rodriguez EH, Fields
AP, Schwartz S, Raychowdhury R, et al (2015) Dynamic profiling of the protein life cycle in
response to pathogens. Science 347: 1259038
Komili S, Farny NG, Roth FP, Silver PA (2007) Functional specificity among ribosomal proteins
regulates gene expression. Cell 131: 557–571
Kondrashov N, Pusic A, Stumpf CR, Shimizu K, Hsieh AC, Xue S, Ishijima J, Shiroishi T,
Barna M (2011) Ribosome-mediated specificity in Hox mRNA translation and vertebrate
tissue patterning. Cell 145: 383–397
Kwon SC, Yi H, Eichelbaum K, Fohr S, Fischer B, You KT, Castello A, Krijgsveld J, Hentze
MW, Kim VN (2013) The RNA-binding protein repertoire of embryonic stem cells. Nature
structural molecular biology
Lawrence MS, Stojanov P, Mermel CH, Robinson JT, Garraway LA, Golub TR, Meyerson M,
Gabriel SB, Lander ES, Getz G (2014) Discovery and saturation analysis of cancer genes
across 21 tumour types. Nature 505: 495–501
Lee ASY, Burdeinick-Kerr R, Whelan SP (2013) A ribosome-specialized translation initiation
pathway is required for cap-dependent translation of vesicular stomatitis virus mRNAs. Pro-
ceedings of the National Academy of Sciences 110: 324–329
Mauro VP, Edelman GM (2002) The ribosome filter hypothesis. Proceedings of the National
Academy of Sciences 99: 12031–12036
Mazumder B, Sampath P, Seshadri V, Maitra RK, DiCorleto PE, Fox PL (2003) Regulated
release of L13a from the 60S ribosomal subunit as a mechanism of transcript-specific trans-
lational control. Cell 115: 187–198
Noll H, Staehelin T, Wettstein F (1963) Ribosomal aggregates engaged in protein synthesis:
ergosome breakdown and messenger ribonucleic acid transport. Nature 198: 632–638
15
O’Leary MN, Schreiber KH, Zhang Y, Duc ACE, Rao S, Hale JS, Academia EC, Shah SR, Mor-
ton JF, Holstein CA, et al (2013) The ribosomal protein Rpl22 controls ribosome composition
by directly repressing expression of its own paralog, Rpl22l1. PLoS genetics 9: e1003708
Ori A, Banterle N, Iskar M, Andres-Pons A, Escher C, Khanh Bui H, Sparks L, Solis-Mezarino
V, Rinner O, Bork P, et al (2013) Cell type-specific nuclear pores: a case in point for context-
dependent stoichiometry of molecular machines. Molecular systems biology 9
Parenteau J, Durand M, Morin G, Gagnon J, Lucier JF, Wellinger RJ, Chabot B, Abou Elela S
(2011) Introns within ribosomal protein genes regulate the production and function of yeast
ribosomes. Cell 147: 320–331
Qian W, Ma D, Xiao C, Wang Z, Zhang J (2012) The genomic landscape and evolutionary
resolution of antagonistic pleiotropy in yeast. Cell Reports 2: 1399–1410
Ramagopal S (1990) Induction of cell-specific ribosomal proteins in aggregation competent
nonmorphogenetic Dictyostelium discoideum. Biochemistry and Cell Biology 68: 1281–1287
Ramagopal S, Ennis HL (1981) Regulation of synthesis of cell-specific ribosomal proteins dur-
ing differentiation of Dictyostelium discoideum. Proceedings of the National Academy of
Sciences 78: 3083–3087
Reschke M, Clohessy JG, Seitzer N, Goldstein DP, Breitkopf SB, Schmolze DB, Ala U, Asara
JM, Beck AH, Pandolfi PP (2013) Characterization and Analysis of the Composition and
Dynamics of the Mammalian Riboproteome. Cell Reports 4: 1276–1287
Shalem O, Sanjana NE, Hartenian E, Shi X, Scott DA, Mikkelsen TS, Heckl D, Ebert BL, Root
DE, Doench JG, et al (2014) Genome-scale CRISPR-Cas9 knockout screening in human
cells. Science 343: 84–87
Slavov N, Airoldi EM, van Oudenaarden A, Botstein D (2012) A conserved cell growth cy-
cle can account for the environmental stress responses of divergent eukaryotes. Molecular
Biology of the Cell 23: 1986 – 1997
16
Slavov N, Botstein D (2011) Coupling among growth rate response, metabolic cycle, and cell
division cycle in yeast. Molecular Biology of the Cell 22: 1997–2009
Slavov N, Budnik B, Schwab D, Airoldi E, van Oudenaarden A (2014) Constant Growth Rate
Can Be Supported by Decreasing Energy Flux and Increasing Aerobic Glycolysis. Cell Re-
ports 7: 705 – 714
Slavov N, Dawson KA (2009) Correlation signature of the macroscopic states of the gene regu-
latory network in cancer. Proceedings of the National Academy of Sciences 106: 4079–4084
Sonenberg N, Hinnebusch AG (2009) Regulation of translation initiation in eukaryotes: mech-
anisms and biological targets. Cell 136: 731–745
Tiruneh BS, Kim BH, Gallie DR, Roy B, von Arnim AG (2013) The global translation profile
in a ribosomal protein mutant resembles that of an eIF3 mutant. BMC biology 11: 123
Topisirovic I, Sonenberg N (2011) Translational control by the eukaryotic ribosome. Cell 145:
333–334
Vaidyanathan PP, Zinshteyn B, Thompson MK, Gilbert WV (2014) Protein kinase A regulates
gene-specific translational adaptation in differentiating yeast. RNA : 10.1261/rna.044552.114
Wang X, Chen CF, Baker PR, Chen Pl, Kaiser P, Huang L (2007) Mass spectrometric character-
ization of the affinity-purified human 26S proteasome complex. Biochemistry 46: 3553–3565
Warner JR (1999) The economics of ribosome biosynthesis in yeast. Trends in biochemical
sciences 24: 437–440
Warner JR, Knopf PM, Rich A (1963) A multiple ribosomal structure in protein synthesis.
Proceedings of the National Academy of Sciences of the United States of America 49: 122
Warner JR, McIntosh KB (2009) How common are extraribosomal functions of ribosomal pro-
teins? Molecular cell 34: 3–11
17
Weber HJ (1972) Stoichiometric measurements of 30S and 50S ribosomal proteins from Es-
cherichia coli. Molecular and General Genetics MGG 119: 233–248
Westermann P, Heumann W, Bielka H (1976) On the stoichiometry of proteins in the small
ribosomal subunit of hepatoma ascites cells. FEBS letters 62: 132–135
Wettstein F, Staehelin T, Noll H (1963) Ribosomal aggregate engaged in protein synthesis:
characterization of the ergosome. Nature 197: 430–435
Wool IG (1996) Extraribosomal functions of ribosomal proteins. Trends in biochemical sciences
21: 164–165
Xue S, Barna M (2012) Specialized ribosomes: a new frontier in gene regulation and organismal
biology. Nature Reviews Molecular Cell Biology 13: 355–369
Xue S, Tian S, Fujii K, Kladwang W, Das R, Barna M (2015) RNA regulons in Hox 5’-UTRs
confer ribosome specificity to gene regulation. Nature 517: 33–38
Young R, Bremer H (1976) Polypeptide-chain-elongation rate in Escherichia coli B/r as a func-
tion of growth rate. Biochem J 160: 185–194
18

Figure Captions
Figure 1. The stoichiometry among core RPs in mouse ribosomes depends on the numberof ribosomes per mRNA. (A) Sucrose gradients allow separating ribosomes that are free orbound to a single mRNA (monosomes, depicted in black) from multiple ribosomes bound toa single mRNA (polysomes, depicted in blue). The absorbance at 254 nm reflects RNA lev-els, mostly ribosomal RNA. The vertical dashed lines indicate the boundaries of the collectedfractions. (B) Replica MS measurements of the monosomes (1a and 1b) indicate reproducibleestimates for RP enrichment in polysomes. (C) Some RPs are enriched in monosomes and oth-ers in polysomes (D). The relative levels of each RP are quantified as the median levels of itsunique peptides, and the probability that the RP levels do not change across the quantified frac-tions is computed from ANOVA (indicated at the top). The distributions of levels of all uniquepeptides from trypsin (left panels) and from lys-C (right panels) digestions are juxtaposed asboxplots to depict the consistency of the estimates across proteases, different peptides, and ex-periments. To correct for variation in the total amount of ribosomes present in each fraction,the mean of the intensities of all RP peptides was normalized to 1 for each fraction. On eachbox, the central line is the median, the edges of the box are the 25th and 75th percentiles, andthe whiskers extend to the most extreme data points.
Figure 2. Global pattern of differential stoichiometry among mouse RPs across sucrosegradients. The relative levels of core RPs in monosomes and polysomes were quantified by MSand found to vary depending on the number of ribosomes bound per mRNA. The measurementnoise was estimated by (i) replica quantification of the monosomal fraction (by using differenttandem-mass-tags reporter ions, 126 or 131) and by (ii) estimating RP levels separately usingeither trypsin (T) or lys-C (L) digestion, as indicated at the bottom of each column. The log2levels of each RP are shown relative to their mean. See Extended View Appendix and FigureE1 for more details and error estimates.
19
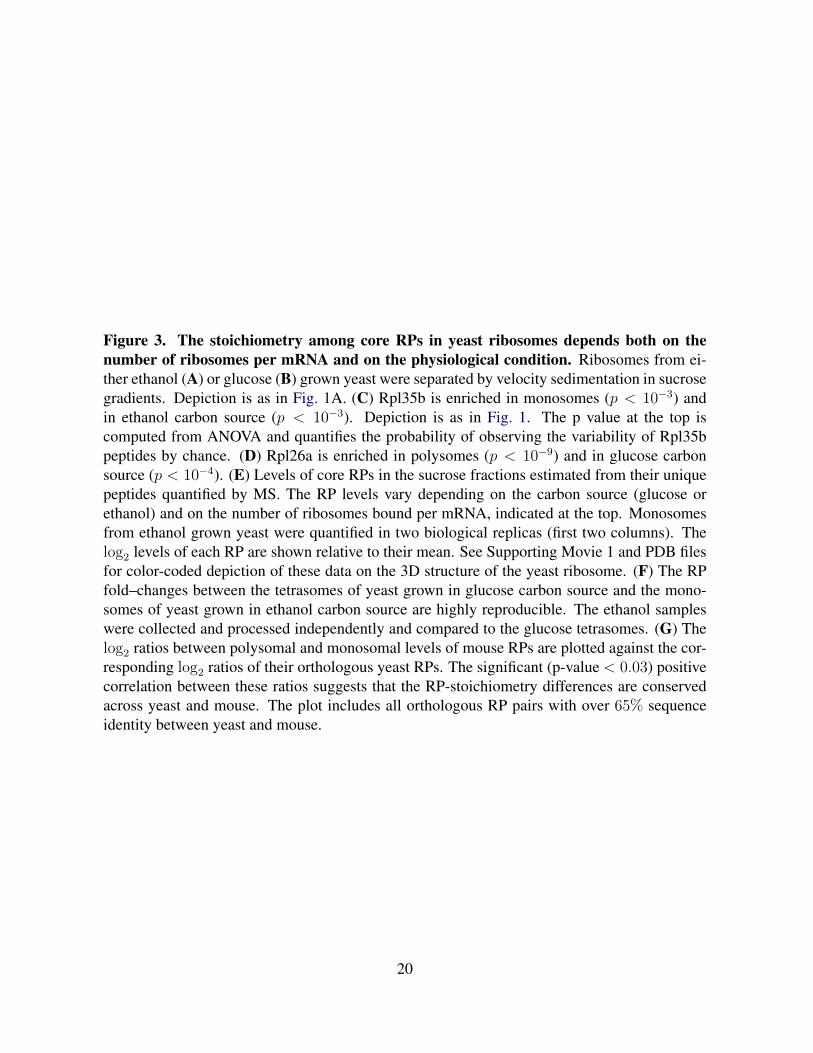
Figure 3. The stoichiometry among core RPs in yeast ribosomes depends both on thenumber of ribosomes per mRNA and on the physiological condition. Ribosomes from ei-ther ethanol (A) or glucose (B) grown yeast were separated by velocity sedimentation in sucrosegradients. Depiction is as in Fig. 1A. (C) Rpl35b is enriched in monosomes (p < 10−3) andin ethanol carbon source (p < 10−3). Depiction is as in Fig. 1. The p value at the top iscomputed from ANOVA and quantifies the probability of observing the variability of Rpl35bpeptides by chance. (D) Rpl26a is enriched in polysomes (p < 10−9) and in glucose carbonsource (p < 10−4). (E) Levels of core RPs in the sucrose fractions estimated from their uniquepeptides quantified by MS. The RP levels vary depending on the carbon source (glucose orethanol) and on the number of ribosomes bound per mRNA, indicated at the top. Monosomesfrom ethanol grown yeast were quantified in two biological replicas (first two columns). Thelog2 levels of each RP are shown relative to their mean. See Supporting Movie 1 and PDB filesfor color-coded depiction of these data on the 3D structure of the yeast ribosome. (F) The RPfold–changes between the tetrasomes of yeast grown in glucose carbon source and the mono-somes of yeast grown in ethanol carbon source are highly reproducible. The ethanol sampleswere collected and processed independently and compared to the glucose tetrasomes. (G) Thelog2 ratios between polysomal and monosomal levels of mouse RPs are plotted against the cor-responding log2 ratios of their orthologous yeast RPs. The significant (p-value < 0.03) positivecorrelation between these ratios suggests that the RP-stoichiometry differences are conservedacross yeast and mouse. The plot includes all orthologous RP pairs with over 65% sequenceidentity between yeast and mouse.
20
Figure 4. The relative levels of RPs across monosomes and polysomes correlate signifi-cantly to the fitness of yeast and mammalian cells lacking the genes encoding these RPs.(A) The fitness of RP–deleted yeast strains (Qian et al, 2012) is inversely proportional (p–value< 4 × 10⁻³) to the relative levels of the corresponding RPs in tetrasomes from yeast growingon ethanol carbon source. The RPs without paralogs are marked with red squares. (B) Ex-tension of the analysis in panel (A) to all sucrose fractions: correlations between the relativeRP levels from Fig. 3E and the fitnesses of strains lacking the corresponding RP genes (Qianet al, 2012). The correlations are shown either for all quantified RPs or only for RPs withoutparalogs. (C) Correlations between the relative levels of the RPs from Fig. 3E and the theirtranscriptional growth–rate responses (slopes). The growth-rate slopes were previously com-puted by regressing (R2 > 0.87) the levels of mRNAs in glucose-limited steady-state culturesof yeast against the growth-rates of the cultures (Brauer et al, 2008; Slavov and Botstein, 2011).(D) Distribution of sequence identity between human RPs and their closest mouse orthologs;the sequences and annotations for RPs are from Swiss–Prot. (E) Extension of the analysis foryeast in panels (A-B) to mouse: correlations between the relative levels of mouse RPs fromFig. 2 and the fitness of human ESC lacking the corresponding human ortholog (Shalem et al,2014). The correlations are shown either for all quantified RPs or only for RPs whose sequenceidentity between mouse and human exceeds 80 %. All error bars are standard deviations frombootstrapping.
21
Expanded View Figure Captions
Figure E1. Multiple unique peptides per RP provide consistent fold–change estimates formost RPs. (A) Number of unique peptides quantified per mouse RP digested by trypsin. (B)Distribution of coefficients of variation (CVs) of the measured fold–changes for mouse RPsdigested by trypsin. (C) Number of unique peptides quantified per mouse RP digested by lys-C.(D) Distribution of coefficients of variation (CVs) of the measured fold–changes for mouse RPsdigested by lys-C. (E) Number of unique peptides quantified per yeast RP digested by trypsin.(F) Distribution of coefficients of variation (CVs) of the measured fold–changes for yeast RPsdigested by trypsin. The CVs for each RP quantify the consistency of fold-changes for that RPestimated from all quantified unique peptides whose amino acid sequences are found only inthe RP and no other protein in the proteome. CVs are estimated as the standard deviation (σ)of the fold-changes of unique peptides mapping to the same RP over the corresponding mean(µ) and are thus computed only for RPs that have multiple unique peptides. (D) Distribution ofCVs of the measured fold-changes for mouse RPs.
Figure E2. RPs are over 100 fold more abundant that ribosome biogenesis proteins inthe sucrose gradients. Distributions of iBAQ scores for RPs and for ribosome biogenesisproteins. The iBAQ score of a protein estimates its absolute level based on the number ofunique peptides for that proteins and their corresponding integrated precursor areas. The levelsof ribosome biogenesis proteins likely reflect the levels of the 90S preribosomal particles in oursucrose gradients.
Figure E3. Comparison of relative RP quantification by MS and Western Blots.(A) Polysomal enrichment of RPs quantified by MS. (B) Polysomal enrichment of RPs quanti-fied by Western blots. RPs were quantified by Western blots in monosomes and polysomes fromhigh passage–number E14 mouse ESCs. Rpl32 was used as a loading control and the boxplotssummarize data from 9 ratios for each quantified RP.
22
Figure E4. Different RPs have different magnitudes of their growth-rate responses, i.e.,transcriptional induction or repression with increasing growth rate.The heatmap displays transcript levels of RPs in yeast cultures growing at steady-state inglucose-limited minimal media at the growth-rates (µ) indicated by the bars on the top. Toemphasize the growth-rate trends, the mRNA levels of each RP are displayed on a log2 scalerelative to their mean across all six growth rates. The RPs are sorted by their growth-rate slopesto emphasize the variability of their slopes, from highly positive to negative. All data are from(Slavov and Botstein, 2011; Brauer et al, 2008).
23

Figure 1
0 10 20 30 40 50 60 700
0.05
0.1
0.15
0.2
0.25
Distance along the sucrose gradient, mm
Abs
orba
nce
at 2
54 n
m
mRNA mRNA
40S 60S 80S
Monosomal }} Polysomal fractionsfractionA
−1.5 −1 −0.5 0 0.5 1 1.5 2−1.5
−1
−0.5
0
0.5
1
1.5
2
Replica 1: log2Polysomes
Monosomes, 1a
Rep
lica
2:lo
g2
Poly
som
esM
onoso
mes
,1b
ρ= 0.92
B 1a 1b 3 5−6 7−10−1
0
1Trypsin
Leve
ls a
cros
s su
cros
e gr
adie
nts,
log
2
Ribosomes per mRNA1a 1b 3 5−6 7−10
Lys−C
Rps9, p < 10−14C
1a 1b 3 5−6 7−10−1
0
1Trypsin
Leve
ls a
cros
s su
cros
e gr
adie
nts,
log
2
Ribosomes per mRNA1a 1b 3 5−6 7−10
Lys−C
Rpl5, p < 10−16
1a 1b 3 5−6 7−10−1
0
1Trypsin
Leve
ls a
cros
s su
cros
e gr
adie
nts,
log
2
Ribosomes per mRNA1a 1b 3 5−6 7−10
Lys−C
Rps3, p < 10−7
1a 1b 3 5−6 7−10−1
0
1Trypsin
Leve
ls a
cros
s su
cros
e gr
adie
nts,
log
2
Ribosomes per mRNA1a 1b 3 5−6 7−10
Lys−C
Rps4x, p < 10−39
1a 1b 3 5−6 7−10−1
0
1Trypsin
Leve
ls a
cros
s su
cros
e gr
adie
nts,
log
2
Ribosomes per mRNA1a 1b 3 5−6 7−10
Lys−C
Rpl30, p < 10−13D
1a 1b 3 5−6 7−10−1
0
1Trypsin
Leve
ls a
cros
s su
cros
e gr
adie
nts,
log
2
Ribosomes per mRNA1a 1b 3 5−6 7−10
Lys−C
Rpl27a, p < 10−10
1a 1b 3 5−6 7−10−1
0
1Trypsin
Leve
ls a
cros
s su
cros
e gr
adie
nts,
log
2
Ribosomes per mRNA1a 1b 3 5−6 7−10
Lys−C
Rps18, p < 10−8
1a 1b 3 5−6 7−10−1
0
1Trypsin
Leve
ls a
cros
s su
cros
e gr
adie
nts,
log
2
Ribosomes per mRNA1a 1b 3 5−6 7−10
Lys−C
Rps17, p < 10−8
24
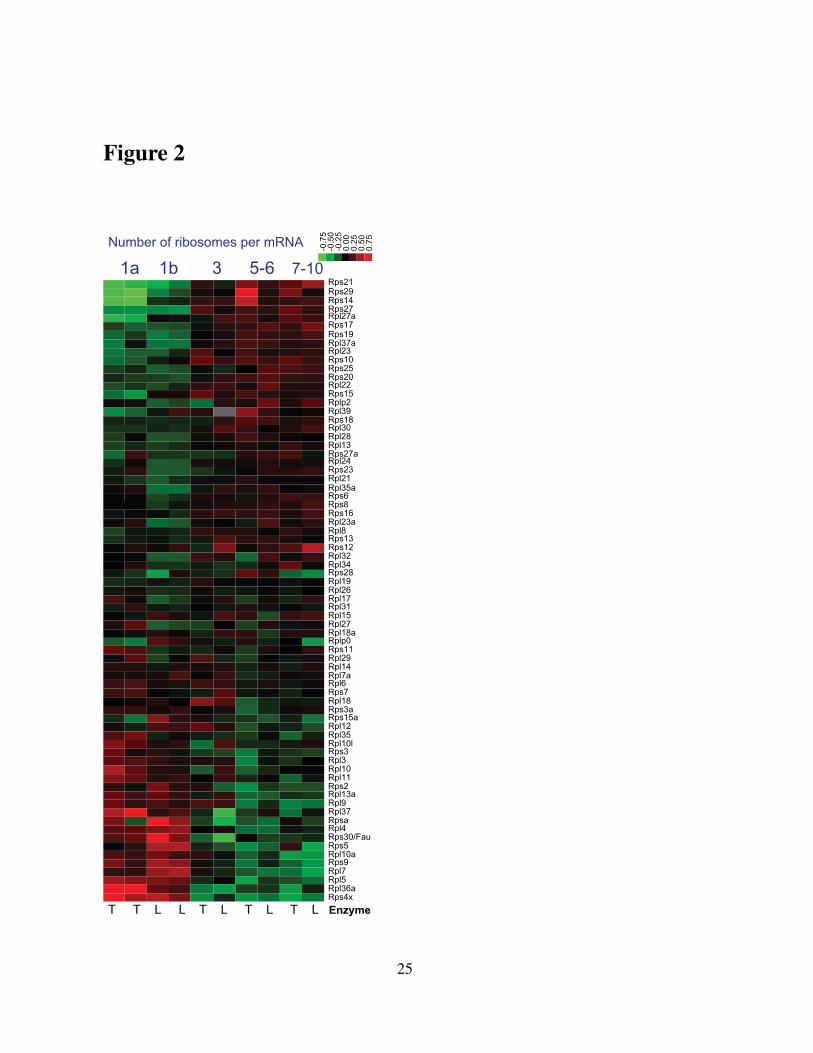
Figure 2
� � � � � � � � � � Rps21 Rps29 Rps14 Rps27 Rpl27a Rps17 Rps19 Rpl37a Rpl23 Rps10 Rps25 Rps20 Rpl22 Rps15 Rplp2 Rpl39 Rps18 Rpl30 Rpl28 Rpl13 Rps27a Rpl24 Rps23 Rpl21 Rpl35a Rps6 Rps8 Rps16 Rpl23a Rpl8 Rps13 Rps12 Rpl32 Rpl34 Rps28 Rpl19 Rpl26 Rpl17 Rpl31 Rpl15 Rpl27 Rpl18a Rplp0 Rps11 Rpl29 Rpl14 Rpl7a Rpl6 Rps7 Rpl18 Rps3a Rps15a Rpl12 Rpl35 Rpl10l Rps3 Rpl3 Rpl10 Rpl11 Rps2 Rpl13a Rpl9 Rpl37 Rpsa Rpl4 Rps30/Fau Rps5 Rpl10a Rps9 Rpl7 Rpl5 Rpl36a Rps4x
Number of ribosomes per mRNA
1a 1b 3 5-6 7-10
T T L L T L T L T L Enzyme
-0.7
5 -0
.50
-0.2
5 0
.00
0.2
5 0
.50
0.7
5
25
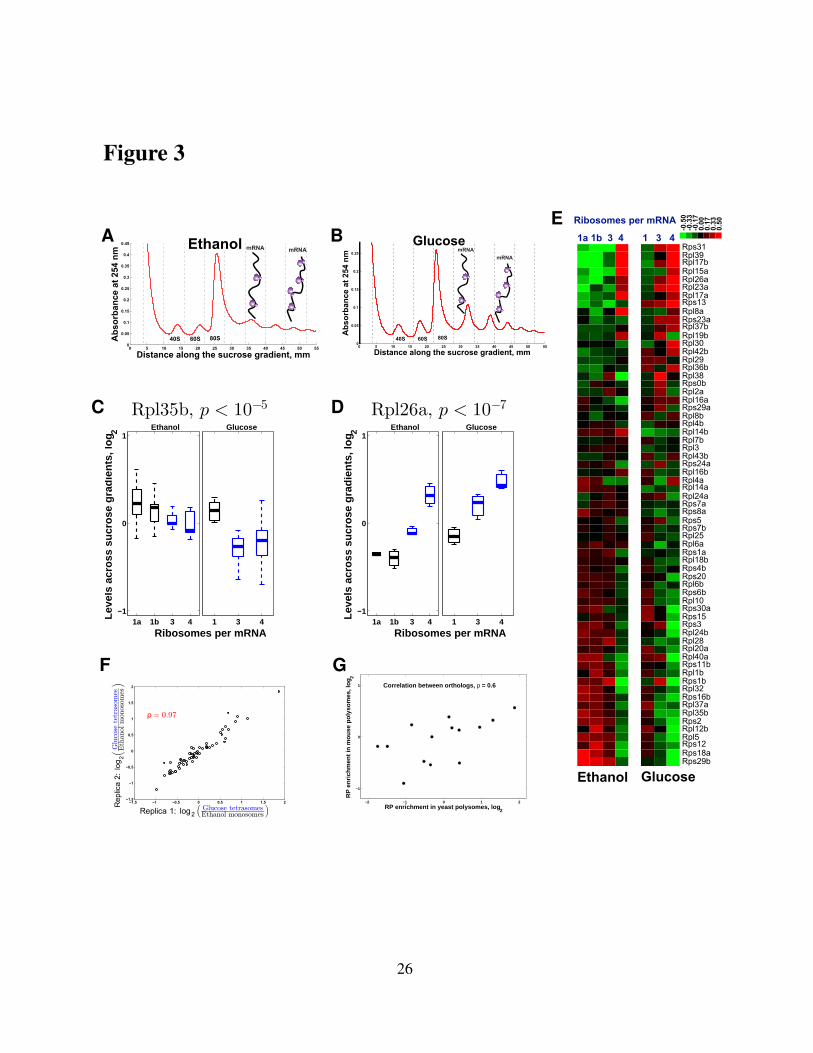
Figure 3
0 5 10 15 20 25 30 35 40 45 50 550
0.05
0.1
0.15
0.2
0.25
0.3
0.35
0.4
0.45
Distance along the sucrose gradient, mm
Abs
orba
nce
at 2
54 n
m mRNA mRNAEthanol
80S40S 60S
A
0 5 10 15 20 25 30 35 40 45 50 550
0.05
0.1
0.15
0.2
0.25
Distance along the sucrose gradient, mmA
bsor
banc
e at
254
nm
40S 60S 80S
mRNAmRNA
GlucoseB
1a 1b 3 4−1
0
1Ethanol
Leve
ls a
cros
s su
cros
e gr
adie
nts,
log
2
Ribosomes per mRNA1 3 4
Glucose
Rpl35b, p < 10−5C
1a 1b 3 4−1
0
1Ethanol
Leve
ls a
cros
s su
cros
e gr
adie
nts,
log
2
Ribosomes per mRNA1 3 4
Glucose
Rpl26a, p < 10−7D
−1.5 −1 −0.5 0 0.5 1 1.5 2−1.5
−1
−0.5
0
0.5
1
1.5
2
Replica 1: log2Glucose tetrasomesEthanol monosomes
Rep
lica
2:lo
g 2G
luco
sete
tras
omes
Eth
anol
mon
osom
es
ρ= 0.97
F
−2 −1 0 1 2
−1
0
1
RP enrichment in yeast polysomes, log2
RP
enr
ichm
ent i
n m
ouse
pol
ysom
es, l
og2
Correlation between orthologs, ρ = 0.6
G
Rps31 Rpl39 Rpl17b Rpl15a Rpl26a Rpl23a Rpl17a Rps13 Rpl8a Rps23a Rpl37b Rpl19b Rpl30 Rpl42b Rpl29 Rpl36b Rpl38 Rps0b Rpl2a Rpl16a Rps29a Rpl8b Rpl4b Rpl14b Rpl7b Rpl3 Rpl43b Rps24a Rpl16b Rpl4a Rpl14a Rpl24a Rps7a Rps8a Rps5 Rps7b Rpl25 Rpl6a Rps1a Rpl18b Rps4b Rps20 Rpl6b Rps6b Rpl10 Rps30a Rps15 Rps3 Rpl24b Rpl28 Rpl20a Rpl40a Rps11b Rpl1b Rps1b Rpl32 Rps16b Rpl37a Rpl35b Rps2 Rpl12b Rpl5 Rps12 Rps18a Rps29b
Glucose Ethanol
Ribosomes per mRNA
1a 1b 3 4 1 3 4
-0.5
0 -0
.33
-0.1
7 0
.00
0.1
7 0
.33
0.5
0 E
26
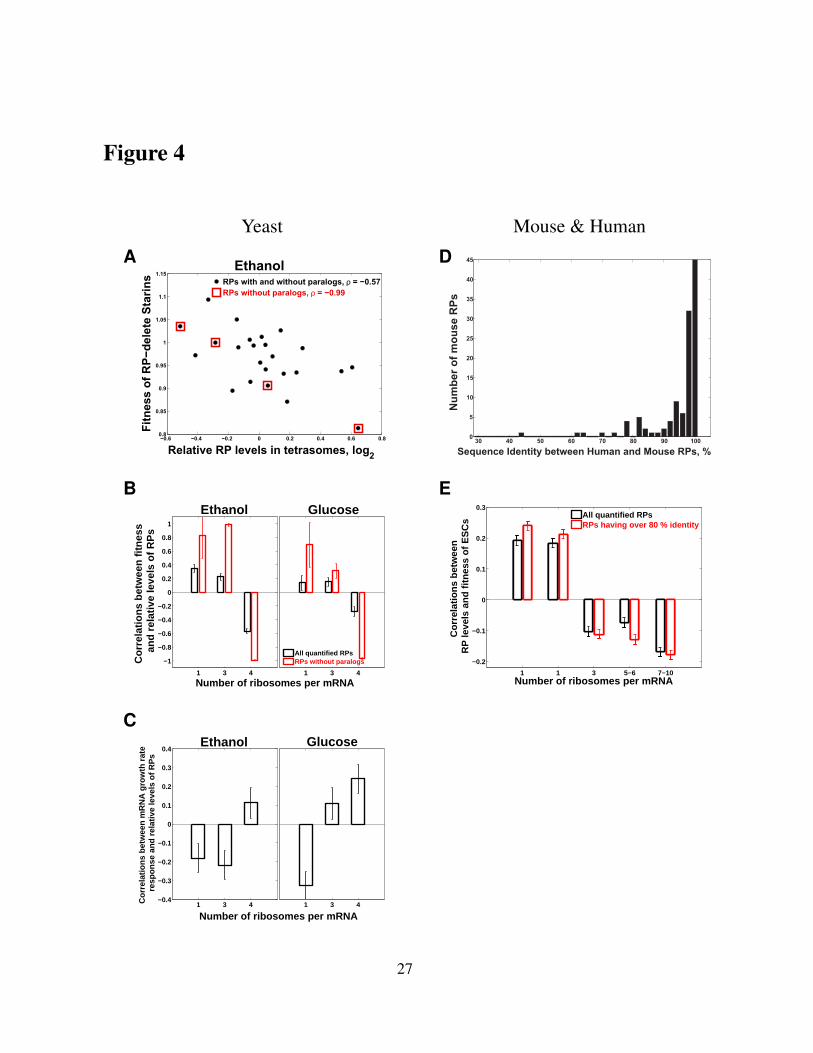
Figure 4
Yeast Mouse & Human
−0.6 −0.4 −0.2 0 0.2 0.4 0.6 0.80.8
0.85
0.9
0.95
1
1.05
1.1
1.15
Relative RP levels in tetrasomes, log2
Fitn
ess
of R
P−de
lete
Sta
rins RPs with and without paralogs, ρ = −0.57
RPs without paralogs, ρ = −0.99
EthanolA
30 40 50 60 70 80 90 1000
5
10
15
20
25
30
35
40
45
Sequence Identity between Human and Mouse RPs, %N
umbe
r of m
ouse
RPs
D
1 3 4
−1
−0.8
−0.6
−0.4
−0.2
0
0.2
0.4
0.6
0.8
1
Ethanol
Number of ribosomes per mRNA
Cor
rela
tions
bet
wee
n fit
ness
a
nd r
elat
ive
leve
ls o
f RP
s
1 3 4
Glucose
All quantified RPsRPs without paralogs
B
1 1 3 5−6 7−10
−0.2
−0.1
0
0.1
0.2
0.3
Number of ribosomes per mRNA
Cor
rela
tions
bet
wee
n R
P le
vels
and
fitn
ess
of E
SC
s
All quantified RPsRPs having over 80 % identity
E
1 3 4−0.4
−0.3
−0.2
−0.1
0
0.1
0.2
0.3
0.4Ethanol
Number of ribosomes per mRNA
Cor
rela
tions
bet
wee
n m
RN
A g
row
th r
ate
res
pons
e an
d re
lativ
e le
vels
of R
Ps
1 3 4
Glucose
C
27
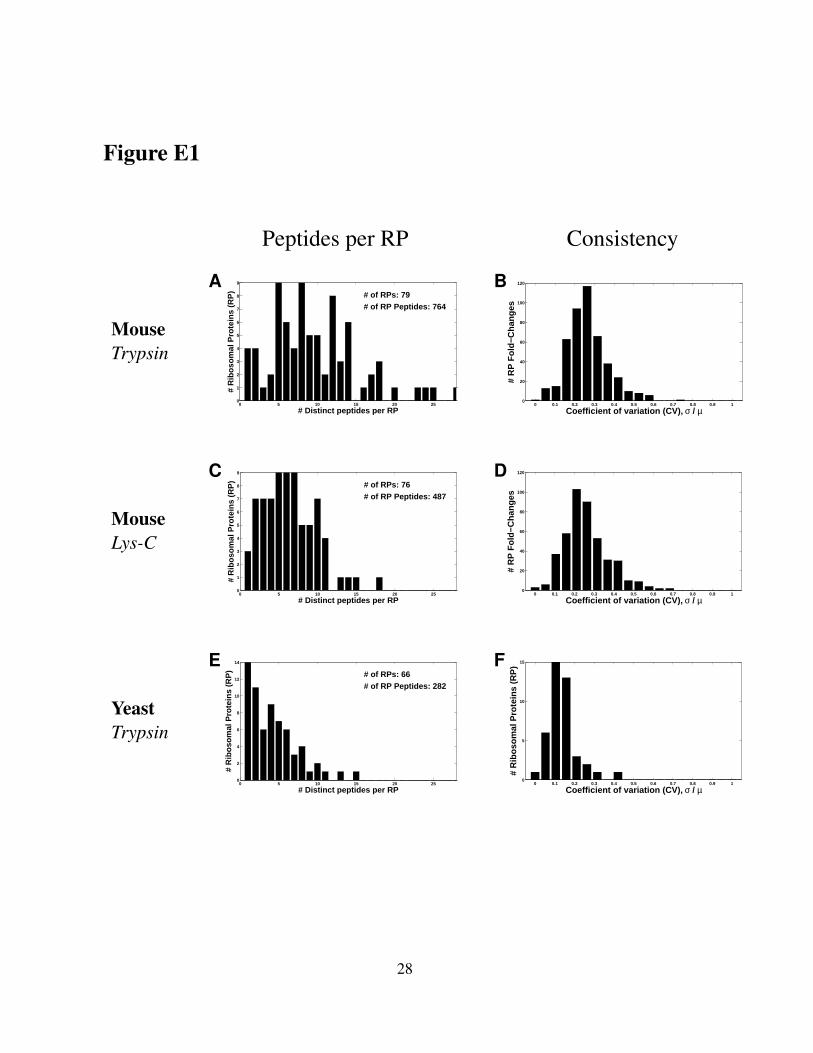
Figure E1
Peptides per RP Consistency
MouseTrypsin
0 5 10 15 20 250
1
2
3
4
5
6
7
8
9
# Distinct peptides per RP
# R
ibo
som
al P
rote
ins
(RP
) # of RPs: 79# of RP Peptides: 764
A
0 0.1 0.2 0.3 0.4 0.5 0.6 0.7 0.8 0.9 10
20
40
60
80
100
120
Coefficient of variation (CV), σ / µ
# R
P F
old−
Cha
nges
B
MouseLys-C
0 5 10 15 20 250
1
2
3
4
5
6
7
8
9
# Distinct peptides per RP
# R
ibo
som
al P
rote
ins
(RP
) # of RPs: 76# of RP Peptides: 487
C
0 0.1 0.2 0.3 0.4 0.5 0.6 0.7 0.8 0.9 10
20
40
60
80
100
120
Coefficient of variation (CV), σ / µ
# R
P F
old−
Cha
nges
D
YeastTrypsin
0 5 10 15 20 250
2
4
6
8
10
12
14
# Distinct peptides per RP
# R
ibo
som
al P
rote
ins
(RP
) # of RPs: 66# of RP Peptides: 282
E
0 0.1 0.2 0.3 0.4 0.5 0.6 0.7 0.8 0.9 10
5
10
15
Coefficient of variation (CV), σ / µ
# R
ibo
som
al P
rote
ins
(RP
)F
28
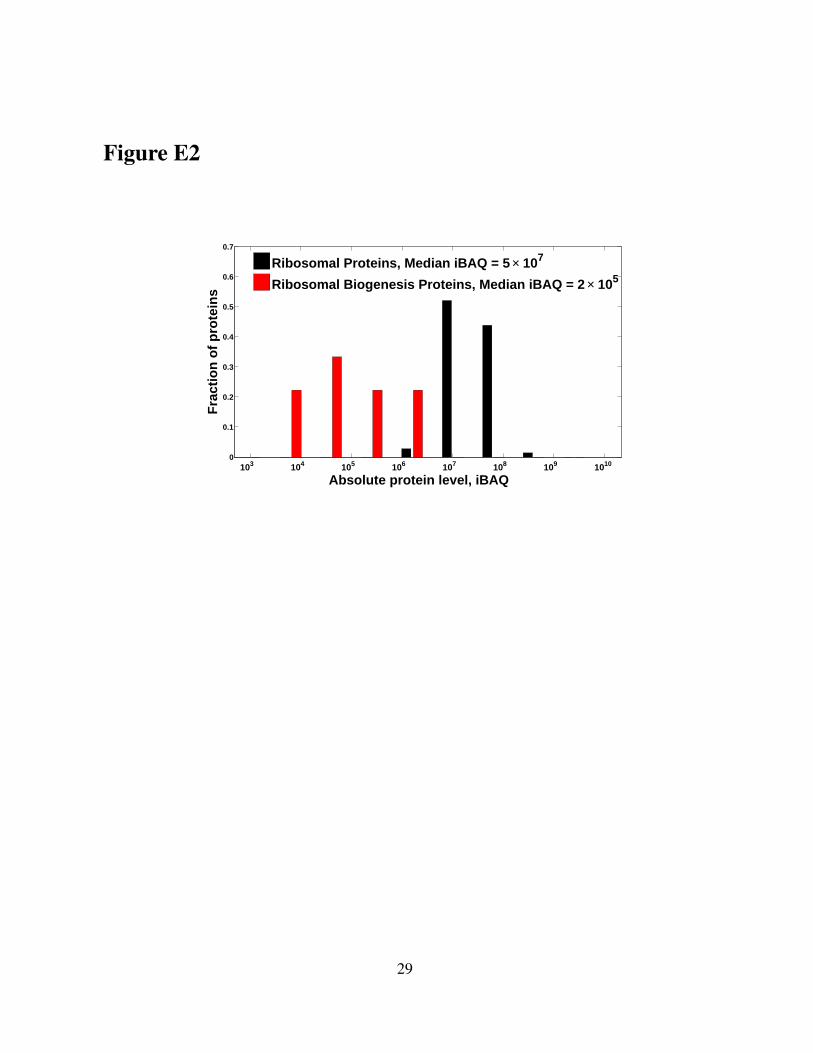
Figure E2
0
0.1
0.2
0.3
0.4
0.5
0.6
0.7
103 104 105 106 107 108 109 1010
Absolute protein level, iBAQ
Fra
ctio
n o
f p
rote
ins
Ribosomal Proteins, Median iBAQ = 5 × 10⁷
Ribosomal Biogenesis Proteins, Median iBAQ = 2 × 10⁵
29
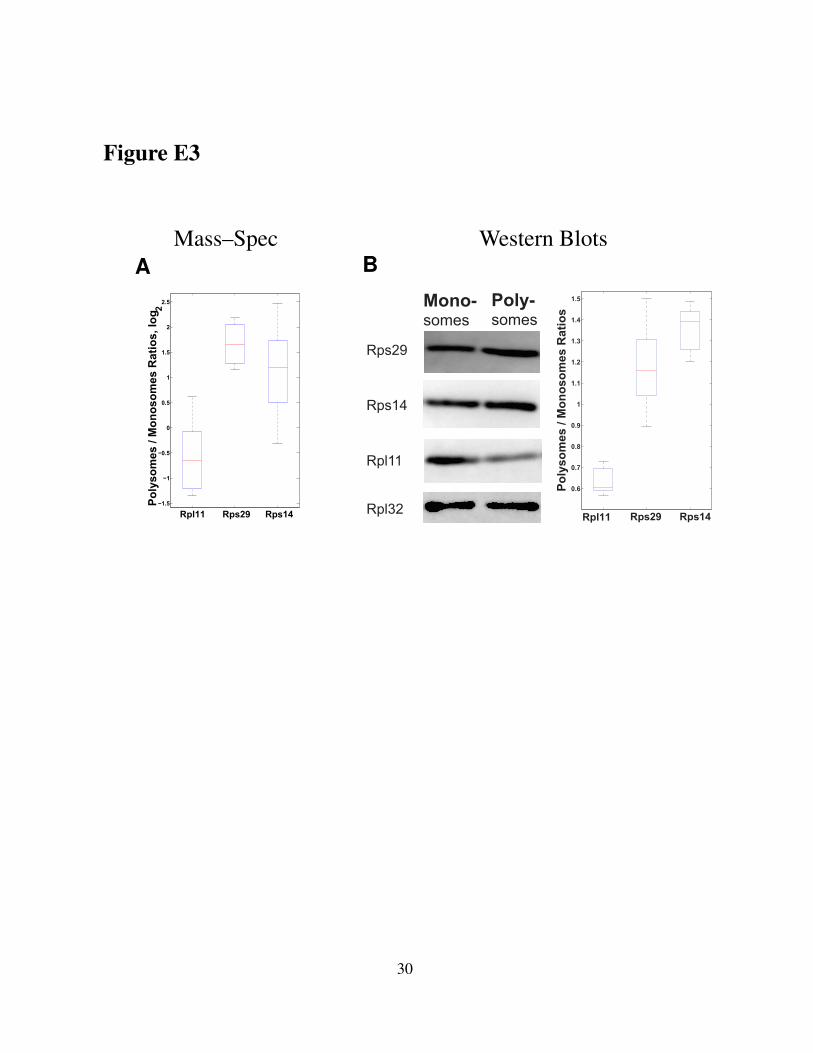
Figure E3
Mass–Spec Western Blots
Rpl11 Rps29 Rps14−1.5
−1
−0.5
0
0.5
1
1.5
2
2.5
Poly
som
es /
Mon
osom
es R
atio
s, lo
g 2
A
Rps14
Rps29
Rpl11
Mono-somes
Poly-somes
Rpl32 Rpl11 Rps29 Rps14
0.6
0.7
0.8
0.9
1
1.1
1.2
1.3
1.4
1.5
Poly
som
es /
Mon
osom
es R
atio
s
B
30
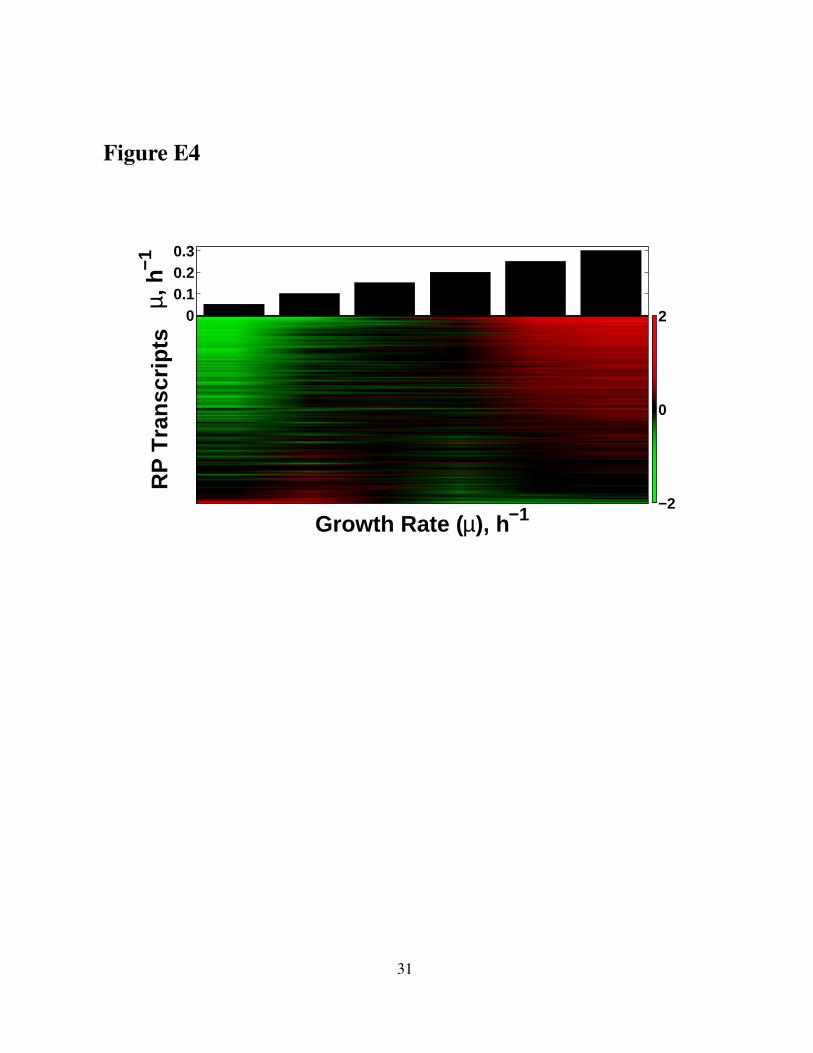
Figure E4
00.10.20.3
µ, h
−1
Growth Rate ( µ), h−1
RP
Tra
nscr
ipts
−2
0
2
31