Embed Size (px)
Citation preview

ARTICLE
Differential expression of Lp-PLA2 in obesity and type 2 diabetesand the influence of lipids
Laura Jackisch1& Warunee Kumsaiyai2 & Jonathan D. Moore3
& Nasser Al-Daghri4,5 & Ioannis Kyrou1,6&
Thomas M. Barber1,7 & Harpal Randeva1 & Sudhesh Kumar1 & Gyanendra Tripathi1,8 & Philip G. McTernan1,9
Received: 27 July 2017 /Accepted: 3 January 2018 /Published online: 9 February 2018# The Author(s) 2018. This article is an open access publication
AbstractAims/hypothesis Lipoprotein-associated phospholipase A2 (Lp-PLA2) is a circulatory macrophage-derived factor that increaseswith obesity and leads to a higher risk of cardiovascular disease (CVD). Despite this, its role in adipose tissue and the adipocyte isunknown. Therefore, the aims of this study were to clarify the expression of Lp-PLA2 in relation to different adipose tissue depotsand type 2 diabetes, and ascertain whether markers of obesity and type 2 diabetes correlate with circulating Lp-PLA2. A final aimwas to evaluate the effect of cholesterol on cellular Lp-PLA2 in an in vitro adipocyte model.Methods Analysis of anthropometric and biochemical variables from a cohort of lean (age 44.4 ± 6.2 years; BMI 22.15 ± 1.8 kg/m2, n = 23), overweight (age 45.4 ± 12.3 years; BMI 26.99 ± 1.5 kg/m2, n = 24), obese (age 49.0 ± 9.1 years; BMI 33.74 ± 3.3 kg/m2, n = 32) and type 2 diabetic women (age 53.0 ± 6.13 years; BMI 35.08 ± 8.6 kg/m2, n = 35), as part of an ethically approvedstudy. Gene and protein expression of PLA2 and its isoforms were assessed in adipose tissue samples, with serum analysisundertaken to assess circulating Lp-PLA2 and its association with cardiometabolic risk markers. A human adipocyte cell model,Chub-S7, was used to address the intracellular change in Lp-PLA2 in adipocytes.Results Lp-PLA2 and calcium-independent PLA2 (iPLA2) isoforms were altered by adiposity, as shown by microarray analysis(p < 0.05). Type 2 diabetes status was also observed to significantly alter gene and protein levels of Lp-PLA2 in abdominalsubcutaneous (AbdSc) (p < 0.01), but not omental, adipose tissue. Furthermore, multivariate stepwise regression analysis ofcirculating Lp-PLA2 and metabolic markers revealed that the greatest predictor of Lp-PLA2 in non-diabetic individuals wasLDL-cholesterol (p = 0.004). Additionally, in people with type 2 diabetes, oxidised LDL (oxLDL), triacylglycerols and HDL-cholesterol appeared important predictors, accounting for 59.7% of the variance (p < 0.001). Subsequent in vitro studies deter-mined human adipocytes to be a source of Lp-PLA2, as confirmed by mRNA expression, protein levels and immunochemistry.Further in vitro experiments revealed that treatment with LDL-cholesterol or oxLDL resulted in significant upregulation of Lp-PLA2, while inhibition of Lp-PLA2 reduced oxLDL production by 19.8% (p < 0.05).
Electronic supplementary material The online version of this article(https://doi.org/10.1007/s00125-018-4558-6) contains peer-reviewed butunedited supplementary material, which is available to authorised users.
* Gyanendra [email protected]
* Philip G. [email protected]
1 Division of Biomedical Sciences, Warwick Medical School,University of Warwick, Coventry, UK
2 Department of Medical Technology, Chiang Mai University, ChiangMai, Thailand
3 Warwick Systems Biology Centre, University of Warwick,Coventry, UK
4 Biomarkers Research Program, Biochemistry Department, KingSaud University, Riyadh, Saudi Arabia
5 Prince Mutaib Chair for Biomarkers of Osteoporosis, BiochemistryDepartment, King Saud University, Riyadh, Saudi Arabia
6 Aston Medical Research Institute, Aston Medical School,Aston University, Birmingham, UK
7 Human Metabolism Research Unit, Warwickshire Institute for theStudy of Diabetes, University Hospitals Coventry and WarwickshireNHS Trust, Coventry, UK
8 Department of Biomedical Sciences, University of Westminster,115 New Cavendish Street, London W1W 6UW, UK
9 College of Science and Technology, Department of Biosciences,Nottingham Trent University, Clifton, Nottingham NG1 8NS, UK
Diabetologia (2018) 61:1155–1166https://doi.org/10.1007/s00125-018-4558-6

Conclusions/interpretation Our study suggests adipose tissue and adipocytes are active sources of Lp-PLA2, with differentialregulation by fat depot andmetabolic state. Moreover, levels of circulating Lp-PLA2 appear to be influenced by unfavourable lipidprofiles in type 2 diabetes, which may occur in part through regulation of LDL-cholesterol and oxLDL metabolism in adipocytes.
Keywords Adiposetissue . Inflammation .Lipids .Lipoprotein-associatedphospholipaseA2 .Lowdensity lipoprotein .Obesity .
Oxidised low density lipoprotein . Type 2 diabetes
AbbreviationsAbdSc Abdominal subcutaneouscPLA2 Calcium-dependent PLA2CVD Cardiovascular diseaseiPLA2 Calcium-independent PLA2Lp-PLA2 Lipoprotein-associated PLA2MAPK Mitogen-activated protein kinaseoxLDL Oxidised LDLPLA2 Phospholipase A2qPCR Quantitative PCRSVF Stromal vascular fraction
Introduction
Lipoprotein-associated phospholipase A2 (Lp-PLA2) is amember of the phospholipase A2 superfamily of enzymes,which promote the formation of oxidised LDL (oxLDL),a producer of proinflammatory mediators such as
lysophosphatidylcholine and oxidised fatty acids (enhancedin states of metabolic disease) [1, 2]. Prior studies highlightthat circulating Lp-PLA2 directly increases arterial inflamma-tion, while cytosolic calcium-dependent PLA2 (cPLA2) andcalcium-independent PLA2 (iPLA2) appear to contribute toinflammation via immunological cells [3]. To date, much at-tention has focused on changes in circulating Lp-PLA2 anddisease (arising from epidemiological studies), and hashighlighted that Lp-PLA2 is upregulated in conditions of obe-sity, inflammation and cardiovascular disease (CVD) [4–7].
Macrophage-derived Lp-PLA2 has been shown to promotethe instability of vulnerable atherosclerotic plaques, increasingthe risk of coronary events; Lp-PLA2 inhibitors have beenshown to reduce the frequency of these occurrences [8].Despite this clear connection with CVD, few studies haveexplored the impact of circulating Lp-PLA2 in people withtype 2 diabetes, which is often considered to precede CVD.The literature suggests that individuals with type 2 diabeteshave raised circulating Lp-PLA2 levels, and that these arepositively correlated with adiposity and cardiometabolic risk
•
•
•
•
•
•
•
•
1156 Diabetologia (2018) 61:1155–1166
factors [9, 10]. While these studies indicate that increased Lp-PLA2 with adiposity arises as a result of macrophages, theimportance of human adipocytes in Lp-PLA2 metabolism re-mains unclear. This is despite the knowledge that adipocytespossess many overlapping immune cell characteristics, includ-ing the production of proinflammatory biomarkers [11, 12].
This study sought to investigate the role of Lp-PLA2 in theadipocyte and the impact of various metabolic states withinadipose tissue on Lp-PLA2 expression. Our aims were to: (1)characterise PLA2 gene expression and its related isoforms inadipose tissue; (2) determine the depot-specific expressionwithin adipose tissue and the impact of obesity and type 2diabetes; (3) define how cardiometabolic risk factors are asso-ciated with circulating Lp-PLA2 levels within different meta-bolic states; and (4) evaluate the molecular impact of LDL-cholesterol and oxLDL on Lp-PLA2 expression withinadipocytes.
Methods
Participants Ethical approval was obtained from the LocalResearch Ethics Committee and all participants gave writ-ten and informed consent. For this study, 114 womenundergoing elective abdominal surgery were recruited.The cohort consisted of lean (age 44.4 ± 6.2 years; BMI22.15 ± 1.8 kg/m2, n = 23), overweight (age 45.4 ±12.3 years; BMI 26.99 ± 1.5 kg/m2, n = 24), obese (age49.0 ± 9.1 years; BMI 33.74 ± 3.3 kg/m2, n = 32) andwomen with type 2 diabetes (age 53.0 ± 6.13 years; BMI35.08 ± 8.6 kg/m2, n = 35). Detailed medical drug histo-ries were taken and those participants with cancer, thyroiddisorders or taking steroids or medication considered toalter inflammatory status, including thiazolidinediones,were excluded.
Serum and tissue collectionVenous blood samples were takenafter an 8–10 h overnight fast. Adipose tissue was obtained byneedle biopsy and then flash frozen and/or used for in vitrostudies.
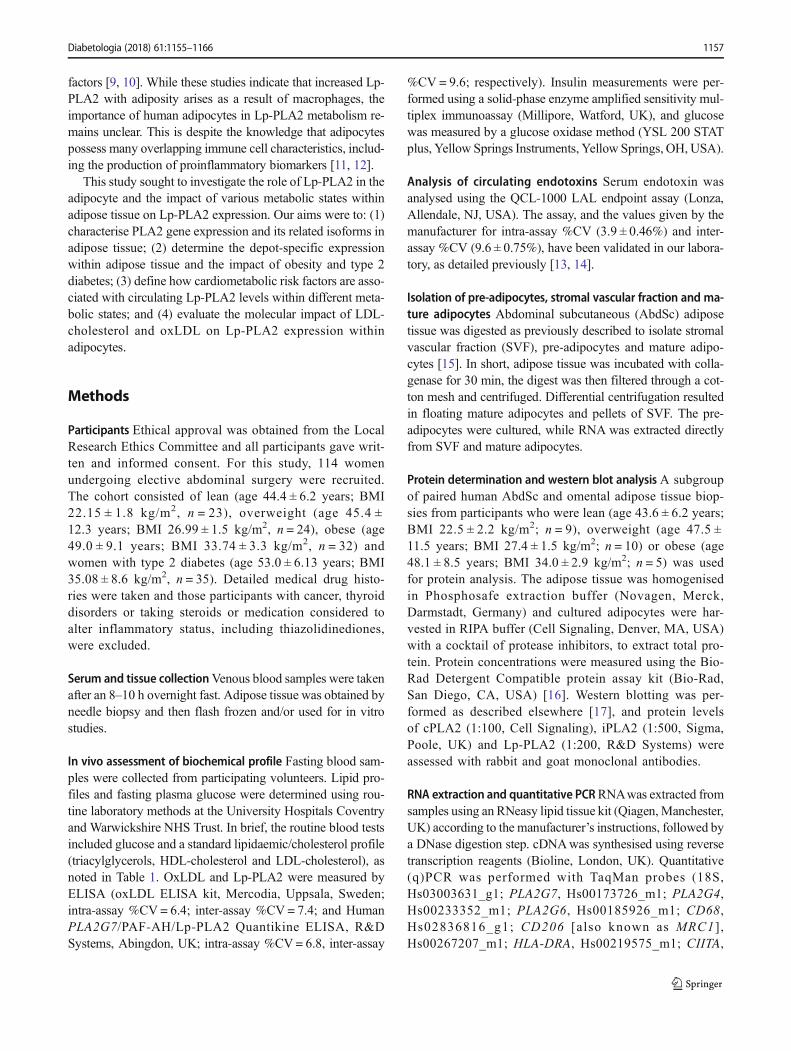
In vivo assessment of biochemical profile Fasting blood sam-ples were collected from participating volunteers. Lipid pro-files and fasting plasma glucose were determined using rou-tine laboratory methods at the University Hospitals Coventryand Warwickshire NHS Trust. In brief, the routine blood testsincluded glucose and a standard lipidaemic/cholesterol profile(triacylglycerols, HDL-cholesterol and LDL-cholesterol), asnoted in Table 1. OxLDL and Lp-PLA2 were measured byELISA (oxLDL ELISA kit, Mercodia, Uppsala, Sweden;intra-assay %CV = 6.4; inter-assay %CV = 7.4; and HumanPLA2G7/PAF-AH/Lp-PLA2 Quantikine ELISA, R&DSystems, Abingdon, UK; intra-assay %CV= 6.8, inter-assay
%CV = 9.6; respectively). Insulin measurements were per-formed using a solid-phase enzyme amplified sensitivity mul-tiplex immunoassay (Millipore, Watford, UK), and glucosewas measured by a glucose oxidase method (YSL 200 STATplus, Yellow Springs Instruments, Yellow Springs, OH, USA).
Analysis of circulating endotoxins Serum endotoxin wasanalysed using the QCL-1000 LAL endpoint assay (Lonza,Allendale, NJ, USA). The assay, and the values given by themanufacturer for intra-assay %CV (3.9 ± 0.46%) and inter-assay %CV (9.6 ± 0.75%), have been validated in our labora-tory, as detailed previously [13, 14].
Isolation of pre-adipocytes, stromal vascular fraction and ma-ture adipocytes Abdominal subcutaneous (AbdSc) adiposetissue was digested as previously described to isolate stromalvascular fraction (SVF), pre-adipocytes and mature adipo-cytes [15]. In short, adipose tissue was incubated with colla-genase for 30 min, the digest was then filtered through a cot-ton mesh and centrifuged. Differential centrifugation resultedin floating mature adipocytes and pellets of SVF. The pre-adipocytes were cultured, while RNA was extracted directlyfrom SVF and mature adipocytes.
Protein determination and western blot analysis A subgroupof paired human AbdSc and omental adipose tissue biop-sies from participants who were lean (age 43.6 ± 6.2 years;BMI 22.5 ± 2.2 kg/m2; n = 9), overweight (age 47.5 ±11.5 years; BMI 27.4 ± 1.5 kg/m2; n = 10) or obese (age48.1 ± 8.5 years; BMI 34.0 ± 2.9 kg/m2; n = 5) was usedfor protein analysis. The adipose tissue was homogenisedin Phosphosafe extraction buffer (Novagen, Merck,Darmstadt, Germany) and cultured adipocytes were har-vested in RIPA buffer (Cell Signaling, Denver, MA, USA)with a cocktail of protease inhibitors, to extract total pro-tein. Protein concentrations were measured using the Bio-Rad Detergent Compatible protein assay kit (Bio-Rad,San Diego, CA, USA) [16]. Western blotting was per-formed as described elsewhere [17], and protein levelsof cPLA2 (1:100, Cell Signaling), iPLA2 (1:500, Sigma,Poole, UK) and Lp-PLA2 (1:200, R&D Systems) wereassessed with rabbit and goat monoclonal antibodies.
RNA extraction and quantitative PCRRNAwas extracted fromsamples using an RNeasy lipid tissue kit (Qiagen,Manchester,UK) according to the manufacturer’s instructions, followed bya DNase digestion step. cDNAwas synthesised using reversetranscription reagents (Bioline, London, UK). Quantitative(q)PCR was performed with TaqMan probes (18S,Hs03003631_g1; PLA2G7, Hs00173726_m1; PLA2G4,Hs00233352_m1; PLA2G6, Hs00185926_m1; CD68,Hs02836816_g1; CD206 [also known as MRC1] ,Hs00267207_m1; HLA-DRA, Hs00219575_m1; CIITA,
Diabetologia (2018) 61:1155–1166 1157
Hs00172106_m1; EMR1 [also known as ADGRE1],Hs00173562_m1; Applied Biosystems, Warrington, UK).Transcript abundance was measured with an AppliedBiosystems 7500 Real-Time PCR System with TaqMan uni-versal PCR master mix. All reactions were multiplexed withthe housekeeping gene 18S, to normalise qPCR data.
Immunohistochemistry Adipose and placenta tissue sampleswere incubated with primary polyclonal Lp-PLA2 antibody(R&DSystems) in a dilution of 1:100. Sections were developedusing peroxidase substrate kit VIP (Vector Laboratories,Peterborough, UK) for Lp-PLA2. To demonstrate specificbinding, the primary antibody was omitted for negative controlfor Lp-PLA2 independently.
Microarray analysis RNA from the adipose tissue samples wasused for gene expression analysis with the Human GenomeU133A plus 2.0 DNA microarrays (Affymetrix, Santa Clara,CA, USA). Preparation of cRNA and hybridisation to DNAmicroarrays were performed according to standard Affymetrixprotocols, as previously described [18, 19]. PLA2 mRNAexpression was investigated using the 219064_AT probe set.
Cell cultures AbdSc pre-adipocytes were grown to confluencein DMEM/F-12 containing 10% (vol./vol.) fetal bovine se-rum, 1% (vol./vol.) penicillin/streptomycin and transferrin(62.5 pmol/l) at 37°C, 5% CO2 incubation. For cell differen-tiation, AbdSc pre-adipocytes were maintained in PromoCellpre-adipocyte differentiation media (PromoCell, Heidelberg,Germany) for 48 h. Subsequently, the cells were maintained in
the PromoCell adipocyte nutrition media (PromoCell,Heidelberg, Germany) for 14 days, with the medium changedevery 2 days. The differentiated adipocytes were then given a24 h wash out in DMEM/F12 supplemented with 0.5% (wt/vol.) BSA. Chub-S7 cells, a human AbdSc pre-adipocyte cellline, were grown under the same conditions [20].
The differentiated AbdSc Chub-S7 cells (n = 6) were treatedwith LDL-cholesterol (67 pmol/l) ± 20 μmol/l of the Lp-PLA2inhibitor (Darapladib, Cayman Chemical, Ann Arbor,Michigan, USA) or oxLDL (43 pmol/l; Kalen Biomedical,Germantown,MD,USA) for 3, 6, 24 and 48 h. PBS containing0.34 mmol/l EDTAwas used as the control. Experiments wereconducted with six technical replicates per treatment.
Statistical analysis For microarray data analysis, one-wayANOVA was performed for each selected PLA2 gene.Significance ofmRNA expression and protein levels in differentadiposity, fat depot and type 2 diabetes status datawere analysedwith paired t tests. For the cell culture, treatments were com-pared using two-way ANOVA. All quantitative variables areshown as the mean ± SEM, unless otherwise stated.
Determination of correlations in gene expression analysiswas performed using Pearson’s correlation coefficient.Spearman’s rank correlation coefficient was used to determinecorrelations for serum Lp-PLA2 and metabolic markers be-cause of the non-parametric distribution. Furthermore, multi-variate stepwise regression was applied to calculate predictorsof systemic Lp-PLA2 and Bonferroni correction was used toadjust the p value to 0.0045. Power analyses to determinesample size were carried out using G*Power version 3.1.9.2
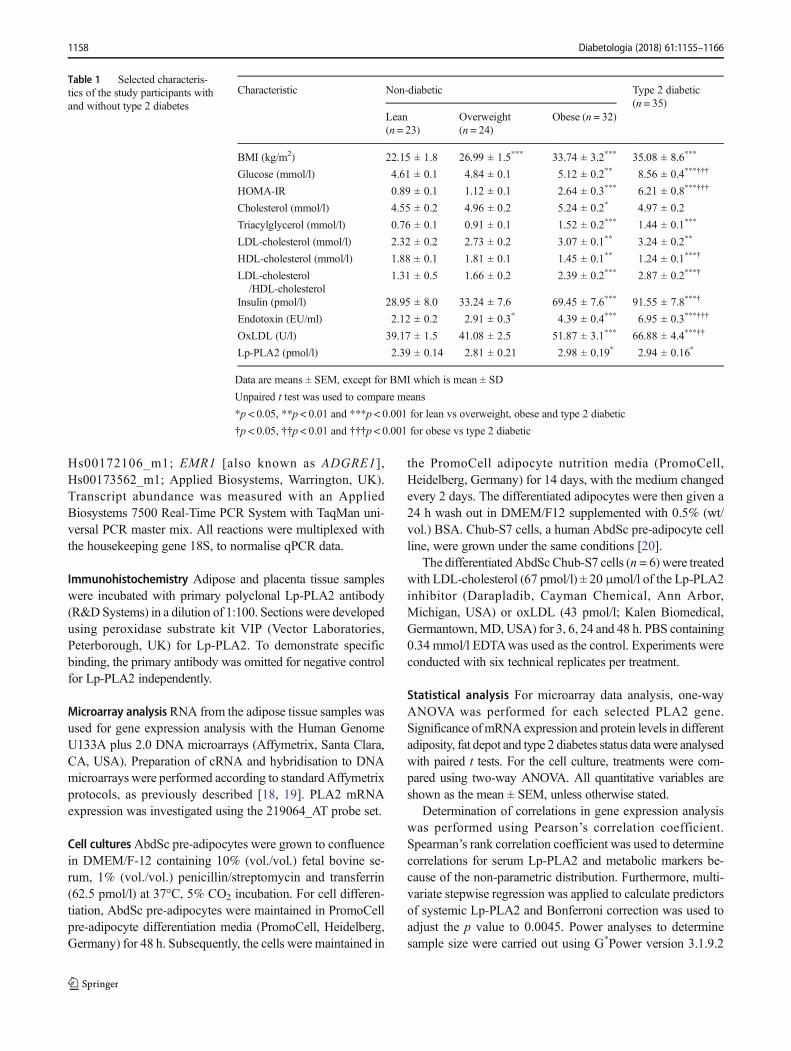
Table 1 Selected characteris-tics of the study participants withand without type 2 diabetes
Characteristic Non-diabetic Type 2 diabetic(n = 35)
Lean(n = 23)
Overweight(n = 24)
Obese (n = 32)
BMI (kg/m2) 22.15 ± 1.8 26.99 ± 1.5*** 33.74 ± 3.2*** 35.08 ± 8.6***
Glucose (mmol/l) 4.61 ± 0.1 4.84 ± 0.1 5.12 ± 0.2** 8.56 ± 0.4***†††
HOMA-IR 0.89 ± 0.1 1.12 ± 0.1 2.64 ± 0.3*** 6.21 ± 0.8***†††
Cholesterol (mmol/l) 4.55 ± 0.2 4.96 ± 0.2 5.24 ± 0.2* 4.97 ± 0.2
Triacylglycerol (mmol/l) 0.76 ± 0.1 0.91 ± 0.1 1.52 ± 0.2*** 1.44 ± 0.1***
LDL-cholesterol (mmol/l) 2.32 ± 0.2 2.73 ± 0.2 3.07 ± 0.1** 3.24 ± 0.2**
HDL-cholesterol (mmol/l) 1.88 ± 0.1 1.81 ± 0.1 1.45 ± 0.1** 1.24 ± 0.1***†
LDL-cholesterol/HDL-cholesterol
1.31 ± 0.5 1.66 ± 0.2 2.39 ± 0.2*** 2.87 ± 0.2***†
Insulin (pmol/l) 28.95 ± 8.0 33.24 ± 7.6 69.45 ± 7.6*** 91.55 ± 7.8***†
Endotoxin (EU/ml) 2.12 ± 0.2 2.91 ± 0.3* 4.39 ± 0.4*** 6.95 ± 0.3***†††
OxLDL (U/l) 39.17 ± 1.5 41.08 ± 2.5 51.87 ± 3.1*** 66.88 ± 4.4***††
Lp-PLA2 (pmol/l) 2.39 ± 0.14 2.81 ± 0.21 2.98 ± 0.19* 2.94 ± 0.16*
Data are means ± SEM, except for BMI which is mean ± SD
Unpaired t test was used to compare means
*p < 0.05, **p < 0.01 and ***p < 0.001 for lean vs overweight, obese and type 2 diabetic
†p < 0.05, ††p < 0.01 and †††p < 0.001 for obese vs type 2 diabetic
1158 Diabetologia (2018) 61:1155–1166
(G*power, Düsseldorf, Germany). Analyses and graphingwere performed using SPSS version 18.0 for Windows(SPSS, Chicago, Illinois, USA) and GraphPad Prism version7.01 (GraphPad, La Jolla, CA, USA), respectively. Levels ofstatistical significance were set at *p < 0.05, **p < 0.01 and***p < 0.001, unless otherwise stated.
Results
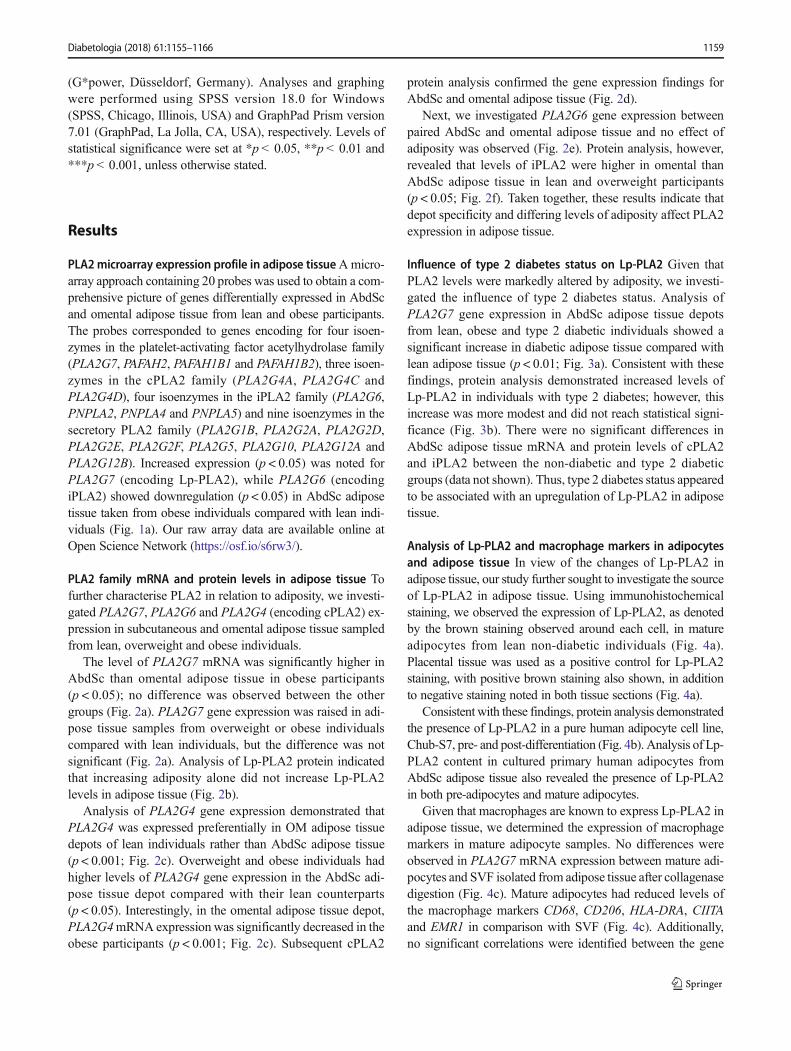
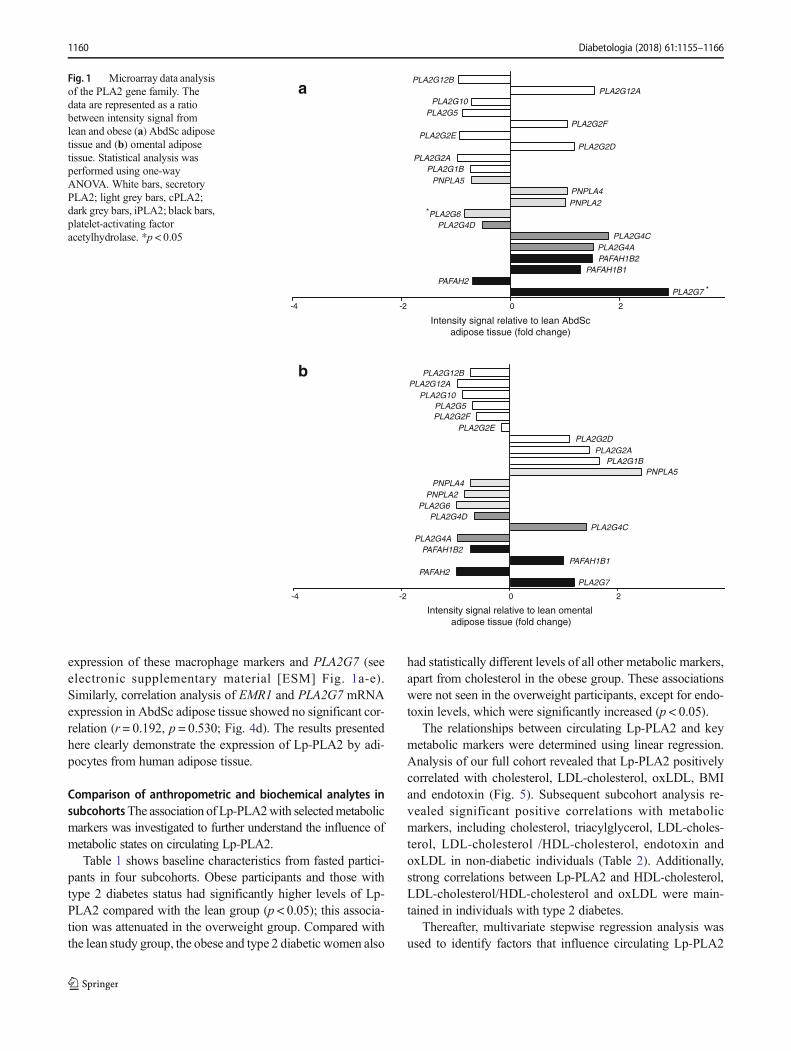
PLA2 microarray expression profile in adipose tissueAmicro-array approach containing 20 probes was used to obtain a com-prehensive picture of genes differentially expressed in AbdScand omental adipose tissue from lean and obese participants.The probes corresponded to genes encoding for four isoen-zymes in the platelet-activating factor acetylhydrolase family(PLA2G7, PAFAH2, PAFAH1B1 and PAFAH1B2), three isoen-zymes in the cPLA2 family (PLA2G4A, PLA2G4C andPLA2G4D), four isoenzymes in the iPLA2 family (PLA2G6,PNPLA2, PNPLA4 and PNPLA5) and nine isoenzymes in thesecretory PLA2 family (PLA2G1B, PLA2G2A, PLA2G2D,PLA2G2E, PLA2G2F, PLA2G5, PLA2G10, PLA2G12A andPLA2G12B). Increased expression (p < 0.05) was noted forPLA2G7 (encoding Lp-PLA2), while PLA2G6 (encodingiPLA2) showed downregulation (p < 0.05) in AbdSc adiposetissue taken from obese individuals compared with lean indi-viduals (Fig. 1a). Our raw array data are available online atOpen Science Network (https://osf.io/s6rw3/).
PLA2 family mRNA and protein levels in adipose tissue Tofurther characterise PLA2 in relation to adiposity, we investi-gated PLA2G7, PLA2G6 and PLA2G4 (encoding cPLA2) ex-pression in subcutaneous and omental adipose tissue sampledfrom lean, overweight and obese individuals.
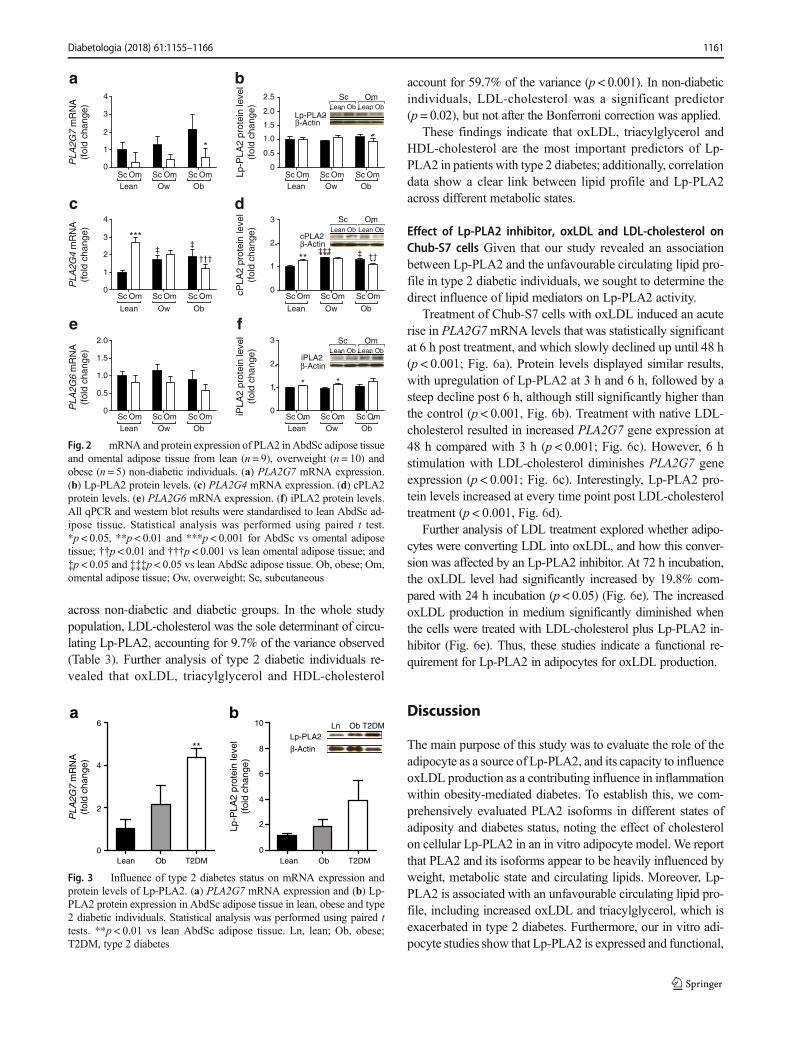
The level of PLA2G7 mRNA was significantly higher inAbdSc than omental adipose tissue in obese participants(p < 0.05); no difference was observed between the othergroups (Fig. 2a). PLA2G7 gene expression was raised in adi-pose tissue samples from overweight or obese individualscompared with lean individuals, but the difference was notsignificant (Fig. 2a). Analysis of Lp-PLA2 protein indicatedthat increasing adiposity alone did not increase Lp-PLA2levels in adipose tissue (Fig. 2b).
Analysis of PLA2G4 gene expression demonstrated thatPLA2G4 was expressed preferentially in OM adipose tissuedepots of lean individuals rather than AbdSc adipose tissue(p < 0.001; Fig. 2c). Overweight and obese individuals hadhigher levels of PLA2G4 gene expression in the AbdSc adi-pose tissue depot compared with their lean counterparts(p < 0.05). Interestingly, in the omental adipose tissue depot,PLA2G4mRNA expression was significantly decreased in theobese participants (p < 0.001; Fig. 2c). Subsequent cPLA2
protein analysis confirmed the gene expression findings forAbdSc and omental adipose tissue (Fig. 2d).
Next, we investigated PLA2G6 gene expression betweenpaired AbdSc and omental adipose tissue and no effect ofadiposity was observed (Fig. 2e). Protein analysis, however,revealed that levels of iPLA2 were higher in omental thanAbdSc adipose tissue in lean and overweight participants(p < 0.05; Fig. 2f). Taken together, these results indicate thatdepot specificity and differing levels of adiposity affect PLA2expression in adipose tissue.
Influence of type 2 diabetes status on Lp-PLA2 Given thatPLA2 levels were markedly altered by adiposity, we investi-gated the influence of type 2 diabetes status. Analysis ofPLA2G7 gene expression in AbdSc adipose tissue depotsfrom lean, obese and type 2 diabetic individuals showed asignificant increase in diabetic adipose tissue compared withlean adipose tissue (p < 0.01; Fig. 3a). Consistent with thesefindings, protein analysis demonstrated increased levels ofLp-PLA2 in individuals with type 2 diabetes; however, thisincrease was more modest and did not reach statistical signi-ficance (Fig. 3b). There were no significant differences inAbdSc adipose tissue mRNA and protein levels of cPLA2and iPLA2 between the non-diabetic and type 2 diabeticgroups (data not shown). Thus, type 2 diabetes status appearedto be associated with an upregulation of Lp-PLA2 in adiposetissue.
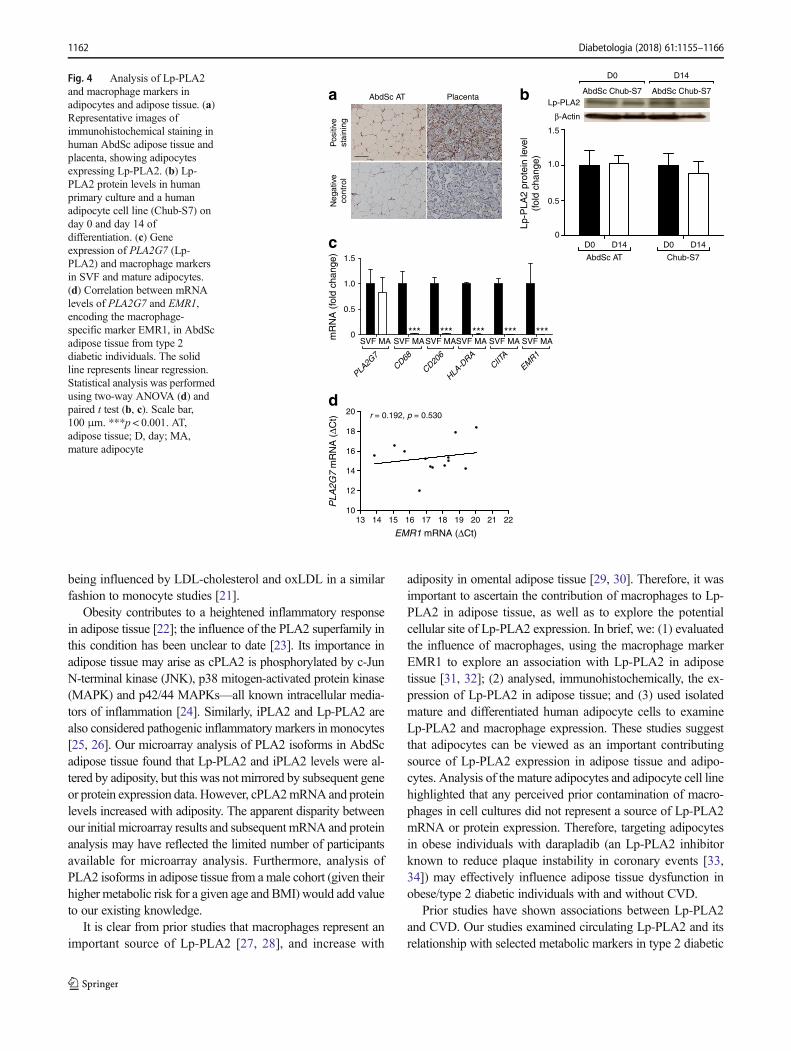
Analysis of Lp-PLA2 and macrophage markers in adipocytesand adipose tissue In view of the changes of Lp-PLA2 inadipose tissue, our study further sought to investigate the sourceof Lp-PLA2 in adipose tissue. Using immunohistochemicalstaining, we observed the expression of Lp-PLA2, as denotedby the brown staining observed around each cell, in matureadipocytes from lean non-diabetic individuals (Fig. 4a).Placental tissue was used as a positive control for Lp-PLA2staining, with positive brown staining also shown, in additionto negative staining noted in both tissue sections (Fig. 4a).
Consistent with these findings, protein analysis demonstratedthe presence of Lp-PLA2 in a pure human adipocyte cell line,Chub-S7, pre- and post-differentiation (Fig. 4b). Analysis of Lp-PLA2 content in cultured primary human adipocytes fromAbdSc adipose tissue also revealed the presence of Lp-PLA2in both pre-adipocytes and mature adipocytes.
Given that macrophages are known to express Lp-PLA2 inadipose tissue, we determined the expression of macrophagemarkers in mature adipocyte samples. No differences wereobserved in PLA2G7 mRNA expression between mature adi-pocytes and SVF isolated from adipose tissue after collagenasedigestion (Fig. 4c). Mature adipocytes had reduced levels ofthe macrophage markers CD68, CD206, HLA-DRA, CIITAand EMR1 in comparison with SVF (Fig. 4c). Additionally,no significant correlations were identified between the gene
Diabetologia (2018) 61:1155–1166 1159
expression of these macrophage markers and PLA2G7 (seeelectronic supplementary material [ESM] Fig. 1a-e).Similarly, correlation analysis of EMR1 and PLA2G7 mRNAexpression in AbdSc adipose tissue showed no significant cor-relation (r = 0.192, p = 0.530; Fig. 4d). The results presentedhere clearly demonstrate the expression of Lp-PLA2 by adi-pocytes from human adipose tissue.
Comparison of anthropometric and biochemical analytes insubcohortsThe association of Lp-PLA2with selectedmetabolicmarkers was investigated to further understand the influence ofmetabolic states on circulating Lp-PLA2.
Table 1 shows baseline characteristics from fasted partici-pants in four subcohorts. Obese participants and those withtype 2 diabetes status had significantly higher levels of Lp-PLA2 compared with the lean group (p < 0.05); this associa-tion was attenuated in the overweight group. Compared withthe lean study group, the obese and type 2 diabetic women also
had statistically different levels of all other metabolic markers,apart from cholesterol in the obese group. These associationswere not seen in the overweight participants, except for endo-toxin levels, which were significantly increased (p < 0.05).
The relationships between circulating Lp-PLA2 and keymetabolic markers were determined using linear regression.Analysis of our full cohort revealed that Lp-PLA2 positivelycorrelated with cholesterol, LDL-cholesterol, oxLDL, BMIand endotoxin (Fig. 5). Subsequent subcohort analysis re-vealed significant positive correlations with metabolicmarkers, including cholesterol, triacylglycerol, LDL-choles-terol, LDL-cholesterol /HDL-cholesterol, endotoxin andoxLDL in non-diabetic individuals (Table 2). Additionally,strong correlations between Lp-PLA2 and HDL-cholesterol,LDL-cholesterol/HDL-cholesterol and oxLDL were main-tained in individuals with type 2 diabetes.
Thereafter, multivariate stepwise regression analysis wasused to identify factors that influence circulating Lp-PLA2
PLA2G12BPLA2G12A
PLA2G2F
PLA2G2D
PNPLA4PNPLA2
PLA2G4CPLA2G4APAFAH1B2
PAFAH1B1
PLA2G10PLA2G5
PLA2G2E
PLA2G2APLA2G1B
PNPLA5
*PLA2G6PLA2G4D
PAFAH2PLA2G7 *
-4 -2 0
Intensity signal relative to lean AbdScadipose tissue (fold change)
Intensity signal relative to lean omental adipose tissue (fold change)
2
PLA2G12BPLA2G12A
PLA2G10PLA2G5PLA2G2F
PLA2G2E
PNPLA4PNPLA2
PLA2G6PLA2G4D
PLA2G4APAFAH1B2
PAFAH2
PLA2G2DPLA2G2A
PLA2G1BPNPLA5
PLA2G4C
PAFAH1B1
PLA2G7
-4 -2 0 2
b
aFig. 1 Microarray data analysisof the PLA2 gene family. Thedata are represented as a ratiobetween intensity signal fromlean and obese (a) AbdSc adiposetissue and (b) omental adiposetissue. Statistical analysis wasperformed using one-wayANOVA. White bars, secretoryPLA2; light grey bars, cPLA2;dark grey bars, iPLA2; black bars,platelet-activating factoracetylhydrolase. *p < 0.05
1160 Diabetologia (2018) 61:1155–1166
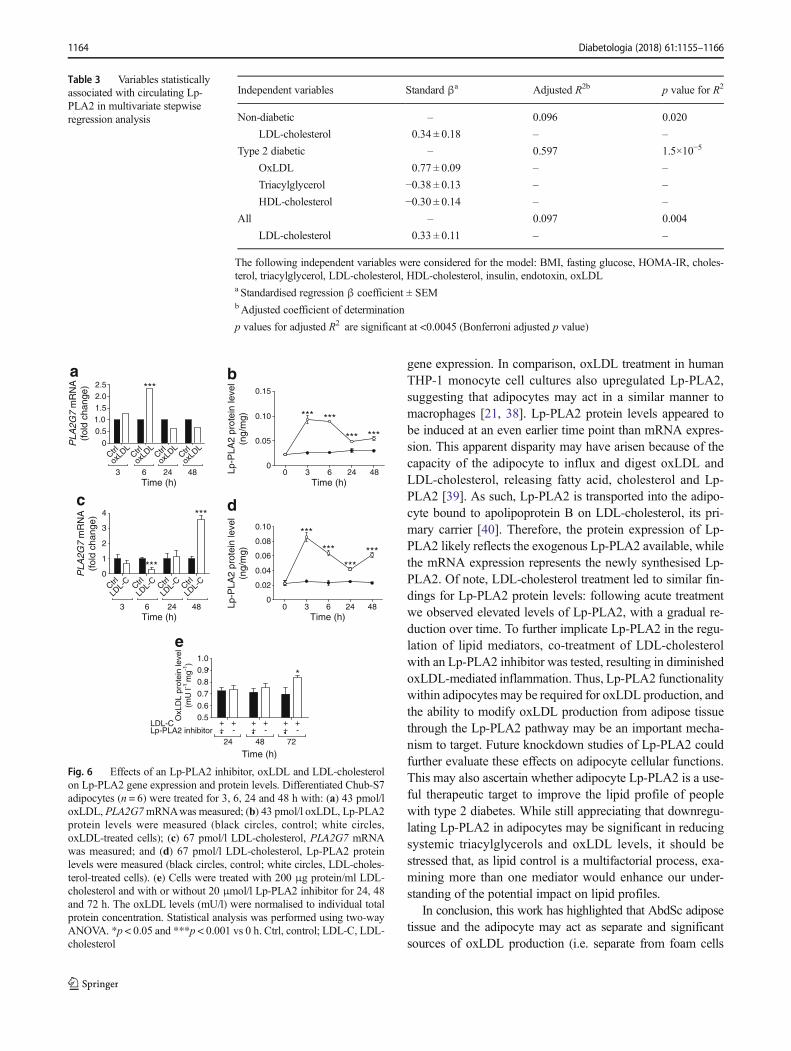
across non-diabetic and diabetic groups. In the whole studypopulation, LDL-cholesterol was the sole determinant of circu-lating Lp-PLA2, accounting for 9.7% of the variance observed(Table 3). Further analysis of type 2 diabetic individuals re-vealed that oxLDL, triacylglycerol and HDL-cholesterol
account for 59.7% of the variance (p < 0.001). In non-diabeticindividuals, LDL-cholesterol was a significant predictor(p = 0.02), but not after the Bonferroni correction was applied.
These findings indicate that oxLDL, triacylglycerol andHDL-cholesterol are the most important predictors of Lp-PLA2 in patients with type 2 diabetes; additionally, correlationdata show a clear link between lipid profile and Lp-PLA2across different metabolic states.
Effect of Lp-PLA2 inhibitor, oxLDL and LDL-cholesterol onChub-S7 cells Given that our study revealed an associationbetween Lp-PLA2 and the unfavourable circulating lipid pro-file in type 2 diabetic individuals, we sought to determine thedirect influence of lipid mediators on Lp-PLA2 activity.
Treatment of Chub-S7 cells with oxLDL induced an acuterise in PLA2G7mRNA levels that was statistically significantat 6 h post treatment, and which slowly declined up until 48 h(p < 0.001; Fig. 6a). Protein levels displayed similar results,with upregulation of Lp-PLA2 at 3 h and 6 h, followed by asteep decline post 6 h, although still significantly higher thanthe control (p < 0.001, Fig. 6b). Treatment with native LDL-cholesterol resulted in increased PLA2G7 gene expression at48 h compared with 3 h (p < 0.001; Fig. 6c). However, 6 hstimulation with LDL-cholesterol diminishes PLA2G7 geneexpression (p < 0.001; Fig. 6c). Interestingly, Lp-PLA2 pro-tein levels increased at every time point post LDL-cholesteroltreatment (p < 0.001, Fig. 6d).
Further analysis of LDL treatment explored whether adipo-cytes were converting LDL into oxLDL, and how this conver-sion was affected by an Lp-PLA2 inhibitor. At 72 h incubation,the oxLDL level had significantly increased by 19.8% com-pared with 24 h incubation (p < 0.05) (Fig. 6e). The increasedoxLDL production in medium significantly diminished whenthe cells were treated with LDL-cholesterol plus Lp-PLA2 in-hibitor (Fig. 6e). Thus, these studies indicate a functional re-quirement for Lp-PLA2 in adipocytes for oxLDL production.
Discussion
The main purpose of this study was to evaluate the role of theadipocyte as a source of Lp-PLA2, and its capacity to influenceoxLDL production as a contributing influence in inflammationwithin obesity-mediated diabetes. To establish this, we com-prehensively evaluated PLA2 isoforms in different states ofadiposity and diabetes status, noting the effect of cholesterolon cellular Lp-PLA2 in an in vitro adipocyte model. We reportthat PLA2 and its isoforms appear to be heavily influenced byweight, metabolic state and circulating lipids. Moreover, Lp-PLA2 is associated with an unfavourable circulating lipid pro-file, including increased oxLDL and triacylglycerol, which isexacerbated in type 2 diabetes. Furthermore, our in vitro adi-pocyte studies show that Lp-PLA2 is expressed and functional,
a b
c d
e f
4
3
2
1
0PLA
2G7
mR
NA
(fol
d ch
ange
)P
LA2G
4 m
RN
A(f
old
chan
ge)
PLA
2G6
mR
NA
(fol
d ch
ange
)
Lp-P
LA2
prot
ein
leve
l(f
old
chan
ge)
cPLA
2 pr
otei
n le
vel
(fol
d ch
ange
)iP
LA2
prot
ein
leve
l(f
old
chan
ge)
Sc OmLean Ow Ob
Lean Ow Ob
Lean Ow Ob Lean Ow Ob
Lean
Lean
Ow Ob
Lean
Lean
Lean Ob Lean Ob
Ow ObSc OmSc Om
Sc Om Sc OmSc Om
Sc Om Sc OmSc Om Sc Om Sc OmSc Om
Sc Om Sc Om
Om
Sc
ScOb Lean Ob
Om
Sc Om
Sc Om
Sc OmSc Om
ScOb Lean Ob
Om
2.0
1.5
1.0
0.5
0
2.5
**
Lp-PLA2
cPLA2
iPLA2
β-Actin
β-Actin
β-Actin
4
3
2
1
0
***
**‡ ‡‡‡
‡
††† ††‡
3
2
1
0
2.0
1.5
3
2
1
0
1.0
0.5
0
* *
Fig. 2 mRNA and protein expression of PLA2 inAbdSc adipose tissueand omental adipose tissue from lean (n = 9), overweight (n = 10) andobese (n = 5) non-diabetic individuals. (a) PLA2G7 mRNA expression.(b) Lp-PLA2 protein levels. (c) PLA2G4 mRNA expression. (d) cPLA2protein levels. (e) PLA2G6 mRNA expression. (f) iPLA2 protein levels.All qPCR and western blot results were standardised to lean AbdSc ad-ipose tissue. Statistical analysis was performed using paired t test.*p < 0.05, **p < 0.01 and ***p < 0.001 for AbdSc vs omental adiposetissue; ††p < 0.01 and †††p < 0.001 vs lean omental adipose tissue; and‡p < 0.05 and ‡‡‡p < 0.05 vs lean AbdSc adipose tissue. Ob, obese; Om,omental adipose tissue; Ow, overweight; Sc, subcutaneous
6 10
8
6
4
2
0
4
2
0Lean Ob T2DM Lean Ob T2DM
**Lp-PLA2
β-Actin
Ln
PLA
2G7
mR
NA
(fol
d ch
ange
)
Lp-P
LA2
prot
ein
leve
l(f
old
chan
ge)
Ob T2DMa b
Fig. 3 Influence of type 2 diabetes status on mRNA expression andprotein levels of Lp-PLA2. (a) PLA2G7 mRNA expression and (b) Lp-PLA2 protein expression in AbdSc adipose tissue in lean, obese and type2 diabetic individuals. Statistical analysis was performed using paired ttests. **p < 0.01 vs lean AbdSc adipose tissue. Ln, lean; Ob, obese;T2DM, type 2 diabetes
Diabetologia (2018) 61:1155–1166 1161
being influenced by LDL-cholesterol and oxLDL in a similarfashion to monocyte studies [21].
Obesity contributes to a heightened inflammatory responsein adipose tissue [22]; the influence of the PLA2 superfamily inthis condition has been unclear to date [23]. Its importance inadipose tissue may arise as cPLA2 is phosphorylated by c-JunN-terminal kinase (JNK), p38 mitogen-activated protein kinase(MAPK) and p42/44 MAPKs—all known intracellular media-tors of inflammation [24]. Similarly, iPLA2 and Lp-PLA2 arealso considered pathogenic inflammatory markers in monocytes[25, 26]. Our microarray analysis of PLA2 isoforms in AbdScadipose tissue found that Lp-PLA2 and iPLA2 levels were al-tered by adiposity, but this was not mirrored by subsequent geneor protein expression data. However, cPLA2mRNAand proteinlevels increased with adiposity. The apparent disparity betweenour initial microarray results and subsequent mRNA and proteinanalysis may have reflected the limited number of participantsavailable for microarray analysis. Furthermore, analysis ofPLA2 isoforms in adipose tissue from amale cohort (given theirhigher metabolic risk for a given age and BMI) would add valueto our existing knowledge.
It is clear from prior studies that macrophages represent animportant source of Lp-PLA2 [27, 28], and increase with
adiposity in omental adipose tissue [29, 30]. Therefore, it wasimportant to ascertain the contribution of macrophages to Lp-PLA2 in adipose tissue, as well as to explore the potentialcellular site of Lp-PLA2 expression. In brief, we: (1) evaluatedthe influence of macrophages, using the macrophage markerEMR1 to explore an association with Lp-PLA2 in adiposetissue [31, 32]; (2) analysed, immunohistochemically, the ex-pression of Lp-PLA2 in adipose tissue; and (3) used isolatedmature and differentiated human adipocyte cells to examineLp-PLA2 and macrophage expression. These studies suggestthat adipocytes can be viewed as an important contributingsource of Lp-PLA2 expression in adipose tissue and adipo-cytes. Analysis of the mature adipocytes and adipocyte cell linehighlighted that any perceived prior contamination of macro-phages in cell cultures did not represent a source of Lp-PLA2mRNA or protein expression. Therefore, targeting adipocytesin obese individuals with darapladib (an Lp-PLA2 inhibitorknown to reduce plaque instability in coronary events [33,34]) may effectively influence adipose tissue dysfunction inobese/type 2 diabetic individuals with and without CVD.
Prior studies have shown associations between Lp-PLA2and CVD. Our studies examined circulating Lp-PLA2 and itsrelationship with selected metabolic markers in type 2 diabetic
a AbdSc AT
Pos
itive
stai
ning
Neg
ativ
eco
ntro
l
1.5
1.0
0.5
*** *** *** *** ***0SVF MA
PLA2G
7CD68
CD206
HLA-D
RACIIT
A
EMR1
SVF MASVF MASVF MA SVF MA SVF MA
1.5
1.0
0.5
0
20
18
16
14
12
1013 14
r = 0.192, p = 0.530
15 16
EMR1 mRNA (ΔCt)17 18 19 20 21 22
mR
NA
(fo
ld c
hang
e)
Lp-P
LA2
prot
ein
leve
l(f
old
chan
ge)
PLA
2G7
mR
NA
(ΔC
t)
Placenta
D0
D0
AbdSc AT Chub-S7
D14 D0 D14
Lp-PLA2
β-Actin
AbdSc Chub-S7 AbdSc Chub-S7
D14
b
c
d
Fig. 4 Analysis of Lp-PLA2and macrophage markers inadipocytes and adipose tissue. (a)Representative images ofimmunohistochemical staining inhuman AbdSc adipose tissue andplacenta, showing adipocytesexpressing Lp-PLA2. (b) Lp-PLA2 protein levels in humanprimary culture and a humanadipocyte cell line (Chub-S7) onday 0 and day 14 ofdifferentiation. (c) Geneexpression of PLA2G7 (Lp-PLA2) and macrophage markersin SVF and mature adipocytes.(d) Correlation between mRNAlevels of PLA2G7 and EMR1,encoding the macrophage-specific marker EMR1, in AbdScadipose tissue from type 2diabetic individuals. The solidline represents linear regression.Statistical analysis was performedusing two-way ANOVA (d) andpaired t test (b, c). Scale bar,100 μm. ***p < 0.001. AT,adipose tissue; D, day; MA,mature adipocyte
1162 Diabetologia (2018) 61:1155–1166

individuals. The data showed that circulating Lp-PLA2 in-creased significantly with both the level of adiposity and dia-betes status. These findings support previous studies in women
with gestational diabetes [33] and South Asian individuals withthe metabolic syndrome [34], which report similar increases inLp-PLA2. Interestingly, relative to people without diabetes,there is a fourfold increase in intracellular Lp-PLA2 levels inadipose tissue from individuals with type 2 diabetes; this may,in part, explain the systemic changes in Lp-PLA2 plasma levelsin type 2 diabetic individuals. It should also be noted that othercell types secrete Lp-PLA2, such as monocytes, macrophages,T lymphocytes and mast cells, providing an additional sourceof circulating Lp-PLA2 in type 2 diabetes [35, 36].
In common with people with CVD, the participants withtype 2 diabetes in this study had a more unfavourable cardio-metabolic risk profile than the obese individuals without diabe-tes; this included increased oxLDL and LDL-cholesterol /HDL-cholesterol ratio and diminished HDL-cholesterol levels. Ourmultivariate stepwise regression analysis confirmed oxLDL,triacylglycerol and HDL-cholesterol as the most important pre-dictors of Lp-PLA2 in participants with type 2 diabetes.Additionally, correlation data showed a clear link between lipidprofiles and Lp-PLA2 across different metabolic states. Thesefindings were partially affirmed by a study involving a cohort ofmen with type 2 diabetes, where a multiple-regression modelfound triacylglycerols as the key predictor of Lp-PLA2 [37].Therefore, it appears that an unfavourable circulating lipid pro-file may drive an increase in Lp-PLA2 in adipose tissue, andthis is more pronounced in individuals with type 2 diabetes.
The association of an unfavourable lipid profile with dia-betes and the associated increase in intracellular Lp-PLA2 inadipose tissue in type 2 diabetes led us to investigate the im-portance of the adipocyte in LDL-cholesterol and oxLDLmodulation in a human adipocyte cell system. In this cellularsystem, it was shown that acute oxLDL exposure increasedthe new synthesis of Lp-PLA2, as observed by increasing
a8
8 0 1 2 3 4 510
Lp-P
LA2
(pm
ol/l)
Cholesterol (mmol/l) Triacylglycerol (mmol/l)
6
6
4
4
2
2
r = 0.404, p < 0.01 r = 0.365, p < 0.01
r = 0.442, p < 0.01 r = 0.353, p < 0.01
r = 0.271, p < 0.05 r = 0.368, p < 0.01
00
8 0 50 100 150
LDL-cholesterol (mmol/l) oxLDL (U/I)
BMI (kg/m2) Endotoxin (EU/ml)
6420
8
Lp-P
LA2
(pm
ol/l)
6
4
2
0
8
Lp-P
LA2
(pm
ol/l)
Lp-P
LA2
(pm
ol/l)
6
4
2
0
8Lp
-PLA
2 (p
mol
/l)Lp
-PLA
2 (p
mol
/l)
6
4
2
0
8
6
4
2
00 20 40 60 0 5 10 15 20
8
6
4
2
0
b
c d
e f
Fig. 5 Correlations between Lp-PLA2 (pmol/l) and: (a) cholesterol(mmol/l), (b) triacylglycerol (mmol/l), (c) LDL-cholesterol (mmol/l),(d) oxLDL (U/l), (e) BMI (kg/m2) and (f) endotoxin (EU/ml).Correlation analysis was performed using Spearman’s rank correlationanalysis, followed by two-way ANOVA
Table 2 Correlations betweenserum Lp-PLA2 and selectedmetabolic markers
Characteristic Non-diabetic Type 2 diabetic(n = 35)
Non-diabetic(n = 79)
Lean(n = 23)
Overweight(n = 24)
Obese(n = 32)
BMI 0.271* 0.146 0.113 0.138 −0.042Glucose 0.123 0.306 0.011 0.025 0.236
HOMA-IR 0.249 0.395 0.468 0.215 0.143
Cholesterol 0.404** 0.537* 0.310 0.315 0.176
Triacylglycerol 0.365** 0.459 0.288 0.299 0.146
LDL-cholesterol 0.442** 0.607* 0.221 0.400* 0.306
HDL-cholesterol −0.281* 0.207 0.113 0.420* −0.536**
LDL-cholesterol/HDL-cholesterol
0.449*** 0.596* 0.025 0.486** 0.588***
Insulin 0.304* 0.297 0.465 0.250 0.122
Endotoxin 0.368** 0.590** 0.125 0.326 0.071
OxLDL 0.353** 0.460* 0.196 0.328 0.657**
The values shown are Spearman’s correlation coefficients
*p < 0.05, **p < 0.01 and ***p < 0.001
Diabetologia (2018) 61:1155–1166 1163
gene expression. In comparison, oxLDL treatment in humanTHP-1 monocyte cell cultures also upregulated Lp-PLA2,suggesting that adipocytes may act in a similar manner tomacrophages [21, 38]. Lp-PLA2 protein levels appeared tobe induced at an even earlier time point than mRNA expres-sion. This apparent disparity may have arisen because of thecapacity of the adipocyte to influx and digest oxLDL andLDL-cholesterol, releasing fatty acid, cholesterol and Lp-PLA2 [39]. As such, Lp-PLA2 is transported into the adipo-cyte bound to apolipoprotein B on LDL-cholesterol, its pri-mary carrier [40]. Therefore, the protein expression of Lp-PLA2 likely reflects the exogenous Lp-PLA2 available, whilethe mRNA expression represents the newly synthesised Lp-PLA2. Of note, LDL-cholesterol treatment led to similar fin-dings for Lp-PLA2 protein levels: following acute treatmentwe observed elevated levels of Lp-PLA2, with a gradual re-duction over time. To further implicate Lp-PLA2 in the regu-lation of lipid mediators, co-treatment of LDL-cholesterolwith an Lp-PLA2 inhibitor was tested, resulting in diminishedoxLDL-mediated inflammation. Thus, Lp-PLA2 functionalitywithin adipocytes may be required for oxLDL production, andthe ability to modify oxLDL production from adipose tissuethrough the Lp-PLA2 pathway may be an important mecha-nism to target. Future knockdown studies of Lp-PLA2 couldfurther evaluate these effects on adipocyte cellular functions.This may also ascertain whether adipocyte Lp-PLA2 is a use-ful therapeutic target to improve the lipid profile of peoplewith type 2 diabetes. While still appreciating that downregu-lating Lp-PLA2 in adipocytes may be significant in reducingsystemic triacylglycerols and oxLDL levels, it should bestressed that, as lipid control is a multifactorial process, exa-mining more than one mediator would enhance our under-standing of the potential impact on lipid profiles.
In conclusion, this work has highlighted that AbdSc adiposetissue and the adipocyte may act as separate and significantsources of oxLDL production (i.e. separate from foam cells
2.52.01.51.00.5
0PLA
2G7
mR
NA
(fol
d ch
ange
)
Lp-P
LA2
prot
ein
leve
l(n
g/m
g)Lp
-PLA
2 pr
otei
n le
vel
(ng/
mg)
OxL
DL
prot
ein
leve
l(m
U l-1
mg-1
)
PLA
2G7
mR
NA
(fol
d ch
ange
) 4
3
2
1
0
0.15
0.10
0.05
0
0.10
0.08
0.06
0.04
0.02
0
1.0
0.9
0.8
0.7
0.60.5
LDL-CLp-PLA2 inhibitor
++
+-
++
+-
++
+-
24 48
Time (h)
Time (h) Time (h)
72
3 6 24 48
Time (h) Time (h)3 6 24 48 4824630
4824630
*
Ctrl
LDL-
CCtrl
LDL-
CCtrl
LDL-
CCtrl
LDL-
C
Ctrl
oxLD
LCtrl
oxLD
LCtrl
oxLD
LCtrl
oxLD
L
***
***
***
******
***
***
***
***
*** ***
a b
c d
e
Fig. 6 Effects of an Lp-PLA2 inhibitor, oxLDL and LDL-cholesterolon Lp-PLA2 gene expression and protein levels. Differentiated Chub-S7adipocytes (n = 6) were treated for 3, 6, 24 and 48 h with: (a) 43 pmol/loxLDL, PLA2G7mRNAwas measured; (b) 43 pmol/l oxLDL, Lp-PLA2protein levels were measured (black circles, control; white circles,oxLDL-treated cells); (c) 67 pmol/l LDL-cholesterol, PLA2G7 mRNAwas measured; and (d) 67 pmol/l LDL-cholesterol, Lp-PLA2 proteinlevels were measured (black circles, control; white circles, LDL-choles-terol-treated cells). (e) Cells were treated with 200 μg protein/ml LDL-cholesterol and with or without 20 μmol/l Lp-PLA2 inhibitor for 24, 48and 72 h. The oxLDL levels (mU/l) were normalised to individual totalprotein concentration. Statistical analysis was performed using two-wayANOVA. *p < 0.05 and ***p < 0.001 vs 0 h. Ctrl, control; LDL-C, LDL-cholesterol
Table 3 Variables statisticallyassociated with circulating Lp-PLA2 in multivariate stepwiseregression analysis
Independent variables Standard βa Adjusted R2b p value for R2
Non-diabetic – 0.096 0.020
LDL-cholesterol 0.34 ± 0.18 – –
Type 2 diabetic – 0.597 1.5×10⁻⁵
OxLDL 0.77 ± 0.09 – –
Triacylglycerol −0.38 ± 0.13 – –
HDL-cholesterol −0.30 ± 0.14 – –
All – 0.097 0.004
LDL-cholesterol 0.33 ± 0.11 – –
The following independent variables were considered for the model: BMI, fasting glucose, HOMA-IR, choles-terol, triacylglycerol, LDL-cholesterol, HDL-cholesterol, insulin, endotoxin, oxLDLa Standardised regression β coefficient ± SEMbAdjusted coefficient of determination
p values for adjusted R2 are significant at <0.0045 (Bonferroni adjusted p value)
1164 Diabetologia (2018) 61:1155–1166
within unstable atherogenic plaques noted in coronary arterydisease) [41]. Furthermore, human adipose tissue and adipocytesappear active sources of Lp-PLA2, with expression induced byLDL-cholesterol and oxLDL. Lp-PLA2 expression is raised inAbdSc adipose tissue from people without diabetes, and this isfurther enhanced in the type 2 diabetic state. The observed in-crease of Lp-PLA2 in type 2 diabetic people appears to be asso-ciatedwith an upregulation in systemic lipids. As such, increasedLp-PLA2 protein from adipocytes in obesity and type 2 diabetesmay contribute to increased circulating oxLDL levels. In turn,this may further promote inflammation and increase the athero-sclerotic risk. Therefore, Lp-PLA2 action within adipocytes ap-pears to represent a novel and important therapeutic target toreduce inflammation, atherosclerotic risk and the developmentof cardiometabolic complications in type 2 diabetes.
Acknowledgements We extend our thanks to the surgeons, theatre staffand Arden Tissue Bank at University Hospitals Coventry andWarwickshire NHS Trust Hospital, Coventry for the collection of sam-ples. We also acknowledge S. L. Sabico (King Saud University, Riyadh,Saudi Arabia) and P. D. Voyias (University of Warwick, Coventry, UK)for their contributions to the paper.
Funding LJ was a recipient of the Warwick Medical School ChancellorsPhD Scholarship. WKwas supported by the Thai Government during herdoctoral studies. This work was also partly funded by supporting grantsfrom the Rowlands Trust and Coventry & District Charitable Trust.
Data availability Any data not included within this paper are availablefrom the corresponding author on reasonable request.
Duality of interest The authors declare that there is no duality of interestassociated with this manuscript.
Contribution statement LJ and WK contributed to the acquisition,analysis and interpretation of data, preparation of figures and writing ofthe manuscript. JDM implemented, managed and performed the micro-array analysis. NA, IK and TMB contributed to the data collection, itsanalysis and intellectual input for revision of the manuscript. HR and SKcontributed to the analysis and interpretation of the data. GTand PGM ledthe design of the study, analysis and interpretation of the data andmanuscript writing and revision. PGM led the grant applications to sourcethe funding of the studies. All authors corrected, revised and gave theirapproval for the final manuscript to be published. GT and PGM are theguarantors of this work.
Open Access This article is distributed under the terms of the CreativeCommons At t r ibut ion 4 .0 In te rna t ional License (h t tp : / /creativecommons.org/licenses/by/4.0/), which permits unrestricted use,distribution, and reproduction in any medium, provided you give appro-priate credit to the original author(s) and the source, provide a link to theCreative Commons license, and indicate if changes were made.
References
1. Zalewski A, Nelson JJ, Hegg L, Macphee C (2006) Lp-PLA2: anew kid on the block. Clin Chem 52:1645–1650
2. Rosenson RS, Stafforini DM (2012)Modulation of oxidative stress,inflammation, and atherosclerosis by lipoprotein-associated phos-pholipase A2. J Lipid Res 53:1767–1782
3. Toth PP, McCullough PA, Wegner MS, Colley KJ (2010)Lipoprotein-associated phospholipase A2: role in atherosclerosisand utility as a cardiovascular biomarker. Expert Rev CardiovascTher 8:425–438
4. Oei HH, Van Der Meer IM, Hofman A et al (2005) Lipoprotein-associated phospholipase A2 activity is associated with risk of coro-nary heart disease and ischemic stroke: the Rotterdam Study.Circulation 111:570–575
5. Winkler K, Hoffmann MM, Winkelmann BR et al (2007)Lipoprotein-associated phospholipase A2 predicts 5-year cardiacmortality independently of established risk factors and adds prog-nostic information in patients with low and medium high-sensitivity C-reactive protein (the Ludwigshafen risk and cardio-vascular health study). Clin Chem 53:1440–1447
6. Khakpour H, FrishmanWH (2009) Lipoprotein-associated phospho-lipase A2: an independent predictor of cardiovascular risk and a noveltarget for immunomodulation therapy. Cardiol Rev 17:222–229
7. Kinney GL, Snell-Bergeon JK, Maahs DM et al (2011)Lipoprotein-associated phospholipase A2 activity predicts progres-sion of subclinical coronary atherosclerosis. Diabetes Technol Ther13:381–387
8. Vickers KC, Maguire CT, Wolfert R et al (2009) Relationship oflipoprotein-associated phospholipase A2 and oxidized low densitylipoprotein in carotid atherosclerosis. J Lipid Res 50:1735–1743
9. Waegner AM, Sanchez-Quesada LJ, Benitez S, Bancells C,Ordonez-Llanos J, Perez A (2011) Effect of statin and fibrate treat-ment on inflammation in type 2 diabetes. A randomized, cross-overstudy. Diabetes Res Clin Pract 93:E25–E28
10. Nelson TL, Kamineni A, Psaty B et al (2011) Lipoprotein-associated phospholipase A2 and future risk of subclinical diseaseand cardiovascular events in individuals with type 2 diabetes: theCardiovascular Health Study. Diabetologia 54:329–333
11. Nakos G, Kitsiouli E, Hatzidaki E, Koulouras V, Touqui L, LekkaME (2005) Phospholipases A(2) and platelet-activating-factoracetylhydrolase in patients with acute respiratory distress syn-drome. Crit Care Med 33:772–779
12. Schipper HS, Nuboer R, Prop S et al (2012) Systemic inflammationin childhood obesity: circulating inflammatory mediators and acti-vated CD14++ monocytes. Diabetologia 55:2800–2810
13. Creely SJ, McTernan PG, Kusminski CM et al (2007)Lipopolysaccharide activates an innate immune system response inhuman adipose tissue in obesity and type 2 diabetes. Am J PhysiolEndocrinol Metab 292:740–747
14. Harte AL, Varma MC, Tripathi G et al (2012) High fat intake leadsto acute postprandial exposure to circulating endotoxin in type 2diabetic subjects. Diabetes Care 35:375–382
15. McTernan P, Anwar A, Eggo M, Barnett A, Stewart P, Kumar S(2000) Gender differences in the regulation of P450 aromatase ex-pression and activity in human adipose tissue. Int J Obes RelatMetab Disord 24:875–881
16. Bradford MM (1976) A rapid and sensitive method for the quanti-tation of microgram quantities of protein utilizing the principle ofprotein-dye binding. Anal Biochem 72:248–254
17. Towbin H, Staehelin T, Gordon J (1979) Electrophoretic transfer ofproteins from polyacrylamide gels to nitrocellulose sheets: procedureand some applications. Proc Natl Acad Sci U S A 76:4350–4354
18. Saiki A, Olsson M, Jernas M et al (2009) Tenomodulin is highlyexpressed in adipose tissue, increased in obesity, and down-regulated during diet-induced weight loss. J Clin EndocrinolMetab 94:3987–3994
19. Anveden A, Sjoholm K, Jacobson P et al (2012) ITIH-5 expressionin human adipose tissue is increased in obesity. Obesity 20:708–714
Diabetologia (2018) 61:1155–1166 1165
20. Darimont C, Zbinden I, Avanti O et al (2003) Reconstitution oftelomerase activity combined with HPV-E7 expression allow hu-man preadipocytes to preserve their differentiation capacity afterimmortalization. Cell Death Differ 10:1025–1031
21. Wang WY, Li J, Yang D, XuW, Zha RP, Wang YP (2010) OxLDLstimulates lipoprotein-associated phospholipase A2 expression inTHP-1 monocytes via PI3K and p38 MAPK pathways.Cardiovasc Res 85:845–852
22. van Greevenbroek M, Schalkwijk C, Stehouwer C (2013) Obesity-associated low-grade inflammation in type 2 diabetes mellitus:causes and consequences. Neth J Med 71:174–187
23. Shi Y, Zhang P, Zhang L et al (2007) Role of lipoprotein-associatedphospholipase A2 in leukocyte activation and inflammatory re-sponses. Atherosclerosis 191:54–62
24. Wang X, Xue H, Xu Q et al (2008) p38 kinase/cytosolic phospho-lipase A2/cyclooxygenase-2 pathway: a new signaling cascade forlipopolysaccharide-induced interleukin-1β and interleukin-6 re-lease in differentiated U937 cells. Prostaglandins Other LipidMediat 86:61–67
25. Xie Z, Gong MC, Su W, Xie D, Turk J, Guo Z (2010) Role ofcalcium-independent phospholipase A2beta in high glucose-induced activation of RhoA, Rho kinase, and CPI-17 in culturedvascular smooth muscle cells and vascular smooth musclehypercontractility in diabetic animals. J Biol Chem 285:8628–8638
26. Piñón P, Kaski J (2006) Inflammation, atherosclerosis and cardio-vascular disease risk: PAPP-A, Lp-PLA2 and cystatin C. New in-sights or redundant information? Rev Esp Cardiol 59:247–258
27. Sudhir K (2005) Lipoprotein-associated phospholipase A2, a novelinflammatory biomarker and independent risk predictor for cardio-vascular disease. J Clin Endocrinol Metab 90:3100–3105
28. McConnell JP, Jaffe AS (2009) The spin stops here: inhibition oflipoprotein-associated phospholipase A2—a promising target but anegative initial trial? Clin Chem 55:21–23
29. Weisberg S, McCann D, Desai M, Rosenbaum M, Leibel R,Ferrante A (2003) Obesity is associated with macrophage accumu-lation in adipose tissue. J Clin Invest 112:1796–1808
30. Boutens L, Stienstra R (2016) Adipose tissue macrophages: goingoff track during obesity. Diabetologia 59:879–894
31. Fink LN, Oberbach A, Costford SR et al (2013) Expression of anti-inflammatory macrophage genes within skeletal muscle correlateswith insulin sensitivity in human obesity and type 2 diabetes.Diabetologia 56:1623–1628
32. Harford KA, Reynolds CM, McGillicuddy FC, Roche HM (2011)Fats, inflammation and insulin resistance: insights to the role ofmacrophage and T cell accumulation in adipose tissue. Proc NutrSoc 70:408–417
33. Wilensky RL, Shi Y, Mohler ER et al (2008) Inhibition oflipoprotein-associated phospholipase A2 reduces complex coro-nary atherosclerotic plaque development. Nat Med 14:1059–1066
34. White H (2010) Darapladib and its potential for plaque stabilizationand prevention of cardiac events. Clin Lipidol 5:465–476
35. Ulrich C, Trojanowicz B, Fiedler R et al (2017) Differential expres-sion of lipoprotein-associated phospholipase A2 in monocyte sub-sets: impact of uremia and atherosclerosis. Nephron 135:231–241
36. Persson M, Nilsson J, Nelson JJ, Hedblad B, Berglund G (2007)The epidemiology of Lp-PLA(2): distribution and correlation withcardiovascular risk factors in a population-based cohort.Atherosclerosis 190:388–396
37. Noto H, Chitkara P, Raskin P (2006) The role of lipoprotein-associated phospholipase A2 in the metabolic syndrome and diabe-tes. J Diabetes Complicat 20:343–348
38. Yang M, Chu EM, Caslake MJ, Edelstein C, Scanu AM, Hill JS(2010) Lipoprotein-associated phospholipase A2 decreases oxi-dized lipoprotein cellular association by human macrophages andhepatocytes. Biochim Biophys Acta 1801:176–182
39. Mentese A, Sumer A, Sumer A, Demir S (2016) Effects of homo-cysteine on adipocyte differentiation and CD36 gene expression in3T3-L1 adipocytes. J Cell Commun Signal 10:55–60
40. Zalewski A, Macphee C (2005) Role of lipoprotein-associatedphospholipase A2 in atherosclerosis: biology, epidemiology, andpossible therapeutic target. Arterioscler Thromb Vasc Biol 25:923–931
41. Johnson JL, Shi Y, Snipes R et al (2014) Effect of darapladibtreatment on endarterectomy carotid plaque lipoprotein-associated phospholipase A2 activity: a randomized, controlledtrial. PLoS One 9:e89034
1166 Diabetologia (2018) 61:1155–1166


![Distribution of Paraoxonase-1 (PON-1) and Lipoprotein ...downloads.hindawi.com/journals/omcl/2018/1752940.pdf · Lp-PLA2 and PON1 [19–22]. A limited number of studies addressed](https://img.pdfslide.us/doc/110x75/5d3f2f8c88c9937e518cc10e/distribution-of-paraoxonase-1-pon-1-and-lipoprotein-lp-pla2-and-pon1-1922.jpg)