Embed Size (px)
Citation preview
NASA-TM-111357
/
Differential Canard Deflection for
Generation of Yawing Moment on the X-31With and Without the Vertical Tail
by
Matthew Robert Whiting
B.S. Aerospace Engineering, Dec. 1991, Parks College of Saint Louis University
A Thesis submitted to
The Faculty of
The School of Engineering and Applied Science
of The George Washington University in partial satisfaction
of the requirements for the degree of Master of Science
1/9/96
(NASA-TM-III357) DIFFERENTIAL
CANARD DEFLECTION FOR GENERATION OF
YAWING MOMENT ON THE X-31 WITH AND
WITHOUT THE VERTICAL TAIL M.S.
Thesis - George Washington Univ.
(NASA. Langley Research Center)
166 p G3/08
N96-18516
Unclas
0099884
This research was conducted at NASA LaRC.
https://ntrs.nasa.gov/search.jsp?R=19960012279 2018-07-15T17:34:38+00:00Z


Abstract
I
The feasibility of augmenting the available yaw control power on the X-31
through differential deflection of the canard surfaces was studied as well as the possibility
of using differential canard control to stabilize the X-31 with its vertical tail removed.
Wind-tunnel tests and the results of departure criteria and linear analysis showed the
destabilizing effect of the reduction of the vertical tail on the X-31. Wind-tunnel testing
also showed that differential canard deflection was capable of generating yawing
moments of roughly the same magnitude as the thrust vectoring vanes currently in place
on the X-31 in the post-stall regime. Analysis showed that the X-31 has sufficient aileron
roll control power that with the addition of differential canard as a yaw controller, the
wind-axis roll accelerations will remain limited by yaw control authority. It was
demonstrated, however, that pitch authority may actually limit the maximum roll rate
which can be sustained. A drop model flight test demonstrated that coordinated, wind-
axis rolls could be performed with roll rates as high as 50 deg/sec (full scale equivalent)
at 50 deg angle of attack. Another drop model test was conducted to assess the effect of
vertical tail reduction, and an analysis of using differential canard deflection to stabilize
the tailless X-31 was performed. The results of six-degree-of-freedom, non-linear
simulation tests were correlated with the drop model flights. Simulation studies then
showed that the tailless X-31 could be controlled at angles of attack at or above 20 deg
using differential canard as the only yaw controller.

Acknowledgments
The author would like to thank everyone at NASA Langley Research Center
whose participation made this study possible. In particular, special recognition should go
to the entire drop model team who worked together to make the drop model flights
happen in the face of adversity. Specifically, thanks go to Mark Croom, who has been my
mentor throughout this project, and Dr. Vladislav Klein, who has served as my academic
advisor. The author would also like to make special mention of Kevin Cunningham, who
made the simulator studies possible, and Lee Pollard for his excellent work on short
notice assembling graphics.
ii


Tableof Contents
Abstract
Acknowledgements
Tableof Contents
ii
iii
List of Symbols V
List of Tables
List of Figures xi
1. Introduction
2. The X-31
3. Vertical Tail Reduction
3.1 Static Wind-Tunnel Testing
3.2 Forced Oscillation Wind-Tunnel Testing
3.3 Equations of Motion
3.4 Dynamic Divergence Parameters
4. Wind-Tunnel Testing of Differential Canard Control
5. Analysis of Performance Limitations
5.1 Coordination of Wind-Axis Rolls
5.2 Inertial Coupling
6. Drop Model Tests
6.1 Drop Model Flight 26: 100% Vertical Tail
6.2 Drop Model Flight 27: 20% Vertical Tail
9
10
11
12
16
18
29
29
31
34
35
38
iii

7. Validationof Simulation
7.1 Reproductionof DropModelFlight 26:
7.2 Reproductionof DropModelFlight 27:
8. StabilityAugmentation
8.1 Stabilizationof LinearSystemPoles
8.2 Modificationto LongitudinalControlLaws
8.3 Evaluationin NonlinearSimulation
8.4 LandingAnalysis
9. Conclusion
100%VerticalTail
20%VerticalTail
42
42
44
45
45
47
48
49
52
10. Recommendationfor FurtherStudy
References
55
56
Tables 58
Figures 69
iv
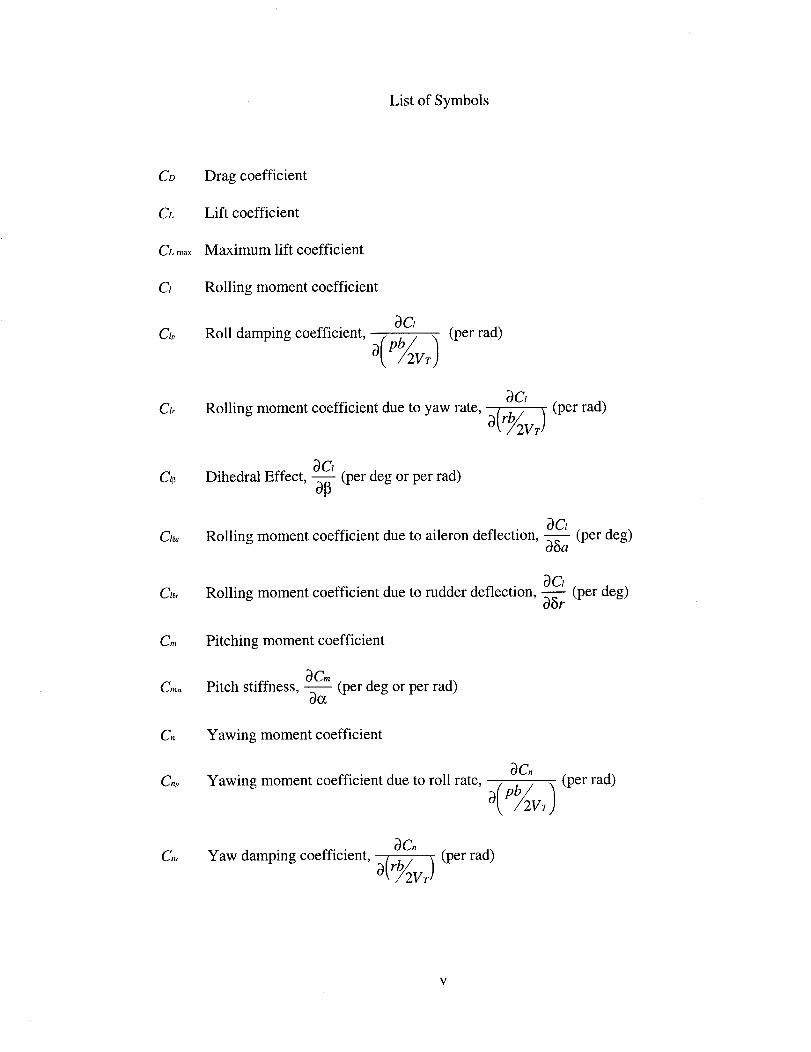
List of Symbols
C_
CL
CLn_
Ct
Clp
fir
Cl_
flea
Clar
Cm
Cm_x
cn
Cnp
Cnr
Drag coefficient
Lift coefficient
Maximum lift coefficient
Rolling moment coefficient
OCtRoll damping coefficient, (per rad)
OCt
Rolling moment coefficient due to yaw rate, 2(rb/_2V_) (per rad)
OCt
Dihedral Effect, -_- (per deg or per rad)
OCt
Rolling moment coefficient due to aileron deflection, _ (per deg)
OCt
Rolling moment coefficient due to rudder deflection, -_r (per deg)
Pitching moment coefficient
OCm
Pitch stiffness, _ (per deg or per rad)
Yawing moment coefficient
0C.Yawing moment coefficient due to roll rate, (per rad)
OCn
Yaw damping coefficient, O,,JVr\tr_/2 ) (per rad)
V
Cnl_
Cn[L dyn
Cnba
Cnsr
CY
CYp
CYr
CY_
CY_
CYst
C_
Cnr
D
Fr
g
/x
/xz
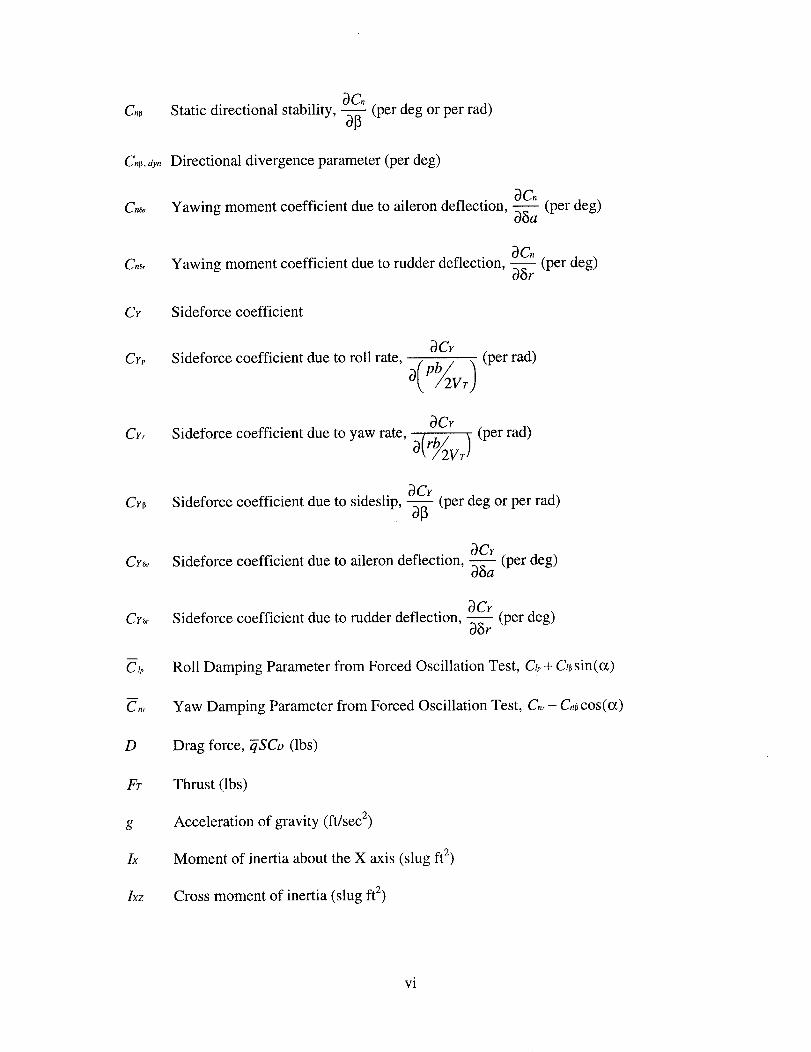
Static directional stability, --_ (per deg or per rad)
Directional divergence parameter (per deg)
Yawing moment coefficient due to aileron deflection, _ (per deg)
Yawing moment coefficient due to rudder deflection, -_r (per deg)
Sideforce coefficient
OCYSideforce coefficient due to roll rate, (per rad)
OCY
Sideforce coefficient due to yaw rate, o(rb_2vr ) (per rad)
OCY
Sideforce coefficient due to sideslip, -_- (per deg or per rad)
OCY
Sideforce coefficient due to aileron deflection, _a (per deg)
OCY
Sideforce coefficient due to rudder deflection, _ (per deg)
Roll Damping Parameter from Forced Oscillation Test, Ct,,+ C_ sin(a)
Yaw Damping Parameter from Forced Oscillation Test, Cnr- Cn_cos(a)
Drag force, _SCD (lbs)
Thrust (lbs)
Acceleration of gravity (ft/sec 2)
Moment of inertia about the X axis (slug ft 2)
Cross moment of inertia (slug ft 2)
vi

IY
Iz
KSRI
L
Lp
Lr
L_
L_
Lsr
m
M
N
Nr
Nsr
q
q
P
Moment of inertia about the Y axis (slug ft 2)
Moment of inertia about the Z axis (slug ft 2)
Roll stick to rudder interconnect gain
Lift force or rolling moment, -_SCL (lbs) or -_SbCl (ft lbs)
_Sb 2CI.Rolling moment due to roll rate, -- (ft lbs per rad/sec)
2Vr
"_Sb 2Ct.Rolling moment due to yaw rate, -- (ft lbs per rad/sec)
2VT
Rolling moment due to sideslip, qSbCl, (ft lbs per rad)
Rolling moment due to aileron deflection, _SbCI_,, (ft lbs per deg)
Rolling moment due to rudder deflection, _SbC_r (ft lbs per deg)
Mass (slug)
Pitching moment, _S-6C,. (ft lbs)
Yawing moment, _SbC. (ft lbs), or linear dimensional scale factor
Yawing moment due to roll rate, qSb2C"-------_(ft lbs per rad/sec)2VT
-_Sb Z Cn,
Yawing moment due to yaw rate, (ft lbs per rad/sec)2V_
Yawing moment due to sideslip, _SbC._ (ft lbs per rad)
Yawing moment due to aileron deflection, -_SbC._, (ft lbs per deg)
Yawing moment due to rudder deflection, -_SbC._r (ft Ibs per deg)
Body axis pitch rate (deg/sec or rad/sec) (see Fig. 1)
Dynamic pressure (psf)
Body axis roll rate (deg/sec or rad/sec) (see Fig. 1)
vii
r
S
Uo
1A
VD
Vr
v
W
Wo
w
Y
Yp
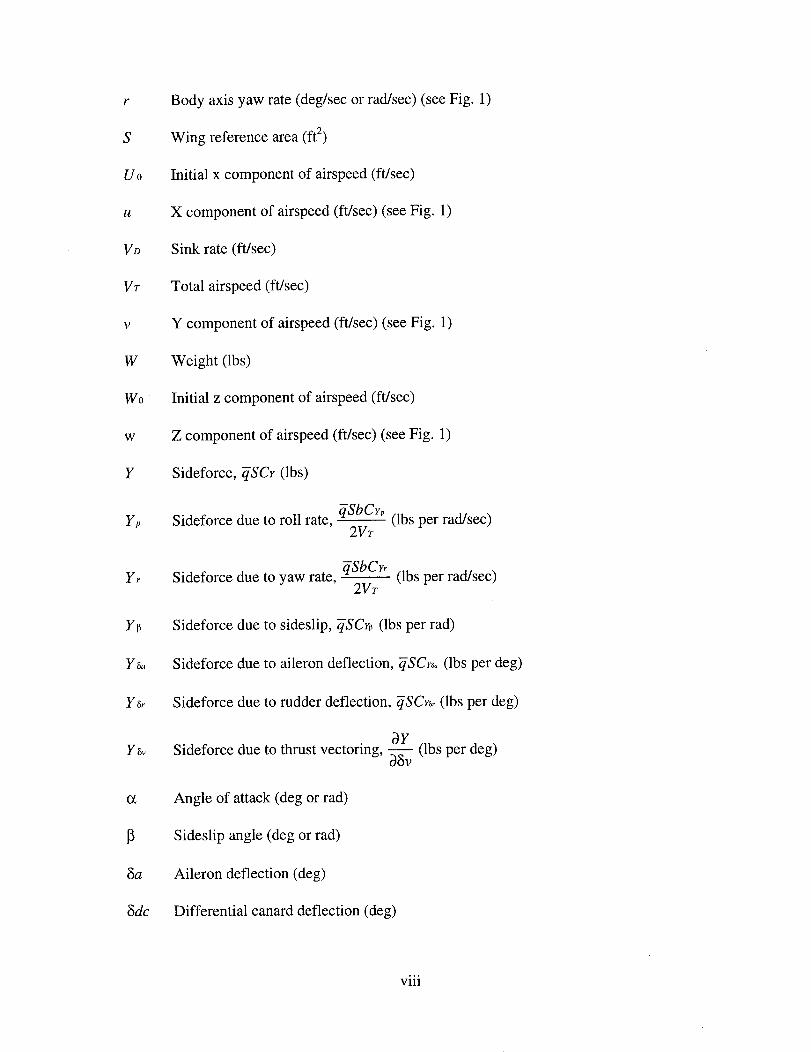
Body axis yaw rate (deg/sec or rad/sec) (see Fig. 1)
Wing reference area (ft 2)
Initial x component of airspeed (ft/sec)
X component of airspeed (ft/sec) (see Fig. 1)
Sink rate (ft/sec)
Total airspeed (ft/sec)
Y component of airspeed (ft/sec) (see Fig. 1)
Weight (lbs)
Initial z component of airspeed (ft/sec)
Z component of airspeed (ft/sec) (see Fig. 1)
Sideforce, -_SCY (lbs)
Sideforce due to roll rate, _SbC_', (lbs per rad/sec)2VT
4SbCYrSideforce due to yaw rate, --yr (lbs per rad/sec)
2VT
Y_ Sideforce due to sideslip, _SCY_ (lbs per rad)
Ya, Sideforce due to aileron deflection, _SCY_,, (lbs per deg)
Y_r Sideforce due to rudder deflection, _SCY_, (lbs per deg)
OY
Y_v Sideforce due to thrust vectoring, _v (lbs per deg)
o_ Angle of attack (deg or rad)
13 Sideslip angle (deg or rad)
_Sa Aileron deflection (deg)
8dc Differential canard deflection (deg)
viii
5f
5r
5v
3'
Oo
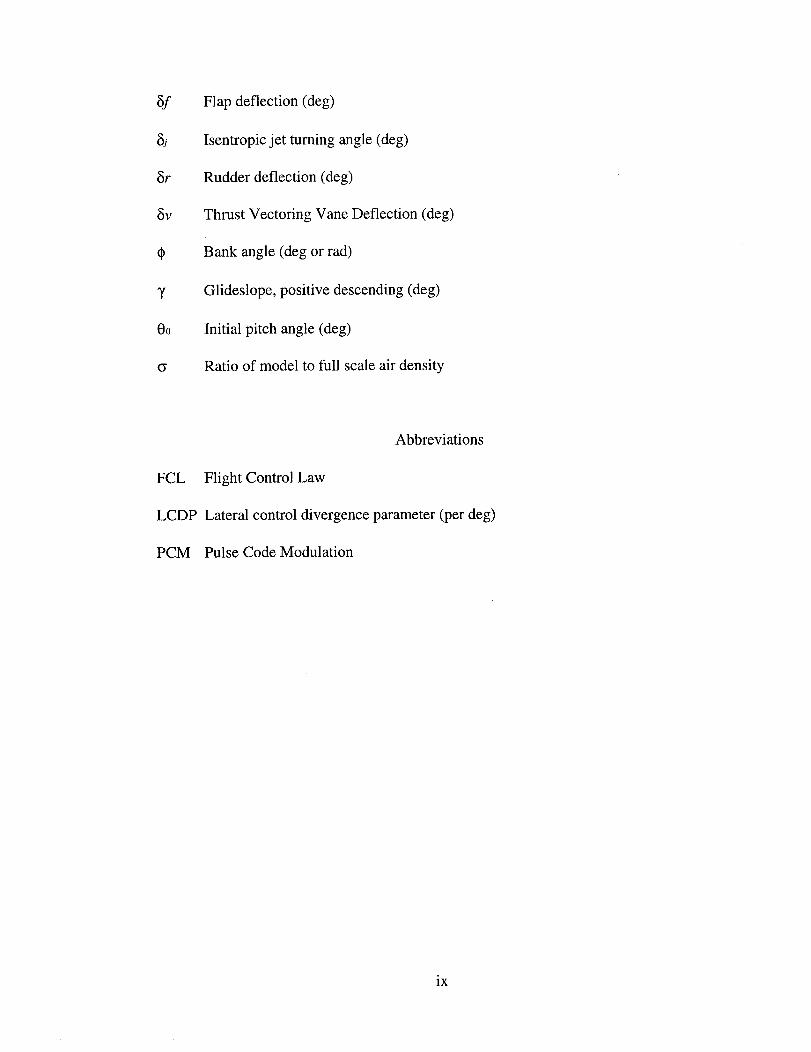
Flap deflection (deg)
Isentropic jet turning angle (deg)
Rudder deflection (deg)
Thrust Vectoring Vane Deflection (deg)
Bank angle (deg or rad)
Glideslope, positive descending (deg)
Initial pitch angle (deg)
Ratio of model to full scale air density
Abbreviations
FCL Flight Control Law
LCDP Lateral control divergence parameter (per deg)
PCM Pulse Code Modulation
ix

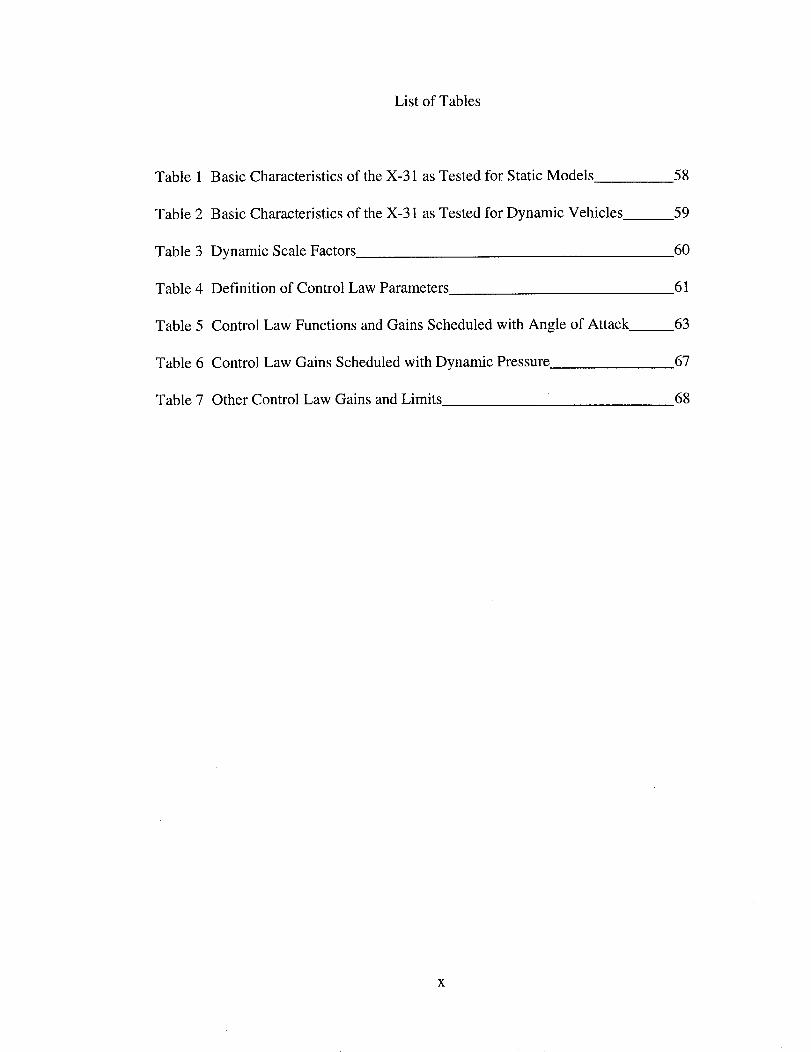
List of Tables
Table 1 Basic Characteristics of the X-31 as Tested for Static Models
Table 2 Basic Characteristics of the X-31 as Tested for Dynamic Vehicles
Table 3 Dynamic Scale Factors
Table 4 Definition of Control Law Parameters
58
59
6O
61
Table 5
Table 6
Table 7
Control Law Functions and Gains Scheduled with Angle of Attack
Control Law Gains Scheduled with Dynamic Pressure
Other Control Law Gains and Limits
63
67
68
X

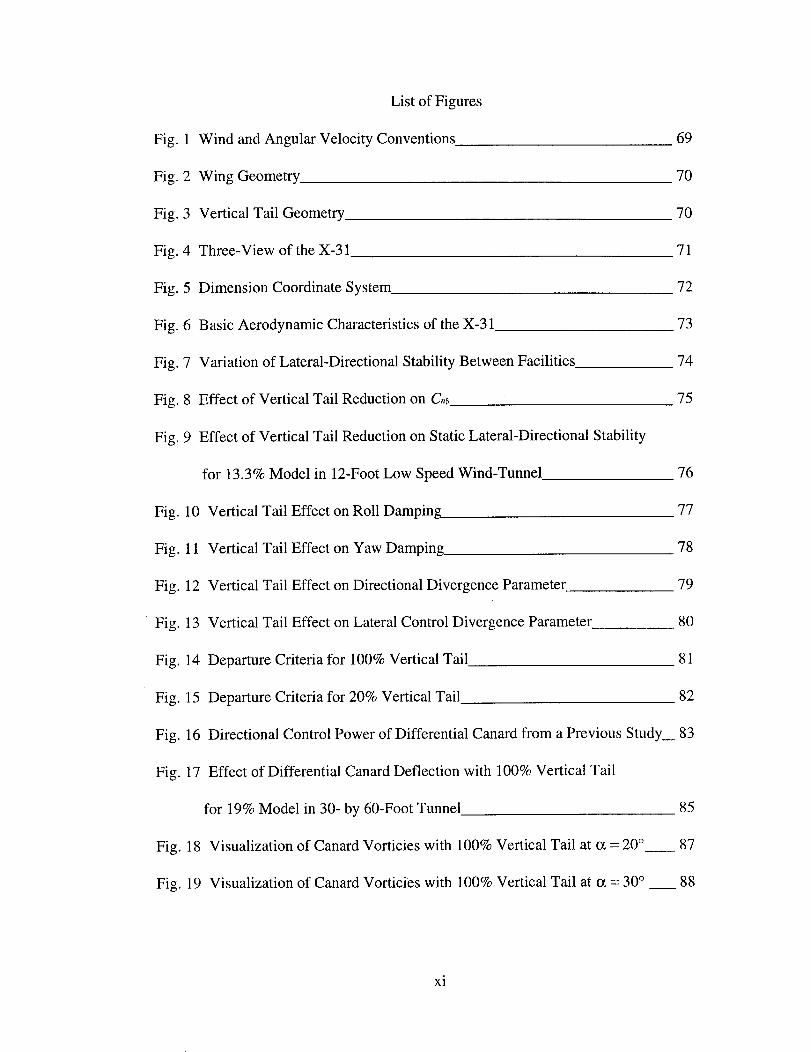
List of Figures
Fig. 1 Wind and Angular Velocity Conventions 69
Fig. 2 Wing Geometry. 70
Fig. 3 Vertical Tail Geometry 70
Fig. 4 Three-View of the X-31 71
Fig. 5 Dimension Coordinate System 72
Fig. 6 Basic Aerodynamic Characteristics of the X-31 73
Fig. 7 Variation of Lateral-Directional Stability Between Facilities 74
Fig. 8 Effect of Vertical Tail Reduction on Cn_ 75
Fig. 9 Effect of Vertical Tail Reduction on Static Lateral-Directional Stability
for 13.3% Model in 12-Foot Low Speed Wind-Tunnel 76
Fig. 10 Vertical Tail Effect on Roll Damping 77
Fig. 11 Vertical Tail Effect on Yaw Damping 78
Fig. 12 Vertical Tail Effect on Directional Divergence Parameter 79
Fig. 13 Vertical Tail Effect on Lateral Control Divergence Parameter 80
Fig. 14 Departure Criteria for 100% Vertical Tail 81
Fig. 15 Departure Criteria for 20% Vertical Tail 82
Fig. 16 Directional Control Power of Differential Canard from a Previous Study_ 83
Fig. 17 Effect of Differential Canard Deflection with 100% Vertical Tail
for 19% Model in 30- by 60-Foot Tunnel
Fig. 18
Fig. 19
Visualization of Canard Vorticies with 100% Vertical Tail at o_ = 20 °
Visualization of Canard Vorticies with 100% Vertical Tail at o_= 30 ° __
85
87
88
xi
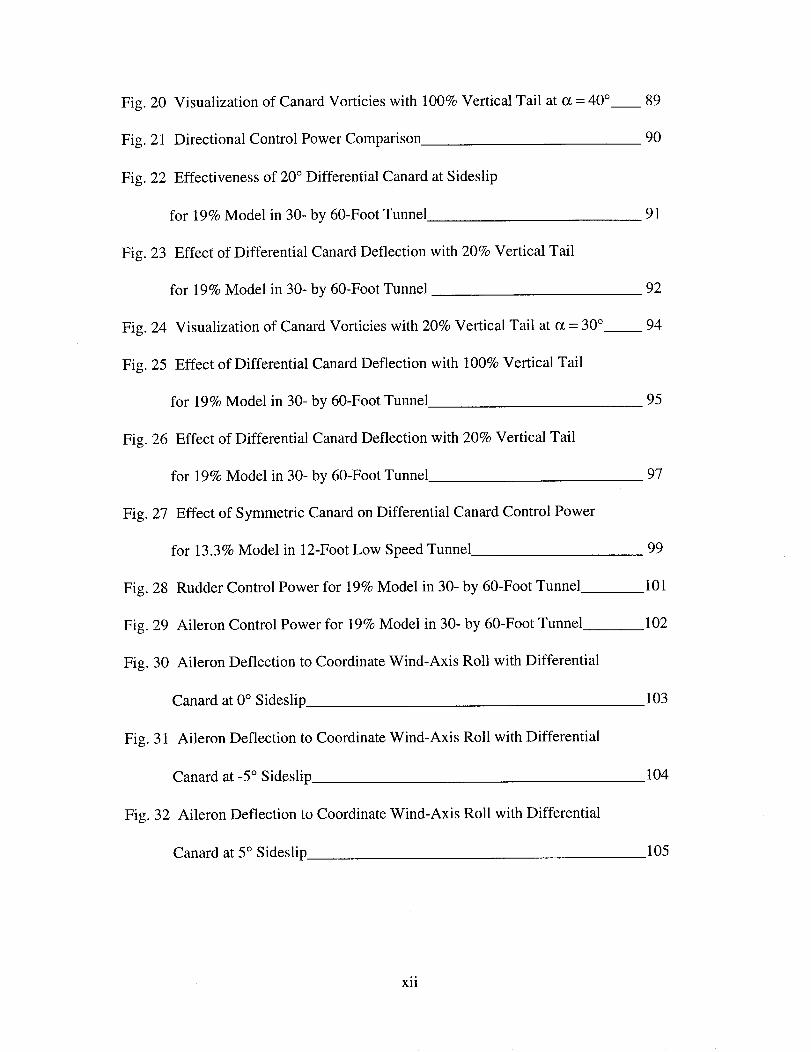
Fig. 20
Fig. 21
Fig. 22
Fig. 23
Visualizationof CanardVorticieswith 100%VerticalTail at o_= 40°_
DirectionalControlPowerComparison
Effectivenessof 20° DifferentialCanardatSideslip
for 19%Model in 30-by 60-FootTunnel
Effectof DifferentialCanardDeflectionwith 20%VerticalTail
for 19%Model in 30-by 60-FootTunnel
89
90
91
92
Fig. 24 Visualizationof CanardVorticieswith 20%VerticalTail at _ = 30°
Fig. 25 Effectof Differential Canard Deflection with 100% Vertical Tail
for 19% Model in 30- by 60-Foot Tunnel
Fig. 26 Effect of Differential Canard Deflection with 20% Vertical Tail
for 19% Model in 30- by 60-Foot Tunnel
Fig. 27 Effect of Symmetric Canard on Differential Canard Control Power
for 13.3% Model in 12-Foot Low Speed Tunnel
Fig. 28 Rudder Control Power for 19% Model in 30- by 60-Foot Tunnel
Fig. 29 Aileron Control Power for 19% Model in 30- by 60-Foot Tunnel
Fig. 30 Aileron Deflection to Coordinate Wind-Axis Roll with Differential
Canard at 0 ° Sideslip
Fig. 31 Aileron Deflection to Coordinate Wind-Axis Roll with Differential
Canard at -5 ° Sideslip
Fig. 32 Aileron Deflection to Coordinate Wind-Axis Roll with Differential
Canard at 5 ° Sideslip.
94
95
97
99
101
102
103
104
105
xii

Fig. 33 MaximumAvailableAerodynamicPitchingMoment
for 19%Model in 30-by 60-FootTunnel 106
Fig. 34 ControlDeflectionsUsedto Trim Model
Fig. 35 Trim Lift andDragEstimates
Fig. 36 DynamicPressureto Trim 550lbDropModel
Fig. 37 MaximumRoll RateBeforeInertialCouplingSaturatesPitchControls
Fig. 38 Drop ModelTestProcedure
Fig. 39 DropModelFlightCommandSystem
Right andLeft Rollsat _ = 50°
Fig. 41 Right andLeft Rollsat _ = 50°,DirectionalAxis
Fig. 42 Right and Left Rolls at a = 50 ° , Pitch Axis
Fig. 43 Right Roll at _ = 60 °
Fig. 44 Right Roll at _ = 60 °, Directional Axis
Fig. 45 Comparison of Wind-Tunnel Data and Drop Model Flight Test Results
Fig. 46 Tailless Drop Model: Departure at o_= 30 °
Fig. 40 Drop Model:
Drop Model:
Drop Model:
Drop Model:
Drop Model:
Fig. 47 Tailless Drop Model:
Fig. 48 Tailless Drop Model:
Fig. 49 Tailless Drop Model:
Fig. 50 Tailless Drop Model:
Fig. 51 Tailless Drop Model:
Fig. 52
Fig. 53
Departure at _ = 30 °, Directional Axis
Departure at ¢z = 30 °, Pitch Axis
Departure at a = 20 °
Departure at a = 20 °, Directional Axis
Departure at o_= 20 °, Pitch Axis
Drop Model Simulation: Right and Left Rolls at o_= 50 °
Drop Model Simulation: Right and Left Rolls at _x= 50 ° , Pitch Axis
107
108
109
110
111
112
113
114
115
116
117
118
119
120
121
122
123
124
125
126
.o.
Xlll
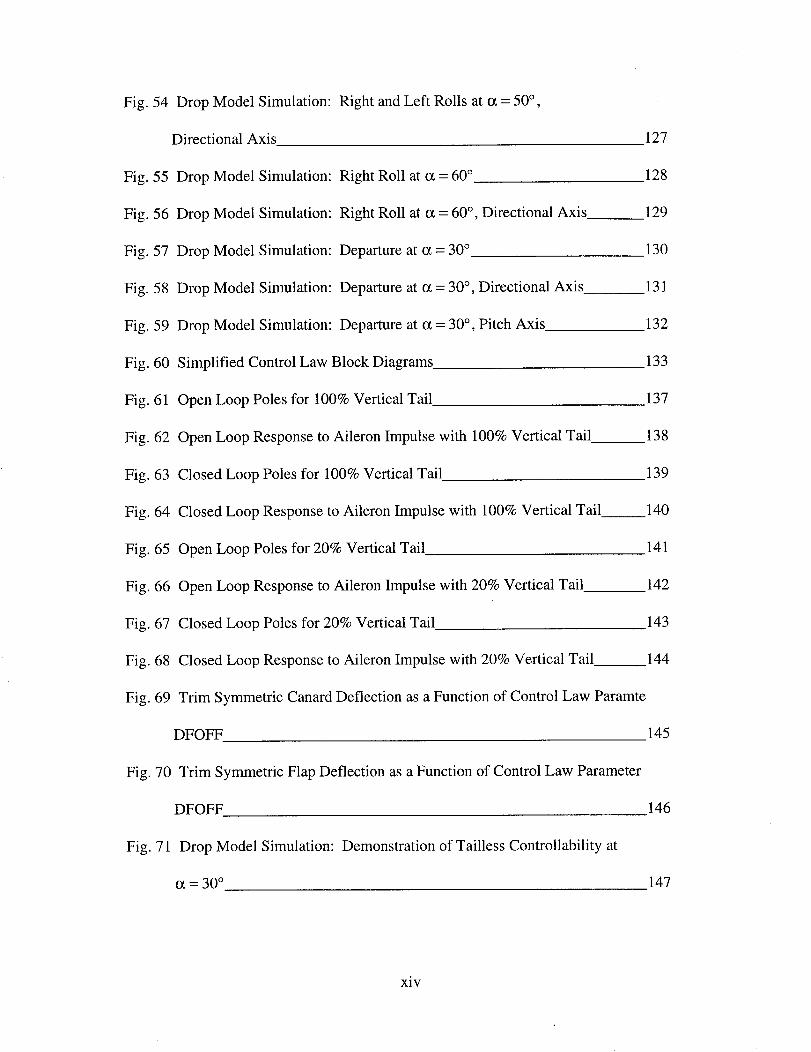
Fig. 54
Fig. 55
Fig. 56
Fig. 57
Fig. 58
Drop Model Simulation:
Directional Axis
Drop Model Simulation:
Drop Model Simulation:
Drop Model Simulation:
Drop Model Simulation:
Fig. 59 Drop Model Simulation:
Right and Left Rolls at ot = 50 ° ,
127
Right Roll at o_= 60 °
Right Roll at c_ = 60 °, Directional Axis
Departure at ot = 30 °
Departure at o_= 30 °, Directional Axis
Departure at _ = 30 °, Pitch Axis
128
129
130
131
132
Fig. 60 Simplified Control Law Block Diagrams
Fig. 61 Open Loop Poles for 100% Vertical Tail
Fig. 62 Open Loop Response to Aileron Impulse with 100% Vertical Tail
Fig. 63 Closed Loop Poles for 100% Vertical Tail
Fig. 64
Fig. 65
Fig. 66
Fig. 67
Fig. 68
Fig. 69
Closed Loop Response to Aileron Impulse with 100% Vertical Tail
Open Loop Poles for 20% Vertical Tail
Open Loop Response to Aileron Impulse with 20% Vertical Tail
Closed Loop Poles for 20% Vertical Tail
Closed Loop Response to Aileron Impulse with 20% Vertical Tail
133
137
138
139
140
141
142
143
144
Trim Symmetric Canard Deflection as a Function of Control Law Paramte
DFOFF 145
Fig. 70 Trim Symmetric Flap Deflection as a Function of Control Law Parameter
DFOFF 146
Fig. 71 Drop Model Simulation: Demonstration of Tailless Controllability at
o_= 30 ° 147
xiv

Fig. 72 Drop Model Simulation:
o_= 25 °
Demonstration of Tailless Controllability at
148
Fig. 73 Drop Model Simulation: Demonstration of Tailless Controllability at
= 20 ° 149
Fig. 74 Time History of Flare From _ = 20 ° to cz = 30 ° 150
XV

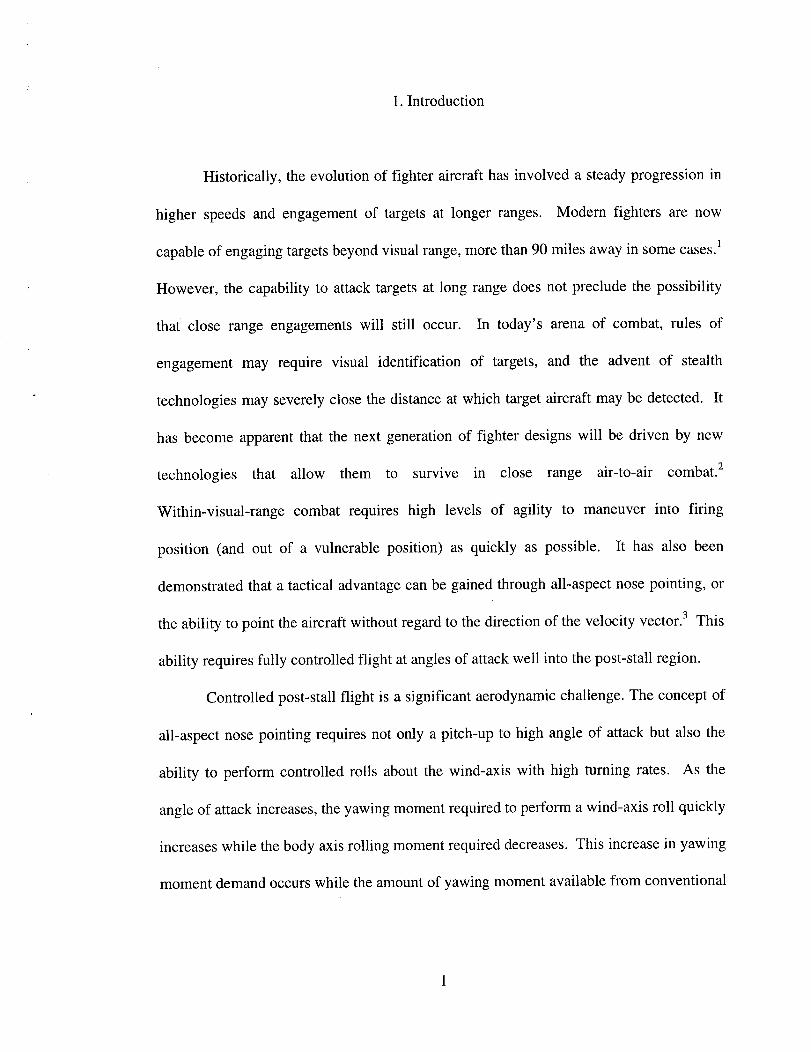
1. Introduction
Historically, the evolution of fighter aircraft has involved a steady progression in
higher speeds and engagement of targets at longer ranges. Modern fighters are now
capable of engaging targets beyond visual range, more than 90 miles away in some cases. 1
However, the capability to attack targets at long range does not preclude the possibility
that close range engagements will still occur. In today's arena of combat, rules of
engagement may require visual identification of targets, and the advent of stealth
technologies may severely close the distance at which target aircraft may be detected. It
has become apparent that the next generation of fighter designs will be driven by new
technologies that allow them to survive in close range air-to-air combat. 2
Within-visual-range combat requires high levels of agility to maneuver into firing
position (and out of a vulnerable position) as quickly as possible. It has also been
demonstrated that a tactical advantage can be gained through all-aspect nose pointing, or
the ability to point the aircraft without regard to the direction of the velocity vector. 3 This
ability requires fully controlled flight at angles of attack well into the post-stall region.
Controlled post-stall flight is a significant aerodynamic challenge. The concept of
all-aspect nose pointing requires not only a pitch-up to high angle of attack but also the
ability to perform controlled rolls about the wind-axis with high turning rates. As the
angle of attack increases, the yawing moment required to perform a wind-axis roll quickly
increases while the body axis rolling moment required decreases. This increase in yawing
moment demand occurs while the amount of yawing moment available from conventional
means (e.g. rudders) is decreasing becauase the vertical tails and rudders are immersed in
the low energy wake of the wing and fuselage. This problem can be compounded by
asymmetric vortices which may develop around the forebody at high angles of attack. 4
The yawing moment produced by these flow asymmetries would place a further demand
on the lateral-directional controllability which can limit the turning rates available or even
cause a nose-slice departure where the asymmetry exceeds the available yaw control
authority and the aircraft diverges into a possible spin entry condition. 5
Another factor which has recently become a major driver in fighter design is
stealth technology. 6 Key to the radar cross section and visual observability is the profile
silhouette and the vertical tail is one of the major contributors to this profile] This has
created an interest in aircraft designs with reduced vertical tails or no vertical tail at all
(e.g. the B-2 aircraft), and the unconventional yaw controls required to stabilize these
designs.
Elimination of the need for a vertical tail surface would add a new element of
design freedom which could be exploited for improved performance. For example total
aircraft weight could be reduced by removing the vertical tail surface provided the
method used to generate yaw control weighs less than the vertical tail and rudder control
components. Possibly trim drag could be reduced resulting in better cruise efficiency.
Since, as stated previously, the vertical tail surfaces tend to lose effectiveness in
the wake of the wings, reducing the vertical tail surfaces may not strongly affect the
stability of the aircraft at high angles of attack. However, excursions into the post-stall
regime are expected to be infrequent and of short duration. Most flying, particularly

take-offandlanding,will still takeplaceat loweranglesof attackwheretheverticaltails
andruddersarereliedon for lateral-directionalstabilityandcontrol.
The ineffectivenessof verticalsurfacesat high anglesof attackandthe desireto
reduceor removethem for stealthor performancereasonshascreatedan increasing
demandfor alternateyaw control methods. Recentstudieshavelooked into forebody
vortex controls suchas nozzleblowing or actuatedstrakes,s but thesemethodshave
focusedon thepost-stallregime. Manyhigh-angle-ofattackflight programshaverelied
on thrust vectoringto achieveyaw control power, and it hasbeenshownthat thrust
vectoringshouldbe sufficientto providedirectionalstability at low anglesof attackfor
aircraftwith reducedverticaltails.7'9However,thesemethodsrequirefunctioningthrust
vectoringactuatorsand enginesoperatingat high levelsof thrust. If a failure wereto
occurin eitherof thesesystems,theaerodynamicinstabilityof thetaillessairframescould
createan unrecoverablesituation, and an alternateform of yaw control to provide
redundancywouldbedesirable.
This study investigatesdifferential canardcontrol--apurely aerodynamicyaw
control methodwhich maybe availablefor futureaircraftdesigns.Previousstudies1°:1
haveshownthat differential deflectionof canardsurfaceshasthe potentialto produce
significantyawingmoments,andin thisstudy,thispotentialis investigatedin somedetail
for a particularairframe,the X-31. First theeffectof reducingor removingthe vertical
tail from theX-31 asstudiedin wind-tunneltestswill bedescribed.Thedatafrom these
tests are applied to the linear equationsof motion as well as divergencecriteria to
determinethe influenceof the verticaltail on the controllability of the aircraft. Then
wind-tunneldatademonstratingthe control power of differential canarddeflectionare
presentedto qualify the effectivenessof differentialcanardsasa yaw controller. With
that information, the differentialcanardcontrol authorityis considered,alongwith the
other aerodynamiccontrolsavailableto determinewhetheryaw, roll, or pitch control
would saturatefirst to becomethe limiting factorfor turn performance.The resultsof
drop model flight testsare shownto correlatewith the wind-tunnel predictionsfor
differentialcanardcontrolpowerandcontrollabilitywith reducedvertical tail. Finally, a
simulator study is described which demonstrates the success of the
six-degree-of-freedom,nonlinearsimulation in predicting drop model behavior, and
control laws aredevelopedfor that simulationto control the X-31 with its vertical tail
removed.

2.TheX-31
TheX-31 is a lightweight,experimentalfighterdesignedaspart of theEnhanced
Fighter Maneuverability program to study the tactical advantagesof post-stall
maneuvering. It is a deltawing-canardconfigurationwith a single vertical tail and a
single enginewith three thrust vectoring vanes. The X-31 has a low wing with a
planformillustratedin Fig.2. Thewing hasapair of leadingedgeflaps,segmentedatthe
point of the changein leadingedgesweep,which areusedfor high-angle-of-attacklift
augmentation.The wing alsohasa pair of trailing edgedeviceson eachside. These
surfacesarenormallyusedtogetherasif theywerea singlepair of flaperonsfor pitch and
roll and will be referredto in this paperasthe flaps (symmetricdeflection)and the
ailerons(asymmetricdeflection).Thesingleverticaltail on theX-31 is shownin Fig. 3.
The X-31 has had a very successfulflight test program and has performed
extremelywell throughoutits flight envelopewhich includesanglesof attackashigh as
70 deg. Recently,interestwas raisedin using the thrust vectoring systemnormally
reservedfor post-stallcontrolto stabilizetheX-31 with a reducedvertical tail. In fact,
flight testswereconductedusingthe quasi-taillesstechniquein which theflight control
systemusesdestabilizingfeedbackto therudderto simulatea reducedtail aircraft;these
testsdemonstratedthat thrustvectoringshouldbesufficient to control the X-31 with a
reducedvertical tail.9 However,completerelianceon thrustvectoringfor stability on a
singleengine aircraftcreatesa situationwherea singlestring failure could eliminate
controllability. This report investigates the use
redundancy and satisfy this flight safety issue.
of differential canard to provide
The results described in this study were obtained using a 13.3% scale model of the
X-31 in Langley's 12-Foot Low Speed Tunnel, a 19% scale model in Langley's 30- by
60-Foot Tunnel, and a 27% dynamically scaled drop model. A three-view drawing of the
X-31 is shown in Fig. 4, and the dimensions of its primary components are described in
Tables 1 and 2, in which the coordinate system used for dimensions declared as FS, BL,
or WL is illustrated in Fig. 5. Table 3 lists the relationship between full scale and
dynamically scaled models for various dimensional quantities.
The all-moving canards are normally only deflected symmetrically, for pitch
control, but because this paper will investigate the effect of asymmetrically deflected
canard surfaces, the deflections of the canards include both symmetric and differential
deflections. Canard deflections are given in degrees with trailing edge down deflections
considered positive. Symmetric canard deflection, 8c, is defined as (right canard + left
canard)/2, and differential deflection of the canard will be referred to as _dc which is
defined as (right canard - left canard)/2.
The position of the leading edge flaps is given in this paper in degrees of leading
edge down deflection normal to the hinge line as (inboard)/(outboard).
The positions of the trailing edge devices referred to in this paper will be given for
flaps and ailerons separately where flap deflection, _Sf, is defined as (right trailing edges +
left trailing edges)/2 and aileron deflection, 5a, is defined by (right trailing edges - left
trailing edges)/2. The anglesgiven are in degreesof deflectionwith positive being
trailingedgedownfor eachsurface.
Unlessstatedotherwise,thebaselineconfigurationas it wastestedfor this study
had the following characteristics,wherethenamesof specificcomponentsusedduring
theoriginalwind-tunneltestingarespecifiedin parentheses:
SymmetricCanards,_5c:-40(40degsymmetrictrailingedgeup).
LeadingEdgeFlaps: 40/32(40deginboard,32degoutboardleadingedgedown).
TrailingEdgeFlaps,5f: 0 (0degsymmetricdeflection).
Ailerons,5a: 0 (0degsymmetricdeflection).
NoseBoom: (J13)projectsto -79.2FSwith -4degincidence.
LeadingEdgeStrakes:(M86)about5.3incheswide,extendingforwardto 148FS
from theleadingedgesof thewingssimilarto a leadingedgeextension.
NoseStrakes:(5B)0.6 incheswideby 20 incheslong.
Aft Strakes:6 incheswideby 65 incheslong. Theyareplacedat an incidenceof
11degwith nodihedral.
Inlet Lip: closed(0 deflection).
ThrustVectoringVanes:nominalposition.
NoseRadius:0.6"
Fig. 6 showsthe basiclongitudinalareodynmaiccharacteristicsof the X-31 as
tested with the 19% scalemodel in the 30- by 60-FootTunnel with two different
symmetriccanardsettings.TheX-31hasamaximumlift coefficient, CL max, of about 1.2
7
at 32 deg angle of attack. This configuration is designed to be statically unstable in
trimmed, subsonic flight at low angles of attack in order to improve transonic
performance.
The full series of data for the effect of incremental vertical tail reduction on
lateral-directional static stability is only available from the 12-Foot Low Speed Tunnel, so
a comparison of the results between the separate tests is made in Fig. 7. The figure shows
good agreement in the data for Ct_ and CY, throughout the angle-of-attack range and in
Cn_ for angles of attack above 60 deg and below 40 deg. In the range from 40 to 60 deg
angle of attack, however, the results from the 13.3% scale model test are shown to be
significantly more stable in static directional stability, C,_, than the 19% scale model test.
Because of this discrepancy, stability analyses are made based on data from the test in the
30- by 60-Foot _lunnel where superior flow quality and model accuracy produce results
more representative of the full scale aircraft. Fig. 8 shows that the change in C,_ which
occurs when the vertical tail is reduced from 100% to 20% does correlate well between
the separate wind-tunnel tests. Therefore, the data from the full series of vertical tail
sizes from the 13.3% scale model test will be shown with the understanding that the
incremental effect of each step in the vertical height reduction would be expected to
correlate with data obtained for the 19% scale model in the larger wind-tunnel.
3. VerticalTail Reduction
Thelateral-directionalstabilityof theX-31 aircraft in its basicconfigurationwith
100%vertical tail has regionsof instabilityboth in static directionalstability, C,_, and
dihedral effect, Ct_. As can be seen in Fig. 7, the X-31 is directionally stable at angles of
attack below 20 deg and between 32 deg and 45 deg. On the other hand, Ct_ is stable
except at angles of attack below 10 deg where a very slight instability can be seen. The
X-31 was not originally designed with the intention of removing its vertical tail and
rudder, and with the directional stability already negative in some regions, there is some
concern about the impact of the reduction of the vertical tail surface. To address this
issue, the vertical tail surface was reduced in several stages and tested to assess the
contribution of each section to the overall lateral-directional stability. The vertical tail
was reduced by cutting the tail along a horizontal line at a given height as shown in
Fig. 3, and is expressed in terms of percent of the full size tail. The tail height is
measured from the bottom of the spin chute compartment which itself represents 20% of
the total vertical tail. It may be noted that the spin chute housing is an integral part of the
airframe and is not likely to be removed from the full scale aircraft; therefore, methods to
control the "tailless" aircraft were tested with 20% vertical tail surface. The spin chute
housing was removed for the purposes of the wind-tunnel testing only and is shown as the
0% tail configuration.
9

3.1 StaticWind-TunnelTesting
Fig. 9 showstheeffectonstaticlateral-directionalstability of stepwisereduction
of the verticaltail surface.At 0 degangleof attacktherelationshipbetweenverticaltail
heightand C,_ is highly linear. Cn_ varies from almost 0.002 with the full tail to almost
-0.004 with no tail at all, crossing the stability boundary between 80% and 60% tail. By
15 deg angle of attack, however, the contribution of the lowest 40% of the tail is no
longer significant. Surprisingly, at angles of attack between 24 deg to 34 deg, the 20%
and 0% configurations are actually more stable than even that with 60% vertical tail;
which may be due to a cross flow at the vertical tail location, but this phenomenon was
not studied further. At 50 deg angle of attack, the vertical tail becomes completely
immersed in the wing wake, and any contribution to C,_ is essentially negligible. In fact,
the minimal effect of the vertical tail appears to be destabilizing in this angle of attack
range.
The impact of the vertical tail reduction on C_ is more predictable. In the low
angle of attack range from 0 deg to 30 deg there appears to be a linear relationship
between Ct_ and vertical tail height from 100% down to 40% below which the
contribution is minimal. At angles of attack above 30, the vertical tail does not have a
significant effect on C_.
In the high angle of attack range from 40 deg to 70 deg, which is within the flight
envelope of the X-31, the data in Fig. 9 showed that reduction of the vertical tail caused
no detriment in performance since it is completely blanketed behind the wing. In the low
angle of attack range from 0 deg to 20 deg, however, it is seen that reducing the tail
10

would be extremely destabilizing. To maintain positive levels of Cn_, at least 80% of the
vertical tail height must be intact. Further reduction of the tail would create the need for
augmentation of the lateral-directional stability through some other means. As reduction
of the vertical tail height necessarily means reduction of the rudder as well, some control
method other than the conventional rudder would be required in order to achieve the 20%
tail, which is the goal for the "tailless" configuration. It has been shown that the thrust
vectoring system already in use on the X-31 should be sufficient to maintain controlled
flight without the vertical tail, 9 but flight safety issues prohibit total reliance on thrust
vectoring for stability. It would therefore be desirable to have an alternate method of
control to provide redundancy in the event of an engine or vectoring failure.
3.2 Forced Oscillation Wind-Tunnel Testing
The effect of the vertical tail on the static stability parameters was shown to be
quite profound, but the effects on dynamic stability are also of importance. Forced
oscillation wind-tunnel tests were conducted with the 19% scale model in the 30- by
60-Foot Tunnel to study the influence of the vertical tail on the dynamic
lateral-directional stability. Fig. 10 shows that the vertical tail's contribution to roll
damping, C_,, is decidedly minimal, however as would be expected, Fig. 11 shows that
the yaw damping, Cnr, is greatly reduced below 30 deg angle of attack by removing the
vertical tail. Rather surprising are the results from 32 deg to 65 deg angle of attack which
show that reduction of the vertical tail actually improves the yaw damping somewhat.
This could be due to a cross flow phenomenon at the vertical tail, but since this does not
11

correlateto asimilareffectin thestaticstability,it is morelikely dueto anunsteadyflow
effect.
3.3 Equationsof Motion
To interprettheoveralleffectonlateral-directionalstabilityof theverticaltail, the
linearized,decoupledequationsof motion(Reference12)will now be analyzedfor both
the 100%and20%verticaltails. Thesideforceequation
m( 9 + U or - W op ) = mg sin(_)) cos(00) + Y,
solved for the time rate of change of the y component of airspeed is
Y9 = g sin(C) cos(00) - Uor +Wop +--.
m
Differentiating the relation
vsin(J3) = --
Vr
results in the expression
- vf'TCOS([_)P
V2T
Applying the small angle assumption to ¢ and assuming that l)'r = 0 to decouple the
lateral-directional part of the equation, this expression becomes
[__ g cos(00) U0 Wo YVr0cos(_) ¢ Vrocos(_) r-t Vrocos([3) p-_ mVrocos([3)"
Applying the small angle assumption to 13, this can be reduced to
COS(00) Y[}- g ¢ + sin(a0)p- cos(ao)r +--.
Vro mVro
12
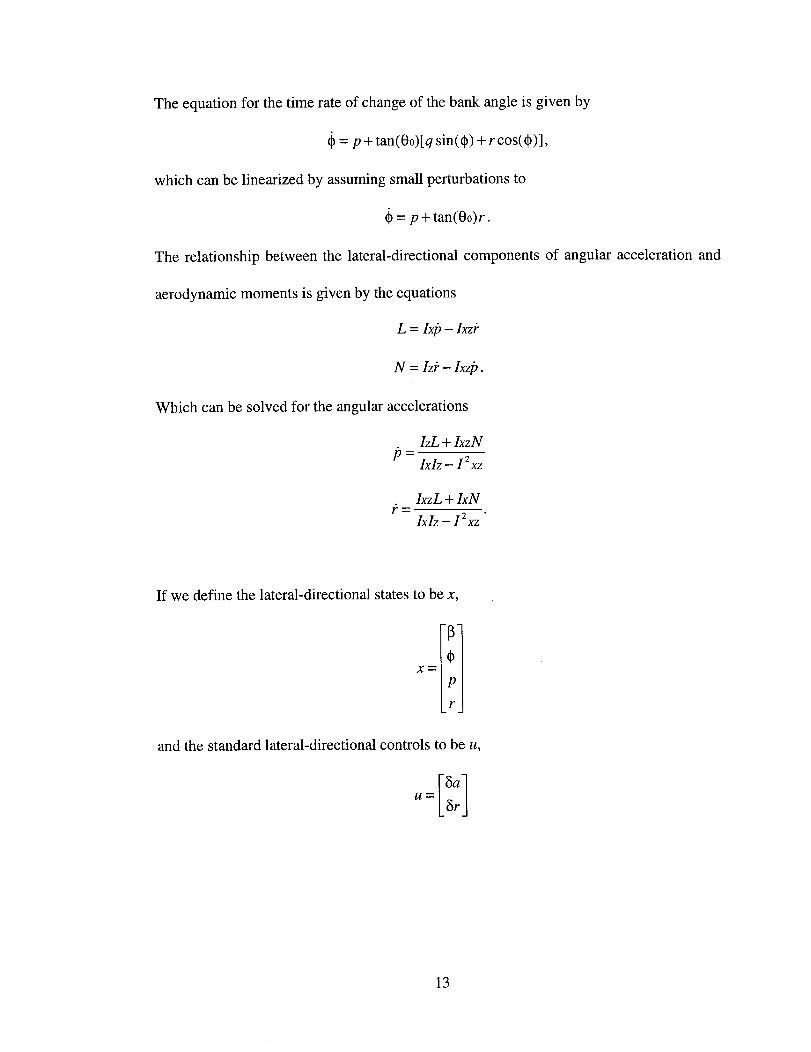
The equation for the time rate of change of the bank angle is given by
= p + tan(O0)[q sin(q) + r cos(_)],
which can be linearized by assuming small perturbations to
= p + tan(O0)r.
The relationship between the lateral-directional components of angular acceleration and
aerodynamic moments is given by the equations
L = Ixp- Ixzi"
N = Izi"- Ixz[9.
Which can be solved for the angular accelerations
IzL + IxzNp-
Ixlz - I Zxz
IxzL + IxNi'-
Ixlz- I2xz "
If we define the lateral-directional states to be x,
and the standard lateral-directional controls to be u,
ISalU _ _F
13

we can write the full decoupled, linearized, lateral-directional equations of motion as
follows:
YI_ gcos(00) YP _-sin(ot0) Yr-cos(s0)mVro Vr0 mVro mV_o
0 0 1 tan(0o)
IzL_ + IxzN_ 0 IzLp + IxzNp IzLr + IxzNrIxlz- I2xz Ixlz- I2xz Ixlz- I2xz
IxzL_ + IxNf_ Ixz_v + IxNp IxzL + IxNr0
IxIz- I2xz Ix/z-/2XZ IxIz- I2xz
Y_a
mVro0
x + IzL_, + IxzNa,,
Ixlz- I2xzIxzL_ + IxN_,
Ixlz- I2xz
Y_r
m Vro0
IzLs_ + IxzNs,.
Ixlz- 12xz
IxzLsr + IxN_t
Idz- I2xz
As will be shown later, the "tailless" X-31 was controlled in flight simulation
down to 20 deg angle of attack. Therefore this example will be carried out for this flight
condition. With the baseline configuration previously described, the wind-tunnel data
shows the following stability derivatives at 20 deg angle of attack:
Vertical Tail
100% 20%
C_ (1/deg) -0.00204 -0.000180
Cn_ (1/deg) 0.00295 -0.00374
CY_ (1/deg) -0.0180 -0.0124
C_p (1/rad) -0.228 -0.254
C,, (1/rad) -0.0260 -0.142
CY, (1/rad) 0.0732 0.405
Ctr (1/rad) 0.328 0.303
C,, (1/rad) -0.830 -0.00780
Crr (1/rad) 1.40 -0.321
Cv_, (1/deg) 0.00271
Ct_, (1/deg) -0.00287
C,,_, (1/deg) -0.000445
CYs_ (1/deg) 0.00202
Ct_r (1/deg) 0.000327
C,,_ (1/deg) -0.00126
14
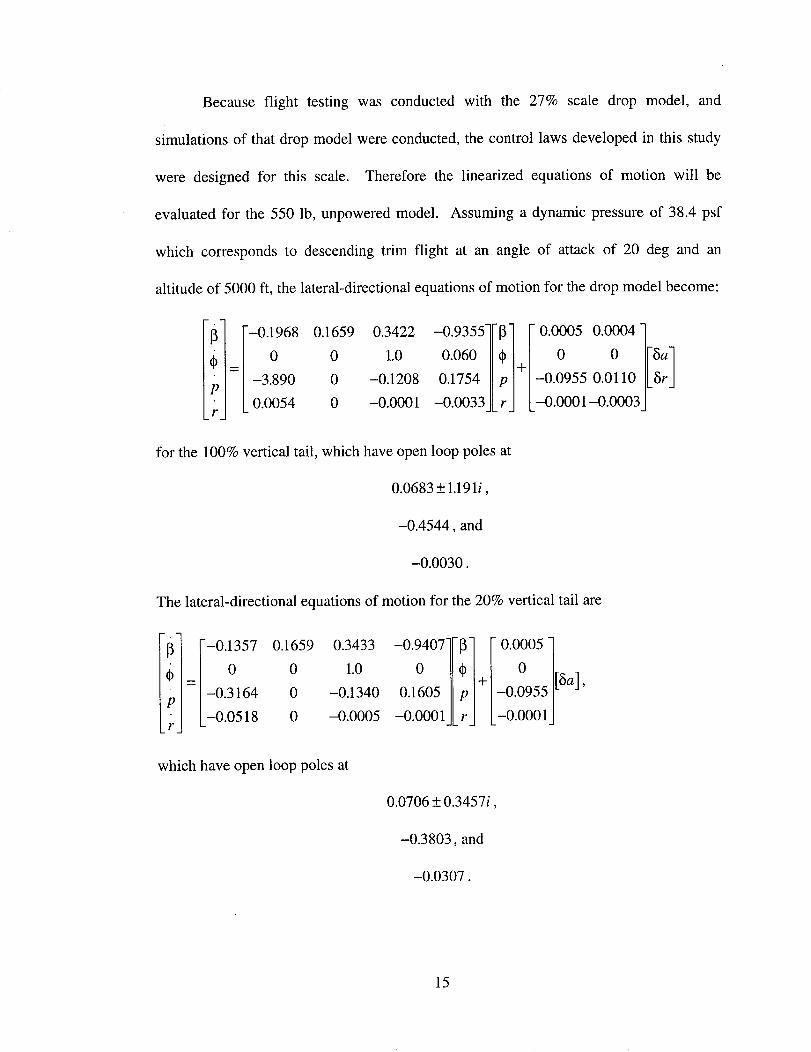
Because flight testing was conducted with the 27% scale drop model, and
simulations of that drop model were conducted, the control laws developed in this study
were designed for this scale. Therefore the linearized equations of motion will be
evaluated for the 550 lb, unpowered model. Assuming a dynamic pressure of 38.4 psf
which corresponds to descending trim flight at an angle of attack of 20 deg and an
altitude of 5000 ft, the lateral-directional equations of motion for the drop model become:
i
--0.1968 0.1659 0.3422
0 0 1.0
-3.890 0 -0.1208
0.0054 0 -0.0001
-0.9355]II] ] F 0.0005 0.0004 ]
0.060//,/+/ o o /F al0.1754/?/ / oo o/LSrJ
-o.oo33JL rJ L-o.oool-o.ooo3J
for the 100% vertical tail, which have open loop poles at
0.0683 + 1.191i ,
-0.4544, and
-0.0030.
The lateral-directional equations of motion for the 20% vertical tail are
- . °
_ =[-0"135700.165900.34331.0 -°94°7lF_loIt,l+p -0.3164 0 -0.13400.1605 liP/• -0.0518 0 -0.0005 -o.ooolAE r J
F
0.0005 ]
-0.O001J
which have open loop poles at
0.0706 + 0.3457i ,
-0.3803,and
-0.0307.
15

Therefore, with the loss of the vertical tail, the unstable mode has been further
destabilized. This is indicated both the the movement of the unstable pair away from the
imaginary axis as well as the significant reduction of unstable damping ration. As will be
shown later, the effect on the closed loop poles due to the loss of the rudder further
compounds the problem.
3.4 Dynamic Divergence Parameters
In addition to the static and dynamic aerodynamic derivatives, there are two
calculated parameters, the directional divergence parameter C,_. +n and the lateral control
been successful at predicting departuredivergence parameter LCDP, which have
susceptibility. 13
Iz Cl_sin(a)Cn_,dy. = C._cos(cz) Ix
_ ( C._ + KsRIC._.
LCDP = C_- C'_-C-_I_,_ ]
where KsR_ refers to the roll stick to rudder interconnect gain. Fig. 12 shows the values
of C,_,dyn for the X-31 with both the 100% and 20% vertical tails, and the values of LCDP
are shown in Fig. 13. The values of C,,_.dy,, are plotted against the corresponding LCDP
for the 100% vertical tail in Fig. 14 and the 20% vertical tail in Fig. 15. As these figures
of the departure criteria described in reference 13 show, the X-31 with 100% vertical tail
is expected to be departure free until the loss of rudder control effectiveness at 50 deg
angle of attack results in a negative LCDP where a "mild initial yaw departure followed
by roll reversal" is expected. For the case of the 20% vertical tail, however, the loss of
16

the rudder has resulted in a negative LCDP over nearly the entire range of angle of attack.
This is expected to produce a "mild initial yaw departure followed by roll reversal" at the
higher angles of attack, but below 25 deg angle of attack, C._, ay. becomes negative with
the loss of the vertical tail, and a "strong directional divergence with roll reversal" is
anticipated.
It is evident that some kind of yaw control device will be required to stabilize the
tailless X-31 throughout the angle-of-attack range, and with 100% vertical tail, the
yawing moment capability will have to be augmented in order to prevent departures
above 45 deg angle of attack. Whereas the full-scale aircraft relies on thrust vectoring to
generate additional yawing moments, this paper investigates the possibility of using
differential deflection of the canards to produce the required yawing moment
aerodynamically.
17

4. Wind-TunnelTestingof DifferentialCanardControl
The X-31 hasa pair of canardswhich arenormally deflectedsymmetricallyfor
pitchcontrol,but thefact thattheymovein thesamedirectionis merelythe resultof the
flight control system. On thefull scaleaircraft,thereexist separateactuatorswhich are
capableof driving thecanardsindependentlyof eachother. It hasbeenshownin previous
studiesthat asymmetricallydeflectedcanardscan createyawing momentson other
aircraft._°'l_ Thesestudiesdemonstratedthat configurationswith tall fuselageshapesat
the position of the differential canardshowedhigherdifferential canardcontrol power
thanthosewith wide fuselages.Thesimilarity in thefuselageshapesbetweentheX-31
andconfigurationA in Fig. 1611pointsto the strongpossibilitythat differentialcanards
wouldbeeffectiveasayawcontrollerontheX-31.
If asymmetricdeflectionof thecanardsproducessignificantyawingmoments,it is
possible that they may be used as a lateral-directionalcontrol on the X-31 with a
minimumof modificationto theactualaircraft. Differential canarddeflectionwastested
initially in the 12-FootLow SpeedTunnel. Combinationswhich showedpromisewere
testedmorethoroughlyin the30-by 60-FootTunnel,andtheresultsshownarefrom this
latter test.
The dataof Fig. 17show theresultsof deflectingthe left (port) canardtrailing
edgeup andtheright (starboard)canardtrailingedgedownby equalamountsawayfrom
the baseline-40 degsymmetriccanarddeflectionwith the full sizeverticaltail in place.
In the low angleof attackrange(0 deg to 20 deg), a significant amountof negative
18

yawing moment is produced. The data show no dead band down to differential
deflectionsas small as5 degandcontrol powerwhich remainsunsaturatedat 30 deg.
Theamountof controlpoweravailabledoesvaryhighlywith angleof attackevenwithin
this range. The30deg8dc caseproducesnegativeACn which improves from -0.015 at
0 deg alpha to -0.03 at 20 deg angle of attack.
The resulting incremental pitching moment, ACre, in this angle-of-attack range
does not become significant until 20 deg deflection. However, any deflection creates a
small, positive rolling moment, ACt which increases as ACn does with angle of attack to
a peak of 0.0075 for the 30 deg 8dc case.
At higher angles of attack (40 deg to 80 deg), Fig. 17 shows yawing moments far
greater than those seen in the low angle of attack range. The 30 deg 8dc case produces
AC, z from -0.05 at 40 deg angle of attack to -0.06 at 80 deg with a peak of -0.09 at 60 deg
angle of attack. As was the case in the low angle of attack range, the data shows no dead
band with differential deflections as small as 5 deg and no saturation with 30 deg.
As with the low alpha case, the resulting rolling moments, although they are
adverse in this range, only reach -0.075. The pitch up effect with 20 deg or more
deflections is smaller than that seen at low angle of attack and fades away completely by
65 deg angle of attack.
The angle of attack range from 20 to 40 deg shows a distinct loss of yaw control
power particularly near stall where ACn becomes virtually negligible. Based on the data
in some of the other curves within Fig. 17, it is curious that this minimum in AC_ occurs
at the same time as a maximum in the sideforce, ACY. This indicates that while
19
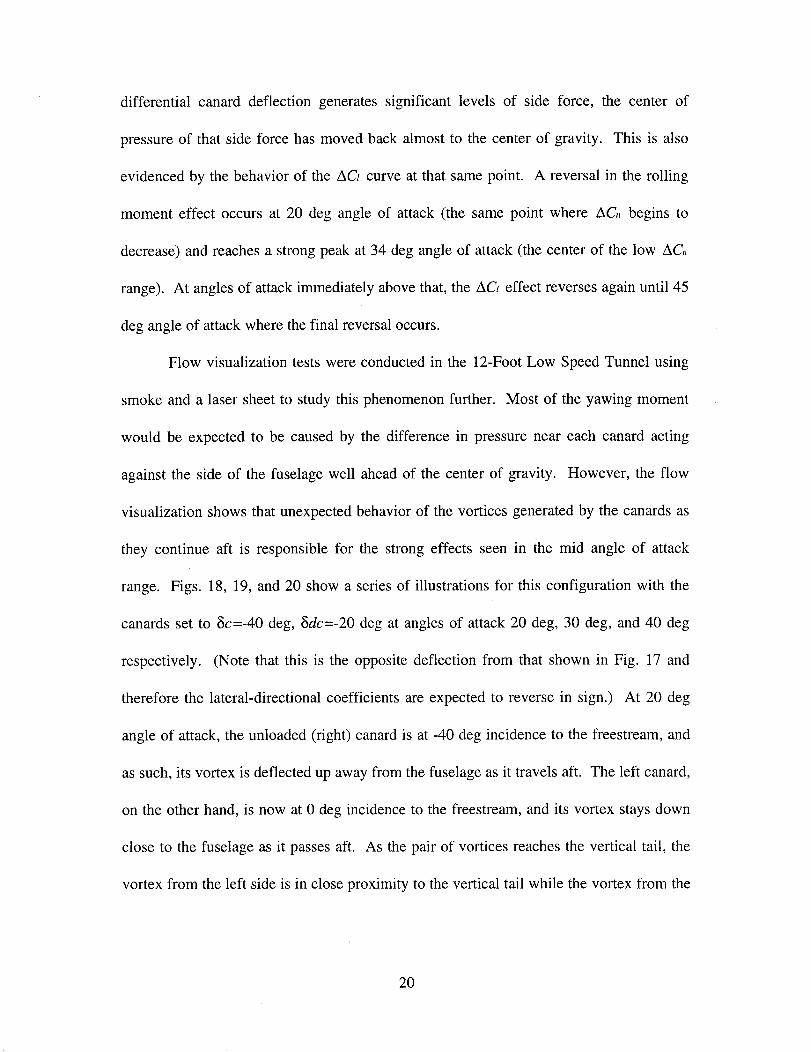
differential canarddeflectiongeneratessignificant levels of side force, the centerof
pressureof that sideforcehasmovedbackalmostto thecenterof gravity. This is also
evidencedby thebehaviorof the ACt curve at that same point. A reversal in the rolling
moment effect occurs at 20 deg angle of attack (the same point where AC, begins to
decrease) and reaches a strong peak at 34 deg angle of attack (the center of the low AC,
range). At angles of attack immediately above that, the ACt effect reverses again until 45
deg angle of attack where the final reversal occurs.
Flow visualization tests were conducted in the 12-Foot Low Speed Tunnel using
smoke and a laser sheet to study this phenomenon further. Most of the yawing moment
would be expected to be caused by the difference in pressure near each canard acting
against the side of the fuselage well ahead of the center of gravity. However, the flow
visualization shows that unexpected behavior of the vortices generated by the canards as
they continue aft is responsible for the strong effects seen in the mid angle of attack
range. Figs. 18, 19, and 20 show a series of illustrations for this configuration with the
canards set to 5c=-40 deg, 8dc=-20 deg at angles of attack 20 deg, 30 deg, and 40 deg
respectively. (Note that this is the opposite deflection from that shown in Fig. 17 and
therefore the lateral-directional coefficients are expected to reverse in sign.) At 20 deg
angle of attack, the unloaded (right) canard is at -40 deg incidence to the freestream, and
as such, its vortex is deflected up away from the fuselage as it travels aft. The left canard,
on the other hand, is now at 0 deg incidence to the freestream, and its vortex stays down
close to the fuselage as it passes aft. As the pair of vortices reaches the vertical tail, the
vortex from the left side is in close proximity to the vertical tail while the vortex from the
2O

other side has been deflected away from the vertical tail. The low pressure field of this
vortex results in a negative sideforce acting at the vertical tail for a positive change in the
yawing moment (and a negative rolling moment). As the angle of attack is increased to
30 deg, the vortex from the right side still passes well above the aft portion of the aircraft,
but the vortex originating from the left canard can be seen to actually cross over the
fuselage where it is now impinging on the opposite side of the vertical tail. This results in
a reversal of the sideforce acting at the vertical tail which accounts for the loss of yawing
moment as well as the sign reversal in the rolling moment. Finally, by 40 deg angle of
attack, the vortex from the left canard has crossed back to the left side of the vertical tail,
restoring the positive yawing moment. As further evidence of the impact of the canard
vortex interaction with the vertical tail, it will be shown hereafter that removal of the
vertical tail eliminates both the loss of yawing moment and the reversal in the rolling
moment for this configuration at 30 deg angle of attack.
In order to put differential canard control power into perspective, its effect is
shown along with the incremental yaw control power of both the rudder and thrust
vectoring system in Fig. 21. The rudder power was obtained from wind-tunnel tests. The
thrust vectoring system provides a propulsive rather than an aerodynamic yawing
moment. Therefore, to compare, thrust vectoring control power must be reduced to
coefficient form which requires specifying a flight condition. Mach 0.4 at 30,000 ft
altitude (full scale) is representative of a typical subsonic flight condition and results in a
dynamic pressure of 70.3 psf. At this condition, the engine installed in the X-31 may
21
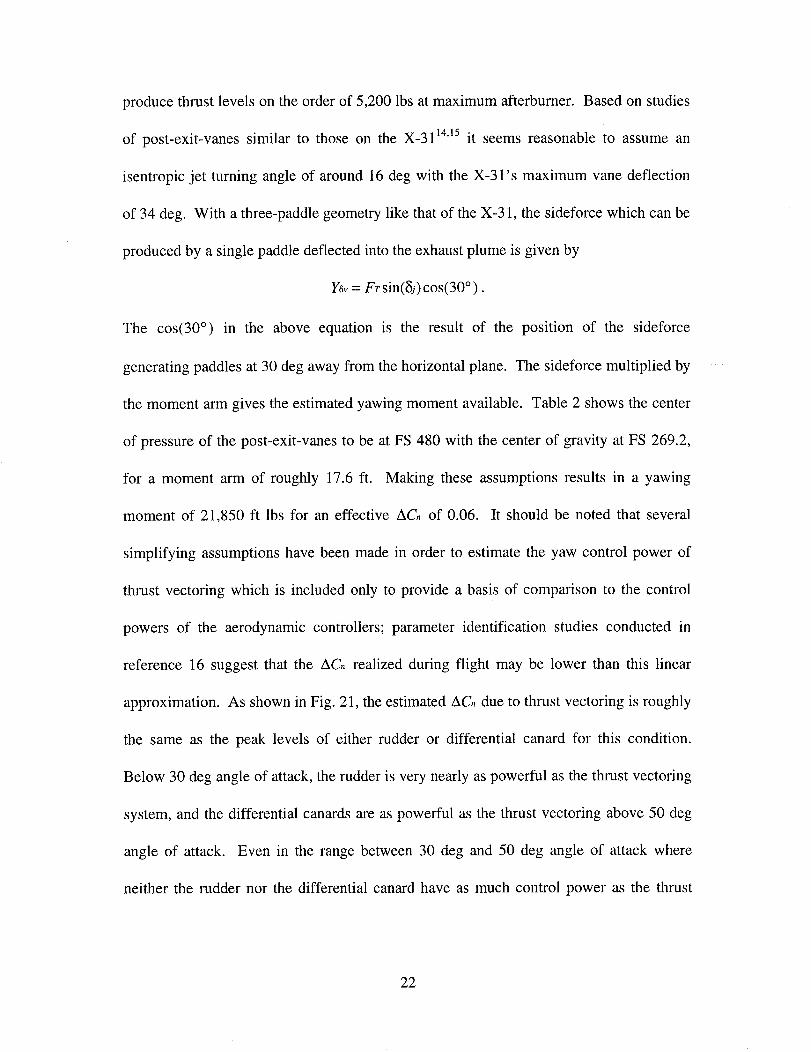
produce thrust levels on the order of 5,200 lbs at maximum afterburner. Based on studies
of post-exit-vanes similar to those on the X-3114'15 it seems reasonable to assume an
isentropic jet turning angle of around 16 deg with the X-31's maximum vane deflection
of 34 deg. With a three-paddle geometry like that of the X-31, the sideforce which can be
produced by a single paddle deflected into the exhaust plume is given by
Y_v = Fr sin(Sj) cos(30 °).
The cos(30 °) in the above equation is the result of the position of the sideforce
generating paddles at 30 deg away from the horizontal plane. The sideforce multiplied by
the moment arm gives the estimated yawing moment available. Table 2 shows the center
of pressure of the post-exit-vanes to be at FS 480 with the center of gravity at FS 269.2,
for a moment arm of roughly 17.6 ft. Making these assumptions results in a yawing
moment of 21,850 ft lbs for an effective AC, of 0.06. It should be noted that several
simplifying assumptions have been made in order to estimate the yaw control power of
thrust vectoring which is included only to provide a basis of comparison to the control
powers of the aerodynamic controllers; parameter identification studies conducted in
reference 16 suggest that the ACn realized during flight may be lower than this linear
approximation. As shown in Fig. 21, the estimated ACn due to thrust vectoring is roughly
the same as the peak levels of either rudder or differential canard for this condition.
Below 30 deg angle of attack, the rudder is very nearly as powerful as the thrust vectoring
system, and the differential canards are as powerful as the thrust vectoring above 50 deg
angle of attack. Even in the range between 30 deg and 50 deg angle of attack where
neither the rudder nor the differential canard have as much control power as the thrust
22
vectoringpaddles,the sumof the control powerfrom the two aerodynamicsurfacesis
roughlyequivalentto thepropulsiveyawcontrolauthority.
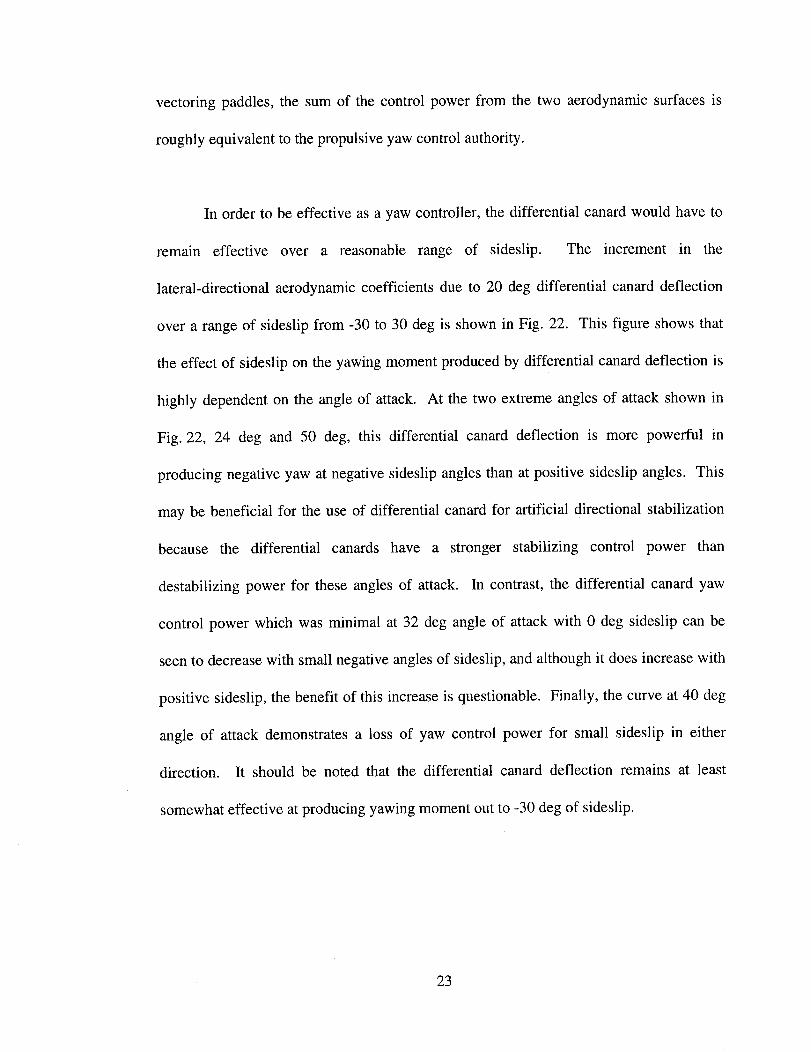
In orderto beeffectiveasa yawcontroller,thedifferentialcanardwouldhaveto
remain effective over a reasonablerange of sideslip. The increment in the
lateral-directionalaerodynamiccoefficientsdueto 20 deg differential canarddeflection
overa rangeof sideslipfrom -30 to 30degis shownin Fig. 22. This figure showsthat
theeffectof sideslipon theyawingmomentproducedby differentialcanarddeflectionis
highly dependenton the angleof attack. At thetwo extremeanglesof attackshownin
Fig. 22, 24 deg and 50 deg, this differential canarddeflection is more powerful in
producingnegativeyawat negativesideslipanglesthanat positivesideslipangles.This
maybebeneficialfor theuseof differentialcanardfor artificial directionalstabilization
becausethe differential canardshave a stronger stabilizing control power than
destabilizingpowerfor theseanglesof attack. In contrast,the differential canardyaw
control power whichwasminimal at 32 degangleof attackwith 0 degsideslipcanbe
seento decreasewith smallnegativeanglesof sideslip,andalthoughit doesincreasewith
positivesideslip,thebenefitof this increaseis questionable.Finally, thecurveat40 deg
angleof attackdemonstratesa lossof yaw control power for small sideslip in either
direction. It shouldbe notedthat the differential canarddeflection remainsat least
somewhateffectiveatproducingyawingmomentoutto -30degof sideslip.
23
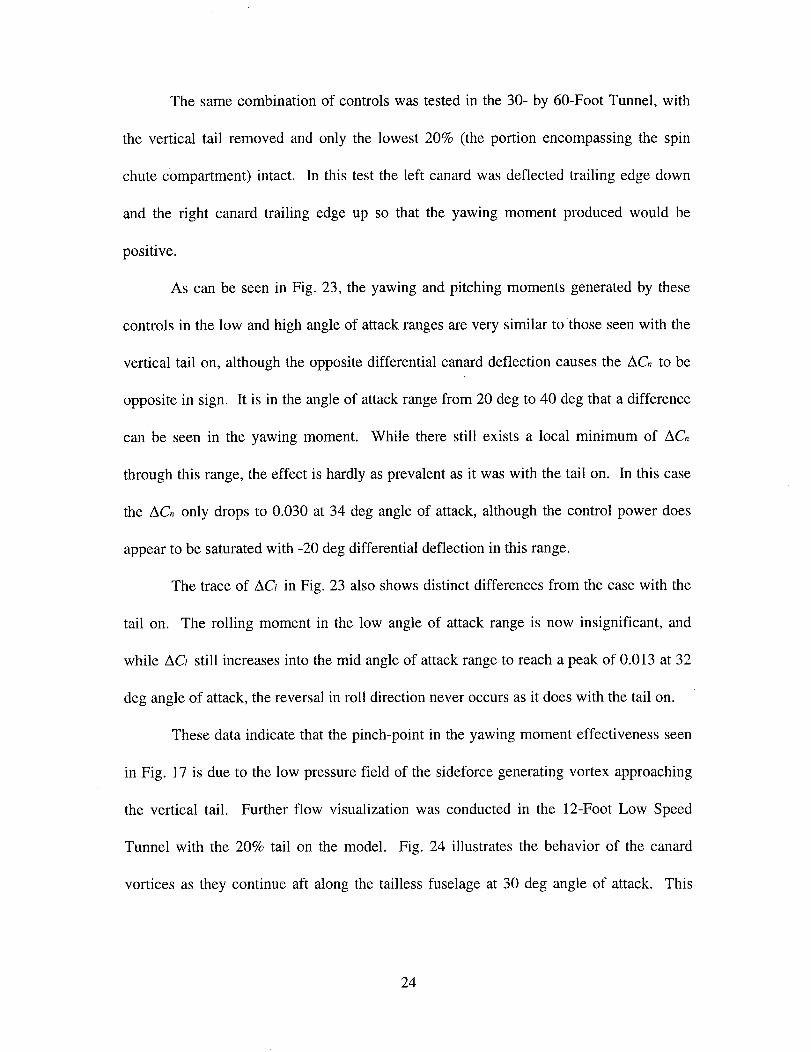
Thesamecombinationof controlswastestedin the 30-by 60-FootTunnel,with
the vertical tail removedandonly the lowest 20% (the portion encompassingthe spin
chutecompartment)intact. In this testthe left canardwasdeflectedtrailing edgedown
and the right canardtrailing edgeup so that the yawingmomentproducedwould be
positive.
As canbeseenin Fig. 23, theyawingandpitchingmomentsgeneratedby these
controlsin the low andhigh angleof attackrangesareverysimilar to thoseseenwith the
verticaltail on, althoughtheoppositedifferentialcanarddeflectioncausesthe zXC,to be
oppositein sign. It is in theangleof attackrangefrom 20 degto 40 degthata difference
canbe seenin the yawingmoment. While therestill exists a local minimum of AC,
through this range, the effect is hardly as prevalent as it was with the tail on. In this case
the ACn only drops to 0.030 at 34 deg angle of attack, although the control power does
appear to be saturated with -20 deg differential deflection in this range.
The trace of AC_ in Fig. 23 also shows distinct differences from the case with the
tail on. The rolling moment in the low angle of attack range is now insignificant, and
while ACt still increases into the mid angle of attack range to reach a peak of 0.013 at 32
deg angle of attack, the reversal in roll direction never occurs as it does with the tail on.
These data indicate that the pinch-point in the yawing moment effectiveness seen
in Fig. 17 is due to the low pressure field of the sideforce generating vortex approaching
the vertical tail. Further flow visualization was conducted in the 12-Foot Low Speed
Tunnel with the 20% tail on the model. Fig. 24 illustrates the behavior of the canard
vortices as they continue aft along the tailless fuselage at 30 deg angle of attack. This
24

time astheangleof attackis increasedto 30deg,thevortexfrom theleft canardcanbe
seenpassdirectly over the spin chutecompartment. Apparently the absenceof the
vertical tail makesit impossiblefor thevortexto completely cross over to the other side
of the fuselage with this configuration. The result is only a reduction in the total yawing
moment rather than total cancellation.
The information presented so far indicates that differential canard has the
potential of being used as an effective yaw control. In fact, the yawing moment generated
in the high angle of attack range may be roughly equivalent to that generated by the thrust
vectoring system which is currently relied on for yaw control in this range where the tail
and rudder are naturally ineffective. However, these control deflection combinations
would not be representative of the X-31 in normal, low angle of attack, flight where the
current control system would command much lower symmetric canard deflection. In
order to be effective as a yaw controller, any control scheme would have to be effective in
the low angle of attack range. In the event that thrust vectoring were to fail on the
full-scale aircraft, it is unlikely that the pilot would be concerned with post-stall
maneuverability, at least once the aircraft is stabilized in level flight. Certainly, the
priority would be to land the aircraft safely, which would require adequate
lateral-directional stability in the low angle of attack range.
25

Thefollowing configurationbetterrepresentstheX-31 in the low angleof attack
rangeaswouldbecommandedby itscurrentcontrolsystem:
SymmetricCanard,8c: 0 deg
LeadingEdgeFlaps: 0/0 (leadingedgesclean)
Fig. 25 showstheresultsof testingthis configurationwith the 100%verticaltail
wherethecanardsaredeflectedto -20deg8dc. As thefigure shows,theyawingmoment
produced by differential canard deflection around a symmetric 0 deg is minimal
throughoutthe alpharange. Below 20degalpha,themaximumACn of 0.0075 at 8 deg
alpha only half of the 0.015 produced by the same differential around -40 deg symmetric
canard deflection.
Fig. 26 shows the results for the 20% tail. The ACn curves in Fig. 26 show the
low angle of attack behavior is dominated by a dead band, requiring -30 deg differential
canard deflection to generate even 0.01 AC,. This renders the differential canard
unusable as a yaw controller at this condition and angle of attack.
It is interesting to note that in the region where the yawing moment pinch point
occurred for the 100% tail with the high alpha configuration, for this configuration there
exists a control reversal of-0.015 AC, at 34 deg angle of attack which is saturated at -20
deg differential deflection. In the angle of attack range from 24 deg to 36 deg, a positive
sideforce increment is being produced along with negative yawing moment increment.
This could only be the result of a positive net sideforce acting at a center of pressure
behind the center of gravity. The corresponding positive rolling moment leads to the
26

conclusionthat the centerof pressureof the net sideforcemustbe abovethe centerof
gravity. Finally,becausetheremovalof theverticaltail did notreducethis phenomenon,
it canonly beconcludedthatthis sideforcedoesnot actupontheverticaltail, but on the
aft fuselage.
Thelossof AC, with 0 deg symmetric canard setting was examined in more detail
in the 12-Foot Low Speed Tunnel where tests were conducted with -20 deg differential
canard deflections for three different symmetric canard settings, holding the leading edges
constant at their baseline configuration of 40/32 (40 deg inboard, 32 deg outboard leading
edge down). The data of Fig. 27 show that the yawing moment produced consistently
decreases as the symmetric canard deflection is increased from -40 deg to 0 deg.
These data show that asymmetric canard deflection could be an extremely
effective yaw control device in post-stall flight. This has the immediate application of
augmenting the thrust vectoring system used in this range. Unfortunately, in the low
angle of attack range where the current control system would command less symmetric
canard deflection, the yaw control power generated by differential canard deflection
would be severely limited. In order to effectively use differential canard deflection as a
yaw control device, it might be possible to redesign the flight control system so that the
aircraft trims at low angle of attack with larger trailing edge up canard deflections by
deflecting the trailing edge flap surfaces to compensate for the pitching moment offset
that this would create. This possibility will be discussed later.
27
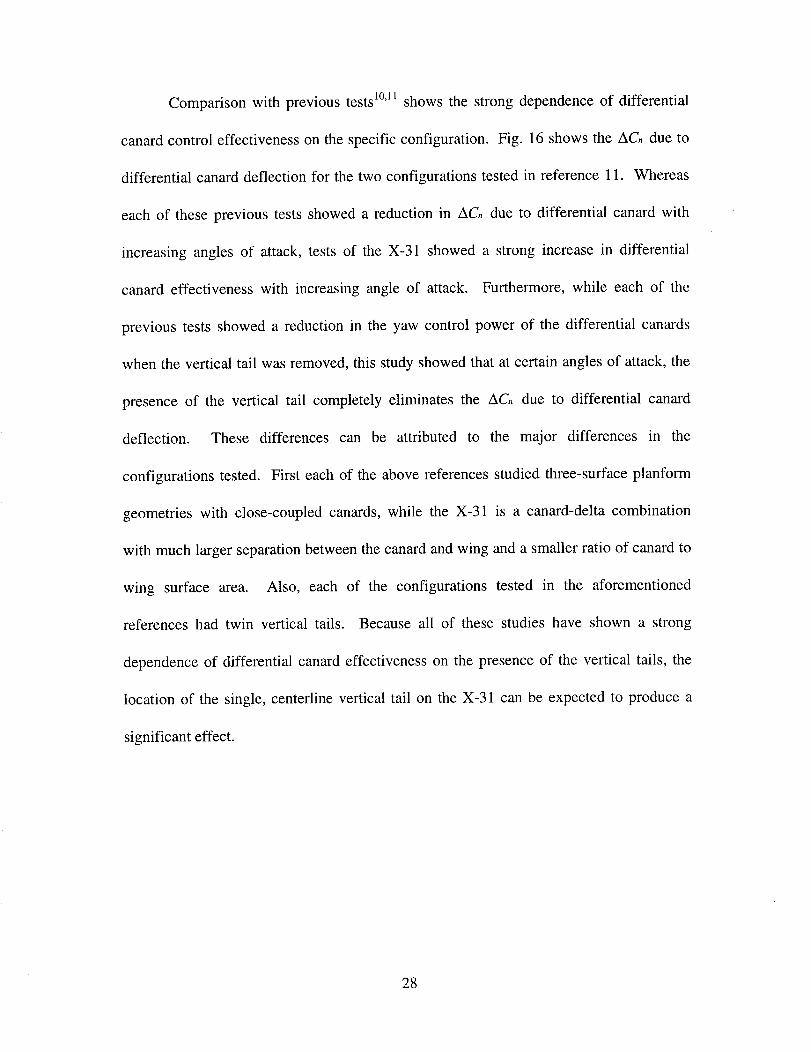
Comparison with previous tests 1°'11 shows the strong dependence of differential
canard control effectiveness on the specific configuration. Fig. 16 shows the ACn due to
differential canard deflection for the two configurations tested in reference 11. Whereas
each of these previous tests showed a reduction in ACn due to differential canard with
increasing angles of attack, tests of the X-31 showed a strong increase in differential
canard effectiveness with increasing angle of attack. Furthermore, while each of the
previous tests showed a reduction in the yaw control power of the differential canards
when the vertical tail was removed, this study showed that at certain angles of attack, the
presence of the vertical tail completely eliminates the ACn due to differential canard
deflection. These differences can be attributed to the major differences in the
configurations tested. First each of the above references studied three-surface planform
geometries with close-coupled canards, while the X-31 is a canard-delta combination
with much larger separation between the canard and wing and a smaller ratio of canard to
wing surface area. Also, each of the configurations tested in the aforementioned
references had twin vertical tails. Because all of these studies have shown a strong
dependence of differential canard effectiveness on the presence of the vertical tails, the
location of the single, centerline vertical tail on the X-31 can be expected to produce a
significant effect.
28
5.Analysisof PerformanceLimitations
With thecontrol powerof differentialcanarddeflectionestablished,thesevalues
canbeusedto estimatethelevelsof performancethat mightbeachievedanddetermine
whetheryaw, roll, or pitch control will saturatefirst to becomethe limiting factor for
performingcoordinated,wind-axisrolls.
5.1 Coordinationof Wind-Axis Rolls
Due to its placement,the vertical tail of the X-31, like that of most aircraft,
becomesimmersedin the low energywake of the main wing as the angleof attack
increases.This not only cancelsout the stabilizingcontributionof the vertical tail as
shownpreviouslyin Fig. 7, but alsoreducesthe effectivenessof the rudderas a yaw
control. Fig. 28 showsthattheyawcontrolpowerof therudderbeginsto dropby 30deg
alpha,becomingcompletelynegligibleby 55 degalpha. Theimportanceof the lossof
rudderpoweris compoundedby thedesireto maneuveraboutthevelocityvectorat high
anglesof attack, so that rolls must be performedaboutthe wind-axis rather than the
body-axis. This requiresincreasinglevelsof yawingmomentin anangle-of-attackrange
wheretheavailableyawingmomentisdecreasing.
To performacoordinated(_= 0) wind-axesroll, theapproximationcanbemade
r = p tan(c_)
and
r = p tan(oQ
29

or, neglecting the cross terms,
and therefore
N L-- = -- tan(_),Iz Ix
C_ = Ct Iz tan(o0.Ix
Since the ratio Iz/_ix is typically much greater than 1 (roughly 12 for the X-31), and the
tan(a) is greater than 1 above 45 deg, the amount of yawing moment required to perform
a wind-axis roll is far greater than the rolling moment. Since the rudder is ineffective in
this range, the X-31 achieves these levels of yaw control through thrust vectoring, and the
comparatively small required rolling moments can be generated by the ailerons which
remain effective at high angles of attack (see Fig. 29).
If the damping terms are neglected in order to assess only the initial response to a
control input, the amount of yaw control deflection that will be required to coordinate a
wind-axis roll using a given amount of roll control and vice versa can be estimated. The
moments generated by 10, 20, and 30 deg of differential canard were computed. The
aileron deflection was solved by iteration to produce a wind-axis roll according to the
above equation. The resulting deflections in Fig. 30 show that with the addition of the
differential canard for yaw control, the roll performance of the X-31 without thrust
vectoring will remain limited by yaw control. Relaxing the constraint that sideslip be
zero, it is possible to greatly improve the turning performance. As long as sideslip is not
allowed to continually build up, a certain amount of sideslip can be used to increase the
C, which could otherwise be produced. The plots in Figs. 31 and 32 show the effect of
30
carrying -5 and 5 deg of sideslip on the aileron deflection needed to produce a wind-axes
turn. These plots show that much greater amounts of aileron deflection are required when
the sideslip is allowed to build up to -5 deg, and generally an aileron reversal is required
when sideslip reaches 5 deg.
5.2 Inertial Coupling
Another factor which has often limited high-angle-of-attack rolling performance
in the past is the amount of available pitch authority. Although an aircraft may have the
control authority required to trim at high angles of attack, the additional demand placed
on the longitudinal controls by inertial coupling becomes increasingly significant with
increasing angle of attack. 17
The non-linear equation of motion for pitching moment is:
IY q = M + Izx( r 2 - p 2) + ( Iz - Ix )rp .
If roll rate gets high enough, a very significant contribution to pitching moment will result
from the last term, i.e., inertial coupling. It is possible that with the advent of the
differential canard as a yaw control, yawing moment may not be the limiting factor in a
coordinated wind-axis roll at high angles of attack because the higher roll rates which will
now be possible may result in saturation of the nose down pitch controls.
Wind-tunnel tests were conducted to determine the maximum amount of
aerodynamic pitching moment that can be generated by the X-31. Fig. 33 shows the loci
of these extrema as they vary with angle of attack. Note the control surface delcetions,
which vary with angle of attack, are not shown. To evaluate the actual pitching moments
31

reflected by these coefficients, the dynamic pressure will be needed. The control
schedule shown in Fig. 34 results in zero pitching moment with lift and drag coefficients
shown in Fig. 35. With an unpowered aircraft (such as the X-31 drop model) CL and CD
alone determine the glidepath angle as
C_tan(7) = --
CL
which can then be used to determine the dynamic pressure necessary to maintain
unaccelerated flight
Dsin(7) + Lcos(7) = W.
Using the tan(7) relation to eliminate drag and substituting for L
L= CLqS,
this becomes
- Wcos(7)q-
CLS
Again, the 550 lb, 27% scale drop model will be used for the following analysis so that
the numbers obtained will reflect the performance expected in drop model flight tests
discussed later. The dynamic pressure resulting from the control schedule in Fig. 34 for
the 27% X-31 drop model is shown in Fig. 36. With the constraint that r = p tan(_),
Fig. 37 shows the maximum amount of coordinated roll rate which can be sustained
before saturating the nose-down pitch controls based on this dynamic pressure estimate.
This plot shows that as angle of attack increases, the maximum amount of wind-axes roll
rate that can be maintained drops, reaching 50 deg per second at 65 deg angle of attack.
32
In summary, the initial response to a roll command will remain limited by yaw
control power with the advent of differential canard controls. The ailerons retain
sufficient roll control authority to coordinate the maximum amount of yawing
acceleration which can be generated by the differential canards at up to 80 deg angle of
attack. The level of roll rate which can be generated and sustained may prove to be
limited by the nose-down pitch authority of the aerodynamic controls as inertial coupling
at high rates and high angles of attack becomes significant. In fact, this phenomenon was
observed during a drop model flight test as will be shown in the following chapter.
33

6. DropModelTests
In orderto verify the resultsfrom the static and forced-oscillationwind-tunnel
data,dropmodelflight testswereconducted.
Theradio-controlleddropmodeltesttechniquewasoriginally developedto study
post-stall aerodynamicsand spin-entry. Since its inception, the techniquehas been
broadenedto includea wide rangeof low-speedflight dynamics. Drop model testsare
conductedat the Wallops Flight Facility wherea speciallymodified UH-1 helicopter
carriesthe dynamicallyscaledmodelto an altitudebetween6,000 and 12,000ft. The
model is then releasedandremotelyflown througha predeterminedflight plan from a
groundstation. As illustrated in Figs. 3818 and 39,19 flight data is transmitted down from
the instruments on the model to the flight control computer on the ground, and an
out-of-cockpit view is transmitted down to the pilot from a camera onboard the model.
The pilot's commands along with downlinked state feedbacks are interpreted by the flight
control computer according to the flight control laws, and the control surface actuator
commands are radioed back up to the model.
As the model approaches the ground, the flight is ended when an onboard
parachute is deployed on command from the ground station. The model is then retrieved
from the water and returned to be reused for the next flight.
The drop model flights for this study were made with the 27% dynamically scaled
X-31 model. Dynamic scaling means that a drop model flight from 12,000 ft to sea level
simulates a full scale altitude in the range from 35,000 to 26,000 ft. 25 previous flights
34
havealreadybeenconductedwith this model,sothetwo flights which will be usedfor
this researchwill be referredto asflights 26 and27. All datashownhereinarein drop
modelscale.
6.1 Drop ModelFlight26: 100%VerticalTail
During dropmodel flight 26,coordinatedwind-axisrolls at 50 and60deg angle
of attackwereexecutedwith thedifferentialcanardsasthe only activeyawcontrol and
the symmetriccanardsstill activefor pitch control. Fig.40 showsthe time history of
right andleft turnswhichwereinitiatedat 50degangleof attack. At 51 seconds into the
flight, the pilot applied and held full right roll stick, and the control system responded
with full differential canard deflection (-20 deg). The differential canard remained
saturated at maximum deflection for approximately one second before sufficient yaw rate
developed for the control system to begin reducing differential deflection. The yaw rate
overshot the command, reaching almost 90 deg per second within three seconds of the
initial control input, and the control system began to correct this by applying about 5 deg
of positive differential canard. By 56 seconds, the pilot reversed the stick to stop the roll
and received the full 20 deg of canard deflection for one and a half seconds. The
differential canard deflection arrested the right yaw and developed a left yaw of -30 deg
per second before the pilot released the stick, and the aircraft was allowed to return to
level flight. At 58 seconds into the flight, the pilot applied full left stick, and with only
brief saturation of the differential canard, the aircraft reached a yaw rate which stabilized
around -70 deg per second.
35
Fig. 41 showstime historiesduring this maneuverfocusing on the yaw axis.
From the tracesof differential canardand aerodynamicyawingmomentcoefficient,the
actualcontrolpowerof thedifferentialcanardcanbeobserved.During theinitial -20deg
deflectionof thedifferentialcanardsat 51seconds,theyawingmomentappearedslow to
develop,but by 52 secondswhenthedeflectionhadstabilized,the aerodynamicyawing
moment,which is assumedto be predominantlydueto differential canard,hadrisento
about0.03. For -20degof differentialcanarddeflection,this representsa controlpower
verysimilar to thatwhich wasseenin thestaticwind-tunneltests(seeFig. 17). Between
56 and57 seconds,20degof differentialcanarddeflectionwereusedto arrestthe turn,
and while again there appearsto have been a lag of about 0.5 secondbefore the
aerodynamicforcescouldcompletelydevelop,the yawingmomentcanbeseento have
peakedbeyond-0.06. Referringagainto Fig. 17,this appearsconsistentwith the levels
observedin the static wind-tunneltestsfor an angleof attackwhich had drifted up to
around 55 deg. Finally, the maneuverwas endedat 63 secondswith -20 deg of
differential canarddeflection to arrestthe left turn, and a correspondingaerodynamic
yawingmomentof 0.05canbeobserved.This is slightly higherthanthe levelsseenin
thewind-tunnel.
Thetracesof yawrateandsideslipin Fig.41 showanoscillatingbodyaxisrolling
behavior,or wing rock, throughoutthis maneuver.However,the artificial roll damping
wasableto containthe amplitudeof theoscillationsothatthe sideslipangleneverbuilt
uppast+/-7 deg. Thisbehaviorwasknownto exist for theX-31 from previousstudies,19
36
andthereforethe differentialcanarddeflectiondoesnot appearto havebeenthe driving
forcebehindit.
During this maneuver,the angleof attackdrifted awayfrom the initial 50 deg,
reachingover62degfor abrief period,andFig. 40showsthat thisoccurredwithout any
input from thepilot. Thetimehistoriesin Fig. 42 focuson thepitchingbehaviorduring
this maneuver.The tracesof symmetriccanardandflap deflectionshowthatthe control
systemwas fighting the pitch up. The differential canarddeflectionwas very small
aroundthe time of this pitch up, so it is unlikely that this resultedfrom the pitching
momentdueto differentialcanard(seeFig. 17). Rather,thepitchup canbeattributedto
the inertialcouplinginducedby suchahighcoordinatedroll rate. As shownpreviouslyin
Fig. 37,a lossof pitchcontrolauthoritywasexpectedat 50degangleof attackfor body
axis roll ratesabove70degpersecond,a boundarywhichwasverynearlycrossedduring
this maneuver. Thetraceof pitchingmomentdue to aerodynamicscomparedwith the
pitchingmomentdueto inertial couplingshownin Fig.42 showsthatthepitchaxispaths
of thecontrol systemwereveryeffectiveatcontainingtheinertialcouplingexceptfor the
brief periodof yawrateovershoot.
Fig. 43 showsthatby 71 secondsinto flight 26, thepilot hadincreasedthe angle
of attack to 60 deg. At this point, the pilot appliedfull right roll stick and held it,
allowing the aircraftto stabilizeat 40 degpersecondyawrate. At 76 seconds, the pilot
reversed the stick to arrest the motion.
37
Fig. 44 showsthetimehistoriesfor theyawaxisduringthis maneuver.Thetrace
of the aerodynamicyawingmomentshowsthat at 72 seconds,a Cn of 0.04 was being
produced. This is rather lower than would have been expected from the wind-tunnel data
shown in Fig. 17 for 60 deg angle of attack except that only -12 deg of differential canard
deflection were actually realized during this time. The full 20 deg of differential canard
were used to arrest the turn at 76 seconds, and the aerodynamic yawing moment of -0.06
is very similar to what the wind-tunnel tests predicted for an angle of attack of roughly 57
deg.
Fig. 45 shows a summary of the yawing moments due to 20 deg of differential
canard deflection observed at different angles of attack during drop model flight 26 as
compared to wind tunnel data for the same configuration. For the points tested, there is
good correlation between drop model flight and wind-tunnel data which validates the
results of the wind-tunnel testing.
6.2 Drop Model Flight 27: 20% Vertical Tail
For flight number 27 of the 27% scale X-31 drop model, the vertical tail was
removed leaving only the lowest 20%, and the differential canards were used as the only
yaw control available. Between the instability of the tailless X-31 (see Fig. 7) and
reduction of differential canard control power at low angles of attack (see Fig. 23), it was
expected that the model would become increasingly difficult to control as the angle of
attack was reduced. Because of this, the flight plan called for the test to begin by
38

stabilizingat themaximumangleof attackfor trim. Then, thepilot slowly reducedthe
angleof attack,expectinga departureas the instability overcamethe availablecontrol
power. Fig.46 showsthatsuchadeparturehadnotyetoccurredasthemodelreached30
degangleof attack,soat 52secondsinto theflight, thepilot appliedfull left roll stick and
held it for two seconds. The aircraft immediatelyrespondedwith an uncoordinated,
nearlybody-axisroll to the left at almost100degpersecondwhich allowedthe sideslip
angleto build up to -20deg. As thepilot heldthecontrolinput, themodelmaintaineda
severeroll oscillationandpitchedup to 50 degangleof attackwherethe pilot released
thestick andthemodelwasallowedto stabilize.
Thetraceof aerodynamicyawingmomentduringthis maneuverin Fig. 47 shows
thatup to thepoint of thecontrolinput,the differentialcanardswereableto containthe
sideslip to within a few deg. Specifically, this figure showsthe differential canard
yawing moment control power to be as high as -0.0013 per deg which compares
reasonablywell with thewind-tunneldatapresentedin Fig. 23 for thetaillessX-31 at 30
degangleof attack. When thecontrolinput wasapplied,however,the yawingmoment
wasimmediatelydominatedby theeffectof sideslip,andfrom 52 to 54seconds,thetrace
of Cn in Fig. 47 mirrors the trace of sideslip very closely. After 54 seconds, the angle of
attack had increased to 50 deg, and the pilot released the controls. At this point, the
yawing moment began to follow the differential canard deflection more closely, showing
a differential canard control power of -0.0025 per deg at 50 deg angle of attack.
Unexpectedly, this departure was characterized by a pitch-up which allowed the
aircraft to restabilize. Fig. 48 shows time histories for this maneuver that focus on the
39

pitching behavior. Unlike the pitch,up which was witnessedin flight 26 during
coordinatedwind-axis rolls, inertial coupling was not the driving factor during this
departure.Fig. 48 showsthat the pitchingmotionbeganby 53 secondsinto the flight,
whereinertial couplingcreatesno appreciablecontributionto pitchingmoment. Instead,
this pitch-up canbe attributedto aerodynamiceffects. The pitching momentdue to
differential canarddeflectionduring this time can accountfor over half of the total
pitching moment observed(see Fig. 23), and the remaindermay be due to other
aerodynamiceffectssuchaspitchingmomentdueto sideslip.
With theaircraftstableagain,the angleof attackwasagainreducedto as low as
22deg. At 64seconds,asshownin Fig.49, thepilot againappliedfull left stick andheld
it for oneandahalf seconds.As before,themodelrespondedwith abody-axisroll to the
left which developedinto a high amplitudeoscillation. This time, thepilot reversedthe
stick, giving full right roll input at 65.5seconds,andheld it for almost threeseconds.
This causedabrief disruptionof theroll oscillationafterwhichtheaircraftresumedbody
axis rolling.
The yawingmomenttracein Fig. 50 showsvery little yawcontrol powerat this
angleof attackwith 10degof differentialcanardbeingsustained,howeverbothyawrate
andsideslipwerecontainedupto thepointof thecontrolinput. At thatpoint,thetotal C,,
was again dominated by the sideslip effect.
The pitching character of this departure (as shown in Fig. 51) was similar to that
seen at 30 deg angle of attack. The aerodynamic pitching moment at the beginning of the
40
maneuvercausedthe aircraft to pitch up to 40 deg angle of attack before the pilot's
control reversal allowed the angle of attack to drop briefly before increasing again.
During both drop model flight tests, the differential canards generated moments
very similar to those predicted from wind-tunnel data, and coordinated, wind-axis rolls at
50 ° and 60 ° angle of attack were performed for the first time with the unpowered drop
model. At 50 ° alpha, the roll rates developed high enough to be limited by the pitch
authority needed to offset the inertial coupling effect demonstrated earlier. The flight
control scheme used for the tailless drop model test (which will be described in detail
later) was able to maintain steady flight with 20% vertical tail at angles of attack
approaching 20 °, and departures which ensued from extreme control inputs proved to be
mild and easily recoverable.
41
7. Validationof Flight Simulation
Sinceonly two dropmodelflightswereavailableto studythesecontrols,theX-31
drop model flight simulatorwas reliedon to developandevaluatecontrol methodsand
feedbacksystems.The effectsof verticaltail removalanddifferential canarddeflection
were modeledbasedon the wind-tunneldata. The drop model simulator combines
accuratesix-degree-of-freedomnonlinearmodeling of the aerodynamicresults from
wind-tunnelanddrop-modeltestingof theX-31 alongwith duplicationof thedropmodel
flight control laws. This simulatoris usedaspartof thedropmodelprogramto develop
andpracticeflight profiles for dropmodeltests.
7.1 Reproductionof DropModelFlight26: 100%Vertical Tail
In an attemptto interpretthe accuracyof the simulation in predicting flight
performance,the conditionsof drop model flight 26 wereduplicatedin the simulation,
and similar control inputsweremademanually. Fig. 52 showsthe time historyof full
right andleft stickinputsin thesimulatorat50degangleof attack.Comparingthis to the
actualflight resultsof Fig. 40 showsreasonablygoodreproductionof resultswith certain
notabledifferences. First, the yaw rate respondedslightly faster in the simulation,
althoughit did not peakas high asthe actualflight test, andthe subsequentpitch-up
resultingfrom inertial couplingdid not occur. Later, whenthe stick wasreversed,the
resultsmatchedthedropmodelflight veryclosely.
42
The pitching moment traces in Fig. 53 show that in the simulation, the
longitudinal control surfaceslaggedthe inertial coupling momentslightly, while the
significantlylower rolling andyawingmomentskept thepitchingmomentdueto inertial
couplingwithin limits thattheaerodynamiccontrolscouldmaintain.
Of greatersignificancearetheyawingmomenttracesin Fig. 54. Theresponseof
yawingmomentto thedifferentialcanarddeflectioncloselymatchedthatwhichwasseen
in flight 26 (seeFig. 41). The failure of the simulation to duplicatethe yaw rate
overshootseenin drop modelflight 26 doesnot appearto havebeendueto any lackof
control powerin the differentialcanardmodel. As the yawrateto the left moreclosely
matchedflight than to the right, it seemsplausiblethat a slight differencemay exist
betweenthe flow asymmetriesof the actualdrop model and thoseof the simulation.
Furthermoreasymmetricvortex formationis knownto be stronglyinfluencedby initial
conditions, and additional drop model flights with which to attemptmultiple entry
conditionswerenot availableto examinethispossibility.
Theroll commandat 60degangleof attackwasalsoreproducedin thesimulator
with goodresultsasshownin Fig. 55. Thetracesof differentialcanardandresultingyaw
rate show excellent correlationto thoseof flight 26 shownin Fig. 43, althoughthe
oscillatoryroll ratewhichhad developedby this point in thedrop model flight wasnot
duplicatedfor thesimulation.Theyawingmomentseenin thedropmodelflight (Fig. 44)
showsthattheyawingmomentdueto differentialcanardmayactuallybehigherthanwas
modeledin thesimulationfor 60degangleof attack(Fig.56).
43
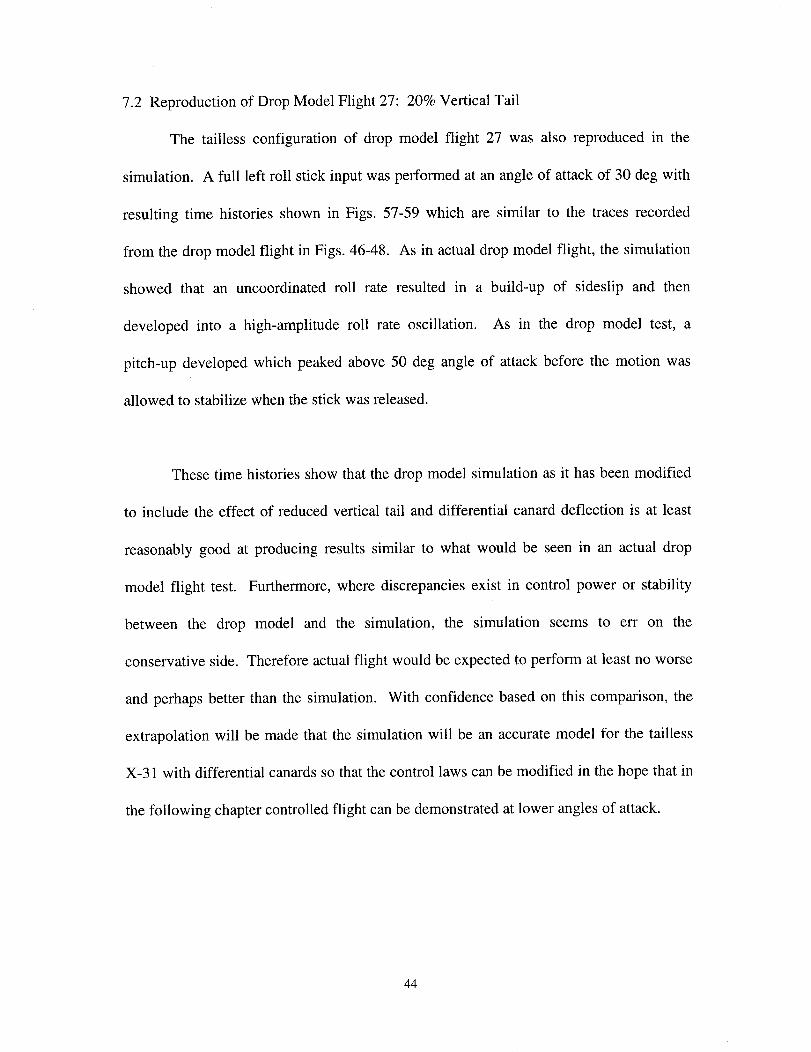
7.2 Reproductionof Drop ModelFlight27: 20%VerticalTail
The tailless configurationof drop model flight 27 was also reproducedin the
simulation. A full left roll stick input was performed at an angle of attack of 30 deg with
resulting time histories shown in Figs. 57-59 which are similar to the traces recorded
from the drop model flight in Figs. 46-48. As in actual drop model flight, the simulation
showed that an uncoordinated roll rate resulted in a build-up of sideslip and then
developed into a high-amplitude roll rate oscillation. As in the drop model test, a
pitch-up developed which peaked above 50 deg angle of attack before the motion was
allowed to stabilize when the stick was released.
These time histories show that the drop model simulation as it has been modified
to include the effect of reduced vertical tail and differential canard deflection is at least
reasonably good at producing results similar to what would be seen in an actual drop
model flight test. Furthermore, where discrepancies exist in control power or stability
between the drop model and the simulation, the simulation seems to err on the
conservative side. Therefore actual flight would be expected to perform at least no worse
and perhaps better than the simulation. With confidence based on this comparison, the
extrapolation will be made that the simulation will be an accurate model for the tailless
X-31 with differential canards so that the control laws can be modified in the hope that in
the following chapter controlled flight can be demonstrated at lower angles of attack.
44

8. StabilityAugmentation
An extremelysimplified versionof the flight control systemusedon the 27%
X-31 dropmodelis shownin Fig. 60wherethevariablesin thesediagramsaredefinedin
Tables4-7. In this simplified diagram,all flight control optionswhich werenot used
duringthe courseof this researchhavebeenomitted,andin somecases,multiple in-line
gainshavebeencombinedinto a singleblock. The two switcheswhich remainin this
simplified control systemareSWrudwhich activatesthe rudder if set to 1 andSWdcd
whichactivatesthedifferentialcanarddeflectionif setto 1. For brevity,theconditioning
which hasbeenappliedto the downlinkparameters(suchasalpha,beta,etc.)aswell as
thatwhichhastakenplaceon thepilotsinputsis not shown. Certainvalues(suchasqbar
andmic) representcalculationsbasedon thedownlinkdatawhich arealsoomitted. The
gains in these diagramswere modified for different situations, and the particular
combinationswhichapplyto eachcasearedetailedin Tables5-7.
8.1 Stabilizationof LinearSystemPoles
The unstableopenlooppolesfor the27%X-31 dropmodelin glidingflight at 20
deg angleof attack developedpreviouslyare shownin Fig. 61 along with the zeros
associatedwith ayawrateto rudderfeedbackloop. Theopenloopresponseto anaileron
impulseshownin Fig. 62 illustratesthe divergentoscillation indicatedby the unstable
complexpairof poles. Theflight controlsystemasit wasimplementedon theX-31drop
model during flight 26 usedroll rate to aileronfeedbackwith 0.052 gain, sideslipto
45
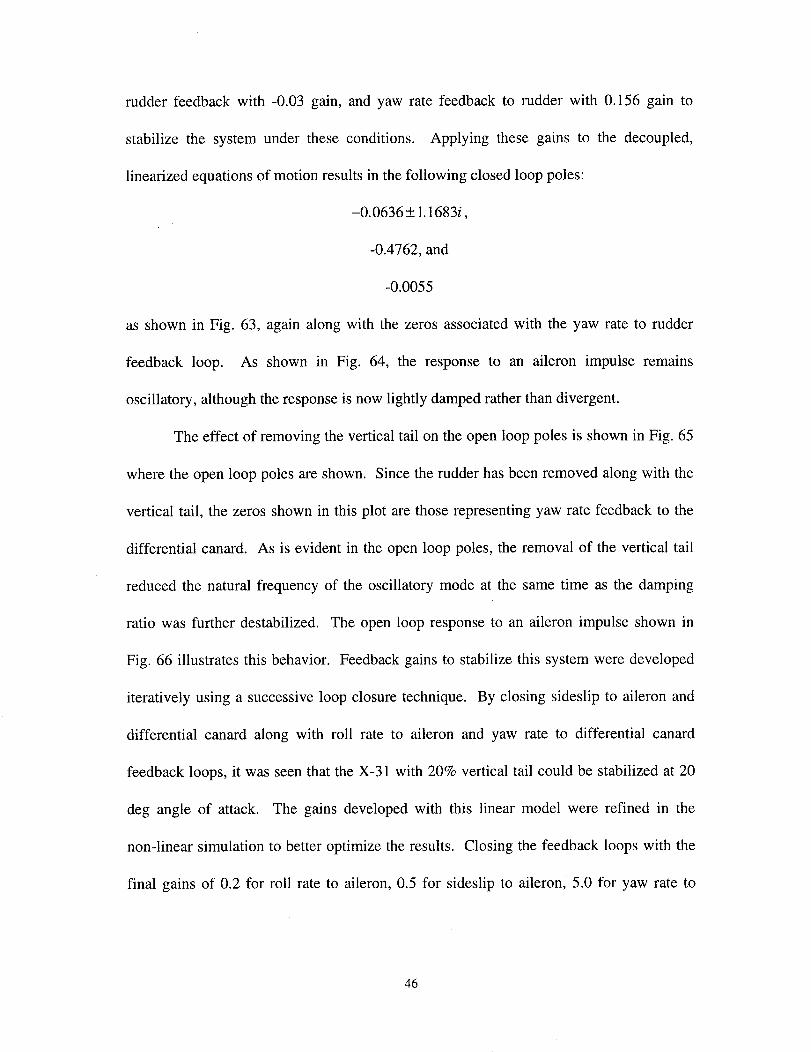
rudder feedbackwith -0.03 gain, andyaw ratefeedbackto rudderwith 0.156gain to
stabilize the systemunder theseconditions. Applying thesegainsto the decoupled,
linearizedequationsof motionresultsin thefollowing closedlooppoles:
-0.0636+ 1.1683i,
-0.4762, and
-0.0055
as shown in Fig. 63, again along with the zeros associated with the yaw rate to rudder
feedback loop. As shown in Fig. 64, the response to an aileron impulse remains
oscillatory, although the response is now lightly damped rather than divergent.
The effect of removing the vertical tail on the open loop poles is shown in Fig. 65
where the open loop poles are shown. Since the rudder has been removed along with the
vertical tail, the zeros shown in this plot are those representing yaw rate feedback to the
differential canard. As is evident in the open loop poles, the removal of the vertical tail
reduced the natural frequency of the oscillatory mode at the same time as the damping
ratio was further destabilized. The open loop response to an aileron impulse shown in
Fig. 66 illustrates this behavior. Feedback gains to stabilize this system were developed
iteratively using a successive loop closure technique. By closing sideslip to aileron and
differential canard along with roll rate to aileron and yaw rate to differential canard
feedback loops, it was seen that the X-31 with 20% vertical tail could be stabilized at 20
deg angle of attack. The gains developed with this linear model were refined in the
non-linear simulation to better optimize the results. Closing the feedback loops with the
final gains of 0.2 for roll rate to aileron, 0.5 for sideslip to aileron, 5.0 for yaw rate to
46

differential canard,and -4.0 for sideslipto differential canardproducedthe following
augmentedpolesfor the linearsystem:
-0.2788+ 0.8232i,
-0.7062, and
-0.0693
which are shown in Fig. 67. As shown by the plot of the closed loop response to an
aileron impulse in Fig. 68, this combination of feedback gains increased the natural
frequency of the dominant oscillatory mode and resulted in a favorable damping ratio.
8.2 Modification to Longitudinal Control Laws
Unfortunately, as previously mentioned, the reduction of symmetric canard
deflection at lower angles of attack will degrade the yawing moment available from the
differential canard deflection. Therefore the longitudinal portion of the flight control
system was modified slightly to cause the aircraft to trim with a greater negative canard
deflection. The longitudinal control law block diagram in Fig. 60a shows that a constant
offset "dfoff" is subtracted from the symmetric trailing edge flap command. By varying
this offset, it is possible to alter the combination of symmetric canard and trailing edge
flap deflections for trim. Figs. 69 and 70 show the symmetric canard and flap deflections
observed in the non-linear simulation when trimmed over a range of angle of attack as a
function of the longitudinal control law parameter "dfoff." To maximize the control
effectiveness of the differential canard, a "dfoff" setting of 25 was used in subsequent
simulation tests.
47
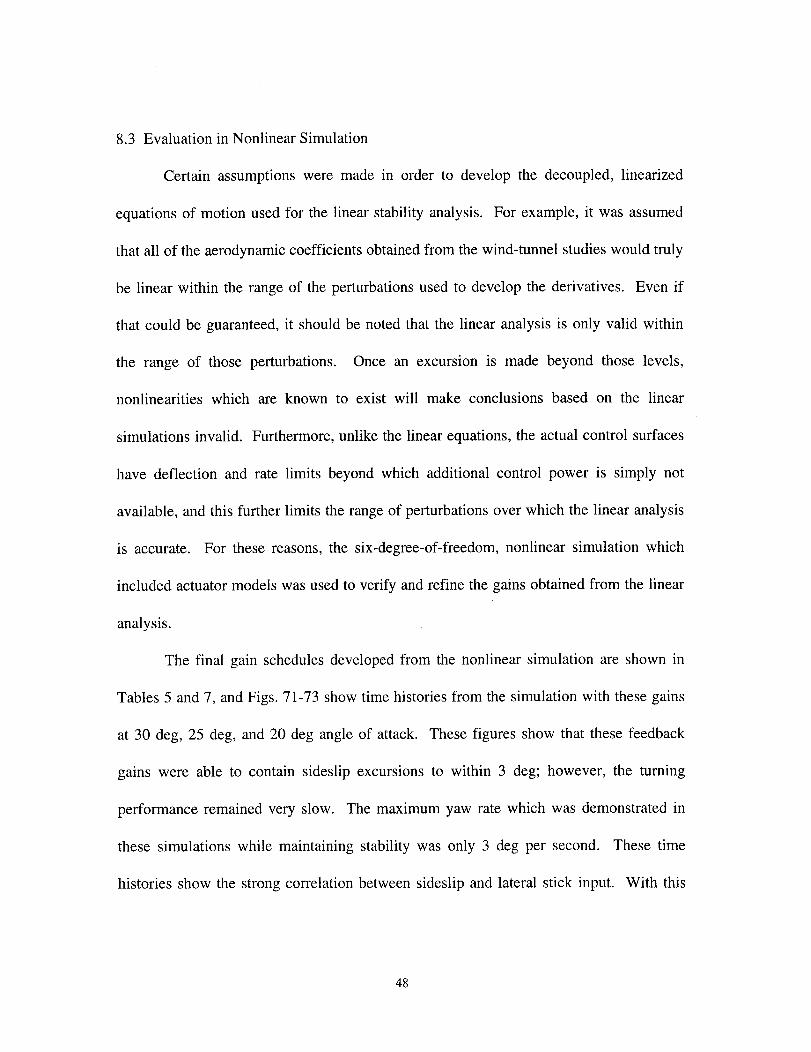
8.3 Evaluationin NonlinearSimulation
Certain assumptionswere madein order to developthe decoupled,linearized
equationsof motion usedfor the linearstability analysis.For example,it wasassumed
thatall of theaerodynamiccoefficientsobtainedfrom thewind-tunnelstudieswould truly
be linear within the rangeof theperturbationsusedto developthe derivatives. Even if
that could beguaranteed,it shouldbenotedthat the linearanalysisis only valid within
the range of thoseperturbations. Oncean excursion is madebeyond those levels,
nonlinearitieswhich are known to exist will make conclusionsbasedon the linear
simulationsinvalid. Furthermore,unlike thelinearequations,the actualcontrol surfaces
have deflectionand rate limits beyondwhich additional control power is simply not
available,andthis furtherlimits therangeof perturbationsoverwhichthelinearanalysis
is accurate. For thesereasons,the six-degree-of-freedom,nonlinearsimulationwhich
includedactuatormodelswasusedto verify andrefinethegainsobtainedfrom thelinear
analysis.
The final gain schedulesdevelopedfrom the nonlinearsimulationareshownin
Tables5 and7, andFigs.71-73showtimehistoriesfrom thesimulationwith thesegains
at 30 deg,25 deg,and20 degangleof attack. Thesefigures showthat thesefeedback
gains were ableto containsideslip excursionsto within 3 deg; however,the turning
performanceremainedvery slow. The maximumyaw ratewhich wasdemonstratedin
thesesimulationswhile maintainingstability was only 3 deg per second. Thesetime
historiesshowthestrongcorrelationbetweensideslipandlateralstick input. With this
48
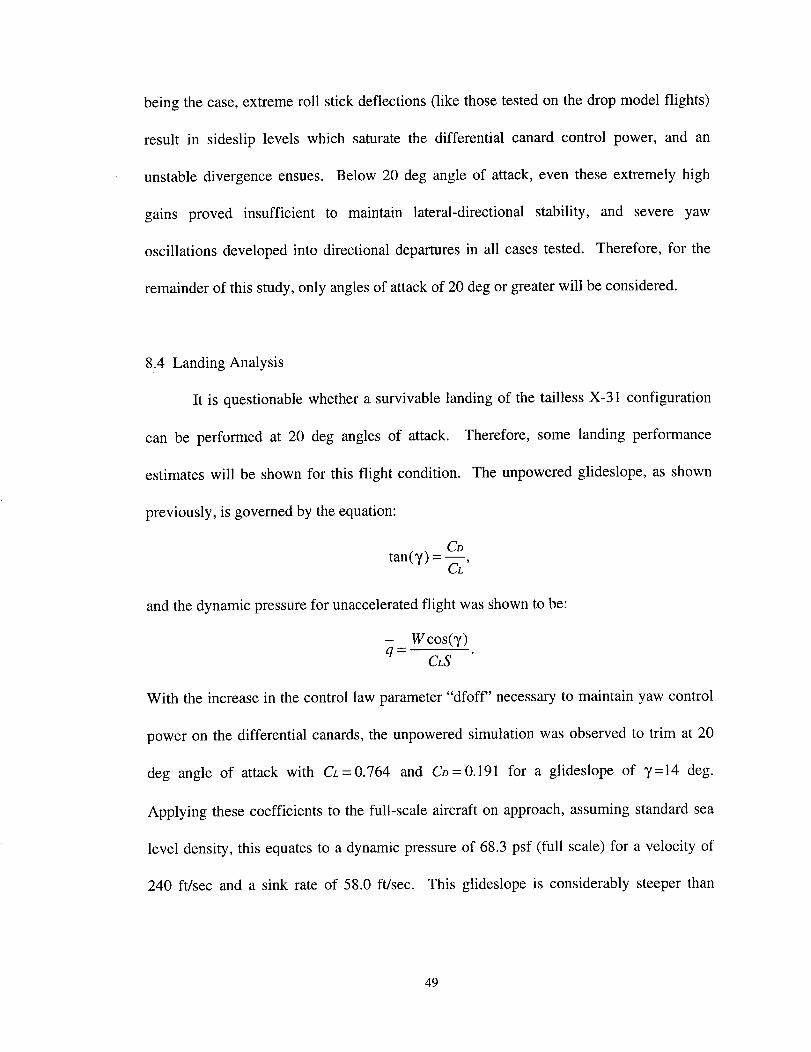
being the case, extreme roll stick deflections (like those tested on the drop model flights)
result in sideslip levels which saturate the differential canard control power, and an
unstable divergence ensues. Below 20 deg angle of attack, even these extremely high
gains proved insufficient to maintain lateral-directional stability, and severe yaw
oscillations developed into directional departures in all cases tested. Therefore, for the
remainder of this study, only angles of attack of 20 deg or greater will be considered.
8.4 Landing Analysis
It is questionable whether a survivable landing of the tailless X-31 configuration
can be performed at 20 deg angles of attack. Therefore, some landing performance
estimates will be shown for this flight condition. The unpowered glideslope, as shown
previously, is governed by the equation:
CDtan(7 ) = --,
CL
and the dynamic pressure for unaccelerated flight was shown to be:
- Wcos(7)q-
CLS
With the increase in the control law parameter "dfoff" necessary to maintain yaw control
power on the differential canards, the unpowered simulation was observed to trim at 20
deg angle of attack with CL=0.764 and Co=0.191 for a glideslope of 7=14 deg.
Applying these coefficients to the full-scale aircraft on approach, assuming standard sea
level density, this equates to a dynamic pressure of 68.3 psf (full scale) for a velocity of
240 ft/sec and a sink rate of 58.0 ft/sec. This glideslope is considerably steeper than
49
anythingnormallyperformedby this typeof aircraftonapproach,but aflare analysiswill
beconductedto determinethepossibiltyof suchanunorthodoxmaneuver.
Assuming a pitch-up to 30 deg angleof attack to flare for touchdown,the
unacceleratedflight constraintcan be temporarilyrelieved resulting in the following
equationsfor therateof changeof totalveloctity, l;'r, andsinkrate,l;'o,
V'T = g sin(y) pSVrZC° and2m
pSVr 2[CL cos(y) + Co sin(y)]Vo = g
2m
Starting with the above conditions, CL = 1.12, and Co = 0.50 at 30 deg angle of attack,
Fig. 74 shows the resulting velocities for the full-scale aircraft as a function of time. This
figure shows that if the pilot has timed his flare perfectly, the minimum descent rate he
could possibly achieve with this scenario is 27.3 ft/sec with a touchdown airspeed of 195
ft/sec.
With power on, the trim flight conditions are more complicated:
W = Fr sin(a- y) + D sin(y) + L cos(y), and
Dcos(y) = Lsin(y) + Frcos(a- y).
Solving the second equation for FT and substituting:
W = D[sin(y) + cos(y) tan(a- y)] + L[cos(y) + sin(y) tan(a - y)], or
W = qS{ Co[sin(T) + cos(T)tan(a- y)]+ CL[cos(y) + sin(y)tan(a- y)]}
for a dynamic pressure of:
50

W
g = S {CD[sin (3') + cos( 3' ) tan (Or- 3') ] + CL[cos( 3' ) + sin (3') tan (or - 3' ) ]}
For trimmed flight of the full-scale X-31 with a glideslope of 3' =4 deg, this results
in a dynamic pressure of 63.6 psf or an approach velocity of 231 ft/sec and a sink rate of
16.1 ft/sec.
Assuming the steepest safe landing can be performed with a glideslope of up to
3'=4 deg with an airspeed of 170 kts and no flare results in a maximum sink rate of
20.0 ft/sec. With this criteria, it has been shown that a safe landing can be achieved with
a powered approach at 20 deg angle of attack. However, in an engine out condition the
minimum touchdown sink rate exceeds these limits by at least one third.
51

9. Conclusions
The purpose of this report was to investigate the possibility of using differential
deflection of the canard surfaces on the X-31 to supplement the available yaw control
authority. Furthermore, the possibility of using the yaw control power of the differential
canard to control the X-31 with a reduced vertical tail was examined.
The height of the vertical tail on the X-31 has a linear relationship with directional
static stability only at 0 degrees angle of attack where removal of the vertical tail reduced
static directional stability from 0.002 to -0.004 per degree. Between 20 and 30 degrees
angle of attack, the portion of the vertical tail from 20% up to and including 60% actually
exhibited a destabilizing effect. Above 50 degrees angle of attack, no part of the vertical
tail made any significant contribution to the static stability of the aircraft.
Differential deflection of the canard surfaces was shown to produce significant
levels of yawing moment on the X-31 configuration, particularly at angles of attack above
40 degrees. Although thrust vectoring provides superior levels of yawing moment below
40 degrees angle of attack, the addition of differential canard deflection could effectively
provide augmentation or redundancy in yaw controls for this configuration throughout the
angle-of-attack range. In fact, it was shown that the combination of both rudder and
differential canard deflections may provide yaw control power with levels similar to those
available through thrust vectoring over the entire angle-of-attack range from 0 deg to 80
deg. If used in conjunction with the existing thrust vectoring on the X-31, differential
canard may be able to double the available yawing moment at high angles of attack.
52
Alternately, differential canard could be combined with thrust vectoring or rudder
deflections to generate direct sideforce, and each of these benefits could be achieved
without any physical modifications to the airframe.
It was determined that with the addition of differential canard as a yaw controller,
the lateral control power is high enough that the initial response to a coordinated wind-
axis roll command would remain limited by yaw control authority. However, it was
shown that the maximum wind-axis roll rates which can be sustained will be limited by
the pitch authority required to compensate for inertial coupling in some cases.
Drop model flight tests correlated with the yaw control power of the differential
canards evidenced in the wind-tunnel tests. During drop model flights, coordinated,
wind-axis rolls were performed at 50 deg angle of attack with wind-axis roll rates up to
100 deg/sec (27% model scale), and as predicted, the inertial coupling reached the limit
of the pitch control authority. The behavior of the tailless X-31 was also investigated in a
drop model flight. During that flight, it was demonstrated that differential canard was
able to maintain level flight. However, with the flight control laws implemented for that
flight, controllability was not demonstrated and departures characterized by body-axis
rolling and a pitch up were observed.
Simulation studies were conducted which correlated with the drop model flights
to validate the six-degree-of-freedom, nonlinear simulation of the X-31 drop model.
Control laws based on the decoupled, linear equations were then developed and tested in
the non-linear simulation. While the removal of the vertical tail greatly increased the
available yawing moment around the stall point, the reduction in differential canard
53
control power for this configurationat lower anglesof attack was shown to be the
limiting factor for controlledflight without the useof thrust vectoringon the tailless
X-31. Evenso,controlledflight wasdemonstratedin thesimulatorat anglesof attackas
low as20 degrees,andit wasshownthat a safelandingcanbeachievedwithout theuse
of thrustvectoringaslongastheengineis still running.
54
10. Recommendations for Further Study
Differential canard deflection may be useful as either a yawing moment or direct
sideforce generator on future aircraft designs. However, due to the variation in results
obtained on different configurations, there is obviously a need for more thorough testing
of the effect of each feature of a configuration on differential canard effectiveness.
A detailed pressure survey over the canards and along the fuselage around the
location of the canards could be performed to determine exactly where along the fuselage
the pressure differential generated by the canards acts. This information might lead to
canard designs and placements to optimize the yawing moment due to differential
deflection.
A pressure survey at the location of the vertical tail surface for both single and
twin tailed configurations might create a better understanding of the influence of
differential canards on the vertical tails and rudders.
55

1. Lennox, D.; Rees,A.; ed.:
Group,1990.
2. Nguyen,L. T.; and Gilbert, W. P.:
References
Jane's Air-LaunchedWeapons. Jane's Information
Impact of EmergingTechnologieson Future
CombatAircraft Agility. AIAA-90-1304,May 1990.
3. Costes,P.: Investigationof Thrust Vectoring and Post-Stall Capability in Air
Combat.AIAA-88-4160-CP.1988.
4. Cobleigh,B. R.: High-Angle-of-AttackYawing MomentAsymmetryof the X-31
Aircraft from FlightTest. NASA CR 186030.Sept.1994.
5. Greer,H.D.: Summaryof DirectionalDivergenceCharacteristicsof SeveralHigh
PerformanceAircraft Configurations.NASA TN D-6993. Nov. 1972.
6. La Froth,R. E.: ThrustVectoringto EliminatetheVertical Stabilizer. M. S.Thesis,
Air ForceInstituteof Technology.Dec.1979.
7. Lok, J. J.: Stealth-ModifiedF-16sin Service.Jane'sDefenceWeekly,vol. 13,no.4.
Jan.27, 1990.
8. Hahne, D. E.: Wind-Tunnel Investigationof Three Potential ForebodyVortex
ControlDevices.NASA TM 4681. Sept.1995.
9. Hynes,S.: The X-31 Quasi-TaillessFlight Experiment. Oral Presentationto the
AGILE ResearchGroup. Jan.1995.
10.Agnew, J. W.; and Hess,J. R.: Benefitsof AerodynamicInteractionto the Three
SurfaceConfiguration.AIAA-79-1830. Aug. 1979.
56
11.Croom, M. A.; Grafton, S. B.; and Nguyen, L. T.: High Angle-of-Attack
Characteristicsof Three-SurfaceFighterAircraft. AIAA-82-0245,Jan.1982.
12.Etkin, B.: Dynamicsof AtmosphericFlight. 1972.
13.Weissman,R.: StatusandDesignCriteria for PredictingDepartureCharacteristics
andSpinSusceptibility.AIAA-74-791,Aug. 1974.
14.Georg,Hans-Ulrich: EnhancedFighterManeuverabilityDescriptionandPreliminary
Resultsof theFull-ScaleEFMThrustVectoringGroundTests.Aug. 1987.
15.Tamrat,B. F.; andAntani,D. L.: StaticTestResultsof anExtemallyMountedThrust
VectoringVaneConcept.AIAA-88-3221. July 1988.
16.Plaetschke,E.; andWeib, S.: Identificationof ThrustVectorEffectivenessfrom X-
31AFlightTestData. Z. Flugwiss.Weltraumforsch.17. 1993.
17.Nguyen, L. T.; et al: Simulator Study of Stall/Post-Stall Characteristics of a Fighter
Airplane with Relaxed Longitudinal Static Stability. NASA TP 1538. Dec. 1979.
18. Croom, M. A.; et al: Dynamic Model Testing of the X-31 Configuration for High-
Angle-of-Attack Flight Dynamics Research. AIAA 93-3674 CP. Aug. 1993.
19. Villeta, J. R.: Lateral-Directional Static and Dynamic Stability Analysis at High
Angles of Attack for the X-31 Configuration. M. S. Thesis, George Washington
University. Aug. 1992.
57

Table 1: Basic Characteristics of the X-31 as Tested for Static Models
Full Scale 27% 19% 13.3%Centerof Gravity:
FS (inches) 269.2 72.7 51.0 35.8BL (inches) 0.0 0.0 0.0 0.0WL (inches) -2.0 -0.54 -0.38 -0.267
Wing:Span(ft) 22.83 6.16 4.34 3.04MeanAerodynamicChord(ft) 12.35 3.33 2.35 1.65ReferenceArea(sq.ft) 226.30 16.5 8.17 4.02
VerticalTail:
Height (ft) 6.81 1.84 1.29 0.908
Reference Area (sq.ft) 37.55 2.74 1.35 0.668
Fuselage:
Length (ft) 43.33 11.7 8.23 5.78
Canard:
Span (ft) 8.64 2.33 1.64 1.15
Reference Area, Total (sq.ft) 23.6 1.72 0.852 0.420
58

Table 2: Basic Characteristics of the X-31 as Tested for Dynamic Vehicles
(Full Scale)
Weight (lb) 14500
Center of Gravity:
FS (inches) 269.2 72.2
BL (inches) 0.0 0.0
WL (inches) -2.0 -0.54
Moments of Inertia:
Ix (slug sq.ft) 3090 9.16
Iy (slug sq.ft) 34300 122
Iz (slug sq.ft) 35200 126
Ixz (slug sq.ft) -145 -0.39
Wing:
Span (ft) 22.83 6.16
Mean Aerodynamic Chord (ft) 12.35 3.33
Reference Area (sq.ft) 226.30 16.5
Aspect Ratio 2.30 2.3
Sweep, Inboard (deg) 57 57
Sweep, Outboard (deg) 45 45
Vertical Tail:
Height (ft) 6.81 1.84
Reference Area (sq.ft) 37.55 2.74
Aspect Ratio 1.24 1.24
Sweep (deg) 50 50
Aerodynamic Center:
FS (inches) 422 114
WL (inches) 70 18.9
Volume Coefficient 0.0925 0.0925
Fuselage:
Length (ft) 43.33 11.7Canard:
Span (ft) 8.64 2.33
Reference Area, Total (sq.ft) 23.6 1.72
Aspect Ratio 3.18 3.18
Sweep (deg) 45 45
Aerodynamic Center:
FS (inches) 77 20.8
WL (inches) 0.00 0.00
Post-Exit Thrust Vectoring Vanes:
Center of Pressure:
FS (inches) 480 130
(27% Drop Model)550
59
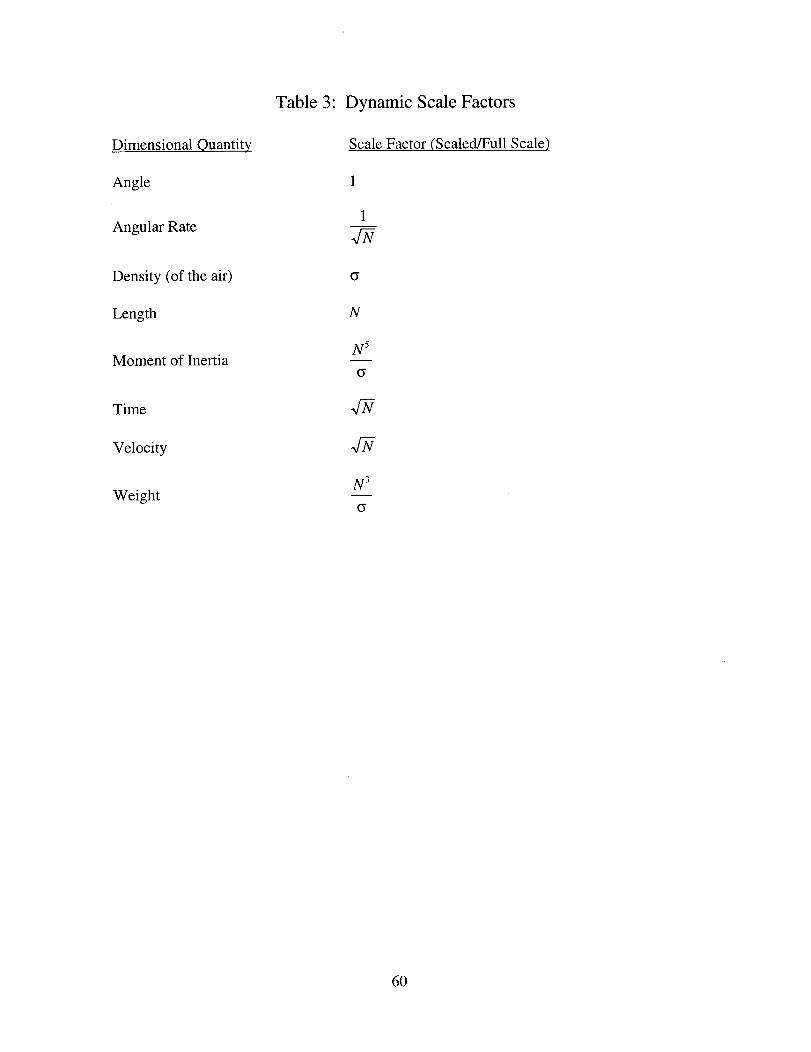
Dimensional Quantity
Angle
Angular Rate
Density (of the air)
Length
Moment of Inertia
Time
Velocity
Weight
Table 3: Dynamic Scale Factors
Scale Factor (Scaled/Full Scale)
1
1
N
N 5
G
N 3
60

aoafb
aoalu
betcor
mic
psel
pstkt
pys
qbar
qsel
rsel
rsprt
Table 4: Definition of Control Law Parameters
(see Fig. 60)
Table 4.a: Inputs
Angle of attack, corrected and filtered, in degrees
Angle of attack, limited between 0 and 80 degrees
Sideslip angle, corrected and filtered, in degrees
Pitching moment due to inertial coupling, calculated from psel and rsel
Roll rate, corrected and filtered, in degrees per second
Pilot pitch stick plus trim
Pilot yaw stick (rudder pedal)
Dynamic pressure, calculated in pounds per square foot
Pitch rate, corrected and filtered, in degrees per second
Yaw rate, corrected and filtered, in degrees per second
Pilot roll stick plus trim
LCANARD
LFLAP
RCANARD
RFLAP
RUDDER
Table 4.b: Uplink Commands
Left (port) canard command, in degrees
Left (port) trailing edge flap command, in degrees
Right (starboard) canard command, in degrees
Right (starboard) trailing edge flap command, in degrees
Rudder command, in degrees
61
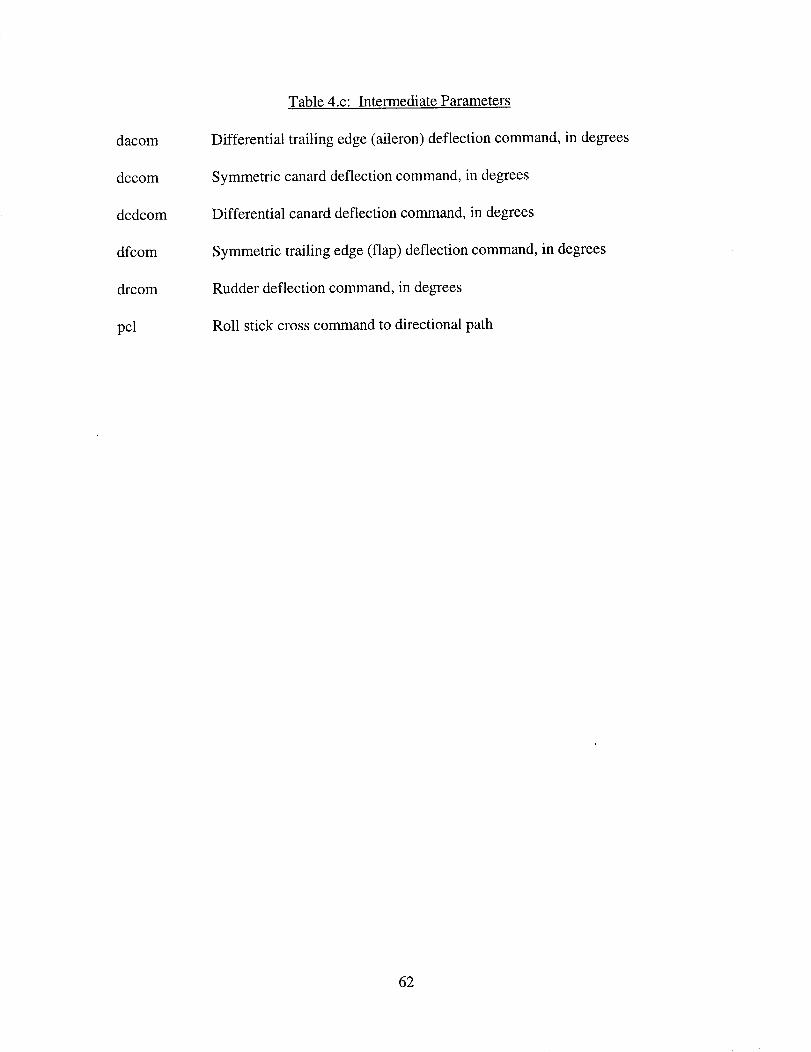
dacom
dccom
dcdcom
dfcom
drcom
pcl
Table 4.c: Intermediate Parameters
Differential trailing edge (aileron) deflection command, in degrees
Symmetric canard deflection command, in degrees
Differential canard deflection command, in degrees
Symmetric trailing edge (flap) deflection command, in degrees
Rudder deflection command, in degrees
Roll stick cross command to directional path
62
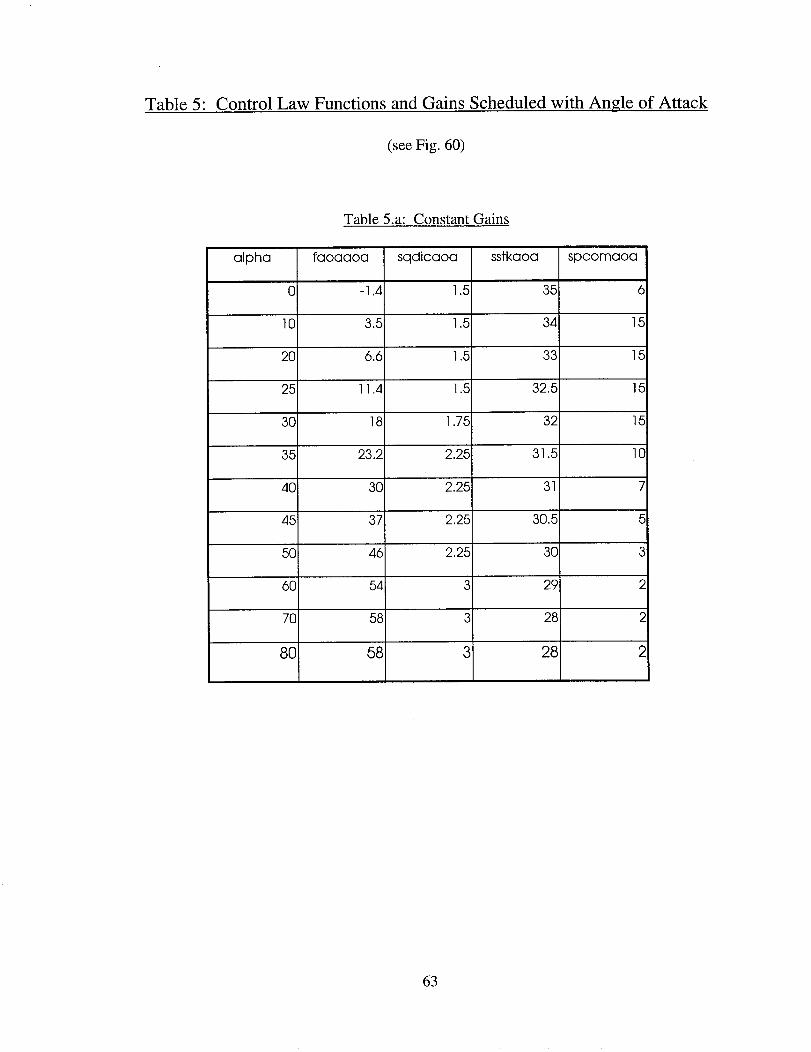
Table 5: Control Law Functions and Gains Scheduled with Angle of Attack
(see Fig. 60)
Table 5.a: Constant Gains
alpha faoaaoa sqdicaoa sstkaoa spcomaoa
0 -1.4 1.5 35 6
10 3.5 1.5 34 15
20 6.6 1.5 33 15
25 11.4 1.5 32.5 15
30 18 1.75 32 15
35 23.2 2.25 31.5 10
40 30 2.2,5 31 7
45 37 2.25 30.5 5
50 46 2.26 30 3
60 54 3 29 2
70 58 3 28 2
80 58 3 28 2
63

Table 5.b Gains Used on Drop Model Flight 26
Drop 26
alpha spaaoa
0 0,05
10 0.05
20 0.052
25 0.065
30 0.1
35 0,39
40 0.52
45 0.364
50 0.208
60 0,104
70 0.104
80 0.104
sbaaoa ssriaoa
-0.55
1.05
1.74
2.11
2.29
srraoa
0.052
0.104
0,156
0.208
0.26
sbraoa
-0.03
-0.045!
-0.06
0 2,43 0.65 -0.12
0 2.36 1.04 -0.18
0 5.83 0.728 -0.5
0 16.8 0.416 -1
10.1 0.364
0.39
0.39
-1
-1
-1
64
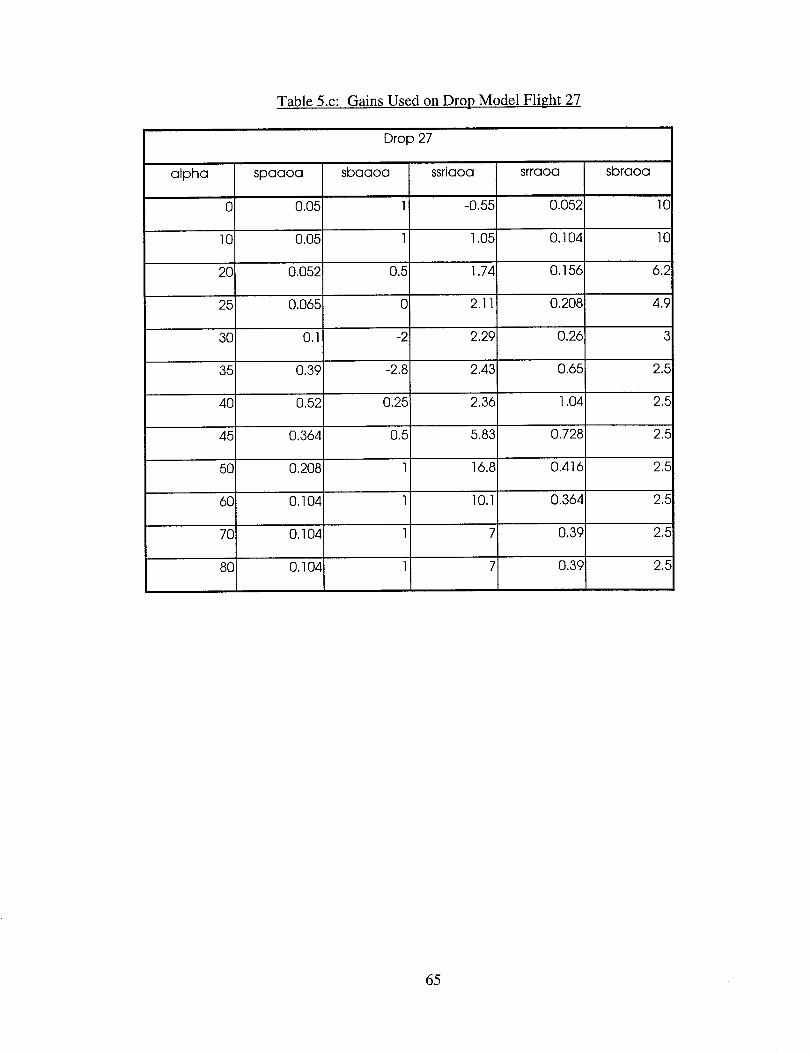
Table 5.c: Gains Used on Drop Model Flight 27
Drop 27
alpha spaaoa
0 0.05
10 0.05
20 0.052
25 0.065
30 0,1
35 0.39
40 0.52
45 0.364
50 0.208
60 0.104
70 0.104
80 0.104
sbaaoa ssriaoa
-0.55
srraoa
0.052
1 1.05 0.104
0,5 1.74 0.156
0 2,11 0.208
-2 2.29
-2.8 2.43
0.25 2.36
0.5 5.83
1 16.8
1 10.1
1 7
1 7
sbraoa
10
10
6.2
4.9
0.26 3
0,65 2.5
1.04 2.5
0.728 2.5
0.416 2.5
0.364 2.5
0,39 2.5
0.39 2._
65
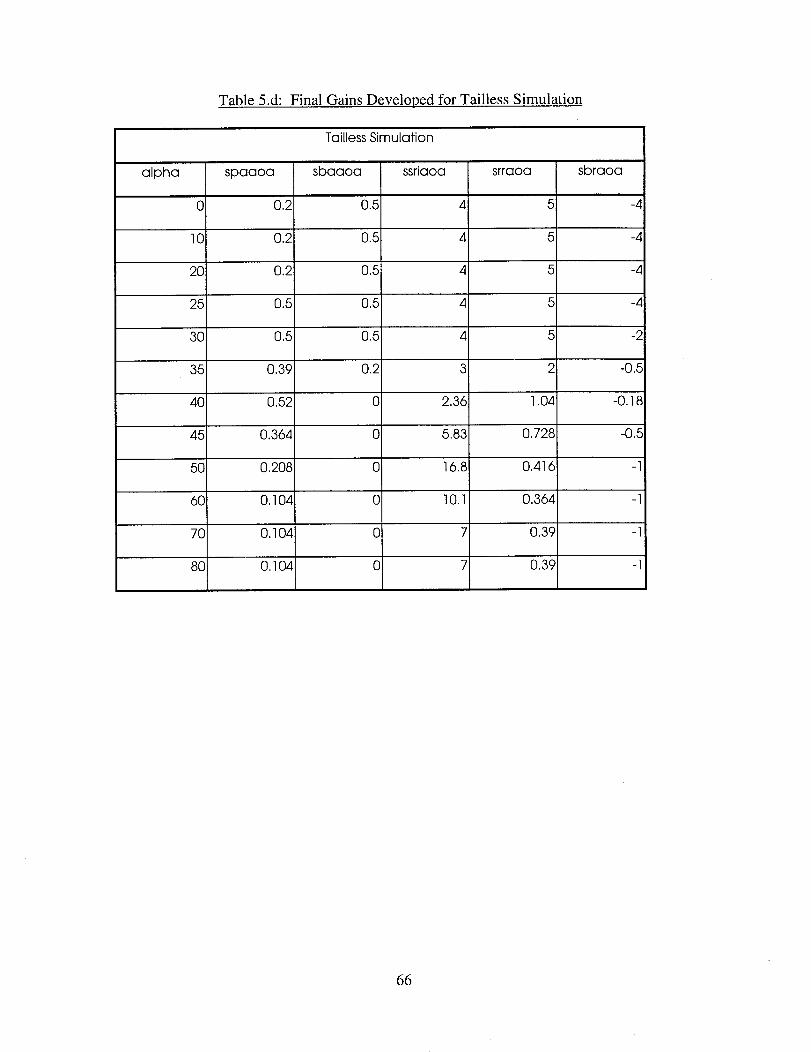
Table 5.d: Final Gains Developed for Tailless Simulation
Tailless Simulation
alpha spaaoa sbaaoa ssriaoa srraoa sbraoa
0 0.2 0.5 4 5 -4
10 0.2 0.5 4 5 -4
20 0.2 0.5 4
25 0.5 0.5 4
30 0.5 0.5 4 5 -2
35 0.39 0.2 3 2 -0,5
40 0.52 0 2.36 1,04 -0.18
45 0.364 0 5,83
50 0.208 0 16.8
60 0.104 0 10.1
7O 0.104
80 0,104 0 7
0.728 -0.5
0.416 -1
0.364 -1
0.39 -1
0.39 -1
66

Table 6: Control Law Gains Scheduled with Dynamic Pressure
(see Fig. 60)
Table 6.a: Schedule 1
qbar
5O
saoaqbar sqqbar
1,5
sqdicqbar
0.02
100 0.5 1 0.01
250 0.25 0.5 0.004
1000 0 O! 0.001
Table 6.b: Schedule 2
qbar spcomqbar spaqbar
0 1 1
30! 1 1
45 1 1
60 0.7 0.5
100 O,3 0.1
1000 0.1 0.1
67

Table 7: Other Control Law Gains and Limits
(see Fig. 60)
Table 7.a: Constant Gains and Limits
aoaauth
qauth
IOC
IC
qdicauth 10
dcscale 1.5
dfscale 1
pstkauth 100
rstkauth
paauth
baauth
100
30
20
pedauth 30
sriauth 30
gdcd
rrauth
brauth
1
3C
IC
aillim 3C
flaplim 3C
rudlim 3C
dcdlim 2C
Table 7.b:
dfoff
Gains Changed for Tailless Simulation
Drop Model Tailless Simulation
15 25
68
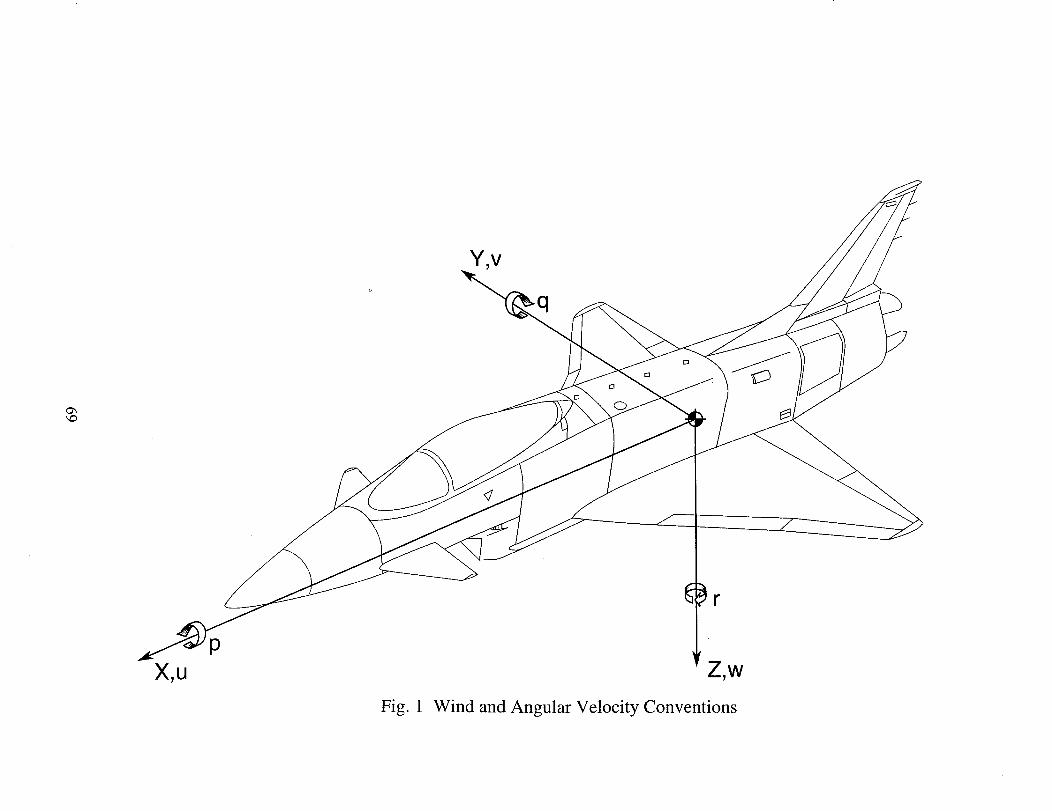
Fig.
Z,W
Wind and Angular Velocity Conventions
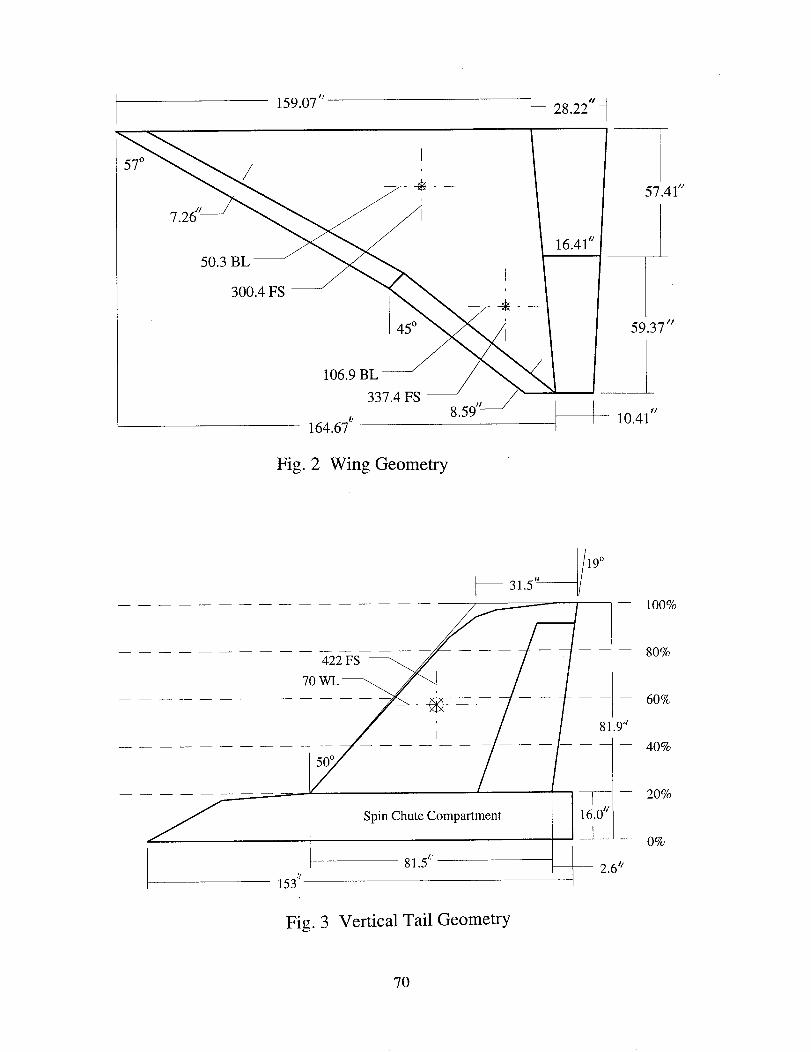
159.07"
I
/ ___
50.3 BL
300.4 FS --
I
106.9 BL-
164.67'10.41
Fig. 2 Wing Geometry
57.41"
.___ __ 100%422FS _ -- 80%
/ /• -- 60%
i
4O%
7" /S in ChuteCom ,art ntP" P "-t'
O%
81 5;". __ 2.60:t
153
Fig. 3 Vertical Tail Geometry
7O
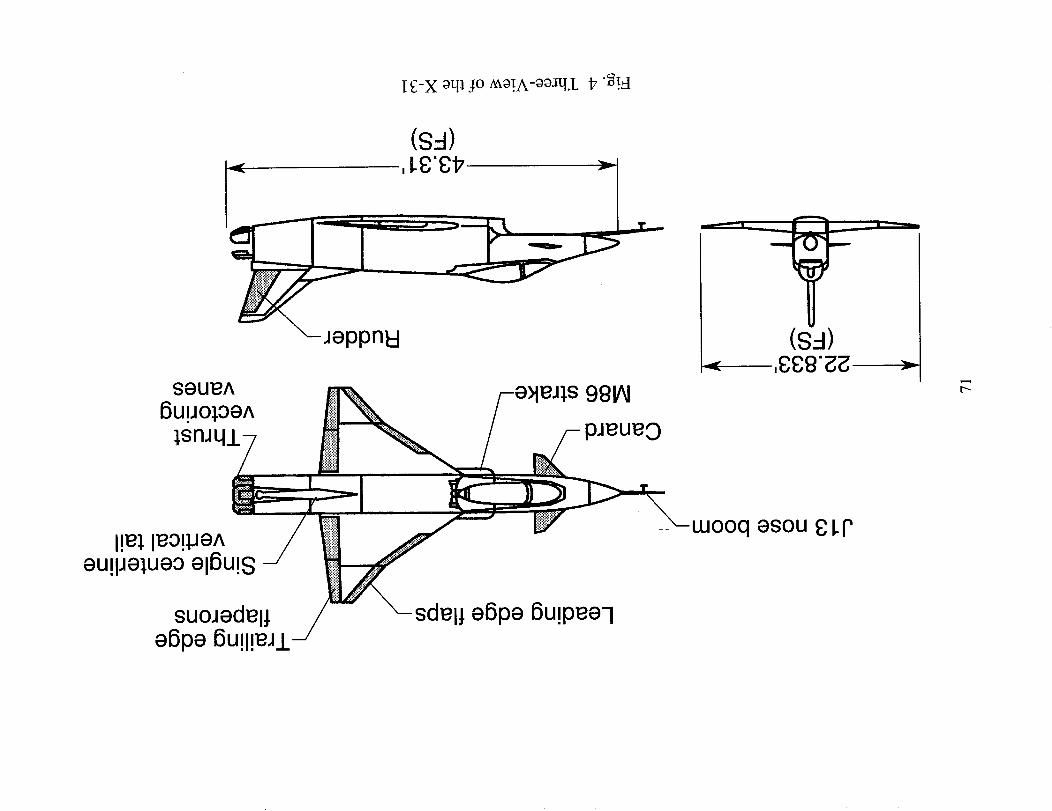
I E-X _q:l jo mO!A-_.IqJ_ 17"_!_I
(S_)
Jeppnl=l
seue^ _ r-e>leJ_s 981AIUlJO]OeA [_ /
;snJq
_i --Luooq
,,_ ,_o!_oA / I_ _ _ _ osou8UllJe],ueo el6u_s J
• suoJede_l /- X-sdelt e6pe 6u!peeq
eBpe 6U,l,eJ_L--/
_Lr

FS
--4tO
BL
WL
Center ofengineexhaustWL 0.0
Canard hinge lineWL 0.0
NoseFS -22 Fig. 5 Dimension Coordinate System

1.5
1.0
CL .5
0
-.5
0
[]
Run364374
Canard
-40
0
LE
40/32
0/0
2.0
1.6
1.2
CD
.8
.4
.15
.10
.05
Cm 01
-.05
-.10
-.150
,__ .,__,..,___--[3..r -_D-4:_E1-4
X....,.,
\
10 20 30 40 50 60 70 80
angle-of-attack
Fig. 6 Basic Aerodynamic Characteristics of the X-31
73
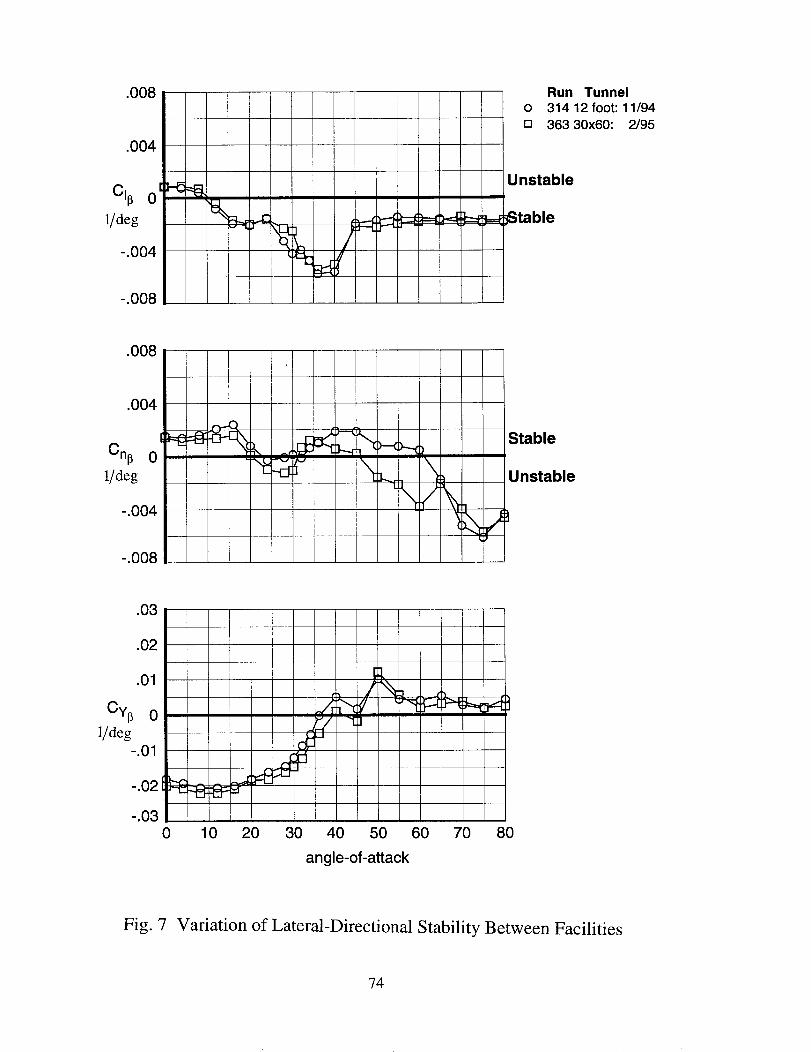
.OO8
.004
Cii3 0 i
1/deg
-.004
-.008
F_ _L /'-"
Run Tunnelo 314 12 foot: 11/94
[] 36330x60: 2/95
Unstable
_table
.008
.004
Cnfi 0
1/deg
-.004
-.008
iI
½@_ \
Stable
Unstable
.O3
.02
.01
Cy_ 0
]/deg-.01
-.02
-.03
L
r"lZ _2(_ i k
i II 1 ,
0 10 20 30 40 50 60 70
angle-of-attack
I
80
Fig. 7 Variation of Lateral-Directional Stability Between Facilities
74
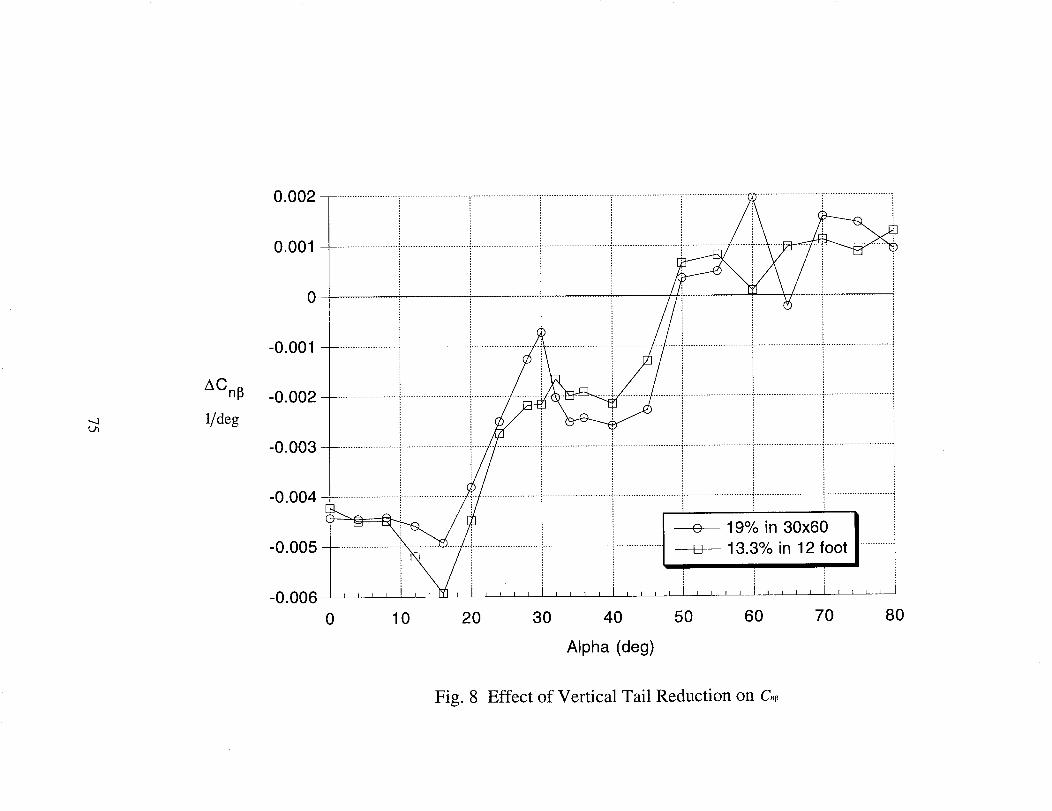
'-4
ACnl3
1/deg
0.002
0.001
0
-0.001
-0.002
0 10
19% in 30x60
---EF-- 13.3% in 12 foot
20 30 40 50 60 70
Alpha (deg)
80
Fig. 8 Effect of Vertical Tail Reduction on Cn,

.008
.004
CII} 0
1/deg
-.004
-.008
I
I
Runo 314[] 318<> 316z_ 330Ix 285r,, 333
Unstable
=--=_-,.. _ _[]___Stable
!
V-Tail100%80%60%40%20%0%
.008
.004
i
Cnl3 0 I
l/deg
-.004
-.008
.O3
.02
.01
Cy_ 0
1/deg.01_
-.02_-.03
0 10 20 30 40 50 60 70 80
angle-of-attack
Fig. 9 Effect of Vertical Tail Reduction on Static Lateral-Directional
Stability for 13.3 % Model in 12-Foot Low Speed Wind-Tunnel
76
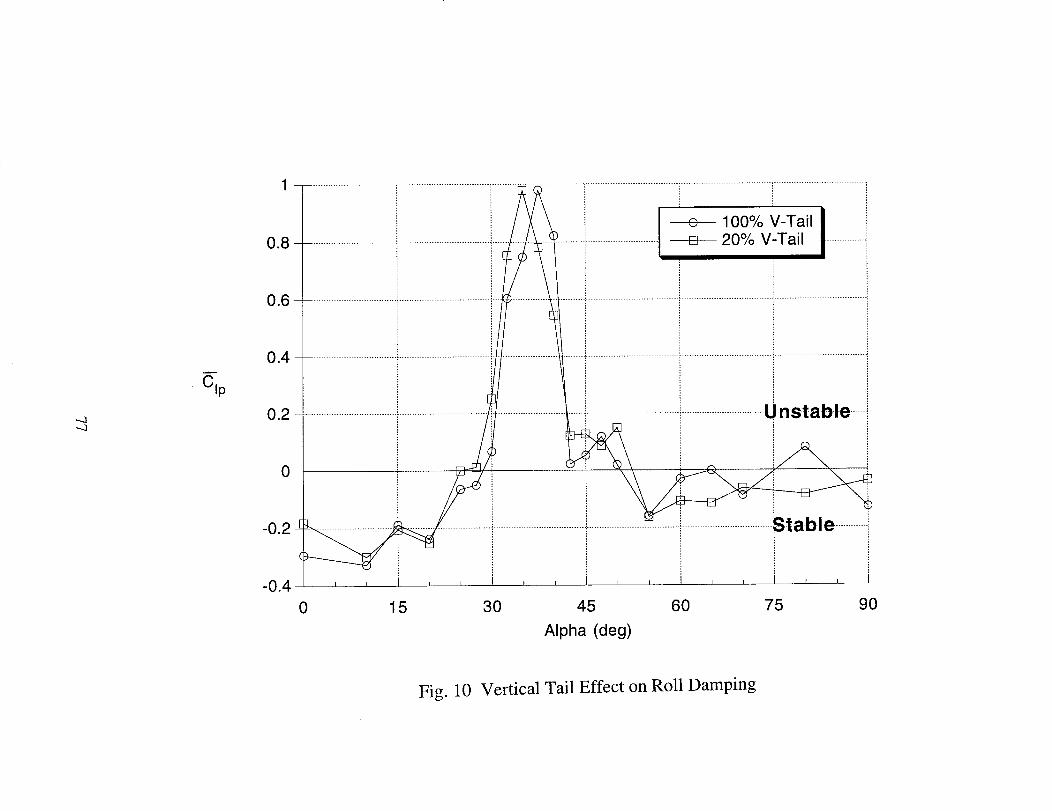
.--4,--.3
Cip
0.8
0.6
0.4
0.2
0
-0.2
-0.4
0 15
I I
---e-- 100% V-Tail20% V-Tail
Stable .............,
I I I I
30 45 60 75
Alpha (deg)
I
90
Fig. 10 Vertical Tail Effect on Roll Damping

_o
_-0_1
I ........... 0
°_
c_
0
o_c_
c_
o_
78
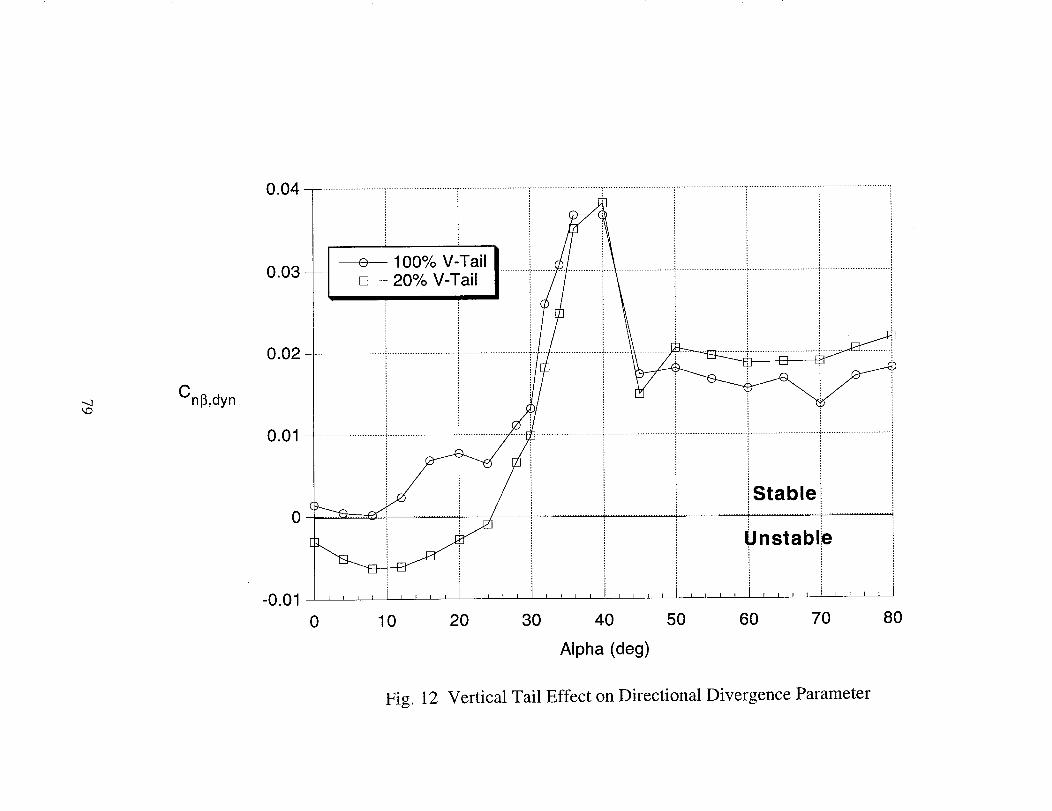
'-4kO
Cnl3,dyn
0.04
0.03
0.02
0.01
0
-0.01
100% V-Tail20% V-Tail
0
Stablei
Unstabl_e
10 20 30 40 50 60 70
Alpha (deg)
8O
Fig. 12 Vertical Tail Effect on Directional Divergence Parameter
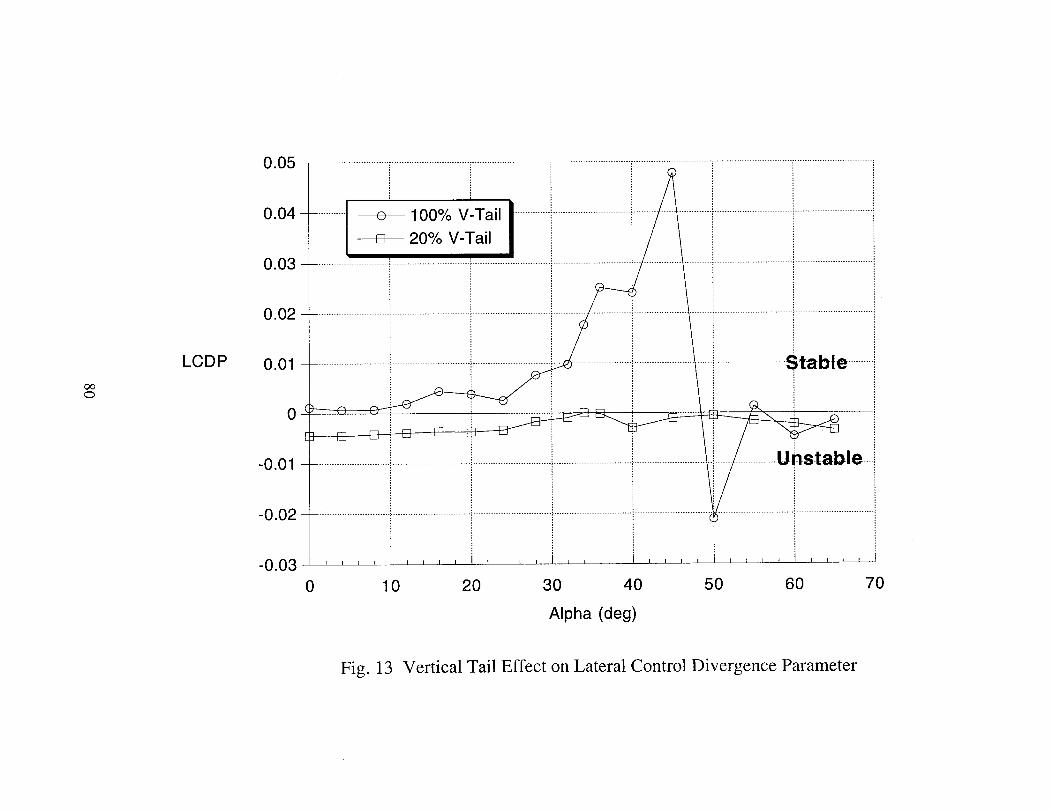
c_O
LCDP
0.05
0.04
0.03
0.02
0.01
0
-0.01
-0.02
-0.03
100% V-Tail
20% V-Tail
Stable ...........
.............U 1stable- _
0 1 0 20 30 40 50 60 70
Alpha (deg)
Fig. 13 Vertical Tail Effect on Lateral Control Divergence Parameter

co
rb
LCDP
0.05
0.04
0.03
0.02
0.01
-0.01
-0.02
-0.03
.... i .... i .... ',.... i .... i o_4_o''.... _....
__o;o_o........ Strong Directional Divergence ....................! Mild Initial Yaw Departure .......
with Roll Reversal Followed by Roll Reversal
........ (High Spin Susceptibility) ...................................i ...................__ 5oo..................!........................
I .... I .... I , , , , , , , , I , , , , I , , , , I , , , ,
-0.04 -0.03 -0.02 -0.01 0 0.01 0.02 0.03 0.04
Cnl3,dyn
Fig. 14 Departure Criteria for 20% Vertical Tail
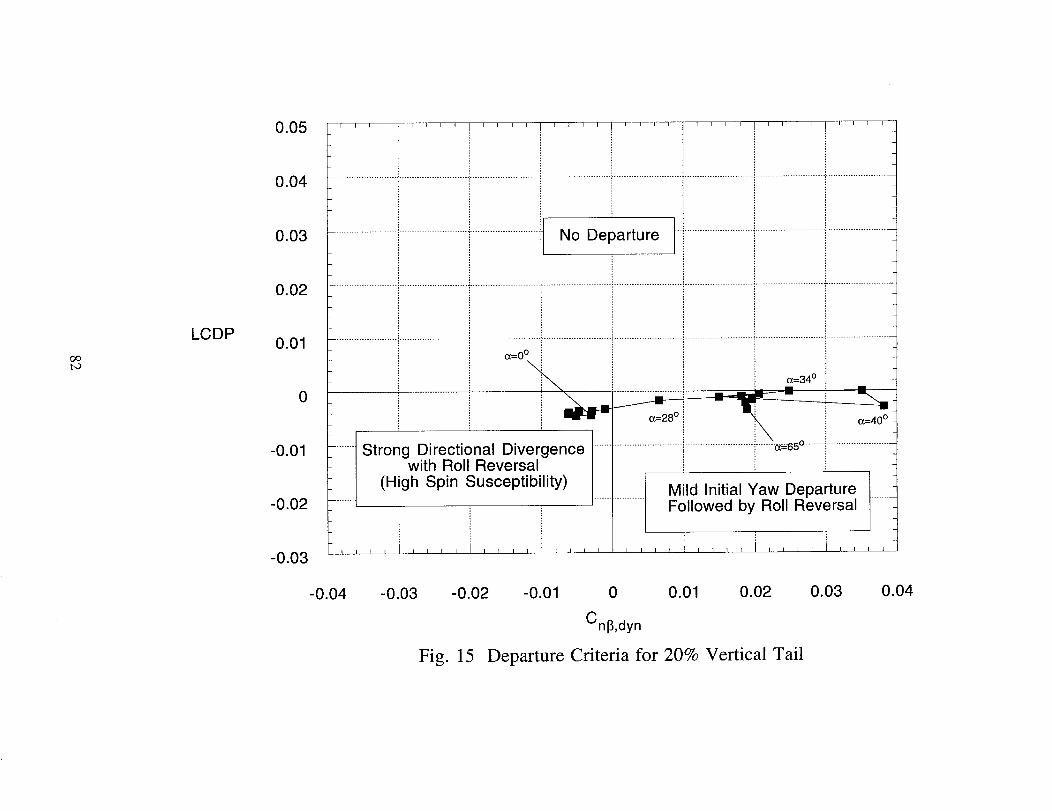
ooto
LCDP
0.05
0.04
0.03
0.02
0.01
0
-0.01
-0.02
-0.03
-0.04
I I I I i _ I _ I I I [ I I I I I I I I I I I I ( I I I I I I I
.................................................................................No Departure .....................................................................................
........................ ,........................... _ ............................ _............................ _ ....................................................... _ ........................... _..........................
0_=00
a=34 o
; " m i m
1 O'ver encetStrong Directionalwith Roll Reversal
Susceptibility) Mild Initial Yaw Departure ].......
(High Spin ............ Followed by Roll Reversal 1
" i i i,,,,q,,,,i,,,,i,,,, ,,,,t,,,,J,,,,I,,,,
-0.03 -0.02 -0.01 0 0.01 0.02
Cn[3,dyn
Fig. 15 Departure Criteria for 20% Vertical Tail
0.03 0.04

O0L_3
_ 107.52 _-
_ 75.00 _- i
Configuration A Configuration B
Fig. 16 Directional Control Power of Differential Canard from a Previous Study
a. Configurations Studied

oo4_
.01
0
-.01ACn'ScD -.02
-.03
-.04
I
I
0
Configuration A
VertiCaIo[]Onofftail I
0 10 20 30 40 50 60 70 80 90
o_,deg
.01
0
ACn,Sc D -.01-.02 -
-.03 -
-.04
-10
Configuration B
I Vertical tail
[] Off _
0
I I I I I I I I I
10 20 30 40 50 60 70 80 90
o_,deg
Fig. 16 Directional Control Power of Differential Canard from a
Previous Study
b. Directional Control Power

.10
.05
ACL 0
-.05
-.10
o[]<>
Run
425426419427
Sym.Can.-40-40-40-40
Diff.Can.
5102030
.10
.05
ACD 0
-.05
-.10
•I°l.05
ACm O_
-.05
-.100 10 20 30 40 50 60 70 80
angle-of-attack
Fig. 17 Effect of Differential Canard Deflection with 100% Vertical Tail
for 19% Model in 30- by 60-Foot Tunnel
a. Longitudinal
85
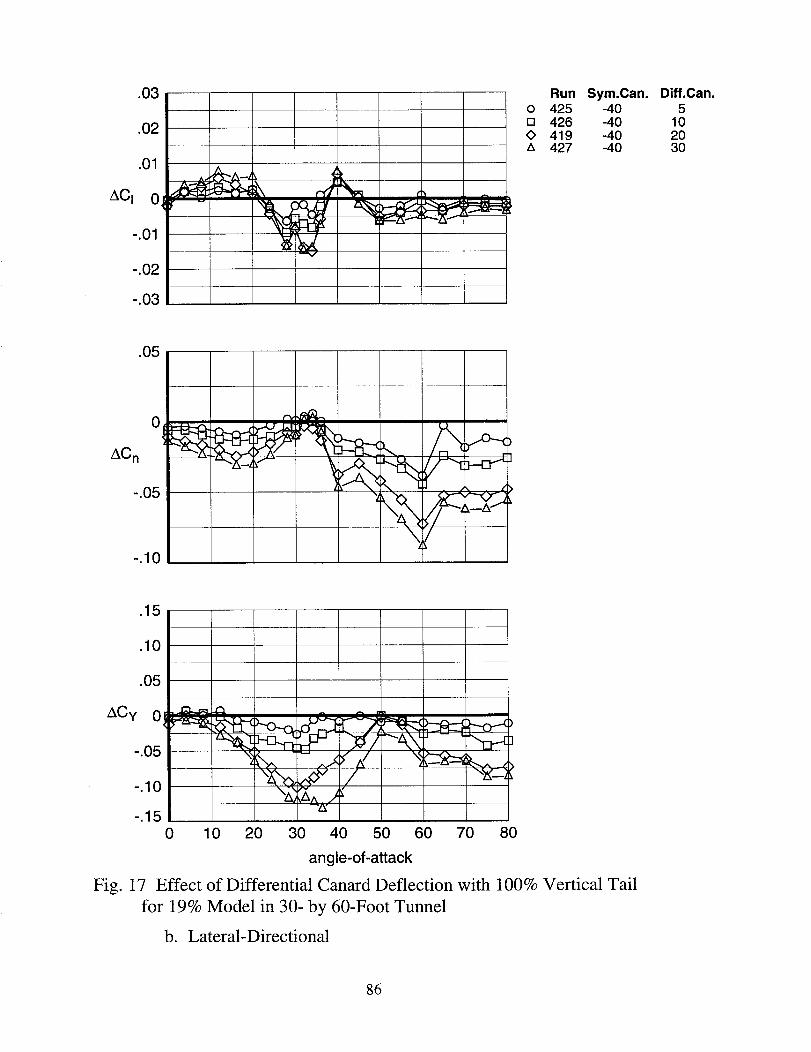
.03
.02
.01
ACl 0
-.01
-.02
-.03
r
o
[]
OLX
Run425426419427
Sym.Can.-40-40-40-40
Diff.Can.5
102030
.05
.15
.10
.05
-.150 10 20 30 40 50 60 70 80
angle-of-attack
Fig. 17 Effect of Differential Canard Deflection with 100% Vertical Tail
for 19% Model in 30- by 60-Foot Tunnel
b. Lateral-Directional
86
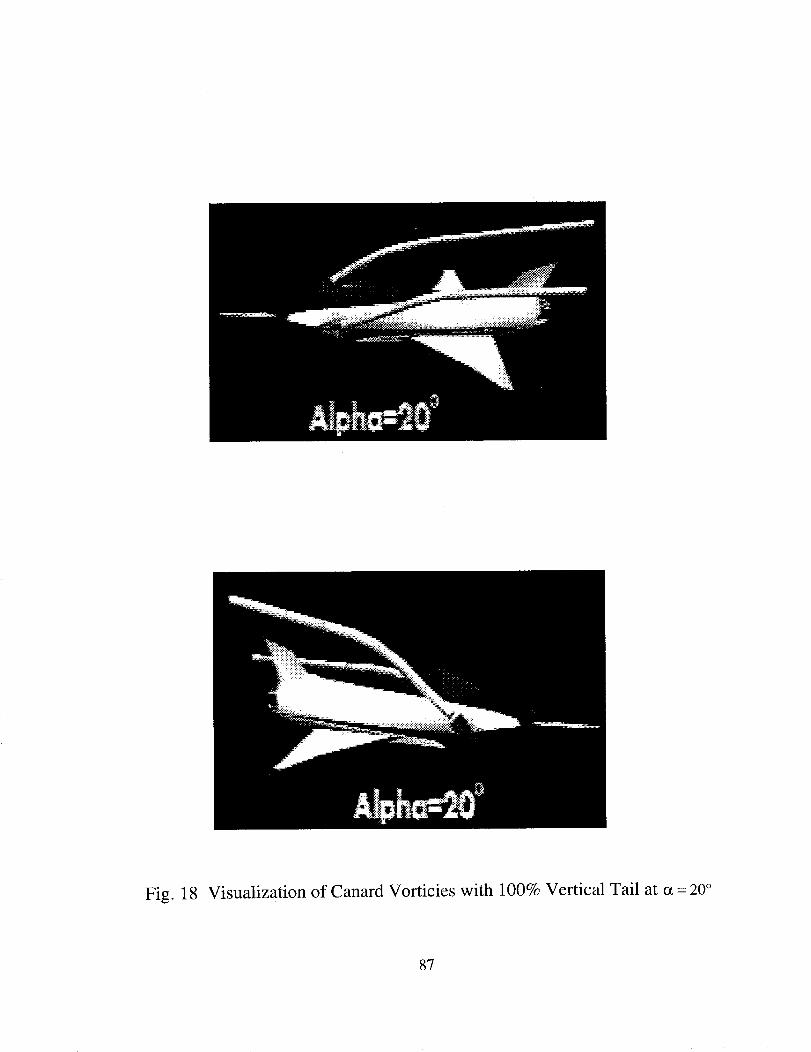
Fig. 18 Visualization of Canard Vorticies with 100% Vertical Tail at o_= 20°
87

Fig. 19 Visualization of Canard Vorticies with 100% Vertical Tail at a = 30°
8_
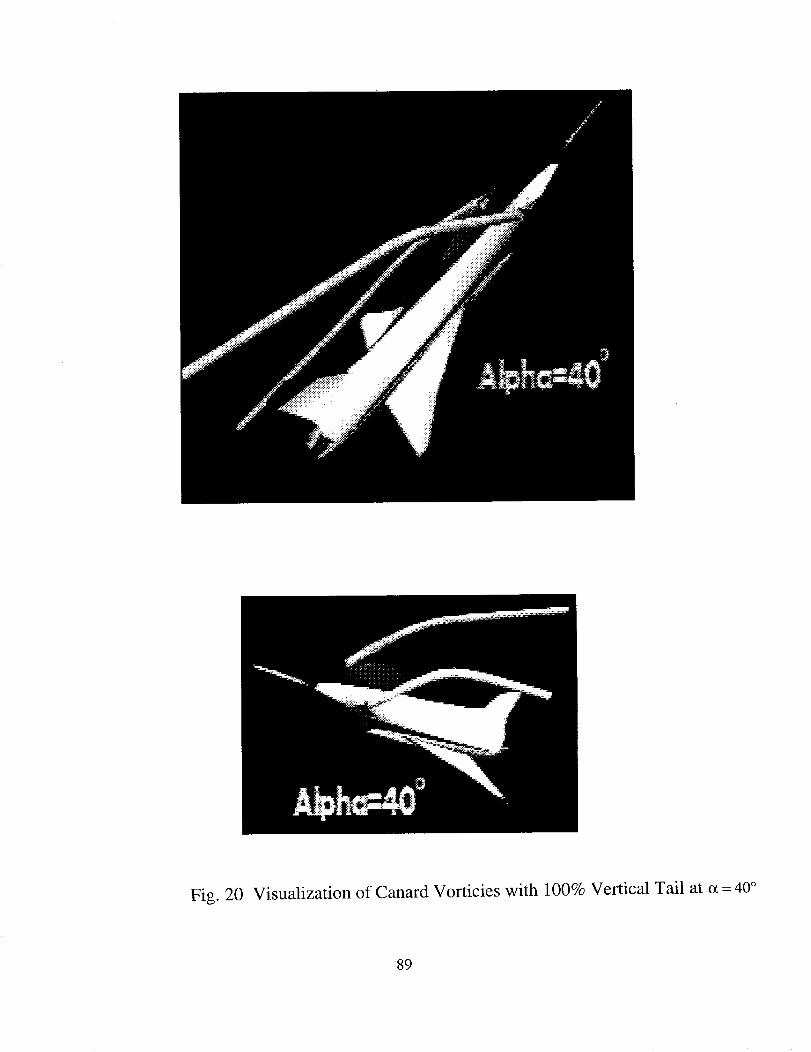
Fig. 20 Visualization of Canard Vorticies with 100% Vertical Tail at c_= 40°
89

0.1 T ....................................................................................................................................... ' ........................................................ ' ...........................
I
0.08 i
[Max A/B at 30,000 ft, Mach 0.Z_
',.OO
C n
0.06
0.04
0
-0.02
0.00
iIIII iIIIIl_lllqlll IIII
30 ° Rudder
30 ° Diff. Can.
-" -" - 34 ° T.V.
I I I I ] I I I I iiir
10.00 20.00 30.00 40.00 50.00 60.00 70.00 80.00
Alpha (deg)
Fig. 21 Directional Control Power Comparison

.03
.02
.01
ACI 0 c
-.01 _
-.02,
-.03
/7 It=,.7 t_-----_Zl_A4 i.,_lx"
b
.k"-
.I
<_ _>-....+j
o[]OA
Run
421422423424
Alpha(deg)
24324O5O
.10
.05
ACn 0
-.05
-.10
.2
.1
[ /
-.2-30 -25 -20 -15 -10
k_ )____ .__._()b4- _'_;"_-'i ""_I
-5 0 5 10 15 20 25 30
Beta (deg)
Fig. 22 Effectiveness of 20 ° Differential Canard at Sideslip
for 19% Model in 30- by 60-Foot Tunnel
91
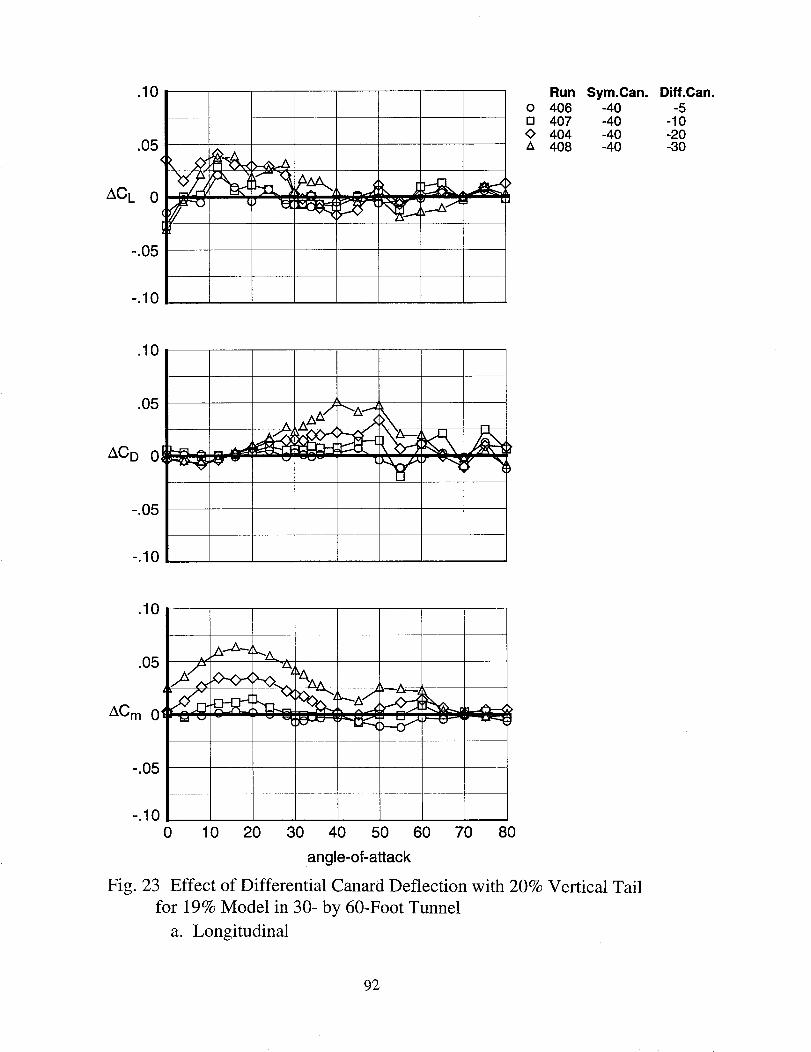
AC L
.10
.05
0
-.05
-.10
Runo 406[] 407<> 404z_ 408
Sym.Can.-40-40-40-40
Diff.Can.-5
-10-20-30
.10
.05
ACD oJ
-.05
-.10
.10
.05
ACm 0
-.05
-.100 10 20 30 40 50 60 70 80
angle-of-attack
Fig. 23 Effect of Differential Canard Deflection with 20% Vertical Tail
for 19% Mode] in 30- by 60-Foot Tunnel
a. Longitudinal
92

.O3
.02
.01
ACI 0!
-.01
-.02
-.03
o[]<>z_
Run
406407404408
Sym.Can.-40-40-40-40
Diff.Can.
-5-10-20-30
.10
.05
AC n
oI
-.05
x"5---#_.A
k.J -
.15
.10
.05
ACy 04
-.05
,Ax-Zx__ ^,,_ \ t --zX--, _.._-Zx.-.---z_,,A,-",, " ,.._x__>--o-<>
-.10
-.150 10 20 30 40 50 60 70 80
angle-of-attack
Fig. 23 Effect of Differential Canard Deflection with 20% Vertical Tail
for 19% Model in 30- by 60-Foot Tunnel
b. Lateral-Directional
93
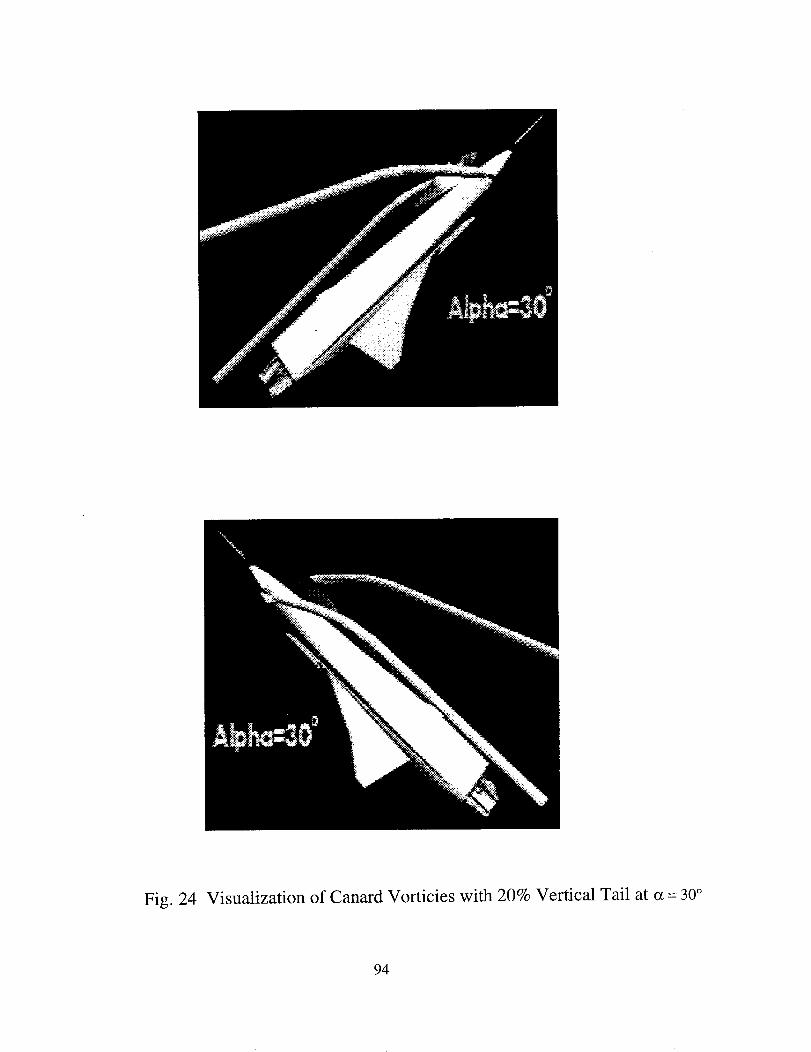
Fig. 24 Visualization of Canard Vorticies with 20% Vertical Tail at a = 30 °
94
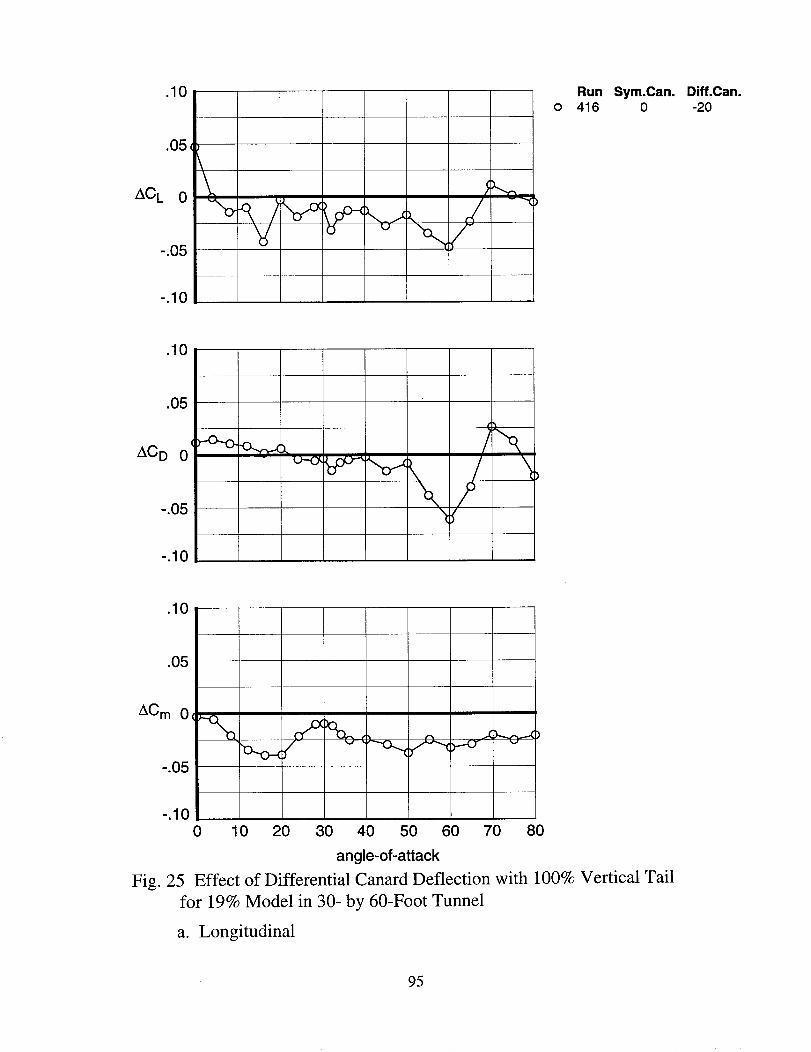
.10 Run Sym.Can. Diff.Can.o 416 0 -20
.05,
L_CL 0
-.05
-.10
°\
.10
.05
ACD 0
-.05
-.10
.10
.05
ACm 0
-.05
-.10
0 10 20 30 40 50 60 70 80
angle-of-attack
Fig. 25 Effect of Differential Canard Deflection with 100% Vertical Tail
for 19% Model in 30- by 60-Foot Tunnel
a. Longitudinal
95
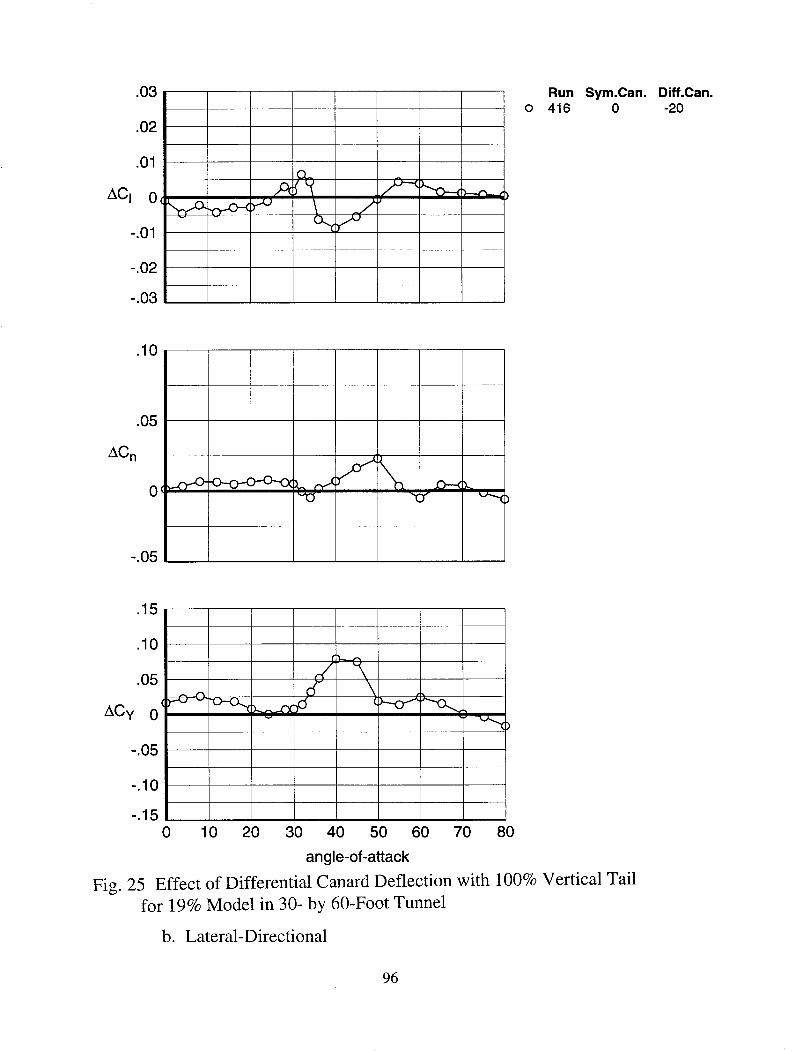
.03
.02
.01
ACI 0,
-.01
-.02
-.03
oRun416
Sym.Can.0
Diff.Can.
-20
.10
.05
AC n
0
-.05
r-O'° -°-o-4 _:_"Q _r'x "_
.15
.10
.05
ACy 0
-.05
v
-.10
-.150 10 20 30 40 50 60 70 80
angle-of-attack
Fig. 25 Effect of Differential Canard Deflection with 100% Vertical Tail
for 19% Model in 30- by 60-Foot Tunnel
b. Lateral-Directional
96
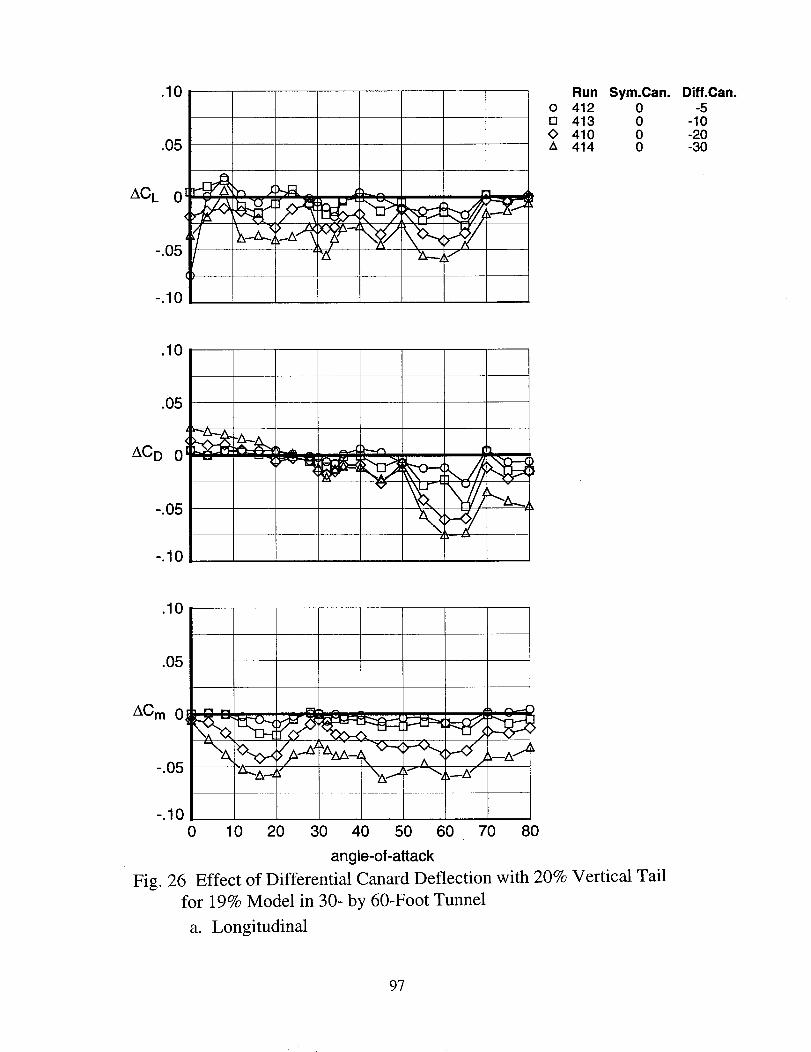
.10
.05
AC L 01
-.05
-.10
o[]<>z_
Run
412413410414
Sym.Can.0000
Diff.Can.
-5-10-20-30
.10
.05
-.05
-.10
.10
.05
ACm 0,
-.05
-.100 10 20 30 40 50 60 70 80
angle-of-attack
Fig. 26 Effect of Differentia] Canard Deflection with 20% Vertical Tail
for 19% Mode] in 30- by 50-Foot Tunnel
a. Longitudinal
97

.03 Run
o 412[] 4134> 410z_ 414
Sym.Can.0000
Diff.Can.
-5-10-20-30
.10
-.05
.15
.10
.o5 .>'LT.,,V'_,,_
-.05
-.10
-.150 10 20 30 40 50 60 70 80
angle-of-attack
Fig. 26 Effect of Differential Canard Deflection with 20% Vertical Tail
for 19% Model in 30- by 60-Foot Tunnel
b. Lateral-Directional
98
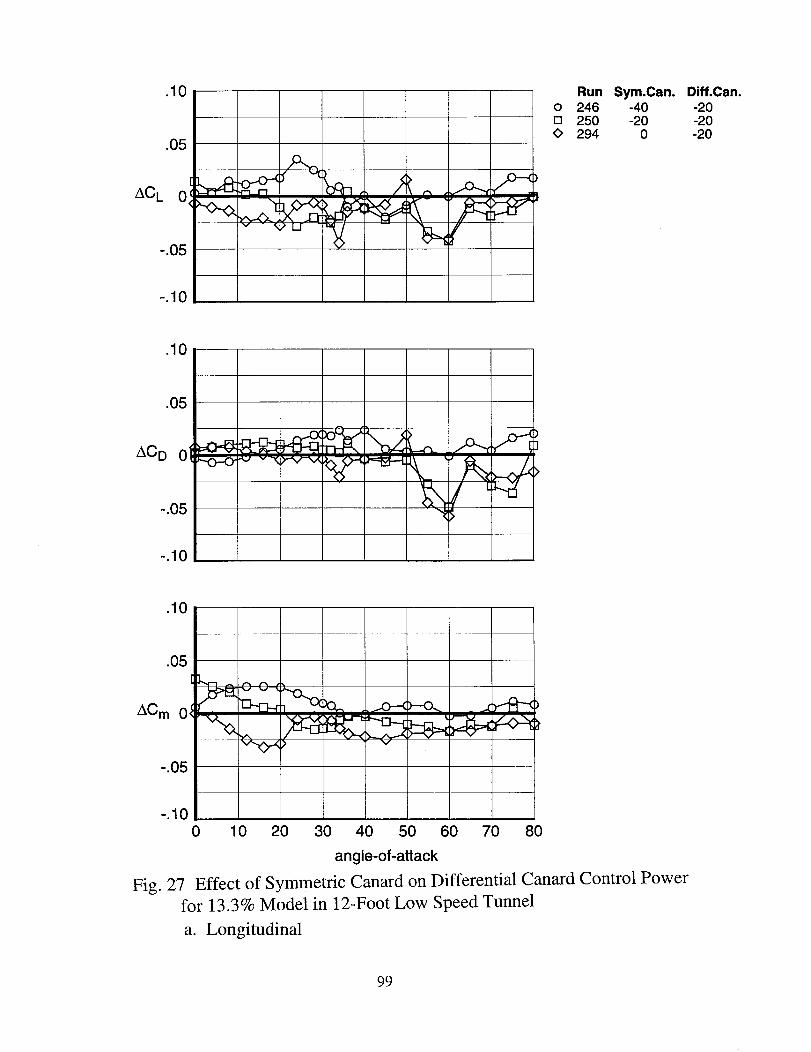
.10
.05
ACL 0
-.05
-.10
Run Sym.Can.o 246 -40[] 250 -20
294 0
Diff.Can.
-20-20-20
.10
.05
ACD 01
-.05
-.10
.10
.05
ACm 0
-.05
-.100 10 20 30 40 50 60 70 80
angle-of-attack
Fig. 27 Effect of Symmetric Canard on Differential Canard Control Power
for 13.3% Model in 12-Foot Low Speed Tunnel
a. Longitudinal
99
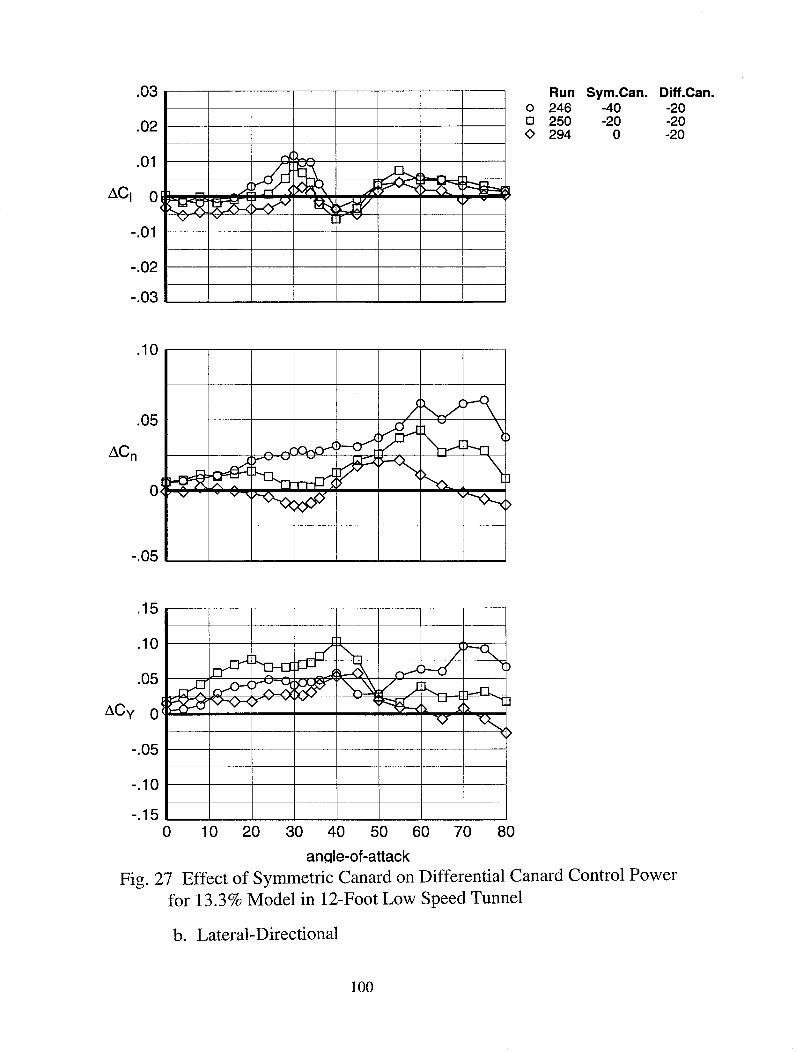
.03
.02
.01
ACI O_
-.01
-.02
-.03
v v - [Tv
0[]<>
Run24625O294
Sym.Can.-40-20
0
Diff.Can.-20-20-20
.10
-.05
.15
-.10
-.150 10 20 30 40 50 60 70 80
angle-of-attack
Fig. 27 Effect of Symmetric Canard on Differential Canard Control Power
for 13.3% Model in 12-Foot Low Speed Tunnel
b. Lateral-Directional
100
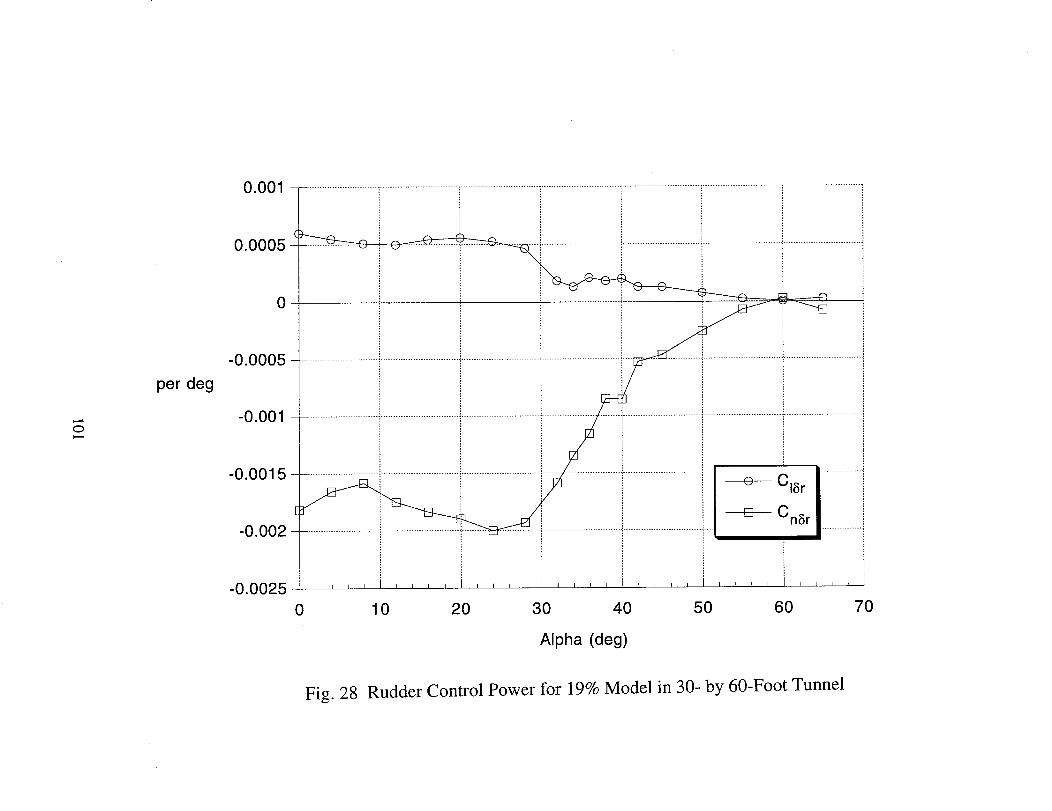
0.001 ..............................................................................................................................................................:..............................._...............................
O
per deg
0.00o5-_ .............i
0
oooo -0.001
-0.0015
-0.002
-0.0025 ,,,, t,,,, i,,,, i,,,, t , , , , ,,,, t,,,, I
0 10 20 30 40 50 60 70
Alpha (deg)
Fig. 28 Rudder Control Power for 19% Model in 30- by 60-Foot Tunnel

[ouun_Llood-09 £q -OE u! ppo_ %6[ _oj _oA_Od [o_luoD uo_I!V 6Z "_!_I
(lap) eqdlV
0£ O# 08 O_
I I I I I J I I I I [ I I I I I
01. 0
.... cJO0"O-
_00"0-
1-00"0-
0
lap Jed
c--]0

!
10 _ 5dc=-10 °
8dc=-20 °
85dc=-30 °
6
5a (deg) 4
OL_
2
0
0 10
Fig. 30
20 30 40 50 60 70
Alpha (deg)
Aileron Deflection to Coordinate Wind-Axis Roll with
80
Differential Canard at 0 ° Sideslip
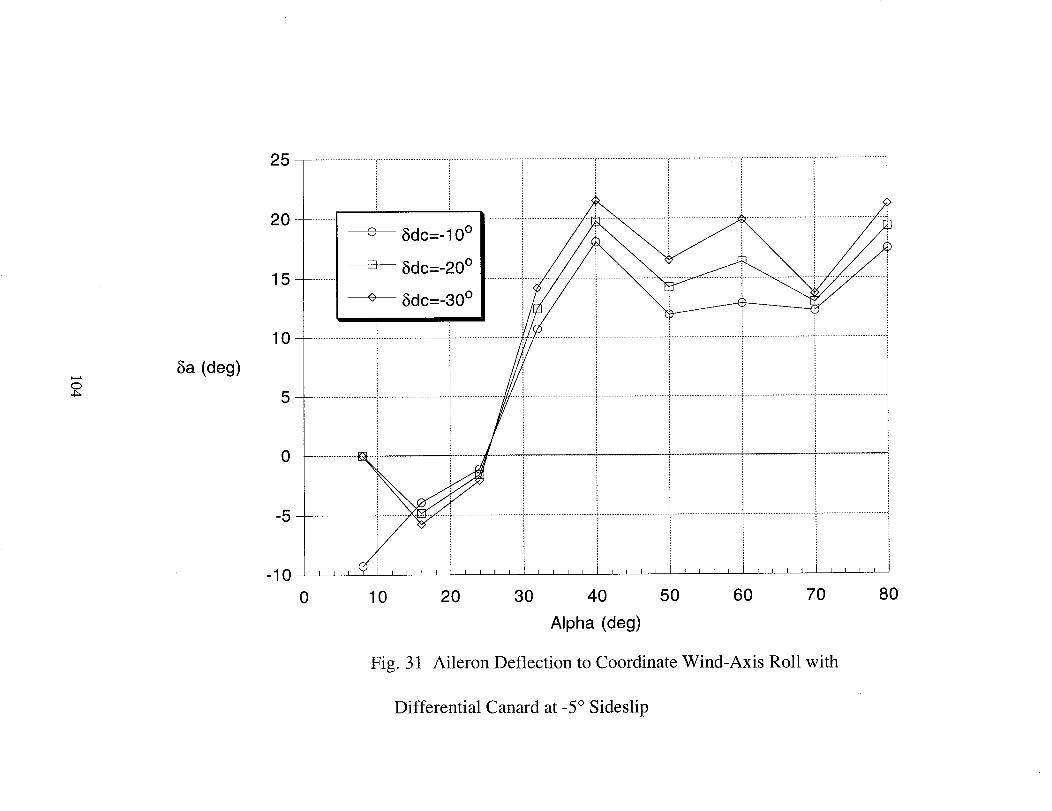
O4_
5a (deg)
25 T .......................................................................................................................................................................................................................................,
20
15
10
5
0
-5
-10
o 5dc=-10 °
5dc=.20 °
8dc=.30 °
0 10 20
Fig. 31
30 40 50
Alpha (deg)
60 70 80
Aileron Deflection to Coordinate Wind-Axis Roll with
Differential Canard at -5 ° Sideslip

O
qSa(deg)
10
5
0
0 10
5dc=-10 °
5dc=-20 °
8dc=-30 °
20 30 40 50 60 70
Alpha (deg)
Fig. 32 Aileron Deflection to Coordinate Wind-Axis Roll with
Differential Canard at 5 ° Sideslip
80

puun_L _oofl-09 ,_q -0E u! ppolAI %6I :toj
:tu_tuo_ _u!qo:qd OI.tUl_U'_p°'l_V _Iq_IFAV uinuI!X_lAi ££ "_!A
(6ep) eqdlV
OL 09 0£ O# 0£ O_ OV 0_'0-
I ........ I .... I .... I .... I .... t ....
i ............. _'0-
.............................................................................................................................................................................................................................I-'0-
0
I i iI
dlq esoN xe_ + ]
...........................................................................................................................uMoG eSON xe_ --e--- I..................L'O
............. -_'0
................................................................................................................................"-..............................._.............................................................g'O
w o
0
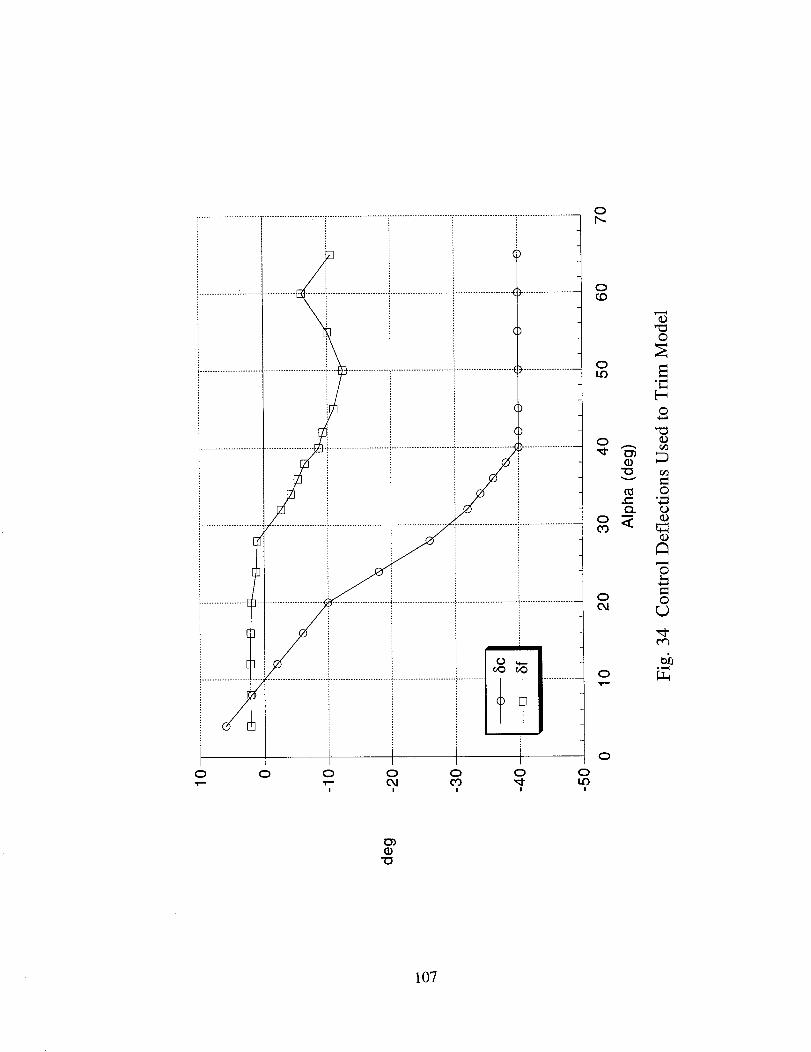
0
_D3
"0
107
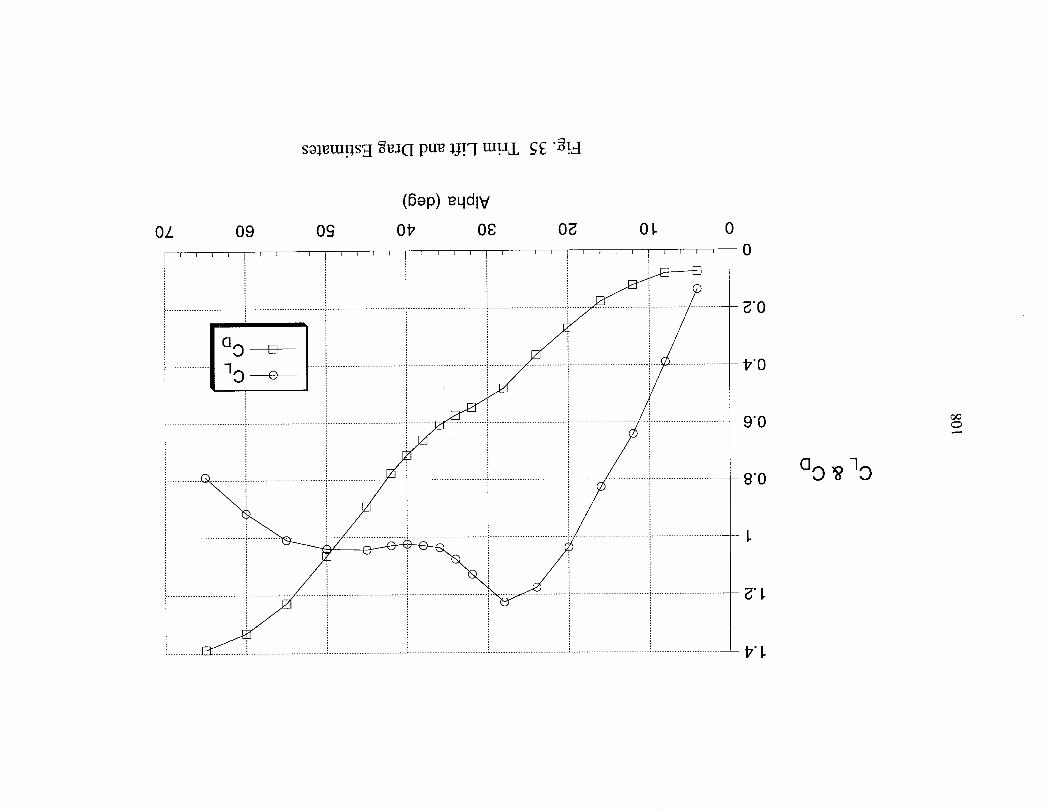
smem!ls_t _eJ(I pue UVI tu!sA gg "_!,_q
OZ 09
IIII
(flop) eqdlV
OCj 017 08
I I 1 I I I I I
0
0
a 0
7 0
_0
170
90
80
171.
a 0 _ 70
oo0

ppolN do.IcI qI 0_ m!3_L ol oInsso.M 3!tu_u,_cI 9£ "_!A
0/_
(Bep) eqdlV
09 OS 017 0t_ 0;_ 0 L 0
I I I I I I I I I I I I I l I I I I I I I I I t 0
- S_
OS
............................................................................................................................................................S/_.
(tsd) b
O'x
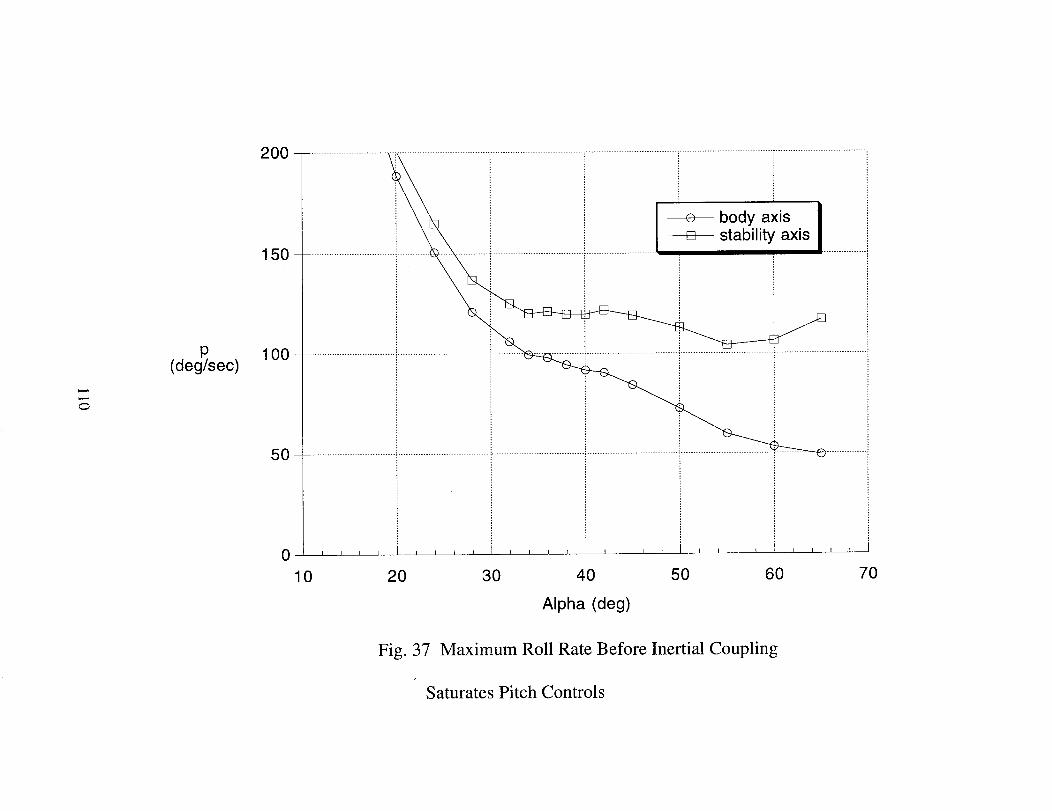
0
P(deg/sec)
00 ......................................................................................................................................................................................................................I !s,150 .............................=;i.... == i I _ stability ax s ................i
50--
I I I P I I _ 1 I I I t I I I I I _ I _ I I I I
10 20 30 40 50 60 70
Alpha (deg)
Fig. 37 Maximum Roll Rate Before Inertial Coupling
Saturates Pitch Controls
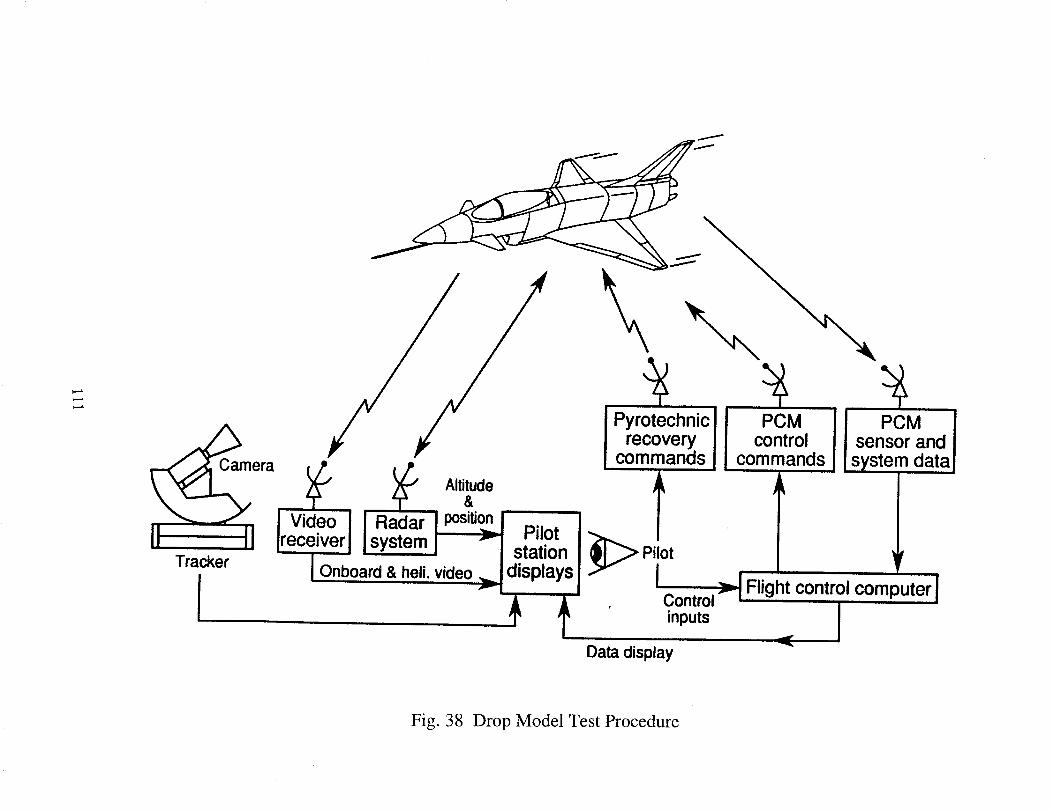
11
era P,,ot]Video II Radar ' III !! Ireceiverl Isystem, Istation _Piiot
I Onboard & hell. video _! displaysTracker
I
Pyrotechnicrecovery
commands
'/_ f Controlinputs
Data display
PCMcontrol
commands
,.= I Flight control
' PCMsensor andsystem data
computer !
Fig. 38 Drop Model Test Procedure
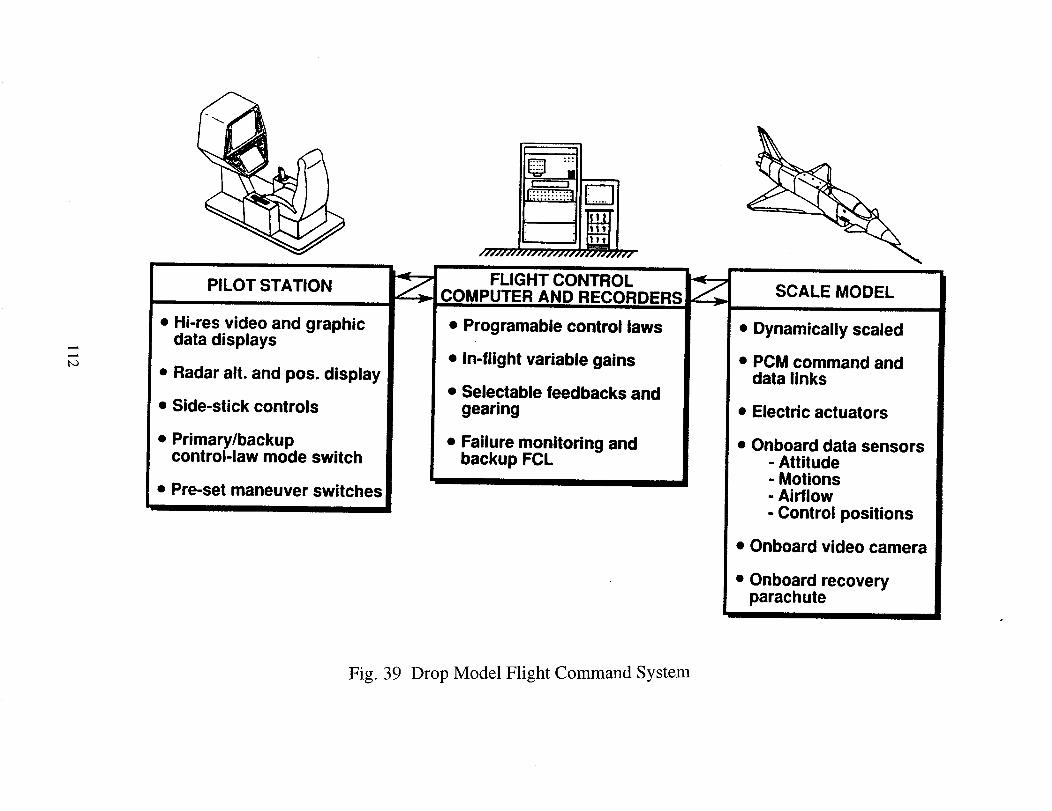
PILOT STATION
• Hi-res video and graphicdata displays
• Radar alt. and pos. display
• Side-stick controls
• Primary/backupcontrol-law mode switch
• Pre-set maneuver switches
II
///////_ _//,r//////d v'/,-d///fl
FLIGHT CONTROLCOMPUTER AND RECORDERS
• Programable control laws
• In-flight variable gains
• Selectable feedbacks andgearing
• Failure monitoring andbackup FCL
SCALE MODEL
• Dynamically scaled
• PCM command anddata links
• Electric actuators
• Onboard data sensors- Attitude- Motions- Airflow- Control positions
• Onboard video camera
• Onboard recoveryparachute
Fig. 39 Drop Model Flight Command System
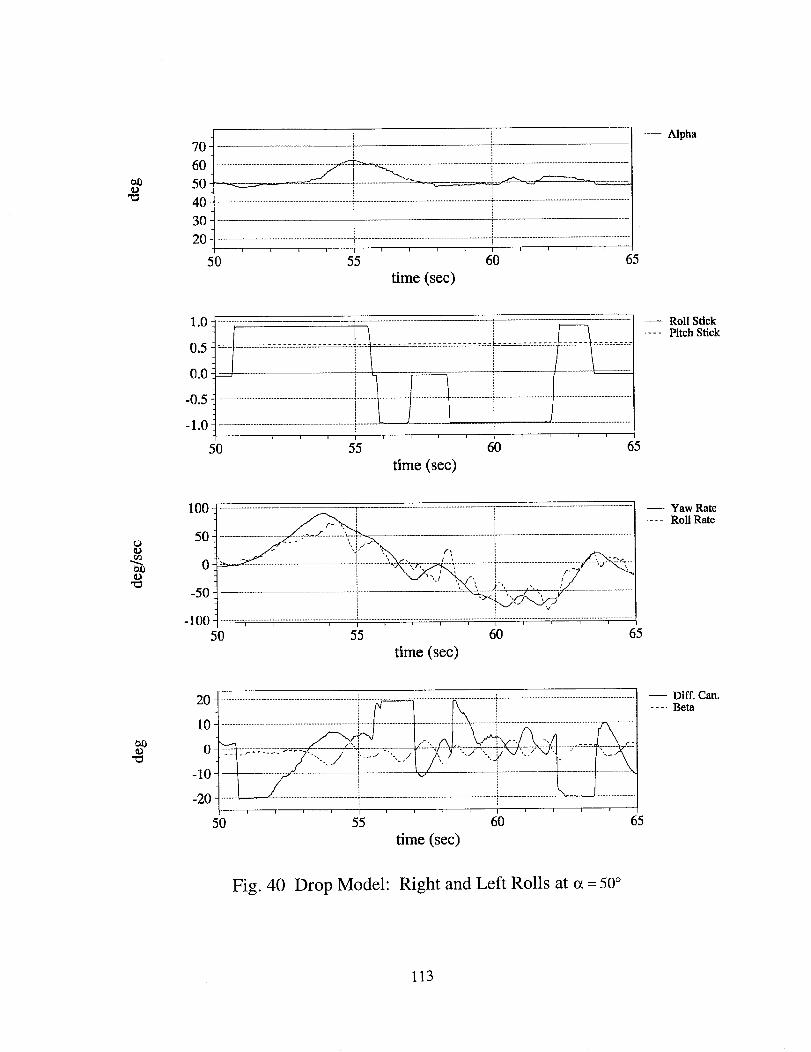
ID
70
60
50
40
30
20
50
.........: .............................................................................iiiiiii_iiiiiiiii!!!!!iii!!!!!!!!!!!!!!!!!!!ii_........................................................................... i !
...................................................................................... i ....................................................................................... i......................................................................................
.... 5'5 .... 60 .... 65time (sec)
-- Alpha
1.0 4 [ -
:°11;......................................................_........ , ......50 55 60 65
time (sec)
-- Roll Stick
.... Pitch Stick
o
cD
100
5O
0
-50
-10050
........._ ...........-;_..........................................2?
! ....i ......................................................................................
...............;.................;.................;.................i................i.................;.................;.................;................;.............[ ....
55 60 65
time (sec)
-- Yaw Rate
.... Roll Rate
20-
10 _
o _
-10
-20
50 5.5
iiiiiiill............................iiiiiiiiiiiiiiiii............
i i F i i i
...... 60 65
time (sec)
-- Diff. Can.
.... Beta
Fig. 40 Drop Model: Right and Left Rolls at c_= 50 °
113
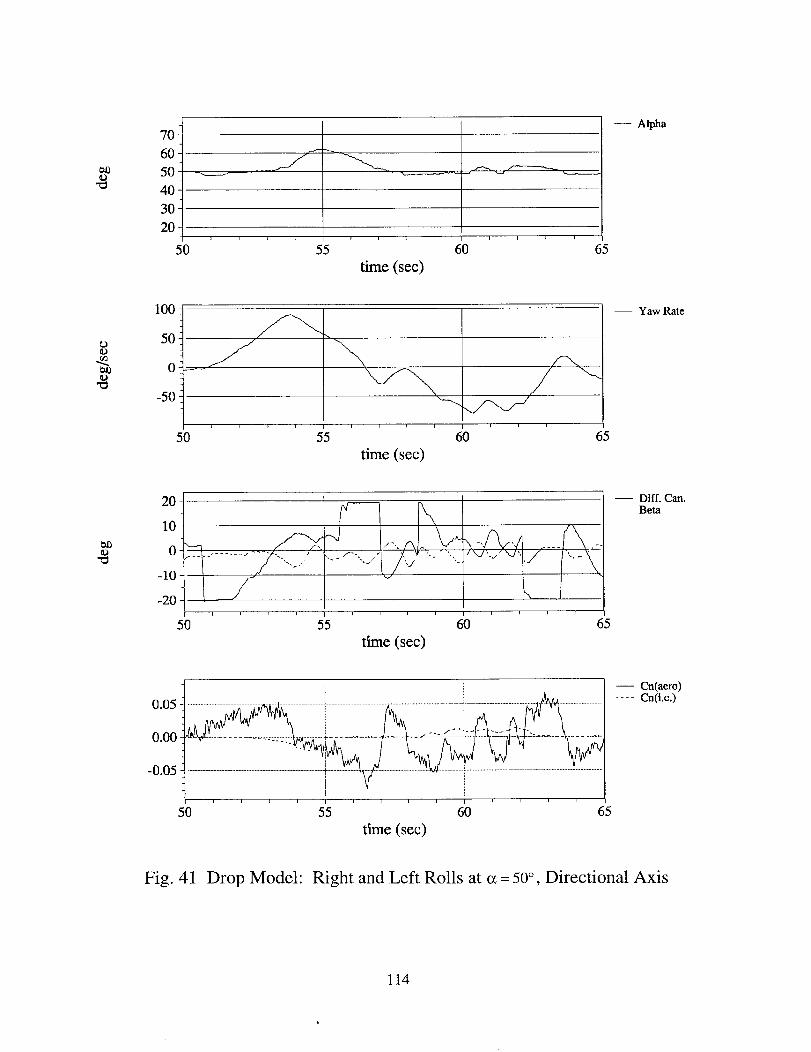
7ol60-
50 ;
40 -
30 -
20;
50I 1 _ i I E t t t I I t z J
55 60 65
time (sec)
-- Alpha
c)¢)
100
5O
0
-50
--T--T--T--T 1 _ T T
50 55 60
time (sec)
65
-- Yaw Rate
01)
20
10
0
-10
-20
5O
,..J
55 60 65
time (sec)
-- Diff. Can..... Beta
0.05
0.00
-0.05
50
............................................................. i ...........................................................................................................
.... 5'5 .... 6'0 .... 65
time (sec)
-- Cn(aero).... Cn(t.c.)
Fig. 41 Drop Model: Right and Left Rolls at c_= 50°, Directional Axis
114
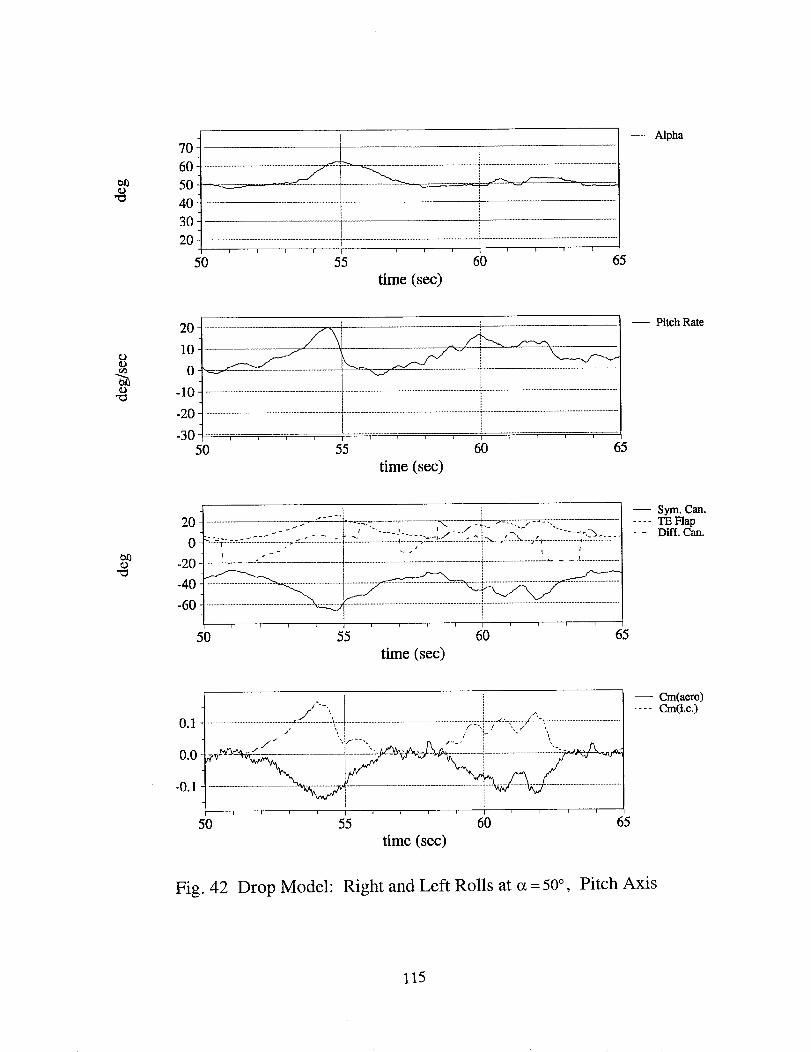
706050403020
50
.......................................................................................................................................................................... ÷....................................................................................
t t t t t t i t _ i
55 60 65
time (sec)
-- Alpha
o
o
0
-10-- ...............................................................................................................................................................................................................................................................
-20 - .............................................................................................................................................................................i...................................................................................
-30 - ........!
J
50 55 6'0 ' ' ' 65
time (sec)
-- Pitch Rate
ta0
20
0
-20
-40
-60
|
....... - .... _-' .........'........:X_-_:iiL ,<_" ".......,_.-....-:_. __ _.:..=_=.._:..:7......................... _ ._...--'. ................. ::.--}................................... I............. _ .r=....... ................ _......._. ....... .,................. _ ::-t-........................ J......................
I " I i _l ................
i i i _ i _ i i L i i t
50 5'5 6'0 65
time (sec)
-- Sym. Can.
TE FlapDiff. Can.
0.I
50
i...................................................) .......................:'c] ..............................................................................7:::i7"_":;:/:::"_ ..............................................
1/-/ "@ --, - _-..' !" "" '*',
..................... ":" _ ............... i..................................."2-- -, .
.... 5'5 .... 6'0 .... 65
time (sec)
-- Cm(aero).... Cm(i.c.)
Fig. 42 Drop Model: Right and Left Rolls at ot = 50 °, Pitch Axis
115

706050403020
70
I
' 72 ' 74 ' 76 ' 7'8 ' 80
time (sec)
-- Alpha
1.0
0.5
0.0
-0.5
-1.0
70
................................................... _.................................................... _.................................................... t ......................................................................................................
:..-::...c..-..-:..-..-:.._-..:..-.i:...:..:=:...-..-..:..-:...:..-..-..::t_...c..=...-..c=...:..:..- ...-..-..._..-..-..-..-...-..-:.7.........................i..................................................!.......i..............
---r"-_ --'1" 7 T r "1 r
72 74 76 78 80
time (sec)
-- Roll Stick.... Pitch Stick
100
50
0
-50
-10070 7'2
i I
/ r, . '
i .... 2..........i.................
74 76 78 80
time (sec)
-- Yaw Rate
..... Roll Rate
_0
20
10
0
-10
-20
70
Z ................
...................................................T..................................................._....................................................i....................................................i...................................................
72 74 76 7'8
time (sec)
80
-- Diff. Can.
.... Beta
Fig. 43 Drop Model: Right Roll at o_= 60 °
116
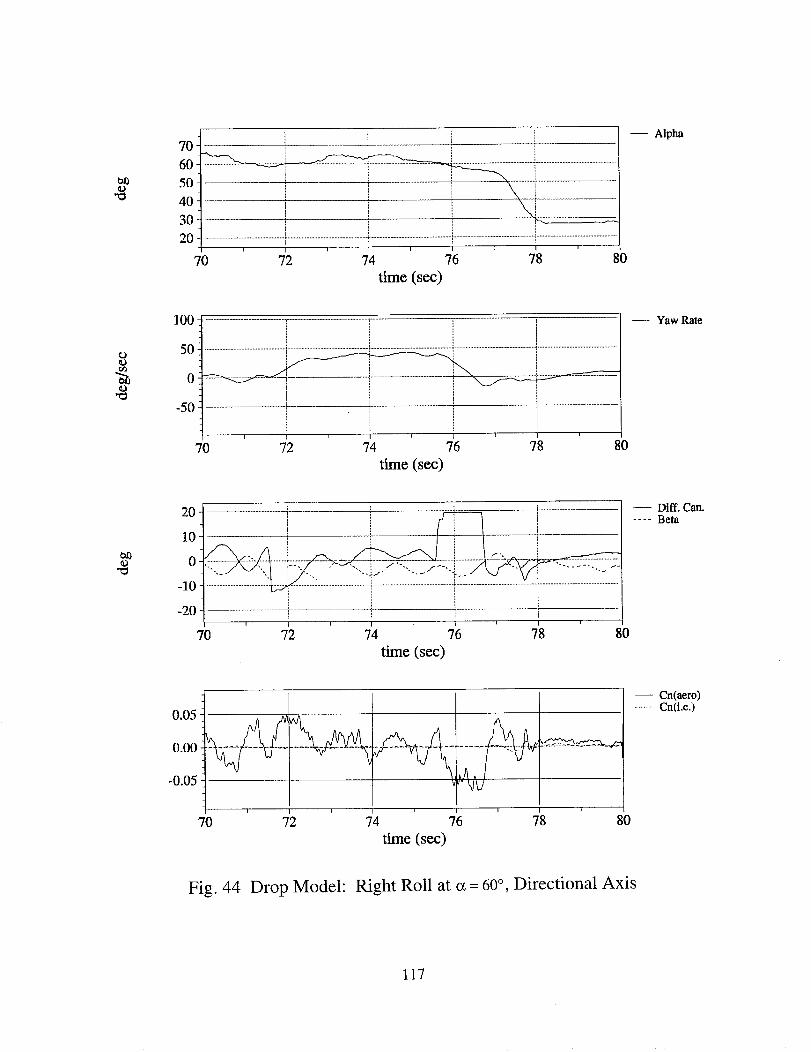
tat)
70
60
50
40
30
20
70 7'2i t I i t i
74 76 78 80
time (sec)
-- Alpha
¢.J¢or._
100
50lz
i " i i
! i
' 7'2 ' 7'6 ' '70 787_ 'time (sec)
80
-- Yaw Rate
t_
20-
10
0
-10
-20 i
70 ' 7'2
E
I I I
74 76 7'8
time (sec)
80
-- Diff. Can.
.... Beta
0.05
0.00
-0.05
70ii
72 74 76 78 80
time (sec)
-- Cn(aero).... Cn(t.c.)
Fig. 44 Drop Model: Right Roll at a = 60°, Directional Axis
117
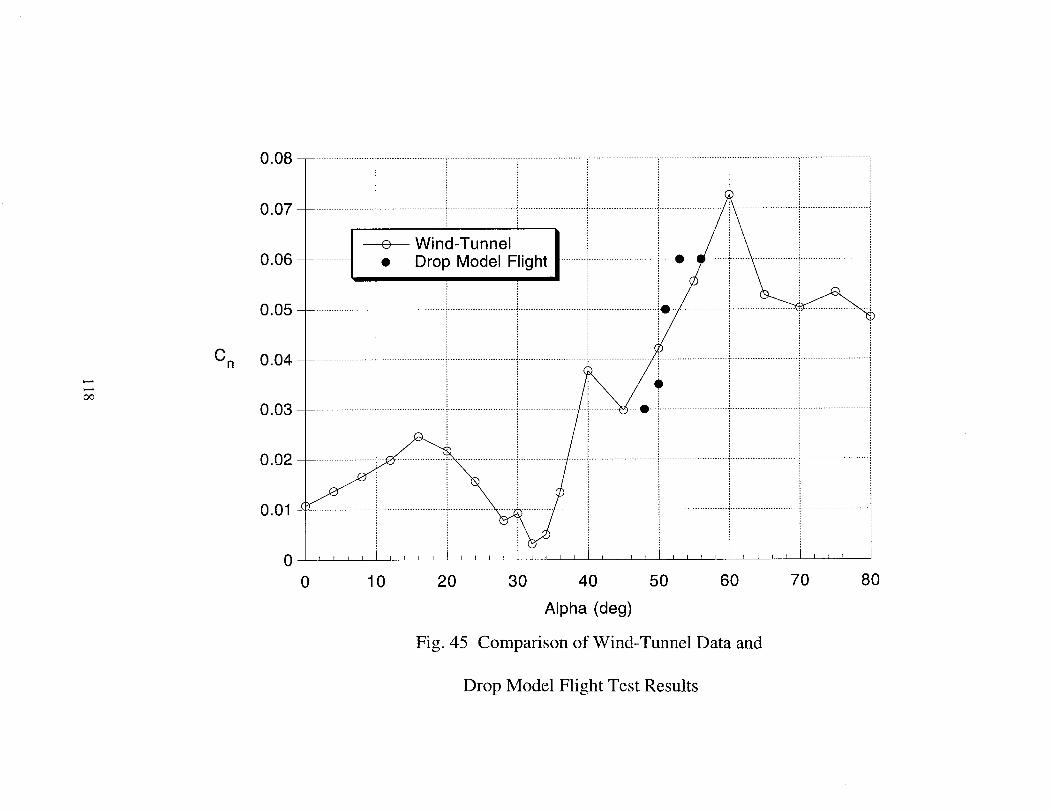
OO
C n
0.06
0.05
0.04
0.03
0.02
0.01
0
Wind-Tunnel
• Drop Model Flight
0 10 20 30 40 50 60 70 80
Alpha (deg)
Comparison of Wind-Tunnel Data andFig. 45
Drop Model Flight Test Results

et0O
80
6O
40
20
050
...................................................}...................................................i.......................................................................................................i..................................................
.................................................. ................................................ i .........................................................................................................................................................
5'2 54 ' 5'6 5'8 60time (see)
-- Alpha
1.0 ........................................................................................................i...........................................................................................................................................................i
0.5 ......................................................................................................}...................................................._.......................................................................................................i
oo t-0.5 ...................................................._.............................................................................................................
-1.0 i _
50 5'2 5_1 56 5'8 60
time (see)
-- R011 Stick--- Pitch Stick
oo
¢D
100
50
0
-50
-10050
! : _ ii!l , _ ii
...... -i ______-4.---L- .............. _..
[ r , _ ' , t!\
f-', / ' t ! _ _" ' ! ' r " E" :¢- #_ _-
-_7- '-- , I _r----_--_v-- .-'r .. = . _ .
" _ _ ' _'_"; i ', ,'U ' '.................................................. i .............. i ............................ *............. '''_ ................... """T"'? ................................................
',/ i : i ',,/ i, ' _
52 54 56 58 60
time (sec)
-- Yaw Rate.... Roll Rate
20'°
0-
-20
-405O
...... '"i.,;, ....., W_._J
52 54 56
time (see)
58 60
-- Diff. Can.
.... Beta
-- Aileron
Fig. 46 Tailless Drop Model: Departure at o_= 30 °
119

80- Lii
6o-...................................................:...................................................i.................................................._.......................................................................................................
40 __°__ ....................
20- ...............................................................................................................................................................................................................!...................................................
i i i i i
50 51 5; 56 58 60
time (sec)
-- Alpha
6O
-20 -
-40
-60
40 _ ..................................
0 _ ...... .
50 57 54 ' 5,6 58 ' 60
time (sec)
-- Yaw Rate
20
0
-20
-405O
i i i, , E E
...................................................i......................r"",...............i ...................................................._..................................................._...................................................
_==_...._ ,,'_',i_ _........_::_"'7====:-==T_=_==;__=
' 5? ' 5_4 ' 56 ' 58 ' 60
time (sec)
-- Diff. Can.
.... Beta
0.10
0.05
0.00
-0.05
-0.1050 5'2 5_' ' ' 5'6 ' 5'8 60
time (sec)
-- Cn(aero)
.... Cn(i.c.)
Fig. 47 Tailless Drop Model: Departure at a = 30 °, Directional Axis
120

80...................................................t.................................................T..................................................i...................................................i..................................................[
60 _ i i ! i............................................ _................................................... _................................................. _.................................... _..................................................
...... i ' i40 2- l _ [ i
t2o _t [
50 5? 5'6 58 6otime (see)
-- Alpha
o
o
4O
20
0
-20
-4050 5'2
i ! v.e--
54 56 5'8 60
time (sec)
-- Pitch Rate
_,i _ -- Sym.Can.20 ..................................................................................._"_f ...................................._..4...................................................._.......................................................TE Flap
...::.. .......... ...,. , .... /,_".ff'%= i'" _"', .- /;t i .- -_ _ i_... - Diff. Can.0 ...............x£...........?............_ ,.' _ , i
-20 .... _-......
-40 __-60 -- i _ i
50 ' 52 ' 54 ' 5_5 58 ' 60
time (sec)
0.2
0.1
0.0
-0.1
-0.250
[
i J ' i /.__ i i
5? 5? 56 5'8 60
time (sec)
-- Cm(aero).... Cm(i.c.)
Fig. 48 Tailless Drop Model: Departure at c_= 30 °, Pitch Axis
121

exo
8o_.......................................................................................................i.................................................i...................................................!..................................................6o_
40
20
o_6O ' 62 ' 64 ' 6'6 ' 6'8 ' 70
time (sec)
-- Alpha
1.0
0.5
0.0
-0.5
-1.0
60
, ....5.....,...................................................,.................................................................T...................................................i......................................................................................................i.........
................................................... t-- ............. 4 .....................
' 62 ' 64 ' 66 6'8 ' 70
time (sec)
-- Roll Stick.... Pitch Stick
tD
100
i _ f! ' r ', I50 .................................... i , ............., t_'"_'"'";i,...........................*,............'_i,................................................, ,
0
-50
-10060
i i , _ ., , ' i \/-', _ i _
..........................................................................'c--i---,.............. ',..........,--t ..................*.........,_..........r_ ...............................i ' ) i _ ) i
62 64 66 68 70
time (sec)
-- Yaw RateRoll Rate
ta0
i _ f,i i ! <20 _................................__,, ,...,_/' . -" ', i / .... ",,,,_),Ir"_/ii._....:,._):"'-/ 'j
0 ::':-""_/-_*-I?>_.7_:_c_ ....................q"Ti; ',V<F\ " .__°i ,,_ _ _.)w, J\] _ 'I r;l i ...2J , ; L._.5',"
i ,. t __ ! ,, /_ "_'_'_'_'_'_'_'_'_±__:,._______i_'-20 - -,. - , , ,i i - i i ', /
-40 .....60 6'2 6_1 6'6 6'8 70
time (sec)
-- Diff. Can..... Beta-- Aileron
Fig. 49 Tailless Drop Model: Departure at c_= 20 °
122
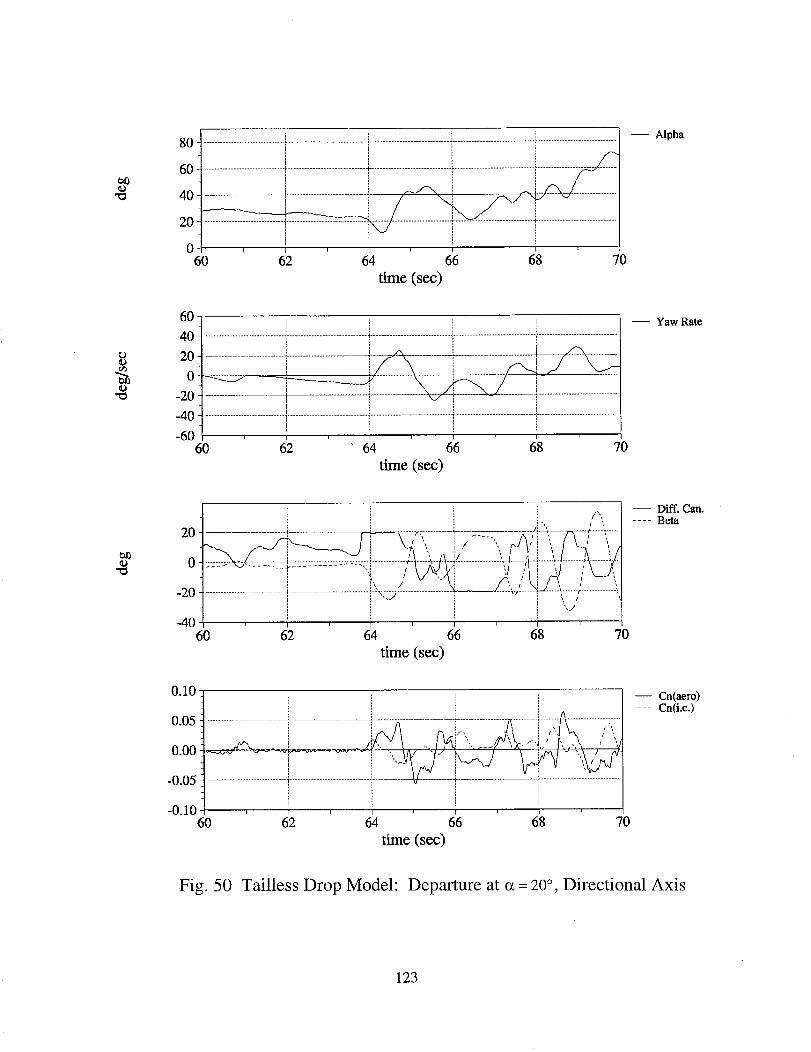
cD
8O
6O
4O
2O
6o 6'2
.................................................._.................................................i.................................................i......................................................................................................
...................................................t.................................................i............ ,..................................................i..................................................
J _
' ' ' 6'6 ' '64 68 70
time (sec)
-- Alpha
60 i _, i40 ..................................................i...................................................._.........................................................................................................i...................................................
-i-.... i
-20- i , _
-_0 2 .................................................I!...................................................i!........................................................................................................1!..................................................
-60 - , ! , _ , i ,60 6'2 64 66 6'8 70
time (sec)
-- Yaw Rate
60 62 64 66 68 70
time (sec)
-- Diff. Can..... Beta
0.10
0.05
0.00
-0.05
-0.106O
................ _......... ! .- ...................i......................................i.................................
' 62 ' 64 6'6 ' 6'8 ' 70
time (sec)
-- Cn(aero).... Cn(t.e.)
Fig. 50 Tailless Drop Model: Departure at a = 20 °, Directional Axis
123

cD
80 _ _ i _
60 : .......................................................................................................!...................................................._...................................................¢................................................
20
_ I i i
60 6'2 64 66 68 70
time (sec)
-- Alpha
o
cD
40
20i i
i
0
-20
-4060 6'2 64 66 68 70
time (sec)
-- Ptlch Rate
o/)©
i i ! _',,, .]20 -:.........................._7: ......... _ 7 --):7:7:L.._::::.....................?:-y::2__.v;;:Ty:,?-:_:,.........../
0 " i i - _,''_I °''" .' 'i -' _--'/
-20-40 --
-60 --i ! i i
60 6'2 64 6'6 6'8 70
time (sec)
-- Sym. Can..... TE Flap- - Diff. Can.
0.2-
0.1
0.0
-0.1
-0.260
-_---¢" ...... _" _ i " "
62 6'4 66 6'8 70
time (sec)
Fig. 51 Tailless Drop Model: Departure at o_= 20 °, Pitch Axis
-- Cm(aero)
.... Cm(i.c.)
124
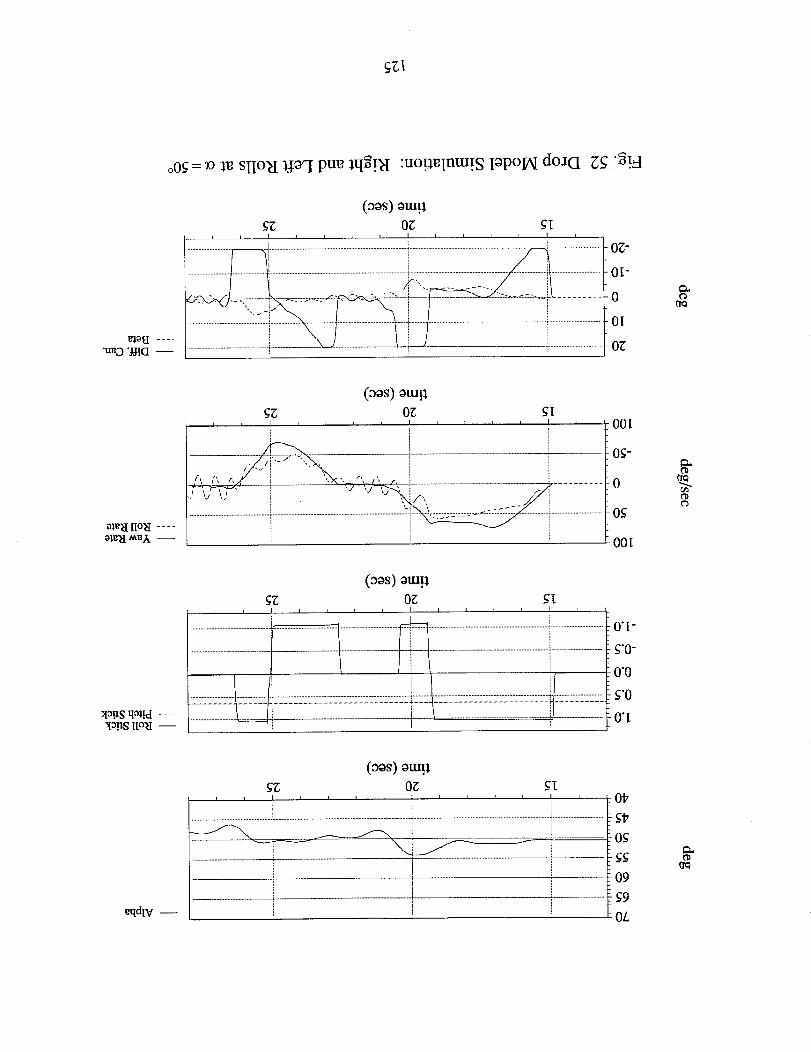
cA'_t
oO_= _ole sI[o_I l_l pue l@!_I :uo!lglnm[.S IopoIN do:[cI _;g "_!A
t_l_ff ....
"u_o "JJIG --
(3_s) om!l
I i I I i q I r i i I I I
-0_-
io_-
io
-O_
C_uCD
m_lt [[o1:I ....+l+_I _l_j_ --
(o_s)mull
gZ; 0_; ffli I I i i I i I i I i i i
: - "N i
_/',,_,", r, 5_..", _', _. i ................, .-_-'-'-'-'-D_., "" i ,i ', )--_., ,._ + _7_.• '_ ',: _ _.r', J)"i..................................................i...................................................................................._:.I. '. _ ..-.:.:;.T;.T+I
' 00[
0_-
0
Og
00[
_olIS qmM ....
I I I I I I I I I I I I ! I
_0"[-
_'0-
0"0
g'O
0"[.
eqdlV --
_iB O_ g[I I I I I I I I I I I I I
................................................... i ....................................................................................... i ....................................................................................... + ................................
,i .i !
0t7
g_
Og
gg
09
g9
OL

70656055504540
'1'5' 20 ' 2'5time (sec)
-- Alpha
exo©
0
-10
-20
2o:.................................i.......................................................................................L......................................................................................i..................................................I
102 i i ,............................... i............................................. [ ..............................................................................................
i ! •
i I
l ir L i i i i J i i i
15 2'0 2'5
time (sec)
-- Pitch Rate
e_0
20 ........................................................ _...... _ , ,
0 2"Y--='7"S--::7--;"i'2": .................... _7 .......... :::-""="=''=" ......................... : .......................................................... ! ..................... _'_" ................
! -" i r-20
_40 ] ......................................_:
-60 - _ !15 20 25
time (sec)
-- Sym. Can.
.... TE Flap- - Diff. Can.
Fig. 53
0.2
0.1
0.0
-0.1
0.2
......... _- ::::_..............................................................:::--..F.'.'- _-_"_ '5-..........................._--------:::'_
............................. ....................... _......._....... .................................
1'5 2'0 2'5time (sec)
-- Cm(aero)
.... Cm(i.c.)
Drop Model Simulation: Right and Left Rolls at a = 50 °, Pitch Axis
126
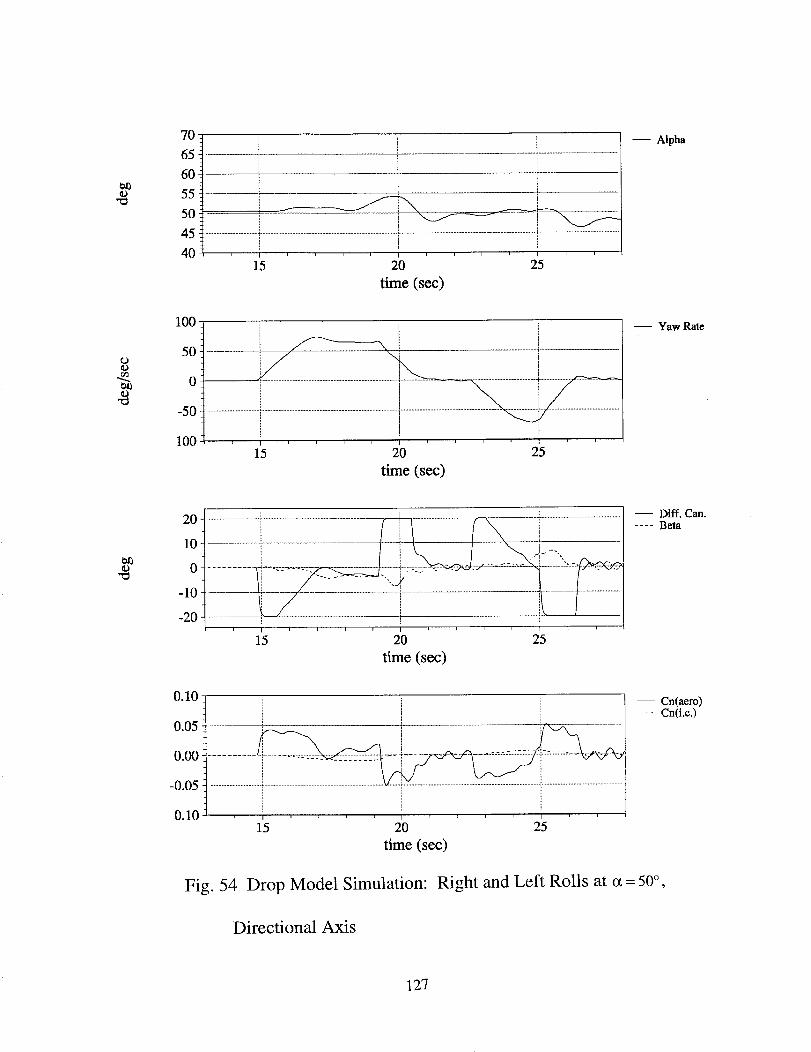
ID
70.
65 i60i55_50i
45
40
iiI
i
i i
1; 2b z5time (sec)
-- Alpha
¢.)
100
50
0
-50
100
i
.................... i ......
.................................i i.....................................................................................!..............................................
1.5 2'0 25
time (see)
-- Yaw Rate
e_ o1............._i+.=......._:::;__f: ...... ..........+_::t.....7 /+7........77!.................77?......----
15 20 25
time (sec)
-- Diff. Can..... Beta
0.10
0.05
0.00
-0.05
0.10
i
i
15 20
time (sec)
i
25
-- Cn(aero).... Cn(t.e,)
Fig. 54 Drop Model Simulation: Right and Left Rolls at o_= 50° ,
Directional Axis
127

70656055504540
3O
i
! ! -
i m...................................................i....................................................i....................................................t..................................................i..................................................
3'2 34 ' 3'6 38 ' 40
time (see)
-- Alpha
-- Roll Stick.... Pitch Stick
_D_3
100
50
0
-50
100
..................................................._._._'*-"'-J/-"i "/''i..................................................._. _. __e.,.._.___i.........................................' .....................................................................
30 3'2 34 36 38 40
time (see)
-- Yaw Rate.... Roll Rate
20
10
0
-10
-20
3O
...................................................i....................................................i....................................................i....................................................i...................................................' 32 ' 34 ' 3'6 ' 3'8 ' 40
time (sec)
-- Diff. Can.....Beta
Fig. 55 Drop Model Simulation: Right Roll at a = 60 °
128
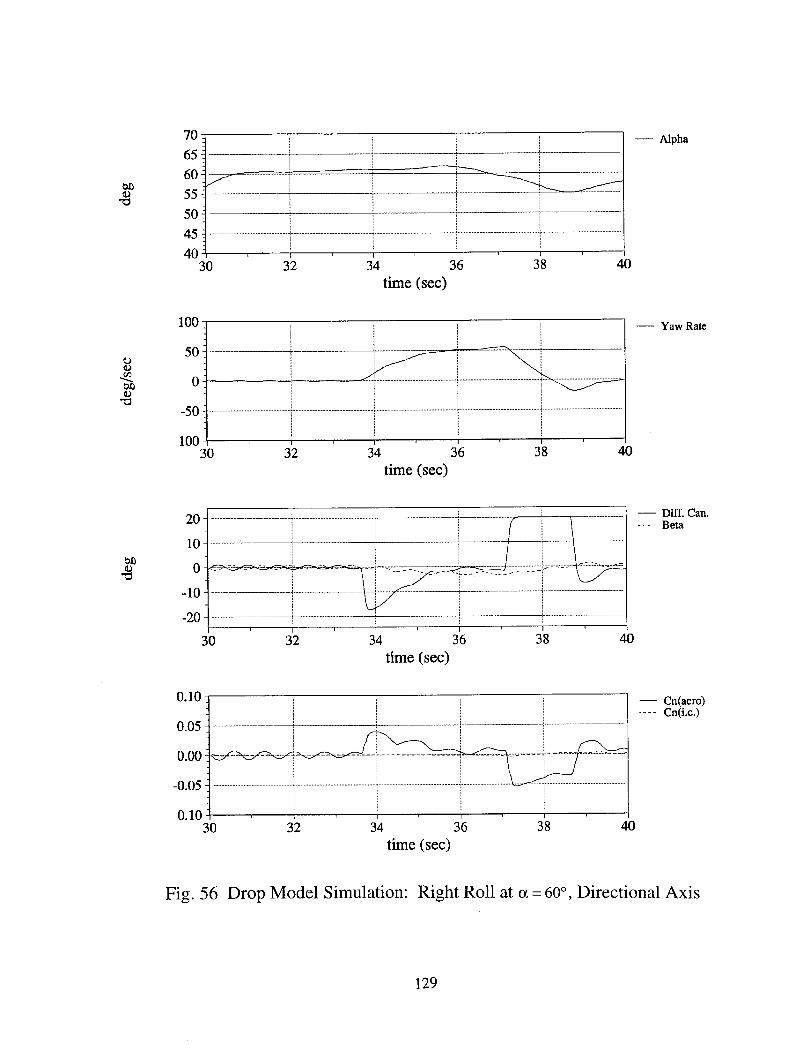
cD
70.
65i60i
55_5oi
45
4030
i
32 34 36 3'8 40
time (sec)
-- Alpha
o
_3
100
5O
0
-50
10030 3'2
i " - _ -------4
34 36 38 40
time (see)
-- Yaw Rate
em
20-
10 _
-20
30 3'2i i , ,
34 36 38 40
time (sec)
-- Diff. Can.
.... Beta
0.10
0.05
0.00
-0.05
0.1030
i
3'2 3_ 36 3'8 40time (sec)
-- Cn(aero)
.... Cn(t.e.)
Fig. 56 Drop Model Simulation: Right Roll at cz= 60°, Directional Axis
129

60- ........................i....................................................t..................................................._....................................................i....................................................!........................
4o:........................i......................................................i....................................................i....................................................',........................i. i
20: i..................................................i....................................................i....................................................i............................................................................t i t t I
1'6 l'S 2'0 2'2 24
time (sec)
-- Alpha
0.0
-0.5
-1.0
1.Oi _ i _ i........................i....................................................t...................................................i....................................................i............................................................................
....i..................i...........................................................................................................................................................i............................................................................
i I i i i I
16 18 20 22 24
time (sec)
-- R011 Stick.... Pitch Stick
o
IO0
50
0
-50
-100
i i , , P _ I
r i I , .
.......................t................_!i ...........;_', ...........f+-i-;_ ..............................T....................................................I........................', / kl A' ',\ __', i 1
__"_'l i "_, '_ / '' __----_t -_- ! 'it {I! i L , ',:. {
'i ' ', , i ....................................[................................ , ............................. ...2,i._.__ _....... ,.__. ...... _.
_ ! i
I ! ,t i
16 18 20 22 24
time (see)
-- Roll Stick.... Pitch Stick
_0_D
20-
0-
-20-
_ i ! I........ L f I , ',P "V /' _,_ \ ,'1",._ f A<------_i -_-_.-- _.._-IL ..................... _................................................. _.._ ........... _ _ ............................................. *............................. =.--=---=....=.4.=...=....=---:-.... , _7.----_!_ _.._._ _
- _ i',_.,., _',-Y i\_-I ! ti ".... ,' i,,' ',,; i t---j i !
1'6 ' 1'8 ' 2'0 ' 2'2 ' 24
time (see)
-- Diff. Can..... Beta
Aileron
Fig. 57 Drop Model Simulation: Departure at c_= 30°
130
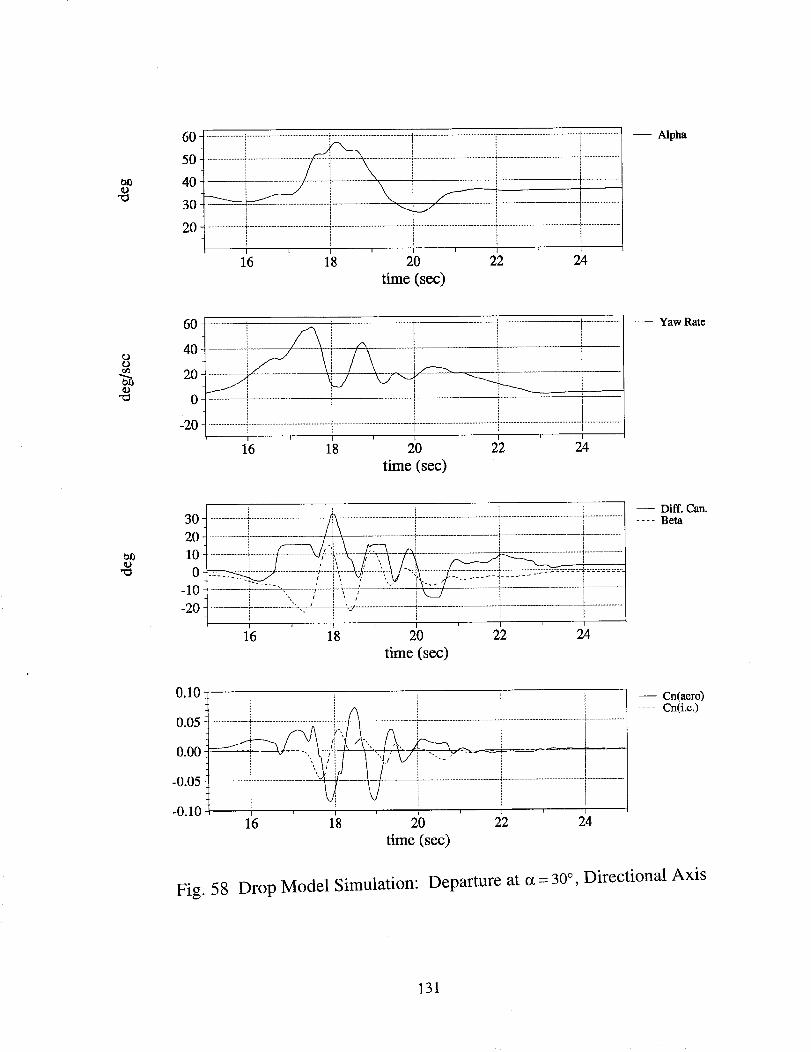
6050403020
.................................................................................................................................i..................................................i............................................................................I I / t I I
16 18 20 22 24
time (sec)
-- Alpha
60-
40
20
0 ;
-20 i i .......................................................................................t i i i I
1'6 1'8 20 22 24
time (sec)
-- Yaw Rate
t_
, I
30 .......................i....................................................................................................i....................................................i...................................................!........................20
10
0-10--
i "-, , i '. , i-20 - ..... - ...............--'-"_-_-'* ....... }....................... _ ....................... I......
I , , ' 2 /2 ' i16 18 20 24
time (sec)
-- Diff. Can.
.... Beta
0.10
0.05
0.00
-0.05
-0.101'6 1'8 20 ' 2'2 ' 24
time (sec)
Fig. 58
-- Cn(aero).... Cn(i.c.)
Drop Model Simulation: Departure at a = 30 °, Directional Axis
131

e_
60
50
40
30
20
........................i....................................................t..................................................i..................................................i....................................................I......................
i i i _
i t i i I i I
16 18 20 22 24
time (sec)
-- Alpha
o
o
40-
20.
0-
-20 -
-40 -
! • m I
......................._....................................................i...................................................!....................................................i.............................................................................
1'6 1'8 2'0 2'2 2)
time (sec)
-- Ptlch Rate
o"O
40
20
0
-20
-40
-60
-- Sym. Can..... TE Flap- - Diff. Can.
0.2
0.1
0.0
-0.1
f,
I _, ' it , /'. ! iJ , J \ i i
....................... + ...........................................7 *'""_*, i...................7 __,.............................. ii.................................................... ti............................................................................
...... ! -................:._...-............., :._.y:...............:,:.._................._.L._
1'6 18 20 22 24
time (sec)
-- Cm(aero)Cm(t.c.)
Fig. 59 Drop Model Simulation: Departure at a = 30 °, Pitch Axis
132
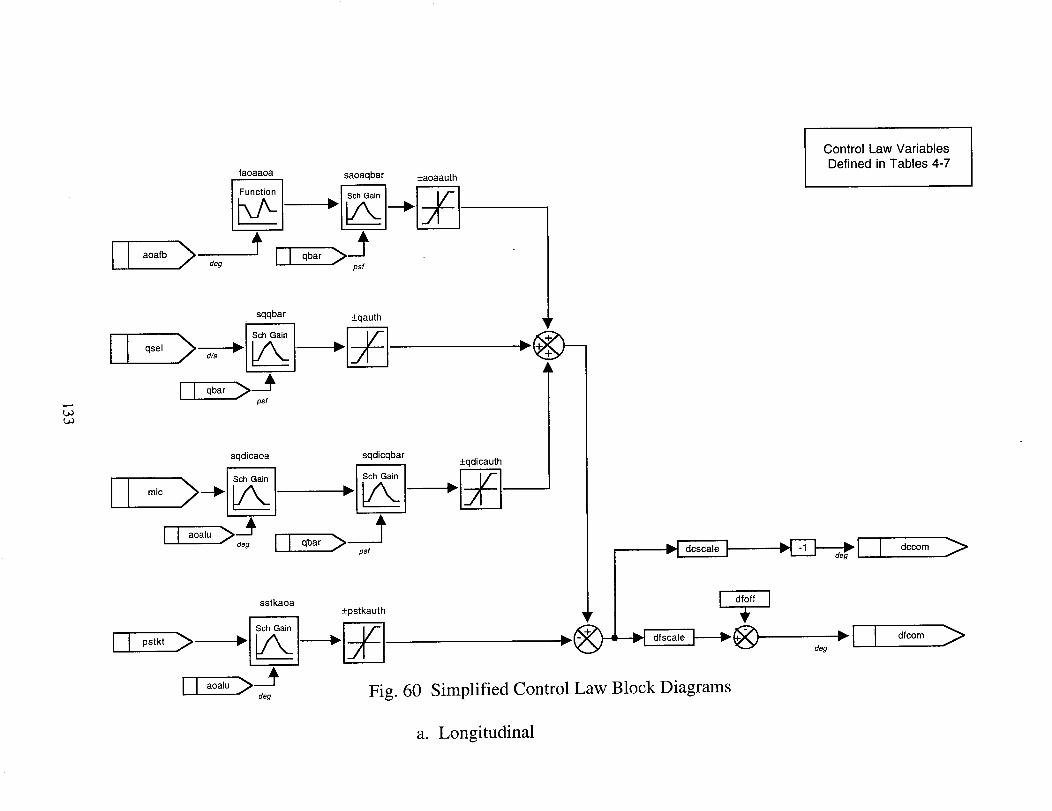
I I a°a*b> ,e_
faoaaoa saoaqbar _+aoaauth
_li' i i qbar >_ Ik
psf
Control Law VariablesDefined in Tables 4-7
L_
sqqbar +qauth
I I qbar >-_1 Apsf
sqdicaoa sqdicqbar+qdicauth
sstkaoa+pstkauth
Fig. 60 Simplified Control Law Block Diagrams
a. Longitudinal

Control Law VariablesDefined in Tables 4-7
L_
rsgear
I I rsprt > _[_
spaaoa
I Sch Gain I
I I pso,>---_deg/sec
I I a°alu >___1_
deg
sbaaoa
I I betcor > dEg--'__
I I aoa,u /_--_dog
spcomaoa
II aoa,u>__4dog
spcomqbar _+rstkauth
iI 00ar ll oa'u> dog
I I qbar
deg
spaqbar, +paauth
psf
+baauth
dacom >
Fig. 60 Simplified Control Law Block Diagrams
b. Lateral

Control Law Variables
Defined in Tables 4-7
L_LA
II 0ys>
II
I pcl
ssriaoa _+sriauth
I I _oa,u>---_deg
srraoa _+rrauth
,_e,>----'_----'1__o im_>_i _
II aoa,u>___4dog
sbraoa+brauth
e, ori i aoa,o>-----_
deg
+oedauth
lFig. 60 Simplified Control Law Block Diagrams
_dcd
rud
-----_1 I drc°rn_>_e_
c. Directional
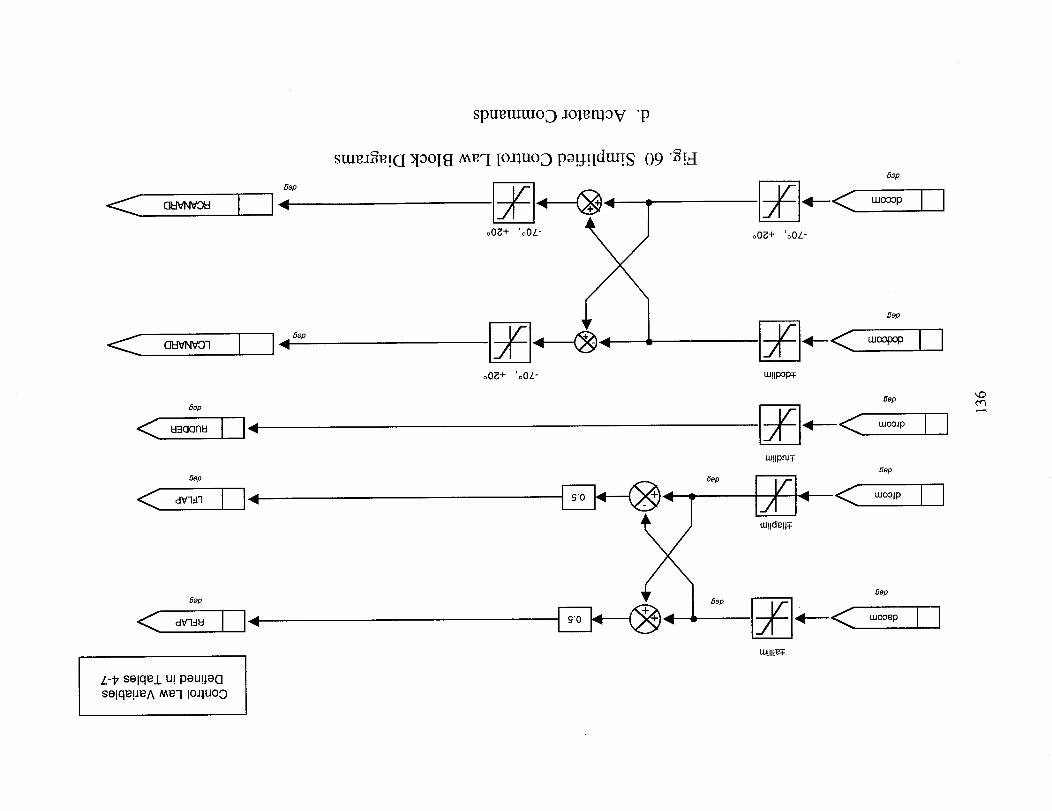
spu_mtuoD _ol_moV "p
8ep
CUVNV_ I •
aUVNVO'I J j._ 8,,p
6ap
6ep
6ap
z-tz selqe/u! peu!_oGselqe!JeA t_e'l IOJ),UOO
stuu_u!CI )I3O1_I A_'-I [o;tluoD poU!ldm!s 09 "_!A
o0_+ 'oOL-
6ep
6ap
6ap
___< _o_pIIo0_ + 'oOZ"
B_p
I_*--< '"_ I I
6ap
__-< ,,,oo_IIUJ!lpru_
6ep
UJ!ldelJT-
Sap
_--I.__< ..,oo_IIW!II!e-T-
cq

o
o
cD O
•,- O O 7"!
cgD_
E
O4O
Oc5
O_1d
!
d!
d!
cOd
!
m
n-
c_
c_o
>
Oo
oO
O
oo
O
_D
137

t..oOO
Rate(deg/sec)
0 T ............................................................................................................................................................................................................................
-- Roll Rate
20 -- - Yaw Rate
10
0
-10
-20
-30 , I I I I [ I I I I I II f
0 5 10 15 20 25
Time (sec)
Fig. 62 Open Loop Response to Aileron Impulse with 100% Vertical Tail
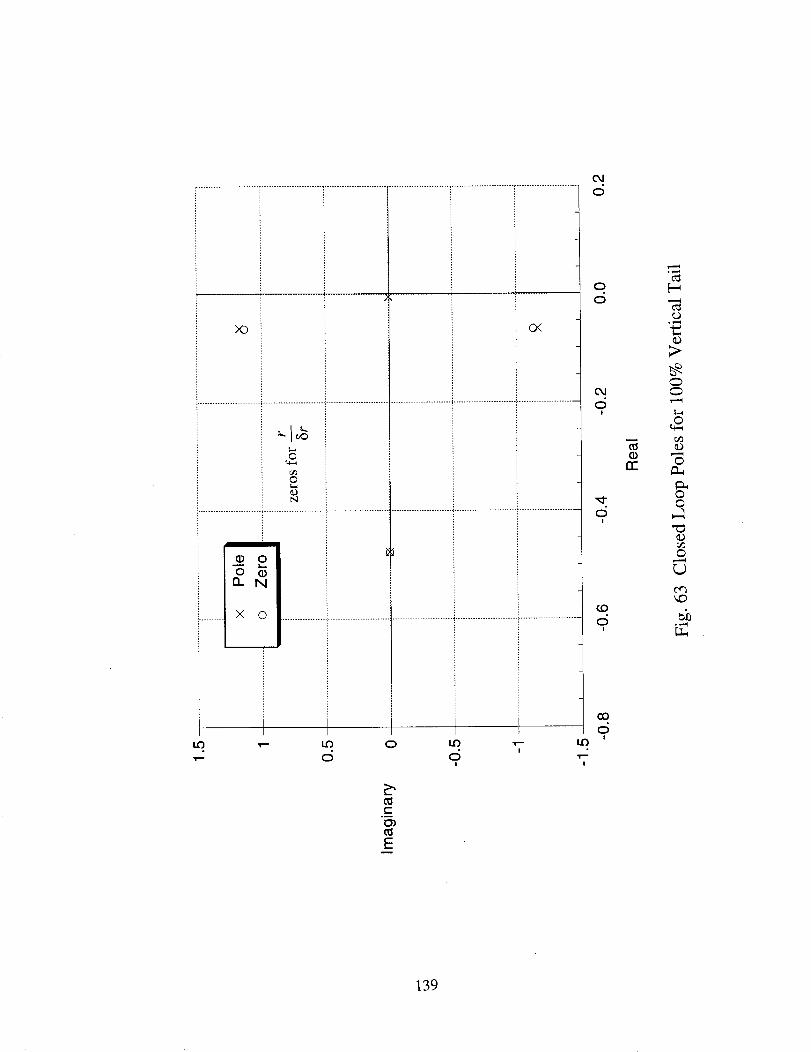
X_ O_
o
o
.......... _tlO0N_-O0IX 0 ................................................................................................................l
_- 0 0 _-!
t-°_
E
0
0
0
O4
o!
m
rr
d!
¢0
d!
co0
!
c_0
o
©
oo
n_0
©
139
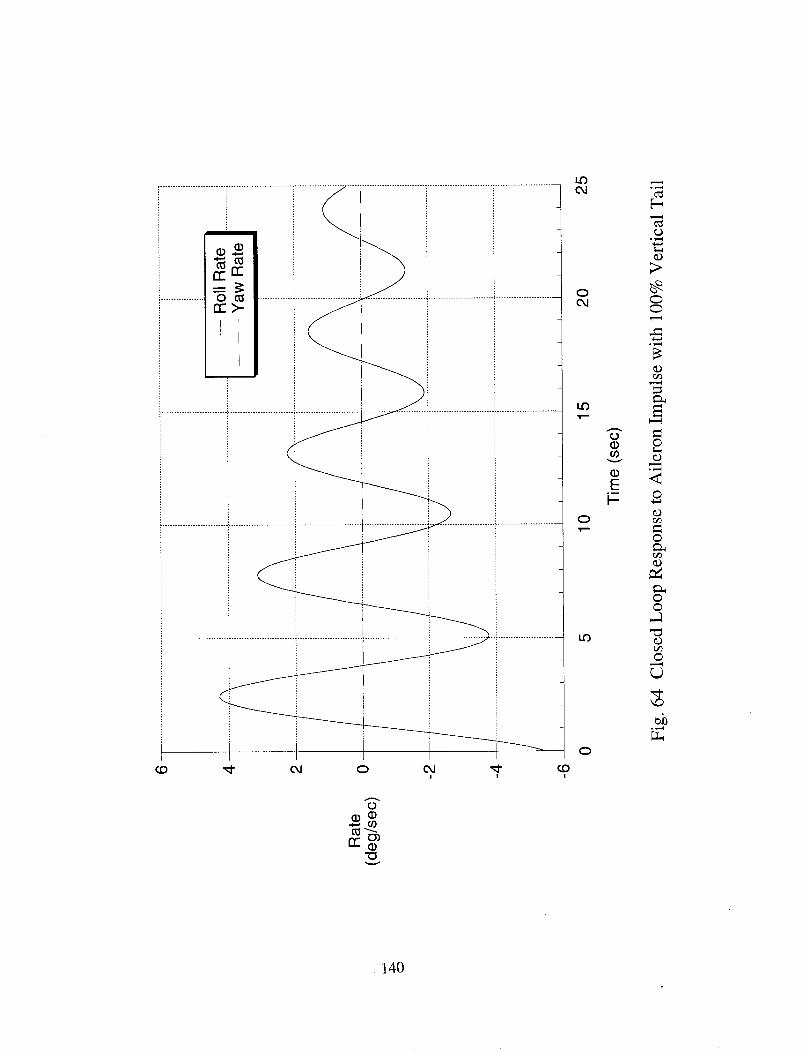
i..........................i.........................i.........................i..........................................................................
i Io_oi i i i
i................. 0 _ ............._..........................: ......................._.........................._.......................
t ti •
..........................i...................................................i.........................i.......................i.......................2
0
c.D '_- eJI i i
(D(D
v
CD
v
CDE
°_
°_
°_
r_
©
°_
©4_
©
©©
©
_o°_-_
140

Imaginary
,5 ................................................................................... -.......................................... _ ......................................... i ..........................................
r
x Pole I1 ..................... o Zero ...................................................................................................................................................
rzeros for --
8dc.........................................
0.5 .......................................................................................................................................................................oX
_/ _ _ ....
X0
-0.5 ........................................................................................................................................................................_.........................................'
-1- ........................................ _........................................... :........................................... :....................................................................................
i-15. ' .... ' ''' ' ' ' ' ''
-0.8 -0.6 -0.4 -0.2 0.0 0.2
Real
Fig. 65 Open Loop Poles for 20% Vertical Tail
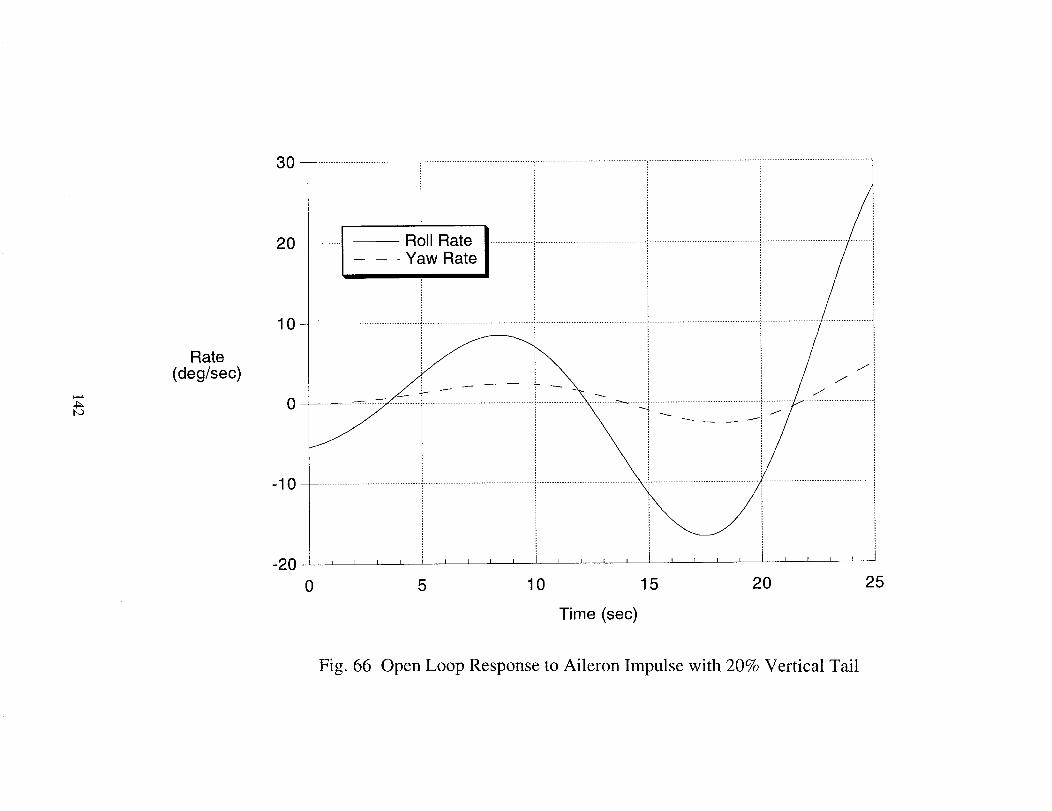
4_t_3
Rate
(deg/sec)
0 ....................................................................................... " ............................................ '............................................. _ ............................................
20-
10-
_
-10 -
-2O
..........I Ro,,RateI................._.........i..................................,............................................_...............................
I - -Yaw Rate I i i i /.........!
i i /E/ i
0 5 10 15 20 25
Time (sec)
Fig. 66 Open Loop Response to Aileron Impulse with 20% Vertical Tail
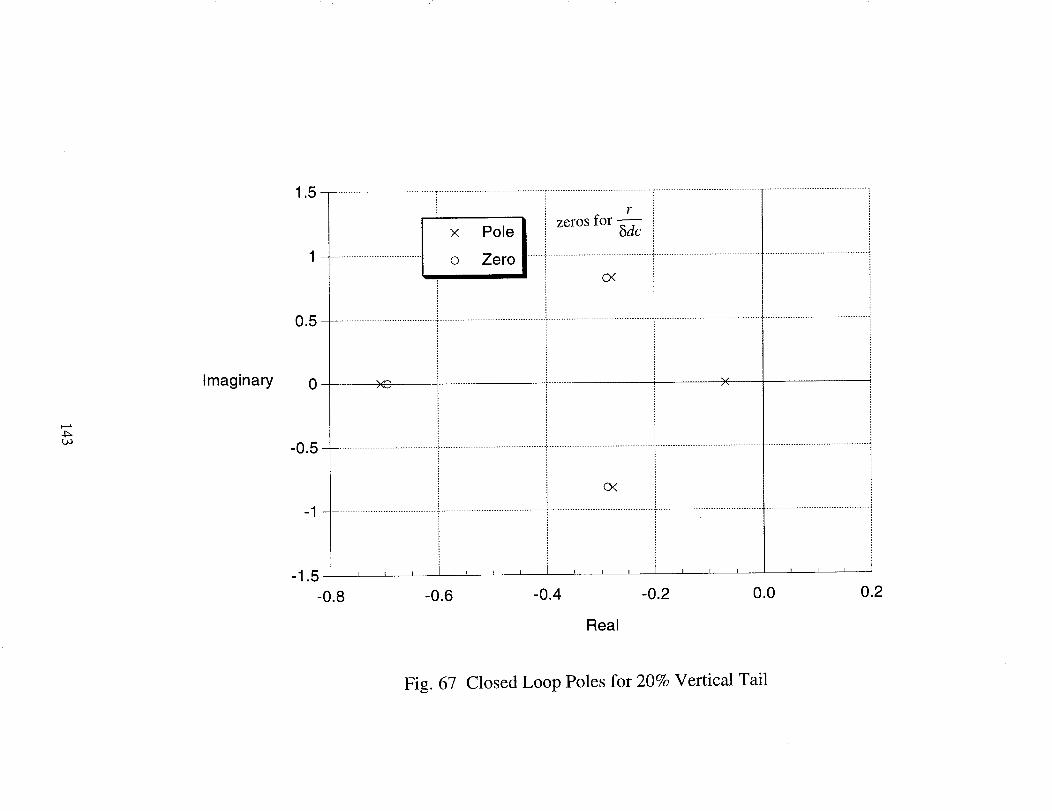
4_L,P
Imaginary
i-
1 .................................. o Zero • ............................._ ..........................................................
.5 ......................................... _ .......................................... _ ......................................... _ ....................................................................................
-0.5
-1
XO X
CK
-15, I I I I I I I I I I I I I I I
-0.8 -0.6 -0.4 -0.2 0.0 0.2
Real
Fig. 67 Closed Loop Poles for 20% Vertical Tail
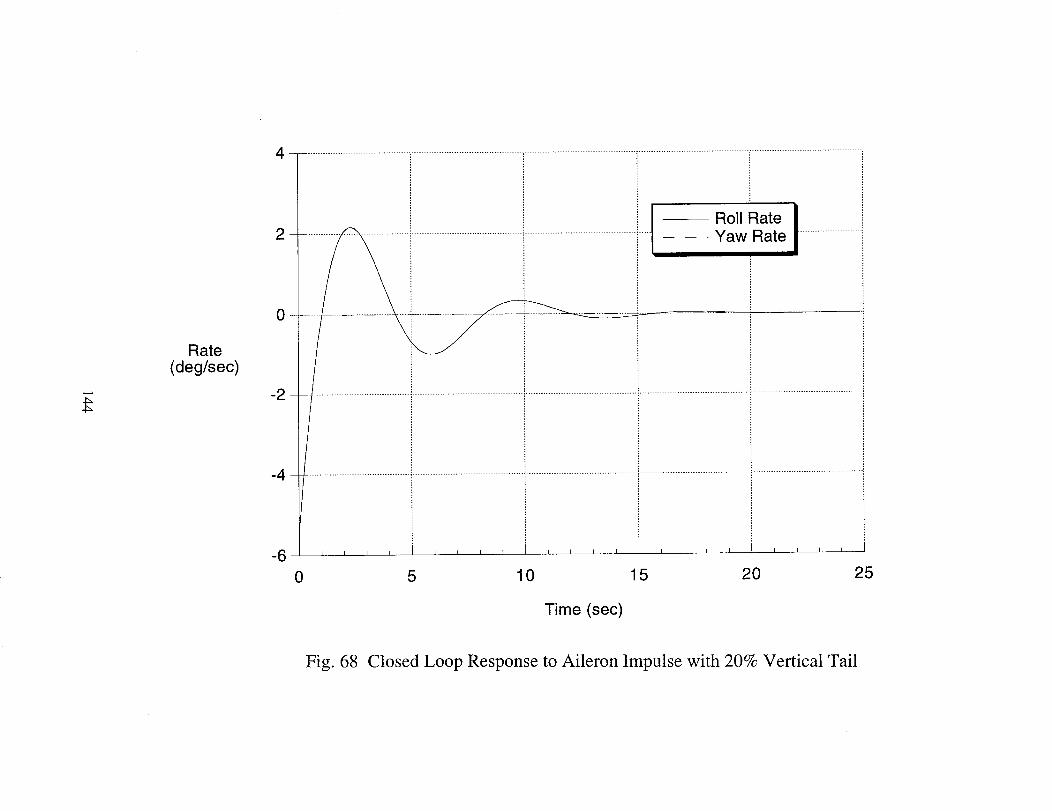
4_
Rate(deg/sec)
T ...................................................................................... ' ............................................ ; ............................................ _ ............................................
l I Roll Rate |
2 ........................................................................................................................i_ .........................i
0
-2
-4-
-6
.....................................................................................i.........................................................................................i............................................, , , , , , , , I , , , , , , , , I , , , ,
0 5 10 15 20 25
Time (sec)
Fig. 68 Closed Loop Response to Aileron Impulse with 20% Vertical Tail
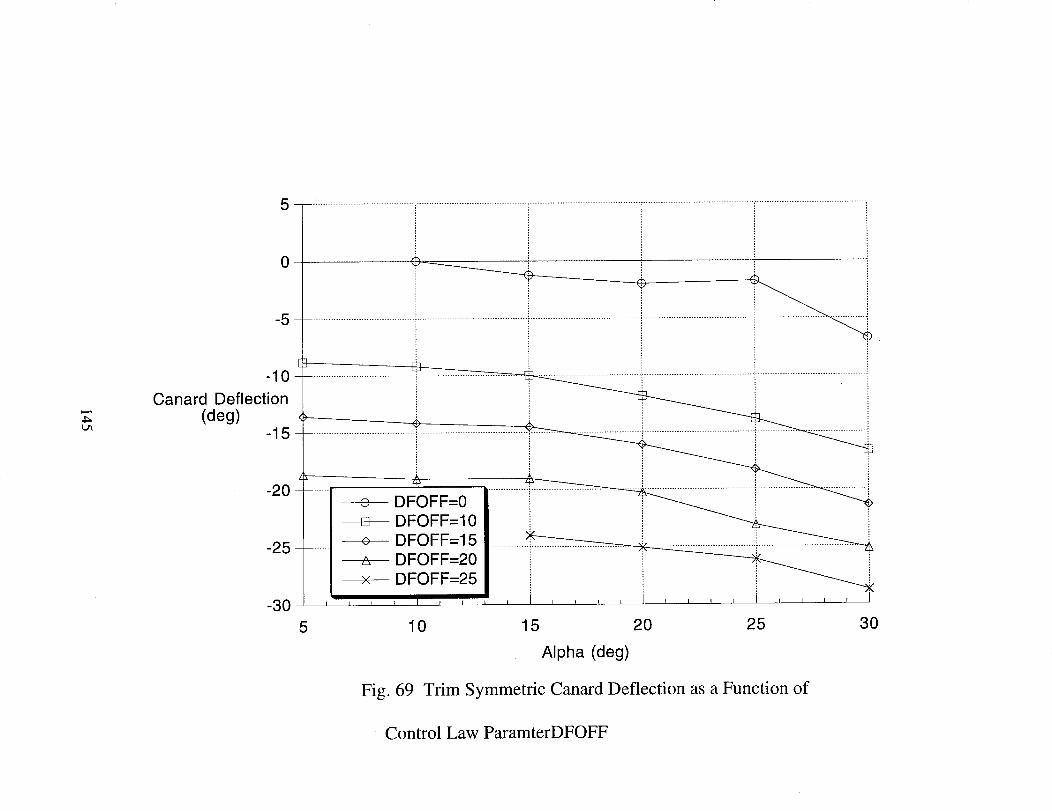
4_L_
Canard
0
-5
-10
Deflection(deg)
-15
-2O
-25
-30
E
I IF!iFF......5 10 15 20 25 30
Alpha (deg)
Fig. 69 Trim Symmetric Canard Deflection as a Function of
Control Law ParamterDFOFF
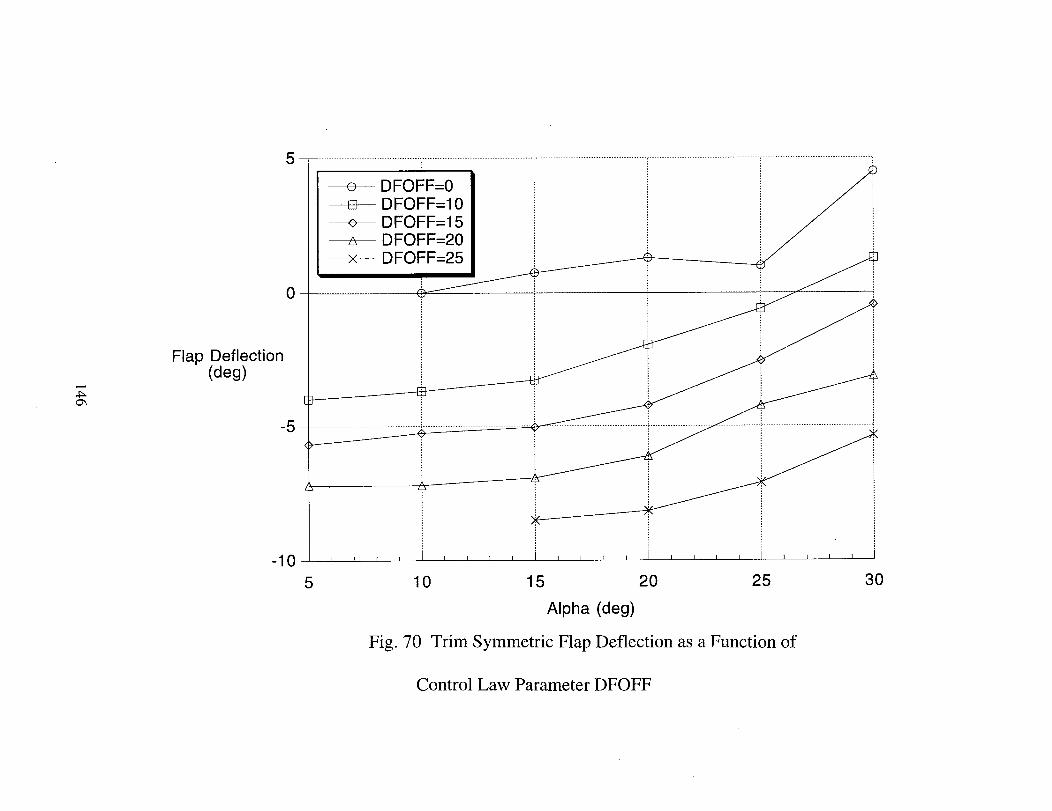
4_
5 .......................................... i..................................................................................................................................................................................:'
DFOFF=0--4a--- DFOFF=10
DFOFF=15DFOFF=20DFOFF=25
i /0
i I f i I r _ I i , I _ I I I i I I I , i w ,
Flap Deflection(deg)
-5
-10
5 10 15 20 25 30
Alpha (deg)
Fig. 70 Trim Symmetric Flap Deflection as a Function of
Control Law Parameter DFOFF
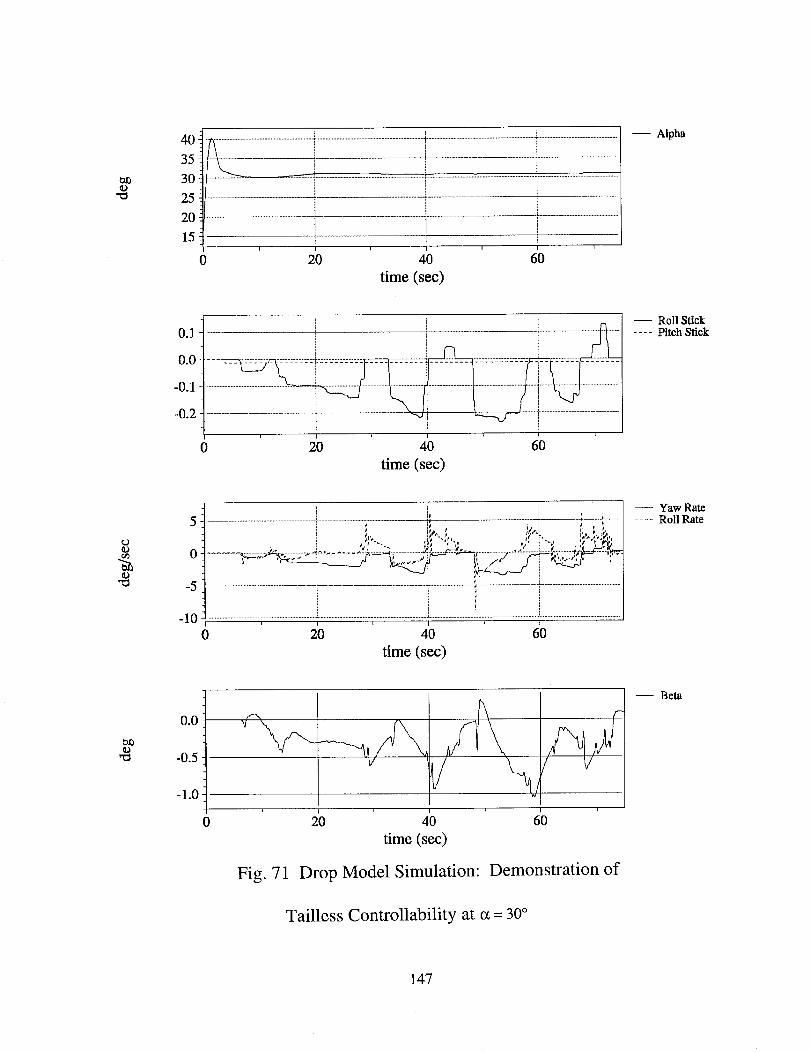
e__D
40_
35!
30_
25
20iL
2'0 ' 4'0
time (sec)
i i
60
-- Alpha
0.1
0.0
-0.1
-0.2
t
' 20 ' 4'0 ' 6'0 '
time (sec)
0
-- Roll Stick
.... Pitch Stick
r_
5
0 ;,,. J.o "_ .... t_ LY4,".... 2 i._; ...........;.:L.._!.g_--
i , !
20 40 60
time (sec)
Yaw Rate
.... Roll Rate
et0
0.0
-0.5
-1.0
0i i
20 40
time (sec)
60
Fig. 71 Drop Model Simulation: Demonstration of
Tailless Controllability at a = 30°
-- Beta
147

elo
40 1__i---------I............................................................................_...............................................................................i................................................................................T.................35 ............ _ ......................_........... _ ....30lt'-'_-- ........................................................................................._.......................................i...................................................................................................
2o_ - i " - i....
0 20 40 60
time (sec)
-- Alpha
0.1
0.0
-0.1
-0.2 ............................................................................... ]................................................................................. ' ................................................................ i..................
0 20 ' 40 ' 60
time (sec)
-- Roll Stick.... Pitch Stick
r.t]
10
5
0
.............................. i ............................................................................................
i i
....................... .;¢_ !. ¢.',%,_ ._..,.. _ ......................... _........_ ,_................... r. .......................... , .... h +------'-_
0 20 ' 40 ' 60
time (sec)
-- Yaw Rate.... Roll Rate
t_
0-
-1
-2
-3-i
' 20 ' 40 ' 60
time (sec)
Fig. 72 Drop Model Simulation: Demonstration of
-- Beta
Tailless Controllability at a = 25°
148
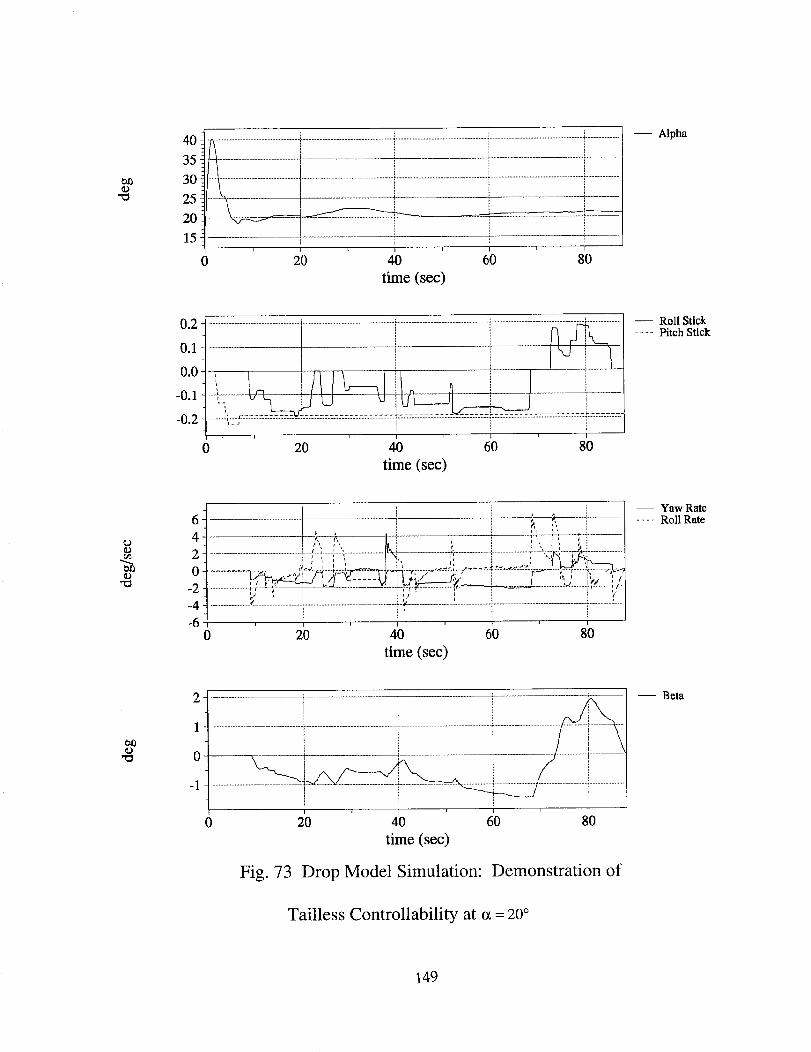
ea_
4oI ..............................................................................................................i...........................................................i.........................................................T.....................
15_ : t _ i : i : !T 1 1
0 20 40 60 80
time (sec)
-- Alpha
0,2-
0.1
0.0
-0.1
-0.2
0 ' 2'0 ' 40 60 ' 80
time (sec)
-- Roll Stick.... Pitch Stick
¢.J
o
4
2
0
-2
-4-6
pll i,
.... }l :, ,', ' )............ _ i. 2,_,_2......... it___............. :.............. +..................._--..-,_-.........;-m......................
I I i t
b_.L;..................:: .....",_ , i '..," ,; i ,_; i', -._:
_ _ '_...................... _...................................... i...........'-......................................... I i, i
0 ' 2'0 ' 40 6'0 80
time (sec)
-- Yaw Rate.... Roll Rate
_
1
0
-1
+ i
i
............ i i i .
0 ' 2'0 ' 40 ' 6'0 ' 80
time (sec)
Fig. 73 Drop Model Simulation: Demonstration of
-- Beta
Tailless Controllability at _ = 20 °
149
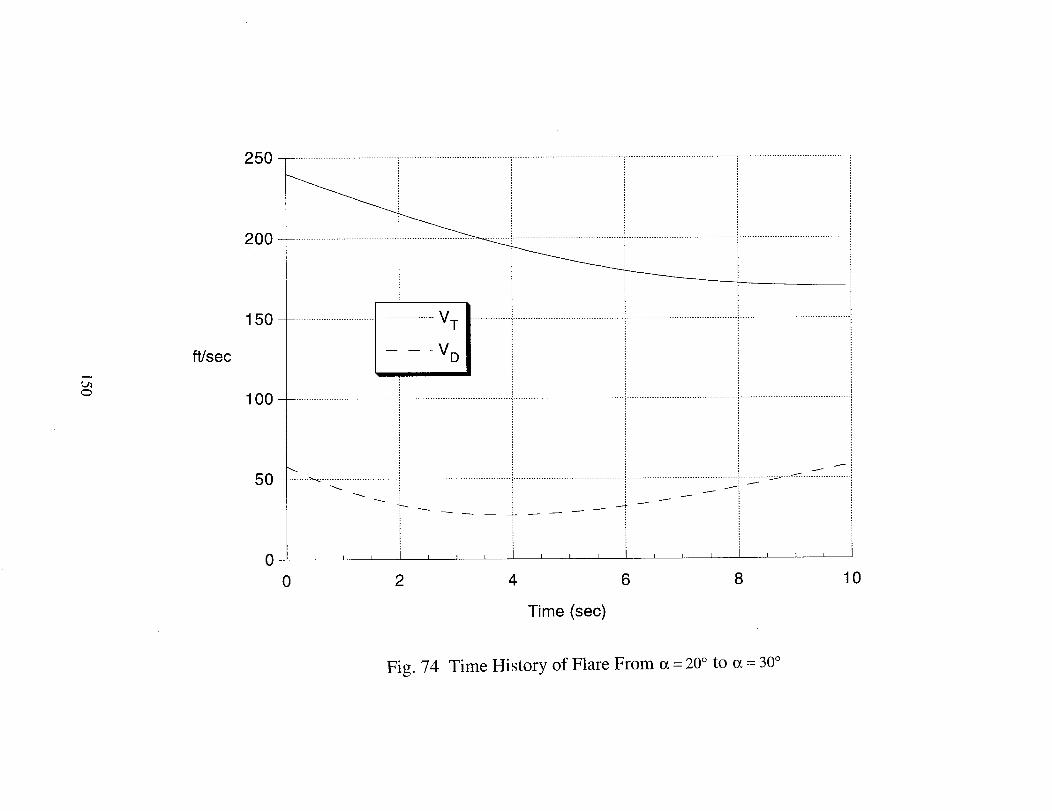
t.ao
ft/sec
250 .......................................................................................i........................................................................................'............................................'
200 - "........................................................................
150 .................................I _ _ _vDVT ........................................................................................................!............................................
_o0........................................i...................................................................................................................................i............................................
50 ....... "_..............................._.........................................................................................................................................._-_ .......................
I I I I I I I I I I I I I I I0
0 2 4 6 8 10
Time (sec)
Fig. 74 Time History of Flare From a = 20 ° to a = 30°