Embed Size (px)
Citation preview

Astronomy & Astrophysics manuscript no. manuscript_single_vs_binary ©ESO 2021February 10, 2021
Different to the core: the pre-supernova structures of massivesingle and binary-stripped stars
E. Laplace1, S. Justham1, 2, M. Renzo3, 4, Y. Götberg5, R. Farmer1, D. Vartanyan6, and S. E. de Mink7, 1, 8
1 Anton Pannekoek Institute of Astronomy and GRAPPA, Science Park 904, University of Amsterdam, 1098XH Amsterdam, TheNetherlands
2 School of Astronomy and Space Science, University of the Chinese Academy of Sciences, Beijing 100012, China3 Department of Physics, Columbia University, New York, NY 10027, USA4 Center for Computational Astrophysics, Flatiron Institute, New York, NY 10010, USA5 The Observatories of the Carnegie Institution for Science, 813 Santa Barbara Street, Pasadena, CA 91101, USA6 Department of Physics and Astronomy, University of California, Berkeley, CA 947207 Max Planck Institute for Astrophysics, Karl-Schwarzschild-Str. 1, 85748 Garching, Germany8 Center for Astrophysics, Harvard-Smithsonian, 60 Garden Street, Cambridge, MA 02138, USA∗e-mail: [email protected]
February 10, 2021
ABSTRACT
The majority of massive stars live in binary or multiple systems and will interact during their lifetimes, which helps to explain theobserved diversity of core-collapse supernovae. Donor stars in binary systems can lose most of their hydrogen-rich envelopes throughmass transfer. As a result, not only are the surface properties affected, but also the core structure. However, most calculations ofthe core-collapse properties of massive stars rely on single-star models. We present a systematic study of the difference between thepre-supernova structures of single stars and stars of the same initial mass (11 – 21 M�) that have been stripped due to stable post-mainsequence mass transfer at solar metallicity. We present the pre-supernova core composition with novel diagrams that give an intuitiverepresentation of the isotope distribution. As shown in previous studies, at the edge of the carbon-oxygen core, the binary-strippedstar models contain an extended gradient of carbon, oxygen, and neon. This layer remains until core collapse and is more extendedin mass for higher initial stellar masses. It originates from the receding of the convective helium core during core helium burningin binary-stripped stars, which does not occur in single-star models. We find that this same evolutionary phase leads to systematicdifferences in the final density and nuclear energy generation profiles. Binary-stripped star models have systematically higher totalmasses of carbon at the moment of core collapse compared to single star models, which likely results in systematically differentsupernova yields. In about half of our models, the silicon-burning and oxygen-rich layers merge after core silicon burning. We discussthe implications of our findings for the explodability, supernova observations, and nucleosynthesis from these stars. Our models willbe publicly available and can be readily used as input for detailed supernova simulations.
Key words. stars: massive – supernovae: general – binaries: close – stars: evolution – nuclear reactions, nucleosynthesis, abundances– stars: neutron
1. Introduction
The question of how massive stars end their lives is one of themost important in stellar astrophysics. Recent developments insupernova simulations, through the inclusion of more sophisti-cated physics and advancements in computational capabilities,have produced the first successful three-dimensional explosionsof stars by independent groups (e.g., Takiwaki et al. 2012; Lentzet al. 2015; Melson et al. 2015; Müller 2015; Roberts et al. 2016;Kuroda et al. 2018; Ott et al. 2018; Summa et al. 2018; Mülleret al. 2019; Vartanyan et al. 2019; Burrows et al. 2020), thoughthe debate is still open regarding which components are essen-tial (for a recent review, see Burrows & Vartanyan 2020). On theobservational side, the rise of robotic transient surveys that arerevealing an unprecedented number and diversity of supernovae,is giving us exceptional samples to compare with theoretical pre-dictions. Examples of these facilities include ZTF (Bellm et al.2019), LSST (Ivezic et al. 2008), DLT40 (Tartaglia et al. 2018),and ASAS-SN (Kochanek et al. 2017). For both stellar explosionmodels and the interpretation of supernova data, robust stellar
models are required that accurately reflect our most recent un-derstanding of massive star evolution.
Most massive stars live in multiple systems, and will in-teract with a companion during their lifetime (e.g., Sana et al.2012). As a result of these interactions, stars can transfer theirhydrogen-rich envelope to a companion star before core col-lapse, leading to supernovae which appear different to thosewhich would be produced if all massive stars were single(Wheeler & Levreault 1985; Podsiadlowski et al. 1992). Tran-sient observations have revealed a diverse population of explo-sions that resemble the supernovae expected from such binary-stripped stars (for a review see, e.g., Modjaz et al. 2019).
Stars which are stripped by binary interactions before theyreach core collapse are also important in forming the observedpopulation of compact-object binaries from isolated binaries(see, e.g., Bhattacharya & van den Heuvel 1991; Dewi & Pols2003; Podsiadlowski et al. 2004; Dewi et al. 2006). Thereforeunderstanding stripped-envelope stars, and the outcomes of theirsupernovae, is disproportionately significant for understanding
Article number, page 1 of 29
arX
iv:2
102.
0503
6v1
[as
tro-
ph.S
R]
9 F
eb 2
021
A&A proofs: manuscript no. manuscript_single_vs_binary
the formation of stellar-mass gravitational-wave merger sources(for which see, eg., Abbott et al. 2016, 2017).
Pioneering work revealed differences between single andbinary-stripped stellar structures, namely, systematically lessmassive final cores (Kippenhahn & Weigert 1967; Habets 1986),except for the mass range in which a second dredge-up de-creases the mass of the helium core in single stars (Podsiad-lowski et al. 2004; Poelarends et al. 2008). Langer (1989b, 1991)and Woosley et al. (1993) found that wind mass loss in pure he-lium stars leads to a shrinking convective core that affects thefinal core mass and composition. Subsequent work investigatedthe conditions for which envelope loss alters the final core struc-ture enough to change whether a massive star of a given initialmass would form a neutron-star or black hole at core collapse(for early studies see, e.g., Brown et al. 1996, 2001; Wellstein &Langer 1999; Pols & Dewi 2002).
However, despite the importance of massive stripped-envelope stars and the potential effects of envelope loss on theevolution and structure of the core, the majority of detailed stel-lar structures at the onset of core collapse are computed for sin-gle stars. Studies that follow the binary interaction in detail arerare. A common assumption is that the structures of binary pro-genitors can be adequately approximated with pure helium starmodels (e.g., Woosley 2019). An alternative simplifying approx-imation is that the outcomes following mass transfer in a binarysystem are equivalent to mass loss over an assumed timescale un-til a certain surface composition has been reached (e.g., Schnei-der et al. 2020).
Few calculations of binary stellar models self-consistentlycapture changes in the composition and interior structurethrough the final hydrostatic burning phases of massive stars.Instead, stellar evolution calculation of binaries are commonlystopped at earlier stages, such as the end of core carbon burning(e.g., Eldridge & Vink 2006; Yoon et al. 2010, 2017; Eldridgeet al. 2018; Gilkis et al. 2019). Models of core-collapse progen-itors often use a small nuclear reaction network that only ap-proximately capture the late phases of nuclear burning (Timmes1999; Timmes et al. 2000; recent examples include Aguilera-Dena et al. 2020; Schneider et al. 2020). In reality, after a silicon-rich core has been formed in massive stars, leptonic losses due toelectron-capture processes significantly change the interior stel-lar structure and composition (Hix & Thielemann 1996). Farmeret al. (2016) demonstrated the potential impact of the size ofthe nuclear reaction network and of the numerical resolution onthe structure of pre-core-collapse models. However, appropri-ately extensive nuclear reaction networks are time- and memory-intensive, and thus relatively computationally expensive, there-fore few suitably detailed models are available (Woosley et al.2002; Woosley & Heger 2007; Renzo et al. 2017). This lackof detailed progenitor models matters because even small dif-ferences in stellar structure can have large consequences for theoutcomes of simulations of stellar core collapse (e.g. the locationof the silicon/oxygen interface, for which see Vartanyan et al.2018).
To better understand the impact of binary interaction on thestellar structure at core collapse, a systematic comparison be-tween the pre-supernova core structures of single stars and ofstars stripped in binary systems is needed. Recent studies havepresented pre-core-collapse models of stars that have lost theirhydrogen-rich envelopes (Marchant et al. 2019; Woosley 2019;Schneider et al. 2020) and even their helium-rich layers (Tauriset al. 2015; Kruckow et al. 2018).
Independent groups have also explored the explodability ofstars, and the distribution of remnant compact object masses, us-
ing the evolution of carbon/oxygen cores with varying carbon tooxygen mass fractions (e.g. Patton & Sukhbold 2020), or pre-scriptions based on the masses of carbon-oxygen cores and he-lium shells (Fryer et al. 2012; Ertl et al. 2016, 2020; Mandel &Müller 2020; Mandel et al. 2020). A limitation of these studies istheir assumed homogeneous composition distributions, at eitherthe start or end of core helium burning, which may not accuratelycapture the complex structure revealed by more detailed stellarevolution models.
Here, we systematically compare the evolution and pre-supernova structures of single stars and donor stars in binary sys-tems. We present models of stars at solar metallicity with initialmasses of 11 to 21 M� that are representative of neutron star pro-genitors. After core oxygen depletion we solve the stellar struc-ture simultaneously with a nuclear network of 128 isotopes, so asto self-consistently model the burning including the evolution ofthe electron fraction. Following Farmer et al. (2016), we employa sufficiently high spatial and temporal resolution to ensure aconverged final helium core mass. We compare the compositionstructures using novel diagrams that represent the stellar struc-ture on a two-dimensional surface and enable the visualizationof the full isotope distribution. We investigate the origin of thesystematic differences in structure and composition by studyingdetails of the late-time evolution.
We first review the general effect of stable mass transfer in abinary system and the differences that arise compared to the evo-lution of single star models of the same initial mass in Section 3.We present our main findings on the systematic differences in thepre-supernova density and composition structure of single andbinary-stripped star models with the same core mass in Section4. In Section 5, we investigate the origin of these differences.We discuss the implications and limitations of our findings inSection 6, and summarize our conclusions in Section 7.
2. Method
We employed the MESA stellar evolution code (version 10398,Paxton et al. 2011, 2013, 2015, 2018, 2019) to compute stellarstructure of massive stars from the beginning of core hydrogenburning until the onset of core collapse. We calculated two setsof 11 stellar models with the same initial masses of 11 – 21 M�.The first set follows the evolution of single massive stars, whilethe second models the evolution of stars with the same initialmasses but in a close binary system.
For the binary models, we used the same setup as in Laplaceet al. (2020), in which we simplified the computation of the bi-nary interaction by approximating the initially less massive com-panion star (the secondary) as a point mass with initially 80% ofthe mass of the primary star. We assumed mass transfer occursconservatively such that no mass is lost during Roche-lobe over-flow. We followed the time-dependent mass transfer evolution,which depends on the radial and orbital evolution of our mod-els, computed self-consistently. We focused on binary systemsundergoing the most common type of mass transfer, known asstable case B mass transfer (de Mink et al. 2008). This term des-ignates mass exchange initiated by the primary star filling itsRoche lobe after expanding during the hydrogen shell-burningphase that follows the end of core-hydrogen burning (Kippen-hahn & Weigert 1967; Tutukov et al. 1973). We chose initialorbital periods between 25 and 35 d. This is not done system-atically, but we believe the evolutionary stage at the beginningof mass transfer is sufficiently similar so as to not significantlyaffect our results (Götberg et al. 2017; Laplace et al. 2020). Forthese choices of binary parameters at solar metallicity, stars of
Article number, page 2 of 29

E. Laplace et al.: Different to the core: the pre-supernova structures of massive single and binary-stripped stars
11 M� and above do not interact again with their companion af-ter the first phase of mass transfer for these choices of physicsand binary parameters (Yoon et al. 2017; Laplace et al. 2020).Thus, after the primary star reached core helium depletion (de-fined as the moment when the central helium mass fraction inthe core decreases below 10−4), we only followed the evolutionof the primary star.
For both the single stars and the primary stars in binary sys-tems, we used the same choice of physical assumptions, ex-plained in detail below.
Starting and stopping conditions – We defined the startingpoint of the evolution as the moment when the abundance ofhelium in the center increases by 5%. From this point on, weevolved the models until the onset of core collapse, which wedefined as the moment when the in-fall velocity of any pointwithin the boundary of the "iron"-rich core reaches 1000 km s−1
(Woosley et al. 2002). Here, "iron" includes all species for whichthe mass number is higher than 46. Throughout this work, we de-fine the core boundaries as the mass coordinate where the massfraction of the depleted element (for example 28Si in the case ofthe "iron" core) decreases below 0.01 and the mass fraction ofthe most abundant element (for example "iron") increases above0.1. We verify that the exact choice of the onset of core collapsedoes not affect our results in Appendix E. We did not take rota-tion into account for the evolution of single stars. For the binarystar models, the models start without rotation but are synchro-nized by tidal forces at the begin of the evolution.
Metallicity and opacities – The models were computed at so-lar metallicity, (Z = 0.0142, Asplund et al. 2009, where Z is themass fraction of elements heavier than helium) and we employedthe opacity tables from Ferguson et al. (2005) and from OPAL(Iglesias & Rogers 1993, 1996). We assumed an initial heliummass fraction of Y = 2Z + 0.24 and an initial hydrogen massfraction of X = 1 − Y − Z, following Tout et al. (1996) and Polset al. (1998).
Nuclear reaction network – To obtain accurate informationfor the interior composition profile at the onset of core collapse,a large nuclear reaction network is needed. It allows to followall electron-capture processes that become significant after core-oxygen depletion and that affect the core structure through leptonlosses. Farmer et al. (2016) showed that only models computedwith nuclear reaction networks containing at least 127 isotopesdo not exhibit significant variations in their pre-supernova struc-ture (e.g., the mass of the iron core) compared to models withlarger networks. Therefore, after core-oxygen depletion, we em-ployed a nuclear reaction network consisting of 128 isotopes(mesa128, Timmes 1999; Timmes et al. 2000; Paxton et al.2011).
MESA solves the fully coupled stellar structure and compo-sition equations simultaneously using a single reaction network(Paxton et al. 2011, 2015). This enables a self-consistent calcu-lation of all quantities, including but not limited to the energygeneration rate, the electron fraction, and the composition. Wecomputed nuclear reactions in the stellar interior until the endof core oxygen burning with an alpha-chain network contain-ing the 21 most important isotopes for these evolutionary phases(approx21, Timmes et al. 2000; Paxton et al. 2011). We choseto perform a single switch of nuclear network, rather than gradu-ally increasing the number of isotopes taken into account for dis-tinct evolutionary steps. This allowed us to minimize numericalartifacts that can be introduced by these switches (Renzo 2015;Renzo et al. 2017). We tested the impact of the size of the nuclearnetwork on the composition and density profiles of two represen-
tative models from our grid (Appendix A). We employed valuesfrom Angulo et al. (1999) for the 12C(α, γ)16O rate.
Mixing – For convective mixing we used the mixing lengththeory approximation (Böhm-Vitense 1958) with a mixinglength parameter αMLT = 1.5. Due to numerical issues in theouter layers of the most massive stellar models, we treated con-vection using the MLT++ scheme of MESA (Paxton et al. 2013)before core oxygen depletion. This method artificially increasesthe energy flux in radiation dominated convectively inefficientlayers (cf. Jiang et al. 2015, 2018). We took into account con-vective overshooting above the core and shells by using a stepovershooting parameter of 0.335 pressure scale heights, appro-priate for stars in our mass range (see Brott et al. 2011). We didnot assume any undershooting.
Winds – For the stellar winds, we used the "Dutch" schemeof MESA (de Jager et al. 1988; Nugis & Lamers 2000; Vinket al. 2001). For the wind mass loss of binary-stripped stars,we employed the extrapolated empirical prescription of Nugis& Lamers (2000) (for more details, see Laplace et al. 2020). Thetiming and amount of wind mass loss has a significant impacton the pre-collapse core structure of massive stars (Renzo et al.2017; Gilkis et al. 2019), but we expect the binary interactionsto produce a larger effect (because of the shorter timescale andhigher mass loss rates). We investigate the effect of varying thewind mass loss rate in Appendix D.
Resolution – Numerical spatial resolution, that is, the choiceof the number and minimum step between mass shells, can af-fect the pre-supernova structure of stellar models (Farmer et al.2016). Testing showed that converged values of stellar param-eters (e.g., the helium core mass) could be obtained by choos-ing at least 1000 mass cells in each model (with an average of5000 throughout the evolution) and ensuring that about one thou-sandth of the total mass be contained in each cell (max_dq =10−3). Further details can be found in our MESA inlists avail-able online1.
The analysis was performed with the following open-sourcecodes: mesaPlot (Farmer 2019), matplotlib (Hunter 2007),numpy (van der Walt et al. 2011), ipython/jupyter, (Perez &Granger 2007) and tulips (Laplace et al. in prep.).
3. Comparison of a representative single and binaryevolutionary model
In this section, we review generic differences in evolution be-tween single star models and binary models of the same ini-tial mass. To this end, we compare the evolution of two repre-sentative models that start their evolution with the same initialmass of 11 M�. In Fig. 1, we present the evolution of these mod-els. In the bottom panels, we display evolutionary tracks on theHertzsprung-Russell (HR) diagram and on the central density –central temperature (log ρc- log Tc) plane. We also show the evo-lution of the compactness parameter ξM , commonly used to char-acterize the core structure of stars (see also Section 5.4), definedas follows (O’Connor & Ott 2011)
ξM =M/M�
R(M)/1000 km. (1)
Here, we evaluate the compactness parameter at M = 2.5 M�,which approximately corresponds to the boundary betweenblack hole and neutron star masses (Ugliano et al. 2012). Wefurther show composition structure diagrams at specific times of
1 https://doi.org/10.5281/zenodo.4506804
Article number, page 3 of 29

A&A proofs: manuscript no. manuscript_single_vs_binary
0.1R⊙
1R⊙
10R⊙
100R⊙1000R⊙
3.6
3.8
4.0
4.2
4.4
4.6
4.8
5.0
log 1
0(T e
ff/K
)
3.25
3.50
3.75
4.00
4.25
4.50
4.75
log10(L/L⊙)
A
B
CD
E,F
CD
E,F
12
34
56
7lo
g 10(
ρ c/[
gcm
−3 ])
7.50
7.75
8.00
8.25
8.50
8.75
9.00
9.25
log10(Tc/K)
A
BCD
E
F
−2
02
46
log 1
0[( τ
F−
τ)/y
r]
0.01
0.02
0.03
0.04
0.05
Compactnessξ2.5
AB
CD
EF
Sing
leB
inar
y-st
ripp
ed
Fig.
1.E
volu
tion
ofre
pres
enta
tive
sing
le(b
lue)
and
bina
ry-s
trip
ped
star
(red
)m
odel
sw
ithth
esa
me
initi
alm
ass
of11
M�
until
core
oxyg
ende
plet
ion.
Key
mom
ents
ofth
eev
olut
ion,
disc
usse
din
Sect
ion
3,ar
em
arke
dw
ithle
tters
Ato
F.U
pper
pane
ls-C
hem
ical
stru
ctur
eof
the
sing
lest
ar(t
op)a
ndth
edo
nors
tari
na
bina
rysy
stem
(bin
ary-
stri
pped
star
,bot
tom
)with
the
sam
ein
itial
mas
sof
11M�
atke
ym
omen
tsof
the
evol
utio
n.T
hera
dial
dire
ctio
nis
prop
ortio
nalt
oth
esq
uare
root
ofth
eto
talm
ass
ofth
em
odel
(see
text
).T
heto
talm
ass
isgi
ven
belo
wea
chm
odel
.Col
ors
indi
cate
the
loca
lmas
sfr
actio
nof
each
isot
ope.
The
surf
ace
area
span
ned
byea
chel
emen
tis
prop
ortio
nalt
oits
tota
lmas
s.T
hedi
agra
ms
are
divi
ded
into
conc
entr
icri
ngs.
Eac
hri
ngis
api
ech
arto
fth
em
ost
abun
dant
isot
opes
inth
em
odel
s.Fr
omou
tsid
e,m
ovin
gin
war
d,gr
ayci
rcle
sm
ark
regi
ons
cont
aini
ng10
0,75
,50,
and
25pe
rcen
tof
the
tota
lmas
s,re
spec
tivel
y.L
ines
are
plac
edat
equa
lint
erva
lsof
1/8
ofth
eto
talf
ract
ion
ofis
otop
es.T
oai
dth
eco
mpa
riso
n,da
shed
blue
orre
dci
rcle
sin
dica
teth
eto
talm
ass
ofth
eal
tern
ate
mod
el(s
ingl
eor
bina
ry-s
trip
ped)
atth
esa
me
stag
e.B
otto
mpa
nels
-Evo
lutio
nof
the
sing
le(b
lue)
and
bina
ry-s
trip
ped
(red
)mod
els
onth
eH
ertz
spru
ng-R
usse
lldi
agra
m(l
eft)
and
the
cent
rald
ensi
ty-c
entr
alte
mpe
ratu
re(c
ente
r)pl
ane.
Cir
cles
and
diam
onds
mar
kim
port
ante
volu
tiona
ryst
eps
fort
hesi
ngle
and
bina
ry-s
trip
ped
star
mod
el,r
espe
ctiv
ely.
We
also
show
the
evol
utio
nof
the
com
pact
ness
para
met
er(r
ight
)as
afu
nctio
nof
the
time
until
core
oxyg
ende
plet
ion.
Ver
tical
dash
edlin
esm
ark
impo
rtan
tevo
lutio
nary
step
s.
Article number, page 4 of 29

E. Laplace et al.: Different to the core: the pre-supernova structures of massive single and binary-stripped stars
the evolution. Since these diagrams2 differ from standard repre-sentations of the stellar composition found in the literature, webriefly describe them here. Each color in the composition dia-grams represents a different isotope. The center and edge of theshaded circles in each of the composition diagrams correspond tothe center and surface of each star, respectively, and rings aboutthe center represent intermediate mass coordinates. Specifically,the radius of each ring about the center is proportional to the thesquare root of the Lagrangian mass coordinate. The fraction ofeach ring which is shaded in a particular color indicates the massfraction of the corresponding isotope at that mass coordinate.This combination means that the total area of any color in theplot is proportional to the total mass of the corresponding isotopein the stellar model. At each mass coordinate the isotopes are or-dered counter-clockwise, by increasing atomic number (and, forisotopes with identical atomic number, by increasing mass num-ber). Nuclear fusion typically causes the mass fraction of thedominant, low atomic number, species to decrease. Hence in re-gions of nuclear fusion, evolutionary composition changes typi-cally cause color patterns to move clockwise on the compositiondiagram3. To aid the comparison between different diagrams, weshow dashed red/blue circles that indicate the total mass of thecorresponding binary/single star model.
In the sections that follow we describe the representative sin-gle and binary models at key phases of the evolution, referringto the phases labeled A-F in Fig. 1.
3.1. Early evolution until mass transfer in binary models (A –B)
The first part of the evolution, starting from the zero-age main-sequence (labeled point A in Fig. 1) is identical for the single starmodel and the primary star in the binary model. Tides and rota-tional effects due to the binary evolution have a negligible impactat this stage. The stars begin their evolution with a solar metal-licity composition, that is, abundances of 0.7174, 0.2684, and0.0142 for hydrogen, helium, and heavier elements, respectively(Asplund et al. 2009), as shown in the composition diagrams.
After the end of core hydrogen burning, the stars burn hy-drogen in a shell and expand, as can be observed on the HR dia-gram in Fig. 1, in which we diagonal lines show loci at constantradii. At point B, the binary star fills its Roche lobe and startsto transfer matter to its companion, leading to a divergence ofthe evolutionary tracks on the HR diagram. At this point, thestars still have an identical chemical structure (see point B in thecomposition diagrams of Fig. 1), with a pristine composition inthe outer layers and a core which is composed mainly of helium,with small mass fractions (less than 0.01) of nitrogen, which hasbeen produced by the CNO cycle. The spiral structure visible inthe center of the composition diagram (point B in Fig. 1) reflectsthe chemical gradient developed above the helium core. This isthe result of the recession in mass coordinate of the convectivecore during core hydrogen burning. At this stage, the physicalconditions in the stellar core are still the same for the single andthe binary model. This can also be seen in the evolutionary trackson the log ρc- log Tc plane in Fig. 1, where the tracks of the sin-gle and binary star are indistinguishable between point A and B.The same is true for the compactness parameter.
2 The composition diagrams are constructed using the python pack-age tulips that is being prepared for release as open source software,(Laplace et al. in prep.).3 A movie showing the changes in composition can be found athttps://doi.org/10.5281/zenodo.4506804.
3.2. Development of key differences until the end of corehelium burning (B – D)
The donor star in the binary transfers matter to its companion andloses nearly all its outer hydrogen envelope (B – C), becoming a"binary-stripped" star and leading to a dramatic change in chem-ical structure and surface properties (for a detailed descriptionsee, e.g., Götberg et al. 2017; Laplace et al. 2020). This changeis apparent on the composition diagrams at point C of Fig. 1 (seealso the dashed colored circles giving the total mass of the al-ternate model). Meanwhile, the single star continues to expandand cool while burning hydrogen in a shell. At point C, bothmodels have fused half of the helium inside their cores. This isthe moment when the central temperature and density conditionsof the stars start to diverge (see the log ρc- log Tc diagram andcompactness parameter evolution in Fig. 1). At the same evolu-tionary stage (C), the binary-stripped star has a slightly denserand cooler core than the single star, because from this point on,the binary-stripped star behaves, to a first approximation, likethe core of a star with a lower initial mass (cf. Kippenhahn &Weigert 1967).
At the end of core-helium burning (D, defined as the momentwhen the central helium mass fraction drops below 10−4), the he-lium core mass of the single star model is larger than that of thebinary-stripped star (see the dashed circle on the compositiondiagram at point D in Fig. 1). This can be explained by two ef-fects: (1) the helium core mass of single stars increases due to thecreation of helium by the hydrogen burning shell (e.g., Woosley2019); (2) the binary-stripped star loses mass due to winds, lead-ing to a decrease of the helium core mass (see also AppendixB). At core helium depletion, the core composition differ sig-nificantly between the models (see the composition diagrams atpoint D in Fig. 1). While the cores of both the single and thebinary-stripped star model are composed of the same productsof core helium burning (namely carbon, oxygen, and neon), therelative ratios of these elements are different. The mass fractionof carbon is larger in the binary-stripped star with an abundanceof 0.38 compared to 0.33 for the single star. In contrast, the massfraction of oxygen is smaller for the binary-stripped star model,0.60 compared to 0.65 for the single star. This is caused by dif-ferences in the mass and density of their cores and by the dis-tinct behavior of their convective cores during core helium burn-ing (cf. Langer 1989b; Woosley et al. 1993; Brown et al. 2001).Higher core masses and lower densities, together with a growthof the convective helium-burning core, favor a more efficient de-struction of carbon through alpha captures in single-star modelsand leads to the observed differences in central carbon and oxy-gen mass fractions (Woosley et al. 1993; Brown et al. 2001, seeSection 5.1 for more details).
The binary-stripped star model develops an extended car-bon/oxygen gradient at the edge of the core (visible on the com-position diagram as the lime colored outer "arm" at the bottomof the dark green region at point D in Fig. 1). This is due to theconvective core shrinking during core helium burning as a resultof wind mass loss (Langer 1989b; Woosley et al. 1993, for moredetails, see Section 5.1 and Appendix D). At core helium deple-tion, the compactness parameter reaches a value of 0.03 for boththe single and binary-stripped star models.
3.3. Evolution after core helium depletion (D – F)
After the end of core helium burning, both stars expand againwhile burning helium in a shell (labeled D – E in Fig. 1) and
Article number, page 5 of 29

A&A proofs: manuscript no. manuscript_single_vs_binary
reach their final location on the HR diagram4. The stars enter thefinal burning stages of heavier elements, starting with core car-bon burning, and the evolution accelerates due to neutrino losses(e.g., Fraley 1968). During this phase, a large difference in theevolution of the compactness parameter can be observed in Fig.1. The compactness value of the binary-stripped star model de-creases, while it increases for the single star model. This reflectsthe change in radius evaluated at the same mass of 2.5 M�.
The previously built-up chemical composition differences re-main until the end of core carbon burning (labeled E in Fig. 1,which marks the moment when the central mass fraction of car-bon drops below 10−4). The binary-stripped star model is lessabundant in oxygen and more abundant in neon and magnesiumthan the single star. This can be attributed to the different com-position at the beginning of core carbon burning and to the dif-ferent burning conditions during core carbon burning as shownin log ρc- log Tc diagram in Fig 1. The compactness parameterof the single star decreases. This is due to a "flash", i.e. ignitionof the following fuel (here, carbon) in a particularly degenerateenvironment (cf. Fig. 7 of Renzo et al. 2017, see also Sukhbold& Woosley 2014).
The composition profiles become increasingly different dur-ing this phase of the evolution (E – F, where F marks the momentwhen the central oxygen mass fraction drops below 10−4). Dur-ing this stage, the stars develop a central core mainly composedof silicon, sulfur, and calcium. In the single star model, the massfraction of silicon is lower than in the binary-stripped model. Incontrast, the mass fraction of sulfur and calcium is larger in thesingle star model compared to the binary-stripped star model.
When massive stars reach oxygen depletion (labeled F in Fig.1), they have less than a few days left to live (e.g., Woosley et al.2002). This is the moment when oxygen shell-burning followedby core and then shell silicon burning, occur. Immediately after,the iron-rich core begins to collapse. At this point we stop ourmodels, since the high density and extremely neutron-rich mate-rial requires a nuclear equation of state and detailed treatmentsof the neutrino physics.
4. Differences between single and binary-strippedmodels at core collapse
In the previous section we compared single and binary-strippedstar models with the same initial mass. In this section, we com-pare the properties of models with similar core masses. This isbecause the explosion properties are mainly determined by themass of their carbon/oxygen cores (e.g., Woosley et al. 2002;Farmer et al. 2019). We define the reference core mass as themass of the helium core at the end of central helium burning.The boundary of the helium core is set as the mass at which themass fraction of hydrogen decreases below 0.01 and the massfraction of helium is larger than 0.1. We discuss the robustnessof this definition in Appendix B.
4.1. Composition at core collapse
In Fig. 2 we show the interior composition at core collapse ofselected single-star models (top row) and binary-stripped starmodels (bottom row). We select four pairs of models with sim-ilar reference core masses of Mref
He core ' 4.3, 5.4, 5.7, 6.3 M�.
4 Assuming no dynamical transient happen shortly before core-collapse (e.g., Shiode et al. 2012; Khazov et al. 2016; Fuller 2017;Fuller & Ro 2018)
We focus on the composition inside the helium core. The ra-dius of each diagram is proportional to the total helium coremass. The hydrogen-rich outer layers in the single star modelsare not shown for clarity. These diagrams naturally bring intofocus three distinct regions that contain a significant fraction ofthe total mass of the star, given below.
I: Helium-rich layer: This region is mainly composed of 4He.At the outer edge, the ashes of the CNO cycle can be ob-served with mass fractions of 0.99 for 4He, and up to 0.01for 14N. Moving inwards, 4He still makes up the largestmass fraction of the region, up to 0.75. The rest of the massis contained in the products of helium burning, namely 12C,16O, and 20Ne, in order of decreasing mass fraction. At theinner edge of this region, binary-stripped stars exhibit acomposition gradient that is not present in single stars dueto the shrinking of the convective core during helium burn-ing (see Section 5.1).
II: Oxygen-rich layer: This region is mainly composed of 16O,but also 20Ne, 24Mg, and 28Si with typical mass fractionsof about 0.6, 0.2, 0.06, and 0.02, respectively. The exactdistribution differs between single and binary-stripped starmodels with similar reference core masses. In the modelswith reference core masses of 4.3 M� (left-most column inFig. 2), isotopes such as 36Ar and 40Ca have been mixedoutwards into this region (due to shell mergers, see Section4.2).
III: Iron-rich region: This is the center-most region, mainlycomposed of iron-group isotopes (with atomic mass num-bers from 52 to 62). The composition diagrams show aclear, smooth, spiral pattern in the center (Fig. 2). This isbecause isotopes with higher mass numbers (for example58Fe) are more abundant in the inner-most layers, whilelight iron-group isotopes (for example 54Fe) are more abun-dant at the outer edge of the core. Note also the presence of4He (in blue) produced by late photodisintegration. At theedge of this region, a small fraction of 28Si and 28Si burn-ing products such as 32S, 36Ar, and 40Ca is present. It canbe identified as a narrow ring around the iron-rich regionin the composition diagrams. This ring is more extended inmass for binary-stripped star models than for single stars,indicating binary-stripped stars have higher mass fractionsof 28Si and its burning products at the edge of the iron-richcore than their single star counterparts.
Not all the material shown at the moment captured in Fig. 2 willbe ejected during the supernova. The majority of region III be-comes enclosed in the compact object that forms in the center.The layers above the iron-rich core are mixed and reprocessedby the supernova shock, creating new isotopes through super-nova nucleosynthesis.
In Table 1, we give detailed values of core masses and massesof the most important isotopes present at the onset of core col-lapse. Composition diagrams for the full set of models at themoment of core collapse are shown in Appendix C.
4.2. Shell mergers
About half of our models experience "shell merger" events,where a convective burning shell merges with the layers above.In our models, we find that the silicon-burning shell merges withthe oxygen-rich layers above in the final day before core col-lapse. This has been found in some three-dimensional explo-sion calculations (e.g., Couch & Ott 2013; Collins et al. 2018;Yoshida et al. 2020; Andrassy et al. 2020; Yadav et al. 2020;
Article number, page 6 of 29

E. Laplace et al.: Different to the core: the pre-supernova structures of massive single and binary-stripped stars
Fig. 2. Final composition profiles of selected single (top row) and binary-stripped (bottom row) star models at the onset of core collapse. Weshow four example models with similar reference core masses, indicated below each column. The diagrams are constructed in a similar fashionas Fig. 1, with each color representing an isotope and the surface area spanned by this color being proportional to the mass of this isotope in thestar. The radius of each diagram is proportional to the final helium core mass. The hydrogen-rich envelope of single stellar models is not shown.Three prominent regions are marked with roman numerals: I) a helium-rich layer, II) an oxygen-rich layer, and III) an inner iron-rich zone. Thelowest-mass example models (left-most column) both show enhanced mass fractions of heavy elements in the oxygen-rich region (II) due to shellmerger events. Binary-stripped star models contain an extended carbon/oxygen gradient at the edge of the oxygen-rich region (II) that is absent insingle star models.
Fields & Couch 2020; McNeill & Müller 2020, for a discussionof the uncertainties, see Section 6.5). The result is that a hightemperature layer containing silicon and its burning products ismixed into a lower-temperature region mainly composed of un-burned oxygen, neon, and magnesium isotopes. This producesalpha particles which, in turn, lead to enhanced alpha-capturereactions that result in high abundances of 28Si, 32S, 36Ar, and40Ca in the oxygen-rich layer (region II of Fig. 2), at the expenseof 16O, 20Ne, and 24Mg.
In Fig. 3, we show the ratio of the total mass of 24Mg and 28Siat the onset of core collapse as a function of the reference coremass. Models for which this ratio is lower than one (more 28Sithan 24Mg) have experienced shell mergers (see also AppendixF). We find that shell mergers occur mainly for the lowest andhighest mass models in our grid, although the robustness of thistrend is not clear. Most models with reference core masses lowerthan about 5 M� or higher than 6.8 M� experience shell mergers.
In Fig. 4, we show the distribution of 40Ca in the interiorof all models at the moment of core collapse as a function ofinitial mass. We show the profiles of single and binary-strippedstar models in the top and bottom panels, respectively. Modelswith shell mergers have a higher 40Ca abundance outside the sil-icon core. The presence of 40Ca in the oxygen-rich region canhave important observational consequences, which might allowfor observational tests of the physical nature of shell mergers(see the discussion in Section 6.2).
3 4 5 6 7 8Mref
Hecore[M�]
0.0
0.5
1.0
1.5
2.0
2.5
Tota
lmas
sof
24M
g/t
otal
mas
sof
28Si
No shell mergers
Shell mergers
SingleBinary-stripped
Fig. 3. Ratio of the total mass of 28Si and 24Mg at the onset of corecollapse as a function of the reference core mass for single (blue) andbinary-stripped (red) progenitors. Models with a ratio below one experi-ence shell mergers (gray region). In our models, the occurrence of shellmergers is related to the helium core mass after helium burning.
Article number, page 7 of 29

A&A proofs: manuscript no. manuscript_single_vs_binary
Tabl
e1.
Cor
em
asse
san
dto
talm
asse
sof
the
mos
tabu
ndan
tiso
tope
sat
the
onse
tof
core
-col
laps
efo
rst
ars
stri
pped
inbi
nari
esan
dsi
ngle
star
sw
ithth
esa
me
initi
alm
asse
s.T
hese
mod
els
are
for
sola
rmet
allic
ity(Z
=0.
014)
.
Min
itM
CC
MH
eco
reM
Oco
reM
Sico
reM
Feco
reM
1 HM
4 He
M12
CM
14N
M16
OM
20N
eM
24M
gM
28Si
M32
SM
36A
rM
40C
aM
Fe[M�]
[M�]
[M�]
[M�]
[M�]
[M�]
[M�]
[M�]
[M�]
[M�]
[M�]
[M�]
[M�]
[M�]
[M�]
[M�]
[M�]
[M�]
Bin
ary
stri
pped
star
s11
.03.
113.
111.
701.
431.
320.
0001
81.
130.
062
0.00
600.
200.
050.
050.
110.
050
0.00
80.
0074
0.54
12.1
3.52
3.52
2.09
1.49
1.33
0.00
046
1.21
0.09
50.
0045
0.27
0.11
0.07
0.10
0.06
00.
013
0.01
290.
6213
.03.
873.
872.
131.
421.
320.
0003
41.
250.
104
0.00
640.
490.
180.
100.
200.
103
0.01
90.
0137
0.46
14.0
4.23
4.23
2.57
1.38
1.27
0.00
020
1.28
0.12
80.
0064
0.49
0.33
0.08
0.26
0.20
10.
044
0.04
790.
4614
.64.
484.
481.
831.
471.
370.
0002
01.
290.
140
0.00
440.
730.
330.
160.
190.
103
0.02
10.
0191
0.55
15.0
4.61
4.61
2.44
1.47
1.36
0.00
026
1.28
0.16
70.
0033
0.72
0.47
0.09
0.20
0.13
70.
029
0.02
470.
5516
.04.
974.
973.
161.
471.
330.
0002
71.
280.
175
0.00
521.
040.
270.
190.
350.
154
0.02
60.
0222
0.55
17.0
5.31
5.31
2.73
1.71
1.47
0.00
063
1.29
0.19
30.
0063
1.34
0.36
0.27
0.23
0.05
10.
009
0.00
690.
6718
.05.
615.
612.
491.
651.
460.
0005
81.
250.
226
0.00
511.
560.
350.
320.
240.
059
0.01
40.
0134
0.70
20.0
6.28
6.28
4.45
1.80
1.52
0.00
064
1.16
0.34
50.
0032
1.68
0.82
0.26
0.17
0.08
00.
016
0.01
340.
8221
.06.
626.
624.
071.
821.
540.
0008
51.
070.
430
0.00
071.
980.
680.
340.
270.
125
0.02
70.
0230
0.72
Sing
lest
ars
11.0
9.32
3.78
2.31
1.44
1.32
3.79
2.95
0.11
30.
0211
0.42
0.11
0.09
0.25
0.12
70.
021
0.01
730.
4912
.19.
734.
332.
171.
311.
263.
683.
010.
121
0.01
850.
570.
120.
070.
370.
273
0.06
00.
0596
0.44
13.0
9.97
4.79
2.80
1.53
1.41
3.52
3.04
0.12
30.
0167
1.01
0.29
0.20
0.14
0.04
70.
011
0.01
140.
5814
.010
.12
5.28
2.81
1.67
1.47
3.27
3.03
0.13
70.
0145
1.23
0.42
0.23
0.14
0.03
70.
008
0.00
660.
7114
.610
.15
5.63
2.05
1.70
1.51
3.03
2.98
0.16
90.
0147
1.36
0.50
0.24
0.11
0.03
50.
008
0.00
710.
8015
.010
.16
5.82
3.31
1.69
1.44
2.90
2.96
0.15
80.
0140
1.61
0.37
0.29
0.20
0.04
60.
011
0.01
130.
6216
.010
.05
6.34
4.47
1.71
1.50
2.44
2.84
0.14
70.
0124
1.68
0.74
0.31
0.13
0.06
10.
016
0.01
620.
7517
.09.
886.
872.
961.
851.
581.
942.
720.
188
0.01
061.
820.
600.
220.
310.
234
0.08
10.
0607
0.77
18.0
10.1
37.
325.
131.
891.
621.
782.
710.
178
0.01
022.
100.
780.
330.
230.
154
0.04
20.
0492
0.81
19.0
10.5
87.
423.
281.
971.
651.
843.
040.
209
0.01
432.
040.
720.
140.
350.
262
0.08
60.
0480
0.83
20.0
11.6
67.
594.
311.
961.
632.
503.
260.
204
0.01
482.
060.
670.
230.
410.
308
0.08
90.
0617
0.84
21.0
10.4
08.
212.
731.
541.
401.
003.
000.
228
0.01
462.
310.
720.
070.
650.
547
0.14
20.
1503
0.58
Not
es.W
ede
fine
the
core
boun
dari
esas
the
mas
sco
ordi
nate
whe
reth
em
ass
frac
tion
ofth
ede
plet
edel
emen
t(fo
rex
ampl
e1 H
inth
eca
seof
the
heliu
mco
re)
decr
ease
sbe
low
0.01
and
the
mas
sfr
actio
nof
the
mos
tabu
ndan
tele
men
t(fo
rex
ampl
e4 H
e)in
crea
ses
abov
e0.
1.Fo
rth
em
ass
ofir
on(M
Fe)
we
have
adde
dth
em
ass
of52
Fe,53
Fe,54
Fe,55
Fe,
56Fe
,57Fe
,and
58Fe
.Oft
hese
isot
opes
,54Fe
,56Fe
,and
58Fe
dom
inat
ean
dco
ntri
bute
with
sim
ilara
mou
nts.
Article number, page 8 of 29

E. Laplace et al.: Different to the core: the pre-supernova structures of massive single and binary-stripped stars
Fig. 4. Distribution of 40Ca in the interior of all stellar models as a func-tion of their mass (top: single stellar models, bottom: binary-strippedstars). All models, represented as bars, are shown as a function of theirinitial mass. The length of each bar gives the mass of this model at theonset of core collapse. The binary-stripped star model with an initialmass of 19 M� is not shown because it did not reach core collapse dueto numerical issues.
4.3. Final total masses of isotopes for single andbinary-stripped stars
Differences in composition at the onset of core collapse are im-portant indicators for differences in chemical yields. In Fig. 5, weshow the total mass of selected isotopes at the end of the evolu-tion integrated throughout the star as a function of the referencecore mass. After the explosion, some of the isotopes will be re-processed by the supernova shock or become part of the compactobject that will form in the center, but the exterior layers (where,ρ . 106g cm−3) will leave the star relatively unaffected by theexplosion.
Final total mass of helium outside the iron-rich core: Theamount of 4He outside the iron-rich core is systematically lower
4 6 80.0
0.5
1.0
1.5
2.0
2.5
3.0
3.5
Tota
lmas
sof
4 He[
M�
]
SingleBinary-stripped
4 6 8Mref
Hecore[M�]
0.0
0.5
1.0
1.5
2.0
2.5
Tota
lmas
sof
16O
[M�
]
4 6 8 0.00
0.05
0.10
0.15
0.20
0.25
0.30
0.35
0.40
0.45
Tota
lmas
sof
12C
[M�
]
4 6 8Mref
Hecore[M�]
1.0
1.1
1.2
1.3
1.4
1.5
1.6
1.7
1.8
MFe
core
[M�
]
Fig. 5. Composition and core properties of single (blue circles) andbinary-stripped (red crosses) star models at the moment of core col-lapse as a function of the reference core mass. Open symbols indicatemodels that experienced a shell merger event. From top to bottom andleft to right: total masses of 4He, 12C, and 16O outside the iron core. Thefinal panel shows the iron core mass.
in binary stripped stars compared to single stars (on average,3 M� for single stars and compared to 1 M� for binary-strippedstar models). This is the combined effect of the quenched H-burning shell which does not produce as many ashes in thebinary-stripped models, and the stellar winds which tap directlyinto the helium-rich material for the binary-stripped stars withcore mass larger than 7 M�.
Final total mass of carbon outside the iron core: Binary-stripped star models in our grid tend to have higher masses of12C at the end of their life than the single star models (see topright panela of Fig. 5). Below reference core masses of 4.5 M�,binary-stripped stars and single stars contain similar masses of12C above the iron core. For higher masses, the total amount of12C in binary-stripped star models is significantly higher thantheir single star counterparts, and the difference increases formore massive models, where the binary models have more thantwice as much 12C. We discuss the origin of this difference, theretreat of the convective helium-burning core due to wind-massloss in binary-stripped stars, in Section 5.2.
Final total mass of oxygen outside the iron core: The final to-tal mass of 16O is similar for the single and binary-stripped starmodels (see bottom left panel of Fig. 5). This is because, eventhough the reactions involved in the creation and destruction of16O are fractionally different in single and binary-stripped stars,they compensate each other in a similar way. We discuss this fur-ther in Section 5.2. The total mass of 16O increases linearly with
Article number, page 9 of 29
A&A proofs: manuscript no. manuscript_single_vs_binary
the reference core mass and does not depend on the occurrenceof shell mergers.
Final iron core mass: Overall, the iron core mass is similarfor all models, with masses from 1.25 to 1.65 M�. Here, "iron"includes all species for which the mass number is higher than 46,and the core boundary is computed with respect to 28Si. The ironcore mass increases slightly with an increasing reference coremass, except for the most massive single star model. Binary-stripped and single stellar models have similar iron core massesthat range from 1.3 and 1.63 M�.
4.4. Density profiles
We find systematic differences in the final density and meanmolecular weight profiles of single and binary-stripped star mod-els with similar reference core masses. These differences are ofparticular importance because even small differences in the den-sity profile have been shown to have a large impact on the ex-plodability of stars (e.g., Vartanyan et al. 2019). In Fig 6, weshow the density and mean molecular weight profiles at the on-set of core collapse as a function of the mass coordinate for thesame example models as in Fig. 2.
Overall, the density profiles span similar values for singleand binary-stripped star models with the same reference coremass, with central densities of about 1010 g cm−3, dropping byalmost 20 orders of magnitude throughout the star. However,binary-stripped stars have steeper density profiles at the inneredge of the helium-rich region (at the boundary of regions 0and I) compared to single star models due to the absence ofa hydrogen-rich layer in the binary-stripped stars. In addition,we find that binary-stripped star models have a systematicallyhigher density in the helium-rich region (I) compared to the sin-gle star models. At the same mass coordinates, we also findlarge differences in the mean molecular weight profiles: binary-stripped star models display a shallow drop of the mean molec-ular weight, whereas single star models contain sharp drops inthe mean molecular weight profile. The difference in the meanmolecular weight profiles can be attributed to the presence ofa carbon/oxygen gradient at the edge of the oxygen-rich region(see Section 5.1).
In the oxygen-dominated layers (II), no such trends can befound. Instead, we find that single and binary-stripped star mod-els have large differences in density. At the inner edge of thisregion, the mean molecular weight reaches a small peak that islinked to the presence of a small silicon-rich layer at this location(see also Fig. 2). In the inner-most iron-rich region (III), the den-sity profiles show similar trends. At the surface of the single-starmodels, the mean molecular weight increases due to recombina-tion of elements. We have verified that the exact definition of theonset of core-collapse does not affect the observed differencesfound between the density profiles of single and binary-strippedstar models (see appendix E).
4.5. Properties of the helium core
We present final properties of the helium core in Fig. 7. For thesame reference core masses, the radius of the helium core is sys-tematically larger for the binary-stripped star models (1.3 to 11.6R�) compared to the single star models (0.6 to 1.2 R�). This trendin radius remains for different definitions of the helium coremass (see Appendix B). For both the single and binary-strippedstar models, the helium core radii decrease with increasing ref-
erence core mass. For binary-stripped stars, this trend in radiusat solar metallicity is well known (Yoon et al. 2010, 2017).
The final mass of the helium core increases linearly with thereference core mass, i.e. the mass of the helium core at the endof core helium burning, for both the single and binary-strippedstar models. A small offset can be observed between the highest-mass binary-stripped star models and the single star models.These are due to the effect of wind mass loss for the binary-stripped stars and to the growth of the helium core after corehelium depletion for the single stars (see also Section 3.2 andthe evolution of the helium core mass shown in appendix B.1).
5. Origins of differences between single andbinary-stripped star progenitors
In the previous sections, we showed that binary-stripped starmodels develop systematically smaller helium core masses thansingle stars with the same initial mass. Since interior propertiesof stars strongly depend on the core mass, internal differencesbetween these models are expected. What can appear surprising,however, is that the final core properties of single and binary-stripped stars are also different when comparing models withsimilar helium core masses. The origin of these differences ismainly linked to the rate and timing of mass loss, which cannoteasily be modeled starting from a naked helium core. We explorethese origins mainly with two models, an initially 16 M� singlestar and a star with an initial mass of 20 M� that is stripped in abinary system before core helium depletion. Both develop a ref-erence core mass of 6.3 M� at the end of core helium burning,and as such, are well suited for a comparison.
5.1. The chemical gradient around the helium-depleted core
Helium burning proceeds differently in the cores of binary-stripped stars and those of single stars, even in cores of simi-lar mass (cf. Woosley et al. 1995). Helium is mainly destroyedthrough two channels: (1) the triple-alpha process (2) alpha cap-tures onto carbon that create oxygen. The reaction rates of bothreactions have a different dependence on the density ρ and on theabundance of 4He nuclei, XHe. For the triple alpha process, thereaction rate r3α scales with the density cubed
r3α ∝ X3Heρ
3, (2)
while the rate of alpha captures onto carbon, rCα, is proportionalto the density squared
rCα ∝ XCXHeρ2, (3)
where XC is the abundance of 12C (e.g., Burbidge et al. 1957).As we show in Fig. 8, convective helium-burning cores growin mass during core helium burning for single stars due to hy-drogen shell burning (see Section 3.2), while they decrease inmass for binary-stripped stars due to wind mass loss (Langer1989b, 1991; Woosley et al. 1993). For single stars, the growthof the convective helium-burning core brings an additional sup-ply of helium that favors the destruction of carbon through alphacaptures (see Eq. 3). As a result, the mass fraction of oxygenis higher in the cores of single stars compared to the cores ofbinary-stripped stars, at the expense of carbon, even for the samereference core mass. The exact fraction of carbon and oxygenis subject to the still uncertain rate of the alpha-capture reac-tion onto carbon (Weaver & Woosley 1993; Brown et al. 1996;Farmer et al. 2020).
Article number, page 10 of 29

E. Laplace et al.: Different to the core: the pre-supernova structures of massive single and binary-stripped stars
0 5 10m [M⊙]
−10.0
−7.5
−5.0
−2.5
0.0
2.5
5.0
7.5
10.0
log 1
0(ρ/
[gcm
−3 ])
III II I 0
MrefHecore =4.3M⊙
SingleBinary-stripped
µ , singleµ , binary-stripped
0 5 10m [M⊙]
III II I 0
MrefHecore =5.4M⊙
0 5 10m [M⊙]
III II I 0
MrefHecore =5.7M⊙
0 5 10m [M⊙]
III II I 0
MrefHecore =6.3M⊙
0.75
1.00
1.25
1.50
1.75
2.00
2.25
2.50
µ
Fig. 6. Density profiles at the moment of core collapse for single (blue) and binary-stripped star models (red) with similar reference core masses.The mean molecular weight profiles are indicated with dashed lines. From left to right, shaded regions give the approximate locations of theiron-rich, oxygen-rich, helium-rich, and hydrogen-rich regions, labeled with Roman numerals as in Fig. 2. The left-most models, with a referencecore mass of 4.3 M�, both experience shell mergers during their evolution. The density of the binary-stripped star models in the helium-rich region(I) is systematically higher than that of the single star models with a similar reference core mass.
4 6 8Mref
Hecore[M�]
3
4
5
6
7
8
Mf H
ecor
e[M�
]
4 6 8Mref
Hecore[M�]
100
101
Rf H
ecor
e[R�
]
SingleBinary-stripped
Fig. 7. Final helium core mass and radius of single star models (bluecircles) and models of stars stripped in binaries (red crosses) at the onsetof core collapse as a function of the reference core mass.
This is illustrated in Fig. 9, where we show a subset of com-position diagrams at the moment of core helium depletion (whenthe central mass fraction of helium decreases below 10−4) forsingle and binary-stripped star models in our grid. We highlightthe differences in the central mass fractions of carbon and oxy-gen, which are indicated on each composition diagram. Modelswith the same initial mass are shown in each column. We in-dicate two sets of single and binary-stripped models, S 1,2 andB1,2, respectively, that reach similar reference core masses atthe end of core helium burning (marked with the same back-ground color). For both sets, the central carbon mass fractions
−4−20246log10(τCC − τ)/yr
0.0
2.5
5.0
7.5
Mco
nv.c
ore/
M⊙
H burning
He burning
C burning
Ne burningO burning
Si burning
Single Mi = 16M⊙Binary-stripped Mi = 20M⊙
Fig. 8. Evolution of the convective core mass of a single and binary-stripped star model with the same reference core mass of 6.3 M�. Duringcore helium burning, the convective core grows in the single star model,while it decreases in the binary-stripped star model due to the effect ofwind mass loss.
are smaller in the single star models (0.31 and 0.28, for S 1 andS 2, respectively) compared to the binary-stripped star models(0.35 and 0.31, for B1 and B2, respectively) for the same refer-ence core mass. The opposite occurs for the oxygen mass frac-tions (0.67 and 0.7 for the single star models compared to 0.63and 0.68 for the binary-stripped star models with a similar ref-erence core mass). This confirms the finding of systematic dif-ferences in the chemical structure of single and binary-strippedstars from independent groups (see also Section 6.3).
The composition diagrams in Fig. 9 emphasize the trend incentral carbon and oxygen mass fractions with increasing ini-tial mass. For both the single (top row) and binary-stripped starmodels (bottom row), the central carbon mass fraction decreaseswith increasing initial mass (from 0.31 to 0.24 for the single starmodels, and from 0.37 to 0.30 in the models of stars stripped in
Article number, page 11 of 29

A&A proofs: manuscript no. manuscript_single_vs_binary
Fig. 9. Composition structure at core helium depletion for a subset of the single (top) and binary-stripped star (bottom) grids. Below each set, weindicate the initial masses of these models. Single (S 1 and S 2) and binary-stripped star (B1 and B2) models with similar reference core masses arehighlighted with the same gray background color. Dashed yellow circles indicate the edge of the helium-depleted core. Outside the helium-depletedcore, binary-stripped star models contain a layer that consists of a gradient of 12C, 16O, and 20Ne, whose extend increases with an increasing heliumcore mass. This layer is not present in single star models.
binaries, for the same initial masses of 12 to 21 M�) at the ex-pense of the central oxygen fraction (from 0.67 to 0.74 for thesingle star models, and from 0.61 to 0.68 in the binary-strippedstar models).
The mass dependence of the central mass fractions can benaturally understood as a consequence of the two main nuclearreactions involved in the burning of helium having rates with dif-ferent density dependencies (see Eq. 2 and 3). Stars with higherreference core masses have lower core densities, and this favorsalpha-captures onto carbon. Thus, carbon is destroyed more ef-ficiently in the cores of more massive stars during core heliumburning (cf. Woosley et al. 1995; Brown et al. 2001).
Fig. 9 also shows the presence of a composition gradient ofcarbon and oxygen around the helium-depleted core. The com-position gradient is left behind by the convective helium-burningcore, which recedes in the binary-stripped star models due to theeffect of wind mass loss. This is the red region just outside thehelium-depleted core (indicated with a yellow dashed circle inthe composition diagrams of Fig. 9). The carbon/oxygen gradi-ent around the helium-depleted core is not visible in the coresof single stars because the helium-burning core grows in massinstead of receding, leading to a steep composition gradient atthe edge. The composition gradient of binary-stripped stars be-comes more pronounced and more extended in mass as the totalmass of the model increases. This can be seen by the growthof the red and purple rings (highlighting 12C and 16O, respec-tively) just outside the helium-depleted core in Fig. 9. Highermass binary-stripped star models experience stronger wind massloss, which leads to a faster and more pronounced retreat of theconvective helium-burning core and to the observed effect on thecarbon/oxygen gradient (see also Appendix D). The chemicalgradient at the edge of the helium core brings a different chem-ical environment at the location helium-burning shell in binary-stripped stars, ultimately leading to different total masses of car-bon compared to single stars (see also Section 5.2).
The differences in chemical structure also have conse-quences for the interior density structure. In Fig. 10, we com-
0 2 4 6 8 10
−8
−6
−4
−2
0
2
4
log 1
0(ρ/
[gcm
−3 ])
II I 0
SingleBinary-stripped
0.6
0.8
1.0
1.2
1.4
1.6
1.8
2.0
µ
0 2 4 6 8 10m [M⊙]
0
1
2
Rat
ioof
dens
ity(ρ
s/ρ b
)
Single/Binary-stripped
Fig. 10. (top) Density and mean molecular weight profile of a singleand a binary-stripped star model with the same reference core mass of6.3 M� at the moment of core helium depletion (D). Gray backgroundcolors indicate approximate location of the oxygen-rich (II), helium-rich (I), and hydrogen-rich (0) regions. (bottom) Ratio of the density ofthe single and binary-stripped star models as a function of mass.
Article number, page 12 of 29

E. Laplace et al.: Different to the core: the pre-supernova structures of massive single and binary-stripped stars
pare the density structure and mean molecular weight at core he-lium depletion of two models with the same reference core mass.To highlight the differences, we show the interpolated ratio ofthe density in binary-stripped and single star models in the bot-tom panels. Approximate locations of the oxygen-rich, helium-rich, and hydrogen-rich regions are indicated with colors as inFig. 6. The density of the innermost, oxygen-rich core (II, up tom = 4.5 M�) is the same for the single and binary-stripped starmodel. At the boundary between the oxygen-rich and helium-rich layers (shaded regions II and I in Fig. 10, respectively), thedensity drops in both models, though this decrease is slower forthe binary-stripped star model. At the same mass coordinate, weobserve a sharp drop in mean molecular weight for the singlestar model, while the binary-stripped star model shows a moreshallow profile. This difference is due to the extended carbon-oxygen gradient at the edge of the helium-depleted core in thebinary-stripped star model. Because the gradient contains some22Ne, the value of the mean molecular weight is different fromthe value of 1.33 expected for a layer entirely composed of 4He,12C, 16O, or 20Ne.
At the outer edge of the CO-enhanced region (m ≈ 5 M�in Fig. 10), both models reach the same values for the densityand mean molecular weight, 1.34. However, at the outer edgeof the helium-rich layer, differences are visible. The single starmodel has a higher density than the binary-stripped star model,as can be observed in the lower panel. This is because the singlestar contains a hydrogen-burning shell at the outer edge of thehelium-rich region and a hydrogen-rich envelope. In contrast,the binary-stripped star model has lost its hydrogen envelope atthis point, and the outer edge of the helium-rich layer (shadedregion I in Fig. 10) corresponds to the surface of the star.
5.2. Origin of distinct final total isotope masses: theimportance of the composition gradient
In Section 4.3, we showed that binary-stripped star models endtheir lives with higher total masses of 12C compared to single starmodels (see Fig. 5), while the total masses of 16O remain similar.Here we discuss how these differences in composition arise. InFig. 11, we present the evolution of the total mass of 12C, 16O,and 20Ne as a function of time until core oxygen depletion for theexample binary-stripped and single star models with a referencecore mass of 6.3 M� (with initial masses of 20 M� and 16 M�, re-spectively). During the helium-shell burning phase (first half ofD-E), the total mass of carbon decreases slightly in the binary-stripped star, while it increases in the single star model. In con-trast, the total mass of oxygen increases in the binary-strippedstar model, while it remains unchanged in the single star model.The shaded bands highlight the mass of each isotope outside thehelium-depleted core (label D in Fig. 11). Meanwhile, the totalmasses of carbon and oxygen inside the helium-depleted coreremain constant. The binary-stripped star model retains a moremassive layer of 12C (0.2 M�) and 16O (0.25 M�) outside the he-lium depleted core than the single star model (about 0.07 M� and0.02 M� for 12C and 16O, respectively) throughout the evolution.This is because of differences in the relative rates of helium-burning channels: alpha captures onto carbon dominate in thebinary-stripped model. In contrast, the single star model burnshelium primarily through the triple-alpha process. This is be-cause of the differences in composition at the location of thehelium-burning shell in the single stars compared to the binary-stripped stars.
At the end of core oxygen burning (label F in Fig. 11), theinterior 12C mass of both models (triangles) is similar. However,
Fig. 11. Evolution of the total mass of 12C (top), 16O (middle), 20Ne(bottom) for a single (blue) and a binary-stripped star model (red) withthe same reference core mass of 6.3 M�. The evolution is shown fromthe moment of core helium depletion as a function of the time until coreoxygen depletion. The curve marked by inverted triangles (i.e. the lowerboundary of the colored bands in each plot) mark the total mass of eachisotope inside the helium-depleted core. The upper boundary markedby circles shows the total mass of this isotope in the star. The red andblue shaded regions thus highlights the mass of this isotope in the shellabove the core.
the total 12C mass, shown with circles, is higher for the binary-stripped star model due to the mass of 12C outside the helium-depleted core. The interior 16O mass is lower for the binary-stripped star model than for the single star model since heliumburning through the triple-alpha process is favored over alpha-captures onto 12C (see Section 5.1). Despite the differences, thetotal mass of 16O is similar in the single and binary-stripped starmodels. Although 16O is created during helium shell burningand more actively during neon burning in the binary-strippedstar model compared to the single star model, oxygen is alsodestroyed more rapidly during carbon core and shell burning.These effects compensate each other and create a similar finaltotal mass of 16O for the single and binary-stripped star model.
5.3. Differences in shell burning
In Section 4.4 we found a systematic difference between thedensity profiles of single and binary-stripped stars with samereference core mass. Specifically, the He-rich layer of binary-
Article number, page 13 of 29
A&A proofs: manuscript no. manuscript_single_vs_binary
stripped stars is systematically denser than that of single star.This impacts the subsequent shell burning phases and thus thepre-collapse structure.
In Fig. 12, we show the evolution of density profiles at no-table moments of the evolution (marked with the same labelsas in Fig. 1) for our example pair composed of a single and abinary-stripped star model that both reach a similar referencecore mass of 6.3 M� at the end of core helium burning. We showthe profiles from the onset of core hydrogen burning (A) to corecollapse (G). We focus on the inner 7 M� of the stellar structures.The evolution of the density profile is similar for both models un-til core helium depletion (label D). As the star evolves, the den-sity of the inner core (up to 5 M�) increases monotonically. Atcore helium depletion (point D), the density profile of the binary-stripped star shows a sharp drop at 6.3 M�, corresponding to thesurface of the star.
The change in density between the single and binary-strippedstar in the helium-rich layer (5 M� . m . 6 M�) happens be-tween core helium depletion and the end of core carbon burning(D-E). While the density of this layer increases for the binary-stripped star model, it decreases for the single star model. Thisphase of the evolution is marked by the ignition of the heliumshell and the start of core carbon burning.
We show the nuclear burning profiles for the specific pointsof the evolution in Fig. 13. We represent the single and binary-stripped stellar model pair as half circles (left: single star models,right: binary-stripped star models), where the size of the circle isdirectly proportional to the mass coordinate. The nuclear energygeneration rate throughout the stellar structures is shown withcolors.
At the moment of core helium depletion (panel D in Fig.13), we find various differences in the burning structure of theexample single and binary-stripped star model. The single starmodel contains a hydrogen-burning shell which is absent in thebinary-stripped star. In addition, it has a helium-burning shell(m = 4.5 M� in Fig. 13). In contrast, at the same mass coordi-nate, the binary-stripped star model has a specific energy gener-ation rate that is two orders of magnitude smaller.
Between core helium depletion and core carbon depletion(points D and E in Fig. 13), a large change occurs in the burn-ing structures. In the single star, the specific energy generationrate in the hydrogen-burning shell decreases significantly, whileit increases in the helium-burning shell. This decline of the out-put from the hydrogen-burning shell is linked to the change indensity in the helium-rich region.
We also note large differences between the helium shell burn-ing of single and binary-stripped star model from this pointon until the end of the evolution (points E to G in Fig. 13).In the binary-stripped star model, the helium shell-burning re-gion is more extended (4.2 M� < m < 5.5 M�). The sin-gle star model has a higher maximum energy generation rate(up to εnuc = 108erg g−1s−1, compared to 107erg g−1s−1 for thebinary-stripped star model). However, for the binary-strippedstar model, a high specific energy generation rate is found in theentire helium-burning region, while for the single star model, itdrops quickly outside of the region with the maximum value.These differences can be understood by the differences in com-position at the location of the helium burning shell at the end ofcore helium burning. Because of the extended chemical gradi-ent at the edge of the helium-depleted core, the binary-strippedstar model contains a significantly higher mass fraction of car-bon next to the helium-burning shell, while the single star modelcontains very little carbon near the burning shell at the beginningof helium shell burning. This means, just as in the case of cen-
tral helium burning (see Section 5.1), that there are differences inthe relative contributions of nuclear reactions involved in heliumshell burning. For helium shell burning, the situation is reversedfrom core helium burning: more alpha captures onto carbon oc-cur in the binary-stripped star model than in the single star model(see also the change in total carbon mass and total oxygen massbetween point D and E in Fig 11).
After the end of core carbon burning (panel F in Fig. 13), ad-ditional changes arise in the density and nuclear burning struc-ture. The stars ignite carbon in a shell around the core. However,the location of this shell is significantly different between the sin-gle and binary-stripped star models. In the single star model, thecarbon shell ignites at m ≈ 1.7 M�, while in the binary-strippedstar, it ignites further out, at m ≈ 2.1 M�. This can be explainedby the differences in carbon mass fractions at the end of core he-lium burning (Chieffi & Limongi 2020). The binary-stripped starhas a higher core carbon abundance and the carbon shell ignitesfurther out from the center than in the single star model withthe same reference core mass. However, the extent (in mass) ofconvective core oxygen burning is similar (up to m ≈ 1.2 M�).We also give the location of the mass boundary expected for thecompact object created during the explosion. We set this bound-ary at the mass coordinate where the specific entropy drops be-low a value of 4 erg g−1 K−1 (Ertl et al. 2016). For the same ref-erence helium core mass, the binary-stripped star model createsa compact object that is more massive than for the single starmodel (1.90 M� compared to 1.83 M�).
5.4. Compactness evolution
The compactness parameter is often used to characterize the corestructure of stars. It has been shown to correlate with the explod-ability with one-dimensional parametric SN explosion models(O’Connor & Ott 2011; Ugliano et al. 2012), although studies ofthree-dimensional explosion of stars have questioned this (e.g.,Ott et al. 2018; Kuroda et al. 2018). Nevertheless, it can be usedto predict the type of compact object resulting from a supernovaexplosion (typically, neutron stars for low values of the compact-ness and black holes for higher values). Other measures of ex-plodability have been proposed from 1D parametric simulations(for a recent example, see Ertl et al. 2020) or multi-dimensionalsimulations.
We show the evolution of the compactness parameter for thefull grid of models in Fig. 14 at three moments of the evolution:D core helium depletion, F core oxygen depletion, and G the on-set of core collapse. In addition, we give general properties ofthe models at the moment of core collapse in Table 2. We eval-uate the compactness at mass coordinates 2 and 3 M�, shown asa blue (red) band in Fig. 14 for the single star (binary-stripped)models. We find that trends in compactness are robust againstvariations of the mass coordinate at which the compactness pa-rameter is evaluated for all moments of the evolution presentedhere (Ugliano et al. 2012). In the left panels, we show the com-pactness as function of initial mass, and in the right panels, as afunction of the reference core mass.
At core helium depletion, the compactness parameter is sim-ilar for models of all initial masses, with a value of about 0.03.Only the three lowest mass model show differences between sin-gle and binary-stripped models. At that epoch, binary-strippedstar models with initial masses smaller than 13.5 M� have aslightly smaller compactness than their single star counterparts.This is because the mass coordinate at which the compactness isevaluated lies outside of the oxygen core in these models, whichmeans the compactness parameter captures the relative expan-
Article number, page 14 of 29

E. Laplace et al.: Different to the core: the pre-supernova structures of massive single and binary-stripped stars
0 2 4 6m [M⊙]
0
2
4
6
8
10
log 1
0(ρ/
[gcm
−3 ])
A
BCD
EF
GSingle
A – core hydrogen ignitionB – begin of mass transferC – halfway throughcore helium burningD – core helium depletionE – core carbon depletionF – core oxygen depletionG – onset of core collapse
0 2 4 6m [M⊙]
0
2
4
6
8
10
log 1
0(ρ/
[gcm
−3 ])
A
BCD
EF
GBinary-stripped
A – core hydrogen ignitionB – begin of mass transferC – halfway throughcore helium burningD – core helium depletionE – core carbon depletionF – core oxygen depletionG – onset of core collapse
Fig. 12. Density profile evolution of a single (left) and stripped (right) star model with the same reference core mass of 6.3 M� from ZAMS tocore-collapse. Dashed lines show the corresponding profiles at the onset of core-collapse.
sion of the helium-rich envelope compared to the single stars(see also Table 1).
By the time of core oxygen depletion (panels marked F inFig. 14), the value of the compactness parameter changes sig-nificantly between all models (Renzo et al. 2017). Higher massmodels have higher compactness. Binary-stripped star modelshave systematically lower values of the compactness (0.01 to0.18) than single star models of the same initial mass (0.05 to0.21). However, when comparing models with the same refer-ence core mass (defined as the helium core mass at core heliumdepletion) the compactness is similar between single and binary-stripped star models, except for the two most massive binary-stripped star models. The difference for the highest mass modelscould be due to the transition to radiative core carbon burningaround this mass range for binary-stripped stars that changesthe compactness of the core (Brown et al. 1996, 1999, 2001;Sukhbold & Woosley 2014; Woosley 2019; Schneider et al.2020).
At the onset of core collapse (panel G in Fig. 14), the dif-ferences between the compactness of single and binary-strippedstar models of the same initial mass increases even further. Thecompactness of binary-stripped star models remains systemati-cally smaller than that of single star models. For the same ref-erence core mass, we find similar values between single andbinary-stripped star models. Changes in the compactness arequalitatively similar to those from similar recent studies (e.g.,Woosley 2019; Chieffi & Limongi 2020; Patton & Sukhbold2020; Schneider et al. 2020). We do not find clear differencesin compactness for models that experience shell mergers beforecore collapse (marked with open symbols in the lower panels of
Fig. 14). This is because shell mergers typically occur at masscoordinates of m ' 1.3 M�, below the mass range we chose toevaluate the compactness and the merged convective shells donot extend beyond the mass cuts chosen for the compactness.
When comparing the electron fraction Ye (see Table 2), wealso find different values for single and binary-stripped star mod-els. Different values of the electron fraction imply that the latenuclear burning conditions in the cores of single and binary-stripped stars are different.
6. Discussion
6.1. Implications for explodability
For the same initial mass, binary-stripped star models have asmaller reference core mass, a smaller compactness, and a dif-ferent distribution of isotopes compared to single stars. Both thesmaller mass and compactness suggest that binary-stripped starswill explode more easily than if they had not interacted with acompanion (though explodability might be better described withmore sophisticated means, e.g., Ertl et al. 2016, 2020). Multi-dimensional calculations indicate that the explosion depends ondetails of the stellar structure, especially the density profile (e.g.,Vartanyan et al. 2018). Müller et al. (2019) did not find signifi-cant differences between the explosions of low-mass single andbinary-stripped stars (based on naked helium core models fromTauris et al. 2015) of the same core mass. However, even forthe same reference core mass, we find systematic differencesin the density structure of single and binary-stripped stars wecomputed. In the helium-rich region binary-stripped stars have
Article number, page 15 of 29

A&A proofs: manuscript no. manuscript_single_vs_binary
Fig. 13. Comparison of the nuclear burning structures of a single (left) and binary-stripped (right) star model with the same reference core massof 6.3 M�. Each stellar model is represented as a multitude of 2D - half circles, where the radius of each circle is directly proportional to themass coordinate. The nuclear energy generation rate is indicated with colors. In panel G (onset of core collapse), we give the location of themass boundary above the compact object that forms in the center with a dashed blue (single) and red (binary-stripped) line, respectively. Thebinary-stripped star model forms a more massive compact object in its core than the single star model (1.90 M� compared to 1.83 M�). All modelsare compared for the same evolutionary steps (D: core helium depletion, E: core carbon depletion, F: core oxygen depletion, G: onset of corecollapse).
higher densities than single stars, and at the edge of the helium-rich region the density drops more sharply in the binary-strippedstar models. In addition, we find distinct electron fractions inthe cores of single and binary-stripped stars, which imply differ-ences in the late nuclear burning conditions. These differences instructure can affect the accretion rates during core collapse andthe explosion dynamics. This could have a significant impact forpopulation synthesis models of compact objects. We explore de-tailed explosion models and implications for the supernova ex-plodability of single and binary-stripped stars in a companionpaper (Vartanyan et al. in prep.).
6.2. Implications for nucleosynthesis and nebular lines
Our models reveal that the composition structures of stellar coresat the moment of core collapse is complex. We identified threemain regions, the helium-rich, oxygen-rich, and iron-rich layers.
The distribution of isotopes in the cores of binary-strippedstars is different from the homogeneous distribution often as-sumed for the evolution of naked carbon-oxygen cores, (e.g.,Patton & Sukhbold 2020). For instance, stars stripped in binariescontain an extended gradient of carbon, oxygen, and neon abovethe helium-depleted core that is not present in single stellar struc-tures. This extended composition gradient leads to changes in thefinal density, mean molecular weight, and composition profiles.This difference is first induced by changes during the central he-lium burning phase and is further accentuated in the subsequentnuclear burning stages.
Article number, page 16 of 29

E. Laplace et al.: Different to the core: the pre-supernova structures of massive single and binary-stripped stars
Fig. 14. Evolution of the compactness parameter for the full grid of single (blue) and binary binary-stripped (red) models as a function of initialmass (left) and reference core mass (right). From top to bottom, we show the compactness at the moment of core helium depletion (D, top), coreoxygen depletion (F, middle), and the onset of core collapse (G, bottom). For the models at the onset of core collapse, open symbols indicatemodel that have experienced shell mergers. For every phase of the evolution, we indicate the range of changes in the compactness parameter withblue and red shaded regions. The upper bound of this region corresponds to the compactness evaluated at m = 2 M� and the lower bound to thecompactness evaluated at m = 3 M�. Trends in the compactness parameter as a function of mass are consistent between different definitions of thecompactness for the range considered. The reference core mass is defined as the mass of the helium core at the moment of core helium depletion.
These differences imply that the supernova nucleosynthesisexpected from single and binary-stripped stars might be system-atically different. In particular, we expect 12C and 16O yields toremain different after the supernova explosion. This is becauseduring supernova nucleosynthesis, part of the remaining carbonwill be synthesized into oxygen. Large consequences can be ex-pected by this difference in yields because it would affect nebu-lar oxygen lines, that are currently widely used to infer the pro-genitor masses of core-collapse supernova explosions. In addi-tion, a systematic difference in the nucleosynthesis from binary-stripped and single stars would have implications for the inter-pretation of galaxy chemical evolution models.
6.3. Comparison with models in the literature
Our models show a consistent trend of systematically higher cen-tral carbon mass fraction for binary-stripped star models com-pared to single star models, as do other models in the literature.We show the central carbon mass fraction as a function of themass of the carbon/oxygen core evaluated at the moment of corehelium depletion in Fig. 15 and compare our models to singlestar models from Sukhbold et al. (2018) and pure helium starmodels from Woosley (2019) (as shown in Fig. 6 of Patton &Sukhbold 2020). These models were computed with the KE-PLER stellar evolution code with similar physical assumptionsto each other. We also compare our models to single star and
case B mass transfer binary models from Schneider et al. (2020),computed with MESA. The physical assumptions are similar.
There is a good agreement between our models and the val-ues reported in Schneider et al. (2020) for both the single andbinary-stripped star models. Especially for the binary-strippedstar models, we barely find any differences in central mass frac-tion, except at the lowest mass end. This agreement originatesfrom the similar physical assumptions regarding the choice ofwind mass loss, overshooting, and of the 12C(α, γ)16O rate. Weexpect that the small differences at the lowest mass end arelinked to the treatment of mass transfer. Schneider et al. (2020)parameterize mass loss on a thermal timescale until an arbitrarysurface composition is reached, while in our models the binarymass-transfer phase is computed self-consistently. Our singlestar models have systematically higher core carbon abundancesthan the models from Schneider et al. (2020). These differencescan be attributed to different choices for the wind mass-loss rate.Much larger differences are found between our work and modelscomputed with the KEPLER code. These models have core car-bon abundances that are a factor 1.7 lower than in our models.These differences probably stem from different physical assump-tions, such as the choice for overshooting, but also from the valueused for the uncertain carbon alpha-capture reaction rate. Themodels shown in (Patton & Sukhbold 2020) have a 12C(α, γ)16Orate that is a factor 1.2 higher than what we assume.
Article number, page 17 of 29
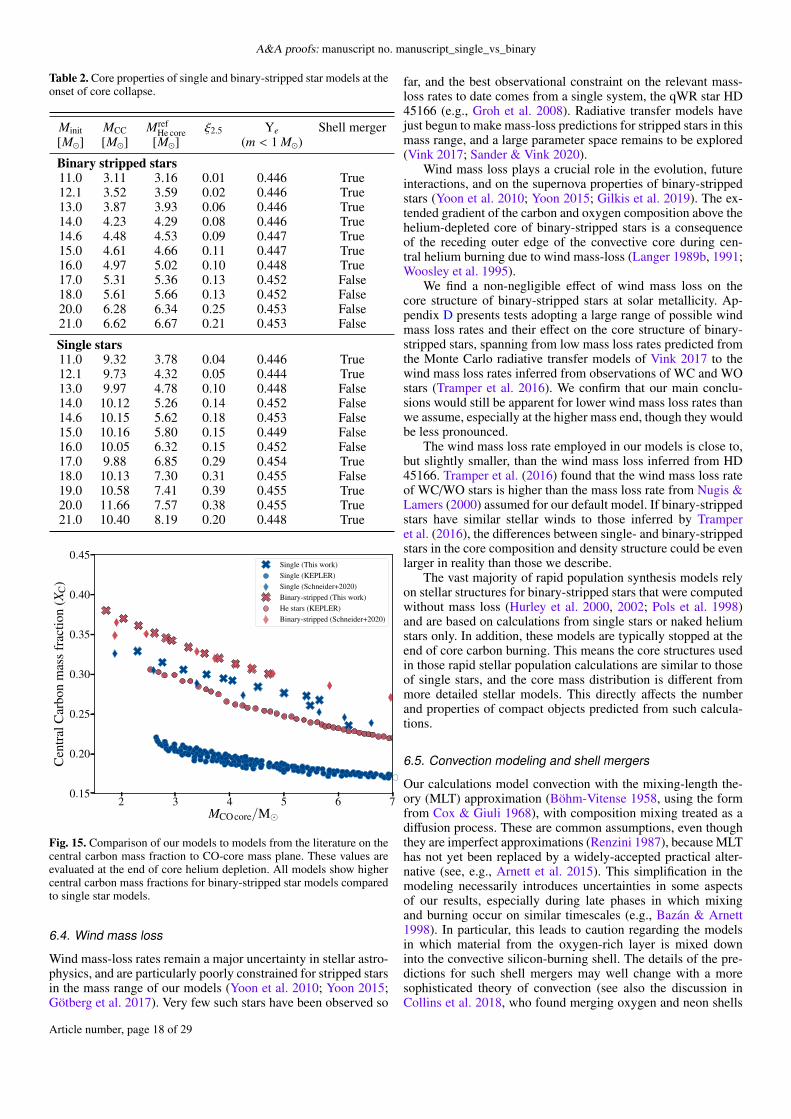
A&A proofs: manuscript no. manuscript_single_vs_binary
Table 2. Core properties of single and binary-stripped star models at theonset of core collapse.
Minit MCC MrefHe core ξ2.5 Ye Shell merger
[M�] [M�] [M�] (m < 1 M�)
Binary stripped stars11.0 3.11 3.16 0.01 0.446 True12.1 3.52 3.59 0.02 0.446 True13.0 3.87 3.93 0.06 0.446 True14.0 4.23 4.29 0.08 0.446 True14.6 4.48 4.53 0.09 0.447 True15.0 4.61 4.66 0.11 0.447 True16.0 4.97 5.02 0.10 0.448 True17.0 5.31 5.36 0.13 0.452 False18.0 5.61 5.66 0.13 0.452 False20.0 6.28 6.34 0.25 0.453 False21.0 6.62 6.67 0.21 0.453 False
Single stars11.0 9.32 3.78 0.04 0.446 True12.1 9.73 4.32 0.05 0.444 True13.0 9.97 4.78 0.10 0.448 False14.0 10.12 5.26 0.14 0.452 False14.6 10.15 5.62 0.18 0.453 False15.0 10.16 5.80 0.15 0.449 False16.0 10.05 6.32 0.15 0.452 False17.0 9.88 6.85 0.29 0.454 True18.0 10.13 7.30 0.31 0.455 False19.0 10.58 7.41 0.39 0.455 True20.0 11.66 7.57 0.38 0.455 True21.0 10.40 8.19 0.20 0.448 True
2 3 4 5 6 7MCOcore/M�
0.15
0.20
0.25
0.30
0.35
0.40
0.45
Cen
tral
Car
bon
mas
sfr
actio
n(X
C)
Single (This work)Single (KEPLER)Single (Schneider+2020)Binary-stripped (This work)He stars (KEPLER)Binary-stripped (Schneider+2020)
Fig. 15. Comparison of our models to models from the literature on thecentral carbon mass fraction to CO-core mass plane. These values areevaluated at the end of core helium depletion. All models show highercentral carbon mass fractions for binary-stripped star models comparedto single star models.
6.4. Wind mass loss
Wind mass-loss rates remain a major uncertainty in stellar astro-physics, and are particularly poorly constrained for stripped starsin the mass range of our models (Yoon et al. 2010; Yoon 2015;Götberg et al. 2017). Very few such stars have been observed so
far, and the best observational constraint on the relevant mass-loss rates to date comes from a single system, the qWR star HD45166 (e.g., Groh et al. 2008). Radiative transfer models havejust begun to make mass-loss predictions for stripped stars in thismass range, and a large parameter space remains to be explored(Vink 2017; Sander & Vink 2020).
Wind mass loss plays a crucial role in the evolution, futureinteractions, and on the supernova properties of binary-strippedstars (Yoon et al. 2010; Yoon 2015; Gilkis et al. 2019). The ex-tended gradient of the carbon and oxygen composition above thehelium-depleted core of binary-stripped stars is a consequenceof the receding outer edge of the convective core during cen-tral helium burning due to wind mass-loss (Langer 1989b, 1991;Woosley et al. 1995).
We find a non-negligible effect of wind mass loss on thecore structure of binary-stripped stars at solar metallicity. Ap-pendix D presents tests adopting a large range of possible windmass loss rates and their effect on the core structure of binary-stripped stars, spanning from low mass loss rates predicted fromthe Monte Carlo radiative transfer models of Vink 2017 to thewind mass loss rates inferred from observations of WC and WOstars (Tramper et al. 2016). We confirm that our main conclu-sions would still be apparent for lower wind mass loss rates thanwe assume, especially at the higher mass end, though they wouldbe less pronounced.
The wind mass loss rate employed in our models is close to,but slightly smaller, than the wind mass loss inferred from HD45166. Tramper et al. (2016) found that the wind mass loss rateof WC/WO stars is higher than the mass loss rate from Nugis &Lamers (2000) assumed for our default model. If binary-strippedstars have similar stellar winds to those inferred by Tramperet al. (2016), the differences between single- and binary-strippedstars in the core composition and density structure could be evenlarger in reality than those we describe.
The vast majority of rapid population synthesis models relyon stellar structures for binary-stripped stars that were computedwithout mass loss (Hurley et al. 2000, 2002; Pols et al. 1998)and are based on calculations from single stars or naked heliumstars only. In addition, these models are typically stopped at theend of core carbon burning. This means the core structures usedin those rapid stellar population calculations are similar to thoseof single stars, and the core mass distribution is different frommore detailed stellar models. This directly affects the numberand properties of compact objects predicted from such calcula-tions.
6.5. Convection modeling and shell mergers
Our calculations model convection with the mixing-length the-ory (MLT) approximation (Böhm-Vitense 1958, using the formfrom Cox & Giuli 1968), with composition mixing treated as adiffusion process. These are common assumptions, even thoughthey are imperfect approximations (Renzini 1987), because MLThas not yet been replaced by a widely-accepted practical alter-native (see, e.g., Arnett et al. 2015). This simplification in themodeling necessarily introduces uncertainties in some aspectsof our results, especially during late phases in which mixingand burning occur on similar timescales (e.g., Bazán & Arnett1998). In particular, this leads to caution regarding the modelsin which material from the oxygen-rich layer is mixed downinto the convective silicon-burning shell. The details of the pre-dictions for such shell mergers may well change with a moresophisticated theory of convection (see also the discussion inCollins et al. 2018, who found merging oxygen and neon shells
Article number, page 18 of 29

E. Laplace et al.: Different to the core: the pre-supernova structures of massive single and binary-stripped stars
in many of their single-star models). Nonetheless, mixing down-wards into convective burning shells has also been seen in multi-dimensional hydrodynamic models of late burning stages (e.g.,Bazan & Arnett 1994; Bazán & Arnett 1998; Andrassy et al.2020; Yadav et al. 2020; McNeill & Müller 2020).
These shell mergers, if they occur in real stars as they do inour models, produce distinctly different distributions of alpha-chain elements in the oxygen-rich layer at the time of the ex-plosion. A consequence of these shell mergers is a potentially-observable abundance signature that allows for the occurrenceof such shell mergers to be tested observationally. Potential im-plications of late-stage shell mergers for stellar nucleosynthesishave been studied by, e.g., Rauscher et al. (2002) and Ritter et al.(2018). Dessart & Hillier (2020) have also noted that such shellmergers in supernova progenitors would affect the interpretationof Ca/O abundance ratios from core-collapse supernovae. In ourgrid the oxygen-silicon shell mergers preferentially occur for ref-erence core masses below 5 M� and above 6.8 M�, which couldproduce an identifiable systematic pattern in observed stripped-envelope supernovae.
7. Conclusions
We have studied the pre-supernova structures of single star mod-els from 11 to 21 M� and stars of the same initial mass that aredonor stars in binary systems (binary-stripped stars). In the bi-nary models, the stars transfer the majority of their hydrogen-rich envelopes to a companion right after the end of core hydro-gen burning (early case B mass transfer). We computed modelsat solar metallicity and, to obtain accurate information for thecomposition profile at the onset of core collapse, used a large,fully-coupled nuclear network of 128 isotopes after core oxy-gen burning. We focused on the systematic differences in thecore density and composition structure at the moment of core-collapse. Overall, we confirm that binary-stripped stars in thismass range end their lives with systematically less massive he-lium cores than single stars with the same initial mass.
Our main findings regarding the core composition structureare:
– Our composition diagrams indicate that the composition pro-files are described by three main regions: (I) a helium-richregion; (II) an oxygen-rich region that contains high abun-dances of oxygen, neon, and magnesium; (III) an iron-richregion, that contains various isotopes of iron-group elements(see Fig. 2 and C.1). These structures do not contain a clearlydistinct carbon-rich layer, in contrast to common depictionsof pre-supernova structures.
– Binary-stripped and single star models have distinct chem-ical profiles at the onset of core collapse (see Fig. 2), evenfor helium cores of similar mass. In agreement with previ-ous studies, we find that stars stripped in binaries develop anextended gradient of carbon and oxygen at the edge of thehelium-depleted core that does not exist in single stars. Weshow that this layer remains until core collapse, and is moreextended in mass for higher initial stellar masses due to themass-dependence of winds (see Fig. 9).
– We find that this extended chemical gradient is responsiblefor a systematically larger total mass of carbon in binary-stripped star models than comparable single star models atthe onset of core collapse (see Fig. 11 and Fig. 5). In contrast,the total mass of oxygen remains similar (see Fig. 11 and 13).
– The difference in total carbon mass will probably affect thechemical yield predictions, pending possible alterations as
the supernova shock propagates through the interior, whichwe have not modeled here (but will be presented in Farmeret al. in prep.).
– Shortly before core collapse, about half of our models ex-perience a merging of the convective silicon-burning shellwith the oxygen-rich layer that results in an enrichment ofheavier alpha elements (mainly 28Si, 32S, 36Ar, 40Ca) in theouter oxygen-rich regions. Although their physical accuracyin 1D models is unclear, similar effects are observed in multi-dimensional simulations. If shell mergers do occur in nature,these peculiar abundances could be observationally testable.
In addition, we investigate systematic differences in the core den-sity structure and come to the following conclusions:
– For the same reference helium core mass, stars stripped inbinaries reach systematically larger helium core radii at theonset of core collapse than single stars (see Fig. 7).
– Systematic differences can be observed in the core densitystructure of single and binary-stripped stars at the onset ofcore collapse (see Fig. 6). In the helium-rich region binary-stripped stars have higher final densities than single stars, andat the edge of the helium-rich region the density drops moresharply in the binary-stripped star models. The core densitystructures begin to diverge during core helium burning (seeFig. 12 and 13).
– We find that for the same initial mass, the compactness ofbinary-stripped stars is systematically lower than that of sin-gle stars. For the same reference core mass, the compactnessis similar. However, the central electron fraction of singleand binary-stripped star models is different (see Table 2).
The differences in composition structures may lead to a system-atically different creation of isotopes from the supernovae of sin-gle stars and binary-stripped stars. We expect the distinct densityand shell-burning structures to have a significant impact on thedynamics following core-collapse, on the propagation of the su-pernova shock through the stellar structure, and on the natureof the compact remnant. Multi-dimensional supernova simula-tions, based on stellar models similar to those presented here,are needed to quantify these effects and to compare them withsupernova observations.Acknowledgements. We thank A. Burrows, L. van Son, T. Moriya, and M.Modjaz for useful discussions. The research was funded by the EuropeanUnion’s Horizon 2020 research and innovation program from the EuropeanResearch Council (ERC, grant agreement No. 715063), and by the NetherlandsOrganisation for Scientific Research (NWO) as part of the Vidi researchprogram BinWaves with project number 639.042.728. YG acknowledges thefunding from the Alvin E. Nashman fellowship for Theoretical Astrophysics.RF is supported by the Netherlands Organisation for Scientific Research (NWO)through a top module 2 grant with project number 614.001.501 (PI de Mink).DV acknowledges funding from the U.S. Department of Energy Office ofScience and the Office of Advanced Scientific Computing Research via theScientific Discovery through Advanced Computing (SciDAC4) program andGrant DE-SC0018297 (subaward 00009650).
ReferencesAbbott, B. P., Abbott, R., Abbott, T. D., et al. 2016, Physical Review Letters,
116, 061102Abbott, B. P., Abbott, R., Abbott, T. D., et al. 2017, Physical Review Letters,
119, 161101Aguilera-Dena, D. R., Langer, N., Antoniadis, J., & Müller, B. 2020,
arXiv:2008.09132 [astro-ph], arXiv: 2008.09132Andrassy, R., Herwig, F., Woodward, P., & Ritter, C. 2020, Monthly Notices of
the Royal Astronomical Society, 491, 972Angulo, C., Arnould, M., Rayet, M., et al. 1999, Nuclear Physics A, 656, 3
Article number, page 19 of 29

A&A proofs: manuscript no. manuscript_single_vs_binary
Arnett, W. D., Meakin, C., Viallet, M., et al. 2015, ApJ, 809, 30Asplund, M., Grevesse, N., Sauval, A. J., & Scott, P. 2009, Annual Review of
Astronomy and Astrophysics, 47, 481Bazan, G. & Arnett, D. 1994, ApJ, 433, L41Bazán, G. & Arnett, D. 1998, ApJ, 496, 316Bellm, E. C., Kulkarni, S. R., Graham, M. J., et al. 2019, Publications of the
Astronomical Society of the Pacific, 131, 018002Bhattacharya, D. & van den Heuvel, E. P. J. 1991, Physics Reports, 203, 1Brott, I., de Mink, S. E., Cantiello, M., et al. 2011, Astronomy and Astrophysics,
530, A115Brown, G. E., Heger, A., Langer, N., et al. 2001, New Astronomy, 6, 457Brown, G. E., Lee, C.-H., & Bethe, H. A. 1999, New Astronomy, 4, 313Brown, G. E., Weingartner, J. C., & Wijers, R. A. M. J. 1996, The Astrophysical
Journal, 463, 297Burbidge, E. M., Burbidge, G. R., Fowler, W. A., & Hoyle, F. 1957, Reviews of
Modern Physics, 29, 547Burrows, A., Radice, D., Vartanyan, D., et al. 2020, Monthly Notices of the Royal
Astronomical Society, 491, 2715Burrows, A. & Vartanyan, D. 2020, arXiv e-prints, 2009, arXiv:2009.14157Böhm-Vitense, E. 1958, Zeitschrift fur Astrophysik, 46, 108Chieffi, A. & Limongi, M. 2020, The Astrophysical Journal, 890, 43Collins, C., Müller, B., & Heger, A. 2018, Monthly Notices of the Royal Astro-
nomical Society, 473, 1695Couch, S. M. & Ott, C. D. 2013, The Astrophysical Journal Letters, 778, L7Cox, J. P. & Giuli, R. T. 1968, Principles of stellar structure, by J.P. Cox and R.
T. Giuli. New York: Gordon and Breach, 1968de Jager, C., Nieuwenhuijzen, H., & van der Hucht, K. A. 1988, Astronomy and
Astrophysics Supplement Series, 72, 259de Mink, S. E., Pols, O. R., & Yoon, S.-C. 2008, First Stars III, 990, 230Dessart, L. & Hillier, D. J. 2020, arXiv:2007.02243 [astro-ph], arXiv:
2007.02243Dewi, J. D. M., Podsiadlowski, P., & Sena, A. 2006, Monthly Notices of the
Royal Astronomical Society, 368, 1742Dewi, J. D. M. & Pols, O. R. 2003, Monthly Notices of the Royal Astronomical
Society, 344, 629Eldridge, J. J. & Vink, J. S. 2006, Astronomy and Astrophysics, 452, 295Eldridge, J. J., Xiao, L., Stanway, E. R., Rodrigues, N., & Guo, N.-Y. 2018,
Publications of the Astronomical Society of Australia, 35Ertl, T., Janka, H.-T., Woosley, S. E., Sukhbold, T., & Ugliano, M. 2016, The
Astrophysical Journal, 818, 124Ertl, T., Woosley, S. E., Sukhbold, T., & Janka, H.-T. 2020, The Astrophysical
Journal, 890, 51Farmer, R. 2019, rjfarmer/mesaplot: Bug fixesFarmer, R., Fields, C. E., Petermann, I., et al. 2016, The Astrophysical Journal
Supplement Series, 227, 22Farmer, R., Renzo, M., de Mink, S. E., Fishbach, M., & Justham, S. 2020, The
Astrophysical Journal Letters, 902, L36Farmer, R., Renzo, M., de Mink, S. E., Marchant, P., & Justham, S. 2019, ApJ,
887, 53Ferguson, J. W., Alexander, D. R., Allard, F., et al. 2005, The Astrophysical
Journal, 623, 585Fields, C. E. & Couch, S. M. 2020, The Astrophysical Journal, 901, 33Fraley, G. S. 1968, Astrophysics and Space Science, 2, 96Fryer, C. L., Belczynski, K., Wiktorowicz, G., et al. 2012, The Astrophysical
Journal, 749, 91Fuller, J. 2017, Monthly Notices of the Royal Astronomical Society, 470, 1642Fuller, J. & Ro, S. 2018, Monthly Notices of the Royal Astronomical Society,
476, 1853Gilkis, A., Vink, J. S., Eldridge, J. J., & Tout, C. A. 2019, Monthly Notices of
the Royal Astronomical Society, 486, 4451Groh, J. H., Oliveira, A. S., & Steiner, J. E. 2008, Astronomy and Astrophysics,
485, 245Götberg, Y., Mink, D., E, S., & Groh, J. H. 2017, Astronomy and Astrophysics,
608, A11Habets, G. M. H. J. 1986, Astronomy and Astrophysics, 165, 95Hix, W. R. & Thielemann, F.-K. 1996, The Astrophysical Journal, 460, 869Hunter, J. D. 2007, Computing in Science and Engineering, 9, 90Hurley, J. R., Pols, O. R., & Tout, C. A. 2000, Monthly Notices of the Royal
Astronomical Society, 315, 543Hurley, J. R., Tout, C. A., & Pols, O. R. 2002, Monthly Notices of the Royal
Astronomical Society, 329, 897Iglesias, C. A. & Rogers, F. J. 1993, The Astrophysical Journal, 412, 752Iglesias, C. A. & Rogers, F. J. 1996, The Astrophysical Journal, 464, 943Ivezic, Z., Axelrod, T., Brandt, W. N., et al. 2008, Serbian Astronomical Journal,
176, 1Jiang, Y.-F., Cantiello, M., Bildsten, L., Quataert, E., & Blaes, O. 2015, The
Astrophysical Journal, 813, 74Jiang, Y.-F., Cantiello, M., Bildsten, L., et al. 2018, Nature, 561, 498Khazov, D., Yaron, O., Gal-Yam, A., et al. 2016, The Astrophysical Journal, 818,
3
Kippenhahn, R. & Weigert, A. 1967, Zeitschrift fur Astrophysik, 65, 251Kochanek, C. S., Shappee, B. J., Stanek, K. Z., et al. 2017, Publications of the
Astronomical Society of the Pacific, 129, 104502Kruckow, M. U., Tauris, T. M., Langer, N., Kramer, M., & Izzard, R. G. 2018,
Monthly Notices of the Royal Astronomical Society, 481, 1908Kuroda, T., Kotake, K., Takiwaki, T., & Thielemann, F.-K. 2018, Monthly No-
tices of the Royal Astronomical Society, 477, L80Langer, N. 1989a, Astronomy and Astrophysics, 220, 135Langer, N. 1989b, Astronomy and Astrophysics, 210, 93Langer, N. 1991, Astronomy and Astrophysics, 248, 531Laplace, E., Götberg, Y., de Mink, S. E., Justham, S., & Farmer, R. 2020, As-
tronomy and Astrophysics, 637, A6Lentz, E. J., Bruenn, S. W., Hix, W. R., et al. 2015, The Astrophysical Journal
Letters, 807, L31Mandel, I., M ueller, B., Riley, J., et al. 2020, arXiv e-prints, 2007,
arXiv:2007.03890Mandel, I. & Müller, B. 2020, Monthly Notices of the Royal Astronomical So-
ciety, 499, 3214Marchant, P., Renzo, M., Farmer, R., et al. 2019, The Astrophysical Journal, 882,
36McNeill, L. O. & Müller, B. 2020, Monthly Notices of the Royal Astronomical
Society, 497, 4644Melson, T., Janka, H.-T., & Marek, A. 2015, The Astrophysical Journal Letters,
801, L24Modjaz, M., Gutiérrez, C. P., & Arcavi, I. 2019, Nature Astronomy, 3, 717Müller, B. 2015, Monthly Notices of the Royal Astronomical Society, 453, 287Müller, B., Tauris, T. M., Heger, A., et al. 2019, Monthly Notices of the Royal
Astronomical Society, 484, 3307Nugis, T. & Lamers, H. J. G. L. M. 2000, Astronomy and Astrophysics, 360, 227O’Connor, E. & Ott, C. D. 2011, The Astrophysical Journal, 730, 70Ott, C. D., Roberts, L. F., da Silva Schneider, A., et al. 2018, The Astrophysical
Journal Letters, 855, L3Patton, R. A. & Sukhbold, T. 2020, arXiv:2005.03055 [astro-ph], arXiv:
2005.03055 version: 1Paxton, B., Bildsten, L., Dotter, A., et al. 2011, The Astrophysical Journal Sup-
plement Series, 192, 3Paxton, B., Cantiello, M., Arras, P., et al. 2013, The Astrophysical Journal Sup-
plement Series, 208, 4Paxton, B., Marchant, P., Schwab, J., et al. 2015, The Astrophysical Journal Sup-
plement Series, 220, 15Paxton, B., Schwab, J., Bauer, E. B., et al. 2018, The Astrophysical Journal Sup-
plement Series, 234, 34Paxton, B., Smolec, R., Schwab, J., et al. 2019, The Astrophysical Journal Sup-
plement Series, 243, 10Perez, F. & Granger, B. E. 2007, Computing in Science and Engineering, 9, 21Podsiadlowski, P., Joss, P. C., & Hsu, J. J. L. 1992, The Astrophysical Journal,
391, 246Podsiadlowski, P., Langer, N., Poelarends, A. J. T., et al. 2004, The Astrophysical
Journal, 612, 1044Poelarends, A. J. T., Herwig, F., Langer, N., & Heger, A. 2008, The Astrophysical
Journal, 675, 614Pols, O. R. & Dewi, J. D. M. 2002, Publications of the Astronomical Society of
Australia, 19, 233Pols, O. R., Schröder, K.-P., Hurley, J. R., Tout, C. A., & Eggleton, P. P. 1998,
Monthly Notices of the Royal Astronomical Society, 298, 525Rauscher, T., Heger, A., Hoffman, R. D., & Woosley, S. E. 2002, ApJ, 576, 323Renzini, A. 1987, Astronomy and Astrophysics, 188, 49Renzo, M. 2015, Master’s thesis, Università di Pisa, Italy, https://etd.adm.unipi.it/t/etd-05062015-125630/
Renzo, M., Ott, C. D., Shore, S. N., & de Mink, S. E. 2017, Astronomy andAstrophysics, 603, A118
Ritter, C., Andrassy, R., Côté, B., et al. 2018, MNRAS, 474, L1Roberts, L. F., Ott, C. D., Haas, R., et al. 2016, The Astrophysical Journal, 831,
98Sana, H., de Mink, S. E., de Koter, A., et al. 2012, Science, 337, 444Sander, A. A. C. & Vink, J. S. 2020, Monthly Notices of the Royal Astronomical
Society, 499, 873Schneider, F. R. N., Podsiadlowski, P., & Müller, B. 2020, arXiv:2008.08599
[astro-ph], arXiv: 2008.08599Schootemeijer, A., Langer, N., Grin, N. J., & Wang, C. 2019, A&A, 625, A132Shiode, J. H., Quataert, E., & Arras, P. 2012, Monthly Notices of the Royal
Astronomical Society, 423, 3397Smith, N. 2014, Annual Review of Astronomy and Astrophysics, 52, 487Sukhbold, T. & Woosley, S. E. 2014, The Astrophysical Journal, 783, 10Sukhbold, T., Woosley, S. E., & Heger, A. 2018, The Astrophysical Journal, 860,
93Summa, A., Janka, H.-T., Melson, T., & Marek, A. 2018, The Astrophysical
Journal, 852, 28Takiwaki, T., Kotake, K., & Suwa, Y. 2012, The Astrophysical Journal, 749, 98
Article number, page 20 of 29
E. Laplace et al.: Different to the core: the pre-supernova structures of massive single and binary-stripped stars
Tartaglia, L., Sand, D. J., Valenti, S., et al. 2018, The Astrophysical Journal, 853,62
Tauris, T. M., Langer, N., & Podsiadlowski, P. 2015, Monthly Notices of theRoyal Astronomical Society, 451, 2123
Timmes, F. X. 1999, The Astrophysical Journal Supplement Series, 124, 241Timmes, F. X., Hoffman, R. D., & Woosley, S. E. 2000, The Astrophysical Jour-
nal Supplement Series, 129, 377Tout, C. A., Pols, O. R., Eggleton, P. P., & Han, Z. 1996, Monthly Notices of the
Royal Astronomical Society, 281, 257Tramper, F., Sana, H., & de Koter, A. 2016, The Astrophysical Journal, 833, 133Tutukov, A., Yungelson, L., & Klayman, A. 1973, Nauchnye Informatsii, 27, 3Ugliano, M., Janka, H.-T., Marek, A., & Arcones, A. 2012, The Astrophysical
Journal, 757, 69van der Walt, S., Colbert, S. C., & Varoquaux, G. 2011, Computing in Science
and Engineering, 13, 22Vartanyan, D., Burrows, A., Radice, D., Skinner, M. A., & Dolence, J. 2018,
Monthly Notices of the Royal Astronomical Society, 477, 3091Vartanyan, D., Burrows, A., Radice, D., Skinner, M. A., & Dolence, J. 2019,
Monthly Notices of the Royal Astronomical Society, 482, 351Vink, J. S. 2017, Astronomy and Astrophysics, 607, L8Vink, J. S., de Koter, A., & Lamers, H. J. G. L. M. 2001, Astronomy and Astro-
physics, 369, 574Weaver, T. A. & Woosley, S. E. 1993, Physics Reports, 227, 65Wellstein, S. & Langer, N. 1999, A&A, 350, 148Wheeler, J. C. & Levreault, R. 1985, ApJ, 294, L17Woosley, S. E. 2019, The Astrophysical Journal, 878, 49Woosley, S. E. & Heger, A. 2007, Physics Reports, 442, 269Woosley, S. E., Heger, A., & Weaver, T. A. 2002, Reviews of Modern Physics,
74, 1015Woosley, S. E., Langer, N., & Weaver, T. A. 1993, The Astrophysical Journal,
411, 823Woosley, S. E., Langer, N., & Weaver, T. A. 1995, The Astrophysical Journal,
448, 315Yadav, N., Müller, B., Janka, H. T., Melson, T., & Heger, A. 2020, The Astro-
physical Journal, 890, 94Yoon, S.-C. 2015, Publications of the Astronomical Society of Australia, 32,
e015Yoon, S.-C., Dessart, L., & Clocchiatti, A. 2017, The Astrophysical Journal, 840,
10Yoon, S.-C., Woosley, S. E., & Langer, N. 2010, The Astrophysical Journal, 725,
940Yoshida, T., Takiwaki, T., Kotake, K., et al. 2019, The Astrophysical Journal,
881, 16Yoshida, T., Takiwaki, T., Kotake, K., et al. 2020, arXiv:2012.13261 [astro-ph],
arXiv: 2012.13261
Article number, page 21 of 29

A&A proofs: manuscript no. manuscript_single_vs_binary
Appendix A: Impact of the nuclear network
Toward the end of the evolution of massive stars, the core is com-posed by a multitude of synthesized isotopes, many of whichare short-lived and neutron-rich. The properties of the stellarcore are sensitive to weak interaction processes that can only beaccounted for by tracking the many electron and positron cap-tures, and β-decays from rare and unstable isotopes. This usu-ally requires the quasi-statistical nuclear equilibrium approxima-tion approach (Hix & Thielemann 1996) or to keep track of alarge number of isotopes in the nuclear network (e.g., Farmeret al. 2016). In this work, we present simulations where wesimultaneously solve for the structure and nuclear burning us-ing with a large nuclear network of 128 isotopes. Farmer et al.(2016) showed that a nuclear network with at least 127 isotopesis required to obtain resolved core structures after the end ofcore oxygen burning. This is what we adopt in our models. Forthe prior evolution up to and including central oxygen burning,we employ an α-chain nuclear network containing 21 isotopes,which is considered adequate to capture the energy generationrate during earlier nuclear burning phases. However, the accu-racy of an α-chain network decreases with the evolution, espe-cially during core oxygen burning (see, e.g., Renzo 2015).
Here, we test the impact of computing the evolution of starsfrom birth to core oxygen depletion with a nuclear network thatcontains 128 isotopes compared to our default setup. We performthis test for two stellar models (1) the single star model with aninitial mass of 16 M� (2) a binary-stripped model with an initialmass of 20 M�. Both models reach almost exactly the same coremass of 6.3 M� at the end of core helium burning. In Figure A.1,we compare these models on the central density-central temper-ature space. Until central carbon depletion, the models have al-most exactly the same evolution independently from the size ofthe nuclear networks. However, after this moment, differencesstart to appear. The models with a larger network reach higherdensities. This is true for both the single and the binary-strippedstar model. After this moment, differences in the binary-strippedmodel become more prominent.
The central temperatures and densities between the modelsdo vary with the use of a larger nuclear network in the lateevolutionary phases. However, the relative differences betweenthe single and binary-stripped stellar models remain similar. Weconclude that models with larger nuclear networks throughoutthe evolution, though expensive, are desirable for the future, butwe expect that our conclusions about the relative differencesbetween single and binary-stripped star models are not signifi-cantly affected.
Appendix B: Reference core mass
Giving an exact definition of the boundary between the core andthe envelope of a star is not trivial and varies between differentstudies (Sukhbold & Woosley 2014). That is because, while adrop in density of several orders of magnitude, together with alarger change in composition, can typically be observed betweenthe edge of the inner core and the envelope, there is a gradientin composition and density at this edge that make it difficult todefine an exact boundary. In addition, details of semi-convectionand core overshoot can have a large effect on the stellar coremass and on the core edge and complicate this definition evenfurther (e.g., Schootemeijer et al. 2019). For this study, we com-pare the late properties of stellar models as a function of theirreference core mass, which we define as the mass of the heliumcore (i.e., the mass coordinate where the mass fraction of hydro-
−7.4 −7.3 −7.2 −7.1 −7.0 −6.9 −6.8 −6.7log10(ρ
1/3c T −1
c /[g1/3 cm−1 K−1])
7.5
8.0
8.5
9.0
9.5
10.0
log 1
0(T c
/K)
A
B
C
D
E
F
G
MrefHecore = 6.3M⊙
A – core hydrogen ignitionB – begin of mass transferC – halfway throughcore helium burningD – core helium depletionE – core carbon depletionF – core oxygen depletionG – onset of core collapse
Single default netSingle 128 netBinary-stripped default netBinary-stripped 128 net
Fig. A.1. Comparison on the central temperature, central density planebetween using a large nuclear network with 128 isotopes throughoutthe evolution and switching from a nuclear network with 21 isotopesto a nuclear network with 128 isotopes after core oxygen depletion. Tobetter show the differences between the models, we have re-scaled thehorizontal axis by the dependence expected for homologous contractionof an ideal gas.
12 14 16 18 20Initial mass [M�]
3
4
5
6
7
8
Mre
fH
ecor
e[M�
]
SingleBinary-stripped
Fig. B.1. Helium core mass at core helium depletion as a function ofinitial mass for single stars and star that were stripped due to Roche-lobeoverflow in a binary system during the hydrogen shell burning phase.
gen decreases below 0.1) at the moment of core helium deple-tion (when the central mass fraction of helium decreases below10−4). Here, we investigate the impact of this definition on ourconclusions. We discuss the sensitivity to the evolutionary stagefor which we define the reference core mass in Section B.1 andto the exact choice of the helium core mass boundary in SectionB.2.
Article number, page 22 of 29
E. Laplace et al.: Different to the core: the pre-supernova structures of massive single and binary-stripped stars
Appendix B.1: Evolution of the helium core mass
In Fig. B.1, we present the reference core mass as a function ofinitial mass for both single and binary models. We verify thatdonor stars in early case B mass-transfer binaries have systemat-ically less massive cores at the end of their lives than single starswith the same initial mass (cf. Podsiadlowski et al. 1992). Forboth the single and binary-stripped models, the reference coremass increases as a function of initial mass. The highest-masssingle star models deviate from the linear trend.
We present the evolution of the helium core mass as a func-tion of time for all of the single (full lines) and binary-stripped(dashed lines) models in Fig. B.2. We indicate the initial massof the models with colors and mark key evolutionary steps withsymbols. All single star models show the same trend of an in-creasing helium core mass with time. In contrast, the heliumcore mass of binary-stripped star models first increases, thenreaches a plateau, and then decrease towards the end of theirlife. This is because single stars undergo hydrogen shell burn-ing, which leads to an increase of about 1 M� in helium coremass from the beginning of core helium burning onward (circlesin Fig. B.2) until core oxygen depletion (squares in Fig. B.2).In contrast, binary-stripped stars at this metallicity stop hydro-gen shell-burning shortly after mass transfer. Eventually mostof their hydrogen-rich envelope is removed due to the solar-metallicity wind mass loss rate assumed here (we discuss theimpact of the wind mass loss rate in Appendix D). For lower-metallicity stars, a hydrogen-rich layer is retained because thestripping process is less effective (Götberg et al. 2017; Yoonet al. 2017; Laplace et al. 2020). During core helium burning, thehelium core mass of binary-stripped stars reaches a plateau forall masses considered when the mass transfer ends (star mark-ers in Fig. B.2). At this moment, hydrogen shell burning, whichwas still occurring during mass transfer, stops, and only a smallhydrogen layer remains on the stellar surface. Soon after, the he-lium core mass begins to decrease for all models due to the effectof winds that remove the outer layers. This effect is mass depen-dent (cf. Langer 1989a). For the stellar wind mass loss rate weassume in this study, the decrease in mass due to wind mass lossin binary-stripped stars ranges from 0.1 M� for the lowest-massmodel (with an initial mass of 11 M�) to 1.2 M� for the highest-mass model (with an initial mass of 21 M�).
After core helium depletion, the lifetime of stars is so shortthat winds have a negligible impact on the helium core mass, asshown by the overlapping markers after this moment (diamonds,squares, and crosses in B.2). The strongest effect we observe is adecrease of the helium core mass by 0.1 M� for the highest-massbinary-stripped star model.
Appendix B.2: Helium core boundary
Various definitions are possible for the helium core mass, as il-lustrated in Fig. B.3. We discuss whether the choice of the coredefinition impacts our conclusions, in particular regarding struc-tural differences between the helium cores of single and binary-stripped stars (see Section 4.5).
In Fig. B.3 we show the interior helium and hydrogen abun-dances of an example single star model with an initial mass of20 M� at core helium depletion. Our definition of the heliumcore mass (1) is shown as the mass coordinate where the hy-drogen mass fraction XH < 0.01 and the helium mass fractionXHe > 0.1 and corresponds to the edge of the helium-rich re-gion at 7.5 M�. The definition employed in Sukhbold & Woosley(2014) is somewhat further out and corresponds to the mass
where XH < 0.2 (2). The definition where XHe > 0.5 leads toan even higher helium core mass and coincides with the begin-ning of a helium-enriched layer due to hydrogen-shell burning(corresponding to the peak of the nuclear energy generation ratearound 7.6 M�). Another possible definition is the mass coordi-nate where the mass fraction of hydrogen is strictly larger thanthe mass fraction of helium (4). This boundary is however setoutside the hydrogen-burning shell and does therefore not fol-low the growth of the helium-rich core due to shell burning.
We show how the radius of the helium core changes whenwe change the definition of the helium core mass boundary inFig. B.4. The figure presents the radial coordinate of each stel-lar model (top: single, bottom:binary-stripped) as a function ofthe initial stellar mass. Every model in our grid is shown as arectangle whose height corresponds to the surface radius of themodel. The width of every rectangle is set as 1 M�. We indicatethe mass fraction of helium at each radius coordinate by colorshading it. For the binary-stripped models at this metallicity, allhelium core definitions correspond to the surface of the star andare thus identical. The choice of the helium core boundary is thusonly relevant for the single-star models.
For the single star models, the helium core radius changesdepending on the core boundary chosen. With definition 3, theboundary of the helium core corresponds to the boundary be-tween the helium-rich region and the hydrogen-rich envelopefor all models, except for the highest mass model. This is be-cause for the highest-mass model, some helium has been mixedin the hydrogen-rich envelope. This means the core-mass defini-tion is not consistent across all masses. Furthermore, this bound-ary lies above the hydrogen-burning shell and can therefore notaccount for the growth in core mass due to shell burning. Theother two definitions give similar trends to each other. The defini-tion 2 from (Sukhbold & Woosley 2014) results in systematicallylarger helium core radii, of about 0.5 R� larger than for definition1. However, this difference is negligible compared with the dif-ference to the helium core radii of the binary-stripped models.The helium core mass does not change significantly after corehelium depletion, and our findings on the differences in heliumcore radii are robust against sensible variations of the core massdefinition. We conclude that the reference core mass we havechosen is robust for our purpose.
Appendix C: All final composition diagrams
In Section 4, we discuss general trends in final chemical structureand compare single and binary-stripped star models with similarvalues of the reference core masses. In Fig. C.1, we present com-position diagrams at the moment of core collapse for the full setof models. The figure is divided into two sets of two rows thatcontain single (top) and binary-stripped (bottom) stellar modelswith the same initial masses. The binary-stripped model with aninitial mass of 19 M� is not shown because it did not reach corecollapse due to numerical issues. Below each model we indicateits reference core mass.
Appendix D: Effect of winds on the cores ofbinary-stripped stars
How much mass massive stars lose to winds is one of the biggestopen question in stellar astrophysics (Smith 2014). The choiceof stellar winds assumed for stellar evolution models greatly im-pacts the evolution of massive stars and in particular their corestructure (Renzo et al. 2017). Stellar winds of binary-stripped
Article number, page 23 of 29

A&A proofs: manuscript no. manuscript_single_vs_binary
1.0 1.2 1.4 1.6 1.8 2.0 2.2 2.4Time / yr ×107
0
1
2
3
4
5
6
7
8
MH
ecor
e/M
⊙more massive (shorter life) less massive (longer life)
a – core helium ignitionb – halfway throughcore helium burningc – core helium depletiond – core oxygen depletione – onset of core collapse
SingleBinary-stripped
12
14
16
18
20
Mi/
M⊙
Fig. B.2. Evolution of the helium core mass of every model as a function of time. Full lines correspond to single star and dashed lines to binary-stripped stars models. Symbols indicate key evolutionary stages for the development of the helium core and colors give the initial mass of the stars.Because massive stars live shorter lives, the more massive models are located on the left side and the less massive models on the right side of theplot.
4 5 6 7 8 9 10 11Mass /M⊙
0.0
0.2
0.4
0.6
0.8
1.0
Abu
ndan
ces
1H
1H
4He
4He 1. XH < 0.01,XHe > 0.1 (this work)2. XH < 0.2 (Sukhbold+2014)3. XHe > 0.54. XHe > XH
-20
-10
0
log(
ε nuc
/[er
gg−
1 s−1 ])
Fig. B.3. Mass fraction of 1H (blue line) and 4He (orange line) as afunction of mass coordinate for an example single star model with aninitial mass of 20 M� at core helium depletion. Vertical lines mark dif-ferent choices of the helium core mass definition. In red, we indicate thespecific nuclear energy generation rate throughout the model. The firstpeak in the nuclear energy generation rate around 5.8 M� correspondsto helium shell-burning and the second peak around 7.6 M� to hydrogenshell-burning.
stars are among of the most unconstrained (Götberg et al. 2017;Vink 2017) and can have a large impact on their evolution, fu-ture interactions, and on their supernova properties (Yoon et al.
2010; Yoon 2015; Gilkis et al. 2019), though efforts are beingmade to better constrain these with new-generation stellar atmo-sphere models (e.g., Sander & Vink 2020). Here, we investigatethe effect of changing the adopted wind mass loss rate for binary-stripped stars on the core properties. To this end, we simulatedtwo example models with initial masses of 11 and 20 M�, at theextremes of the mass range we chose, and varied the wind massloss rate by a constant factor after the end of mass-transfer.
We varied the wind mass loss rate from a factor 10 smaller toa factor three higher than the default wind mass loss rate. Thesevalues are motivated by the range of mass loss rates inferredfrom binary-stripped stars both through observations and fromlatest theoretical studies (Yoon et al. 2010; Yoon 2015; Vink2017). In Table D.1, we give values for the surface properties andwind mass loss rates halfway through core helium burning (whenthe central mass fraction of helium decreases below 0.5). Thevalues for the lowest wind mass loss rates (wind factors of 0.10and 0.33) are similar to the solar-metallicity wind mass loss ratecomputed by Vink (2017) through Monte Carlo radiative transfermodels. Our lowest mass model with an initial mass of 11 M�can be compared to observations of the qWR star HD 45166,which has a wind mass loss rate of log10 M/(M� yr−1) = −6.66and a luminosity of log10(L/L�) = 3.75 ± 0.08 (Groh et al.2008). Though the luminosity of this star, and therefore its mass,is smaller than the luminosity of the model, its wind mass loss
Article number, page 24 of 29

E. Laplace et al.: Different to the core: the pre-supernova structures of massive single and binary-stripped stars
Fig. B.4. Radial coordinate as a function of the initial mass for the sin-gle star models (top) and the binary-stripped star models (bottom) atthe onset of core collapse. Colors indicate the mass fraction of 4He ateach radial coordinate. Four different helium core mass definitions areindicated with horizontal lines.
rate is similar to the mass loss rates we obtain when increas-ing the wind mass loss rate by a factor between 1.25 or 2. Forthe binary-stripped star model with an initial mass of 20 M�, thevalues for the highest wind mass loss rates (wind factors 2 and 3)are similar to the wind mass loss rates derived from observationsof WC/WO stars (log10 M/(M� yr−1) = −5 for log10(L/L�) = 5,Tramper et al. 2016).
Varying the wind mass loss rate factor has a systematic im-pact on the stellar structure. The total mass of the binary-strippedstar, and with it its density profile at core helium depletion,strongly depends on the wind mass loss rate, as shown in Fig.
Table D.1. The effect of a modified wind mass loss factor after masstransfer on the stellar properties of binary-stripped stars, taken halfwaythrough central helium burning (defined as the moment when XHe =0.5).
Wind factor M∗ log10 log10 log10(M�) (Teff/K) (L/L�) (M/[M� yr−1])
Binary-stripped star model: Mi = 11 M�0.10 3.50 4.84 4.19 -7.790.33 3.46 4.85 4.17 -7.280.50 3.43 4.85 4.15 -7.110.75 3.39 4.86 4.14 -6.941.00 3.36 4.86 4.12 -6.821.25 3.32 4.87 4.11 -6.732.00 3.22 4.89 4.08 -6.523.00 3.08 4.92 4.03 -6.27
Binary-stripped star model: Mi = 20 M�0.10 8.10 4.92 5.04 -6.680.33 7.94 4.95 5.02 -6.170.50 7.84 4.97 5.00 -5.980.75 7.68 4.99 4.99 -5.801.00 7.52 5.02 4.97 -5.621.25 7.34 5.04 4.95 -5.462.00 6.81 5.03 4.88 -5.343.00 6.22 5.02 4.80 -5.27
D.1. In the top panel of Fig. D.1, we show the models with aninitial mass of 11 M�, and in the bottom panel, the models withan initial mass of 20 M�. Independently of the initial mass, wefind that models with increased wind mass loss rates have morecentrally concentrated density profiles, a lower mass core and alower total mass. In contrast, models with decreased wind massloss rates have higher total masses and achieve smaller densitiesat the surface. The models with the smallest wind mass loss rateshave density profiles with a similar shape as for the single-starprofiles because they retain a hydrogen-rich layer above the he-lium core. The 20 M� binary-stripped model (bottom panel ofFig. D.1) with the lowest wind mass loss rate achieves a heliumcore mass that is larger than that of the single star model withthe same initial mass.
In Fig. D.2 we show that the central mass fraction of 12C and16O at the moment of core helium depletion is also systemati-cally affected by a changing wind mass loss rate. The higher thewind mass loss, the lower (higher) the central mass fraction of12C (16O). For models with low wind mass loss rates, we find amore pronounced effect on the central mass fraction.
The wind mass loss rate affects the extent of the carbon-richgradient above the helium-depleted core, as we show in the com-position profiles in Fig. D.3. Models with high wind mass lossrates have a more extended carbon-rich layer. This can be un-derstood as the consequence of a more pronounced retreat inmass of the convective core during central helium burning (seealso 5.1), that leaves helium burning products behind. Even forlower wind mass loss rates, the carbon-rich layer is still presentin the binary-stripped stars and more extended than for single-star models. Models with reduced wind mass loss rates retain ahydrogen-rich layer (as shown by the dashed lines in Fig. D.3).
For the example binary-stripped star model with an initialmass of 20 M�, the effect of winds is more pronounced than forthe 11 M� model, due to the indirect mass dependence of winds.In the two models with the highest wind mass loss rates (a fac-tor two and three larger, respectively), the winds are so strong
Article number, page 25 of 29

A&A proofs: manuscript no. manuscript_single_vs_binary
Fig. C.1. Composition diagrams showing the core composition interior to the helium core at the onset of core collapse for the entire grid ofmodels. The two pairs of rows show single and binary-stripped star models with the same initial masses. All models are scaled such that the radiusof the diagram is proportional to the square root of the helium core mass (the helium core mass is indicated at the bottom of each diagram). Thebinary-stripped model with an initial mass of 19 M� is not shown because it did not reach core collapse.
that even the helium-rich layer is removed, and the carbon-richlayer reaches the surface of the star (indicated with a circle inthe bottom panel of Fig. D.3). Observationally, such stars wouldlikely be observed as carbon- or oxygen-rich Wolf-Rayet stars(type WC/WO) and a supernova resulting from such stars wouldmost likely be of type Ic.
We conclude that variations of the wind mass loss rate havea systematic effect on the core structure of binary-stripped stars.The extent of the carbon-rich layer above the helium-depletedcore strongly depends on the wind mass loss rate. However, themass extent of the carbon-rich layer and the central fraction ofcarbon remains larger for binary-stripped star models than forsingle-star models with the same initial mass, even for the lowestwind mass loss rates (a factor 10 weaker, and similar to the windmass loss inferred by Vink 2017).
Appendix E: Definition of the onset of core collapse
As the inner layers of the star lose pressure support, they beginto collapse and the density increases. In our models, the mo-ment that marks the onset of core collapse is chosen followingWoosley et al. (2002). Here, we study how changing the defini-tion of the onset of core collapse affects the density profile.
In Fig. E.1 and E.2, we show the density profiles of two ex-ample single and binary-stripped star models with initial massesof 11 M� and 14.5 M�, respectively. We compare two differentdefinitions of the onset of core collapse: (1) our default defini-tion of an infall velocity of 1000 km/s in the inner iron core (2) avalue of 1500 km/s. For all models, the density of the inner-mostlayers varies slightly for the second definition in the innermost0.7 M�. The rest of the density profile is not affected because thefree fall time-scale is much larger in the outside layers. Sincethe inner-most layers will become enclosed in the compact ob-ject that forms in the center, we conclude that the choice of our
Article number, page 26 of 29

E. Laplace et al.: Different to the core: the pre-supernova structures of massive single and binary-stripped stars
0
0
1
1
2
2
3
3
4
4
5
5
m [M⊙]
−8
−6
−4
−2
0
2
4
log 1
0(ρ/
[gcm
−3 ])
wind ×0.1wind ×0.33wind ×0.5wind ×0.75wind ×1.25wind ×2wind ×3Single Mi = 11M⊙Binary-stripped Mi = 11M⊙
0
0
1
1
2
2
3
3
4
4
5
5
6
6
7
7
8
8
9
9
m [M⊙]
−8
−6
−4
−2
0
2
4
log 1
0(ρ/
[gcm
−3 ]) wind ×0.1
wind ×0.33wind ×0.5wind ×0.75wind ×1.25wind ×2wind ×3Single Mi = 16M⊙Single Mi = 20M⊙Binary-stripped Mi = 20M⊙
Fig. D.1. Impact of wind variations on the density profiles of binary-stripped stars. We show the profiles at the moment of core helium de-pletion for a single (blue) and binary-stripped (red) star model with thesame initial mass of 11 M� (top panel) and 20 M� (bottom panel). Greylines show variations of the density profile for the binary-stripped starwhen we vary the wind mass-loss rate after Roche-lobe overflow by thefactor indicated in the legend.
definition for the onset of core collapse does not affect our con-clusions.
Appendix F: Shell mergers
About half of the models in our grid experience the merging ofsilicon-burning shells with oxygen-rich layers (e.g., Couch & Ott2013; Yoshida et al. 2019; Andrassy et al. 2020; Fields & Couch2020). They occur in both single and binary-stripped models. Inthis section, we discuss how these shell mergers arise and howthe composition is modified. To this end, we focus on an examplemodel, the single star model with an initial mass of 11 M�.
In Fig. F.1, we show the evolution of the composition struc-ture at selected points in the evolution. The star burns siliconin a convective core (labels 1 to 3 in Fig. F.1), before ignitingsilicon in a convective shell (label 4 in Fig. F.1). Shortly afterthe ignition of this shell, the burning shell moves upwards inmass coordinate. It then reaches the oxygen-rich region aboveand becomes mixed in (labels 4 to 5 in Fig. F.1). The mergerleads to a more luminous and extended burning of silicon. Be-cause silicon now burns in a different composition environment,different branching rates of the burning reactions occur. The in-gestion of oxygen helps boost alpha-chain reactions and leads toan increased abundance of 28Si, 32S, 36Ar, 40Ca, and 44Fe in the
2.6 2.8 3.0 3.2 3.4 3.6 3.8Mref
Hecore[M⊙]
0.4
0.5
0.6
Cen
tral
mas
sfr
actio
n
12C
16O
0.10.330.50.75
1.2523Wind factor
3.5 4.0 4.5 5.0 5.5 6.0 6.5 7.0 7.5Mref
Hecore[M⊙]
0.2
0.3
0.4
0.5
0.6
0.7
Cen
tral
mas
sfr
actio
n
12C
16O
0.10.330.50.751.2523Wind factor
Fig. D.2. Impact of binary-stripped star wind variations on the centralmass fractions at the moment of core helium depletion. Open and filledcrosses indicate the central mass fractions of 12C and 16O, respectively.Grey crosses show variations for binary-stripped star models when wedecrease the strength of the winds after Roche-lobe overflow by a con-stant factor indicated on top of the vertical lines. For reference, we showa single (light blue) and binary-stripped (red) star model with the sameinitial mass of 11 M� (top panel) and 20 M� (bottom panel). In the bot-tom panel, we also compare the binary-stripped star models to a singlestar model with the same reference core mass of 6.3 M� with an initialmass of 16 M�.
oxygen-rich layer. From point 6 to 9, the silicon-rich outer layersturn into iron-group elements.
Article number, page 27 of 29

A&A proofs: manuscript no. manuscript_single_vs_binary
1.0
1.0
1.5
1.5
2.0
2.0
2.5
2.5
3.0
3.0
3.5
3.5
4.0
4.0
m [M⊙]
0.0
0.2
0.4
0.6
Abu
ndan
ce
1H
12C
Single Mi = 11M⊙wind ×0.1wind ×0.33wind ×0.5wind ×0.75Binary-stripped Mi = 11M⊙wind ×1.25wind ×2wind ×3
0
0
2
2
4
4
6
6
8
8
10
10
12
12
m [M⊙]
0.0
0.2
0.4
0.6
Abu
ndan
ce
1H
12C
Single Mi = 16M⊙Single Mi = 20M⊙
wind ×0.1wind ×0.33wind ×0.5wind ×0.75Binary-stripped Mi = 20M⊙
wind ×1.25wind ×2wind ×3
Fig. D.3. Impact of binary-stripped star wind variations on the composition profiles at the moment of core helium depletion as a function of themass coordinate. We show our reference single (blue) and binary-stripped (red) star models with the same initial masses of 11 M� (top panel) and20 M� (bottom panel). In gray, we show how the profiles of the binary-stripped star models change when we vary the wind mass loss rates by thefactor indicated in the legend. Dashed and full lines indicate the mass fractions of 1H and 12C, respectively. The mass extent of the carbon-richlayer increases with higher wind mass loss rates. The surface of the stellar models is indicated with a colored circle. In the top panel, we limit themass range for clarity, and do not show the entire hydrogen layer of the single star model.
Article number, page 28 of 29

E. Laplace et al.: Different to the core: the pre-supernova structures of massive single and binary-stripped stars
0 2 4 6 8m [M⊙]
−10.0
−7.5
−5.0
−2.5
0.0
2.5
5.0
7.5
10.0
log 1
0(ρ
/[g
cm−
3 ])
Mi = 11M⊙default, singledefault, binary-stripped
1500 km s−1, single
1500 km s−1, binary-stripped
0.0 0.5 1.0m [M⊙]
8.5
9.0
9.5
10.0
log 1
0(ρ
/[g
cm−
3 ])
Fig. E.1. Impact of the chosen definition for the onset of core collapse.We show the density profiles of a single (blue) and binary-stripped (red)star models with the same initial mass of 11 M�. Full lines show our de-fault assumption (when the infall velocity of the iron-rich core reaches1500 km s−1). The inset highlights the differences in the center.
0 2 4 6 8 10M /M⊙
−7.5
−5.0
−2.5
0.0
2.5
5.0
7.5
10.0
log 1
0(ρ
/[g
cm−
3 ])
Mi = 14.5M⊙
0.0 0.5 1.0m [M⊙]
8.5
9.0
9.5
10.0
log 1
0(ρ
/[g
cm−
3 ])
Fig. E.2. Same as Fig E.1 for a single and binary-stripped star modelwith the same initial mass of 14.5 M�.
Fig. F.1. Evolution of the interior composition structure of an examplesingle star model with an initial mass of 11 M� after core oxygen de-pletion. From diagram 1 to 3 core silicon burning occurs, leading to thecreation of 44Fe. The silicon-burning shell of the star merges with theoxygen-rich layers above between point 4 and 5, leading to the creationof 28Si, 32S, 36Ar, 40Ca, and 44Fe in the oxygen-rich layer. From point6 to 9, the outer layers of the silicon-rich region turn into iron-groupelements.
Article number, page 29 of 29