Embed Size (px)
Citation preview

Different ExpressionMultiple Hypothesis Testing
STAT115
Spring 2012
Tongji 20092
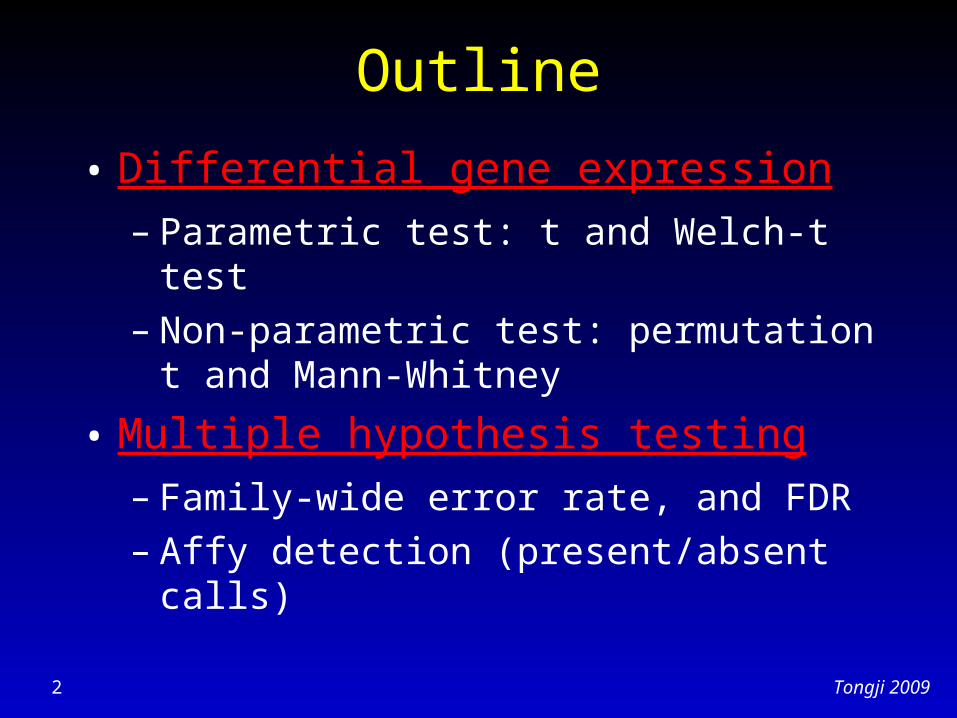
Outline
• Differential gene expression– Parametric test: t and Welch-t test– Non-parametric test: permutation t and Mann-
Whitney
• Multiple hypothesis testing– Family-wide error rate, and FDR– Affy detection (present/absent calls)

Tongji 20093
Normalized & Summarized Data 5 Normal and 9 Myeloma (MM) Samples
Samples
Gen
es
probe set Normal m412aNormal m414aNormal m416aNormal m426aNormal m430aMM m282 MM m331aMM m332aMM m333aMM m334aMM m353aMM m408aMM m423aMM m424a39089_at 89.31 143.37 111.61 134.78 121.57 104.02 101.11 105.16 121.21 176.72 117.16 137.19 109.5 109.0635862_at 95.05 107.04 71.06 100.63 117.58 103.96 95.2 114.35 95.03 90.32 93.13 88.61 90.87 112.9541777_at 22.76 20.05 21.37 25.55 30.8 20.75 21.95 28.82 30.85 28.81 22.65 18.91 22.58 21.6538250_at 53.55 62.89 29.36 62.74 36.14 60.07 37.46 42.85 27.86 41.48 116.4 46.39 38.9 29.11656_at 177.69 177.65 167.15 166.04 155.07 180.4 136.47 200.4 201.8 138.38 165.92 176.25 162.85 156.17332_at 128.5 98.29 130.58 111.49 103.56 115.47 121.01 134.5 118.85 88.71 105.08 93.28 113.18 140.1339185_at 107.86 114.02 104.08 108.89 112.75 113.61 120.9 120.1 113.82 102.72 109.81 104.86 104.4 95.53514_at 69.21 51.43 92.43 69.21 55.46 58.43 73.9 74.58 88.07 57.01 79.11 53.63 53.43 69.6235010_at 65.34 42 48.14 52.85 59.07 49.62 62.59 68.39 55.57 47.92 46.97 49.73 44.7 55.7334793_s_at 9.95 9.12 10.45 14.65 21.91 13.2 14.02 17.15 9.05 10.66 8.24 13.43 17.17 15.9733277_at 153.21 120.52 136.7 113.79 110.23 140.96 153.44 149.59 119.14 98.57 156.85 101.86 117.28 104.7234788_at 167.66 172.86 142.6 199.39 195.34 156.66 173.96 159.16 207.34 154.18 158.59 151.91 171.65 246.112053_at 91.76 111.82 99.57 95.58 87.17 123.15 82.24 93.92 97.76 114.66 80.33 107.65 89.78 85.4133465_at 63.37 45.24 54.72 56.74 58.16 59.55 63.43 71.55 55.76 46.63 49.78 40.49 44.5 69.3341097_at 145.34 148.08 171.78 151.96 128.26 138.98 148.45 160.25 169.47 133.5 166.24 135.37 159.2 129.9632394_s_at 449.9 1190.09 429.93 1034.13 196.52 214.51 220.81 331.66 652.66 488.37 699.41 1903.88 843.79 575.161969_s_at 30.03 34.58 59.76 32.84 46.98 51.34 40.4 41.75 31.8 36.74 62.42 40.4 36.37 26.0639225_at 43.19 82.15 97.56 78.3 57.23 65.29 75.14 54.5 58.35 62.47 124.64 56.42 90.55 57.2836919_r_at 36.45 26.84 37.94 35.79 38.86 33.99 28.94 32.57 39.61 32.08 31.37 36.58 44.33 36.9933574_at 16.14 12.58 10.93 14.65 29.64 19.38 14.65 15.29 16.14 19.72 11.23 12.6 18.2 24.0436271_at 41.71 25.8 39.79 49.71 52.64 33.5 48.33 41.15 48.74 45.12 36.5 38.58 55.99 29.73490_g_at 83.48 103.93 121.57 80.05 73.81 115.47 106.57 96.19 101.49 78.5 86.13 71.87 83.73 93.641654_at 78.63 82.7 93.15 73.96 73.82 104.4 100.39 91.78 82.26 63.21 76.23 56.97 76.2 73.0441207_at 100.27 80.62 84.98 75.44 74.26 95.56 96.83 100.36 85.12 71.34 81.04 75.81 70.77 70.8140080_at 172.83 106.63 122.03 118.12 131.15 153.53 150.19 161.04 123 101.64 142.03 110.02 113.58 117.1838699_at 69.1 67.16 62.73 67.46 74.03 61.16 75.27 75.7 63.2 68.12 57.25 65.42 70.71 75.81698_f_at 21.36 43.88 30.5 65.43 35.73 44.05 32.34 35.17 33.89 62.61 34.72 42.49 32.13 37.5136036_at 105.59 71.45 88.72 79.84 75.78 95.13 115.07 100.81 84.13 69.87 76.51 71.58 72.16 73.8540720_at 104.84 175.9 186.87 65.58 64 204.55 89.48 110.87 99 59.84 138.3 59.43 197.43 118.3232194_at 34.01 165.32 153.91 59.4 43.4 98.5 59.53 43.28 47.98 63.09 217.29 127.38 79.38 82.0431499_s_at 42.66 36.26 47.61 43.35 48.55 40.87 52.57 53.86 41.41 40.08 44.22 35.6 43.32 41.4841685_at 25.07 14.68 22.41 22.98 19.79 22.21 21.85 25.12 20.27 18.44 20.37 12.85 22.02 25.9131788_at 115.87 151.38 103.33 144.45 138.01 125.9 132.74 121.06 113.56 114.21 149.88 199.76 121.17 96.031719_at 15.65 18.26 16.74 21.49 15.16 11.49 17.52 21.35 19.36 20.6 15.13 14.3 18.77 18.49973_at 169.15 142.44 164.57 129 151.38 189.15 171.12 169.57 139.02 140.37 145.62 145.17 130.23 132.35

Tongji 20094
Identify Differentially Expressed Genes
• Understand what is the difference between two conditions / samples– Disease pathways
• Find disease markers for diagnosis– Diagnosis chips
• Interested in genes with:– Statistical significance: observed differential
expression is unlikely to be due to chance– Biological significance: observed differential
expression is sufficient of biological relevance

Tongji 20095
Classical study of cancer subtypes
Golub et al. (1999)
Identification of Diagnostic Genes

Tongji 20096
Identify Differentially Expressed Genes
• Fold change• Parametric test (assume expression value follows
normal distribution)– T test and Welch-t test
• Non-parametric test (no assumption of expression distribution)– Permutation t-test and Mann-Whitney U (Wilcoxon
rank sum) test
• Non-parametric is good only if you have plenty of samples to choose from– Expression with 3 treatment and 3 controls are better
off with regular t or Welch-t statistic
Tongji 20097
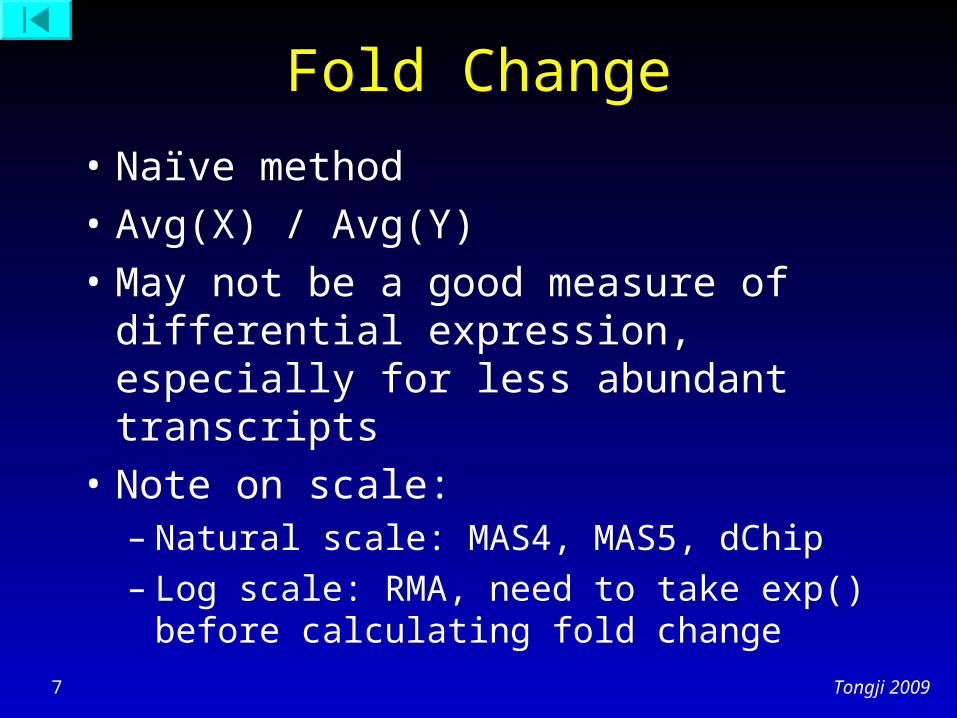
Fold Change
• Naïve method
• Avg(X) / Avg(Y)
• May not be a good measure of differential expression, especially for less abundant transcripts
• Note on scale:– Natural scale: MAS4, MAS5, dChip– Log scale: RMA, need to take exp() before
calculating fold change
Tongji 20098
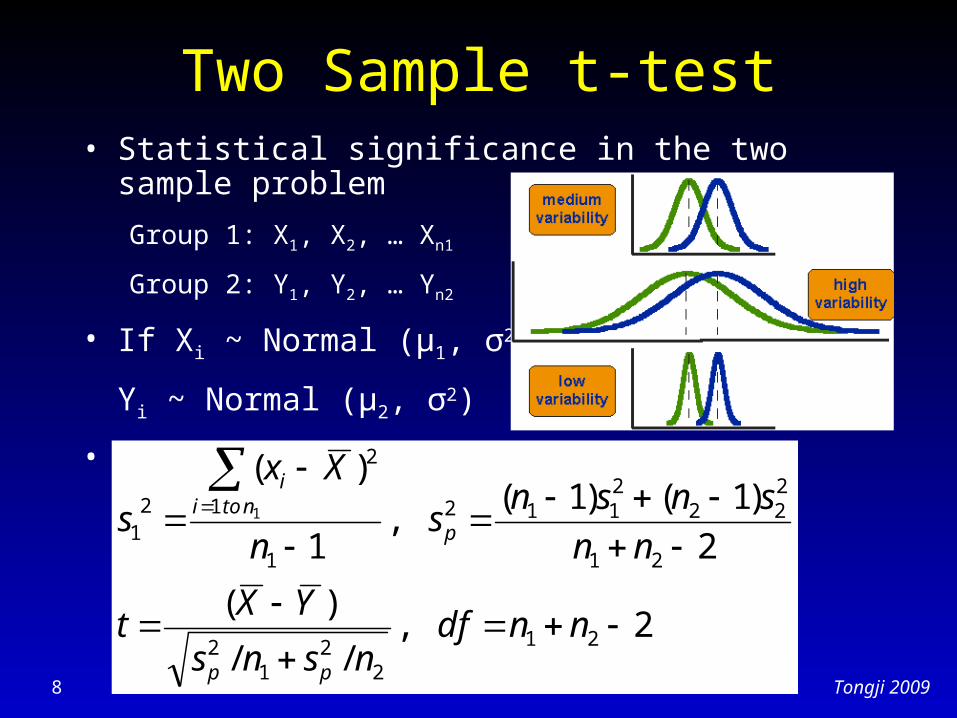
Two Sample t-test• Statistical significance in the two sample problem
Group 1: X1, X2, … Xn1
Group 2: Y1, Y2, … Yn2
• If Xi ~ Normal (μ1, σ2),
Yi ~ Normal (μ2, σ2)
• Null hypothesis of μ1= μ2
2,//
)(
2
)1()1(,
1
)(
21
22
12
21
222
2112
1
1
2
21
1
nndfnsns
YXt
nn
snsns
n
Xx
s
pp
pntoi
i

Tongji 20099
Two Sample t-test• Statistical significance in the two sample problem
Group 1: X1, X2, … Xn1
Group 2: Y1, Y2, … Yn2
• If Xi ~ Normal (μ1, σ12),
Yi ~ Normal (μ2, σ22)
• Null hypothesis of μ1= μ2
• Use Welch-t statistic• Check T table for p-val• A gene with small p-val
(very big or small t) – Reject null– Significant difference between normal and MM
2221
21 //
)(
nsns
YXt
Tongji 200910
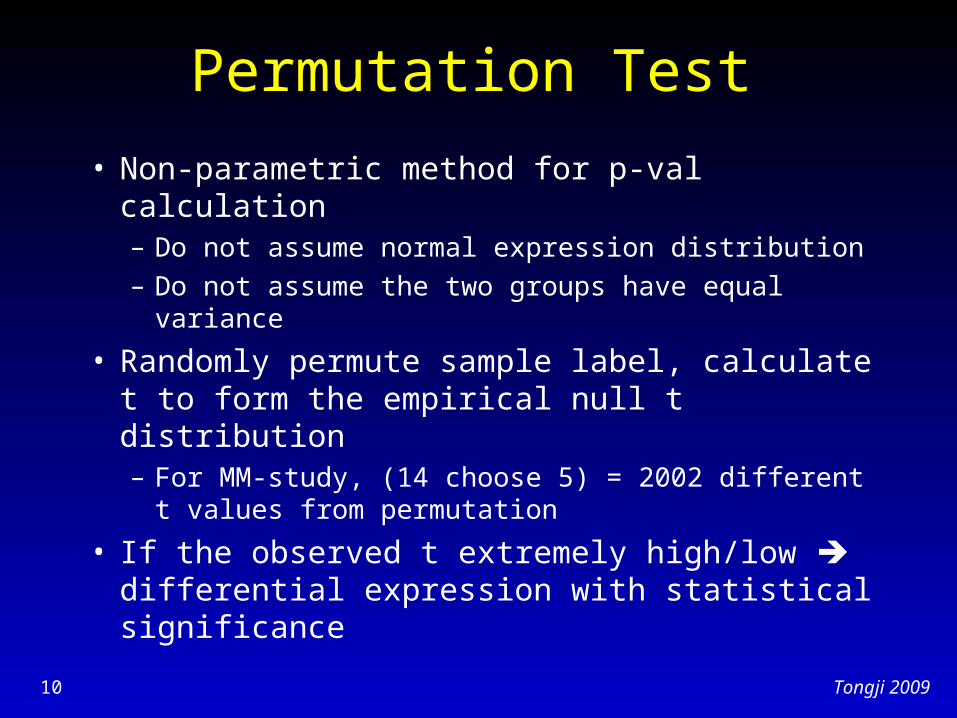
Permutation Test
• Non-parametric method for p-val calculation– Do not assume normal expression distribution
– Do not assume the two groups have equal variance
• Randomly permute sample label, calculate t to form the empirical null t distribution– For MM-study, (14 choose 5) = 2002 different t values
from permutation
• If the observed t extremely high/low differential expression with statistical significance
Tongji 200911
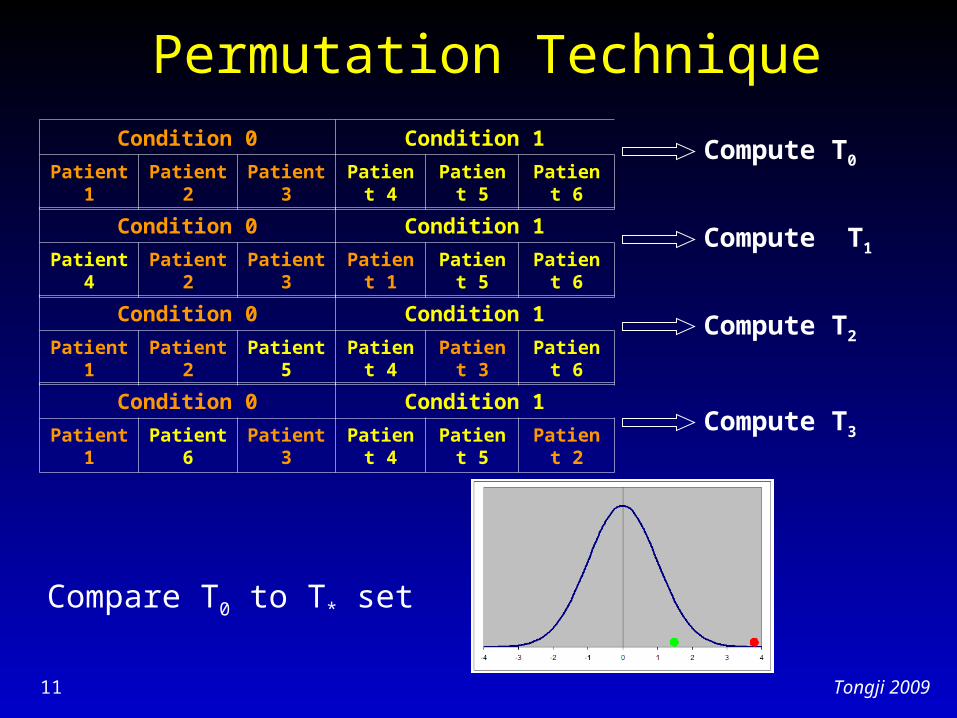
Permutation Technique
Condition 0 Condition 1
Patient 4 Patient 2 Patient 3 Patient 1 Patient 5 Patient 6
Condition 0 Condition 1
Patient 1 Patient 2 Patient 5 Patient 4 Patient 3 Patient 6
Condition 0 Condition 1
Patient 1 Patient 6 Patient 3 Patient 4 Patient 5 Patient 2
Condition 0 Condition 1
Patient 1 Patient 2 Patient 3 Patient 4 Patient 5 Patient 6Compute T0
Compute T1
Compute T2
Compute T3
Compare T0 to T* set

Tongji 200912
Wilcoxon Rank Sum Test
• Rank all data in row, count sum of ranks TT or TC
• Significance calculated from permutation as well• E.g. 10 normal and 10 cancer
– Min(T) = 55– Max(T) = 155– Significance(T=150)
• Check U table(transformation of T) for stat significance
• Intuition similarto permutation t-test
Tongji 200913
Multiple Hypotheses Testing
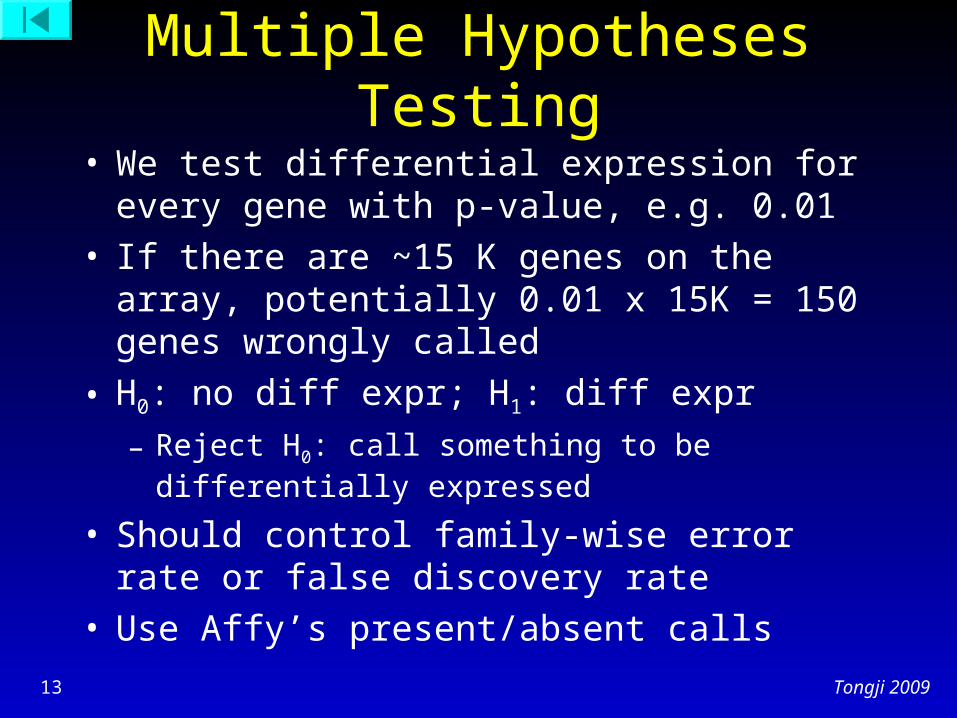
• We test differential expression for every gene with p-value, e.g. 0.01
• If there are ~15 K genes on the array, potentially 0.01 x 15K = 150 genes wrongly called
• H0: no diff expr; H1: diff expr
– Reject H0: call something to be differentially expressed
• Should control family-wise error rate or false discovery rate
• Use Affy’s present/absent calls

Tongji 200914
Family-Wise Error Rate
• P(false rejection at least one hypothesis) < αP(no false rejection ) > 1- α
• Bonferroni correction: to control the family-wise error rate for testing m hypotheses at level α, we need to control the false rejection rate for each individual test at α/m
• If α is 0.05, for 15K gene prediction, p-value cutoff is 0.05/15K = 3.33 E-6
• Too conservative for differentially expressed gene selection

Tongji 200915
False Discovery Rate# not rejected
Not called
# rejectedCalled
Total
# H0
Two groups similar
U V m0
# H1
Two groups different
T S m1
Total m - R R m
V: type I errors, false positivesT: type II errors, false negativesFDR = V / R, FP / all called

Tongji 200916
False Discovery Rate
• Less conservative than family-wise error rate
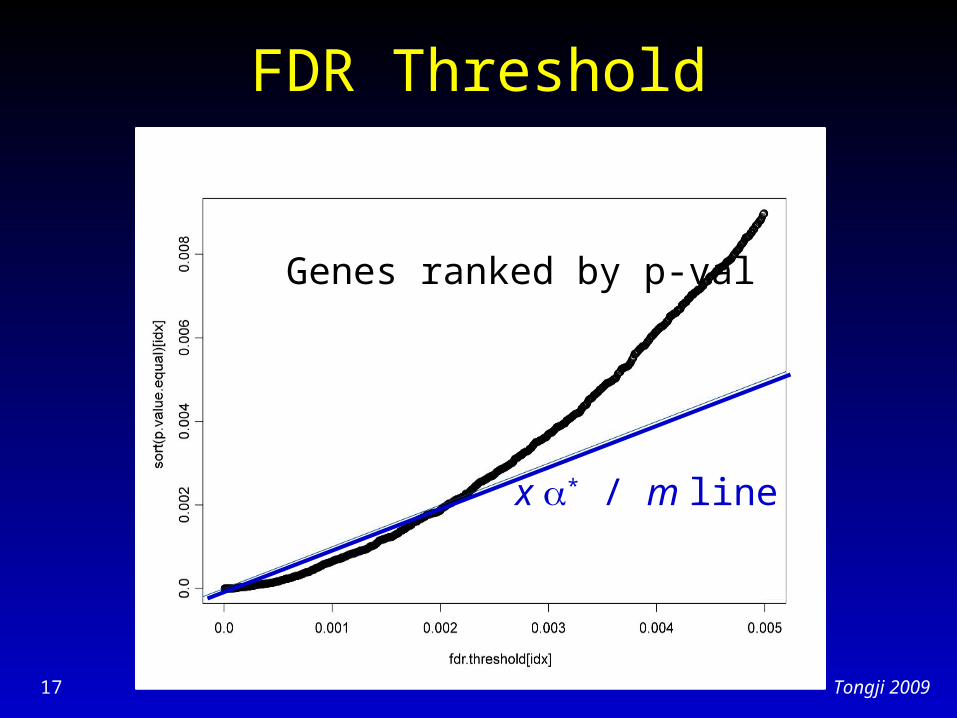
• Benjamini and Hochberg (1995) method for FDR control, e.g. FDR ≤ *
– Draw all m genes, ranked by p-val– Draw line y = x * / m, x = 1…m– Call all the genes below the line
Tongji 200917
FDR Threshold
Genes ranked by p-val
x * / m line
Tongji 200918
SAM for FDR Control
• Statistical Analysis of Microarrays (SAM), Tusher et al. PNAS 2001– With small number of samples, there could be
small and very big t by chance– SAM: modified t*, increase based on of
other genes on the array (i.e. lowest 5 percentile of )
– Proceeds with regular FDR

Tongji 200919
Q-value• Storey & Tibshirani,
PNAS, 2003• Empirically derived
q-value• Every p-value has its
corresponding q-value (FDR)
• FDR’s academic vs practical values
Tongji 200920
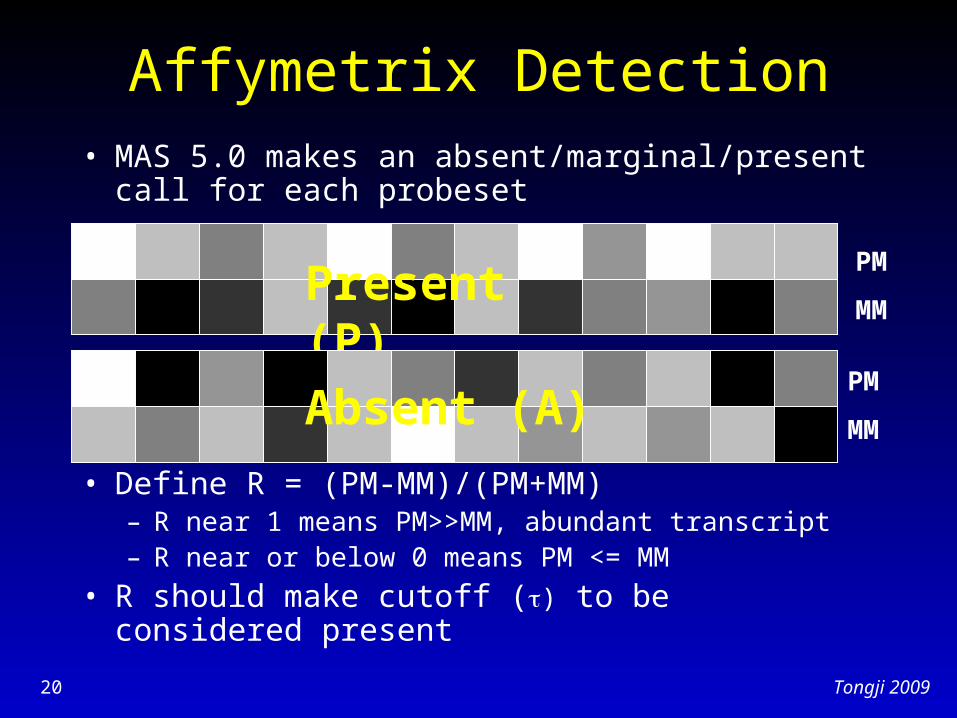
Affymetrix Detection• MAS 5.0 makes an absent/marginal/present call
for each probeset
• Define R = (PM-MM)/(PM+MM)– R near 1 means PM>>MM, abundant transcript– R near or below 0 means PM <= MM
• R should make cutoff () to be considered present
PM
MMPresent (P)
PM
MMAbsent (A)
Tongji 200921
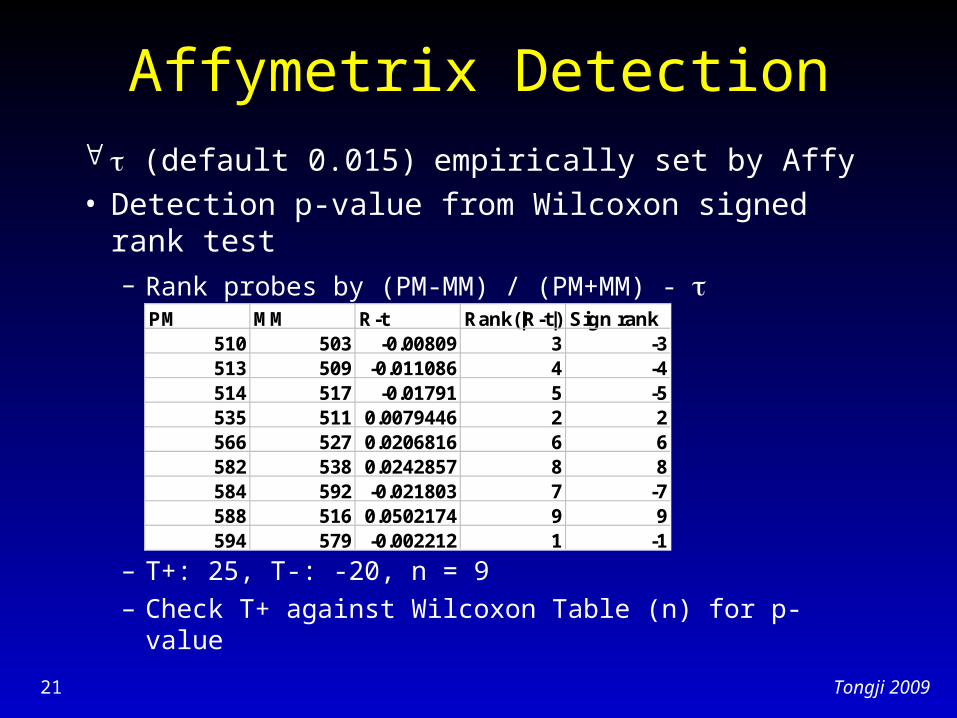
Affymetrix Detection (default 0.015) empirically set by Affy • Detection p-value from Wilcoxon signed rank test
– Rank probes by (PM-MM) / (PM+MM) -
– T+: 25, T-: -20, n = 9
– Check T+ against Wilcoxon Table (n) for p-value
PM MM R-t Rank(|R-t|) Sign rank510 503 -0.00809 3 -3513 509 -0.011086 4 -4514 517 -0.01791 5 -5535 511 0.0079446 2 2566 527 0.0206816 6 6582 538 0.0242857 8 8584 592 -0.021803 7 -7588 516 0.0502174 9 9594 579 -0.002212 1 -1

Tongji 200922
Affymetrix Detection 1 and 2 are user defined
values but have optimized defaults in MAS5
• Since expression index for low abundant transcripts is unreliable, it is better to find differentially expressed genes only from present call genes
• Increasing can reduce FDR, but true present calls could be lost
Present Marginal Absent Default: 0.04 0.06
1 2
P-value of a probe set
Tongji 200923
Outline
• Differential gene expression– Parametric test: t and Welch-t test– Non-parametric test: permutation t and Mann-
Whitney
• Multiple hypothesis testing– Family-wide error rate and FDR– Find diff expr genes only on Affy present calls

Tongji 200924
Acknowledgment• Kevin Coombes & Keith Baggerly• Mark Craven• Georg Gerber• Gabriel Eichler• Ying Xie• Terry Speed & Group• Larry Hunter• Wing Wong & Cheng Li• Mark Reimers• Jenia Semyonov