Embed Size (px)
Citation preview

The world according to shoppers
A study conducted for The Retailing Research Council of North America by TNS NFO
Different days,
different needs

Introduction Whose agenda is it anyway?
Chapter 1 4The climate is pressuredHow’s the weather out there?
Chapter 2 10Same shopper, different dayNeed states and shopping occasions
Chapter 3 21Mapping supermarket performance against the world according to shoppers
Chapter 4 32Translating need statesinto competitive advantage
Online Tool Available 37Bringing the world accordingto shoppers into your business
Contents

1
The supermarket’s share of the total grocery businesshas declined broadly in recent years. The averagenumber of visits made by U.S. households to super-markets fell from 85 in 1998 to 72 in 2003. Consumershave moved a significant portion of their groceryspending to other types of stores. The broad questionthat The Coca-Cola Retailing Research Council of NorthAmerica confronted was this: How can supermarketsdevelop a clearer and more relevant connection withtoday’s consumers?
The strengths and weaknesses of new competitors—supercenters, warehouse clubs, health food supermar-kets, etc.—are well understood in terms of price, variety,quality, and service. But is this understanding enough?As members of the Council debated this issue, itbecame clear that the answer was “no,” and that currentthought processes may even be limiting our ability todevelop the most effective responses.
Whose agenda is it anyway?
Introduction
Supermarket trips per household per year
Source: ACNielsen,
“Channel Blurring.”
85 8378 75 73 72
1998 1999 2000 2001 2002 2003

Introduction Whose agenda is it anyway? 2
Early discussions focused on new competitors “stealing our customers,” but it didn’ttake long to realize that these were not really OUR customers. They are customersmaking their own decisions about how best to satisfy their needs at the range of dif-ferent stores available to them. Despite the fact that some of these stores have nar-rower product offerings than supermarkets, in some respects they do a better job ofserving specific consumer needs.
Today, most supermarket executives and managers still tend to think about compe-tition in “supermarket” terms: We believe that consumers are attracted to supermar-kets on the basis of price, comparable national brands and private-label products,store cleanliness, service, store hours, and quality of perishables. These are importantconsiderations, but they are standards developed during a time when supermarketswere the obvious choice for grocery shopping. Do they speak meaningfully to today’sconsumer needs? Has the consumer quietly left the building while we have been talk-ing about “our” customers and competing with each other? Whose agenda is it any-way? Ours—or the consumer’s?
Shoppers’ lifestyles and needs have changed a great deal over the last 10–20 years,and the supermarket’s declining share of business suggests that it hasn’t kept pacewith the new needs and choices.
The Council saw a need to broaden and update our understanding of the consumer’sagenda for grocery shopping. Doing so provoked a shift in perspective from “the worldaccording to supermarkets” to “the world according to shoppers.” The resulting studyfocused on developing a deeper understanding of the needs experienced by con-temporary consumers, rather than competition among supermarkets—because in theworld according to shoppers, there are many places to grocery shop.
Understanding the needs that drive shoppers’ choices can enable supermarkets toidentify new opportunities for growth, and help them avoid spending time, money,and resources on efforts that have little meaning for consumers.
The study explored the following questions:
How are lifestyle and other pressures affecting store selection and shopping behavior?
How do today’s consumers describe their needs? How do those needs influencedecisions about where to shop?
How does supermarket performance map against the world according to shoppers?
How can understanding need states translate into competitive advantage?

3
Study methodology:
TNS NFO conducted the study using its online panel ofapproximately one million U.S. shoppers to:
Profile the grocery shopping of more than 3,000households.
Conduct two week-long, online focus groups.
Survey more than 1,500 households on their behav-ior and attitudes toward meal preparation and groceryshopping, including:
Exploring their two or three most recent groceryshopping trips, focusing on the needs householdswere trying to satisfy and the experiences they hadin specific stores.
Capturing the performance of individual stores insatisfying consumer needs.
Inventorying the importance of store attributes.
Analyze the shopping behavior toward supermarketsand non-supermarket competition using the TRI*MSystem to measure the intensity of shopper commit-ment to different types of stores. The TRI*M Systemis more fully explained in Chapter 3.
The study asked the following questions for 4,200 dif-ferent shopping trips.
What needs were you trying to satisfy on this shop-ping trip?
What did you personally want to accomplish on thisshopping occasion?
At what location(s) did you shop on this trip?
At which location did you spend the most money?
Why did you choose to shop at this location for thisshopping occasion?
How were you feeling during the shopping trip?
What types of products did you purchase?
In total, how much did you spend?
What time of day and day of week was this?
Was the trip made alone or with other people?
How do you rate the outlet where you did most ofyour spending in terms of overall performance, likeli-hood to recommend to others, likelihood to shopthere again, and its advantages versus other outletsfor this type of shopping occasion?
This detailed approach ensured that the informationgathered related to specific shopping decisions, notgeneralizations, and that it measured specifically whatconsumers said they did versus generalizations aboutoverall shopping.
Study objective:
To identify actionable new consumer insights on theneeds consumers are striving to satisfy when groceryshopping, and develop a framework that individual retail-ers can use to identify better ways to satisfy these needs.

4
Chapter 1 The climateis pressured

5
Changing lifestyles are a major factor driving the shifting patterns of grocery shopping.The study provided solid evidence that consumers are experiencing four powerfulpressures driven by current U.S. lifestyles. These broad pressures affect nearly allshoppers, whatever their traditional demographic grouping.
Today, consumers are defining “the best value” in their own terms. Whether shoppershave more or less money to spend than they did a few years ago, they want to spendit wisely. It’s become increasingly difficult to use income alone as an accurate predic-tor of spending decisions.
Time limitations have a huge influence on grocery shopping behavior. In most families,both parents work outside the home. Many people are working longer hours, yet theirother chores are no less time-consuming. As a result, consumers have become moreimpatient and less tolerant of delays—they want what they want, they want it right,and they don’t want to wait for it.
A powerful need to “take care of me” has grown out of the combined pressures ofmaking money and juggling time. As consumers struggle to balance externalresponsibilities and personal needs, guilt-free personal indulgences and a little “timefor myself” are two ways this plays out when people shop for groceries.
Connecting with and caring for the family has also become more pressured as a resultof juggling time and money. Children typically receive more focus—if not attention—than they did a generation ago, and adults are looking for new ways to maintainand fulfill their relationships and responsibilities within the family.
How’s the
weather
out there?
Money
Time
Self care
Care for family

Chapter 1 The climate is pressured 6
Although overall income has grown steadily, the top-earning 20% of households have captured more of thegains. This means the overwhelming majority of house-holds haven’t experienced much increase in spendingpower. No matter how you look at it, four out of five NorthAmerican households experience some form of moneypressure—and the percentage may be even higher.
As stated earlier, income alone is no longer as reliable apredictor of spending decisions as it once was. Newretail options offer shoppers opportunities to trade up ortrade down in ways that are not available in supermar-kets. Consumers can trade down to stores that offerextremely low price points, such as warehouse and dol-lar stores. And they can trade up to specialty marketsoffering premium-quality products that tap into strongemotions not normally associated with buying groceryproducts, such as pride, status, and indulgence. Thenew players pose a challenge for “middle-of-the-road”supermarkets because they tend to polarize the shop-per’s attention on the two extremes, leaving stores “in the middle” without a clear, compelling appeal.
How do household money pressures influence groceryshopping decisions today?
75% of shoppers believe that “stores differ significantly”in their pricing of grocery products. Whether consumersare on a budget or not, they report that an important goalof 50% of their shopping trips was to save “as much aspossible”; 36% of households in the study report thatthey “stay within a firm grocery budget.”
Even with the pressure of limited time, 46% of thehouseholds report that they “buy groceries in severalstores to take advantage of the best deals.” The truenumber may be even higher; shoppers who said theyshopped two stores over a three-month period actuallyshopped at four.
43% of households report that they typically plan to dotheir major grocery shopping after payday. This remainsa powerful trigger for stock-up shopping, despite thefact that many of these households are not living pay-check to paycheck.
Savings are
important.
Store-hopping
is common.
Some shopping is
paycheck-driven.
Money pressure
Lowest20%
202
Second-Lowest 20%
209
Middle20%
229
Second-Highest
20%
270
Highest20%
100
1971
207
2001
100
1971 2001
100
1971 2001
100
1971 2001
100
1971 2001
Indexed real income growth by household, 1971–2001 (in 20% groupings) Index: 1971=100.
Source: Willard Bishop Consulting
analysis of U.S.Census data.

7
Unrelenting time pressure has a huge impact on groceryshopping experience. The most frequently reportednegative feelings relate to the time pressures that shop-pers encounter while shopping. This greatly exceedsany store characteristic or store problem. Time is the“unpackaged” commodity.
Some shoppers have already taken it into their ownhands to minimize this discomfort.
Almost 60% make a conscious effort to plan theirshopping during times when stores are not crowded.
About one-third of shopping trips now include thegoal of reducing the need for an additional trip bybuying everything in this one.
Time pressures influence consumer grocery shoppingdecisions in at least three ways.
The traditional supermarket—particularly the combina-tion food/drug store—used to be the place for one-stopshopping. The availability of larger stores offering moreextensive non-grocery choices changes this tradition.The survey found that one-third of grocery shoppingtrips today are driven by the desire to buy groceries anda range of general merchandise at the same store.
Consumers strongly dislike hunting for products theyknow they want. For about half the trips, shoppersreportedly selected the store because they believed they could quickly find the products they wanted.Thisputs a premium on making it easy and intuitive for first-time shoppers to find what they’re looking for.
Every retailer knows this, but consumers report that fastcheckout is critical—40% become impatient if they haveto wait in line “more than a minute.” To get in and outfaster, a surprising number are willing to pitch in: 36%indicated that they wanted self-checkout available.
Time pressure
The definition of
one-stop shopping
is changing.
Easy shopping
is expected.
Fast checkout
is a must.
Chapter 1 The climate is pressured 8
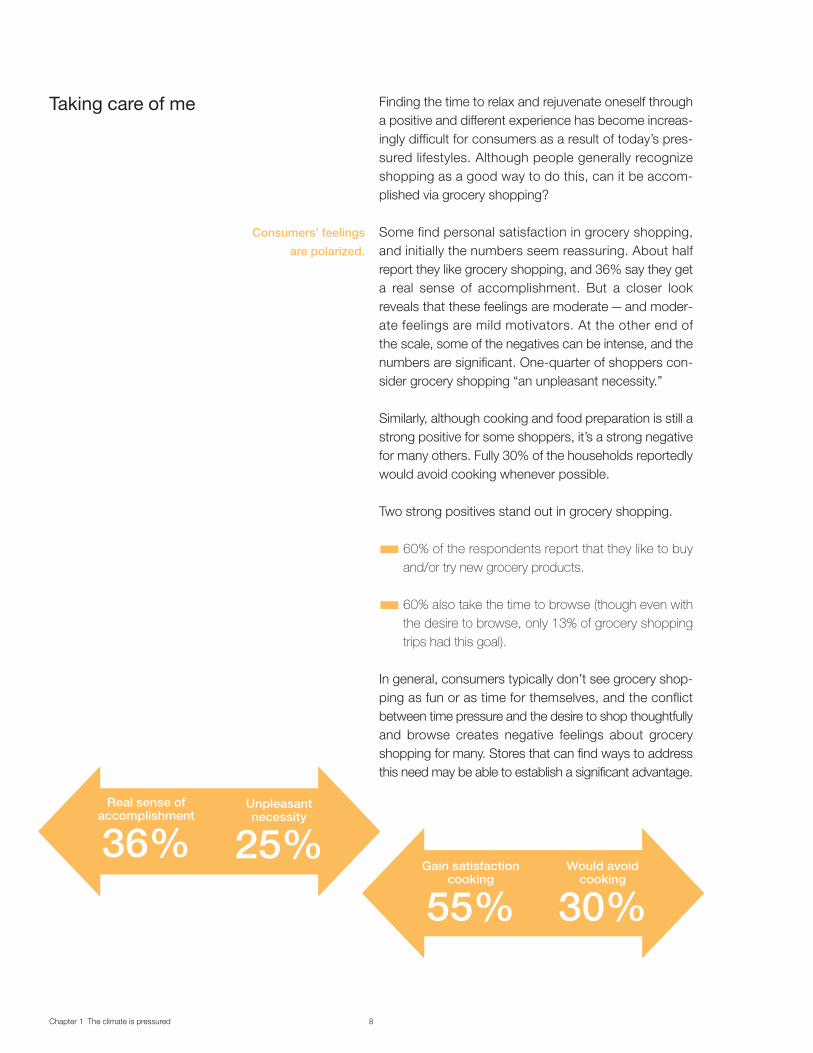
Finding the time to relax and rejuvenate oneself througha positive and different experience has become increas-ingly difficult for consumers as a result of today’s pres-sured lifestyles. Although people generally recognizeshopping as a good way to do this, can it be accom-plished via grocery shopping?
Some find personal satisfaction in grocery shopping,and initially the numbers seem reassuring. About halfreport they like grocery shopping, and 36% say they geta real sense of accomplishment. But a closer lookreveals that these feelings are moderate—and moder-ate feelings are mild motivators. At the other end ofthe scale, some of the negatives can be intense, and thenumbers are significant. One-quarter of shoppers con-sider grocery shopping “an unpleasant necessity.”
Similarly, although cooking and food preparation is still astrong positive for some shoppers, it’s a strong negativefor many others. Fully 30% of the households reportedlywould avoid cooking whenever possible.
Two strong positives stand out in grocery shopping.
60% of the respondents report that they like to buyand/or try new grocery products.
60% also take the time to browse (though even withthe desire to browse, only 13% of grocery shoppingtrips had this goal).
In general, consumers typically don’t see grocery shop-ping as fun or as time for themselves, and the conflictbetween time pressure and the desire to shop thoughtfullyand browse creates negative feelings about groceryshopping for many. Stores that can find ways to addressthis need may be able to establish a significant advantage.
Taking care of me
Real sense of accomplishment
36%Unpleasant necessity
25%Gain satisfaction
cooking
55%Would avoid
cooking
30%
Consumers’ feelings
are polarized.

9
Many consumers just don’t have as much time as they’dlike to spend with and take care of their families. They arestill committed, but today’s lifestyles present roadblocks.
Almost 60% of shoppers report that “everyone in ourhouse eats together most days of the week.” A worth-while question for supermarkets is, “Who’s doing thecooking?” While only one-third of households describethemselves as buying prepared or take-out food “often,”the survey found that in reality 84% of those householdsbought one or more take-out or delivery meals in atypical week.
When consumers can’t spend time with family, the prod-ucts they buy can serve as a way to connect. They likebeing appreciated by family members for bringing homefavorite foods, products, and treats. “Thanks, Mom”means a lot.
Store selection and shopping behavior are influenced bythe following.
It may sound old-fashioned, but 43% of stores chosenfor grocery shopping are selected because “it’s thestore I trust.”
Families are top-of-mind in terms of the specific goalsbehind many shopping trips: 47% of trips include thegoal of satisfying the needs of family and household, and32% of trips include the explicit goal of taking good careof family or household.
Consumers use grocery shopping to buy products thatexpress their personal feelings to family and householdmembers. 60% report that they buy treats or rewards forfamily while grocery shopping.
Family pressure
Trust matters.
Family is the focus.
Shopping provides
an opportunity
to connect.

10
friday
monday
Chapter 2
tuesday
wednesday
thursday
saturday
sunday

11
In “the world according to supermarkets,” consumerneeds are traditionally understood by grouping shoppersinto segments based on household characteristics:gender, age, marital status, income, job status, ethnic-ity, education, geographic location, and the presence orabsence of children in the household. Within eachgrouping, needs are by and large considered homoge-nous. This approach worked fairly well when supermar-kets were the obvious choice for grocery shopping. Butwhen consumers step out of their doors with keys inhand today, they see an array of stores that can bettersatisfy at least some of their shopping needs.
In “the world according to shoppers,” the needs thatconsumers bring to particular shopping occasionsstrongly influence the store choices they make—and thesame shopper has different needs from day to day andoccasion to occasion. Saturday they may be trying tostock up so they won’t have to do major grocery shop-ping for several weeks. On Thursday, they may need to stop in for one quick sack of supplies for dinner.Tuesday, they may make an emergency trip to fill a pre-scription. By all the traditional measurements listedabove, it’s the same shopper, but on each occasion theneeds are different. And each occasion is an opportunityto choose a store.
By shifting perspective from “the world according tosupermarkets” to “the world according to shoppers,”the industry stands to gain greater relevance for today’sconsumers. Recognizing and responding to shoppers’need states (rather than viewing them only through ademographic lens) can translate into increased traffic,greater consumer satisfaction, and higher revenues.
The nine need states identified on the following pagesare the result of the study’s deep dive into the last two orthree shopping occasions for more than 1,500 house-holds. Detailed information on more than 4,200 shop-ping occasions revealed:
which driving needs—both emotional and rational—shoppers were trying to satisfy for their households
what the shopper personally wanted to accomplish
the store where they did most of their groceryshopping on that occasion
the reasons for shopping at that store
trip profiles, i.e., when, how much spent, types ofproducts purchased
an assessment of the overall trip experience
Same shopper, different day
Need states
and shopping
occasions

Chapter 2 Need states and shopping occasions 12
Care for Family
Shoppers in this need state are driven to do the best they can for their families.
To please household members To do the right thingTo keep a wide variety of foods on hand
“I buy what people ask for and what I think will pleasethem, but I always make a decision that ensures it’sgood for them.”
Appreciation from family members The satisfaction of a job well done
These trips take time, so the quality of the shoppingexperience is important.
These shoppers only go to a couple of trusted stores for groceries and usually walk through every aisle.Household members influence the brands and productsthey buy. Serving nutritious and balanced meals is a highpriority. They frequently cook from scratch and keep theirkitchens well stocked. Most days everyone in the house-hold eats dinner together.
High-quality refrigerated and fresh products, such asfresh fish, fresh baked goods, refrigerated preparedfoods, and imported cheese
Product selectionStore atmosphere
Average spending
per shopping trip:
$110Percentage
of grocery
shopping trips:
19%Percentage
of total grocery
spending:
27%
They want:
Quote:
The reward they seek:
Other important features:
Relevant attitudes
about shopping,
meal preparation,
and cooking:
More frequently
purchased products:
Top reasons for
store choice:

13
In this need state, shoppers are laying insupplies to minimize the number of timesthey have to go to the store.
To avoid unnecessary tripsTo stock up for future use
“I don’t like to grocery shop, so on my major trips I buyeverything I can.”
To cross this task off their list
These shoppers don’t get any enjoyment out of groceryshopping. Though they plan their trips, they are usuallyin a hurry and want to spend as little time as possible inthe store. Getting in and out of the store quickly is ahigh priority.
Frequent Efficient Stock-Up shoppers usually decidewhat to make for dinner when it’s time to cook, so theylike to keep their kitchens stocked with familiar foods andrarely buy unfamiliar ones.
Food products that don’t require a lot of time in prepara-tion such as packaged foods and frozen entrees
Product selection
Average spending
per shopping trip:
$95Percentage
of grocery
shopping trips:
13%Percentage
of total grocery
spending:
16%
They want:
Quote:
The reward they seek:
Other important features:
Relevant attitudes
about shopping,
meal preparation,
and cooking:
More frequently
purchased products:
Top reason for
store choice:
Efficient Stock-Up

Chapter 2 Need states and shopping occasions 14
Shoppers in this need state want to dothe right thing for the family, but savingmoney is important in their decisions.
To stick to a budgetTo seek out and stock up on bargainsTo keep a wide variety of items on hand
“I’m laying in supplies for the long term. I want the storeto make it easy for me to find savings.”
Proof that they’ve saved a lot on a shopping trip
As long as they are able to get the savings, these shop-pers aren’t as time-sensitive as some. Free tasting sam-ples, in-store coupon and recipe centers, and “What’sNew” sections appeal to them.
Shoppers in this need state are planners. They study adsand circulars, buy groceries at several stores to takeadvantage of the best deals, and track the money theysave from coupons. They eat together at home mostnights, try to plan nutritious and balanced meals, andmaintain well-stocked supplies.
Typically, products that deliver a lot of “value for money,”such as quality frozen foods that are promoted often
PricesStore atmosphereProduct selection
Average spending
per shopping trip:
$93Percentage
of grocery
shopping trips:
15%Percentage
of total grocery
spending:
18%
They want:
Quote:
The reward they seek:
Other important features:
Relevant attitudes
about shopping,
meal preparation,
and cooking:
More frequently
purchased products:
Top reasons for
store choice:
Smart Budget-Shopping

15
Shoppers in this need state are explorers hoping to find something new.
To see new ideas and productsTo buy grocery and non-grocery items on the same tripTo enjoy themselves and have fun
“I like to browse during my grocery shopping trips. Everytrip is a little different. I look for new ideas, new recipes,new foods—and non-grocery products like clothes.”
A surprise—and the pleasure of finding something new
Discovery shoppers enjoy grocery shopping, but are alsoattracted to the broader opportunities for discoveryoffered by supercenters and mass merchandisers.“What’s New” sections in supermarkets appeal to them.
On Discovery occasions, grocery shoppers are impulsiveand inclined to buy and try new foods and products.Often they decide what to cook for dinner at the lastmoment. New recipes and meal ideas are attractive tothem. Finding treats or rewards for family members isalso very satisfying.
Products with the potential for delivering personal satis-faction, such as specialty and natural products, as wellas higher-involvement non-foods like magazines orhigh-quality cooking utensils
Store atmosphereProduct selection
Average spending
per shopping trip:
$90Percentage
of grocery
shopping trips:
7%Percentage
of total grocery
spending:
9%
They want:
Quote:
The reward they seek:
Other important features:
Relevant attitudes
about shopping,
meal preparation,
and cooking:
More frequently
purchased products:
Top reasons for
store choice:
Discovery

Chapter 2 Need states and shopping occasions 16
In this need state, consumers focus first and foremost on one or two urgently needed items.
To satisfy an immediate need quicklyTo buy something a family member needs or wants
“I need something right away: a specific food, ingredient,prescription medicine, or alcoholic beverage. If it’s not onthe shelf, I’m likely to go to the next store.”
Finding the specific item immediatelyGetting what they need quickly and easily
This is a product-focused trip, so selection is top-of-mind; out-of-stock issues are very important. This shop-ping occasion encompasses virtually all shoppers at onetime or another and is likely to increase in frequency.People are doing less planning, and when they needsomething, they want it right away.
In this frame of mind, shoppers make a lot of little tripsfor items they run out of or will need in the next few days.Household members’ requests sometimes initiate thesetrips. Sometimes these occasions are welcome oppor-tunities to get out of the house.
Items that have a unique use and value in the householdsuch as prescriptions, over-the-counter medicines, andcertain household supplies
Product selectionConvenienceStore atmosphere
Average spending
per shopping trip:
$60Percentage
of grocery
shopping trips:
11%Percentage
of total grocery
spending:
9%
They want:
Quote:
The reward they seek:
Other important features:
Relevant attitudes
about shopping,
meal preparation,
and cooking:
More frequently
purchased products:
Top reasons for
store choice:
Specific Item

17
Shoppers in this need state don’t want to grocery shop and seek as little involvement as possible.
To make the experience as painless as possibleTo spend as little time in the store as possible
“I just don’t want to be here. I’d rather have somebodyelse do my shopping or go online.”
Getting done and getting out
While these may not be the most pleasant shoppers,they have the potential to become very loyal and veryprofitable. They are also more likely to be early adoptersof new practices like automatic checkouts and shop-ping online.
Shoppers in this state of mind often say their lives arehectic and that they are always in a hurry. They generallybuy just what the household will use for the next fewdays, and try to make meals that take less than 30 min-utes to prepare. They also seem to eat more meals awayfrom home than at home. Although all kinds of shoppersfit this profile, the occasion skews to higher-incomeshoppers who can sometimes afford to make the storetheir kitchen and buy the whole meal fresh.
Value-added foods with shorter preparation time such asfresh prepared entrees
Self-service checkoutReady-to-eat meals section
Post office/shippingHome center/hardware stores
Convenience
Average spending
per shopping trip:
$58Percentage
of grocery
shopping trips:
8%Percentage
of total grocery
spending:
4%
They want:
Quote:
The reward they seek:
Other important features:
Relevant attitudes
about shopping,
meal preparation,
and cooking:
More frequently
purchased products:
Important services:
Appealing adjacent retail:
Top reason for
store choice:
Reluctance

Chapter 2 Need states and shopping occasions 18
Shoppers in this need state look for tactical bargains on specific items asopposed to overall savings.
Savings, savings, savingsTo stock up when they zero in on a good deal
“I take pride in what I do. I like to tell my friends about thedeals I find.”
The thrill of bagging a deal
Bargain-hunters are some of the least loyal customersbecause they want only one thing—a deal. Their top rea-son for choosing a store is sales. Free tasting samples ofnew products and in-store coupon and recipe centersappeal to these shoppers.
To qualify as a great deal, products need to be of goodquality, so on these occasions consumers will hunt sev-eral stores to find the best of different types of foods.They use ads and circulars to plan major trips, likecoupons, love rebates, and track their savings.
A broad range of food products on promotion as well asspecially priced non-grocery items like photo/video,CDs, paper, and personal care products
Nearby discount stores or mass merchandisers
Sales
Average spending
per shopping trip:
$57Percentage
of grocery
shopping trips:
13%Percentage
of total grocery
spending:
10%
They want:
Quote:
The reward they seek:
Other important features:
Relevant attitudes
about shopping,
meal preparation,
and cooking:
More frequently
purchased products:
Appealing adjacent activity:
Top reason for
store choice:
Bargain-HuntingAmong Stores

19
Shoppers in this need state want to getin, grab a short list of items, and get outin a hurry.
Speed and convenienceTo buy products for near-term use
“Bread, milk, bananas, and beer. In and out in 10 min-utes. That’s what I’m here for.”
Getting what they came for quickly
Shoppers in this need state are buying things thathouseholds run out of routinely, as opposed to SpecificItem shoppers who are trying to satisfy an urgent needfor a particular product or two.
On Small-Basket Grab & Go occasions, shoppers are ina hurry, impatient, and impulsive. Convenience is impor-tant. They are less discriminating about store choices,finding convenience and drug stores logical outlets.Some are people picking up a quick sack of dinner sup-plies on the way home from work, but Small-BasketGrab & Go shopping for perishable staples is routine forothers. Younger shoppers in particular say things like“This is the way we do it—this is the way we live.” A lotof the items purchased in this need state don’t have a long shelf life and might do as well as impulse items if located near a checkout.
Regularly consumed foods that households are mostlikely to run out of, such as bananas, milk, soft drinks,and beer
BankingVideo rental
Convenience
Average spending
per shopping trip:
$41Percentage
of grocery
shopping trips:
9%Percentage
of total grocery
spending:
5%
They want:
Quote:
The reward they seek:
Other important features:
Relevant attitudes
about shopping,
meal preparation,
and cooking:
More frequently
purchased products:
Top reason for
store choice:
Small-BasketGrab & Go
Appealing adjacent activity:

Chapter 2 Need states and shopping occasions 20
In this need state shoppersseek to satisfy a craving.
To satisfy an immediate cravingTo get in and out fast
“I’m thirsty, I’m hungry, or I need cigarettes.”
Immediate gratification
Sometimes this need state piggybacks on other shop-ping occasions.
The high importance of convenience makes store selec-tion somewhat random, but certain high-traffic retailersmight find an advantage here. These shoppers like self-service checkout.
Products that supply immediate personal satisfaction,from bottled water and soft drinks to magazines, snacks,and tobacco.
Fast-food restaurantsVideo rental
Convenience
Average spending
per shopping trip:
$32Percentage
of grocery
shopping trips:
5%Percentage
of total grocery
spending:
2%
They want:
Quote:
The reward they seek:
Other important features:
Relevant attitudes
about shopping,
meal preparation,
and cooking:
Appealing adjacent activity:
More frequentlypurchased products:
Top reason for
store choice:
Immediate Consumption

21
Chapter 3 Mapping supermarket performance against the world according to shoppers
Consumers haven’t abandoned supermarkets for any of their need states; but froma need state perspective, supermarkets don’t hold the number-one share for anyshopping occasion. Non-supermarket competitors serve every need state, and someoutlets demonstrate their specialized strengths by attracting a disproportionate per-centage of shoppers in one or more need states.
The study measured two related features of supermarket performance: Where doshoppers choose to shop when they are operating in each need state? And whatquality of experience do consumers report for stores selling groceries? Since specificshopping trips were examined, it was possible to identify where shoppers actually wentand what they experienced as they operated in each of the grocery need states. Basedon the level of spending, the need states can be organized into three categories.
High-SpendCare for Family ($110 per trip)Efficient Stock-Up ($95 per trip)Smart Budget-Shopping ($93 per trip)Discovery ($90 per trip)
Medium-SpendSpecific Item ($60 per trip)Reluctance ($58 per trip)Bargain-Hunting Among Stores ($57 per trip)
Low-SpendSmall-Basket Grab & Go ($41 per trip)Immediate Consumption ($32 per trip)
The average amount of money spent on some of the occasions seems high until oneremembers that these are trips to grocery stores triggered by the respective need state.

Chapter 3 Mapping supermarket performance 22
As the chart above shows, the distribution of supermar-ket trips by need state closely parallels that for totalshopping occasions. Clearly, supermarkets serve allnine need states.
While all nine can be important, some supermarkets willfind their greatest opportunity in strengthening theircapability to attract and serve the high-spend needstates, while others will go for higher trip frequency bystressing the low-spend need states. Both strategiescan drive significant incremental sales. However, theprimary battlefield for many stores will involve the fourhigh-spend need states.
For the high-spend need states, two types of stores—supercenters and warehouse clubs —attract a largershare of trips than supermarkets.
Warehouse clubs are particularly strong in attractingCare for Family and Smart Budget-Shopping trips.
Supercenters attract one of the higher shares of tripsin the Discovery need state, and they also have morepull than supermarkets for Care for Family andEfficient Stock-Up.
Supermarkets, on the other hand, pull a little morestrongly than supercenters with trips involving SmartBudget-Shopping.
Share of shopping occasions by need state(% of trips)
Share of shopping occasions for stores that best serve High-Spend need states(% of trips)
High-Spend
Care for Family 19 20 22 26
Efficient Stock-Up 13 13 15 15
Smart Budget-Shopping 15 16 15 19
Discovery 7 6 9 9
High-Spend
Care for Family 19 20
Efficient Stock-Up 13 13
Smart Budget-Shopping 15 16
Discovery 7 6
Medium-Spend
Specific Item 11 10
Reluctance 8 8
Bargain-Hunting Among Stores 13 12
Low-Spend
Small-Basket Grab & Go 9 10
Immediate Consumption 5 5
TOTAL 100 100
Warehouse Clubs (%
)
Supercenters (%)
Supermarkets (%)
Total Occasions (%)
Supermarkets (%)
Total Occasions (%)

23
In the medium-spend need states, supermarkets alsohave strong competition.
Drug stores have done a good job of satisfyingwhat can generally be called fill-in trips. They showsurprising strength across all three medium-spendneed states.
Mass-merchant strength in the mid-spend needstates is broad, but they do not particularly dominateany individual category.
Dollar stores’ strength is concentrated in theBargain-Hunting Among Stores need state, where itmaintains a very significant share. Somewhat unex-pectedly, these stores also pull trips for shoppers onSpecific Item occasions.
In the low-spend need states, supermarkets pull a “fairshare” of trips for the low-spend need states, but twoother types of retailers are much more effective.
Drug stores’ strength in this category is concen-trated primarily in Small-Basket Grab & Go, anotherindication that they have earned the role as a fill-ingrocery outlet.
Convenience store strength for Immediate Consump-tion probably isn’t surprising, but the percentage ofSmall-Basket Grab & Go trips they pull indicates thatthey serve as an important grocery provisioner formany consumers.
Share of shopping occasions for stores that best serve Low-Spend need states(% of trips)
Share of shopping occasions for stores that best serve Medium-Spend need states(% of trips)
Medium-Spend
Specific Item 11 10 21 12 11
Reluctance 8 8 10 9 6
Bargain-HuntingAmong Stores 13 12 24 15 30
Convenience Stores (%)
Drug Stores (%)
Supermarkets (%)
Total Occasions (%)
Mass Merchandisers (%)
Dollar Stores (%)
Drug Stores (%)
Supermarkets (%)
Total Occasions (%)
Low-Spend
Small-Basket Grab & Go 9 10 17 26
Immediate Consumption 5 5 6 43

Chapter 3 Mapping supermarket performance 24
The quality of the consumer shopping experience is a good indication of how well astore is serving shopper needs. Highly satisfying experiences forge strong bonds. Lesssatisfying experiences create weaker bonds.
To arrive at an overall measure of the quality of the consumer shopping experience,the study used the TRI*M Index, a measure used for the last 10 years by businessesall over the world to assess how their customers’ experiences translate into satis-faction and loyalty.
The index used in this study combines four dimensions of grocery shopping behavior.Each gauges a different way that the shopping experience is reflected in the mind ofthe consumer:
Satisfaction—how would you rate your overall shopping experience with this typeof store on this shopping occasion?
Recommendation — how likely are you to recommend this type of store to yourfriends for shopping occasions similar to this one?
Revisit—how likely are you to shop at this type of store for future shopping occa-sions of this kind?
Advantage — given what you know about other stores, how would you rate theoverall advantage of shopping at this type of store versus another type of storefor this kind of shopping occasion?
These four sources of information are combined into a TRI*M score that providesa means for comparing the quality of shopping experiences across differentshopping options.
The TRI*M Index can range from a negative number, which seldom occurs for viablebusinesses, to a score that can exceed 100, which indicates exceptional qualityexperience. Differences of 3 or more in the TRI*M Index are significant.
All grocery-buying occasions don’t produce the same quality of experience forconsumers. Some hold the potential for more satisfaction and even enjoyment andgenerate higher-quality shopping experiences. Others don’t appear to hold the sameemotional potential and produce lower scores.
The quality
of the shopping
experience.

25
When compared to the TRI*M database of all customerstudies in North America, the TRI*M scores for all needstates fall into the top 20% range—indicating relativelyhigh-quality shopping experiences even for lower-scoring trips and store types.
The high scores generated by Smart Budget-Shopping,Discovery, and Care for Family show that consumershave particularly strong experiences when operating inthese need states.
For Small-Basket Grab & Go and Immediate Consump-tion, lower scores suggest they don’t involve muchenergy and emotion.
Across different shopping channels, there is a significantdegree of variation in the quality of experience reported.
The supermarket TRI*M score of 91 indicates thatsupermarket shoppers have a good experience and, asa result, are not actively looking for another place toshop. The challenge is that limited-assortment stores,warehouse clubs, and dollar stores generate significantlyhigher scores. These new competitors appear to haveraised the bar when it comes to shopping experience.
Supercenters and mass merchandisers generate scoresthat are close to supermarkets, indicating that eventhough they can draw the business, consumers don’thave a much stronger experience with them than theydo with supermarkets. In other words, these stores aredoing a good job of meeting consumers’ needs, but notan exceptional one.
Smart Budget-Shopping
Discovery
Care for Family
Efficient Stock-Up
Specific Item
Bargain-Hunting Among Stores
Reluctance
Small-Basket Grab & Go
Immediate Consumption
100
100
97
92
91
90
86
84
83
Quality of shopping experience by need state(TRI*M Index for all stores;
differences of 3 or more are significant)
70 to 100 = strong experience
100 plus = very strong experience
Quality of shopping experience by channel(TRI*M Index; differences of 3 or more are significant)
70 to 100 = strong experience
100 plus = very strong experience
Limited-Assortment Stores
Warehouse Clubs
Dollar Stores
Mass Merchandisers
Supercenters
Supermarkets
Drug Stores
Convenience Stores
106
101
100
93
93
91
87
80
Chapter 3 Mapping supermarket performance 26
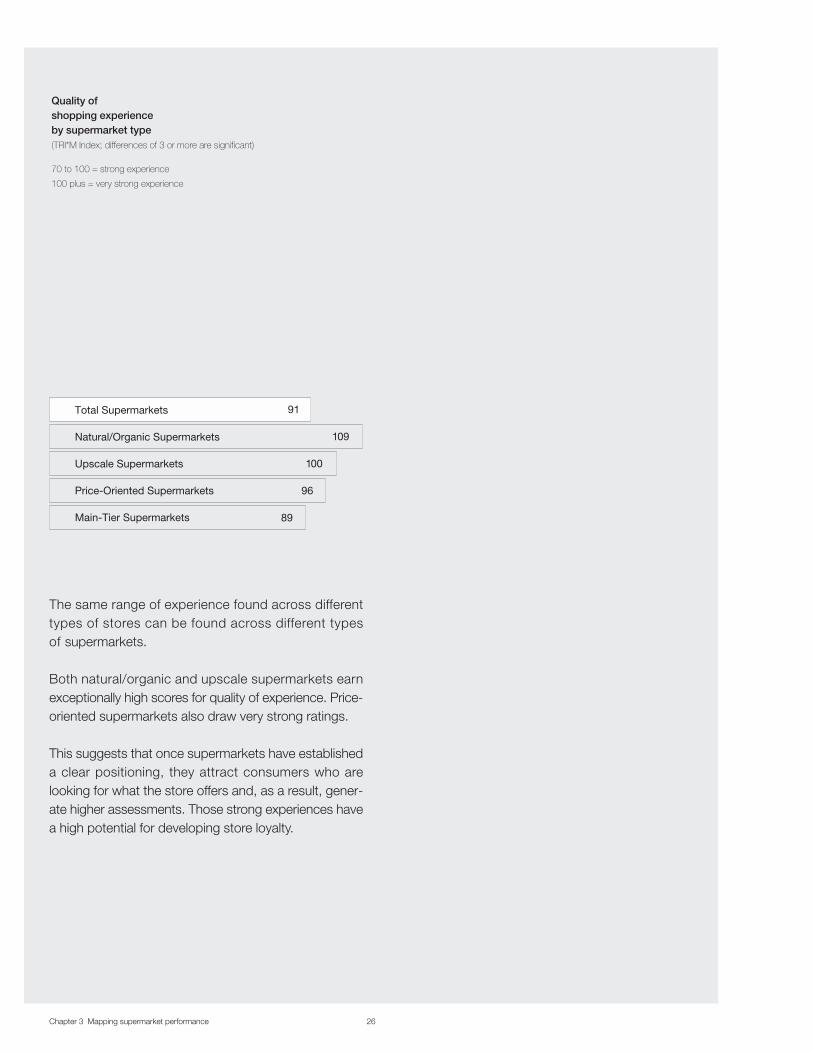
The same range of experience found across differenttypes of stores can be found across different typesof supermarkets.
Both natural/organic and upscale supermarkets earnexceptionally high scores for quality of experience. Price-oriented supermarkets also draw very strong ratings.
This suggests that once supermarkets have establisheda clear positioning, they attract consumers who arelooking for what the store offers and, as a result, gener-ate higher assessments. Those strong experiences havea high potential for developing store loyalty.
Quality ofshopping experience by supermarket type(TRI*M Index; differences of 3 or more are significant)
70 to 100 = strong experience
100 plus = very strong experience
Total Supermarkets
Natural/Organic Supermarkets
Upscale Supermarkets
Price-Oriented Supermarkets
Main-Tier Supermarkets
91
109
100
96
89

27
Comparing the TRI*M scores of supermarkets andtheir competition by need state provides a clearerpicture of which competitors do the best job of pro-viding high-quality experience for specific need-state-driven occasions.
Supermarkets deliver strong levels of shopping expe-rience across all high-spend need states.
Warehouse clubs are the strongest competition forhigh-spend need states, generating significantlyhigher scores for three of the four need states.
Supercenters are also strong supermarket com-petitors but generate significantly higher scores foronly one need state, Smart Budget-Shopping.
Supermarkets don’t deliver quite as high a level ofexperience for medium-spend need states andface some strong competition for these shoppingoccasions.
The quality of experience serving the Specific Itemneed state is significantly higher for both massmerchandisers and drug stores.
Dollar stores, warehouse clubs, and supercentersall deliver higher levels of experience than dosupermarkets for Bargain-Hunting Among Stores.
Supercenters provide a higher level of shoppingexperience for Smal l-Basket Grab & Go thando supermarkets.
High-Spend
Care for Family 95 96 102 105 na na na
Efficient Stock-Up 92 87 91 97 na na na
Smart Budget-Shopping 97 101 97 108 na na na
Discovery 101 98 102 102 na na na
Medium-Spend
Specific Item 88 87 96 na 95 na na
Reluctance 82 83 86 na na na na
Bargain-Hunting Among Stores 88 94 81 103 84 na 105
Low-Spend
Small-Basket Grab & Go 82 87 na na 84 na na
Immediate Consumption 81 na na na na 80 na
Quality of shopping experience by need state and channel(TRI*M Index; differences of 3 or more are significant)
70 to 100 = strong experience
100 plus = very strong experience
Mass Merchandisers
Supercenters
Supermarkets
Convenience Stores
Dollar Stores
Drug Stores
Warehouse Clubs

Chapter 3 Mapping supermarket performance 28
The trip distribution data as well as the TRI*M scores show that supermarkets are gro-cery stores with general appeal that also deliver strong shopping experiences acrossall need states. But, they are generalists operating in a market where competition isnow getting more specialized.
One response to this situation involves striking a balance between being recognizedby your execution as a great generalist and, at the same time, establishing a uniqueposition as the retailer who’s known for exceptional focus on one of the consumerneed states.
The first step toward being an outstanding generalist is to get the fundamentals rightby executing well against what consumers are looking for in all the need states thatare important to the store.
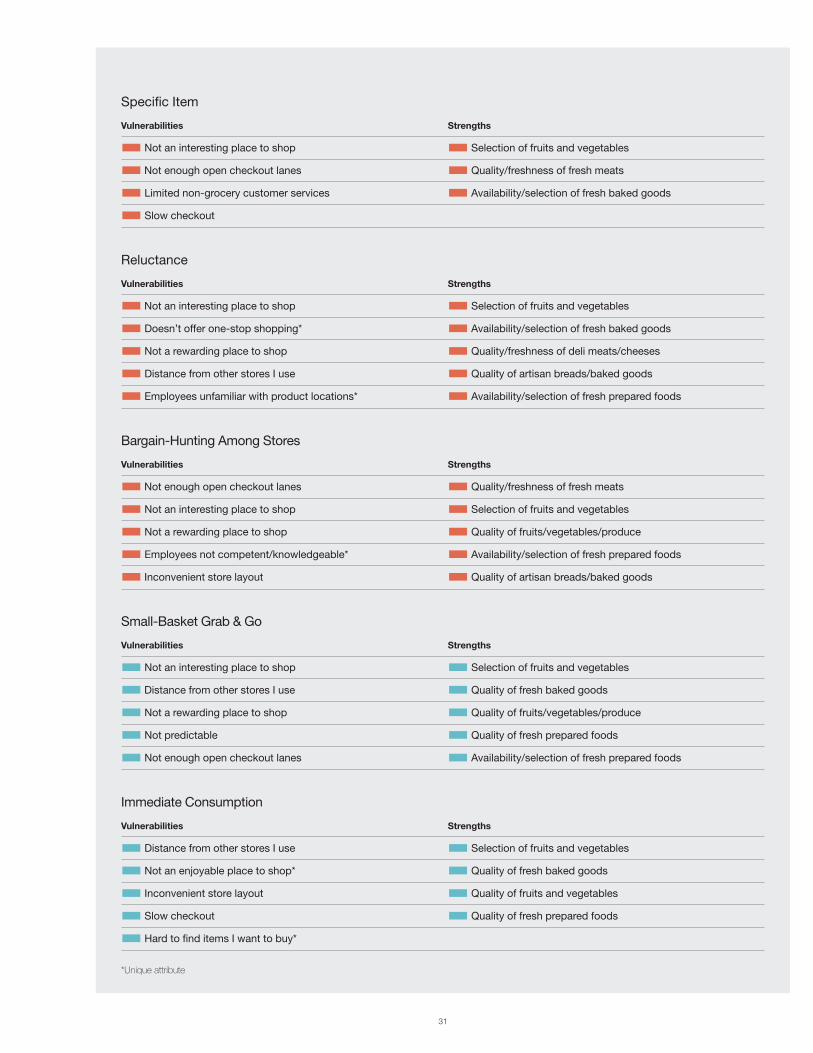
Guidance on how to do this can be found in the tables at the end of this chapter.By need state, and in order of importance, they list the most significant supermarketvulnerabilities and strengths when competing with non-supermarket outlets.
Experience over the years in applying similar insights drawn from other TRI*Mstudies indicates that the biggest benefits are typically realized by reducing or elim-inating vulnerabilities.

29
For example, in the Care for Family table on the next page, two of the top three vulnerabilities suggest that merchandising decisions—not price reduction alone—will help make the supermarket a more attractive destination.
The supermarket strengths listed for Care for Family show the specific things con-sumers are looking for — and finding — in the supermarket: selection of fresh fruitsand vegetables, quality and freshness of deli meats and cheeses, and carrying allleading brands. All are required to successfully attract and retain Care for Familyneed-driven trips.
Taken together, the tables show one supermarket strength that is nearly universalamong need states. “Selection of fresh fruits and vegetables” appears in eight of thenine need states.
One universal characteristic shows up on the negative side as well. “Not an interestingplace to shop” was cited as the first- or second-place vulnerability in every need state.
Characteristics unique to a single need state are highlighted by an asterisk in the tables.
Once a retailer has identified and reduced the seriousness of vulnerabilities and madesure the strengths are in place, the foundation elements are in place to perform wellas a generalist against all shopping occasions.
The second step, establishing a unique position as a retailer known for exceptionalfocus on one of the consumer need states, is discussed in Chapter 4.

Chapter 3 Mapping supermarket performance 30
Care for FamilyVulnerabilities Strengths
Not an interesting place to shop Selection of fruits and vegetables
Lack of low prices day in and day out Quality/freshness of deli meats/cheeses
Doesn’t feature new and interesting products Carries all the leading brands*
Isn’t modern or up to date*
Efficient Stock-UpVulnerabilities Strengths
Not an interesting place to shop Quality of fruits and vegetables
Lack of low prices day in and day out Draws my attention to sale and promotional items*
Not a rewarding place to shop Has plenty of grocery baggers*
Out-of-stock products* Is easy to find store employees when I need help*
Smart Budget-ShoppingVulnerabilities Strengths
Lack of low prices day in and day out Quality/freshness of fresh meats
Not an interesting place to shop Availability/selection of dairy products*
Not a rewarding place to shop Selection of fruits and vegetables
Not enough open checkout lanes Quality of fresh prepared foods
Not predictable
DiscoveryVulnerabilities Strengths
Not an interesting place to shop Quality/freshness of fresh meats
Doesn’t feature new and interesting products Selection of fruits and vegetables
Not a place that kids enjoy going* Quality/freshness of deli meats/cheeses
Limited non-grocery customer services Is not too noisy*
Limited brand-name non-food products*
Top supermarket vulnerabilities
and strengths (and unique attributes),
by need state and order of importance
*Unique attribute
31
Specific Item
Vulnerabilities Strengths
Not an interesting place to shop Selection of fruits and vegetables
Not enough open checkout lanes Quality/freshness of fresh meats
Limited non-grocery customer services Availability/selection of fresh baked goods
Slow checkout
Reluctance
Vulnerabilities Strengths
Not an interesting place to shop Selection of fruits and vegetables
Doesn’t offer one-stop shopping* Availability/selection of fresh baked goods
Not a rewarding place to shop Quality/freshness of deli meats/cheeses
Distance from other stores I use Quality of artisan breads/baked goods
Employees unfamiliar with product locations* Availability/selection of fresh prepared foods
Bargain-Hunting Among Stores
Vulnerabilities Strengths
Not enough open checkout lanes Quality/freshness of fresh meats
Not an interesting place to shop Selection of fruits and vegetables
Not a rewarding place to shop Quality of fruits/vegetables/produce
Employees not competent/knowledgeable* Availability/selection of fresh prepared foods
Inconvenient store layout Quality of artisan breads/baked goods
Small-Basket Grab & Go
Vulnerabilities Strengths
Not an interesting place to shop Selection of fruits and vegetables
Distance from other stores I use Quality of fresh baked goods
Not a rewarding place to shop Quality of fruits/vegetables/produce
Not predictable Quality of fresh prepared foods
Not enough open checkout lanes Availability/selection of fresh prepared foods
Immediate Consumption
Vulnerabilities Strengths
Distance from other stores I use Selection of fruits and vegetables
Not an enjoyable place to shop* Quality of fresh baked goods
Inconvenient store layout Quality of fruits and vegetables
Slow checkout Quality of fresh prepared foods
Hard to find items I want to buy*
*Unique attribute
32
In “the world according to shoppers,” consumer needs vary from shopping occasionto shopping occasion. Each one is the basis for choosing a store from among the setof retail outlets available. And shoppers form the strongest attachments to stores thatmeet those specific needs most successfully.
Do all supermarkets serve all need states? The answer depends on the capabilitiesand strategy of each retailer. Some supermarkets—such as those focused on naturaland organic, upscale, or price-impact—have already made the decision to serve aspecific segment of the market. The results shown in Chapter 3 indicate that, onaverage, these stores deliver a stronger experience to their customers than domain-tier supermarkets.
Other supermarkets—some of which are very successful—seek to serve the broadermarket with a strong offering. For these operators, the answer is that they do wantto serve all segments, and the tables at the end of Chapter 3 provide some guidanceon how to strengthen their offerings against each need state.
It’s evident, however, that just executing well against each need state doesn’t alwaysgenerate the place a retailer wants on the shopper’s agenda. This requires clearlystanding for something in the minds of shoppers.
Designing new strategies based on consumer need states is uncharted territory formost supermarket retailers, and best practices have yet to be developed. How, then,can industry executives and managers approach this new information? Brandingstrategies, with their intense focus on consumers rather than competitors, offer somepromising tools.
Branding is a way of identifying yourself in the marketplace. Though it is usually guidedat the corporate level, the principles apply to all levels of an organization, down toindividual stores. By identifying the nine need states, this study provides individualretailers with a new set of “lenses” for branding and positioning their stores.
Chapter 4 Translating need statesinto competitive advantage
33
If a retailer chooses to follow this approach, the first step is to identify the need statewhere it can really deliver and be known as the expert. This choice can be madebased on a review of how consumers are using your stores today, as well as anassessment of your capabilities, relative to the competition, for serving what con-sumers are looking for in each need state. The online tool developed along with thisreport can help with this task (see page 37).
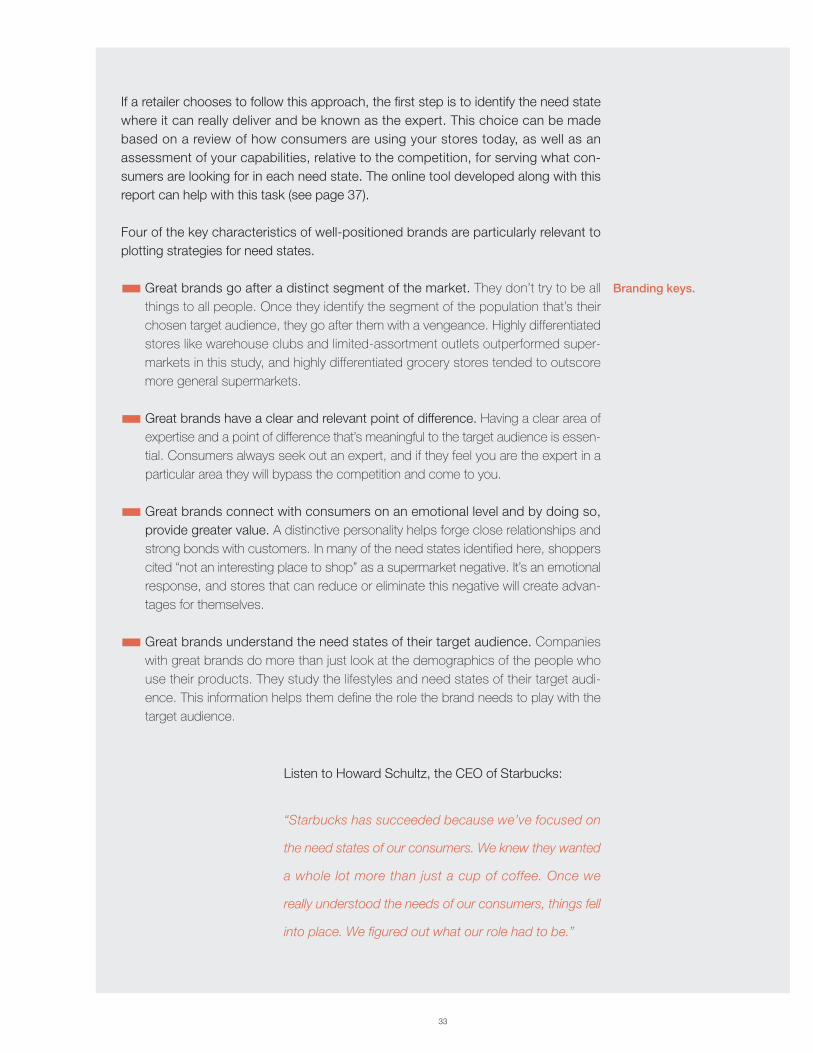
Four of the key characteristics of well-positioned brands are particularly relevant toplotting strategies for need states.
Great brands go after a distinct segment of the market. They don’t try to be allthings to all people. Once they identify the segment of the population that’s theirchosen target audience, they go after them with a vengeance. Highly differentiatedstores like warehouse clubs and limited-assortment outlets outperformed super-markets in this study, and highly differentiated grocery stores tended to outscoremore general supermarkets.
Great brands have a clear and relevant point of difference. Having a clear area ofexpertise and a point of difference that’s meaningful to the target audience is essen-tial. Consumers always seek out an expert, and if they feel you are the expert in aparticular area they will bypass the competition and come to you.
Great brands connect with consumers on an emotional level and by doing so,provide greater value. A distinctive personality helps forge close relationships andstrong bonds with customers. In many of the need states identified here, shopperscited “not an interesting place to shop” as a supermarket negative. It’s an emotionalresponse, and stores that can reduce or eliminate this negative will create advan-tages for themselves.
Great brands understand the need states of their target audience. Companieswith great brands do more than just look at the demographics of the people whouse their products. They study the lifestyles and need states of their target audi-ence. This information helps them define the role the brand needs to play with thetarget audience.
Listen to Howard Schultz, the CEO of Starbucks:
“Starbucks has succeeded because we’ve focused on
the need states of our consumers. We knew they wanted
a whole lot more than just a cup of coffee. Once we
really understood the needs of our consumers, things fell
into place. We figured out what our role had to be.”
Branding keys.

Chapter 4 Translating 34
Once supermarkets have identified the need states they currently serve, the next stepis to pinpoint the one need state that the chain or store serves best. What a store doesbest is its starting point for brand-building. Next comes creating a clear image thatmakes the store or chain stand apart from the competition. Finally, it’s important totake credit for this uniqueness and make sure the consumer is aware of it.
One useful tool for pinpointing and communicating a brand is a statement of “mean-ingful difference.” The statement highlights the brand’s area of expertise and pointsout differences with the competition. It provides all participants with a clear vision ofthe brand to help guide decision-making. Programs that align with the brand and rein-force brand image should be implemented; those that are not in alignment or dilutethe brand should be eliminated.
For a hypothetical supermarket named “Pete’s”—whose target need state is Care forFamily and whose customers have average incomes —the meaningful differencestatement might sound like this:
“For consumers who want to be able to find the best fresh foods for their families with-out blowing their budgets, Pete’s Fresh Market offers a different supermarket shop-ping experience — it’s a treat to shop here. Shopping at Pete’s you feel great fromwhen you enter the store to buy groceries to when you serve that food to your family.”
The structure of “Pete’s” brand can be traced through the four important avenuesmarketing professionals use to define brand architecture: product features, functionalbenefits, emotional benefits, and brand personality. What’s helpful about this approachis that it details both the tangibles (product features and functional benefits) and theintangibles (emotional benefits and brand personality). The tangibles are like hardware;they are the price of entry, and without them you have nothing. The intangibles are likesoftware; they make the hardware sing.
Product features A warm store environment making extensive use ofnatural light.
A large and beautifully merchandised producedepartment.
Large displays of unique and high-value items offered“while they last,” e.g., quarts of aseptic mango juicefrom the Middle East.
High-service, colorful meat and deli departments.
High-quality Mexican baked goods for immediate con-sumption, since the store serves a large base ofMexican customers.
Comfortable décor — unique colors, display fixtureswith round corners.
Define your
difference.
The hardware
and software
of brand
architecture.
“Pete’s” brand
architecture.

35
“I’ve never seen such beautiful fruits and vegetables.”
“I like having new products that I’ve not seen beforethat I can try without risking a lot of money.”
“My family likes to shop here because there’s more tolook at.”
“We can get the products that remind us of Mexico.”
“I like being able to see outside through the windowshigh on the walls.”
“I have a relaxed feeling when I enter the store. It feelsopen and organized, so it’s a nice place to be.”
“I feel that we’re well taken care of and safe when weshop there.”
“I like the special treats that are there for me andthe family.”
“I feel wanted because employees are friendly andhelp me have a good experience.”
Brand personality “Nice place to be.”
“Lots of good things.”
“Uniquely serves our community.”
“Pete’s” has paid close attention to the needs of Care for Family shoppers. Becausethese trips take time, the store has taken pains to make itself a comfortable place tobe. It stocks the kinds of foods these shoppers like to find. And it makes the trip inter-esting by showcasing new foods and products, and featuring “while they last” specials.
There is, of course, a whole lot more involved in branding, but that’s another report.The information contained here can be used to identify and take advantage of oppor-tunities presented by any of the need states.
Emotional benefits
(high-level consumer
“I” statements)
Functional benefits
(consumer “I” statements)

Chapter 4 Translating 36
Supermarkets face a challenge in the world of contemporary retail because they aregeneralists. They serve every need state and every demographic, and they do it verywell. Their greatest competitive challenge comes from specialists who concentrate onfulfilling specific consumer needs and often satisfy those needs better.
This report is not a call to abandon the generalist platform, but it is a call to becomethe best generalist possible. Look at the need states, determine which are mostimportant to you, and take steps to excel in those areas. Once you’ve accomplishedthis, select one shopping occasion, become the undisputed expert in it, and use thatexpertise as the focal point for differentiating your store in the minds of consumers.This involves paying more attention to the customers you are trying to serve, and pay-ing only enough attention to competitors to ensure you are outperforming them in yourstrategically selected need states.
Conclusion.

37
Online tool available Bringing the world according to shoppers into your business*
Looking at consumer needs through the lens of shopping occasions can help retailersidentify opportunities to grow their businesses and lay the groundwork for retailers tosharpen the definition of what they stand for in the minds of consumers.
This report has laid out a set of needs-driven shopping occasions and the character-istics and preferences for consumers operating in each of the occasions. For retailerswho are interested, a web-based tool has been developed—Getting Inside the Mindof Your Shopper—that will help them apply this approach to their own businesses.Putting this tool to work will take some time and effort, but at the end of the process,retailers will have a good idea of where and how they can focus their attention onshopping occasions to profitably grow their businesses.
The tool is not for everyone. To use it effectively takes time. It also requires anunflinchingly honest, clear-eyed assessment of the strengths and vulnerabilities of astore’s operations, as well as those of its competition; otherwise the results will notbe meaningful.
Step 1
Learn what is on the minds of consumers during their various shopping occasions.
Step 2
Determine how elements of your in-store customer experience compare to your top three competitors.
Step 3
Evaluate your performance versus your top three competitors on satisfying the driving needs ofshoppers operating in the various need states.
Step 4
Determine where and potentially how you can strengthen the quality of the shopping experience for allthe need states relevant to your stores.
Step 5
Select the primary need state you wish to focus on and begin to formulate a strategy.
The tool walks
retailers through
five steps.
*For additional information, please contact The Coca-Cola Retailing Research Council of North America website at www.CCRRC.org

38
Acknowledgments The Council wishes to thank Bill Bishop, founder and President of Willard BishopConsulting, Ltd., for providing essential guidance and counsel as the facilitator and coordinator of the project for the Council, and for his support in developing theonline tool. Appreciation is also extended to Jim Emery for his valuable expertise and contributions to the branding material contained in this report. Tom Van Aman,Keith Holzmueller, and Kathleen Lee of TNS NFO carried out the research for the study.

39
Grow with America: Best Practices in Ethnic Marketing and Merchandising 2002
Cultural Access Group and About Marketing Solutions, Inc.
New Ideas for Retaining Store-Level Employees 2000
Blake Frank, PhD, Graduate School of Management, University of Dallas
Building a Meal Solution Delivery System: Understanding Supply-Side
Costs and Strategies for Supermarket Foodservice 1998
The Hale Group, Ltd.
Where to Look for Incremental Sales Gains:
The Retail Problem of Out-of-Stock Merchandise 1996
Andersen Consulting
Measured Marketing: A Tool to Shape Food Store Strategy 1993
Brian P. Woolf, Retail Strategy Center, Inc.
New Ways to Take Costs Out of the Retail Food Pipeline 1992
Mercer Management Consulting
Strengthening Your Relationships with Store Employees 1991
Robert M. Tomasko, Washington, DC–based consultant to Arthur D. Little, Inc.
Supermarket Merchandising for the 1990s 1989
Booz, Allen & Hamilton
Assessing and Capturing the Soft Benefits of Scanning 1988
Professor Robert Blattburg, Graduate School of Business, University of Chicago
Improving Store Manager Effectiveness 1986
Human Synergistics, Inc.
Managing the Large Food Store of the Future 1984
Arthur D. Little Co.
Lessons from Japan 1983
Michael O’Connor
Planning Your Financial Growth in the 1980s:
A Financial Planning Model for Food Retailers 1982
Robert D. Buzzell, William E. Fruhan, Walter Salmon
Product Improvement Techniques & Strategy for the Supermarket Industry 1981
Professor Bobby Calder, Graduate School of Management, Northwestern University
The Impact of Energy on Food Distribution in the 1980s 1980
John Morrissey, Senior Vice President, Super Valu Stores, Inc.
An Economic Analysis of the Distribution Industry in the United States 1980
Arthur Andersen & Company
Social Trends and Food Retailing 1980
SRI-International
Coca-Cola Retailing
Research Council
of North America
Commissioned
Research Projects

40
Coca-Cola Retailing
Research Council
of North America VI
The Coca-Cola Retailing Research Council of North America was created by TheCoca-Cola Company to address issues of strategic importance to the U.S. super-market industry. The Council is responsible for identifying and framing the strategicissues to be addressed.
The process allows for retaining consulting resource(s) to conduct the research andanalysis associated with the identified issue, directing and guiding the conduct of theresearch and analysis, and ensuring the results are reported/presented to the super-market industry in a way that is useful to and actionable by the industry.
The Council consists of 13 supermarket industry executives who carry out the respon-sibilities and tasks associated with the previously mentioned mandate. They are:
Rick Anicetti, President, COO, and CEO, Food Lion Stores, Inc.
Jonathan Berger, General Manager for North America, CIES
Kevin Davis, Chairman, President, and CEO, Bristol Farms
Leonard Harris, President and Owner, Chatham Food Center, Inc.
Russell T. Lund, III, President and CEO, Lund Food Holdings, Inc.
David Marsh, President and COO, Marsh Supermarkets, Inc.
Bill McEwan, CEO and President, Sobeys, Inc.
Don McGeorge, President and COO, The Kroger Company
Patrick Raybould, President, B&R Stores
Michael Sansolo, Senior Vice President, Food Marketing Institute
Ray Stewart, Executive Vice President, Hy-Vee, Inc.
Suzanne Allford Wade, Executive Vice President, Retailing, H.E. Butt Grocery Company
Colleen Wegman, Senior Vice President, Merchandising, Wegman’s Food Markets, Inc.

© 2004 The Coca-Cola Company. To order copies of this study, call 800-808-8877.
All trademarks and registered trademarks are the property of their respective owners.
Designed and produced by Thinkhouse Creative.

The Coca-Cola Retailing ResearchCouncil of North America is a body offood retailers and wholesalers whoseindependent research activities are sponsored by Coca-Cola North America.
www.CCRRC.org