Embed Size (px)
Citation preview
Samarkand, 2016
Different Approaches to Evaluate
the Condition of Irrigated Agricultural Areas
Using Remotely Sensed Data
Regional and International Cooperation in Central Asia and South Caucasus: Recent
Developments in Agricultural Trade2 - 4 November 2016 | Samarkand, Uzbekistan
Dr. Natalya Tsychuyeva, Dr. Nurlan Bekmuhamedov, Dmitry Malakhov
JSC “National Center of Space Research and Technology”, Almaty, Kazakhstan

Background
Farmers
Akim
(head of the region)
The information about
irrigated areas
Area of irrigated lands (85% or 1200000 ha) – Kzylorda, SKO, Jambyl, Almaty oblasts
Climatic zones of Kazakhstan
Semi
deserts and
Deserts
Zone of irrigated crop production
Significant areas (20-30%) remained unusable in this zone
Ministry of Agriculture
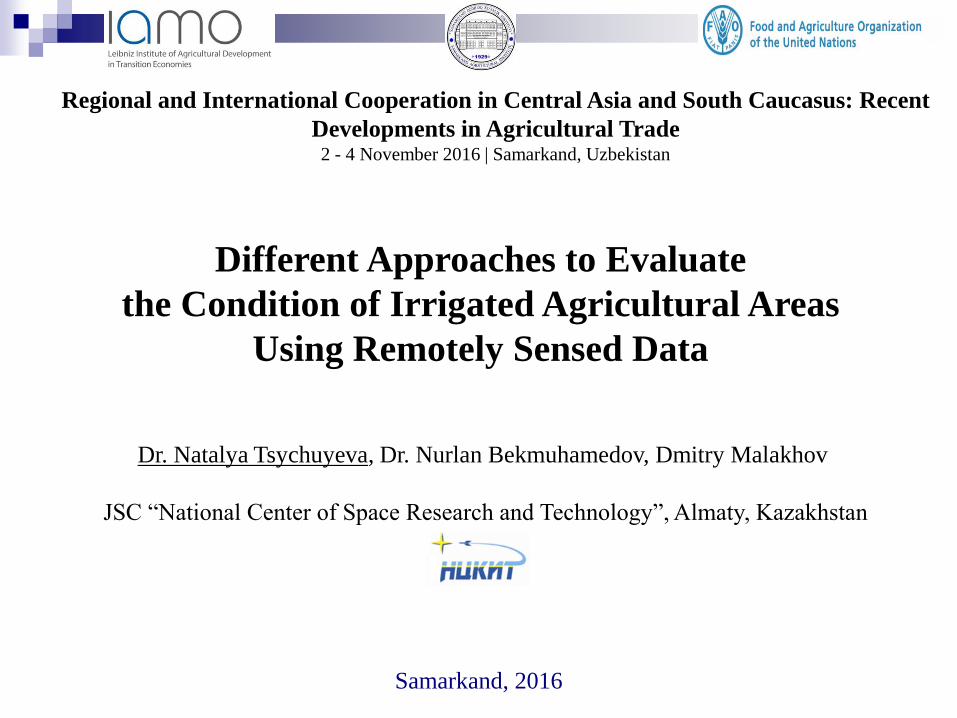
Main Aims
To create the monitoring system of irrigated lands in Kazakhstan using
operative remote sensing data
Aims
Project was fund by Kazakhstan State Budget Program 212 «Scientific
development for consumption using of water resources and agricultural
lands»

Regis
tration o
f
leachin
g
Regis
tration o
f
sow
ing d
ate
Curr
ent
sta
te
of vegeta
tion
Regis
tration o
f
Irrigation d
ate
Regis
tration o
f
harv
esting d
ate
Background
The annual cycle of agricultural work
February/ March/ April/ May/ June / July/ August/ October / November/
R e m o t e s e n s i n g m o n i t o r i n g
Regis
tration o
f
sa
linity
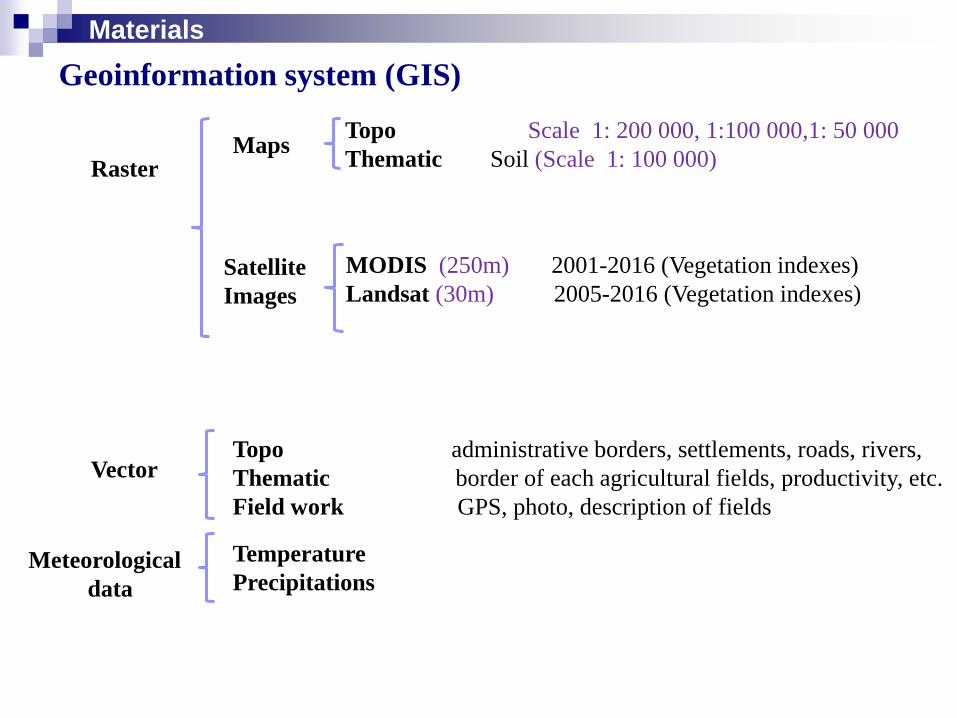
Raster
Vector
Meteorological
data
MapsTopo Scale 1: 200 000, 1:100 000,1: 50 000
Thematic Soil (Scale 1: 100 000)
Satellite
Images
Temperature
Precipitations
Topo administrative borders, settlements, roads, rivers,
Thematic border of each agricultural fields, productivity, etc.
Field work GPS, photo, description of fields
MODIS (250m) 2001-2016 (Vegetation indexes)
Landsat (30m) 2005-2016 (Vegetation indexes)
Materials
Geoinformation system (GIS)

Catalog: Landsat-5-8 from 2005-
2016
Remote sensing data
Almaty oblast Landsat images
Terra/MODIS (250 m resolution) - everyday,
Landsat-8 (30 m and 15 m resolution) - 16 day
Materials
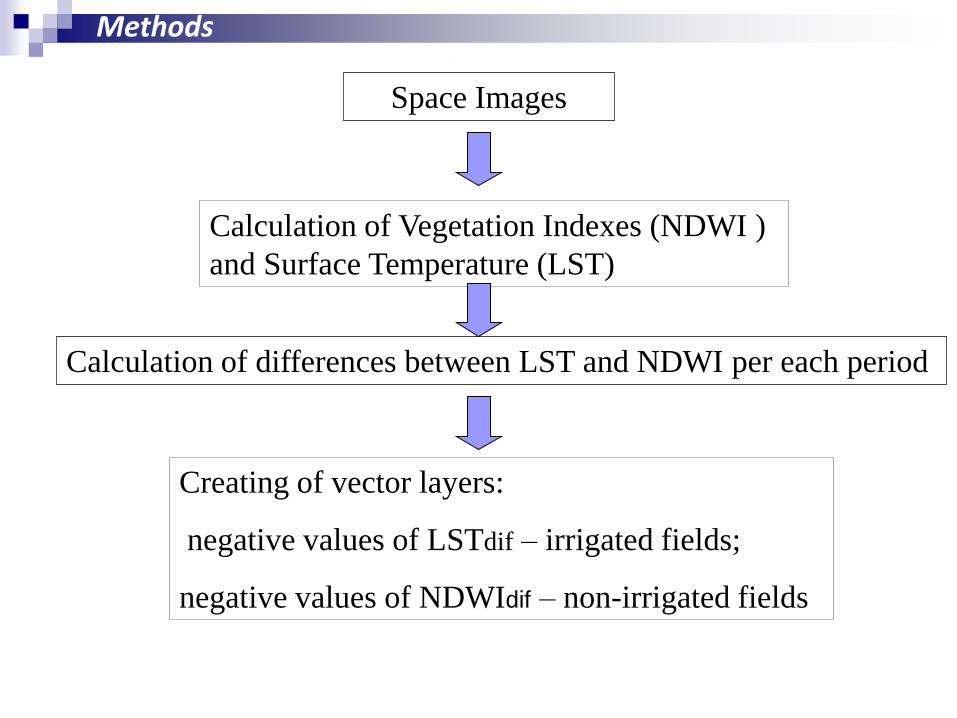
Methods
Space Images
Calculation of Vegetation Indexes (NDWI )
and Surface Temperature (LST)
Calculation of differences between LST and NDWI per each period
Creating of vector layers:
negative values of LSTdif – irrigated fields;
negative values of NDWIdif – non-irrigated fields

Index Formula Threshold
Salinity index NDSI=(b3-b4)/(b3+b4) -0,11 to 0
Water Index (b2-b4)/(b2+b4) >0.1
LST K2/alog(K1/b#+1); Bcels=Bkelv-273.15
SAVI SAVI = (NIR-Red)/(NIR+Red+0.5))*(1+0.5) 0.01-0.025
LSTdif LSTdif = LST latest date – LST earliest date <0
NDWI NDWI = (B5-B6)/(B5+B6) -1 to +1
The list of spectral indexes for Landsat -8

Map of irrigated and non-
irrigated fields of South-
Kazakhstan Oblast
in July 2016
Results
Classification of irrigated and
non-irrigated fields of test
polygon
Irrigated fields
Uncertainty
Non-irrigated fields

The mask of agricultural fields vectorized by space images
Results

The Map of Salinity Areas
Лето - полив (засоление не проявляется)
Осень - на высохшей почве фиксируется вторичное засоление
Классификация засоленных участков
основана на применении индекса
засоленности NDSI.
Расчеты проводились по данным
Landsat 8 за 2014 год.
Results

Changing of salinised areas during vegetation period (test plot Atakent village)
Irrigation areas analysis of salinity
Results
Area of salinised fields ha

Field work
- Phenological description;
- Salinisation determination;
- Irrigation system
description
300 test fields

Verification
IndexLand Surface
TemperatureNDWI SAVI
Irrigated fields 100% 65% 75%
Non-irrigated
fields22.5% 81% 69%

Geoportal

You are welcome for questions!