Embed Size (px)
Citation preview
Biomed Pap Med Fac Univ Palacky Olomouc Czech Repub. 2018 Jun; 162(2):99-106.
99
Dietary sucrose regulates the expression of the Cd36 gene in hepatic tissue of rats with obesity and Non Alcoholic Fatty Liver Disease (NAFLD)
Rodolfo Quintana Castroa,b, Ida Soto Rodrigueza, Rosa A. Deschamps Lagoa, Peter Grube Pagolac, Jorge Rodriguez Antolind, Adriana Peres Quintala, Jaime Rivera Riveraa, Alfonso Alexander Aguileraa,b
Aim. To evaluate the mRNA expression levels of Cd36 in adipose and hepatic tissues, in rats with NAFLD after the consumption of sucrose for 10 and 20 weeks.Methods. Twenty Wistar rats, all nearly 21 days old were divided into two experimental groups (NAFLD-10 and NAFLD-20), that received a standard diet (2014 Teklad Global) plus 30% sucrose in their drinking water for 10 and 20 weeks and the control groups (C Groups). Variables such as body weight, food intakes, and serum parameters were measured. Adipose and hepatic tissues were extirpated; some tissue was preserved in formalin and some at -70 °C until analysis. Histological analysis was carried out, and the Cd36 mRNA expression levels were determined.Results. The rats in the NAFLD-10 and NAFLD-20 groups showed a significative increase in abdominal fat, triglycerides, free fatty acids, insulin, AST, ALT, uric acid and HOMA index; as well as changes in the cellular dynamics in adipose tissue, (adipocytes hypertrophic: >1500 µm2) with respect to the control groups (P<0.05). The histological analysis showed development of mild portal hepatitis in rats of the NAFLD-10 group and grade 1 hepatic steatosis with mild portal inflammation in rats of the NAFLD-20 group. Finally, Cd36 mRNA expression levels were significantly increased in hepatic tissue after 10 (1.5-fold) and 20 (3.5-fold) weeks of sucrose ingestion (P<0.05).Conclusion. mRNA expression is a molecular mechanism involved in the development of NAFLD associated with obesity in rats consuming sucrose. However, there was increased Cd36 mRNA expression only in hepatic tissue while in hypertrophic adipose tissue mRNA levels remained unchanged.
Key words: fatty liver, metabolic syndrome, sucrose, CD36, insulin resistance, obesity
Received: September 11, 2017; Accepted: April 4, 2018; Available online: May 15, 2018https://doi.org/10.5507/bp.2018.016
aFacultad de Bioanalisis, Universidad Veracruzana, Carmen Serdan s/n. Col. Flores Magon, Veracruz, Ver., 91700. MexicobEscuela de Medicina, Universidad Cristobal Colon, Carr. Veracruz-Medellin s/n. Col. Puente Moreno, Boca del Rio, Ver., 94271. MexicocInstituto de Investigaciones Medico-Biologicas, Universidad Veracruzana, Carmen Serdan s/n. Col. Flores Maron, Veracruz, Ver., 91700. MexicodCentro Tlaxcala de Biologia de la Conducta, Universidad Autonoma de Tlaxcala, Carretera Tlaxcala-Puebla Km. 15., 90062. MexicoCorresponding author: Alfonso Alexander Aguilera, e-mail: [email protected]
INTRODUCTION
Non alcoholic fatty liver disease (NAFLD) includes a group of hepatic diseases not caused by alcohol con-sumption, evolving from non alcoholic simple fatty liver (NAFL) to non alcoholic steatohepatitis (NASH), he-patic fibrosis and cirrhosis. NAFLD has become the lead-ing cause of chronic liver damage in developed countries1 and is a recognized condition associated with increased cardiovascular and liver-related mortality2. This disease is characterized by an accumulation of triglycerides (TG) in hepatocytes known as steatosis and has been associated with insulin resistance (IR), obesity, type 2 diabetes mel-litus and dyslipidemia3. The pathogenesis of NAFLD has been explained by the “double-hit” hypothesis, consisting of fat or lipid accumulation as the primary insult or “first hit” in the liver4 followed by a “second hit” in which pro-inflammatory mediators cause inflammation, hepatocel-lular injury and fibrosis5.
Causes of hepatic steatosis, include poor diet and nu-trition. Sucrose or fructose intake and/or comsumption of sugar-sweetened beverages have recently received atten-
tion as potential risk factors for metabolic syndrome and type 2 diabetes6-8. These sugars, which include glucose are converted into fatty acids by means of de novo lipogenesis in enterocytes and hepatocytes, and are the source for hepatic triglycerides synthesis9, favoring the development of steatosis.
The development of steatosis is related to fat homeo-stasis in adipocytes, hepatocytes and myocytes among other cells. This equilibrium is controlled by a number of factors including membrane and/or intracellular proteins implicated in the transport, synthesis and degradation of fat10. For example, the CD36 transporter coordinates uptake and processing of free fatty acids, as well as fatty acids storage in the adipocytes, utilization by adipose tis-sues and muscle11, chylomicron production12, and secre-tion of hepatic VLDL (ref.13). Cd36 also contributes to the regulation of energy balance and, therefore, has a role in the risk of metabolic disorders such as insulin resis-tance, type 2 diabetes mellitus, obesity, and non alcoholic hepatic steatosis10.
Despite current advances in understanding the com-plex cellular signaling of the metabolic and inflamma-

Biomed Pap Med Fac Univ Palacky Olomouc Czech Repub. 2018 Jun; 162(2):99-106.
100
tory pathways involved in NAFLD, the development of steatosis and progression to steatohepatitis and fibrosis/cirrhosis is not yet fully understood14,15. Some studies have shown that the increase in CD36 expression in liver of transgenic mice attenuates the formation of steatosis dur-ing fasting16.
The long-term consumption of sugars results in physio-pathological communication between adipose and hepatic tissues that is important in the development of steatosis and the pathogenesis of NAFLD. Furthermore, different cellular dynamics during the development of obesity are associated with insulin resistance and fatty liver; among other factors. Thus, it is important to know the relation-ship that exists in the transcriptional expression of the gene encoding for the CD36 receptor under sucrose con-sumption in tissues associated with the development of steatosis.
The purpose of this work was to evaluate the effects of dietary sucrose administration and Cd36 mRNA expres-sion levels in adipose and hepatic tissues in Wistar rats on the development of non-alcoholic fatty liver disease (NAFLD).
MATERIALS AND METHODS
Experimental designTwenty Wistar rats, all nearly 21 days old, were pur-
chased from Harlan Teklad Inc. (Mexico City). The ani-mals, were individually housed in stainless-steel cages and maintained in 12-h light/dark cycles at 25 °C. Animal maintenance and handling followed the guidelines of Mexican legislation, NOM-062-ZOO-1999 (ref.17).
Animals were divided into two experimental groups: two non-alcoholic fatty liver groups (NAFL-10 Group, n-5 and NAFL-20 Group, n-5) that received a standard diet (2014 Teklad Global) plus 30% sucrose in their drinking water for 10 or 20 weeks, and a control groups (C Groups) that received a standard diet and drinking water.
After experimental treatment with sucrose; fasted animals (18 hrs) from each group were sacrificed. Measurements of body weight, food intake, and serum parameters were made. Adipose and hepatic tissues were extirpated some tissue was preserved in formalin and some tissue at -70 ° C until analysis.
Serum biochemical determinationsSerum glucose, cholesterol, triglycerides, uric acid,
alanine aminotransferase (ALT), aspartate aminotrans-ferase (AST) and other markers, were determined by enzymatic methods using a Selectra-E autoanalyzer. All reagents were obtained from Spinreact SA in Spain. The serum insulin concentration was determined by a com-mercial double-antibody solid-phase radioimmunoassay (Coat-A-Count, DPC). Serum free fatty acids (FFAs) were determined from fresh frozen samples by an en-zymatic method (NEFA-C test, Wako Chemicals). To calculate the index of insulin resistance (HOMA-IR) the following formula was used: insulin [µU/mL] x glucose [mmol/L]/ 22.5 (ref.18).
Quantification of Hepatic TriglyceridesLipids were extracted from hepatic tissue (1 g) utiliz-
ing the method of Folch et al.19. Total lipids were extracted from liver samples by homogenizing the tissues using a mixture of chloroform/methanol/0.9% NaCl to a final 20-fold dilution of the original volume of the tissue sample. The organic layer was then removed, evaporated, and reconstituted in chloroform. The values of TG were mea-sured using a colorimetric assay kit (Spinreact, Barcelona, Spain) and the results were expressed as mg per gram of the liver weight.
Adipocyte size measurementsRandom samples of abdominal adipose tissue of rats
in the NAFLD and control group were fixed in neutral formalin (10% formaldehyde and 0.1 M phosphate buffer, pH 7) for 24 h at room temperature. The samples were embedded in paraffin, and 7 mm serial sections were then cut using a microtome and stained with hematoxylin and eosin.
Areas were measured in each adipocytes for micro-scopic field of view, using five fields of view per rat. The average adipocyte area was calculated for each rat, and group means were determined from the individual aver-ages for comparisons between groups. For the above, photomicrographs were obtained at a 40X magnification utilizing an optical microscope (Axio Image A2, Zeiss) with an Olympus digital camera at a 5.1-megapixel resolu-tion. Adipocyte areas were measured using the AxioVision Real 4.6 software (Zeiss Software, Inc.), and expressed as µm2.
Microscopic liver analysisTo analyze hepatic damage, liver tissue was fixed for
24 h in 10% neutral buffered formalin. Sections (4-6 µm) of the tissue were embedded in paraffin, and stained with hematoxylin and eosin (H–E) prior to microscop-ic examination. Digital images were obtained using an Olympus BX51 microscope equipped with a Camedia C3040ZOOM digital camera (Olympus America Inc., Corporate Center Drive, Melville, NY, USA). All the im-ages were recorded at 10x and 40x magnification.
Real-time PCR Cd36 Gene a) Total RNA Isolation
Total RNA was obtained from nitrogen-frozen rat liver or abdominal fat tissue. First 300 mg of nitrogen-frozen tissue was pulverized using a nitrogen-cooled steel mor-tar. The tissue powder, was immediately suspended in 2.0 mL of TRIzol™ Reagent (Invitrogen) and incubated at room temperature 5 min. Then, 0.3 mL of chloroform was added and shaken for 15 s, and after three minutes the samples were centrifuged at 12,000 x g for 15 min at 4 °C and the aqueous phase was recovered. The RNA was pre-cipitated with 1 mL of isopropanol and incubated at room temperature for 10 min and recovered by centrifugation at 12,000 x g for 20 min at 4 °C. The RNA was washed with ethanol at 75%, and resuspended in RNase-free water and kept at -70 °C until use.
Biomed Pap Med Fac Univ Palacky Olomouc Czech Repub. 2018 Jun; 162(2):99-106.
101
b) Cd36 mRNA expression measurementThe relative expression of Cd36 mRNA from ab-
dominal fat and hepatic tissue was measured with the StepOne™ Real Time PCR System (Life Technologies). The reaction was performed with iTaq™ Universal SYBR® Green One-Step Kit (Bio-Rad). The amount and quality of total RNA were determined by spectro-photometry using NanoDrop 2000™ spectrophotometer (Thermo Scientific) and 0.5 µg for each sample of total RNA was normalized for each reaction. The reaction mix was adjusted according to the manufacturer’s rec-ommendations; primers used for Cd36 gene expression were reported by Arias et al., 2014 (sense 5’-GGT GTG CTC AACAGC CTT ATC-3’and antisense 5’-TTA TGG CAA CCTTGC TTA TG-3’) (ref.20). Thermocycling conditions were as follows: for reverse transcription ten minutes at 50°C, for polymerase activation and DNA de-naturation one minute at 95 °C and for amplification, 40 cycles of 15 s at 95 °C and 60 s at 60 °C. β-Actin gene expression was used as the endogenous control, the primers sequences used for β-Actin were as follows: sense 5'-TGGAATCCTGTGGCATCCATG-3 and antisense 5'-TAAAACGCAGCTCAGTAACAG-3’. Melting curve analysis were performed after each RT-PCR run in order to confirm that only one PCR products was detected. The relative expression of the target gene with respect to the internal control was calculated using relative quanti-fication software provided by StepOne™ Real Time PCR System.
Data analysisExperimental data were tested for normality and ho-
mogeneity of variance. We then used ANOVA and com-parisons using the multiple range Tukey test (P<0.05 or P<0.01); the results are expressed as the means and SDs
Table 1. Caloric consumption parameters, fat and liver weight in sucrose-fed NAFLD and Control groups.
10 Weeks 20 WeeksControl Group NAFLD-10 Group Control Group NAFLD-20 Group
Initial body weight (g) 172±8 186±7 172±8 186±7Final body weight (g) 341±50 379±44 359±49 394±47Liquid intake (mL/day) 85.43±11.01 145.30±21.35* 112.47±13.20 209.91±17.24*Liquid intake (mL/day/100 g bw) 24.99±3.22 38.31±5.62* 31.32±3.67 53.27±4.37* Equivalent in Kcal in drinking water 0.00 45.96±6.74* 0.00 63.92±1.31*Food intake (g/day) 58.67±8.42 28.22±4.00* 61.76±1.14 12.80±4.63*Food intake (g/day/100 g bw) 17.16±2.46 7.44±1.05* 17.89±2.35 3.24±1.17* Equivalent in Kcal in food 53.19±7.58 23.06±3.25* 55.45±7.28 10.04±3.62* Total Kcal/day/100 g bw 53.19±7.58 69.02±9.99 55.45±7.28 73.96±4.93*Abdominal fat weight (g) 9.20±1.06 15.93±3.95* 10.76±1.37 16.90±2.72*Epididymal fat weight (g) 7.20±1.40 15.10±2.20* 8.75±2.31 17.30±1.96* Total fat (g) 16.40±2.46 31.03±6.15* 19.51±3.68 34.20±4.68*Number of adipocyte x 106 (mm2) 29.33±3.70 31.34±3.80 38.80±5.80 40.60±4.60Liver weight (g) 9.76±0.20 13.30±0.26* 9.90±0.83 13.32±0.71*Hepatic triglycerides (mg/g liver) 15±2.50 22±1.85* 17±2.80 35±1.80*Index of adiposity 4.80 8.18* 5.43 8.68*Hepatosomatic index 2.86 3.50 2.75 3.38
Values are the mean ± SD (C, n=5; NAFLD-10 and NAFLD-20, n=5). * P<0.01. Bw = Body weight. Index of adiposity= (Abdominal and epididy-mal fat weight / body weight) x 100. Hepatosomatic index = (liver weight/body weight) x 100
17
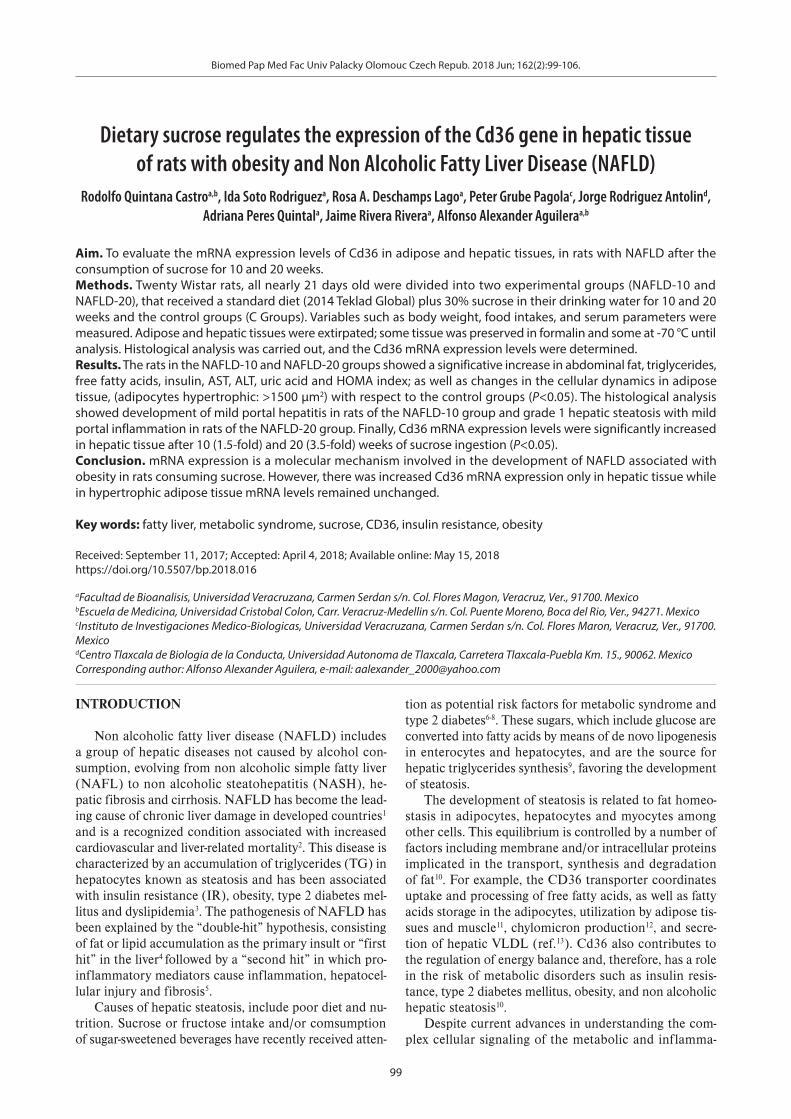
Fig. 1. Evolution of the body weight of rats that consumed sucrose for 10 weeks (NAFLD-10 Group) and 20 weeks (NAFLD-20 Group) with respect to control rats.
150
200
250
300
350
400
450
1 5 10 15 20
Control Group
NAFLD Group
*
*
Body
wei
ght (
g)
Weeks
Fig. 1. Evolution of the body weight of rats that consumed sucrose for 10 weeks (NAFLD-10 Group) and 20 weeks (NAFLD-20 Group) with respect to control rats.
of five repetitions. The Minitab 16.1.0 statistical package was used.
RESULTS
Caloric intake from diet, weight and body fatA model of fatty liver was achieved by the administra-
tion of 30% sucrose in drinking water in male Wistar rats. Figure 1 shows the evolution of body weight of the rats that consumed sucrose over 20 weeks, the NAFLD-10 and NAFLD-20 groups consuming sucrose for 10 and 20 weeks showed no significant changes in body weight
Biomed Pap Med Fac Univ Palacky Olomouc Czech Repub. 2018 Jun; 162(2):99-106.
102
compared to the control groups. However, there were sig-nificant changes in weight at weeks 5 and 15 of consum-ing sucrose.
Table 1 shows the differences in liquid consumption as well as food and caloric intake at the end of the su-crose treatment period at 10 or 20 weeks (P<0.01). At 10 weeks, the ingestion of sucrose in NAFLD-10 group led to a significant increase in abdominal fat of 73% (P<0.01) and epididymal fat of 109% (P<0.01). After 20 weeks of sucrose administration, the rats in the NAFLD-20 group presented an increase in abdominal fat of 57%, (P<0.01) and epididymal fat of 97% (P<0.01) in comparison to con-trol groups. The rats in the NAFLD 10 and 20 groups, also showed an increase in adiposity index values (70% and 59%; respectively) with respect to the control group (P<0.01). Additionally, the rats in the NAFLD 10 and 20 groups presented a significant increase in liver weight and in the quantified triglycerides in the liver (46% and 105% respectively) in comparison to control group (P<0.01).
Serum biochemical parametersIn relation to the serum parameters, the rats in the
NAFLD-10 group consuming sucrose for 10 weeks showed elevation of triglycerides (48%, P<0.05), VLDL (41%, P<0.01), fatty free acids (30%, P<0.05), uric acid (37%, P<0.05), insulin (85%, P<0.05) and HOMA-IR in-dex (99%, P<0.05). Similarly, the rats consuming sucrose for 20 weeks (NAFLD-20 group) showed an increase in triglycerides (109%, P<0.05), VLDL (112%, P<0.01), free fatty acids (17%, P<0.01), uric acid (18%, P<0.05) insulin (57%, P<0.05), HOMA-IR index (52%, P<0.05) and ALT (610%, P<0.05) with respect to the control group. No dif-ference was observed in the levels of cholesterol, total proteins, albumin and creatinine in rats of the NAFLD groups in comparison to the control group (Table 2).
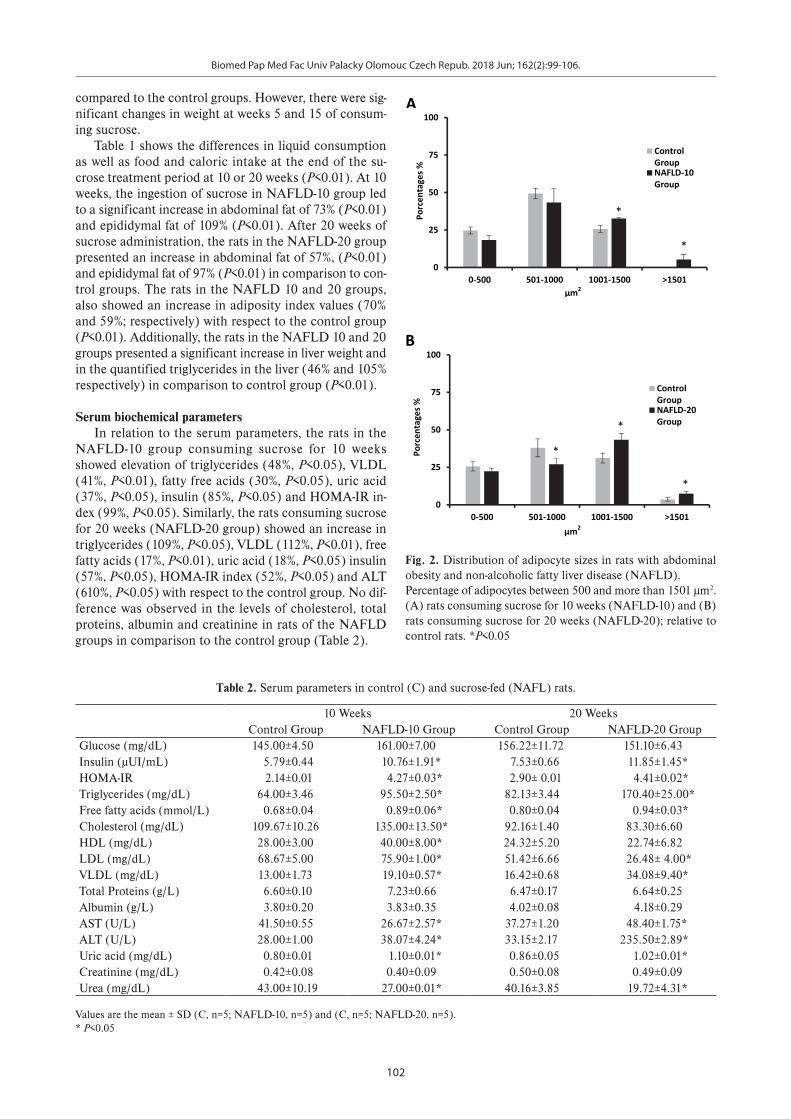
Table 2. Serum parameters in control (C) and sucrose-fed (NAFL) rats.
10 Weeks 20 WeeksControl Group NAFLD-10 Group Control Group NAFLD-20 Group
Glucose (mg/dL) 145.00±4.50 161.00±7.00 156.22±11.72 151.10±6.43Insulin (µUI/mL) 5.79±0.44 10.76±1.91* 7.53±0.66 11.85±1.45*HOMA-IR 2.14±0.01 4.27±0.03* 2.90± 0.01 4.41±0.02*Triglycerides (mg/dL) 64.00±3.46 95.50±2.50* 82.13±3.44 170.40±25.00*Free fatty acids (mmol/L) 0.68±0.04 0.89±0.06* 0.80±0.04 0.94±0.03*Cholesterol (mg/dL) 109.67±10.26 135.00±13.50* 92.16±1.40 83.30±6.60HDL (mg/dL) 28.00±3.00 40.00±8.00* 24.32±5.20 22.74±6.82LDL (mg/dL) 68.67±5.00 75.90±1.00* 51.42±6.66 26.48± 4.00*VLDL (mg/dL) 13.00±1.73 19.10±0.57* 16.42±0.68 34.08±9.40*Total Proteins (g/L) 6.60±0.10 7.23±0.66 6.47±0.17 6.64±0.25Albumin (g/L) 3.80±0.20 3.83±0.35 4.02±0.08 4.18±0.29AST (U/L) 41.50±0.55 26.67±2.57* 37.27±1.20 48.40±1.75*ALT (U/L) 28.00±1.00 38.07±4.24* 33.15±2.17 235.50±2.89*Uric acid (mg/dL) 0.80±0.01 1.10±0.01* 0.86±0.05 1.02±0.01*Creatinine (mg/dL) 0.42±0.08 0.40±0.09 0.50±0.08 0.49±0.09Urea (mg/dL) 43.00±10.19 27.00±0.01* 40.16±3.85 19.72±4.31*
Values are the mean ± SD (C, n=5; NAFLD-10, n=5) and (C, n=5; NAFLD-20, n=5).* P<0.05
18
*
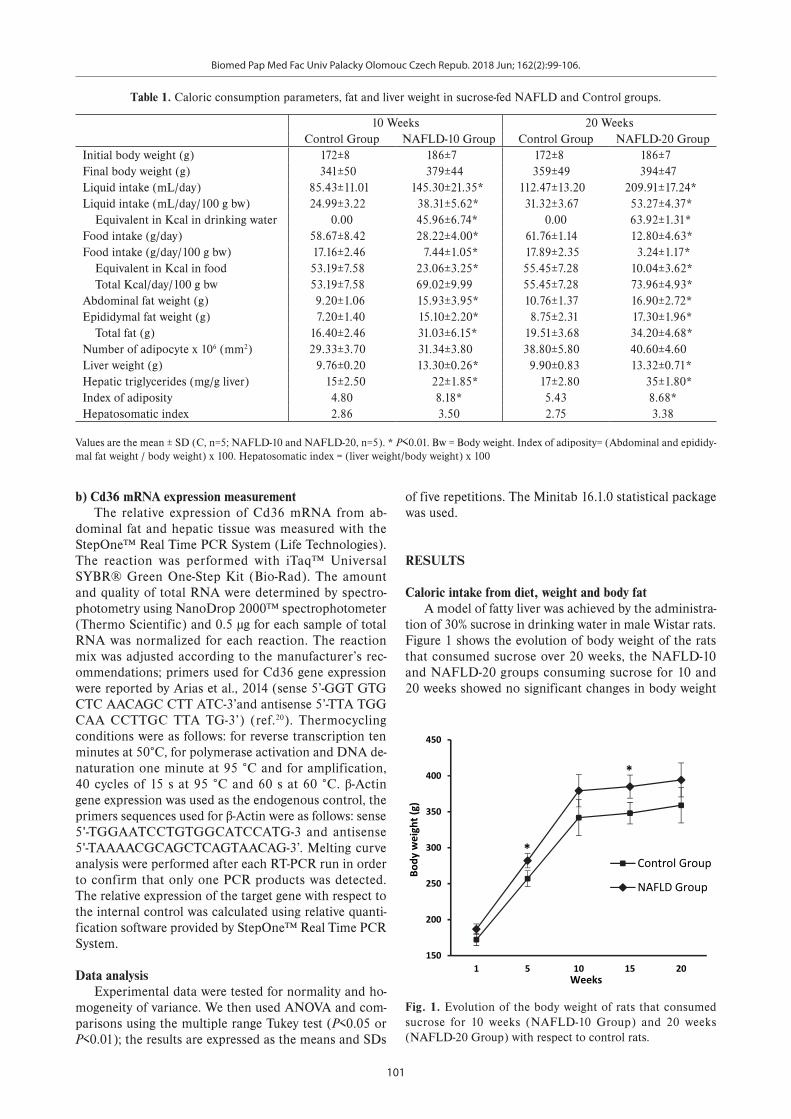
Fig. 2. Distribution of adipocyte sizes in rats with abdominal obesity and non-alcoholic fatty liver disease (NAFLD).
Percentage of adipocytes between 500 and more than 1501 µm2. (A) rats consuming sucrose for 10 weeks (NAFLD-10) and (B) rats consuming sucrose for 20 weeks (NAFLD-20); relative to control rats. *P<0.05
0
25
50
75
100
0-500 501-1000 1001-1500 >1501
ControlGroupNAFLD-10Group
*
µm2
*
Porc
enta
ges %
B
*
*
µm2
Porc
enta
ges %
0
25
50
75
100
0-500 501-1000 1001-1500 >1501
ControlGroupNAFLD-20Group*
*
*
A
Fig. 2. Distribution of adipocyte sizes in rats with abdominal obesity and non-alcoholic fatty liver disease (NAFLD). Percentage of adipocytes between 500 and more than 1501 µm2. (A) rats consuming sucrose for 10 weeks (NAFLD-10) and (B) rats consuming sucrose for 20 weeks (NAFLD-20); relative to control rats. *P<0.05

Biomed Pap Med Fac Univ Palacky Olomouc Czech Repub. 2018 Jun; 162(2):99-106.
103
Cellular dynamic of adipose tissueFig. 2. shows the relative distribution of adipocyte ar-
eas in abdominal adipose tissue samples from rats in the NAFLD-10 and NAFL-20 groups that consumed sucrose. The NAFLD-10 group displayed a significant increase in the percentage of fat cells with areas between 1001 and 1501 μm2 compared with the control group that presented fat cells smaller than 1000 µm2 (P<0.01). In the same way, the NAFLD-20 group showed a significant increase in the percentage of fat cells with areas greater 1001 µm2 and a reduction of adipocytes with areas between 501-1000 µm2 compared to the control group (P<0.05). The adipose tissue of rats fed sucrose showed greater adipocyte hyper-trophy than the control animals (Fig. 3).
Microscopic liver analysisAfter 10 weeks of sucrose administration, the rats in
the NAFLD-10 group showed an increase in liver weight. However, there were no changes in the hepatosomatic index. Similarly, at 20 weeks of consuming sucrose, the rats in the NAFLD-20 group presented an increase in liver weight, but no elevation in the hepatosomatic index, with respect to the control group.
The microscopic liver analysis of rats in the NAFLD-10 group showed the presence of mild portal hepatitis (Fig. 4b and c); while the rats in NAFLD-20 group had grade
19
Fig. 3. Abdominal adipose tissue of rats in the control groups consuming water without sucrose (a, c) and hypertrophic adipose tissue in rats consuming sucrose for 10 weeks in NAFLD-10 group (b) and 20 weeks in NAFLD-20 group (d).
Control Groups NAFLD Groups
At 10 weeks
At 20 weeks
(a) (b)
(c) (d)
Fig. 3. Abdominal adipose tissue of rats in the control groups consuming water without sucrose (a, c) and hypertrophic adipose tissue in rats consuming sucrose for 10 weeks in NAFLD-10 group (b) and 20 weeks in NAFLD-20 group (d).
20
Fig. 4. Histological analysis of the liver in rats in the NAFLD-10 group consuming sucrose for 10 weeks: (a) normal hepatic parenchyma (10x) in control group, (b) scarce mononuclear inflammatory infiltrate in the stroma of portal spaces (10x) and (c) hepatocytes without alterations (mild portal hepatitis) (40x). Rats in the NAFLD-20 group consuming sucrose for 20 weeks: (d) normal hepatic parenchyma (10x) in control group; (e) lymphocytes in the portal space stroma, in addition hepatocytes with large lipid vacuoles (10x) and (f) morphological detail of hepatocytes with large lipid vacuoles (steatosis grade 1) (40x). Hematoxylin and Eosin.
Fig. 4. Histological analysis of the liver in rats in the NAFLD-10 group consuming sucrose for 10 weeks: (a) normal hepatic parenchyma (10×) in control group, (b) scarce mononuclear inflamma-tory infiltrate in the stroma of portal spaces (10×) and (c) hepatocytes without alterations (mild portal hepatitis) (40×). Rats in the NAFLD-20 group consuming sucrose for 20 weeks: (d) normal hepatic parenchyma (10×) in control group; (e) lymphocytes in the portal space stroma, in addi-tion hepatocytes with large lipid vacuoles (10×) and (f) morphological detail of hepatocytes with large lipid vacuoles (steatosis grade 1) (40×). Hematoxylin and Eosin.
Biomed Pap Med Fac Univ Palacky Olomouc Czech Repub. 2018 Jun; 162(2):99-106.
104
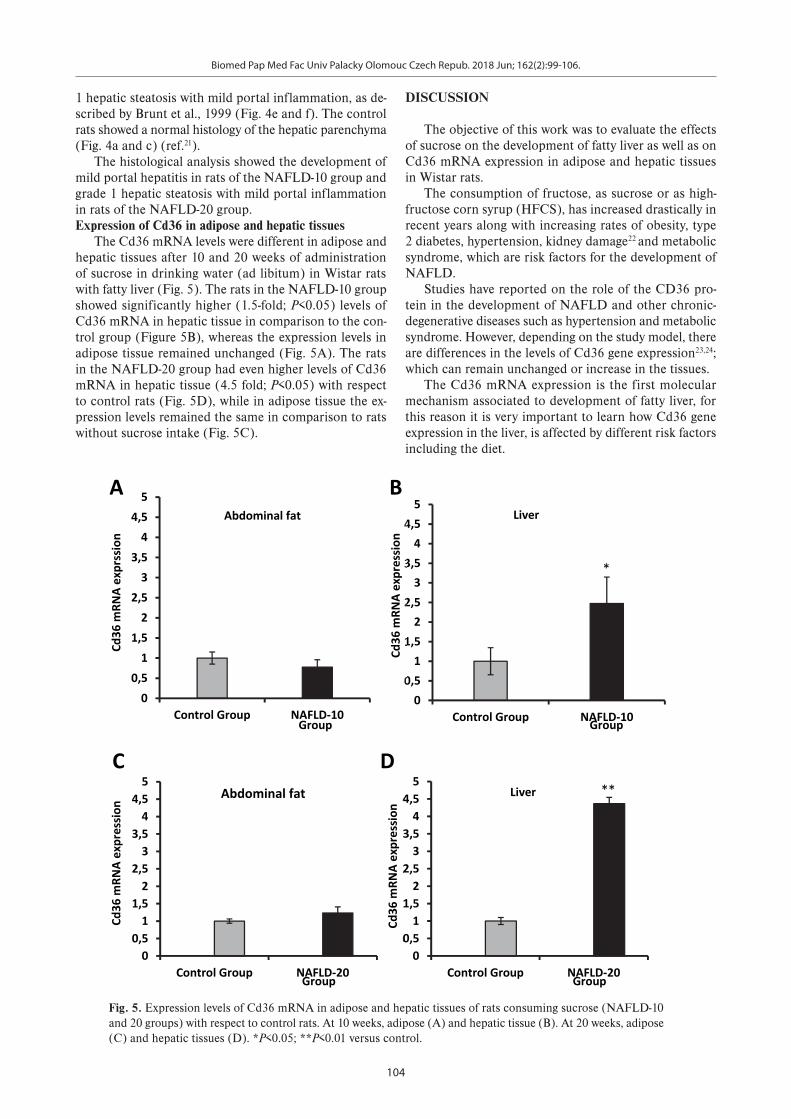
1 hepatic steatosis with mild portal inflammation, as de-scribed by Brunt et al., 1999 (Fig. 4e and f). The control rats showed a normal histology of the hepatic parenchyma (Fig. 4a and c) (ref.21).
The histological analysis showed the development of mild portal hepatitis in rats of the NAFLD-10 group and grade 1 hepatic steatosis with mild portal inflammation in rats of the NAFLD-20 group. Expression of Cd36 in adipose and hepatic tissues
The Cd36 mRNA levels were different in adipose and hepatic tissues after 10 and 20 weeks of administration of sucrose in drinking water (ad libitum) in Wistar rats with fatty liver (Fig. 5). The rats in the NAFLD-10 group showed significantly higher (1.5-fold; P<0.05) levels of Cd36 mRNA in hepatic tissue in comparison to the con-trol group (Figure 5B), whereas the expression levels in adipose tissue remained unchanged (Fig. 5A). The rats in the NAFLD-20 group had even higher levels of Cd36 mRNA in hepatic tissue (4.5 fold; P<0.05) with respect to control rats (Fig. 5D), while in adipose tissue the ex-pression levels remained the same in comparison to rats without sucrose intake (Fig. 5C).
DISCUSSION
The objective of this work was to evaluate the effects of sucrose on the development of fatty liver as well as on Cd36 mRNA expression in adipose and hepatic tissues in Wistar rats.
The consumption of fructose, as sucrose or as high-fructose corn syrup (HFCS), has increased drastically in recent years along with increasing rates of obesity, type 2 diabetes, hypertension, kidney damage22 and metabolic syndrome, which are risk factors for the development of NAFLD.
Studies have reported on the role of the CD36 pro-tein in the development of NAFLD and other chronic-degenerative diseases such as hypertension and metabolic syndrome. However, depending on the study model, there are differences in the levels of Cd36 gene expression23,24; which can remain unchanged or increase in the tissues.
The Cd36 mRNA expression is the first molecular mechanism associated to development of fatty liver, for this reason it is very important to learn how Cd36 gene expression in the liver, is affected by different risk factors including the diet.
21
Fig. 5. Expression levels of Cd36 mRNA in adipose and hepatic tissues of rats consuming sucrose (NAFLD-10 and 20 groups) with respect to control rats. At 10 weeks, adipose (A) and hepatic tissue (B). At 20 weeks, adipose (C) and hepatic tissues (D). *P<0.05; **P<0.01 versus control.
00,5
11,5
22,5
33,5
44,5
5
Control Group NAFLD-100
0,51
1,52
2,53
3,54
4,55
Control Group NAFLD-10
00,5
11,5
22,5
33,5
44,5
5
Control Group NAFLD-200
0,51
1,52
2,53
3,54
4,55
Control Group NAFLD-20
Cd36
mRN
A ex
prss
ion
Cd36
mRN
A ex
pres
sion
*
A B
C D
Group Group
Group Group
**
Cd36
mRN
A ex
pres
sion
Cd36
mRN
A ex
pres
sion
Abdominal fat Liver
Abdominal fat Liver
Fig. 5. Expression levels of Cd36 mRNA in adipose and hepatic tissues of rats consuming sucrose (NAFLD-10 and 20 groups) with respect to control rats. At 10 weeks, adipose (A) and hepatic tissue (B). At 20 weeks, adipose (C) and hepatic tissues (D). *P<0.05; **P<0.01 versus control.

Biomed Pap Med Fac Univ Palacky Olomouc Czech Repub. 2018 Jun; 162(2):99-106.
105
After 10 weeks of ingesting sucrose in drinking water, rats of the NAFLD-10 group showed no significant chang-es in total calorie consumption with respect to the control group; however, at 20 weeks of ingesting sucrose, the rats in NAFLD-20 group showed an increase in total calorie ingestion compared to control rats. These dietary calories were not reflected in the body weight of the rats of the NAFLD-10 and 20 groups, however; the rats presented significant increased abdominal and epididymal fat.
These results coincide with other reports which have shown that consumption of sugary drinks in humans and animals is associated with obesity, cardiovascular diseases and metabolic syndrome7,25, as well as increased ectopic fat accumulation, regardless of other lifestyle factors26.
The above results are related to the serum biomarkers, which showed significant changes in the rats consuming sucrose with respect to the control group. At 10 and 20 weeks of sucrose intake, the rats of the NAFLD groups showed an increase in triglycerides, VLDL, free fatty ac-ids, insulin, HOMA-IR and uric acid. The rats consuming sucrose showed a significative increase in total body fat which is associated with dyslipidemia (elevation of triglyc-erides and VLDL) and insulin resistance. These results are similar to those of other research groups who have shown that the accumulation of abdominal fat results in excessive liberation of fatty acids from the visceral adipose tissue, increasing the risk of hyperinsulinemia and insulin resistance which are associated with an inflammatory and thrombogenic profile27-29.
The rats in the NAFLD groups that consumed su-crose (NAFLD-10 and NAFLD-20) showed similar cel-lular dynamics in adipose tissue to those reported by Jo et al., who studied adipocyte size and distribution in sev-eral degenerative diseases30,31, as well as examining how adipocyte population size shifts under various dietary conditions and among different rat strains. The increase in the percentage of adipocytes with a size greater than 1000 µm2 in rats that consumed sucrose agree with other studies that show that the size distribution differences obtained correlate with a diabetic phenotype32. This is characterized by hypertrophy of adipocyte associated with hepatic steatosis development and inflammation33.
In connection with the Cd36 gene expression and de-velopment of fatty liver in rats, we have shown that the increase in triglycerides and fatty acids in the sera of rats in the NAFLD-10 and NAFLD-20 groups could be associ-ated with the flux of free fatty acids from adipose tissue to liver as well as the development of grade 1 hepatic steatosis with mild portal inflammation after 20 weeks of sucrose consumption. The rats with fatty liver showed significant differences in Cd36 gene expression; while the expression levels in adipose tissue remained unchanged relative to control rats. The liver showed increased levels of Cd36 gene expression between weeks 10 and 20 of sucrose administration. These results indicate that hyper-trophy and the storage capacity of adipose tissue allow it to maintain its basal levels of Cd36 expression. Since the liver is an organ that cannot increase in size unlike adipose tissue, it is forced to raise expression levels of the Cd36 gene. This could lead to in synthesis of the recep-
tor protein, as one of the molecular mechanisms for the development of NAFLD.
Some authors have shown that insulin resistance in-creases the expression of the Cd36 gene in rat liver in a PPARγ-dependent manner, by increasing the localiza-tion of the CD36 receptor in the plasma membrane of the hepatocyte, promoting the development of NAFLD (ref.34-36). Additionally, there are reports of CD36 receptor participation in the development of NAFLD associated with aging in animals and humans. It has been shown that aging increase the circulating levels of insulin, glucose and fatty acids in humans and mice37. Factors have been docu-mented to either increase cellular CD36 expression or in-duce CD36 translocation to the plasma membrane38,39,40,41,
increasing the risk of NAFLD. Our results demonstrate that intake of sucrose could promote cellular conditions that increase the Cd36 mRNA expression.
CONCLUSION
In conclusion, sucrose intake for 10 and 20 weeks by Wistar rats caused abdominal obesity, insulin resistance and development of NAFLD, along with a significant increase in the expression of the Cd36 gene in hepatic tissue, but not in adipose tissue.
Author contribution: All authors contributed equally to preparing the manuscript.Conflict of interest statement: None declared.
REFERENCES
1. Romeo GR, Lee J, Shoelson SE. Metabolic syndrome, insulin resis-tance, and roles of inflammation–mechanisms and therapeutic targets. Arterioscler Thromb Vasc Biol 2012;32:1771-6.
2. Angulo P.Obesity and nonalcoholic fatty liver disease. Nutr Rev 2007;65:57-63.
3. Marchesini G, Bugianesi E, Forlani G, Cerrelli F, Lenzi M, Manini R, Natale S, Vanni E, Villanova N, Melchionda N, Rizzeto M. Nonalcoholic fatty liver, steatohepatitis, and the metabolic syndrome. Hepatology 2003;37:917-23.
4. Farrell GC, Larter CZ. Nonalcoholic fatty liver disease: From steatosis to cirrhosis. Hepatology 2006;43:S99-S112.
5. Tacke F, Luedde T, Trautwein C.Inflammatory pathways in liver ho-meostasis and liver injury. Clin Rev Allergy Immunol 2009;36:4-12.
6. Johnson L, Mander AP, Jones LR, Emmett PM, Jebb, SA. Is sugars-weetened beverage consumption associated with increased fatness in children? Nutrition 2007;23:557-63.
7. Palmer JR, Boggs DA, Krishnan S, Hu FB, Singer M, Rosenberg L. Sugar-sweetened beverages and incidence of type 2 diabetes mel-litus in African American women. Arch Intern Med 2008;168:1487-92.
8. Segal, M.S., Gollub, E., Johnson, R.J. Is the fructose index more rel-evant with regards to cardiovascular disease than the glycemic in-dex? Eur J Nutr 2007;46:406-17.
9. Donnelly KL, Smith CI, Schwarzenberg SJ, Jessurun J, Boldt MD, Parks EJ. Sources of fatty acids stored in liver and secreted via lipopro-teins in patients with nonalcoholic fatty liver disease. J Clin Invest 2005;115:1343-51.
10. Silverstein RL, Febbraio, M. CD36, a scavenger receptor involved in immunity, metabolism, angiogenesis, and behavior. Sci Signal 2009;2:re3.
11. Pepino MY, Kuda O, Samovski D, Abumrad NA. Structure-function of CD36 and importance of fatty acid signal transduction in fat me-tabolism. Annu Rev Nutr 2014;34:281-303.

Biomed Pap Med Fac Univ Palacky Olomouc Czech Repub. 2018 Jun; 162(2):99-106.
106
12. Tran TT, Poirier H, Clement L, Nassir F, Pelsers MM,Petit V, Degrace P, Monnot MC, Glatz JF, Abumrad NA, Besnard P, Niot I. Luminal lipid regulates CD36 levels and downstream signaling to stimulate chy-lomicron synthesis. J Biol Chem 2011;286:25201-10.
13. Nassir F, Adewole OL, Brunt EM, Abumrad NA. CD36 deletion reduces VLDL secretion, modulates liver prostaglandins, and exacerbates hepatic steatosis in ob/ob mice. J Lipid Res 2013;54:2988-97.
14. Berlanga A, Guiu-Jurado E, Porras JA, Auguet T. Molecular path-ways in non-alcoholic fatty liver disease. Clin Exp Gastroenterol 2014;7:221-39.
15. Tilg H, Moschen AR. Evolution of inflammation in nonalcoholic fat-ty liver disease: The multiple parallel hits hypothesis. Hepatology 2010;52:1836-46.
16. Garbacz WG, Lu P, Miller TM, Poloyac SM, Eyre NS, Mayrhofer G, Xu M, Ren S, Xie W. Hepatic overexpression of CD36 improves glycogen homeostasis and attenuates high-fat diet-induced hepatic steatosis and insulin resistance. Mol Cell Biol 2016;36(21):2715-27.
17. SAGARPA. Norma Oficial Mexicana NOM-062-ZOO-1999, Especificaciones técnicas para la producción, cuidado y uso de los animales de laboratorio. Diario Oficial de la Federación. Fecha de publicación 22 de agosto de 2001.
18. Matthews DR, Hosker JP, Rudenski AS, Naylor BA, Treacher DF, Turner RC. Homeostasis model assessment: insulin resistance and beta-cell function from fasting plasma glucose and insulin concentrations in man. Diabetologia 1985;28:412-9.
19. Folch J, Lees M, Sloane Stanley G.H, A simple method for the iso-lation and purification of total lipides from animal tissues. J Biol Chem 1957;226:497-509.
20. Arias N, Macarulla MT, Aguirre L, MartÍnez-Castaño MG, Portillo MP. Quercetin can reduce insulin resistance without decreasing adipose tissue and skeletal muscle fat accumulation. Genes Nutr 2014;9:361.
21. Brunt EM, Janney CG, Di Bisceglie AM, Neuschwander-Tetri BA, Bacon BR. Nonalcoholic steatohepatitis: a proposal for grading and staging the histological lesions. Am J Gastroenterol 1999;94:2467-74.
22. Johnson, RJ, Segal MS, Sautin Y, Nakagawa T, Feig DI, Kang DH, Gersch MS, Benner S, Sanchez-Lozada LG. Potential role of sugar (fructose) in the epidemic of hypertension, obesity and the meta-bolic syndrome, diabetes, kidney disease, and cardiovascular dis-ease. Am J Clin Nutr 2007;86:899-906.
23. Aitman TJ, Glazier AM, Wallace CA, Cooper LD, Norsworthy PJ, Wahid FN, Al-Majali KM, Trembling PM, Mann CJ, Shoulders CC, Graf D, St Lezin E, Kurtz TW, Kren V, Pravenec M, Ibrahimi A, Abumrad NA, Stanton LW, Scott J. Identification of Cd36 (Fat) as an insulin-resis-tance gene causing defective fatty acid and glucose metabolism in hypertensive rats. Nat Genet 1999;21(1):76-83.
24. Alexander AA, Angulo GO, Quintana CR, Ida Soto RI, Guadalupe Sánchez OMG, Rosa María Oliart RRM. CD36 gene expression in-duced by fish oil in abdominal adipose tissue of rats with metabolic syndrome. J Food Nutr Disord 2017;6(2):1-6
25. Dhingra R, Sullivan L, Jacques PF, Wang TJ, Fox CS, Meigs JB, D’Agostino RB, Gaziano JM, Vasan RS. Soft drink consumption and risk of developing cardiometabolic risk factors and the metabolic syndrome in middle-aged adults in the community. Circulation 2007;116:480-8.
26. Nseir W, Nassar F, Assy N. Soft drinks consumption and nonalcoholic fatty liver disease. World J Gastroenterol 2010;16:2579-88.
27. Desprees JP, Lemieux I, Bergeron J, Pibarot P, Mathieu P. Larose E, Rodés Cabau J, Bertrand OF, Poirier P. Abdominal obesity and the
metabolic syndrome: contribution to global cardiometabolic risk. Arterioscler Thromb Vasc Biol 2008;28:1039-49.
28. Tsuriya D, Morita H, Morioka T, Takahashi N, Ito T, Oki Y, Nakamura H. Significant correlation between visceral adiposity and high-sen-sitivity C-reative protein (hs-CRP) in Japanese subjects. Intern Med 2011;50:2767-73.
29. Reyes M, Gahagan S, Díaz E, Blanco E, Leiva L, Lera L, Burrows R. Relationship of Adiposity and insulin Resistance Mediated by inflam-mation in a Group of Overweight and Obese Chilean Adolescents. Nutr J 2011;10:1-4.
30. Jo J, Gavrilova O, Pack S, Jou W, Mullen S, Sumner AE, Cushman SW, Periwal V. Hypertrophy and/or hyperplasia: dynamics of adipose tissue growth. PLoS Comput Biol 2009;3:e1000324.
31. Jo J, Guo J, Liu T, Mullen S, Hall KD, Cushman SW et al. Hypertrophy-Driven adipocyte death overwhelms recruitment under prolonged weight gain. Biophys J 2010;11:3535-44.
32. Fang L, Guo F, Zhou L, Stahl R, Grams J. The cell size and distribution of adipocytes from subcutaneous and visceral fat is associated with type 2 diabetes mellitus in humans. Adipocyte 2015;4:273-9.
33. Kursawe R, Eszinger M, Narayan D, Liu T, Bazuine M, Cali AMG, D’Adamo E, Shaw M, Pierpont B, Shulman GL, Cushman SW, Sherman A, Caprio S. Cellularity and adipogenic profile of the abdominal sub-cutaneous adipose tissue from obese adolescents: association with insulin resistance and hepatic steatosis. Diabetes 2010;9:2288-96.
34. Lee YJ, Ko E H, Kim JE, Kim E, Lee H, Choi H, Yu JH, Kim HJ, Seong, JK, Kim KS, Kim JW. Nuclear receptor PPAR- regulated monoacylglycerol O-acyltransferase 1 (MGAT1) expression is responsible for the lipid accumulation in diet-induced hepatic steatosis. Proc Natl Acad Sci USA 2012;109:13656-61.
35. Rahimian R, Masih-Khan E, Lo M, van Breemen C, McManus BM, Dubé GP. Hepatic overexpression of peroxisome proliferator acti-vated receptor γ2 in the ob/ob mouse model of non-insulin depen-dent diabetes mellitus. Mol Cell Biochem 2001;224:29-37.
36. Schadinger SE, Bucher NL, Schreiber BM and Farmer SR. Insulin Enhances Hepatic Expression of FA Translocase CD36 PPARγ2 regu-lates lipogenesis and lipid accumulation in steatotic hepatocytes. Am J Physiol Endocrinol Metab 2005;288:E1195-E1205.
37. Sheedfar F, Sung MM, Aparicio-Vergara M, Kloosterhuis NJ, Miquilena-Colina ME, Vargas-Castrillón J, Febbraio M, Jacobs RL, de Bruin A, Vinciguerra M, García-Monzón C, Hofker MH, Dyck JR, Koonen DP. Increased hepatic CD36 expression with age is associ-ated with enhanced susceptibility to nonalcoholic fatty liver disease. Aging (Albany NY) 2014;6:281-95.
38. Chang AM, Halter JB. Aging and insulin secretion. Am J Physiol Endocrinol Metab 2003;284:E7-12.
39. Bonen A, Benton CR, Campbell SE, Chabowski A, Clarke DC, Han XX, Glatz JFC, Luiken JJFP. Plasmalemmal fatty acid transport is regu-lated in heart and skeletal muscle by contraction, insulin and leptin, and in obesity and diabetes. Acta Physiol Scand 2003;178:347-56.
40. Coort SLM, Hasselbaink DM, Koonen DPY, Willems J, Coumans WA, Chabowski A, van der Vusse GJ, Bonen A, Glatz JFC, Luiken JJFP. Enhanced sarcolemmal FAT/CD36 content and triacylglyc-erol storage in cardiac myocytes from obese zucker rats. Diabetes 2004;53:1655-63.
41. Schwenk RW, Luiken JJFP, Bonen A, Glatz JFC. Regulation of sar-colemmal glucose and fatty acid transporters in cardiac disease. Cardiovasc Res 2008;79:249-58.