Embed Size (px)
Citation preview
Dietary Lipid Source Modulates in Vivo Fatty Acid Metabolismin the Freshwater Fish, Murray Cod ( Maccullochella peelii
peelii )
DAVID S. FRANCIS, GIOVANNI M. TURCHINI, PAUL L. JONES, AND
SENA S. DE SILVA *
School of Life and Environmental Sciences, Deakin University,P.O. Box 423, Warrnambool, Victoria 3280, Australia
The aim of the present investigation was to quantify the fate of C18 and long chain polyunsaturateddietary fatty acids in the freshwater fish, Murray cod, using the in vivo, whole-body fatty acid balancemethod. Juvenile Murray cod were fed one of five iso-nitrogenous, iso-energetic, semipurifiedexperimental diets in which the dietary fish oil (FO) was replaced (0, 25, 50, 75, and 100%) with ablended vegetable oil (VO), specifically formulated to match the major fatty acid classes [saturatedfatty acids, monounsaturated fatty acids, n-3 polyunsaturated fatty acids (PUFA), and n-6 PUFA] ofcod liver oil (FO). However, the PUFA fraction of the VO was dominated by C18 fatty acids, whileC20/22 fatty acids were prevalent in the FO PUFA fraction. Generally, there was a clear reflection ofthe dietary fatty acid composition across each of the five treatments in the carcass, fillet, and liver.Lipid metabolism was affected by the modification of the dietary lipid source. The desaturation andelongation of C18 PUFAs increased with vegetable oil substitution, supported by the occurrence oflonger and higher desaturated homologous fatty acids. However, increased elongase and desaturaseactivity is unlikely to fulfill the gap observed in fatty acid composition resulting from decreased highlyunsaturated fatty acids intake.
KEYWORDS: Maccullochella peelii peelii ; whole-body fatty acid balance method; linoleic acid; r-linolenic
acid; EPA; DHA
INTRODUCTION
The steady global expansion of the aquaculture industry overthe last three decades has placed a heavy dependence on capturefisheries as a source of fishmeal and fish oil (FO) for aquafeeds(1), two ingredients of limited supply and relatively high price.The use of these key ingredients, particularly for the culture ofcarnivorous fish species, has raised concerns over the sustain-ability of the industry and its potential to expand beyond 2010.In 2002, aquafeeds accounted for approximately 81% of theglobal FO production and are expected to increase to 88% by2012 (2). Consequently, great emphasis has been directed towardthe identification of alternative, economically sustainable feedingredients, with plant oil sources chiefly showing the mostpromising results, providing that essential fatty acid (EFA)requirements are met (3). Many studies have demonstrated thatthe fatty acid composition of the fish will reflect that of thedietary lipid source (4, 5). Inclusion of plant oils can thereforelead to a degradation of fatty acids associated with humanhealth-promoting properties, in particular C20/22 highly unsatur-ated fatty acids (HUFA) (6).
The conversion of EFA, 18:2 n-6 (linoleic acid), and 18:3n-3 (R-linolenic acid) to long chain HUFA via an alternatingseries of elongation and desaturation is an innate abilitydemonstrated by most freshwater fish species (7). The efficiencyof a species’ capability in producing long chain HUFA can bemeasured both ex vivo and in vivo, and a variety of techniquesare available to assess general fatty acid metabolism (8). Studiesemploying an ex vivo approach far outnumber those in whichin vivo methods are employed and thus provided the emphasisfor this study. In vivo methods generally utilize a whole-bodyapproach (9) and are relatively simple and more informativefrom a quantitative view point in comparison to ex vivocounterparts. However, to date, these methods remain relativelyunexplored in fish nutrition studies.
In the present study, the fatty acid metabolism of Murraycod, Maccullochella peelii peelii(Mitchell), was investigatedusing the whole-body fatty acid balance method, first proposedby Cunnane and Anderson (9) and later adopted and furtherdeveloped by Turchini et al. (10). The present study wasmotivated by the need to better understand if the C18 polyun-saturated fatty acid (PUFA) elongase and desaturase capabilitiesof fish can compensate for the reduction of HUFA levels infish tissues resulting from the reduction in dietary intake.
* To whom correspondence should be addressed. Tel:+61-3-55-633-527. Fax: +61-3-55-633-462. E-mail: [email protected].
1582 J. Agric. Food Chem. 2007, 55, 1582−1591
10.1021/jf062153x CCC: $37.00 © 2007 American Chemical SocietyPublished on Web 01/23/2007
MATERIALS AND METHODS
Animals, Husbandry, and Experimental Diets.Murray cod [M.peelii peelii(Mitchell); Order Perciformes; Family Percichthyidae] ofthe 2004 year class (initial mean weight, 14 g) were obtained fromUarah fish hatchery (Grong-Grong, N.S.W., Australia) and used inthis experiment. Fish were housed in a 15 tank (160 L capacity)recirculating system with an in-line oxygen generator, a physical andbiological filtration plant, and an ozone disinfection unit. The systemwas maintained on a 12:12 h light:dark cycle at 24.7( 1.2 °C with aflow rate of 6 L min-1. Water quality parameters were measured dailyusing Aquamerck test kits (Merck, Darmstadt, Germany) and maintainedat optimal levels, as reported previously (4).
Five iso-nitrogenous,iso-energetic,iso-lipidic semipurified experi-mental diets (with minimal fish meal inclusion) were formulated with17% lipid originating from FO (cod liver oil) and a blended vegetableoil (VO). The diets differed only with respect to the VO content, whichwas substituted in 25% increments (Table 1). The VO was formulatedusing three commonly available vegetable oils in the form of olive oil(12%), palm oil (43%), and linseed oil (45%) and was specificallyformulated to match the major fatty acid classes of the FO. The
nutritional contents of the diets were based on previous findings (11)and prepared and stored as also reported previously (4).
At the commencement of the experiment, a sample of 20 fish wastaken and euthanized in excess anesthetic (0.5 mL L-1 benzocaine) foranalysis. Four hundred fifty individually weighed (to the nearest 0.01g) and measured (to the nearest mm) juvenile Murray cod wererandomly distributed among the 15 experimental tanks (30 fish pertank) and assigned one of the five dietary treatments (three replicatesper treatment). Fish were fed twice daily at approximately 08:00 and15:00 h to apparent satiation for a period of 98 days. At the terminationof the experiment, a random sample of 24 fish (eight per tank) fromeach treatment were euthanized for analyses. Fecal samples werecollected on a daily basis. Prior to collection, tanks were siphoned toremove uneaten feed from the pm feed and avoid possible contamina-tion. The following morning, feces were removed from each tank,freeze-dried, and stored at-20 °C at until analyzed.
Chemical Analyses.Sampled fish were randomly split into twogroups of four fish for whole-body fatty acid balance analysis/proximateanalysis and tissue fatty acid analysis. Proximate analysis was conductedusing standard procedures (12). The percentage moisture was deter-mined by drying in an oven at 80°C until a constant weight wasachieved; protein (Kjeldahl nitrogen; N× 6.25) was determined in anautomated Kjeltech (model 2300, Tecator, Sweden); total lipid wasdetermined by chloroform/methanol extraction (2:1 v/v) (13); ash wasdetermined by incineration in a muffle furnace (model WIT, C & LTetlow, Australia) at 550°C for 18 h; and gross energy was determinedusing a ballistic bomb calorimeter (Gallenkamp, United Kingdom).
Fatty acid analysis was performed in triplicate on each of theexperimental diets and fecal samples. Tissue samples (fillet, liver, andwhole-body) were pooled (four fish) and analyzed in triplicate perreplicate. Following lipid extraction, fatty acids were esterified intomethyl esters using the acid-catalyzed methylation method (14) andfollowed the methods previously used in the laboratory (15, 16). Briefly,250 µL of ethyl 13:0 (5 mg/mL-1) (Sigma-Aldrich, Inc., St. Louis,MO) was added to monitor the extent of transesterification, and 800µL of 23:0 (2.5 mg/mL-1) was used as an internal standard (Sigma-Aldrich, Inc.). Fatty acid methyl esters were isolated and identifiedusing a Shimadzu GC 17A (Shimadzu, Chiyoda-ku, Tokyo, Japan)equipped with an Omegawax 250 capillary column (30 m× 0.25 mminternal diameter, 25µm film thickness, Supelco, Bellefonte, PA), aflame ionization detector (FID), a Shimadzu AOC-20i autoinjector, anda split injection system (split ratio, 50:1). The temperature programwas 150-180 °C at 3 °C min-1, then from 180 to 250°C at 2.5°Cmin-1, and held at 250°C for 10 min. The carrier gas was helium at1.0 mL min-1 at a constant flow. Each of the fatty acids was identifiedrelative to known external standards. The resulting peak areas werethen corrected by theoretical relative FID response factors (17) andquantified relative to the internal standard. Feed and freeze-dried fecalsamples were analyzed for proximate and fatty acid analysis andchromic oxide (Cr2O3) according to the method of Furukawa andTsukahara (18). Estimates of lipid digestibility (%LD) and fatty aciddigestibility were calculated using standard formulas (19).
Calculations.The computation of the whole-body fatty acid balancewas carried out as previously described by Turchini et al. (10). In detail,the individual concentrations of fatty acids in the diets, feces, and theinitial and final carcass were expressed in mg per fish. It was thenpossible to calculate the appearance or disappearance of individual fattyacids (FA) according to the following formulas:
The disappearance of fatty acids can be attributed to their elongationand desaturation to longer chain fatty acids or utilization of their carbonskeleton viaâ-oxidation for energy production. In order to determine
Table 1. Ingredient and Proximate Composition of the ExperimentalDiets (mg g-1 Dry Diet) and the Fatty Acid Composition of theExperimental Diets, Expressed in mg g Lipid-1 as Feda
dietary treatmentsb
FO VO25 VO50 VO75 VO100
dietary ingredientscaseinc 320 320 320 320 320gelatin 80 80 80 80 80dextrin 100 100 100 100 100fish meal 100 100 100 100 100defatted soybean meal 105 105 105 105 105wheat flour 53 53 53 53 53FO 170 127.5 85 42.5 -VO - 42.5 85 127.5 170mineral premix 40 40 40 40 40vitamin premix 30 30 30 30 30Cr2O3 2 2 2 2 2
proximate composition (mg g-1)moisture 52.5 50.1 54.2 48.4 47.7crude protein 498.3 502.5 504.1 499.3 504.5crude lipid 192.7 187.4 186.7 191.0 189.5ash 48.3 48.8 48.4 48.9 49.3NFE 208.2 211.2 206.5 212.4 209energy (kJ/g) 19.4 19.3 19.3 19.3 19.4
fatty acid composition (mg g lipid-1)14:0 43.1 35.2 23.5 15.4 6.616:0 135.9 154.1 159.2 181.6 206.516:1 n-7 62.2 47.8 31.4 18.4 4.118:0 34.2 36.2 32.6 34.2 35.718:1 n-9 152.7 188.3 207.6 250.1 295.018:1 n-7 30.2 27.4 20.9 18.4 14.518:2 n-6 41.9 59.0 69.6 88.8 109.118:3 n-3 8.0 64.2 115.0 176.8 242.918:4 n-3 11.5 9.2 6.3 3.7 1.520:1d 16.73 12.8 8.9 6.0 2.220:4 n-6 6.1 4.9 3.4 2.0 -20:3 n-3 3.2 3.0 2.6 2.9 3.020:4 n-3 10.1 7.8 4.8 2.6 0.220:5 n-3 73.6 56.0 36.4 21.4 4.722:5 n-3 33.2 24.9 16.0 8.7 1.022:6 n-3 105.7 79.8 51.9 29.8 6.3SFA 226.3 236.1 223.7 239.1 256.9MUFA 281.3 293.1 280.4 300.1 317.8PUFA 319.6 331.0 320.2 344.8 369.7HUFA 235.2 179.0 117.2 68.5 15.2n-3 245.2 244.9 232.9 245.8 259.6n-6 59.4 73.2 79.7 94.3 109.5n-3/n-6 4.1 3.4 2.9 2.61 2.4HUFA/PUFA 0.7 0.5 0.4 0.20 0.0
a Not all fatty acids are reported. b Diet abbreviations: FO, 100% FO; VO25,25% VO and 75% FO; VO50, 50% VO and 50% FO; VO75, 75% VO and 25%FO; and VO100, 100% VO. c Ingredient information as reported in ref 4.d Represents the sum of all 20:1 isomers.
FA intake) g of feed intake× mg of FA per g of feed
FA excretion) mg of FA intake× FA digestibility
FA accumulation) mg of FA in final carcass-mg of FA in initial carcass
FA appearance/disappearance) FA accumulation- FA intake-FA excretion
Fatty Acid metabolism in Murray Cod J. Agric. Food Chem., Vol. 55, No. 4, 2007 1583
the partitioning of fatty acids in the computation of the 18:2 n-6 and18:3 n-3 balance, the appearance and disappearance of fatty acids wereconverted to mmol per fish and the number of mmol of longer chainfatty acids that had appeared was subtracted from the number of mmolof the relative previous fatty acid in the fatty acid elongation/desaturation pathway. For example, the mathematical model used forthe whole-body fatty acid balance computation of n-6 fatty acids canbe described by the following equations [where:ε ) total specifiedFA converted (elongated or desaturated);δ ) number of mmol of thespecified FA appeared/disappeared; ifδ is a negative number (FAdisappearance) oxidized), thenδ ) 0 for the following computation]:
The total 18:2 n-6 balance is then delineated by the followingequations [where: DE(18:2 n-6)) the total amount of 18:2 n-6elongated to dead end products; NP(18:2 n-6)) the total amount of18:2 n-6 converted through the normal elongation/desaturation pathway;
Ox(18:2 n-6)) the total amount of 18:2 n-6 oxidized; andγ(18:2 n-6)) total number of mmol of 18:2 n-6 disappeared]:
Ultimately, it is possible to estimate the elongase,∆-5, and∆-6desaturase activities, expressed as mmol of product per gram of fish(average fish weight) per day, with the following equations:
Statistical Analysis. All data were reported as means( standarderror (n ) 3). Data interpretation was based on two different statisticaltests: Data were analyzed among treatments by (i) linear regression(relative to the degree of FO substitution at significant levels of 0.05,0.01, and 0.001%) and (ii) one-way analysis of variance (ANOVA) ata significance level of 0.05 following confirmation of normality andhomogeneity of variance. Where significant differences were detectedby ANOVA, data were subjected to a Student-Newman-Keuls posthoctest for homogeneous subsets. All statistical analyses were computedusing SPSS v12.0.1 (SPSS Inc., Chicago, IL).
RESULTS
The test diets wereiso-nitrogenous,iso-lipidic, and iso-energetic, and their fatty acid composition reflected that of the
Table 2. Main Growth, Biometry and Whole-Body, Fillet, and Liver Proximate Composition (in mg g-1) Wet Weight of Juvenile Murray Cod FedDifferent Experimental Diets over a 98 Day Perioda
dietary treatmentsb
initialc FO VO25 VO50 VO75 VO100 R2
growth parametersinitial weight 14.3 ± 0.2 14.5 ± 0.2 14.5 ± 0.2 14.4 ± 0.1 14.6 ± 0.4 0.58final weight 62.3 ± 3.4 b 58.9 ± 0.5 ab 58.9 ± 1.5 ab 52.8 ± 2.4 ab 49.9 ± 2.2 a 0.93**SGRd 1.50 ± 0.1 b 1.43 ± 0.1 ab 1.43 ± 0.1 ab 1.32 ± 0.1 ab 1.25 ± 0.1 a 0.93**FCRe 0.77 ± 0.1 0.78 ± 0.1 0.75 ± 0.1 0.80 ± 0.1 0.83 ± 0.1 0.50FDRf 1.85 ± 0.1 1.78 ± 0.1 1.70 ± 0.1 1.64 ± 0.1 1.58 ± 0.1 0.99***HSI%g 1.93 ± 0.2 1.77 ± 0.1 2.06 ± 0.1 1.89 ± 0.1 2.17 ± 0.2 0.38VFI%h 3.69 ± 0.5 2.97 ± 0.2 2.88 ± 0.3 2.69 ± 0.2 2.90 ± 0.1 0.59
whole-bodymoisture 744.4 ± 1.7 711.4 ± 1.9 711.5 ± 1.0 720.9 ± 2.5 717.6 ± 4.1 710.1 ± 1.4 0.01protein 150.7 ± 1.2 152.5 ± 7.1 161.8 ± 3.4 152.8 ± 2.9 156.9 ± 1.2 157.7 ± 3.7 0.05lipid 76.2 ± 2.6 108.5 ± 2.6 108.8 ± 7.9 100.2 ± 2.8 104.7 ± 4.8 106.2 ± 3.3 0.16ash 35.6 ± 0.4 30.9 ± 2.4 32.7 ± 0.5 30.4 ± 0.6 30.8 ± 0.8 34.6 ± 1.2 0.25
filletmoisture 788.9 ± 0.8 782.7 ± 1.9 775.2 ± 1.4 781.8 ± 3.1 777.0 ± 1.1 781.9 ± 1.1 0.00protein 192.4 ± 0.1 184.8 ± 3.3 191.0 ± 3.5 184.7 ± 1.9 194.0 ± 0.8 187.6 ± 1.9 0.12lipid 17.2 ± 0.5 27.0 ± 1.4 29.4 ± 0.6 30.9 ± 2.1 26.1 ± 1.6 30.1 ± 1.6 0.05ash 11.6 ± 0.2 11.0 ± 0.4 10.6 ± 0.3 10.9 ± 0.2 11.1 ± 0.1 10.8 ± 0.5 0.00
livermoisture 781.7 ± 4.0 715.4 ± 8.7 b 715.1 ± 6.1 b 689.2 ± 5.9 b 688.4 ± 13.8 b 636.3 ± 9.2 a 0.82*protein 111.6 ± 0.4 106.9 ± 4.7 96.0 ± 1.6 91.7 ± 5.1 104.9 ± 11.7 85.3 ± 3.5 0.36lipid 83.4 ± 3.9 108.2 ± 3.7 a 105.7 ± 6.1 a 110.4 ± 6.4 a 148.3 ± 12.3 a 205.7 ± 16.4 b 0.77ash 14.8 ± 0.1 10.9 ± 0.5 ab 11.4 ± 0.6 a 10.3 ± 0.3 ab 10.8 ± 0.3 ab 9.4 ± 0.2 b 0.55
a Values in the same row with different superscripts are significantly different (P < 0.05) as determined by ANOVA. Data were also analyzed with the linear regressionrelative to the degree of substitution of FO with the blended vegetable oil; the coefficient of determination R2 and P values (*, <0.05; **, <0.01; and ***, <0.001) are reported.b See Table 1 for diet abbreviations. c Statistical analyses not performed on initial sample. d SGR: SGR (% day-1) ) [Ln(final weight) − Ln(initial weight)] × (number ofdays)-1 × 100. e FCR: FCR ) (dry feed fed) × (wet weight gain)-1. f FDR: FDR ) [Ln(final lipid) − Ln(initial lipid)] × (number of days)-1. g HSI%: HSI% ) (weight ofliver) × (total fish weight)-1 × 100. h VFI%: VFI% ) (visceral fat weight) × (total fish weight)-1 × 100.
ε(20:4 n-6)) δ(22:4 n-6)
ε(20:3 n-6)) δ(20:4 n-6)+ ε(20:4 n-6)
ε(18:3 n-6)) δ(20:3 n-6)+ ε(20:3 n-6)
ε(20:2 n-6)) δ(22:2 n-6)
ε(18:2 n-6)) δ(18:3 n-6)+ ε(18:3 n-6)+ δ(20:2 n-6)+ε(20:2 n-6)
DE(18:2 n-6)) δ(20:2 n-6)+ ε(20:2 n-6)
NP(18:2 n-6)) δ(18:3 n-6)+ ε(18:3 n-6)
Ox(18:2 n-6)) γ(18:2 n-6)- DE(LA) - NP(LA)
g of fish day-1 ) (initial fish weight+ final fish weight)× 2-1 ×no. of days-1
∆-6 desaturase) [δ(18:3 n-6)+ ε(18:3 n-6)] (g of fish day-1)-1
∆-5 desaturase) [δ(20:4 n-6)+ ε(20:4 n-6)] (g of fish day-1)-1
elongase) [δ(20:2 n-6)+ ε(20:2 n-6)+ ε(18:3 n-6)+ε(20:4 n-6)] (g of fish day-1)-1
1584 J. Agric. Food Chem., Vol. 55, No. 4, 2007 Francis et al.
added oils (Table 1). As the VO was formulated to mimic themajor class profile of cod liver oil (FO), the diets were similarin this respect [i.e., saturated fatty acid (SFA), monounsaturatedfatty acid (MUFA), PUFA, n-3, and n-6]. However, there weredifferences in the fatty acid profiles with respect to HUFA andC18PUFA classes and individual fatty acids. The FO diet wascharacterized by high levels of 20:5 n-3 and 22:6 n-3, whilethe VO100 diet was high in 16:0, 18:2 n-6, 18:3 n-3, and inparticular 18:1 n-9.
Juvenile Murray cod tripled their initial weight over theexperimental period. Significant differences (P < 0.05) wereobserved between fish receiving the FO and VO100 diet in meanfinal weight, with values of 62.3 and 49.9 g, respectively (Table2). Similarly, specific growth rate (% day-1) (SGR) and fatdeposition rate (FDR) exhibited the same trend, ranging from1.50 to 1.25 and 1.85 to 1.58, respectively. No significantdifferences were apparent between treatments for the feedconversion ratio (FCR), hepatosomatic index (HSI%), or visceralfat index (VFI%). The lipid content of the liver was significantlymodified by the inclusion of 100% VO, with values around2-fold of the FO, VO25, and VO50 treatments. The proximatecomposition of the whole-body and fillet did not differsignificantly between the dietary treatments.
The fillet fatty acid compositions of fish reared on theexperimental diets are given inTable 3. Increased VO substitu-tion resulted in a significant (P < 0.05) amplification of 18:1n-9, 18:2 n-6, and 18:3 n-3 in Murray cod fillet. Adversely,increasing VO substitution levels had a significant impact onlevels of n-3 and n-6 HUFA, particularly, 20:5 n-3, 22:6 n-3,and 20:4 n-6. The fatty acid composition of Murray cod liverexhibited a similar trend, although levels of MUFA were foundin higher concentrations than levels in the diet (Table 4).
Individual differences in the fatty acid composition of theexperimental diets resulted in a significantly lower intake,
excretion, final body content, and accumulation of n-3 and n-6 HUFA as the substitution of FO approached 100% (Table5). No difference was noted in the intake or final body contentof SFA, MUFA, and n-3 PUFA. However, the excretion ofMUFA, n-3 PUFA, and n-6 PUFA increased as the level ofVO in the diet increased. An appearance of 31.5 mg of n-3HUFA per fish and 5.4 mg of n-6 HUFA per fish in Murraycod receiving the VO100 diet was recorded.
With respect to the n-6 fatty acid balance, there was anaccumulation and significant appearance of 18:3 n-6 and 20:3n-6 in the VO100 treatment despite a low to nonexistent intakein the diet (Table 6). Conversely, with regard to the total balanceof 18:2 n-6, a significantly higher (P < 0.05) disappearancewas recorded in Murray cod receiving the VO100 treatment.The disappearance of 20:4 n-6 was positively correlated to thelevel of VO substitution (R2 ) 0.96,P < 0.01). However, 20:4n-6 was not present in the intake of fish receiving the VO100treatment and recorded a marginal disappearance (-1.4 ( 0.1mg per fish).
The n-3 fatty acid balance is given inTable 7. The total intakeand disappearance of 18:3 n-3 were positively correlated withthe inclusion of VO in the diet (R2 > 0.99,P < 0.001 andR2
) 0.97, P < 0.01, respectively). Fatty acids on the n-3elongation/desaturation pathway, namely, 18:4 n-3 and 20:4 n-3in the VO50, VO75, and VO100 treatments, recorded anappearance (P < 0.05). The intake of 20:5 n-3 and 22:6 n-3was negatively correlated with the inclusion of VO (R2 ) 0.99,P < 0.001 andR2 ) 0.98,P < 0.001, respectively). However,the 20:5 n-3 and 22:6 n-3 balance, although negative across alltreatments, approached appearance as the level of VO substitu-tion in the diets advanced to 100% (-39.4( 2.7 and-13.3(4.5 mg per fish, respectively).
The majority of the net intake of 18:1 n-9, 18:2 n-6, and 18:3n-3 was accumulated, ranging from 73.6 to 80.4% in 18:1 n-9,
Table 3. Fillet Fatty Acid Composition of Juvenile Murray Cod Fed Different Experimental Diets over a 98 Day Period, Expressed in mg g Lipid-1a
dietary treatmentsb
initialc FO VO25 VO50 VO75 VO100 R2
14:0 22.5 ± 0.4 28.3 ± 1.3 d 19.5 ± 3.9 bc 16.0 ± 2.9 abc 12.8 ± 0.4 ab 9.6 ± 0.4 a 0.94**16:0 125.8 ± 2.1 141.5 ± 1.2 a 142.2 ± 4.5 a 156.4 ± 5.9 c 148.3 ± 1.7 bc 160.5 ± 3.1 c 0.6816:1 n-7 30.3 ± 0.8 48.8 ± 1.6 e 39.9 ± 2.0 d 35.0 ± 2.2 c 21.9 ± 0.6 b 15.7 ± 0.6 a 0.98***18:0 44.7 ± 0.6 35.9 ± 0.2 33.9 ± 0.5 35.1 ± 1.2 34.7 ± 0.5 36.5 ± 0.9 0.1118:1 n-9 118.8 ± 1.9 131.7 ± 4.1 a 153.3 ± 3.3 b 184.1 ± 9.8 c 187.6 ± 3.1 c 225.1 ± 6.6 d 0.96**18:1 n-7 23.6 ± 0.5 27.0 ± 0.8 d 24.4 ± 0.2 c 22.1 ± 1.1 c 17.7 ± 0.1 b 14.6 ± 0.6 a 0.99***18:2 n-6 35.8 ± 0.7 31.8 ± 1.7 a 44.0 ± 0.9 b 56.5 ± 2.8 c 63.7 ± 1.0 d 79.6 ± 1.1 e 0.99***18:3 n-3 7.1 ± 0.3 5.5 ± 0.3 a 36.2 ± 1.3 b 70.9 ± 4.6 c 85.9 ± 1.9 d 113.3 ± 3.1 e 0.99***18:4 n-3 7.3 ± 0.8 6.5 ± 0.4 a 6.7 ± 0.6 a 8.0 ± 0.4 a 8.8 ± 0.5 a 16.5 ± 0.4 b 0.7120:1d 7.2 ± 1.1 10.7 ± 0.8 d 9.2 ± 0.4 cd 7.9 ± 0.2 c 5.5 ± 0.5 ab 4.5 ± 0.3 a 0.98***20:4 n-6 4.9 ± 4.9 8.4 ± 0.3 6.9 ± 0.2 5.5 ± 0.4 5.0 ± 0.1 2.5 ± 0.4 0.96**20:3 n-3 15.3 ± 1.5 7.6 ± 1.6 a 7.3 ± 1.1 a 8.5 ± 1.5 a 11.1 ± 0.4 ab 10.9 ± 0.9 ab 0.83*20:4 n-3 6.2 ± 1.0 8.0 ± 0.9 a 6.9 ± 0.2 a 7.2 ± 0.2 a 7.9 ± 0.1 a 13.1 ± 0.2 b 0.4920:5 n-3 43.9 ± 1.1 37.9 ± 0.9 e 29.0 ± 0.9 d 20.9 ± 0.4 c 14.5 ± 0.5 b 9.6 ± 0.6 a 0.99***22:5 n-3 29.5 ± 0.4 35.6 ± 1.3 e 29.3 ± 0.8 d 23.9 ± 0.7 c 17.1 ± 0.3 b 13.8 ± 0.3 a 0.99***22:6 n-3 136.2 ± 2.1 121.9 ± 2.2 e 99.4 ± 2.1 d 81.8 ± 0.7 c 68.8 ± 2.4 b 38.9 ± 2.1 a 0.98***SFA 212.6 ± 3.7 213.3 ± 3.7 203.6 ± 8.4 213.6 ± 8.1 199.4 ± 3.1 211.5 ± 2.2 0.04MUFA 188.7 ± 2.5 228.7 ± 6.2 a 234.9 ± 5.9 ab 255.6 ± 13.0 ab 237.4 ± 4.5 ab 262.8 ± 7.1 b 0.59PUFA 305.2 ± 9.1 282.5 ± 6.4 283.4 ± 7.0 298.1 ± 8.6 293.7 ± 4.2 312.7 ± 2.8 0.82*HUFA 240.0 ± 4.7 222.7 ± 4.0 e 181.8 ± 3.4 d 150.7 ± 1.6 c 126.9 ± 2.5 b 91.8 ± 4.5 a 0.99***n-3 245.5 ± 2.8 223.0 ± 4.2 214.8 ± 5.7 221.2 ± 5.5 214.1 ± 2.2 216.2 ± 2.0 0.33n-6 50.7 ± 6.1 50.2 ± 2.6 a 60.4 ± 0.2 a 70.4 ± 2.5 b 76.8 ± 1.3 b 93.8 ± 0.6 c 0.98**n-3/n-6 5.0 ± 0.7 4.5 ± 0.2 c 3.6 ± 0.1 b 3.1 ± 0.1 ab 2.8 ± 0.1 ab 2.3 ± 0.1 a 0.96**HUFA/PUFA 0.8 ± 0.0 0.8 ± 0.0 e 0.6 ± 0.0 d 0.5 ± 0.0 c 0.4 ± 0.0 b 0.3 ± 0.0 a 0.99***
a Values in the same row with different superscripts are significantly different (P < 0.05) as determined by ANOVA. Not all fatty acids are reported. Data were alsoanalyzed with linear regression relative to the degree of substitution of FO with the blended vegetable oil; the coefficient of determination R2 and P values (*, <0.05; **,<0.01; and ***, <0.001) are reported. b See Table 1 for diet abbreviations. c Statistical analyses not performed on initial sample. d Represents the sum of all 20:1 isomers.
Fatty Acid metabolism in Murray Cod J. Agric. Food Chem., Vol. 55, No. 4, 2007 1585
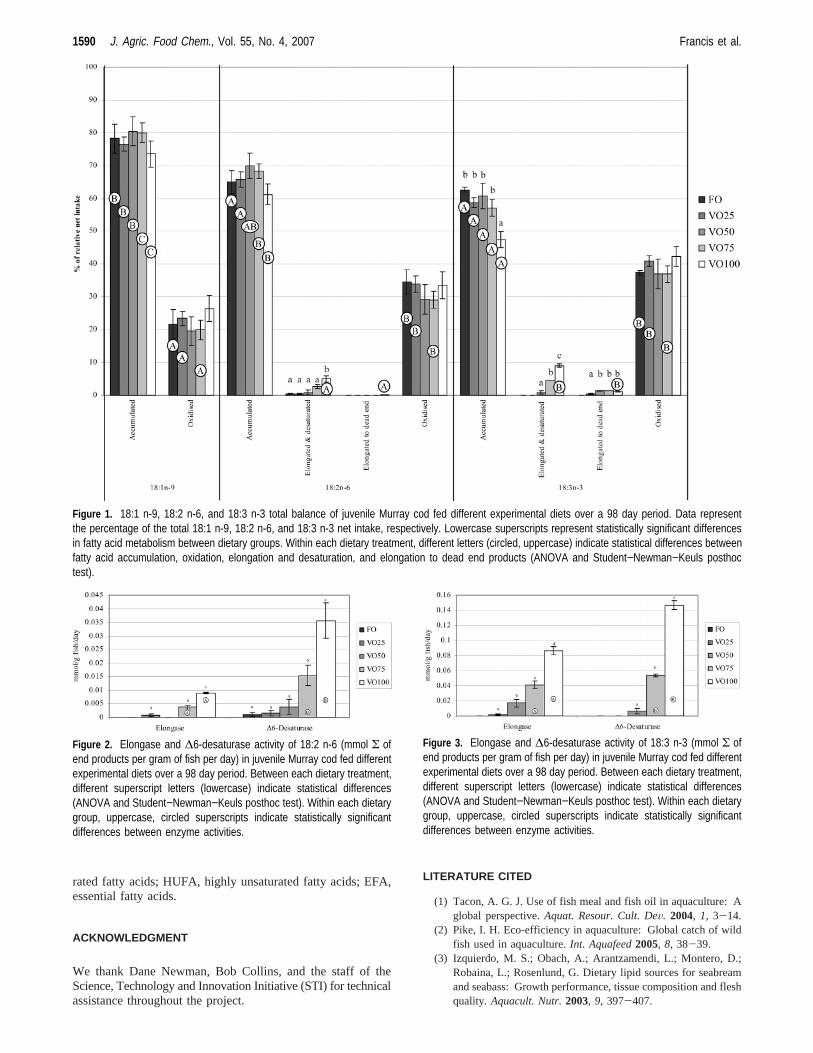
from 61.2 to 69.9% in 18:2 n-6, and from 47.5 to 62.6% in18:3 n-3 (Figure 1). Consequently, a lower percentage of 18:1n-9, 18:2 n-6, and 18:3 n-3 was oxidized (19.6-26.4, 29.1-34.6, and 36.9-42.3%, respectively).
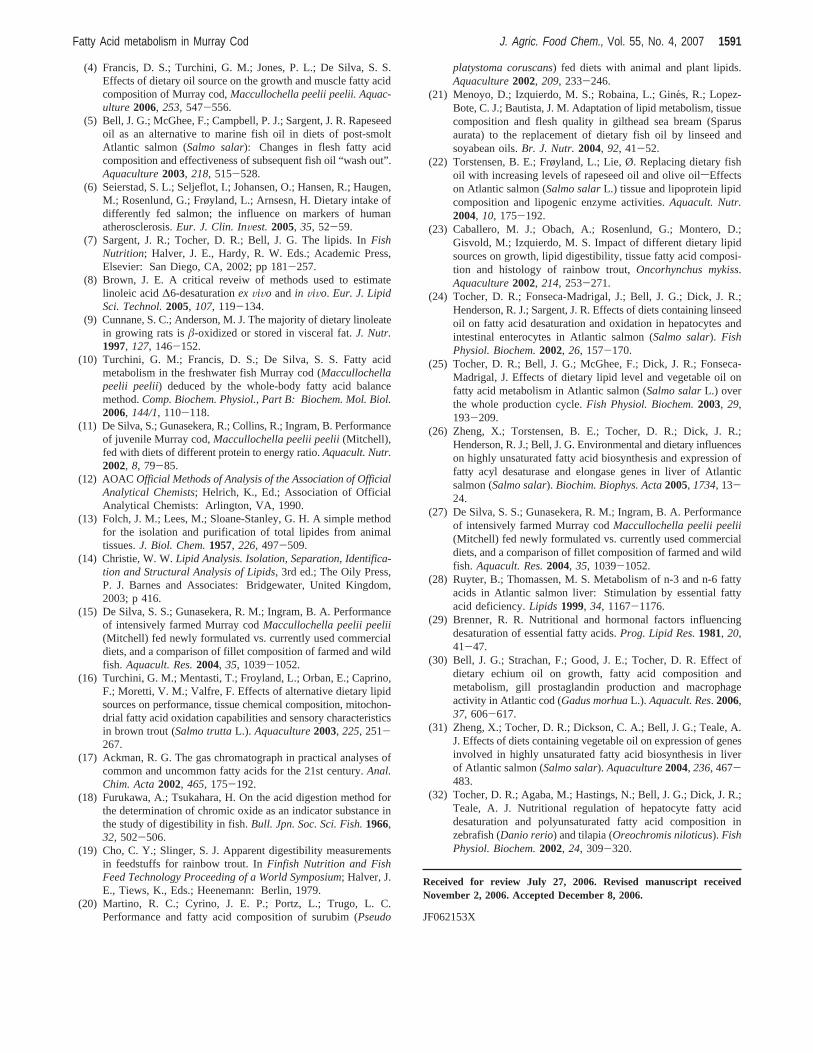
Following the direction of the normal EFA elongation/desaturation pathway, significantly higher amounts (P < 0.05)of 18:2 n-6 and 18:3 n-3 in fish receiving the VO100 wereelongated and desaturated. Total elongase and∆-6 desaturaseactivity of 18:2 n-6 is shown inFigure 2. Elongase and∆-6desaturase activity increased with VO substitution. Fish receiv-ing the VO100 treatment had significantly higher (P < 0.05)elongase and∆-6 desaturase activity as compared to those ofthe other treatments (0.009( 0.0003 and 0.035( 0.007 mmol/gof fish/day, respectively). In fish receiving the VO75 and VO100treatments, the∆-6 desaturase activity was significantly higherthan elongase activity. Similarly, elongase and∆-6 desaturaseactivity in 18:3 n-3 increased with VO substitution (P < 0.05)and was greatest in fish receiving the VO100 treatment (0.09( 0.005 and 0.15( 0.006 mmol/g of fish/day, respectively)(Figure 3). The∆-6 desaturase activity was significantly higherthan the elongase activity in fish receiving the VO75 and VO100treatments.
A direct elongation of 18:2 n-6 and 18:3 n-3 toward deadend products was recorded, and fatty acid dead end productsderived from 18:3 n-3 (i.e., 20:3 n-3) in the VO100 treatmentwere greater (P < 0.05) than those derived from 18:2 n-6 (i.e.,20:2 n-6 and 22:2 n-6) (data not reported).
DISCUSSION
The inclusion of a blended vegetable oil alternative to FO ina semipurified diet for Murray cod had no effect on mortality,palatability, or feed efficiency. However, a reduction in growthperformance was evident with the increasing inclusion level.This result is consistent with a previous study in which Murraycod were fed various alternative vegetable oil lipid sources in
a semipurified diet (4) and studies of other warm waterfreshwater fish species in which the FO component wassubstituted in a similar manner (20, 21). Contrary to this, studieson species including Atlantic salmon (Salmo salar) and rainbowtrout (Oncorhynchus mykiss), reported no significant growtheffects resulting from vegetable oil substitution (22, 23). Apossible explanation for these differences in growth may berelated to the amount of fishmeal in the experimental diets andthe capability of species such as Atlantic salmon to effectivelyutilize dietary lipid to spare protein from energy production.On the other hand, species such as Murray cod are unable toeffectively utilize the protein sparing capability and are not soefficient in utilizing lipid for energy production, and themodification in quality of the dietary lipid source may beresponsible for growth reduction.
In the present study, the lipid content of the fillet ranged from26.1 ( 1.6 to 30.9( 2.1 mg g-1 and did not differ betweendietary treatments. However, there was a significant difference(P < 0.05) in the amount of lipid found within Murray codlivers of fish receiving the VO100 treatment. In previous Murraycod studies in which FO was substituted with linseed or canolaoil, the liver lipid concentration increased as the dietary levelof the substitute oil reached 100% (4). This is consistent withresults obtained by Tocher et al. (24) for Atlantic salmonreceiving diets substituted with linseed oil where increased liverlipid levels were attributable to increased levels of neutral lipids.
The fatty acid composition of fish tissue, as demonstratedpreviously for Murray cod (4) and as is well-documented forother fish species (21, 22), closely reflected that of the dietarylipid source. This resulted in a loss of the human health-promoting factors associated, in particular, with n-3 HUFA.
A variety of methods have been developed to estimateelongase and desaturase activity in animal studies. Of these,the most widely adopted method for fish nutritional studies isan ex vivo assessment method in which tissue microsomes or
Table 4. Liver Fatty Acid Composition of Juvenile Murray Cod Fed Different Experimental Diets over a 98 Day Period, Expressed in mg g Lipid-1a
dietary treatmentsb
initialc FO VO25 VO50 VO75 VO100 R2
14:0 14.9 ± 1.2 5.1 ± 4.4 12.9 ± 2.3 11.9 ± 2.2 12.4 ± 0.2 11.0 ± 0.5 0.3216:0 98.9 ± 5.4 152.4 ± 0.2 a 168.0 ± 7.7 a 202.4 ± 7.8 b 206.2 ± 8.6 b 222.3 ± 9.2 b 0.94**16:1 n-7 23.9 ± 3.2 66.2 ± 0.4 ab 60.8 ± 4.5 ab 70.9 ± 2.2 b 62.4 ± 4.2 ab 54.1 ± 2.8 a 0.3318:0 34.6 ± 0.3 30.7 ± 0.4 a 34.4 ± 0.3 ab 40.0 ± 2.2 bc 38.8 ± 2.3 bc 46.0 ± 2.4 c 0.91*18:1 n-9 100.8 ± 12.7 186.1 ± 0.1 204.5 ± 6.1 258.8 ± 5.7 295.2 ± 9.1 296.5 ± 61.2 0.93**18:1 n-7 22.3 ± 1.9 36.3 ± 0.8 32.2 ± 0.9 33.8 ± 0.4 28.3 ± 1.5 79.1 ± 53.3 0.3818:2 n-6 27.3 ± 2.4 27.1 ± 0.3 a 31.9 ± 3.1 ab 37.9 ± 1.4 b 49.6 ± 2.4 c 58.7 ± 1.7 d 0.97**18:3 n-3 5.2 ± 0.7 3.6 ± 0.3 a 19.7 ± 1.7 b 32.4 ± 1.7 c 47.4 ± 2.3 d 55.2 ± 2.7 e 0.99***18:4 n-3 2.9 ± 1.6 4.0 ± 0.6 a 4.5 ± 0.2 a 6.2 ± 0.2 b 10.1 ± 0.1 c 16.9 ± 0.2 d 0.86*20:1d 8.9 ± 1.2 11.6 ± 0.1 b 9.6 ± 1.1 a 9.0 ± 0.4 a 8.8 ± 0.2 a 7.7 ± 0.1 a 0.89*20:4 n-6 7.7 ± 3.9 6.9 ± 0.3 e 5.6 ± 0.2 d 4.6 ± 0.5 c 2.2 ± 0.3 b 0.5 ± 0.1 a 0.98**20:3 n-3 18.7 ± 2.7 4.0 ± 0.3 6.1 ± 0.8 7.2 ± 0.7 6.7 ± 0.3 5.5 ± 0.4 0.2220:4 n-3 6.4 ± 0.4 5.9 ± 0.1 a 6.2 ± 0.7 a 7.3 ± 0.3 a 10.6 ± 0.9 b 13.0 ± 0.9 c 0.91*20:5 n-3 23.2 ± 1.9 17.4 ± 0.1 e 13.1 ± 0.7 d 8.6 ± 0.2 c 5.6 ± 0.3 b 2.7 ± 0.1 a 0.99***22:5 n-3 35.0 ± 1.3 33.8 ± 1.7 d 23.9 ± 2.4 c 14.9 ± 1.1 b 12.1 ± 1.2 ab 7.3 ± 0.5 a 0.95**22:6 n-3 156.9 ± 7.6 136.2 ± 6.5 e 99.4 ± 8.4 d 62.3 ± 2.6 c 40.7 ± 3.7 b 13.5 ± 0.5 a 0.99***SFA 159.2 ± 4.0 195.9 ± 3.3 a 222.0 ± 6.9 a 259.7 ± 9.4 b 262.6 ± 10.1 b 283.8 ± 11.9 b 0.94**MUFA 170.0 ± 17.7 309.0 ± 1.3 a 314.1 ± 5.6 a 378.7 ± 7.4 b 399.5 ± 12.5 b 439.9 ± 14.1 c 0.95**PUFA 299.7 ± 13.2 256.7 ± 7.5 b 225.4 ± 18.5 ab 197.6 ± 5.2 a 199.6 ± 12.3 a 190.9 ± 7.0 a 0.84*HUFA 249.4 ± 6.7 208.9 ± 8.1 e 158.3 ± 13.3 d 108.7 ± 4.4 c 80.9 ± 6.9 b 45.2 ± 2.1 a 0.99***n-3 248.3 ± 8.0 205.0 ± 6.9 c 172.8 ± 14.4 b 139.0 ± 4.7 a 133.1 ± 8.6 a 114.0 ± 4.9 a 0.94**n-6 45.7 ± 3.8 45.8 ± 0.7 a 47.5 ± 3.7 a 54.6 ± 1.2 a 64.2 ± 3.2 b 75.5 ± 1.8 c 0.94**n-3/n-6 5.5 ± 0.3 4.5 ± 0.1 e 3.6 ± 0.1 d 2.6 ± 0.1 c 2.1 ± 0.1 b 1.5 ± 0.1 a 0.98**HUFA/PUFA 0.8 ± 0.0 0.8 ± 0.0 e 0.7 ± 0.0 d 0.6 ± 0.0 c 0.4 ± 0.0 b 0.2 ± 0.0 a 0.99***
a Values in the same row with different superscripts are significantly different (P < 0.05) as determined by ANOVA. Not all fatty acids are reported. Data were alsoanalyzed with linear regression relative to the degree of substitution of FO with the blended vegetable oil; the coefficient of determination R2 and P values (*, <0.05; **,<0.01; and ***, <0.001) are reported. b See Table 1 for diet abbreviations. c Statistical analyses not performed on initial sample. d Represents the sum of all 20:1 isomers.
1586 J. Agric. Food Chem., Vol. 55, No. 4, 2007 Francis et al.
whole cells (i.e., hepatocytes) are isolated and incubated withlabeled EFAs, i.e., (1-14C) 18:2 n-6 or (1-14C) 18:3 n-3. Theuse of this method is costly and time-consuming and can resultin considerable variation in desaturase activity between species,not to mention within the same species (8, 10). The presentstudy employed the whole-body fatty acid balance method, anin vivo method (9), which provides an estimation of anorganism’s overall capacity to metabolize EFAs within thecontext of an integrated system (8). The whole-body fatty acidbalance method is a simple, relatively inexpensive, routinelaboratory technique that generates consistent results betweenapplications. To date, to the best of the authors’ knowledge,this is the second instance in which this technique has beenapplied in a fish nutrition study. Turchini et al. (10) investigatedthe aptitude of Murray cod in elongating and desaturating 18:2n-6 and 18:3 n-3 to higher homologues when fed dietscontaining either canola or linseed oil. The chief observationin this study was that Murray cod exhibited elongase,∆-5, and∆-6 desaturase activities, all of which were quantified using
the whole-body fatty acid balance method. Given that the onlydifference between Turchini et al. (10) and the present studywas the oil source and a small difference with regard to thesize of initial fish, there was a good agreement between theresults of the two studies with respect to the fate of consumed18:1 n-9, 18:2 n-6, and 18:3 n-3, as well as the total elongaseand desaturase activities in mmol/g of fish/day. Likewise, withrespect to elongase and desaturase activities, the results obtainedfrom this study are in general agreement and within the highlyvariable range of results obtained using the radiolabeledhepatocyte method (25, 26). Additionally, the present studysupports the peculiar and contrasting inverse order of accumula-tion and oxidation of 18:1 n-9, 18:2 n-6, and 18:3 n-3 exhibitedby Murray cod, initially described by De Silva et al. (27) andlater supported by Turchini et al. (10). Moreover, the occurrenceof a “∆-6 desaturase block” acting on 18:2 n-6 in the presenceof excess 18:3 n-3, previously reported for Atlantic salmon (24),was not evident for Murray cod given the appearance ofdesaturase intermediates on the 18:2 n-6 biosynthetic pathway
Table 5. Fatty Acid Class Balance of Juvenile Murray Cod Fed Different Experimental Diets over a 98 Day Period; Data Represent the TotalAmount of Fatty Acid (mg) Per Fisha
dietary treatmentsb
FO VO25 VO50 VO75 VO100 R2
SFAintake 1774.6 ± 51.9 1666.5 ± 59.6 1504.7 ± 88.5 1531.0 ± 97.5 1568.6 ± 82.3 0.61excretion 73.8 ± 5.8 79.7 ± 5.6 83.4 ± 12.4 125.8 ± 34.1 130.0 ± 30.5 0.86*initial body content 252.1 ± 2.7 254.4 ± 3.7 254.5 ± 4.0 253.4 ± 2.0 256.7 ± 6.5 0.58final body content 1544.8 ± 100.0 1347.9 ± 56.4 1318.2 ± 84.1 1243.0 ± 105.4 1173.1 ± 88.8 0.91*accumulation 1292.7 ± 100.9 1093.4 ± 52.7 1063.7 ± 87.6 989.6 ± 107.3 916.5 ± 85.0 0.91*appearance/disappearance −408.1 ± 58.9 −493.3 ± 18.6 −357.6 ± 65.8 −415.6 ± 40.4 −522.1 ± 78.2 0.13
MUFAintake 2205.8 ± 64.5 2068.7 ± 74.0 1886.2 ± 110.9 1921.9 ± 122.5 1940.5 ± 101.8 0.66excretion 97.9 ± 9.9 a 116.2 ± 5.3 a 106.5 ± 11.6 a 154.2 ± 9.3 b 148.5 ± 8.1 b 0.76initial body content 308.9 ± 3.4 311.7 ± 4.6 311.8 ± 4.9 310.5 ± 2.5 314.5 ± 8.0 0.58final body content 1910.5 ± 125.2 1769.2 ± 88.1 1744.2 ± 107.6 1752.7 ± 144.0 1692.0 ± 107.8 0.77accumulation 1601.6 ± 126.6 1457.5 ± 83.6 1432.5 ± 111.7 1442.3 ± 146.3 1377.5 ± 104.4 0.77appearance/disappearance −506.4 ± 80.5 −495.0 ± 31.0 −347.2 ± 83.2 −325.5 ± 35.7 −414.5 ± 81.0 0.46
n-3 PUFAintake 1922.9 ± 56.2 1728.5 ± 61.8 1566.9 ± 92.1 1574.3 ± 100.3 1584.9 ± 83.2 0.73excretion 43.5 ± 5.2 a 46.8 ± 1.0 a 44.2 ± 5.3 a 64.3 ± 3.7 b 67.5 ± 3.1 b 0.79*initial body content 232.0 ± 2.5 234.1 ± 3.4 234.1 ± 3.7 233.1 ± 1.9 236.2 ± 6.0 0.58final body content 1391.4 ± 87.8 1290.8 ± 65.1 1226.8 ± 79.4 1197.8 ± 96.9 1116.0 ± 61.0 0.97**accumulation 1159.4 ± 89.3 1056.7 ± 62.2 992.7 ± 82.3 964.6 ± 98.5 879.9 ± 58.8 0.97**appearance/disappearance −720.1 ± 56.2 −625.0 ± 42.1 −530.0 ± 74.7 −545.4 ± 6.7 −637.6 ± 65.7 0.25
n-6 PUFAintake 465.8 ± 13.6 a 516.8 ± 18.5 ab 536.0 ± 31.5 ab 603.7 ± 38.5 bc 668.4 ± 35.1 c 0.97**excretion 17.8 ± 1.7 a 20.3 ± 0.6 a 19.6 ± 2.6 a 30.6 ± 1.6 b 33.4 ± 1.7 b 0.85*initial body content 77.8 ± 0.8 78.5 ± 1.2 78.5 ± 1.2 78.2 ± 0.6 79.2 ± 2.0 0.58final body content 374.4 ± 20.6 409.6 ± 22.3 440.6 ± 27.7 484.4 ± 41.9 500.3 ± 31.0 0.99***accumulation 296.7 ± 21.0 331.1 ± 21.3 362.1 ± 28.7 406.2 ± 42.4 421.1 ± 30.5 0.98***appearance/disappearance −151.3 ± 12.1 −165.5 ± 11.9 −154.2 ± 25.0 −166.9 ± 5.1 −213.9 ± 31.9 0.63
n-3 HUFAintake 1770.0 ± 51.7 e 1210.6 ± 43.3 d 750.8 ± 44.1 c 418.7 ± 26.7 b 92.6 ± 4.9 a 0.98***excretion 39.6 ± 4.3 d 31.9 ± 0.7 c 21.6 ± 2.3 b 18.1 ± 1.1 ab 11.2 ± 1.1 a 0.98**initial body content 209.3 ± 2.3 211.2 ± 3.1 211.3 ± 3.3 210.4 ± 1.7 213.1 ± 5.4 0.58final body content 1286.7 ± 84.7 e 969.2 ± 49.5 d 705.3 ± 37.0 c 499.4 ± 31.7 b 326.0 ± 6.4 a 0.99***accumulation 1077.4 ± 86.1 e 758.0 ± 47.0 d 494.1 ± 39.57 c 289.0 ± 33.1 b 112.9 ± 6.6 a 0.99***appearance/disappearance −653.0 ± 55.3 a −420.7 ± 36.4 b −235.2 ± 37.1 c −111.5 ± 9.6 d 31.5 ± 9.2 e 0.98***
n-6 HUFAintake 74.4 ± 2.2 d 53.0 ± 1.9 c 39.1 ± 2.3 b 19.8 ± 1.3 a 0.99***excretion 2.9 ± 0.6 b 1.3 ± 0.1 a 0.6 ± 0.3 a 0.6 ± 0.1 a 0.83*initial body content 12.7 ± 0.1 12.8 ± 0.2 12.8 ± 0.2 12.7 ± 0.1 12.9 ± 0.3 0.58final body content 62.0 ± 3.0 e 49.0 ± 2.8 d 38.0 ± 2.4 c 28.1 ± 2.3 b 18.3 ± 1.6 a 0.99***accumulation 49.4 ± 3.0 e 36.2 ± 2.6 d 25.2 ± 2.6 c 15.4 ± 2.4 b 5.4 ± 1.4 a 0.99***appearance/disappearance −22.1 ± 1.4 a −15.5 ± 2.2 b −13.4 ± 1.1 b −3.8 ± 1.2 c 5.4 ± 1.4 d 0.96**
a Values in the same row with different superscripts are significantly different (P < 0.05) as determined by ANOVA. Data were also analyzed with linear regressionrelative to the degree of substitution of FO with the blended vegetable oil; the coefficient of determination R2 and P values (*, <0.05; **, <0.01; and ***, <0.001) are reported.b See Table 1 for diet abbreviations. Blank cells, not detected.
Fatty Acid metabolism in Murray Cod J. Agric. Food Chem., Vol. 55, No. 4, 2007 1587
(18:3 n-6). Taking all this into account, it is conceivable thatthe role of n-6 fatty acids in the general fatty acid balance ofMurray cod is the result of an adaptation to a natural diet richin freshwater crustaceans and ultimately n-6 fatty acids.
It has been outlined previously that dietary lipid source canhave a marked impact on overall lipid metabolism, resulting inincreased elongase and desaturase activities when a HUFAdeficient vegetable oil is substituted for FO (10). Consistentwith this observation, a significant increase in elongase/desaturase activities was evident in this study with the inclusionof the VO. Significantly greater proportions of 18:3 n-3 wereelongated to dead end products as compared to that of 18:2n-6, a result consistent with studies on Atlantic salmon (28).Furthermore, there was an appearance of fatty acids on boththe∆-9 (data not reported) and the∆-6 biosynthetic pathways.This resulted in the production of fatty acids including 16:1n-7, 18:4 n-3, and 18:3 n-6. In this instance,∆-5 desaturaseactivity could not be quantified as an appearance of 20:5 n-3and 20:4 n-6 was masked by concentrations of these fatty acidsin the initial fish samples. However, it is probable that theproduction of these fatty acids would have been quantifiable ifthe experiment duration had been longer, although productionwould be negligible (5). The affinity of elongase and desaturaseactivities for fatty acids in the order of n-3< n-6 < n-9 hasbeen well-documented in teleost fish species (7, 10) and is
further supported in the present study. The∆-6 desaturase hasbeen previously described as the rate-limiting enzyme in thefatty acid biosynthetic pathway (29). However, elevated levelsof 18:4 n-3 and 18:3 n-6 in Murray cod samples coupled withresults from experiments in which diets were supplemented withoils rich in ∆-6 desaturated fatty acids (30) suggest that theproduction of n-3 and n-6 HUFA is more than likely limitedby ∆-5 desaturase.
The occurrence of a positive feedback mechanism in relationto the amount of dietary precursor, or a negative feedbackmechanism in response to decreased product, or possibly acombination of both, appears to be the driving influence behindthe increase in elongase and desaturase in this experiment.Similar observations have been reported previously for Murraycod (10), as well as for other species (31). At this stage, theunderlying mechanism responsible for increased activity isrelatively unclear and requires further investigation. Tocher etal. (32) speculate that increased elongase and desaturaseactivities in fish are a direct result of a reduction in productrather than an increased provision of precursor for the first stepin the biosynthetic pathway. Conversely, combining the resultsof the present study alongside those of Turchini et al. (10), wecan speculate that at least for the species under examination,that increased activity is a result of elevated precursor level.
The whole-body fatty acid balance method has proved useful
Table 6. n-6 Fatty Acid Balance for the Normal Pathway of Juvenile Murray Cod Fed Different Experimental Diets over a 98 Day Period; DataRepresent the Total Amount of Fatty Acid (mg) Per Fisha
dietary treatmentsb
FO VO25 VO50 VO75 VO100 R2
18:2 n-6intake 328.6 ± 9.6 a 416.6 ± 14.9 b 468.0 ± 27.5 b 568.8 ± 36.2 c 666.2 ± 35.0 d 0.99***excretion 12.6 ± 1.3 a 17.2 ± 0.7 ab 18.7 ± 2.2 b 30.0 ± 1.7 c 32.8 ± 1.6 c 0.94**initial body content 56.8 ± 0.6 57.3 ± 0.8 57.3 ± 0.9 57.1 ± 0.5 57.8 ± 1.5 0.58final body content 262.7 ± 15.3 a 320.3 ± 17.1 ab 370.6 ± 22.6 bc 426.6 ± 35.0 c 445.2 ± 27.7 c 0.98**accumulation 205.9 ± 15.5 a 263.0 ± 16.3 ab 313.3 ± 23.4 bc 369.5 ± 35.4 c 387.4 ± 27.1 c 0.98**appearance/disappearance −110.0 ± 8.5 b −136.5 ± 9.0 b −135.9 ± 20.2 b −169.4 ± 2.6 b −246.0 ± 26.1 a 0.84*
18:3 n-6intake 8.4 ± 0.3 c 8.6 ± 0.3 c 4.3 ± 0.3 b 1.1 ± 0.1 a 1.1 ± 0.1 a 0.89*excretion 0.3 ± 0.2 0.1 ± 0.1 0.1 ± 0.1 0.87*initial body content 2.3 ± 0.1 2.3 ± 0.1 2.3 ± 0.1 2.3 ± 0.1 2.3 ± 0.1 0.58final body content 10.8 ± 1.4 11.0 ± 1.9 a 10.2 ± 2.5 a 14.4 ± 3.4 a 28.2 ± 5.6 b 0.63accumulation 8.5 ± 1.4 a 8.7 ± 1.8 a 7.9 ± 2.5 a 12.0 ± 3.4 a 25.9 ± 5.6 b 0.63appearance/disappearance 0.4 ± 1.6 a 0.2 ± 1.4 a 3.7 ± 2.7 a 10.9 ± 3.4 a 24.7 ± 5.6 b 0.83*
20:3 n-6intake 11.7 ± 0.3 c 6.5 ± 0.2 b 7.1 ± 0.4 b 2.5 ± 0.2 a 0.93**excretion 0.6 ± 0.4 0.1 ± 0.1 0.63initial body content 1.8 ± 0.1 1.9 ± 0.1 1.9 ± 0.1 1.9 ± 0.1 1.9 ± 0.1 0.58final body content 10.2 ± 0.8 9.1 ± 0.8 8.4 ± 0.7 8.1 ± 0.8 9.0 ± 0.6 0.45accumulation 8.3 ± 0.8 7.2 ± 0.8 6.5 ± 0.7 6.3 ± 0.8 7.1 ± 0.6 0.46appearance/disappearance −2.7 ± 0.1 a 0.8 ± 0.6 b −0.6 ± 0.4 b 3.7 ± 0.7 c 7.1 ± 0.6 d 0.87*
20:4 n-6intake 48.1 ± 1.4 d 34.5 ± 1.2 c 23.0 ± 1.4 b 13.1 ± 0.8 a 0.99***excretion 1.8 ± 0.2 c 1.2 ± 0.1 b 0.5 ± 0.3 a 0.4 ± 0.2 a 0.93**initial body content 9.0 ± 0.1 9.1 ± 0.1 9.1 ± 0.1 9.1 ± 0.1 9.2 ± 0.2 0.58final body content 40.8 ± 2.1 e 31.8 ± 1.3 d 23.9 ± 1.7 c 15.2 ± 0.8 b 7.8 ± 0.3 a 0.99***accumulation 31.8 ± 2.2 e 22.7 ± 1.3 d 14.8 ± 1.9 c 6.1 ± 0.8 b −4.6 ± 0.1 a 0.99***appearance/disappearance −14.5 ± 0.8 a −10.6 ± 1.3 b −7.8 ± 1.1 c −6.7 ± 0.4 c −1.4 ± 0.1 d 0.96**
22:4 n-6intake 14.6 ± 0.4 d 12.0 ± 0.4 c 9.1 ± 0.5 b 4.1 ± 0.3 a 0.98***excretion 0.6 ± 0.3 0.1 ± 0.1 0.3 ± 0.1 0.35initial body content 1.8 ± 0.1 1.8 ± 0.1 1.8 ± 0.1 1.8 ± 0.1 1.8 ± 0.1 0.58final body content 11.0 ± 0.6 d 8.1 ± 0.7 c 5.8 ± 0.3 b 4.9 ± 0.8 b 1.6 ± 0.8 a 0.98**accumulation 9.2 ± 0.6 d 6.3 ± 0.6 c 4.0 ± 0.3 b 3.1 ± 0.8 b −0.8 ± 2.3 a 0.97**appearance/disappearance −4.8 ± 1.0 a −5.7 ± 0.4 a −5.0 ± 0.4 a −0.8 ± 0.7 b −0.3 ± 0.8 b 0.75
a Values in the same row with different superscripts are significantly different (P < 0.05) as determined by ANOVA. Data were also analyzed with linear regressionrelative to the degree of substitution of FO with the blended vegetable oil; the coefficient of determination R2 and P values (*, <0.05; **, <0.01; and ***, <0.001) are reported.b See Table 1 for diet abbreviations. Blank cells, not detected.
1588 J. Agric. Food Chem., Vol. 55, No. 4, 2007 Francis et al.
in answering key questions regarding the lipid metabolism ofMurray cod. As with any method, there are certain limitationsthat can restrict accuracy and feasibility. The allowance foreicosanoid production, fatty acid derivatives chiefly from theC20 PUFA 20:3 n-6, 20:4 n-6, and 20:5 n-3 (7), is one variablethat the whole-body fatty acid balance method does not takeinto consideration. However, as outlined previously (9, 10), itis acceptable that the conversion of these C20 PUFA is minimal,having little impact on the total balance of fatty acids.Additionally, the implementation of the whole-body fatty acidbalance method requires the use of a semipurified diet in orderto minimize the underestimation of activity arising from thepresence of elongase and desaturase intermediates present in apractical diet. This, coupled with a relatively long experimentalperiod, limits the method to small scale laboratory trials.
In conclusion, using the whole-body fatty acid balancemethod, this study has confirmed that Murray cod efficientlyelongate and desaturate 18:2 n-6 and 18:3 n-3. Dietary vegetableoil inclusion resulted in increased elongase and desaturase
activities and exhibited a higher affinity toward n-3 fatty acids.The ∆-6 desaturase enzyme was found to be more active thanboth elongase and∆-5 desaturase activity, while Murray codwas found to have a preferential order of fatty acid oxidationof 18:3 n-3> 18:2 n-6> 18:1 n-9. However, despite increasedlevels of elongase and desaturase activities, substituting dietaryFO with a VO resulted in decreased growth rates, a substantialfillet fatty acid modification, and ramifications from a humanhealth point of view. Ultimately, this study has clearly proventhe usefulness of in vivo methods for the assessment of fattyacid metabolism, demonstrating good consistency betweenapplications and comparability with results obtained using exvivo counterparts.
ABBREVIATIONS USED
VO, vegetable oil blend; FO, fish oil; SFA, saturated fattyacids; MUFA, monounsaturated fatty acids; PUFA, polyunsatu-
Table 7. n-3 Fatty Acid Balance for the Normal Pathway of Juvenile Murray Cod Fed Different Experimental Diets over a 98 Day Period; DataRepresent the Total Amount of Fatty Acid (mg) Per Fisha
dietary treatmentsb
FO VO25 VO50 VO75 VO100 R2
18:3 n-3intake 62.6 ± 1.8 a 452.9 ± 16.2 b 773.7 ± 45.5 c 1132.0 ± 72.1 d 1483.0 ± 77.8 e 0.99***excretion 2.4 ± 0.2 a 13.7 ± 0.5 b 22.1 ± 2.8 c 46.0 ± 2.5 d 56.3 ± 2.5 e 0.97**initial body content 10.1 ± 0.1 10.2 ± 0.2 10.2 ± 0.2 10.1 ± 0.1 10.3 ± 0.3 0.58final body content 47.8 ± 1.0 a 268.5 ± 15.5 b 466.6 ± 38.8 c 633.8 ± 64.3 d 687.4 ± 48.5 d 0.96**accumulation 37.7 ± 0.9 a 258.4 ± 15.4 b 456.4 ± 39.0 c 623.7 ± 64.4 d 677.1 ± 48.4 d 0.96**appearance/disappearance −22.5 ± 1.0 e −180.8 ± 4.5 d −295.2 ± 34.9 c −462.3 ± 14.3 b −749.6 ± 55.9 a 0.97**
18:4 n-3intake 90.3 ± 2.6 e 65.0 ± 2.3 d 42.3 ± 2.5 c 23.6 ± 1.5 b 9.3 ± 0.5 a 0.99***excretion 1.5 ± 0.7 1.2 ± 0.2 0.5 ± 0.3 0.1 ± 0.1 0.95**initial body content 12.6 ± 0.14 12.7 ± 0.2 12.7 ± 0.2 12.6 ± 0.1 12.8 ± 0.3 0.58final body content 56.8 ± 2.8 a 53.1 ± 1.6 a 54.9 ± 3.8 a 64.5 ± 2.7 a 102.7 ± 6.0 b 0.62accumulation 44.3 ± 2.8 a 40.4 ± 1.4 a 42.3 ± 4.0 a 51.9 ± 2.8 a 89.9 ± 5.9 b 0.62appearance/disappearance −44.5 ± 1.6 a −23.5 ± 1.5 b 0.4 ± 3.1 c 28.5 ± 1.4 d 80.5 ± 5.6 e 0.96**
20:4 n-3intake 79.0 ± 2.3 e 55.0 ± 2.0 d 32.1 ± 1.9 c 16.3 ± 1.1 b 1.0 ± 0.1 a 0.99***excretion 2.0 ± 0.2 b 1.6 ± 0.1 b 0.8 ± 0.2 a 0.4 ± 0.2 a 0.98***initial body content 7.9 ± 0.1 7.9 ± 0.1 8.0 ± 0.1 7.9 ± 0.1 8.0 ± 0.2 0.58final body content 59.2 ± 3.4 b 48.7 ± 2.3 b 44.1 ± 2.9 a 46.3 ± 3.3 a 61.7 ± 3.7 a 0.00accumulation 51.3 ± 3.4 b 40.7 ± 2.2 a 36.1 ± 3.0 a 38.4 ± 3.3 a 53.6 ± 3.6 b 0.00appearance/disappearance −25.7 ± 2.0 a −12.7 ± 1.3 b 4.8 ± 2.4 c 22.4 ± 2.2 d 52.6 ± 3.5 e 0.97**
20:5 n-3intake 576.9 ± 16.9 e 395.5 ± 14.1 d 244.7 ± 14.4 c 137.1 ± 8.7 b 28.8 ± 1.5 a 0.99***excretion 8.3 ± 0.9 d 6.6 ± 0.2 c 4.4 ± 0.6 b 3.5 ± 0.1 b 1.6 ± 0.1 a 0.99***initial body content 55.2 ± 0.6 55.7 ± 0.8 55.7 ± 0.9 55.4 ± 0.5 56.2 ± 1.4 0.58final body content 262.6 ± 16.2 e 186.8 ± 8.9 d 122.6 ± 6.0 c 77.9 ± 4.6 b 44.0 ± 0.3 a 0.98**accumulation 207.4 ± 16.6 e 131.1 ± 8.2 d 67.0 ± 6.5 c 22.5 ± 4.9 b −40.3 ± 3.9 a 0.99***appearance/disappearance −361.1 ± 10.5 a −257.7 ± 9.4 b −173.3 ± 12.4 c −111.1 ± 4.3 d −39.4 ± 2.7 e 0.99***
22:5 n-3intake 260.2 ± 7.6 e 175.4 ± 6.3 d 107.6 ± 6.3 c 55.9 ± 3.6 b 6.1 ± 0.3 a 0.99***excretion 6.9 ± 0.9 d 5.0 ± 0.2 c 3.3 ± 0.5 b 2.5 ± 0.2 b 0.8 ± 0.1 a 0.98***initial body content 36.3 ± 0.4 36.7 ± 0.5 36.7 ± 0.6 36.5 ± 0.3 37.0 ± 0.9 0.58final body content 264.3 ± 16.8 e 190.0 ± 9.0 d 138.2 ± 8.6 c 90.3 ± 7.0 b 55.9 ± 1.4 a 0.98**accumulation 227.9 ± 17.0 e 153.3 ± 8.5 d 101.5 ± 9.0 c 53.8 ± 7.2 b 19.0 ± 1.6 a 0.98**appearance/disappearance −25.4 ± 11.8 a −17.1 ± 5.9 a −2.8 ± 7.4 ab 0.3 ± 4.0 ab 13.7 ± 1.6 c 0.98**
22:6 n-3intake 828.7 ± 24.2 e 563.2 ± 20.1 d 348.8 ± 20.5 c 190.9 ± 12.2 b 38.5 ± 2.0 a 0.98***excretion 18.6 ± 2.2 d 14.1 ± 0.3 c 9.3 ± 1.3 b 7.7 ± 0.6 b 3.2 ± 0.3 a 0.98**initial body content 105.9 ± 1.2 106.9 ± 1.6 106.9 ± 1.7 106.5 ± 0.9 107.8 ± 2.7 0.58final body content 681.9 ± 47.8 e 521.2 ± 28.1 d 371.3 ± 19.1 c 249.6 ± 14.4 b 129.8 ± 0.3 a 0.99***accumulation 576.0 ± 48.5 e 414.3 ± 26.9 d 264.4 ± 20.3 c 143.1 ± 15.0 b 22.0 ± 2.8 a 0.99***appearance/disappearance −234.2 ± 33.9 a −134.8 ± 21.6 b −75.0 ± 17.3 bc −40.1 ± 4.0 c −13.3 ± 4.5 c 0.93**
a Values in the same row with different superscripts are significantly different (P < 0.05) as determined by ANOVA. Data were also analyzed with linear regressionrelative to the degree of substitution of FO with the blended vegetable oil; the coefficient of determination R2 and P values (*, <0.05; **, <0.01; and ***, <0.001) are reported.b See Table 1 for diet abbreviations. Blank cells, not detected.
Fatty Acid metabolism in Murray Cod J. Agric. Food Chem., Vol. 55, No. 4, 2007 1589
rated fatty acids; HUFA, highly unsaturated fatty acids; EFA,essential fatty acids.
ACKNOWLEDGMENT
We thank Dane Newman, Bob Collins, and the staff of theScience, Technology and Innovation Initiative (STI) for technicalassistance throughout the project.
LITERATURE CITED
(1) Tacon, A. G. J. Use of fish meal and fish oil in aquaculture: Aglobal perspective.Aquat. Resour. Cult. DeV. 2004, 1, 3-14.
(2) Pike, I. H. Eco-efficiency in aquaculture: Global catch of wildfish used in aquaculture.Int. Aquafeed2005, 8, 38-39.
(3) Izquierdo, M. S.; Obach, A.; Arantzamendi, L.; Montero, D.;Robaina, L.; Rosenlund, G. Dietary lipid sources for seabreamand seabass: Growth performance, tissue composition and fleshquality. Aquacult. Nutr.2003, 9, 397-407.
Figure 1. 18:1 n-9, 18:2 n-6, and 18:3 n-3 total balance of juvenile Murray cod fed different experimental diets over a 98 day period. Data representthe percentage of the total 18:1 n-9, 18:2 n-6, and 18:3 n-3 net intake, respectively. Lowercase superscripts represent statistically significant differencesin fatty acid metabolism between dietary groups. Within each dietary treatment, different letters (circled, uppercase) indicate statistical differences betweenfatty acid accumulation, oxidation, elongation and desaturation, and elongation to dead end products (ANOVA and Student−Newman−Keuls posthoctest).
Figure 2. Elongase and ∆6-desaturase activity of 18:2 n-6 (mmol Σ ofend products per gram of fish per day) in juvenile Murray cod fed differentexperimental diets over a 98 day period. Between each dietary treatment,different superscript letters (lowercase) indicate statistical differences(ANOVA and Student−Newman−Keuls posthoc test). Within each dietarygroup, uppercase, circled superscripts indicate statistically significantdifferences between enzyme activities.
Figure 3. Elongase and ∆6-desaturase activity of 18:3 n-3 (mmol Σ ofend products per gram of fish per day) in juvenile Murray cod fed differentexperimental diets over a 98 day period. Between each dietary treatment,different superscript letters (lowercase) indicate statistical differences(ANOVA and Student−Newman−Keuls posthoc test). Within each dietarygroup, uppercase, circled superscripts indicate statistically significantdifferences between enzyme activities.
1590 J. Agric. Food Chem., Vol. 55, No. 4, 2007 Francis et al.
(4) Francis, D. S.; Turchini, G. M.; Jones, P. L.; De Silva, S. S.Effects of dietary oil source on the growth and muscle fatty acidcomposition of Murray cod,Maccullochella peelii peelii. Aquac-ulture 2006, 253, 547-556.
(5) Bell, J. G.; McGhee, F.; Campbell, P. J.; Sargent, J. R. Rapeseedoil as an alternative to marine fish oil in diets of post-smoltAtlantic salmon (Salmo salar): Changes in flesh fatty acidcomposition and effectiveness of subsequent fish oil “wash out”.Aquaculture2003, 218, 515-528.
(6) Seierstad, S. L.; Seljeflot, I.; Johansen, O.; Hansen, R.; Haugen,M.; Rosenlund, G.; Frøyland, L.; Arnsesn, H. Dietary intake ofdifferently fed salmon; the influence on markers of humanatherosclerosis.Eur. J. Clin. InVest.2005, 35, 52-59.
(7) Sargent, J. R.; Tocher, D. R.; Bell, J. G. The lipids. InFishNutrition; Halver, J. E., Hardy, R. W. Eds.; Academic Press,Elsevier: San Diego, CA, 2002; pp 181-257.
(8) Brown, J. E. A critical reveiw of methods used to estimatelinoleic acid∆6-desaturationex ViVo and in ViVo. Eur. J. LipidSci. Technol.2005, 107, 119-134.
(9) Cunnane, S. C.; Anderson, M. J. The majority of dietary linoleatein growing rats isâ-oxidized or stored in visceral fat.J. Nutr.1997, 127, 146-152.
(10) Turchini, G. M.; Francis, D. S.; De Silva, S. S. Fatty acidmetabolism in the freshwater fish Murray cod (Maccullochellapeelii peelii) deduced by the whole-body fatty acid balancemethod.Comp. Biochem. Physiol., Part B: Biochem. Mol. Biol.2006, 144/1, 110-118.
(11) De Silva, S.; Gunasekera, R.; Collins, R.; Ingram, B. Performanceof juvenile Murray cod,Maccullochella peelii peelii(Mitchell),fed with diets of different protein to energy ratio.Aquacult. Nutr.2002, 8, 79-85.
(12) AOACOfficial Methods of Analysis of the Association of OfficialAnalytical Chemists; Helrich, K., Ed.; Association of OfficialAnalytical Chemists: Arlington, VA, 1990.
(13) Folch, J. M.; Lees, M.; Sloane-Stanley, G. H. A simple methodfor the isolation and purification of total lipides from animaltissues.J. Biol. Chem.1957, 226, 497-509.
(14) Christie, W. W.Lipid Analysis. Isolation, Separation, Identifica-tion and Structural Analysis of Lipids, 3rd ed.; The Oily Press,P. J. Barnes and Associates: Bridgewater, United Kingdom,2003; p 416.
(15) De Silva, S. S.; Gunasekera, R. M.; Ingram, B. A. Performanceof intensively farmed Murray codMaccullochella peelii peelii(Mitchell) fed newly formulated vs. currently used commercialdiets, and a comparison of fillet composition of farmed and wildfish. Aquacult. Res.2004, 35, 1039-1052.
(16) Turchini, G. M.; Mentasti, T.; Froyland, L.; Orban, E.; Caprino,F.; Moretti, V. M.; Valfre, F. Effects of alternative dietary lipidsources on performance, tissue chemical composition, mitochon-drial fatty acid oxidation capabilities and sensory characteristicsin brown trout (Salmo truttaL.). Aquaculture2003, 225, 251-267.
(17) Ackman, R. G. The gas chromatograph in practical analyses ofcommon and uncommon fatty acids for the 21st century.Anal.Chim. Acta2002, 465, 175-192.
(18) Furukawa, A.; Tsukahara, H. On the acid digestion method forthe determination of chromic oxide as an indicator substance inthe study of digestibility in fish.Bull. Jpn. Soc. Sci. Fish.1966,32, 502-506.
(19) Cho, C. Y.; Slinger, S. J. Apparent digestibility measurementsin feedstuffs for rainbow trout. InFinfish Nutrition and FishFeed Technology Proceeding of a World Symposium; Halver, J.E., Tiews, K., Eds.; Heenemann: Berlin, 1979.
(20) Martino, R. C.; Cyrino, J. E. P.; Portz, L.; Trugo, L. C.Performance and fatty acid composition of surubim (Pseudo
platystoma coruscans) fed diets with animal and plant lipids.Aquaculture2002, 209, 233-246.
(21) Menoyo, D.; Izquierdo, M. S.; Robaina, L.; Gine´s, R.; Lopez-Bote, C. J.; Bautista, J. M. Adaptation of lipid metabolism, tissuecomposition and flesh quality in gilthead sea bream (Sparusaurata) to the replacement of dietary fish oil by linseed andsoyabean oils.Br. J. Nutr.2004, 92, 41-52.
(22) Torstensen, B. E.; Frøyland, L.; Lie, Ø. Replacing dietary fishoil with increasing levels of rapeseed oil and olive oilsEffectson Atlantic salmon (Salmo salarL.) tissue and lipoprotein lipidcomposition and lipogenic enzyme activities.Aquacult. Nutr.2004, 10, 175-192.
(23) Caballero, M. J.; Obach, A.; Rosenlund, G.; Montero, D.;Gisvold, M.; Izquierdo, M. S. Impact of different dietary lipidsources on growth, lipid digestibility, tissue fatty acid composi-tion and histology of rainbow trout,Oncorhynchus mykiss.Aquaculture2002, 214, 253-271.
(24) Tocher, D. R.; Fonseca-Madrigal, J.; Bell, J. G.; Dick, J. R.;Henderson, R. J.; Sargent, J. R. Effects of diets containing linseedoil on fatty acid desaturation and oxidation in hepatocytes andintestinal enterocytes in Atlantic salmon (Salmo salar). FishPhysiol. Biochem.2002, 26, 157-170.
(25) Tocher, D. R.; Bell, J. G.; McGhee, F.; Dick, J. R.; Fonseca-Madrigal, J. Effects of dietary lipid level and vegetable oil onfatty acid metabolism in Atlantic salmon (Salmo salarL.) overthe whole production cycle.Fish Physiol. Biochem.2003, 29,193-209.
(26) Zheng, X.; Torstensen, B. E.; Tocher, D. R.; Dick, J. R.;Henderson, R. J.; Bell, J. G. Environmental and dietary influenceson highly unsaturated fatty acid biosynthesis and expression offatty acyl desaturase and elongase genes in liver of Atlanticsalmon (Salmo salar). Biochim. Biophys. Acta2005, 1734, 13-24.
(27) De Silva, S. S.; Gunasekera, R. M.; Ingram, B. A. Performanceof intensively farmed Murray codMaccullochella peelii peelii(Mitchell) fed newly formulated vs. currently used commercialdiets, and a comparison of fillet composition of farmed and wildfish. Aquacult. Res.2004, 35, 1039-1052.
(28) Ruyter, B.; Thomassen, M. S. Metabolism of n-3 and n-6 fattyacids in Atlantic salmon liver: Stimulation by essential fattyacid deficiency.Lipids 1999, 34, 1167-1176.
(29) Brenner, R. R. Nutritional and hormonal factors influencingdesaturation of essential fatty acids.Prog. Lipid Res.1981, 20,41-47.
(30) Bell, J. G.; Strachan, F.; Good, J. E.; Tocher, D. R. Effect ofdietary echium oil on growth, fatty acid composition andmetabolism, gill prostaglandin production and macrophageactivity in Atlantic cod (Gadus morhuaL.). Aquacult. Res. 2006,37, 606-617.
(31) Zheng, X.; Tocher, D. R.; Dickson, C. A.; Bell, J. G.; Teale, A.J. Effects of diets containing vegetable oil on expression of genesinvolved in highly unsaturated fatty acid biosynthesis in liverof Atlantic salmon (Salmo salar). Aquaculture2004, 236, 467-483.
(32) Tocher, D. R.; Agaba, M.; Hastings, N.; Bell, J. G.; Dick, J. R.;Teale, A. J. Nutritional regulation of hepatocyte fatty aciddesaturation and polyunsaturated fatty acid composition inzebrafish (Danio rerio) and tilapia (Oreochromis niloticus). FishPhysiol. Biochem.2002, 24, 309-320.
Received for review July 27, 2006. Revised manuscript receivedNovember 2, 2006. Accepted December 8, 2006.
JF062153X
Fatty Acid metabolism in Murray Cod J. Agric. Food Chem., Vol. 55, No. 4, 2007 1591