Embed Size (px)
Citation preview
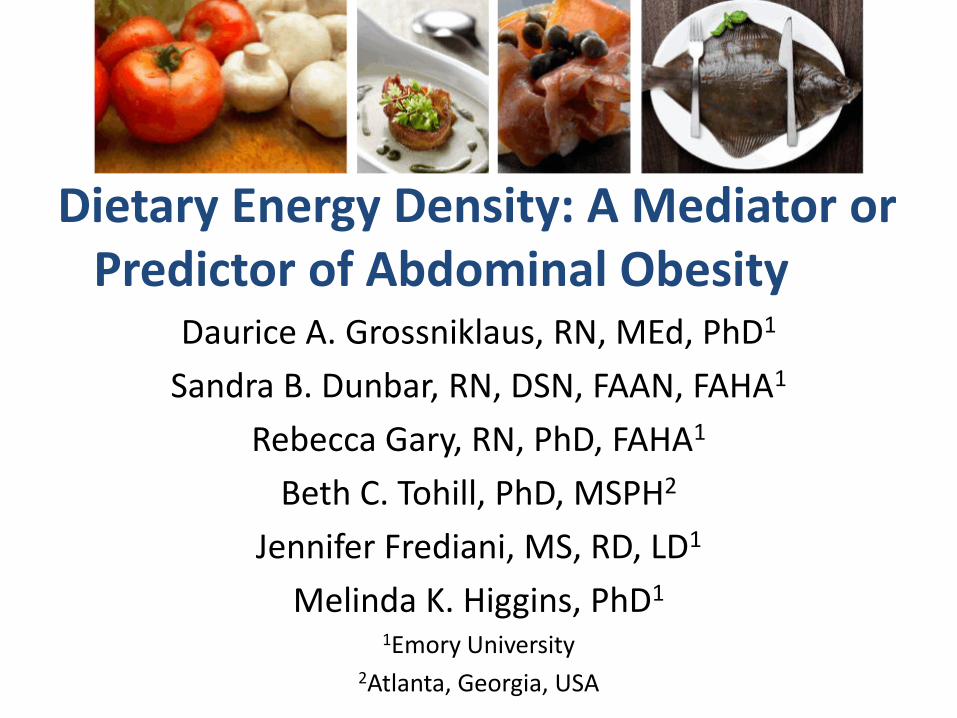
Dietary Energy Density: A Mediator or Predictor of Abdominal Obesity
Daurice A. Grossniklaus, RN, MEd, PhD1
Sandra B. Dunbar, RN, DSN, FAAN, FAHA1
Rebecca Gary, RN, PhD, FAHA1
Beth C. Tohill, PhD, MSPH2
Jennifer Frediani, MS, RD, LD1
Melinda K. Higgins, PhD1
1Emory University 2Atlanta, Georgia, USA

Sponsors
Alpha Epsilon Chapter, Sigma Theta Tau International
Small Grant Award, Southern Nurses Research Society
Dorothy Cornelius Research Award, American Nurses Foundation
Isabel Hampton Robb Scholarship, Nurses Educational Funds, Inc.
NIH, NINR, NRSA (1F31NR010159-01A1)
Supported in part by PHS Grant UL1 RR025008 Clinical and Translational Science Award program and PHS Grant M01 RR0039 General Clinical Research Center program, NIH, National Center for Research Resources
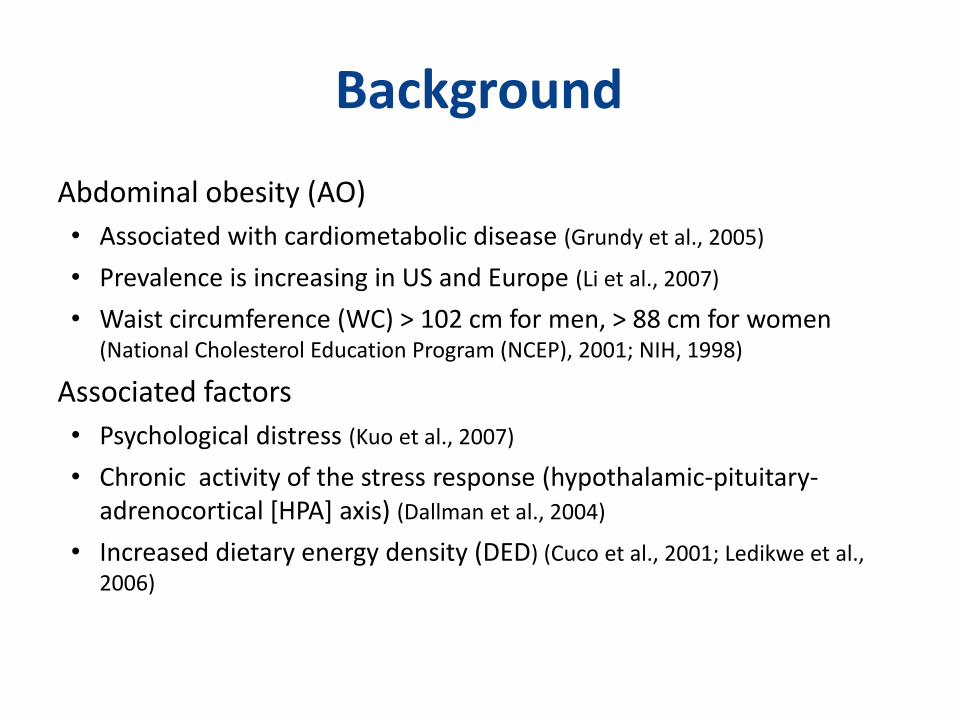
Background
Abdominal obesity (AO)
• Associated with cardiometabolic disease (Grundy et al., 2005)
• Prevalence is increasing in US and Europe (Li et al., 2007)
• Waist circumference (WC) > 102 cm for men, > 88 cm for women (National Cholesterol Education Program (NCEP), 2001; NIH, 1998)
Associated factors
• Psychological distress (Kuo et al., 2007)
• Chronic activity of the stress response (hypothalamic-pituitary-adrenocortical [HPA] axis) (Dallman et al., 2004)
• Increased dietary energy density (DED) (Cuco et al., 2001; Ledikwe et al., 2006)
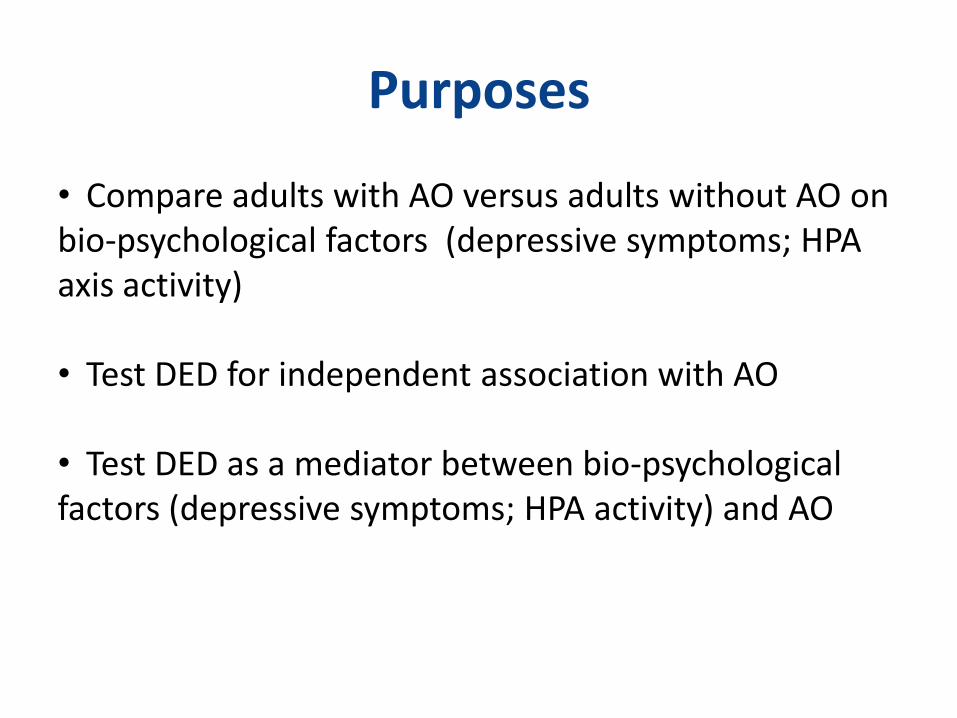
Purposes
• Compare adults with AO versus adults without AO on bio-psychological factors (depressive symptoms; HPA axis activity)
• Test DED for independent association with AO
• Test DED as a mediator between bio-psychological factors (depressive symptoms; HPA activity) and AO
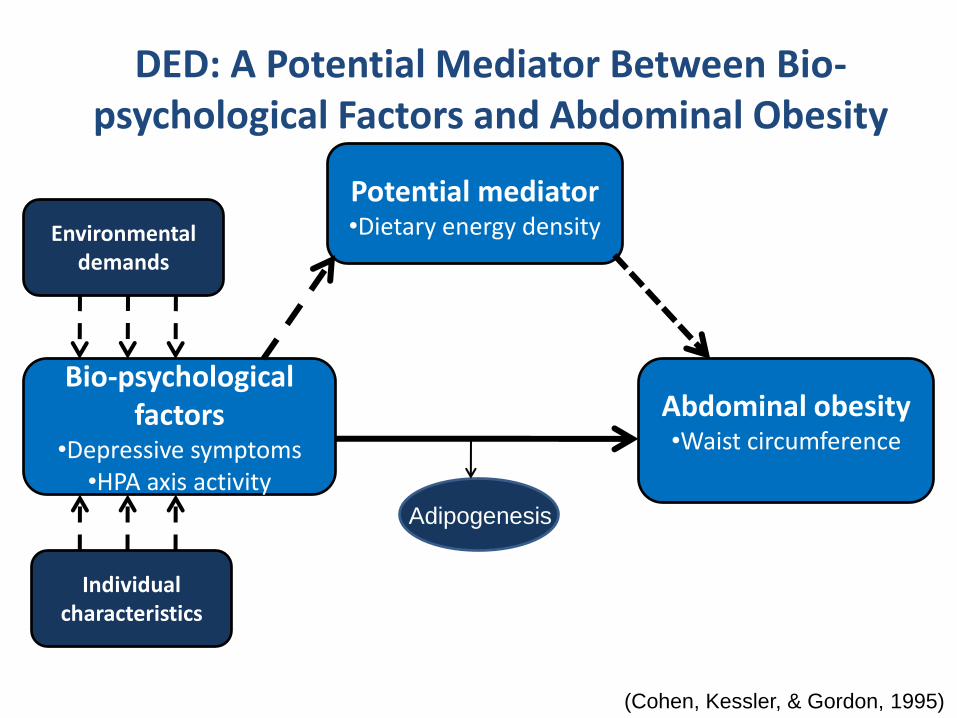
DED: A Potential Mediator Between Bio-psychological Factors and Abdominal Obesity
Bio-psychological factors
•Depressive symptoms•HPA axis activity
Abdominal obesity•Waist circumference
Potential mediator•Dietary energy densityEnvironmental
demands
Individual characteristics
(Cohen, Kessler, & Gordon, 1995)
Adipogenesis
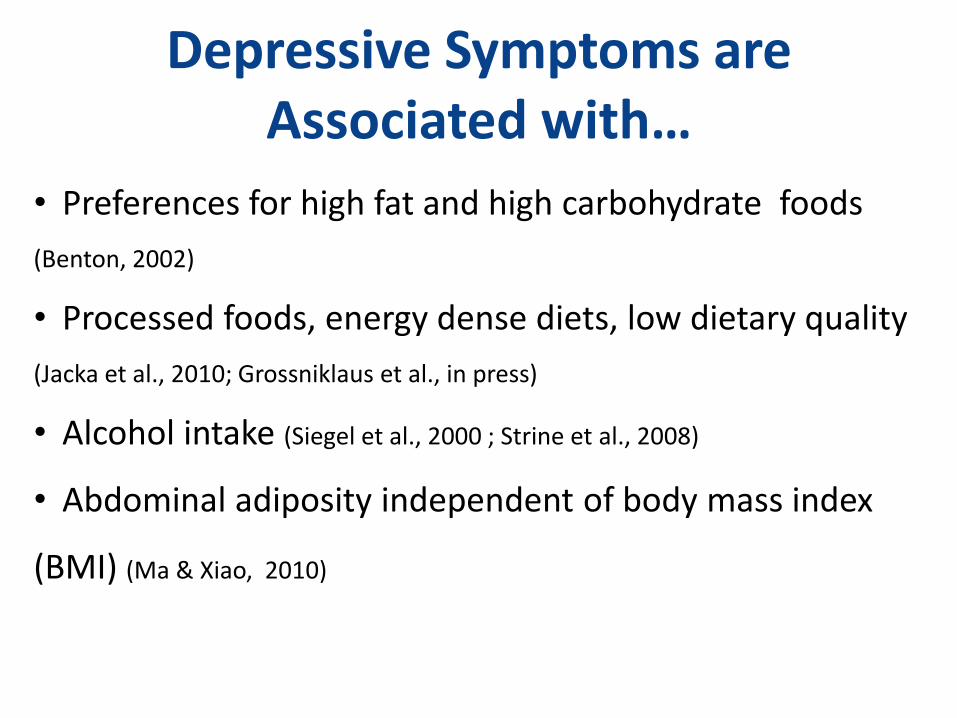
Depressive Symptoms are Associated with…
• Preferences for high fat and high carbohydrate foods
(Benton, 2002)
• Processed foods, energy dense diets, low dietary quality
(Jacka et al., 2010; Grossniklaus et al., in press)
• Alcohol intake (Siegel et al., 2000 ; Strine et al., 2008)
• Abdominal adiposity independent of body mass index
(BMI) (Ma & Xiao, 2010)
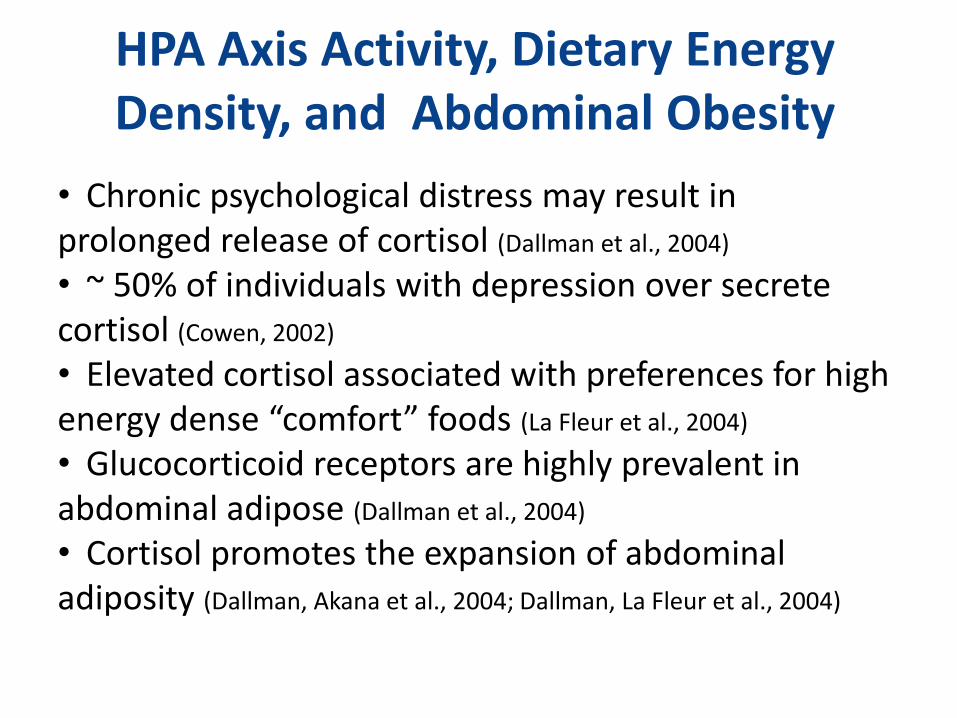
HPA Axis Activity, Dietary Energy Density, and Abdominal Obesity
• Chronic psychological distress may result in prolonged release of cortisol (Dallman et al., 2004)
• ~ 50% of individuals with depression over secrete cortisol (Cowen, 2002)
• Elevated cortisol associated with preferences for high energy dense “comfort” foods (La Fleur et al., 2004)
• Glucocorticoid receptors are highly prevalent in abdominal adipose (Dallman et al., 2004)
• Cortisol promotes the expansion of abdominal adiposity (Dallman, Akana et al., 2004; Dallman, La Fleur et al., 2004)
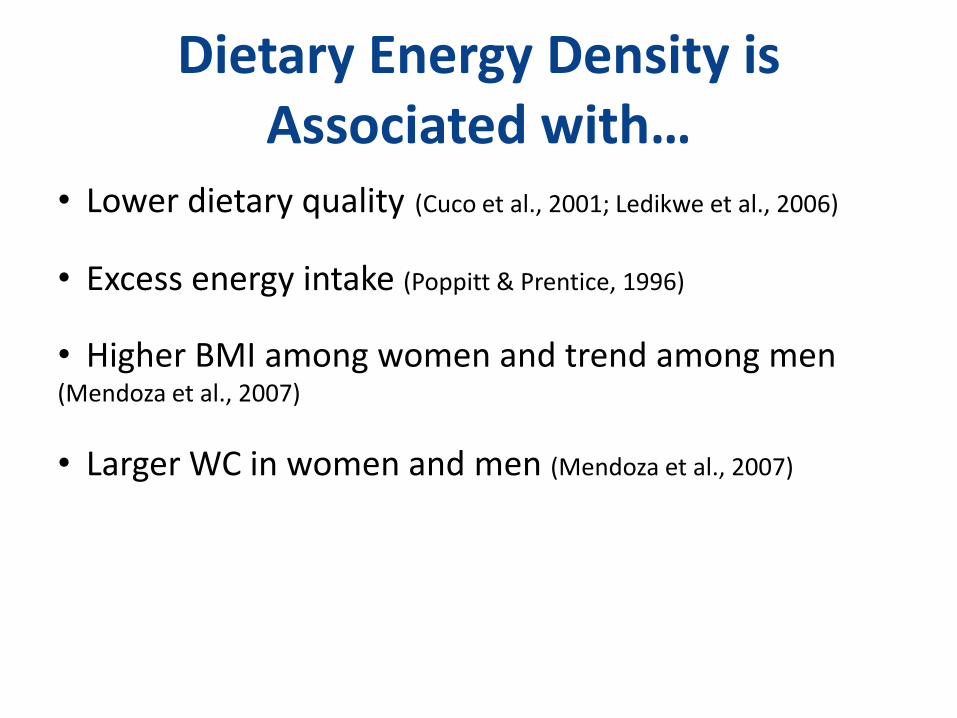
Dietary Energy Density is Associated with…
• Lower dietary quality (Cuco et al., 2001; Ledikwe et al., 2006)
• Excess energy intake (Poppitt & Prentice, 1996)
• Higher BMI among women and trend among men (Mendoza et al., 2007)
• Larger WC in women and men (Mendoza et al., 2007)
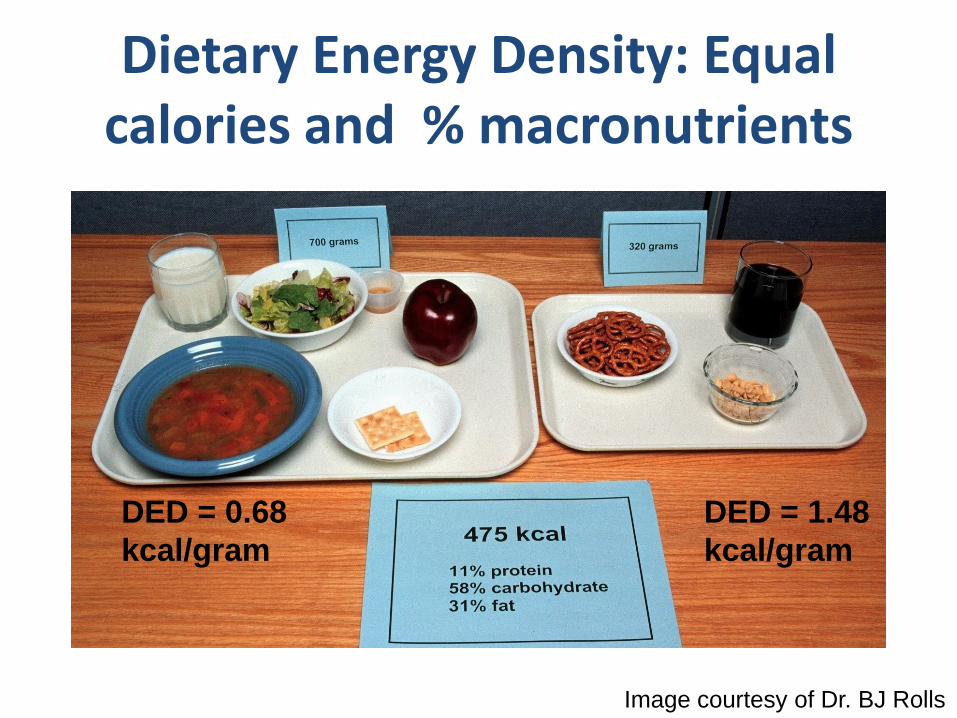
Dietary Energy Density: Equal calories and % macronutrients
Image courtesy of Dr. BJ Rolls
DED = 0.68
kcal/gram
DED = 1.48
kcal/gram
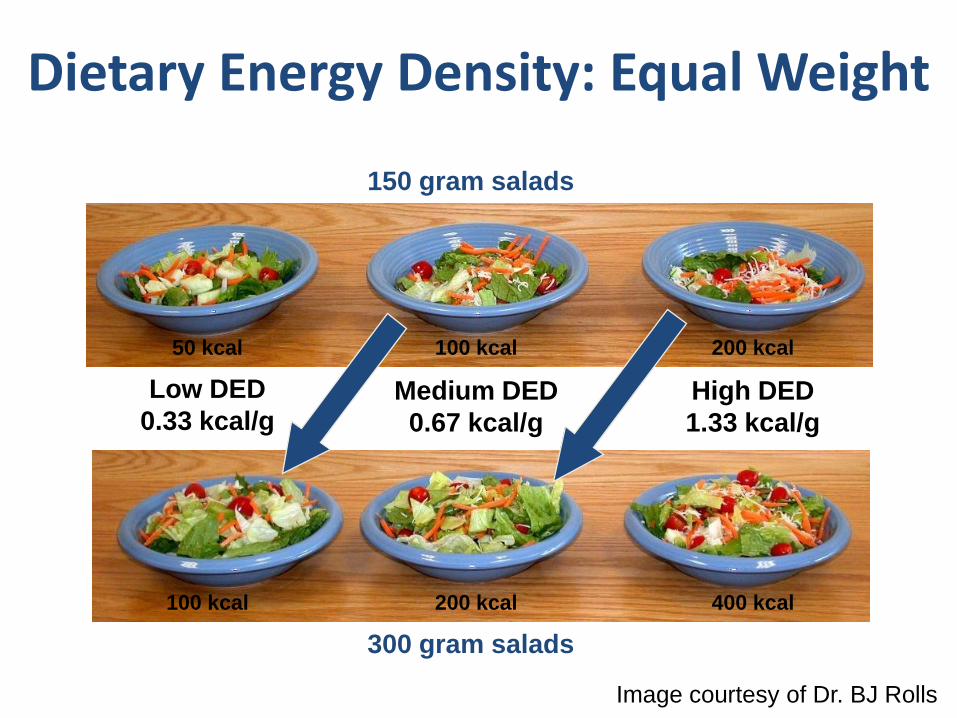
50 kcal 100 kcal 200 kcal
100 kcal 200 kcal 400 kcal
150 gram salads
Low DED
0.33 kcal/g
300 gram salads
Medium DED
0.67 kcal/g
High DED
1.33 kcal/g
Dietary Energy Density: Equal Weight
Image courtesy of Dr. BJ Rolls
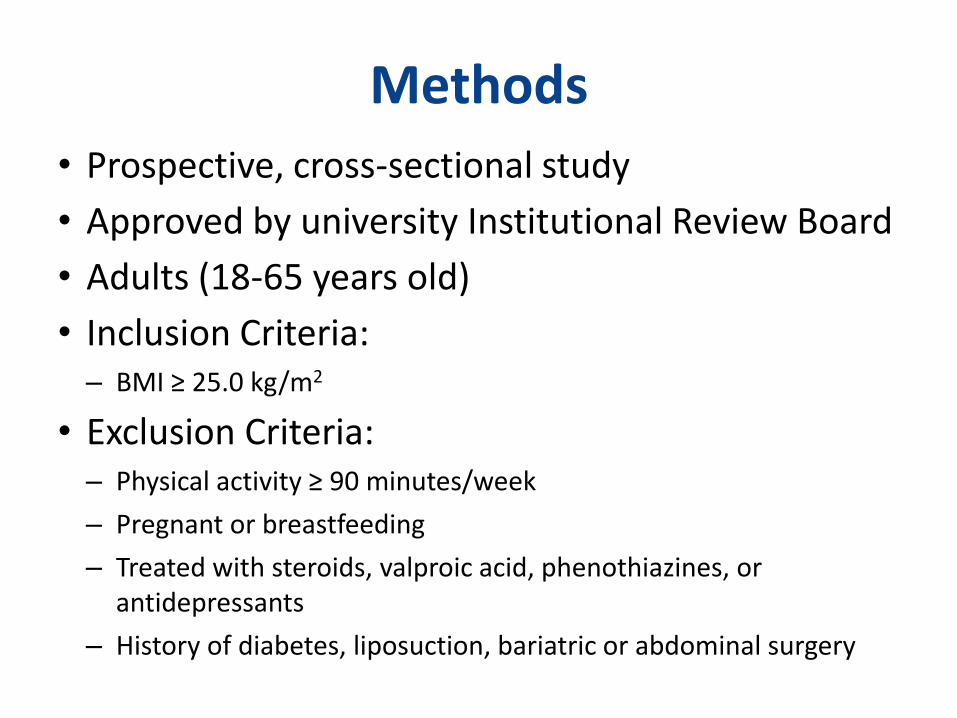
Methods
• Prospective, cross-sectional study
• Approved by university Institutional Review Board
• Adults (18-65 years old)
• Inclusion Criteria: – BMI ≥ 25.0 kg/m2
• Exclusion Criteria: – Physical activity ≥ 90 minutes/week
– Pregnant or breastfeeding
– Treated with steroids, valproic acid, phenothiazines, or antidepressants
– History of diabetes, liposuction, bariatric or abdominal surgery
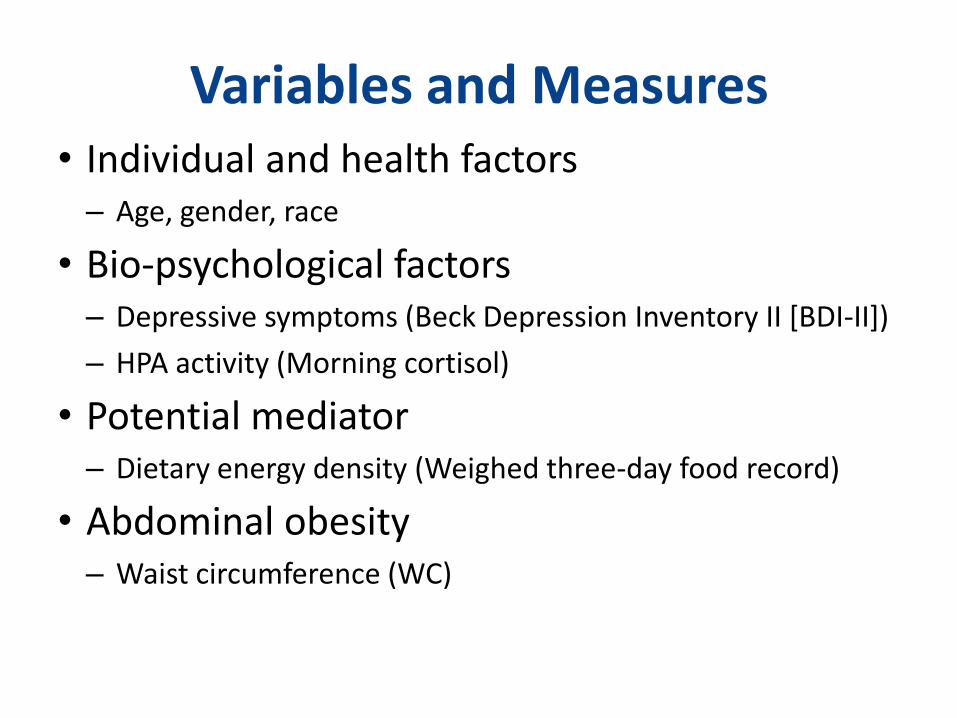
Variables and Measures• Individual and health factors
– Age, gender, race
• Bio-psychological factors – Depressive symptoms (Beck Depression Inventory II [BDI-II])
– HPA activity (Morning cortisol)
• Potential mediator– Dietary energy density (Weighed three-day food record)
• Abdominal obesity– Waist circumference (WC)

Bio-psychological Factors: Depressive Symptoms
Beck Depression Inventory – II (BDI-II)
# of items 21
Response (min-max) 0-3
Minimum 0
Maximum 63
Interpretation Higher scores, more severe depressive symptoms
Cronbach’s α 0.91
Beck et al., 1996; Steer et al., 1997
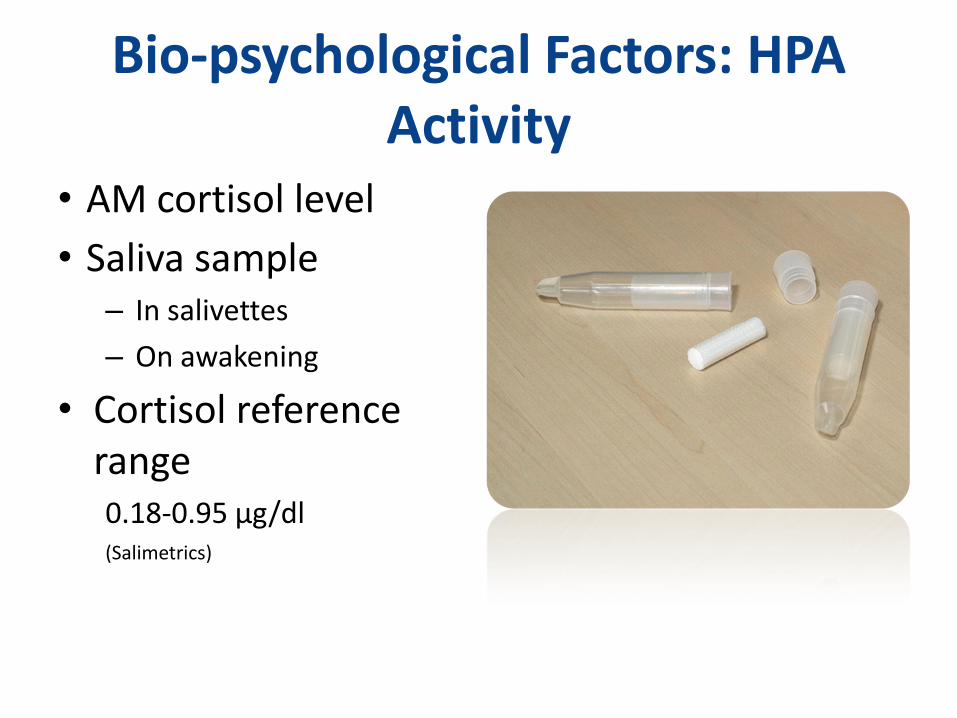
Bio-psychological Factors: HPA Activity
• AM cortisol level
• Saliva sample– In salivettes
– On awakening
• Cortisol reference range 0.18-0.95 µg/dl (Salimetrics)
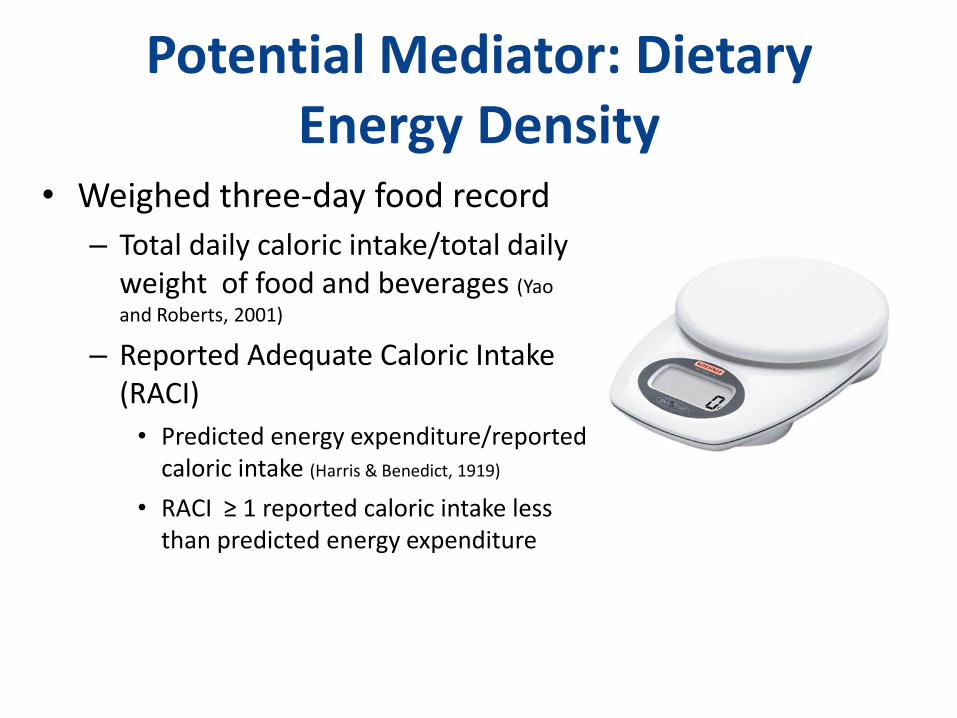
Potential Mediator: Dietary Energy Density
• Weighed three-day food record
– Total daily caloric intake/total daily weight of food and beverages (Yao
and Roberts, 2001)
– Reported Adequate Caloric Intake (RACI)
• Predicted energy expenditure/reported caloric intake (Harris & Benedict, 1919)
• RACI ≥ 1 reported caloric intake less than predicted energy expenditure
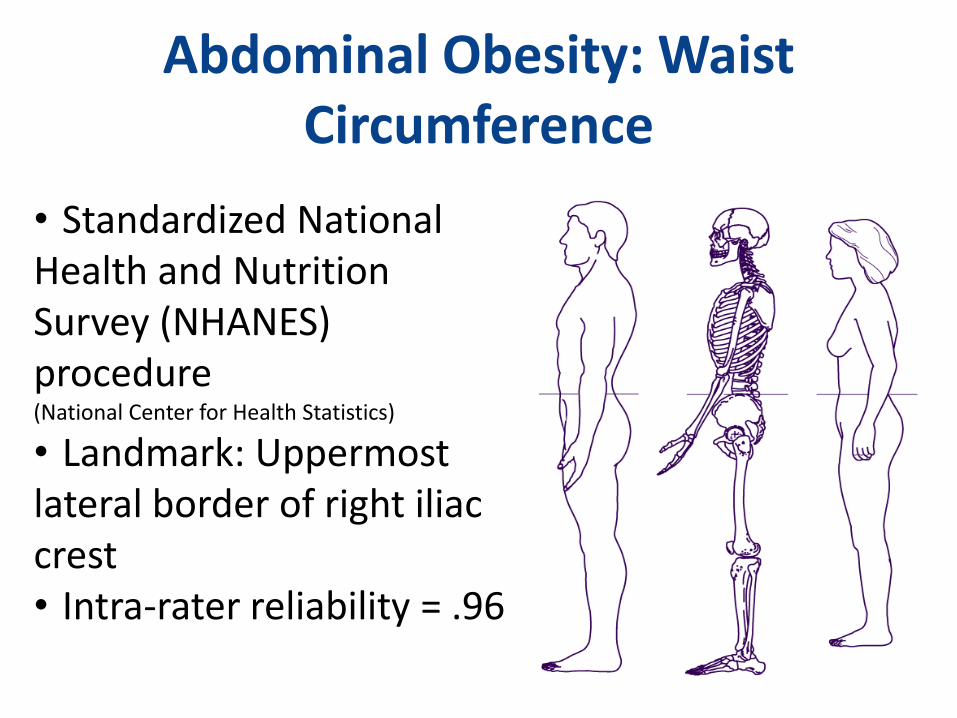
Abdominal Obesity: Waist Circumference
• Standardized National Health and Nutrition Survey (NHANES) procedure(National Center for Health Statistics)
• Landmark: Uppermost lateral border of right iliac crest • Intra-rater reliability = .96
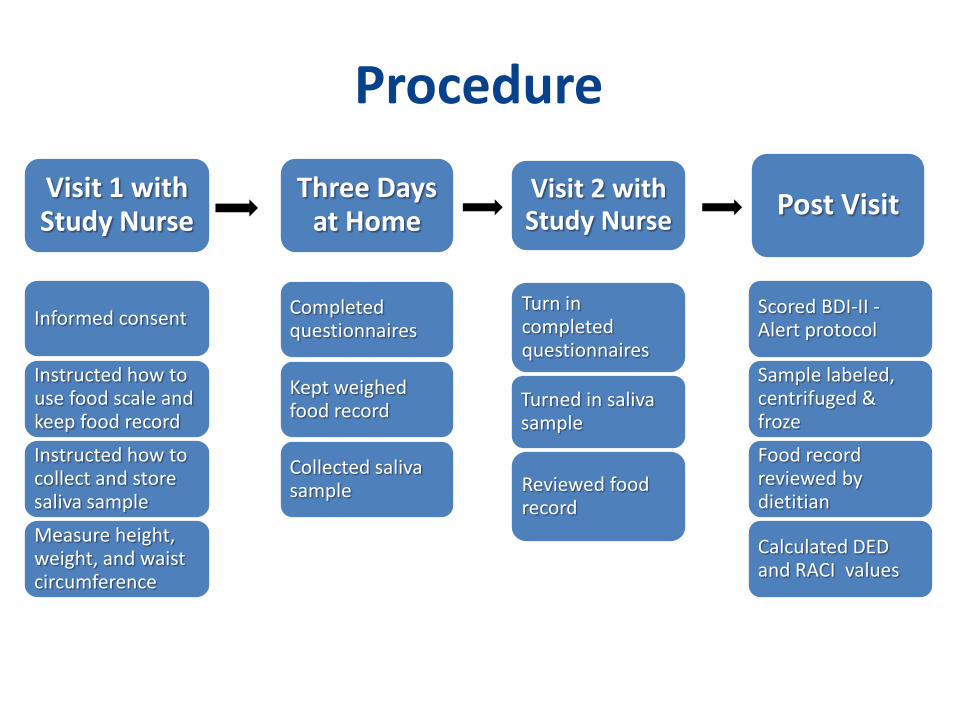
Procedure
Visit 1 with Study Nurse
Informed consent
Instructed how to use food scale and keep food record
Instructed how to collect and store saliva sample
Measure height, weight, and waist circumference
Completed questionnaires
Kept weighed food record
Collected saliva sample
Turn in completed questionnaires
Turned in saliva sample
Reviewed food record
Visit 2 with Study Nurse
Three Days at Home
Post Visit
Scored BDI-II -Alert protocol
Sample labeled, centrifuged & froze
Food record reviewed by dietitian
Calculated DED and RACI values
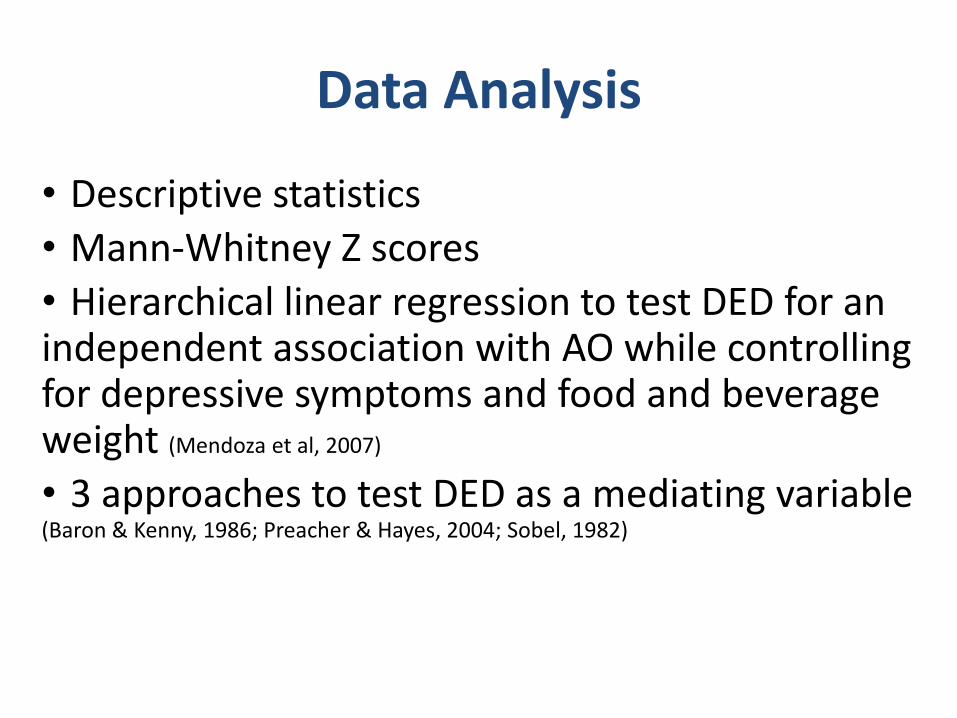
• Descriptive statistics
• Mann-Whitney Z scores
• Hierarchical linear regression to test DED for an independent association with AO while controlling for depressive symptoms and food and beverage weight (Mendoza et al, 2007)
• 3 approaches to test DED as a mediating variable (Baron & Kenny, 1986; Preacher & Hayes, 2004; Sobel, 1982)
Data Analysis
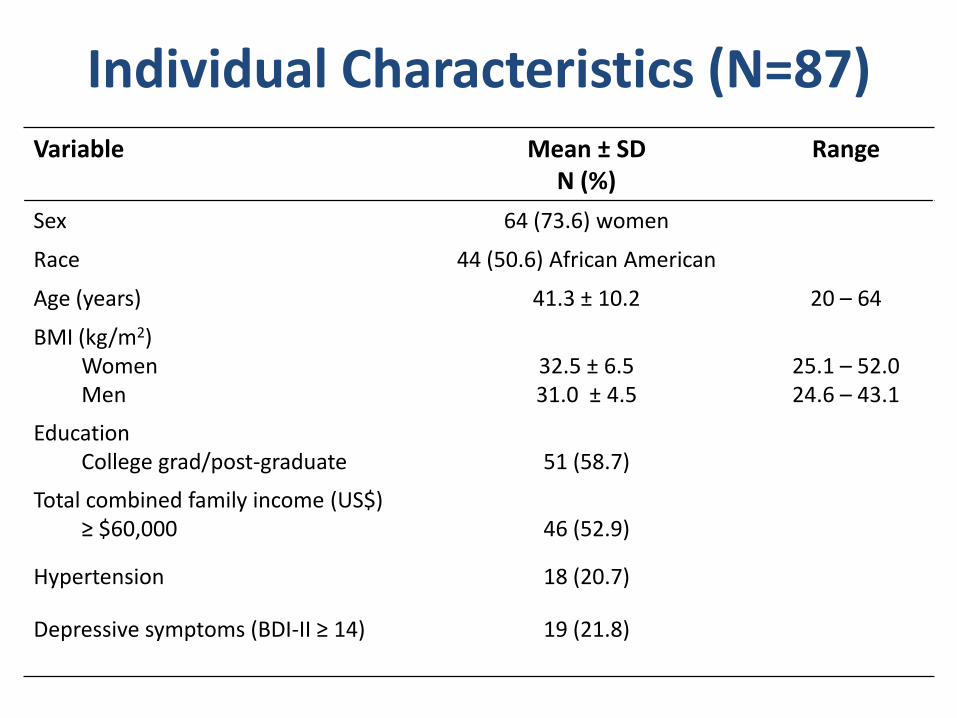
Individual Characteristics (N=87) Variable Mean ± SD
N (%)Range
Sex 64 (73.6) women
Race 44 (50.6) African American
Age (years) 41.3 ± 10.2 20 – 64
BMI (kg/m2)WomenMen
32.5 ± 6.531.0 ± 4.5
25.1 – 52.024.6 – 43.1
EducationCollege grad/post-graduate 51 (58.7)
Total combined family income (US$)≥ $60,000 46 (52.9)
Hypertension 18 (20.7)
Depressive symptoms (BDI-II ≥ 14) 19 (21.8)

Dietary FactorsVariable Mean ± SD Range
Food and beverage intake (kcal)
2029.8 ± 589.0 1066.2 – 3731.5
Food and beverage weight (g)Dietary energy density (kcal/g)
2864.0 ± 864.9
0.75 ± 0.22
1062.6 – 5972.8
0.32 – 1.31
Reported inadequate caloric intake (RACI ≥ 1)
N (%)
51 (58.6)
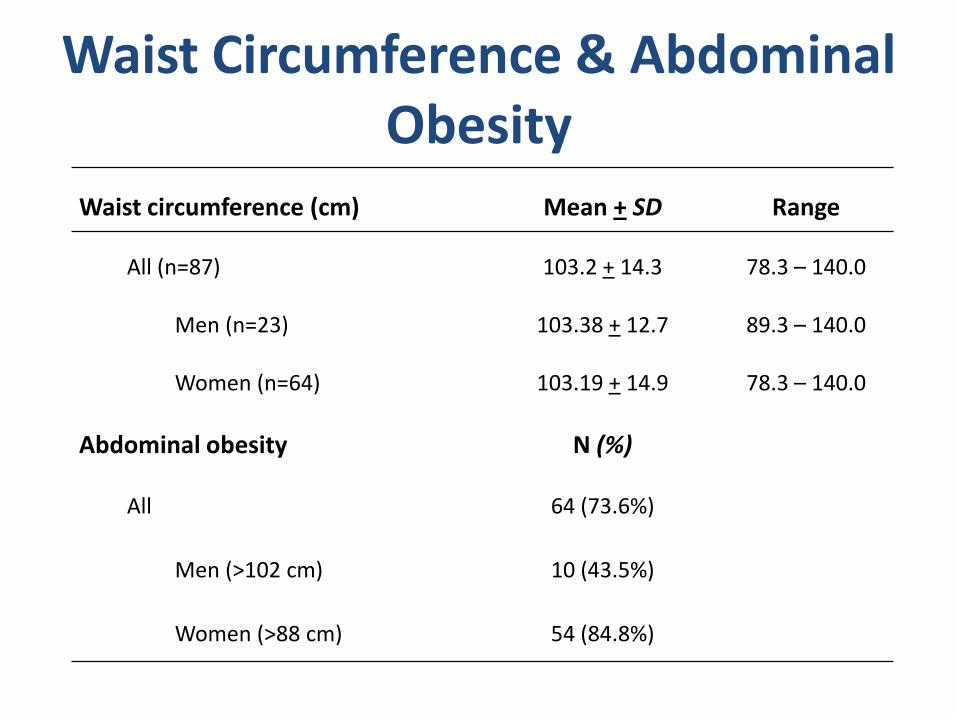
Waist circumference (cm) Mean + SD Range
All (n=87) 103.2 + 14.3 78.3 – 140.0
Men (n=23) 103.38 + 12.7 89.3 – 140.0
Women (n=64) 103.19 + 14.9 78.3 – 140.0
Abdominal obesity N (%)
All 64 (73.6%)
Men (>102 cm) 10 (43.5%)
Women (>88 cm) 54 (84.8%)
Waist Circumference & Abdominal Obesity

Depressive Symptoms, Cortisol, and DED by Abdominal Obesity
Variable Without AO(n = 23)
Median (Range)
With AO(n = 64)
Median (Range)
Mann-Whitney Z
BDI-II 5.0 (0 – 21.0) 7.0 (0 – 42.0) –2.003*
AM cortisol (µg/dl) .41 (.08 – 1.73)a .59 (.15 – 2.21)b –2.286*
DED (kcal/g) .75 (.32 – 1.17) .73 (.41 – 1.31) –0.337
an = 21. bn = 58.
*p ≤ .05.
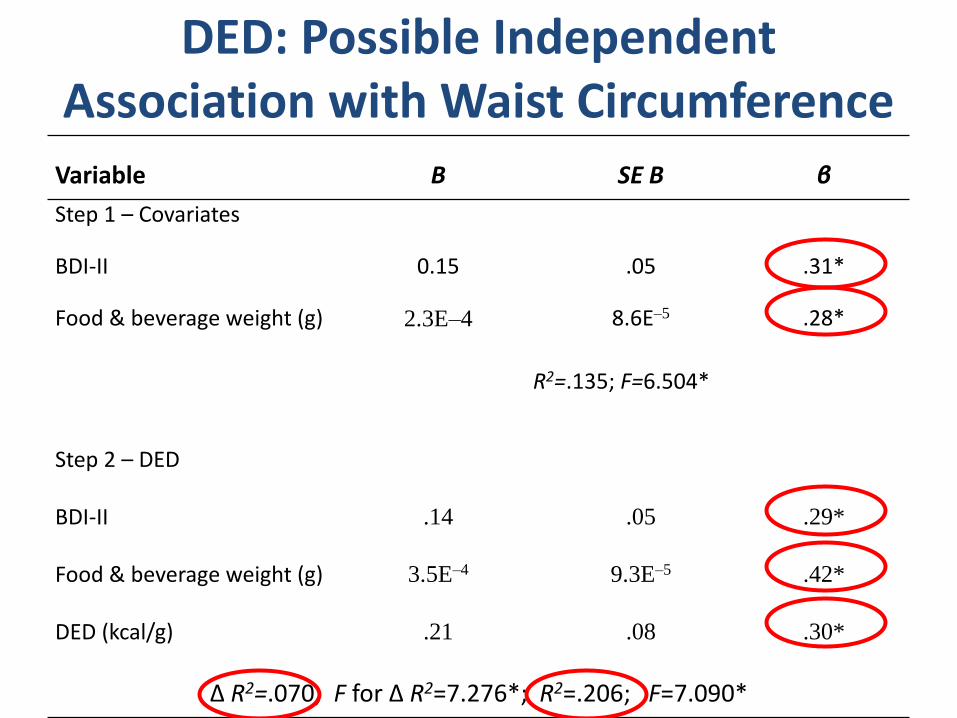
DED: Possible Independent Association with Waist Circumference
Variable B SE B β
Step 1 – Covariates
BDI-II 0.15 .05 .31*
Food & beverage weight (g) 2.3E–4 8.6E–5 .28*
R2=.135; F=6.504*
Step 2 – DED
BDI-II .14 .05 .29*
Food & beverage weight (g) 3.5E–4 9.3E–5 .42*
DED (kcal/g) .21 .08 .30*
∆ R2=.070; F for ∆ R2=7.276*; R2=.206; F=7.090*
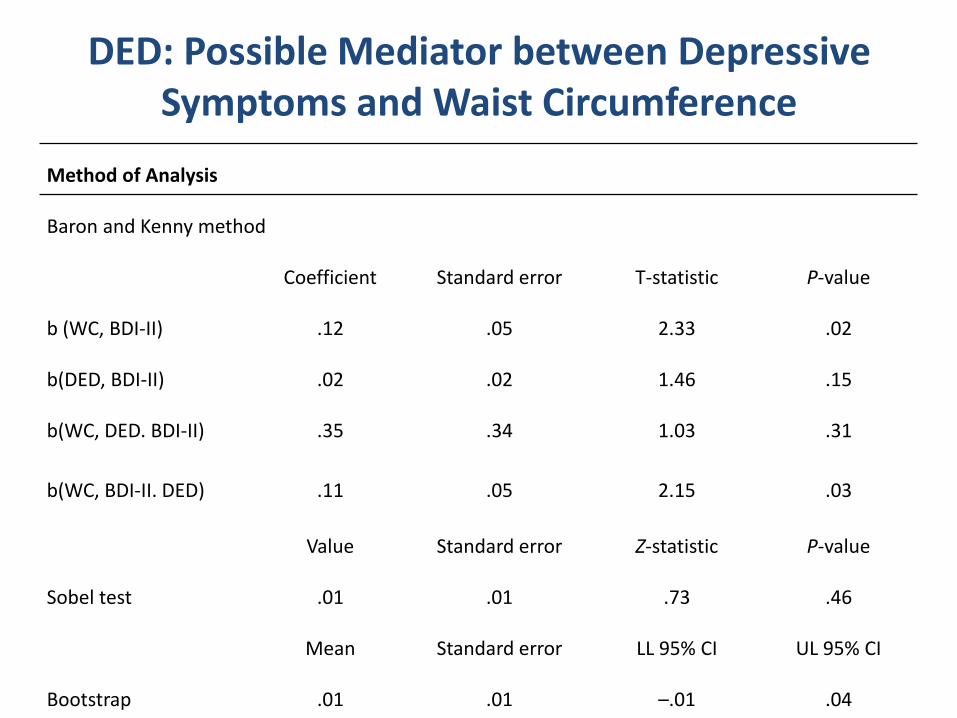
DED: Possible Mediator between Depressive Symptoms and Waist Circumference
Method of Analysis
Baron and Kenny method
Coefficient Standard error T-statistic P-value
b (WC, BDI-II) .12 .05 2.33 .02
b(DED, BDI-II) .02 .02 1.46 .15
b(WC, DED. BDI-II) .35 .34 1.03 .31
b(WC, BDI-II. DED) .11 .05 2.15 .03
Value Standard error Z-statistic P-value
Sobel test .01 .01 .73 .46
Mean Standard error LL 95% CI UL 95% CI
Bootstrap .01 .01 –.01 .04
Conclusions
• Depressive symptoms in this sample were more common than in general US population
• Majority had WC measurements indicating abdominal obesity and increased relative risk of cardiovascular disease
• Although within the range of minimal depressive symptoms, adults with AO had greater depressive symptoms than adults without AO
• Although within the reference range, morning cortisol levels were higher in adults with AO vs adults without AO
Conclusions
• Dietary energy density was independently associated with abdominal obesity
• Dietary energy density did not mediate between depressive symptoms and abdominal obesity
Limitations
• Non-random sampling
• Underreporting of caloric intake may mask significant relationships
– Undereating
– Underrecording
– Underestimating
– Recording burden
• Challenge to collect saliva samples
Research Recommendations
• Develop and test comprehensive nursing approaches aimed at:
– Early recognition and reduction of depressive symptoms
– Reducing dietary energy density

Thank you!