Embed Size (px)
Citation preview

Diet, nutrition and the prevention of excess weight gain andobesity
BA Swinburn1,*, I Caterson2, JC Seidell3 and WPT James4
1Physical Activity and Nutrition Research Unit, School of Health Sciences, Deakin University, Melbourne, Australia:2Faculty of Medicine, University of Sydney, Sydney, Australia: 3Free University of Amsterdam, Amsterdam,The Netherlands: 4International Obesity Task Force, London, UK
Abstract
Objective: To review the evidence on the diet and nutrition causes of obesity and torecommend strategies to reduce obesity prevalence.Design: The evidence for potential aetiological factors and strategies to reduce obesityprevalence was reviewed, and recommendations for public health action, populationnutrition goals and further research were made.Results: Protective factors against obesity were considered to be: regular physicalactivity (convincing); a high intake of dietary non-starch polysaccharides (NSP)/fibre(convincing); supportive home and school environments for children (probable); andbreastfeeding (probable). Risk factors for obesity were considered to be sedentarylifestyles (convincing); a high intake of energy-dense, micronutrient-poor foods(convincing); heavy marketing of energy-dense foods and fast food outlets(probable); sugar-sweetened soft drinks and fruit juices (probable); adverse socialand economic conditions—developed countries, especially in women (probable).A broad range of strategies were recommended to reduce obesity prevalenceincluding: influencing the food supply to make healthy choices easier; reducing themarketing of energy dense foods and beverages to children; influencing urbanenvironments and transport systems to promote physical activity; developingcommunity-wide programmes in multiple settings; increased communications abouthealthy eating and physical activity; and improved health services to promotebreastfeeding and manage currently overweight or obese people.Conclusions: The increasing prevalence of obesity is a major health threat in bothlow- and high income countries. Comprehensive programmes will be needed to turnthe epidemic around.
KeywordsPublic health
OverweightObesity
Evidence-base
This review paper has been structured to provide an
overview of the likely aetiological factors in the
development of weight gain and obesity, to propose
related population nutrient goals and content areas for
food-based dietary guidelines, and to evaluate some of the
potential food and diet related intervention strategies that
might help to attenuate and eventually reverse this global
epidemic. The process involved Medline searches on
relevant topics determined by the authors and the
participants in the Joint WHO/FAO Expert Consultation
on diet, nutrition and the prevention of chronic diseases
(Geneva, 28 January–1 February 2002). Recent reviews
and key papers were sought, but this did not involve a full
systematic review on each topic.
The level of evidence that a dietary factor could be
involved in the promotion of or protection against the
development of obesity was assigned on the basis of the
evidence review and the weighting of this evidence by
the authors and Expert Consultation members. The
evidence judgments were based on the framework and
definitions used by the World Cancer Research Fund and
American Institute for Cancer Research in their review on
diet and cancer1. The evidence in that report was rated as
convincing, probable, possible or insufficient for a
positive, a negative or no relationship between the
variable and cancer. However, because their outcome of
interest was cancer, the framework mainly centred on
epidemiological studies. In the current review, random-
ised clinical trials were given the highest ranking with
consistent results from several trials constituting convin-
cing evidence. This is particularly important in the
relationship between diet and obesity because of the
major methodological problems of dietary underreport-
ing. Obese people tend to underreport more than lean
people and the underreporting may be the greatest for
high fat and high carbohydrate foods2,3. Another difficulty
q The Authors 2004*Corresponding author: Email [email protected]
Public Health Nutrition: 7(1A), 123–146 DOI: 10.1079/PHN2003585

arose in rating evidence in relation to some of the potential
environmental causes of weight gain. For environmental
factors, more associated evidence and expert opinion had
to prevail because of the absence of direct studies or trials
in the area4.
It is important to note that this review on obesity has
not covered the energy expenditure side of the energy
balance equation in any depth. Physical activity is at least
as important as energy intake in the genesis of weight
gain and obesity and there are likely to be many
interactions between the two sides of the equation in
terms of aetiology and prevention. The role of physical
inactivity in the development of obesity has been well
described5 and a recent report from the US Center for
Disease Control and Prevention summarises the evidence
base for a variety of interventions to increase physical
activity at the population level6. Also, a thorough review
of weight control and physical activity has recently been
conducted by the WHO International Agency for
Research on Cancer and was also used as a basis for
recommendations on physical activity7.
Current global situation and trends
Overview
The prevalence of obesity is increasing throughout the
world’s population. But the distribution varies greatly
between and within countries. In the US, over the past 30
years, the prevalence of obesity rose from about 12–20%
of the population from 1978 to 19908. The UK has
experienced an increase in the prevalence of obesity from
7% in 1980 to 16% in 19958. Other countries, such as The
Netherlands, have experienced much smaller increases
from a low baseline of about 5% in the 1980s to about 8%
in 19979. In Asia, the prevalence of obesity has rapidly
increased. In the last 8 years the proportion of Chinese
men with a body mass index (BMI) .25 kg/m2 has tripled
from 4 to 15% of the population and the proportion in
women has doubled from 10 to 20%10. Pacific populations
have some of the world’s highest prevalence rates of
obesity. The proportion of men and women with a BMI
.30 kg/m2 in Nauru was 77% in 199411 and for Pacific
people living in New Zealand in the early 1990s the
prevalence rates were about 65–70%12.
The obesity epidemic moves through a population in a
reasonably consistent pattern over time and this is
reflected in the different patterns in low- and high income
countries. In low income countries, obesity is more
common in people of higher socioeconomic status and in
those living in urban communities. It is often first
apparent among middle-aged women. In more affluent
countries, it is associated with lower socioeconomic
status, especially in women, and rural communities13,14.
The sex differences are less marked in affluent countries
and obesity is often common amongst adolescents and
younger children.
Brazil is an example of a country with well-
documented changes in obesity prevalence as it under-
goes rapid nutrition transition. There has been a rapid
increase in obesity where the prevalence among urban
men with high incomes is about 10%, but still only 1% in
rural areas. Women in all regions are generally more
obese than men and the prevalence for those on low
income is still increasing. However, the rate of obesity
among women with high income is becoming stable or
even declining15.
The standard definitions of overweight (BMI $ 25
kg/m2) and obesity ($30 kg/m2) have been mainly
derived from populations of European descent8. However,
in populations with large body frames, such as Poly-
nesians, higher cut-off points have been used16. In
populations with smaller body frames, such as Chinese
populations, lower cut-off points have been proposed17
and studies are being undertaken to evaluate appropriate
cut-off points for a variety of Asian populations18.
Body fat distribution (often assessed by the waist
circumference or the waist:hip ratio) is an important
independent predictor of morbidity19,20. Although this
review focuses on weight gain and the development of
overweight and obesity, it is acknowledged that increases
in abdominal fatness (particularly, intra-abdominal fat)
pose a greater risk to health than increases in fatness
around the hips and limbs. In general, the causes of weight
gain and abdominal weight gain are the same and it is the
characteristics of the individuals (such as sex, age,
menopausal status) that influence the distribution of the
fat that is gained.
The nutrition transition
The increasing westernisation, urbanisation and mechan-
isation occurring in most countries around the world is
associated with changes in the diet towards one of high fat,
high energy-dense foods and a sedentary lifestyle8,21. This
shift is also associated with the current rapid changes in
childhood and adult obesity. Even in many low income
countries, obesity is now rapidly increasing, and often
coexists in the same population with chronic under-
nutrition21. Life expectancy has increased due to
advancement in nutrition, hygiene and the control of
infectious disease. Infectious diseases and nutrient
deficiency diseases are, therefore, being replaced in
developing countries by new threats to the health of
populations like obesity, cardiovascular disease and
diabetes8.
A sharp decline in cost of vegetable oils and sugar
means that they are now in direct competition with cereals
as the cheapest food ingredients in the world22. This has
caused a reduction in the proportion of the diet that is
derived from grain and grain products21 and has greatly
increased world average energy consumption, although
this increase is not distributed evenly throughout the
world’s population22.
BA Swinburn et al.124
As populations become more urban and incomes rise,
diets high in sugar, fat and animal products replace more
traditional diets that were high in complex carbohydrates
and fibre21,22. Ethnic cuisine and unique traditional food
habits are being replaced by westernised fast foods, soft
drinks and increased meat consumption22. Homogenis-
ation and westernisation of the global diet has increased
the energy density22 and this is particularly a problem for
the poor in all countries who are at risk of both obesity and
micronutrient deficiencies14.
Health consequences of obesity
Mortality rates increase with BMI and they are greatly
increased above a BMI of 30 kg/m2 23. For example, a
study in US women estimated that among people with a
BMI .29 kg/m2, 53% of all deaths could be directly related
to their obesity24.
As obesity has increased over the last 30 years, the
prevalence of type 2 diabetes has increased dramatically.
The global numbers of people with diabetes (mainly type
2) are predicted to rise by almost 50% in 10 years—151
million in 2000 to 221 million in 201025. The most potent
predictor for the risk of diabetes, apart from age, is the
BMI23. Even at a BMI of 25 kg/m2 the risk of type 2 diabetes
is significantly higher compared to BMI of less than
22 kg/m2, but at BMI over 30 kg/m2, the relative risks are
enormous26. Type 2 diabetes is becoming increasingly
prevalent among children as obesity increases in those age
groups. This was first reported among the Pima Indians in
1979 where 1% of the 15–24-year-olds had diabetes
(almost all type 2 diabetes)27. Now in many populations
around the world, a substantial proportion of the
teenagers with diabetes have the obesity-associated type
2 variety28. Asian populations appear to develop diabetes
at a lower BMI than other populations29.
A high BMI is associated with higher blood pressure and
risk of hypertension, higher total cholesterol, LDL-
cholesterol and triglyceride levels and lower HDL-
cholesterol levels. The overall risk of coronary heart
disease and stroke, therefore, increases substantially with
weight gain and obesity23.
Gall bladder disease and the incidence of clinically
symptomatic gallstones are positively related to BMI23.
There is evidence to suggest increased cancer risk as BMI
increases, such as colorectal cancer in men, cancer of the
endometrium and biliary passage in women, and breast
cancer in post-menopausal women8,23. Obese people are
also at increased risk of gout, sleep apnoea, obstetric and
surgical complications23.
Health care costs of obesity
The direct health care costs of obesity in the US have
been estimated to account for 5.7% of total health care
expenditure in 1995. Comparable figures are somewhat
lower than this for other western countries such as France
(2%), Australia (2%)30 and New Zealand (2.5%)31. These
figures underestimated the full direct costs of weight-
associated disease because they estimated the costs for
the population with BMI . 30 kg/m2 and omitted any
burden of lesser forms of overweight (BMI 25–30 kg/m2).
A Dutch study suggests the costs attributed to BMI
25–30 kg/m2 are three times the cost of BMI . 30
kg/m2 32. The direct costs of obesity are predominantly
from diabetes, cardiovascular disease and hypertension.
Indirect costs, which are far greater than direct costs,
include workdays lost, physician visits, disability pen-
sions and premature mortality which all increase as BMI
increases33. Intangible costs (impaired quality of life)
have not been estimated, but given the social and
psychological consequences of obesity, they are likely to
be enormous.
Potential aetiological factors in relation to obesity in
populations
The format for identifying potential nutritional causes of
obesity at a population level is based on the Epidemio-
logical Triad34 where the ‘hosts’ are the general
population, the ‘vectors’ are the foods and nutrients and
the ‘environment’ includes the physical, economic, policy
and socio-cultural factors external to the individual.
Issues were selected based on their relevance to
approaches to reducing the burden of obesity at a
population level. The evidence summary for identified
issues is shown in Table1.
Host issues
There are a variety of behaviours and other host factors
that have a potential effect on a population’s level of
obesity. These are, of course, closely linked to the vectors
and the environments and in many cases the issues merge
and overlap. Issues related to social aspects of eating are
not covered.
Snacking/eating frequency
While there is no one definition of snacking, it is probably
best to consider the content of snack foods and the
increased eating frequency that snacking promotes as
separate issues35. There is evidence from the US that
snacking prevalence (i.e. occasions of snacking) is
increasing, the energy density of snack foods is increasing
and the contribution to total energy is increasing36. Snacks
contribute to about 20–25% of total energy intake in
countries like the US and UK35. However, there is little
evidence that a higher frequency of eating per se is a
potential cause of obesity. Cross-sectional studies tend to
show a negative relationship or no relationship between
meal frequency and BMI37. Low eating frequency may, of
course, be a response to obesity rather than a cause.
Experimental studies have found mixed results on the
degree of caloric compensation that people make at meal
time in response to a prior snack with some studies
Diet, nutrition and the prevention of excess weight gain and obesity 125
showing more complete compensation among lean
people37. There is insufficient evidence to support an
effect of a higher frequency of eating on obesity or weight
gain. If anything, it is protective against weight gain. The
high energy density of common snack foods, however,
may do the opposite and promote weight gain (see below).
Restrained eating, dieting and binge eating patterns
While a degree of selective or restrained eating is probably
needed to prevent obesity in an environment of plenty,
some individuals (dieters and non-dieters) score highly on
the Restraint Scale and paradoxically may also exhibit
periods of disinhibited eating38. Such individuals appear
to be at risk of dieting–overeating cycles. The concepts
used to define these constructs and the instruments used
to measure them continue to evolve, but the studies would
suggest that a ‘flexible restraint’ eating pattern is associated
with a lower risk of weight gain whereas a ‘rigid
restraint/periodic disinhibition’ pattern is associated with
a greater risk of weight gain39. Binge eating disorder40 and
night eating syndrome41 would be examples of the latter
pattern. Binge eating disorders are significantly more
common in obesity in cross-sectional studies. The
relationships between these dietary patterns and weight
gain or obesity is complex with both cause and effect
relationships likely.
Eating out
In western countries, the frequency of eating food
prepared outside the home is increasing and this is most
apparent and best documented in the US. In 1970, 26% of
the food dollar in the US was spent on food prepared
outside the home. By 1995, it had climbed to 39% and is
projected to rise to 53% by 201042,43. This shift towards an
increase in the frequency of eating meals and snacks away
from home and the proportion of food budget spent on
away from home foods42,44,45 has coincided with the
increasing prevalence of obesity.
In the US, food prepared away from home is higher in
total energy, total fat, saturated fat, cholesterol and
sodium, but contains less fibre and calcium and is overall
of poorer nutritional quality than at-home food. Also, the
fat content of at-home food has fallen considerably from
41% of total energy in 1977 to 31.5%, but there has been no
change in the fat content of food prepared away from
home (37.6%)43.
These food composition differences and the increasing
portion sizes, are likely contributors to the rising
prevalence of obesity in the US44. Those who eat out
more, on average, have a higher BMI than those who eat
more at home46. The evidence implicating the increasing
use of food prepared outside the home as a risk for obesity
is largely limited to the US but this may be extrapolated to
other western countries. It is unknown whether a high
frequency of eating out is associated with obesity or
weight gain in other populations, for example, in Asian
countries, where eating outside the home may not be a
risk for weight gain.
Breastfeeding
Breastfeeding has been suggested as a potential protective
factor against weight gain in childhood47 and this is
important because overweight children and adolescents
are at risk of becoming overweight adults48. A review by
Butte49 examined 18 studies (6 retrospective, 10
prospective, 1 cohort, 1 case–control) published up to
1999 with a total of nearly 20,000 subjects. There was a
wide time span (1945–1999) and the definitions of
breastfeeding and obesity and the length of follow up
were all highly variable. Two of the studies found a
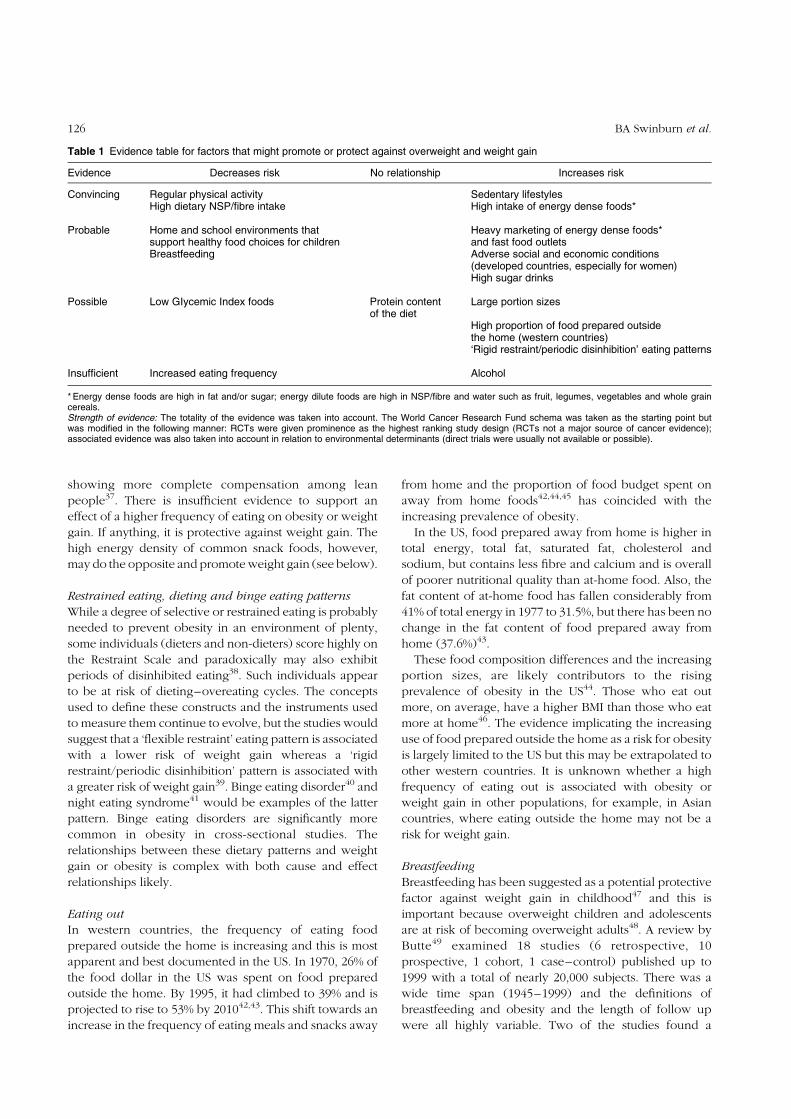
Table 1 Evidence table for factors that might promote or protect against overweight and weight gain
Evidence Decreases risk No relationship Increases risk
Convincing Regular physical activity Sedentary lifestylesHigh dietary NSP/fibre intake High intake of energy dense foods*
Probable Home and school environments thatsupport healthy food choices for children
Heavy marketing of energy dense foods*and fast food outlets
Breastfeeding Adverse social and economic conditions(developed countries, especially for women)High sugar drinks
Possible Low GIycemic Index foods Protein contentof the diet
Large portion sizes
High proportion of food prepared outsidethe home (western countries)‘Rigid restraint/periodic disinhibition’ eating patterns
Insufficient Increased eating frequency Alcohol
* Energy dense foods are high in fat and/or sugar; energy dilute foods are high in NSP/fibre and water such as fruit, legumes, vegetables and whole graincereals.Strength of evidence: The totality of the evidence was taken into account. The World Cancer Research Fund schema was taken as the starting point butwas modified in the following manner: RCTs were given prominence as the highest ranking study design (RCTs not a major source of cancer evidence);associated evidence was also taken into account in relation to environmental determinants (direct trials were usually not available or possible).
BA Swinburn et al.126

positive association between breastfeeding and later
obesity and four found a negative relationship (i.e. an
apparent protective effect of breastfeeding). The remain-
der found no differences. The largest study (n ¼ 9357
children aged 5–6) found a prevalence of obesity among
breastfed children of 2.8% compared to 4.5% in never
breastfed children and there was an apparent dose
response in relation to the duration of breastfeeding50. A
similar study of 3731 6-year-old British children, however,
found no such relationships51.
Since that review, two further studies have been
published. A US cohort study of over 15,000 boys and
girls aged 9–14 years reported a significant (about 20%)
reduction in the risk of becoming overweight associated
with only or mostly breastfeeding in the first 6 months of
life after adjusting for measured confounders52. The
second study was a US cross-sectional survey of 2685 3–5-
year-olds53. The risk reductions for breastfeeding were of
a similar magnitude to the previous study but the lower
power of the second study meant that the associations
were not statistically significant. A significant reduction in
risk was found with breastfeeding for being ‘at risk of
overweight’ (between 85th and 94th percentiles for BMI).
The influence of confounding factors is a major problem
in these studies and controlling for them was only
attempted in some of the studies. The BMI of the parents
(especially the mother) is a strong determinant for
childhood obesity49,52 and overweight mothers tend to
breastfeed less and for a shorter duration52. There have
been marked changes in formula composition and infant
feeding practices over the decades and the early studies
may be of limited relevance to the current day
recommendations49.
The current evidence was judged to show a probable
protective effect of breastfeeding against childhood
obesity. The prevention of unhealthy weight gain should,
therefore, be added to all the other health reasons for
promoting breastfeeding and complementary feeding.
Early nutrition
Birth weight is a crude indicator of intrauterine nutrition. A
systematic review of predictors of obesity by Parsons et al.
found that studies reported a consistent and positive
relationship between birth weight and BMI (or risk of
overweight) as a child or as an adult54. It is possible that
low birth weights may also be associated with high adult
BMI (i.e. that the relationship is a J-shaped curve rather
than linear and positive). However, very low birth weight
is a much weaker predictor of high adult BMI than high
birth weight54.
Maternal and childhood undernutrition are common in
low income countries and childhood stunting is often used
as a marker for this. A later exposure to more western-style
diets and lifestyles (such as through migration to urban
areas and/or improved economic conditions) may
promote an excessive increase in body fatness or
abdominal fatness. Popkin et al. studied 3–9-year-old
children in cross-sectional studies in four countries (China,
Russia, South Africa and Brazil) and found that stunted
children (low height-for-age z-score) were more likely
than non-stunted children to be overweight (high weight-
for-height z-score) with relative risks between 1.7 and
7.855. On the other hand, a cohort of children measured at
age 3 in Guatemala and followed into adulthood showed
that childhood stunting was associated with a low BMI and
low percent body fat in men but no such relationships
were seen in women56. Only when BMI or percent body
were adjusted for, did an association between severe
stunting and high waist:hip ratio become evident.
The hypothesis that intrauterine and/or early childhood
undernutrition leads to adult obesity or abdominal obesity
is an important one that links with the other relationships
between early undernutrition and adult diseases such as
hypertension and diabetes57. This could pose a major
problem for countries undergoing the economic and
nutrition transition21. However, the relationships are
clearly complex and the available data were judged
insufficient to be able to make a single summary statement
in the evidence table.
Vector issues
Percent fat, percent carbohydrate and energy density
Background: Most of the debate about the fat and
carbohydrate content of the diet in relation to obesity
centres on the effects of altering the reciprocal proportions
of carbohydrate and fat in the diet on energy density, total
energy intake, body weight and lipoprotein profiles. The
debate58–60 has become vigorous and, at times, muddled
because several issues are usually debated at the same
time. Also, the epidemiological evidence comes from
different types of studies (ecological, cross-sectional and
prospective) which suffer from multiple potential sources
of bias, the instruments used to measure dietary intake are
blunt, and there is substantial obesity-related under-
reporting of energy and fat intake61. Even the clinical trials
use a wide variety of different dietary manipulations, some
are isocaloric and some are ad libitum and few are long
term. The evidence is reviewed in several parts to try to
bring some clarity to the debate. Firstly, the effects of
reciprocal differences or alterations in percent fat and
percent carbohydrate on body weight will be examined in
different study designs: epidemiological studies; con-
trolled trials of high percent fat or high percent
carbohydrate diets under conditions of (a) fixed total
energy intakes, (b) covert manipulations with ad libitum
total intakes or (c) overt manipulations with ad libitum
total intakes. Secondly, the high energy density of high fat
diets will be examined as the potential mechanism to
explain their propensity to promote weight gain.
Percent fat in the diet—epidemiological studies: The
epidemiological evidence presents mixed results on the
relationship between the percent fat (or percent
Diet, nutrition and the prevention of excess weight gain and obesity 127
carbohydrate) in the diet and obesity or weight gain.
Ecological studies between populations tend to show a
positive relationship between fat and obesity, especially if
populations with low fat intakes are included60,61, but
negative relationships are also seen62. Similarly, studies in
the same population over time tend to show positive
relationships between obesity and dietary fat intake in
populations undergoing nutrition transition but a negative
relationship in many westernised populations61,62. Cross-
sectional and prospective studies also show mixed
results62. In light of the methodological drawbacks of
these types of studies and the mixed results they have
produced61, controlled trials are needed to address the
question.
Percent fat in the diet—fixed total energy trials:
According to Reaven63 the simplest way to answer the
question about the impact of fat and carbohydrate in the
diet on body weight ‘is to focus on studies that vary in
macronutrient composition, but are equal in energy’.
Studies that have done this63–65 have indeed found that
‘clamping’ total energy produces similar weight changes
irrespective of the macronutrient composition. The
rationale for many of these studies was to assess the
impact of macronutrient changes independent of total
energy intake. They were not to emulate the real world
where total intake is ad libitum. The conclusion from the
fixed energy studies is that if a high percent fat diet
promotes weight gain, the mechanism appears to be
mediated by promoting a higher total energy intake.
Percent fat in the diet—ad libitum trials, covert
manipulations: Several trials have covertly manipulated
the fat and carbohydrate proportions of equally palatable
diets while allowing study participants to eat ad libitum
total intakes66–73. Most of the studies were short term with
the longest being 11 weeks73. These trials consistently
show a progressive rise in total energy intake and body
weight on the higher percent fat diets and the opposite on
the lower percent fat diets. The amount (weight) of food
eaten is similar on both types of diet. These covert
manipulation studies are central to the debate on dietary
fat and weight gain because they demonstrate that, other
things being equal, the physiological–behavioural con-
sequence of a high percent fat diet is a slow weight gain
through the ‘passive overconsumption’ of total energy.
Percent fat in the diet—ad libitum trials, overt
manipulation: Longer term trials of high and low percent
fat diets have generally used educational strategies to get
participants to select reduced fat food options and
compared them with standard or higher fat diets. The
diet is unrestricted in total amount (weight) and
replacement of lost energy from fat is not specifically
replaced by carbohydrate. It is important to note that,
unlike the covert manipulations, it is difficult to blind
such studies and, therefore, psychosocial effects,
personal preferences and other effects not directly related
to physiology can confound the results74. A recent
meta-analysis of 16 ad libitum dietary trials (19 interven-
tions) of at least 2 months duration showed that reduced
fat diets consistently result in a reduced total energy intake
and reduced weight75. Interestingly, weight loss was not
the primary goal in more than half the studies. A reduction
in the proportion of fat in the diet by 10% points
corresponded with a reduction of about 1 MJ of total
energy per day. The effects of such a dietary change on
body weight have been estimated to be in the range of
2.6–3.2 kg, although greater weight loss is seen in more
overweight individuals75. The weight loss was not
associated with the duration of the intervention but it
was larger in overweight subjects compared to normal
weight subjects. It is important to note that an absolute
reduction in dietary fat (g/d) does not elicit a compensa-
tory increase in absolute dietary carbohydrate intake
(g/d), although the fat:carbohydrate ratio, of course,
decreases76.
An interesting study attempting to replicate realistic
food choices randomised normal weight and overweight
participants into two groups who selected either full fat or
reduced fat foods from small, realistic ‘supermarkets’ in
the study centres77. The free access to higher fat products
resulted in a significant increase in energy intake
(0.9 MJ/d) and body weight (0.7 kg) over 6 months
compared to the reduced fat group.
Reducing the fat content of the diet consistently
produces modest reductions in body weight but one
could argue that instructions to individuals to reduce other
macronutrients in the diet or to restrict the intake of certain
high volume foods (such as staple carbohydrates) would
also result in weight loss. Indeed, there are a myriad of
popular diets with a wide variety of food and drink
restrictions and all have their champions who have lost
weight. It is obvious that any such restrictions that result in
a reduction in total energy intake will produce weight loss.
The rationale for promoting a reduction in the fat content
of the diet to prevent weight gain or promote weight loss is
that it is concordant with the body’s physiological–
behavioural mechanisms regulating food intake as
evidenced by the covert manipulation studies.
Another potential criticism of promoting a reduced fat
content of the diet is that the ad libitum weight loss studies
show a modest effect (a few kilograms) with a tendency to
return towards the previous weight after the intervention
period76. This rebound is common to all dietary
interventions and there are a number of potential
explanations for this. They include: a reduction in
compliance to the diet, perhaps due to an environment
that is unsupportive of healthy food choices; overeating of
foods known to be low in fat and; physiological
adaptations that attenuate the impact of negative energy
balance on weight loss78.
Extremely low fat, high carbohydrate diets are also very
effective for weight loss79,80 but it must be stressed that
large reductions in total fat intake would be unattainable at
BA Swinburn et al.128
a population level. Average changes in the order of 2–3 kg
may seem small for individuals but they are important on a
population level in the context of obesity prevention. A
shift of one unit of BMI in the overall distribution in the
population is associated with a 5% point change in the
prevalence of obesity8.
Percent fat in the diet—mechanisms that promote
weight gain: Why does a high percent fat diet tend to result
in a passive overconsumption of total energy and thus
promote weight gain? Potential mechanisms are through
satiety, energy density, palatability and/or metabolic
responses.
Foods high in fat are less satiating than foods high in
carbohydrates81,82. When isocaloric amounts of foods are
fed, a high satiety score is associated with a high volume of
the food which in turn is related to a high complex
carbohydrate content81. Is satiety related to the food
volume (weight) per se or is it dependent on the different
metabolic processes that fat and carbohydrate undergo
after digestion? Pure fat (9 kcal/g) has more than twice the
energy density of pure carbohydrate (4 kcal/g) or pure
protein (4 kcal/g). These differences are accentuated
when one considers real foods rather than nutrients
because high carbohydrate foods, such as vegetables and
cereals, also tend to include water and fibre which further
dilute energy density whereas many high fat foods, such as
oils, butter and margarine, have little water or fibre.
Several carefully controlled studies have manipulated
the fat and carbohydrate content, energy density, and
volume independently of each other to further explore
these relationships. If energy density and palatability are
kept constant, no difference in energy intake occurs in
diets with varying fat and carbohydrate content83.
Conversely, variations in energy density at constant
fat:carbohydrate ratios influences total energy intake84.
This implies that under ad libitum conditions, it is the
high energy density of fatty foods that results in a weak
satiating effect for the energy eaten and, therefore,
promotes passive overconsumption85,86. In the real
world, the fat content of foods or dietary intakes are
closely related to their energy density, so that the general
statement that high dietary fat intakes are likely to
promote weight gain still holds. However, three caveats
to this statement need to be made. The first is that some
food products such as snack bars and breakfast cereals
have been manufactured to be low in fat, but the addition
of large amounts of sugars into the products means that
they contain about the same amount of energy per 100 g
as their original full-fat counterparts87. The second is that
the water incorporated into foods appears to have greater
effects on promoting satiety and reducing subsequent
intake than water incorporated into beverages88. This
would mean that until further research claries the
relationship between energy density, satiety and sub-
sequent energy intake across foods and beverages, these
latter two categories should be considered separately.
The third caveat is that diets that are very high in energy
dilute foods (such as vegetables, fruits and whole grain
cereals) and have a significant addition of fat (such as oil)
may achieve a high percent of energy as fat without being
very energy dense.
Prior to the elegant studies teasing out the impact of
energy density and dietary fat (above), a ‘glycogenostatic
model’ for energy balance had been proposed by Flatt as a
metabolic explanation of the differential effects of high fat
and high carbohydrate diets in animals and humans. This
model was built on the experimental evidence from
feeding trials, the largely separate metabolic pathways for
carbohydrate and fat (nutrient partitioning), the minor
conversion of carbohydrate into fat (de novo lipogenesis is
a minor pathway in humans except under unusual
conditions of massive carbohydrate overfeeding90), the
lack of acute fat oxidation response to increased fat
intake85,91 and the limited capacity of glycogen stores.
While each of these building blocks of the model remain
valid, studies that have grossly manipulated glycogen
stores over 1–2 days have found no effect on energy
intake92,93.
Another potential metabolic mechanism by which
dietary fat might promote weight gain is that it has a
lower thermic effect (energetic cost of processing) than
carbohydrate94 but this is likely to be a minor factor except
under conditions of significant overfeeding91.
Fats also carry many aromatic compounds that add
flavour to foods and, therefore, high fat foods may be
overconsumed, in part, because they are highly palatable.
Percent fat in the diet—secular changes in diet and
obesity: It is apparently paradoxical that in some countries
the percent fat in the diet has decreased but obesity has
increased—indeed this has been dubbed ‘The American
paradox’95 because that is where it is most obvious.
Accurate measurement of population macronutrient
intakes is problematic because of serious (and probably
increasing) underreporting in dietary surveys and the
many assumptions incorporated into measuring food
supply. However, it does appear that dietary carbohydrate
intake has risen in absolute and relative terms, dietary fat
has changed little in absolute terms and decreased in
relative terms and that total energy intake has increased
overall96. These trends coupled with continued reductions
in physical activity would explain the apparent paradox.
Messages about reducing fat in the diet appear to have
been used interchangeably with increasing carbohydrate
and this may have contributed to overconsumption of
carbohydrates and total energy which then promotes the
storage of dietary fat as body fat. This would also be
accentuated by the marketing of high sugar, high energy
dense foods as ‘low fat’ implying (falsely) that they are
neutral or helpful for preventing weight gain87.
Percent fat in the diet—effects on lipoproteins: This topic
is covered in the chapter on cardiovascular diseases, but
there is an interaction between dietary composition and
Diet, nutrition and the prevention of excess weight gain and obesity 129
weight change on lipoprotein levels. Many studies have
manipulated the macronutrient content of short term diets
under isocaloric weight stable conditions (such as reducing
saturated fat and replacing the energy with carbohydrate or
other types of fat). In many58 but not all97 such studies, the
high carbohydrate diet is associated with increased
triglycerides and decreased HDL-cholesterol (especially if
predominantly simple carbohydrates are used).
The weight loss effect of a reduced-fat diet, ad libitum
diet, however, appears to compensate for these potentially
detrimental effects. Schaefer et al. directly compared the
effects of shifting subjects from a high fat diet (35% of
energy) to a low fat diet (15% of energy) under isocaloric
(5–6 weeks) and ad libitum (10–12 weeks) conditions98.
In order to achieve energy equivalence in the isocaloric
part of the study, the weight and volume of the food
consumed on the lower fat diet had to be increased by
30%. Under weight-maintenance conditions, on the low
fat diet there was a significant reduction total, LDL- and
HDL-cholesterol and an increase in total:HDL cholesterol
ratio and plasma triglyceride concentrations. At the end of
the ad libitum diet, subjects had lost an average of 3.6 kg
and achieved greater reductions in total and LDL-
cholesterol compared to the low fat isocaloric diet. The
total:HDL cholesterol ratio and triglyceride levels were no
different at the end of the ad libitum period compared to
baseline.
This and other studies that assess the interaction
between macronutrient composition and weight change
on blood lipids77,99,100 suggest that the effects of short
term, isocaloric manipulations under metabolic ward
conditions on lipids cannot be extrapolated to long term,
ad libitum conditions in free-living individuals.
Summary of percent fat and obesity: At a macronutrient
level, there is no evidence that energy from fat is more
fattening than the same amount of energy from
carbohydrate or protein. At a dietary level, there is still
debate about the effects of diet composition on unhealthy
weight gain, and more research is needed in this area.
However, it was considered that the overall evidence from
the randomised controlled trials was convincing that a
high intake of energy-dense foods (which are often also
micronutrient poor) promotes unhealthy weight gain. The
short term, isocaloric substitution studies were considered
far less relevant to free living individuals than the longer
term, ad libitum studies. These latter studies show a highly
consistent effect of a high fat content on promoting weight
gain. The covert manipulations of fat content show that the
effect is a physiological–behavioural one and is not
dependent on conscious reductions in food eaten. The
main mechanism for this appears to be that a diet high in
fat has a weak impact on satiety because of its high energy
density and this leads to a passive overconsumption of
total energy. The high palatability of high fat foods and the
relatively weak metabolic autoregulation in the face of a
high fat diet are also likely contributors. While most high
fat diets tend to be energy dense diets and thus weight-
promoting diets, important caveats were noted. For
example, many processed low fat foods were quite
energy-dense and could promote weight gain if eaten in
large amounts and conversely vegetable-based foods were
quite energy dilute even with significant added fat and
could protect against weight gain.
Carbohydrate type (sugar, glycemic index (GI) and non-
starch polysaccharide (NSP))
The definitions of carbohydrates are often confusing.
Sugars are predominantly monosaccharides and disac-
charides. The term ‘free sugars’ has been defined in
relation to the sugars that promote dental caries and refers
to all mono and disaccharides added by the manufacturer,
cook or consumer plus sugars naturally present in fruit
juice, honey and syrups. Polysaccharides are either starch
or NSP, the latter having considerable commonality with
the term ‘dietary fibre’ which is still in common parlance
and was the term used in many of the studies reviewed.
Sugars, GI and NSP/fibre are considered in turn, although
of course there is significant overlap between these factors
within foods.
Sugar in foods: There is a reciprocal relationship
between the percent fat and percent carbohydrate in the
diet because these two nutrients generally contribute over
80% of total energy. Therefore, the previous section on
percent fat could also be stated as: diets with a high
carbohydrate content provide protection against weight
gain. However, if the diet is high in sugar, does the same
association apply? Large population studies have demon-
strated that those who have high total energy intakes tend
to have a high total sugar intake101–106 although in relative
terms, a reciprocal relationship is also seen between the
percent fat and percent sugar in the diet106. Studies relating
sugar intake to BMI consistently show an inverse relation
between sugar intake as a percent of energy and BMI or
obesity prevalence106.
It is possible that the negative relationship between
sucrose consumption and BMI is affected by confounding
factors. For example, more active people need extra
energy and this could be provided by sugar. Selective
underreporting of high sugar foods and drinks by
overweight/obese people is another possible confoun-
der107. The high sugar content of some products with
reduced fat claims may falsely imply that the products are
low in energy as well.
Simple sugars have hedonistic value. Sweetening
increases the palatability of many foods and it has been
suggested that sweetness may lead to overconsump-
tion108. However, there appears to be a limit to the
hedonistic response to sweetened foods109. Palatability of
foods is also increased by fat and therefore processed
foods containing both high sugar and fat content may lead
to weight gain110. Overall, the mixed results, especially
amongst the few available trials, does not allow a
BA Swinburn et al.130
judgment to be made about the sugar content of food and
obesity.
Studies have compared high fat diets with low fat diets
that are high in either sugar or starch. Raben et al. found
that similar amounts of energy were consumed on the
high fat and high sucrose diets but there was a lower
energy intake and weight loss with the high starch
diets111. Saris et al. found a relative weight loss of 1.7 kg
in the high sugar diet and 2.6 kg in the high starch diet
compared to the high fat diet (both statistically
significant) but the differences between carbohydrate
types was not significant100.
Sugar in drinks: The energy density of drinks such as
regular soda drinks is low because of the high water
content but physiologically the energy density of fluids
and foods may have not have comparable effects on
satiety and ad libitum food consumption88,112. It, there-
fore, seems prudent to consider the impact of drinks that
contribute a significant amount to total energy intake
(such as high sugar soda drinks) separately from foods.
In a cross-over study, Tordoff and Alleva113 compared
the consumption of soda (1150 g/d for 3 weeks) which
had been sweetened with either a high fructose corn syrup
or aspartame on body weight. The high fructose soda
condition increased total energy intake by 335 kcal/d and
resulted in a significant mean weight gain of 0.66 kg
compared to the aspartame soda condition where total
energy intake decreased by 179 kcal/d and weight
decreased non-significantly by 0.17 kg.
From a US national survey, Harnack et al.114 found that
children ingesting nine or more ounces of soft drink per
day consumed nearly 200 kcal/d more than those who did
not drink soft drinks. In a longitudinal study in the US,
Ludwig et al.115 found a high intake of sugar drinks
predicted the development of obesity over 19 months in
12-year-old children. They estimated that an increase of
one can of soda per day increased the risk of obesity 1.6
times. This association was not seen with diet soda drinks.
Some fruit drinks and cordial drinks can also be high in
sugar and may promote weight gain if drunk in large
quantities but this has been less extensively studied than
soda drinks.
Overall, the evidence that high sugar drinks promote
weight gain is consistent and moderately strong, but is of
most relevance in those populations with a high intake
(such as children in many countries).
Glycemic index: A further mechanism by which
carbohydrates may influence energy intake and body
weight is by their GI. Different carbohydrate foods
increase blood glucose and serum insulin to varying
extents even when the same amount of carbohydrate is
eaten. The different changes in glucose and/or insulin may
have subsequent effects on food intake or the promotion
of overweight and obesity116, with lower GI diets
producing greater satiety117,118. In addition to the effects
of carbohydrates on satiety, there is a suggestion that low
GI diets may provoke greater increases in cholecystokinin
and fullness post-meal (satiation)118,119.
Ludwig et al.116 demonstrated that voluntary food intake
was greater after high GI meals were consumed compared
to medium and low GI meals. They found that rapid
absorption of glucose altered hormonal and metabolic
functions and promoted excessive food intake after the
ingestion of a high GI meal. Agus et al.120 found during a
randomised cross-over trial that when the acute (9 days)
effects of energy restricted diets of high and low glycemic
loads were studied in overweight young men, the high
glycemic load diet produced a greater decline in metabolic
rate, more negative nitrogen balance and greater voluntary
food intake.
On energy restrained diets, a 12 week cross-over trial by
Slabber et al.121 demonstrated that a low GI diet produced
lower insulin levels and a greater weight loss than
corresponding high GI diets. Spieth et al.122 found that
after 4 months of intervention, low GI diets may be more
effective than reduced-fat diets in treating childhood
obesity.
Low GI diets may influence fuel storage by promoting
fat oxidation instead of carbohydrate oxidation118,
whereas raised insulin levels in response to high GI diets
inhibit lipolysis and encourage fat storage116,118, limiting
available fuels and encouraging overeating116.
Overall, the current evidence suggests a possible
influence of GI on body weight and composition, but
long term trials with changes in body weight as an
outcome are needed before more definitive statements
can be made123.
Non-starch polysaccharide: A high intake of dietary
NSP/fibre is generally, but not always associated with a
lower BMI in epidemiological studies124,125, but these
studies are highly susceptible to measurement errors and
confounding factors. Two recent reviews of trials of high
versus low dietary NSP/fibre showed that the majority of
studies supported a beneficial effect of NSP/fibre. Pereira
and Ludwig124 reported that 16 out of 27 trials reported
beneficial subjective effects (satiety ratings) for high
NSP/fibre meals or diets and 12 out of 19 showed
beneficial objective effects (measured energy intake,
gastric emptying, hormonal response or weight change).
The review by Howarth et al. examined the impact of
dietary NSP/fibre on satiety ratings, energy intake and
weight change125. For studies of #2 days (n ¼ 20) and .2
days (n ¼ 18), dietary NSP/fibre as a supplement or in
foods either increased satiety or reduced hunger in the
vast majority (n ¼ 27 studies). The high NSP/fibre
condition also resulted in a decrease in energy intake of
about 10% (n ¼ 23 studies). Studies of greater than 4
weeks duration with either a fixed energy intake (n ¼ 11)
or ad libitum intake (n ¼ 11) showed consistent
reductions in body weight with the high NSP/fibre
condition. The mean weight loss for the fixed intake
studies was 1.3 kg over 2.9 months (20 g/d) and for the
Diet, nutrition and the prevention of excess weight gain and obesity 131

adlibitum studies was 1.9 kg over 3.8 months (24 g/d). In
general, there were no differences between soluble,
insoluble, or mixed fibre or between fibre as a supplement
and within foods. Obese or overweight people tended to
lose more weight than lean individuals (2.4 versus 0.8 kg).
A variety of mechanisms have been postulated to
explain the effects of dietary NSP/fibre on energy balance
and these include intrinsic effects of the NSP/fibre (such as
on energy density and palatability), hormonal effects
(such as gastric emptying and post-prandial glycemia and
insulinemia), and colonic effects (such as fermentation to
short chain fatty acids and effects on satiety)124–126.
Overall, the evidence is convincing that a high dietary
NSP/fibre intake helps to protect against weight gain.
Protein
The range of mean protein intakes across populations and
across time is relatively small (10–15% of total energy)127
and this limits the scope for influencing protein intake as a
population measure to combat obesity. Nevertheless,
protein is generally agreed to be the most satiating of
macronutrients128, particularly among people with a low
habitual protein intake129 and may influence body weight
under ad libitum, reduced fat conditions130. Increasing
protein intake may be beneficial for some individuals for
weight control but the role of protein content of the diet at
a population level is probably not an important
determinant of obesity prevalence.
Alcohol
Alcohol is an energy dense nutrient (7 kcal/g) and because
of its place at the top of the oxidative hierarchy131, its
potential for sparing fat oxidation and promoting fat
storage is significant132. However, some metabolic studies
show that isocaloric substitution of alcohol for food energy
results in weight loss while the addition of alcohol does
not promote weight gain133. There is a similar paradox
seen in epidemiological studies. Dietary intake surveys
tend to show that energy from alcohol is additive to food
energy intake such that total energy intake is higher with a
higher alcohol consumption134. However, the relation-
ships between reported alcohol intake and BMI show a
mixed pattern. One review of the epidemiological
evidence, listed 25 studies showing a positive association,
18 showing a negative association and 11 showing no
relationship135. For women, there was often a negative
relationship134 or possibly U-shaped relationship131. For
men, the relationship tends to be slightly positive134 or
non-existent131.
In an earlier review of 27 studies136, seven showed a
negative relationship between adiposity and alcohol
intake, seven showed a positive relationship, nine showed
different associations for women and men, and eight
showed no relationship. Emery et al. reviewed the
epidemiological studies linking a high alcohol intake
with abdominal fat distribution (high waist circumference
or waist:hip ratio)137. They concluded that the evidence
for a relationship was moderate for men and suggestive for
women.
The potential for confounding by concurrent lifestyle
and socioeconomic factors is substantial, as is the
tendency to underreport alcohol intake. Other factors
also confound the relationships between alcohol and
obesity: alcohol–macronutrient interactions; the possi-
bility that obese people have reduced their alcohol
consumption because of their obesity; metabolism
through pathways with different energetic returns (e.g.
alcohol dehydrogenase versus microsomal ethanol oxidiz-
ing system); and the direct toxic effects of alcohol135.
Overall, the epidemiological evidence is mixed and
probably highly confounded. Randomised controlled
trials on the issue are unlikely to be conducted. There is
currently insufficient evidence to support a general role for
alcohol in the development of obesity.
Portion size
The portion size in pre-packaged, ready-to-eat and
restaurant foods is increasing in the US and elsewhere,
building on the consumers’ desire for ‘value for money’. In
recent years the number of restaurants offering ‘supersize’
options on their menu has rapidly risen, and other food
items, especially snack foods, have increased package
weight42. The increasing size of packaging indicates lower
unit cost and encourages use of more product than small
package size42,138. These trends are occurring in many
western countries but are less well documented than they
are in the US.
‘Supersized’ portions potentially lead to increased
energy intakes at the time and over the day and, therefore,
could be a significant contributor to obesity, particularly in
populations with a high use of meals prepared outside the
home. Many people cannot accurately estimate portion
size, and this leads to an underestimation of intake42,138.
The energy compensation later in the day after a high
energy meal is incomplete in many individuals139. Very
few studies have examined the impact of portion size on
overall energy consumption. One of these has shown that
portion size promotes a higher total intake and that this
seems to occur in adults and in 5 year olds, but not in 3
year olds139. The age at which the external cues (such as
portion size) begin to influence intake is, therefore,
appears to be between 3 and 5 years.
Overall, there is strong ecological evidence of a
concurrent increase in portion sizing and obesity in
countries such as the US. The proposition that large
portion sizes promote overconsumption is logical and
likely but the empirical studies, while supportive, are very
few in number.
Environmental issues
The increasing ‘obesogenicity’ of the environments
external to individuals is likely to be the major driving
BA Swinburn et al.132

force for the increasing obesity epidemic34. The environ-
ments in which people live are complex and their
individual and combined elements have a marked effect
on people’s behaviours and dietary intakes. Individuals
interact in a variety of micro-environments or settings such
as schools, workplaces, homes, restaurants and fast food
outlets140. These in turn are influenced by the broader
macro-environments or sectors such as the food industry,
all levels of government, and society’s attitudes and
beliefs. Much of the evidence of the impact of
environments on dietary intake and obesity comes from
cross-sectional associations and some intervention studies,
although it is generally very difficult to tease out the
impacts of specific environmental elements. The same
statements also apply to environments that promote
physical inactivity. The car-oriented design of built
environments (coupled with the heavy promotion and
affordability of cars and petrol), the increasing use of
machines to replace occupational physical work, the
increasing availability of energy-saving machines for every
day tasks, and the expanding opportunities for passive
recreation and entertainment are some of the dominating
forces in influencing behaviours towards more inactive
lifestyles42.
Socioeconomic circumstances
While socioeconomic status (SES) is a characteristic of an
individual (often measured by personal income or
educational attainment), its underlying determinants are
closely linked to the wider environment, especially to
social, economic, employment and education policies.
The relationship between SES and obesity is complex. The
patterns are more exaggerated in women compared to
men and children and generally show that in low income
countries obesity is more prevalent in high SES individuals
and in affluent countries, it is more prevalent in low SES
individuals141. The change in obesity prevalence patterns
can be seen in some countries that have monitored obesity
prevalence rates over a period of economic transition142. It
seems that in developed countries, the relationship may be
bi-directional (i.e. low SES promotes obesity and obesity
promotes low SES) as well as both obesity and low SES
being independently influenced by other common factors
such as intelligence141. The mechanisms by which high
SES in developed countries provides some protection
against obesity have not been well characterized and are
likely to be multiple, including behaviours such as
restrained eating practices and increased levels of
recreational activity, living in less obesogenic environ-
ments with greater opportunities for healthy eating and
physical activity, and a greater capacity to manipulate their
micro-environments to suit their needs. People living in
low SES circumstances may be more at the mercy of the
increasingly obesogenic environment and end up taking
the default choices on offer. Poorer neighbourhoods tend
to have fewer recreation amenities143, be less safe, and
have a higher concentration of fast food outlets144.
Overall, there is consistent support for the concept that,
in affluent countries, a low SES is a risk factor for obesity in
women and part of that effect is likely to be related to
environments that are relatively deprived of healthier food
choices and opportunities for physical activity.
Schools and other educational settings
Schools are key setting for influencing children and
indeed, in a review of environment-based interventions to
reduce energy intake or energy density145, 24 out of the 75
identified studies were school-based. Overall, these
interventions appeared to influence some of the beha-
viours in relation to food intake but only one showed an
effect on obesity prevalence (in girls but not boys)146.
Another likely obesogenic element in schools (particu-
larly in the US) is the increasing number of soft drink
vending machines in the schools and contracts the schools
sign to achieve a required volume of sales42. One study
has shown that a high consumption of high sugar soft
drinks predicts increased weight gain115.
The elements that contribute to the overall school food
environment are: school food and nutrition policies
(including the types of foods and drinks available and
promoted at school through the school food service or
vending machines); training opportunities and resources
for teachers and food service staff; guidelines for offering
healthy food and drink choices; promotion of healthy
options in food brought from home; the curriculum
content on food and nutrition; and the overall school ethos
or culture on food and nutrition. Collectively, they
probably influence dietary intake and, coupled with the
physical activity environment, probably affect obesity
prevalence but definitive evidence is still lacking around
which elements are most important.
Home environment
The home and family environment is undoubtedly the
most important setting in relation to shaping children’s
eating and physical activity behaviours, but, surprisingly,
very little is known about the specific home influences. A
recent review by Campbell and Crawford, however, has
highlighted a number of elements in the home environ-
ment that are likely to be influential147. The availability,
accessibility and exposure to a range of fruits and
vegetables in the home was correlated with consump-
tion148, and at least two studies showed that repeated
exposure to new foods seemed to reduce the propensity
for young children to reject them149,150. Some aspects of
the mother’s nutrition knowledge, attitudes and beha-
viours are also significant predictors of a child’s
consumption of fruits, vegetables and confectionery151.
A 1993 meta-analysis of five studies showed only a weak
correlation between the food preferences of parent–child
pairs152 but the studies had significant design problems.
Diet, nutrition and the prevention of excess weight gain and obesity 133
A more recent, better designed study found significant
correlations between a toddler’s food preferences and
those of its family members with the most limiting factor
being that a food had never been offered to a toddler,
possibly because the mother did not like the food153.
The review also noted that the continued trend for
eating more food prepared outside the home has reduced
the exposure of children to cooking skills learned in the
home. In addition, there was some evidence that role
modelling by peers and parents is another potentially
important influence over children’s eating patterns. Some
experimental evidence suggests that using foods as a
reward or restricting their availability increases the
preference for those foods and that a high degree of
parental control of a child’s food intake correlated with a
lower ability of the child to self regulate energy intake147.
In summary, there was some empirical evidence and
compelling logic that a wide range of factors in the
home environment influenced food intake, although the
caveat is that most of the studies involved white, middle
class, US children of normal weight. As a setting,
however, it is difficult to influence because of the sheer
numbers and heterogeneity of homes and the limited
options for access (with television advertising campaigns
being the most effective but very expensive access
option).
Food marketing sector
Fast food restaurants and energy-dense foods and drinks
are among the most advertised products on television42,154
and children are often the targeted market. The fat, sugar
and energy content of foods advertised to children is very
high compared to their daily needs and most of the foods
advertised fall into the ‘eat least’ or ‘eat occasionally’
sections of the recommended dietary guidelines155. Many
studies have documented that the overwhelmingly
dominant messages that are directed at children,
particularly through the powerful medium of television
advertising, are the antithesis of what is recommended for
a healthful diet42,155–157.
The food industry (mainly fast food restaurants and
manufacturers of high fat or high sugar foods and drinks)
spends huge sums on mass media advertising, mainly
through television advertisements. In 1997, they spent 11
billion US$ in the US alone42. The impact of this high
volume of advertising on directing food choices to the
products being advertised has undoubtedly been closely
researched by the companies concerned but very little of
this market research data is publicly available156. The high
volume of advertising for energy dense foods and
beverages is undoubtedly fuelling the increasing con-
sumption of these products158.
The prevalence of overweight and obesity is higher
among children who watch more television159, and the
increased energy intakes of these children42,160 may be
partly responsible. Advertised products are more often
requested for purchase and consumed by children157,159.
Brand recognition not only encourages children to request
products more often, but also targets those with
discretionary spending money156. Children’s behaviour
has been shown to reflect television advertising patterns
even when they know what they should be eating157.
Young children under the age of about 6–8 cannot
distinguish regular programmes from advertisements161,
nor do they understand the persuasive intent of
commercials and overweight children with low self-
esteem are more susceptible to commercials that promote
consumption of foods for personal enhancement159.
Overall, it is probable that the heavy advertising of fast
foods and energy dense foods and drinks increases the
consumption of those products. The evidence to support
this rested on a wide variety of publicly available (often
indirect evidence) studies and the huge advertising
investment in influencing food choice behaviours which
was based on more direct but proprietary evidence.
Other environments
There are a wide variety of settings in which people gather
and that involve food and eating. Most of the evidence for
their impact on eating patterns comes from cross-sectional
surveys or intervention studies. Restaurants162, work-
places163,164, supermarkets165 and a variety of other
settings probably each provide modest influences on
dietary intakes and obesity but good evidence is either
limited or non-existent145.
Potential strategies to reduce obesity
A number of potential strategies to reduce obesity
prevalence are described below and summarised in
Table 2. The content of the potential intervention is
outlined, along with a summary of the evidence of
effectiveness and the implications for governments, civil
society, the private sector and the international agencies.
This is not an exhaustive list of potential interventions and
indeed each intervention activity would need to be
specific to the locality and culture of the intervention
population. Strategies to increase physical activity levels
would be a key part of any overall approach to obesity
prevention, however, these are not considered in detail in
this review of diet and nutrition approaches. A review of
the evidence support for some strategies to increase
physical activity has been published by the Center for
Disease Control in the US6.
Fiscal food policies
Food prices have a marked influence on food buying
behaviour and consequently nutrient intakes166.
Governments have price policy instruments at their
disposal (principally subsidies and taxes) to influence
buying patterns. In the case of cardiovascular disease,
Marshall167 has estimated that a tax (17.5% value added
BA Swinburn et al.134

Tab
le2
Pote
ntialnutr
ition
inte
rventio
nstr
ate
gie
sto
reduce
overw
eig
ht/
obesity
pre
vale
nce
Pote
ntialnutr
itio
nin
terv
ention
str
ate
gie
sC
onte
nt
Evid
ence
support
Recom
mendatio
ns
Fis
calpolic
ies
toin
fluence
consum
ption
patt
ern
sR
e-a
lignin
gfiscal
polic
ies
that
influence
the
food
supply
toensure
that
the
popula
tion
has
acce
ss
toa
safe
,nutr
itio
us,
afford
able
food;
fiscal
pol-
icie
sto
dis
coura
ge
the
inta
ke
of
hig
hfa
t/sugar
foods
with
low
essentialnutr
ient
densi
ty
Good
evid
ence
that
food
prices,
availa
bili
tyand
acce
ss
influence
buyin
gpatt
ern
sG
ov,
IC:
Conduct
health
impact
assess
ments
of
fiscal
polic
ies
that
aff
ect
the
food
supply
;m
odify
such
polic
ies
toim
pro
vehealth
CS
:A
dvocacy
for
polic
ies
toim
pro
vefo
od
supply
PS
:S
upport
polic
ies
toim
pro
vefo
od
supply
Levie
sfo
ruse
innutr
itio
npro
motio
nS
mall
levie
son
cert
ain
hig
hvolu
me
foods/d
rinks
(hig
hfa
tand/o
rsugar)
Sm
all
taxes
on
hig
hvolu
me
pro
ducts
rais
esub-
sta
ntial
revenue
(tobacco
levy
model
for
health
pro
motio
n)
Gov:
Consid
er
levie
sto
support
nutr
itio
npro
-m
otio
npro
gra
mm
es
Nutr
itio
nin
form
ation
panels
Appro
priate
labelli
ng
of
nutr
ient
conte
nt
of
food
on
the
package;
com
munic
ation
str
ate
gie
sto
educa
teconsum
ers
on
the
use
of
the
panels
Wid
ely
used
(especia
llyby
wom
en,
hig
her
incom
epeople
and
those
with
health
conditio
ns);
pro
bably
influences
food
form
ula
tions
Gov:
Mandato
ryla
belli
ng
law
s;
fundin
gcom
muni-
catio
ns
str
ate
gie
sto
consum
ers
(especi
ally
low
er
incom
epeople
)IC
,P
S,
CS
:S
upport
NIP
sF
ood
cla
ims
Regula
tory
fram
ew
ork
tom
inim
ise
mis
leadin
gfo
od,
health
,and
nutr
ition
cla
ims
Food
cla
ims
influence
food
choic
es
Gov:
Imple
ment
and
monitor
are
gula
tory
fram
e-
work
;allo
wa
‘low
fat’
cla
imonly
with
equiv
ale
nt
reduced
energ
ydensi
tyIC
,C
S:
Support
food
cla
ims
fram
ew
ork
PS
:D
evelo
pre
duced
fat
foods
that
have
equiv
al-
ent
reductio
ns
inenerg
ydensi
tyN
utr
itio
nsig
npostin
gE
ndors
ed
logos
from
respect
ed
org
anis
ations
show
ing
pro
ducts
meet
nutr
itio
nsta
ndard
sS
ignpost
sused
by
hig
hpro
port
ion
of
the
public
;in
fluences
food
form
ula
tions
CS
:C
onsid
er
the
esta
blis
hm
ent
of
sig
npostin
gpro
gra
mm
es
Gov,
PS
:S
upport
pro
gra
mm
es
Min
imiz
em
ark
eting
of
energ
ydense
foods
toyoung
child
ren
Bans
on
advert
isin
gon
tele
vis
ion
toyoung
chil-
dre
n;
bans
on
mark
eting
energ
ydense
foods
or
drinks
inschool
Str
ong
evid
ence
on
the
hig
hfa
t/sugar
conte
nt
of
food
ads;
str
ong
evid
ence
that
ads
influence
food
purc
hases;
hig
hin
vestm
ent
inT
Vads
Gov:
Legis
lation
and
bro
adcasting
polic
ies
toban
tele
vis
ion
ads
toyoung
child
ren;
education
sect
or
polic
ies
toban
food/d
rink
mark
eting
inschools
CS
,IC
,P
S:
Support
ad
bans
Com
munity-w
ide
pro
gra
mm
es
Multi
ple
sett
ings—
education,
mass
media
and
environm
enta
lin
terv
entions
Modest
eff
ects
at
best
of
pre
vio
us
inte
rventions
(main
lyeducatio
nal)
Gov:
Fund
researc
hin
‘dem
onstr
ation
com
mu-
nitie
s’
tobuild
the
evid
ence
on
inte
rventions
(inclu
din
genvironm
enta
l)to
impro
ve
eating
pat-
tern
sS
chools
and
oth
er
educa
tional
sett
ings
Food
polic
ies/g
uid
elin
es/s
tandard
s;
influencin
gfo
od
sold
or
bro
ught
toschool;
nutr
itio
n/c
ookin
gskill
sin
curr
iculu
m
Good
evid
ence
for
influencin
gsom
edie
tary
pat-
tern
s,
usually
insuffi
cie
nt
toin
fluence
BM
IG
ov:
Polic
ies/g
uid
elin
es/s
tandard
son
school
food;
main
tenance
of
physic
al
educa
tion;
nutr
i-tion
incurr
iculu
mP
S,
IC,
CS
:S
upport
healthy
school
food
pro
-gra
mm
es
Work
pla
cein
terv
entions
Food
polic
y,
healthy
food
availa
ble
and
pro
mote
dM
odest
eff
ect
at
best
on
som
edie
tary
patt
ern
sP
Ssupport
for
health
pro
motion
pro
gra
mm
es
inw
ork
pla
ces
Bre
ast
feedin
gE
duca
tion
and
BF
support
serv
ices,
health
pro
-fe
ssio
nal
train
ing,
BF
-friendly
environm
ents
,B
Fm
onito
ring
pro
gra
mm
es
Good
evid
ence
that
pro
gra
mm
es
incre
ase
BF
rate
s,
good
evid
ence
that
BF
impro
ves
many
health
outc
om
es
but
evid
ence
for
pre
ventio
nof
obesity
ism
ixed
Gov:
Hig
hpriority
for
fundin
gB
Fpro
gra
mm
es,
train
ing,
and
monitoring
syste
ms;
enfo
rce
Code
on
bre
astf
eedin
gand
bre
astm
ilksubstitu
tes
PS
,IC
,C
S:
Support
BF
and
monitor
code
Healthy
eating
guid
elin
es
and
messages
Com
munic
ation
str
ate
gie
saro
und
key
food-
based
mess
ages
for
the
popula
tion
Rais
es
aw
are
ness
and
know
ledge;
may
influence
behavio
ur
inhig
her
SE
Sgro
ups;
necessary
but
not
suffi
cient
Gov:
Support
for
the
develo
pm
ent,
updating,
dis
-sem
ination,
pro
motion
of
food-b
ased
die
tary
guid
elin
es;
link
with
oth
er
str
ate
gie
sC
S,
PS
:S
upport
and
pro
mote
FB
DG
Diet, nutrition and the prevention of excess weight gain and obesity 135
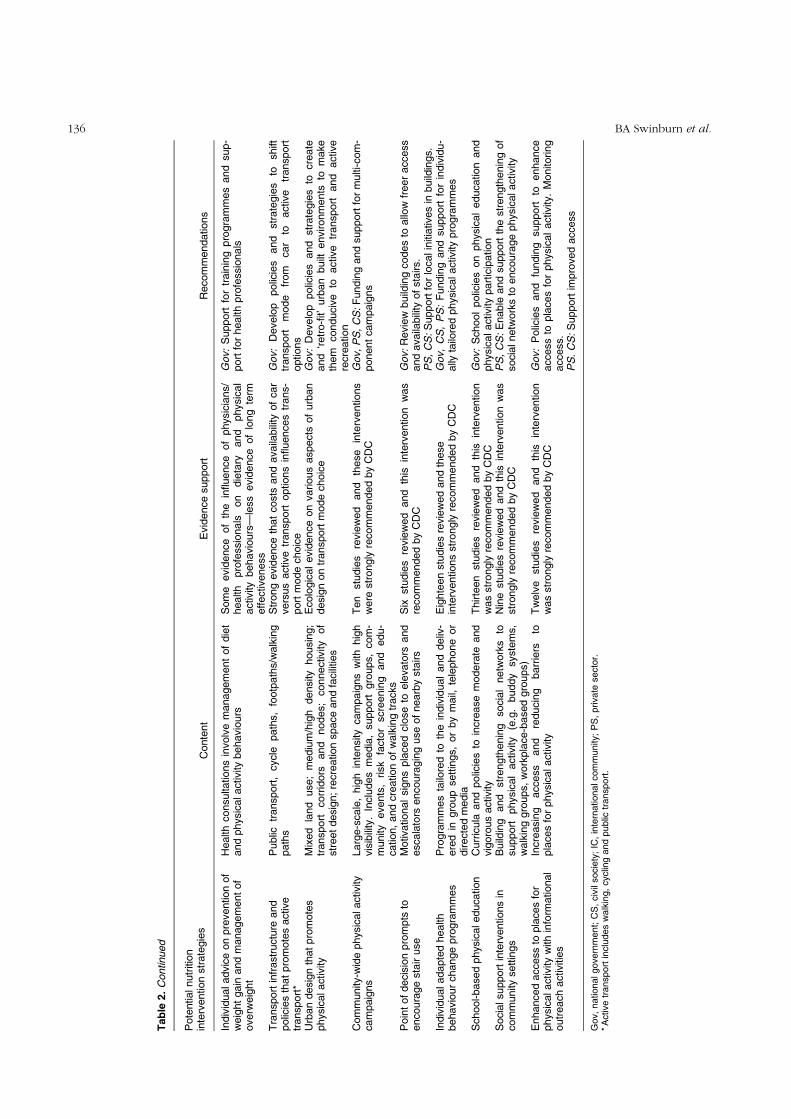
Tab
le2.
Continued
Pote
ntialnutr
itio
nin
terv
ention
str
ate
gie
sC
onte
nt
Evid
ence
support
Recom
mendatio
ns
Indiv
idualadvic
eon
pre
vention
of
weig
ht
gain
and
managem
ent
of
overw
eig
ht
Health
consulta
tions
involv
em
anagem
ent
of
die
tand
physic
alactivity
behavio
urs
Som
eevid
ence
of
the
influence
of
physic
ians/
health
pro
fessio
nals
on
die
tary
and
physic
al
activ
ity
behavio
urs
—le
ss
evid
ence
of
long
term
effective
ness
Gov:
Support
for
train
ing
pro
gra
mm
es
and
sup-
port
for
health
pro
fessio
nals
Tra
nsport
infr
astr
uctu
reand
polic
ies
that
pro
mote
sactive
transport
*
Public
transport
,cycle
path
s,
footp
ath
s/w
alk
ing
path
sS
trong
evid
ence
that
costs
and
availa
bili
tyof
car
vers
us
activ
etr
ansport
options
influences
trans-
port
mode
choic
e
Gov:
Develo
ppolic
ies
and
str
ate
gie
sto
shift
transport
mode
from
car
toactive
transport
options
Urb
an
desig
nth
at
pro
mote
sphysic
alactivity
Mix
ed
land
use;
mediu
m/h
igh
densi
tyhousin
g;
transport
corr
idors
and
nodes;
connectiv
ity
of
str
eet
desig
n;
recre
atio
nspace
and
facili
ties
Eco
logic
al
evid
ence
on
various
aspects
of
urb
an
desig
non
transport
mode
choic
eG
ov:
Develo
ppolic
ies
and
str
ate
gie
sto
cre
ate
and
‘retr
o-fi
t’urb
an
built
environm
ents
tom
ake
them
conduci
ve
toactive
transport
and
activ
ere
cre
ation
Com
munity-w
ide
physic
alactivity
cam
paig
ns
Larg
e-s
cale
,hig
hin
tensity
cam
paig
ns
with
hig
hvis
ibili
ty.
Inclu
des
media
,support
gro
ups,
com
-m
unity
events
,risk
facto
rscre
enin
gand
edu-
cation,
and
cre
ation
of
walk
ing
tracks
Ten
stu
die
sre
vie
wed
and
these
inte
rventions
were
str
ongly
recom
mended
by
CD
CG
ov,
PS
,C
S:
Fundin
gand
support
for
multi-com
-ponent
cam
paig
ns
Poin
tof
decis
ion
pro
mpts
toencoura
ge
sta
iruse
Motiv
ational
sig
ns
pla
ced
clo
se
toele
vato
rsand
escala
tors
encoura
gin
guse
of
nearb
ysta
irs
Six
stu
die
sre
vie
wed
and
this
inte
rvention
was
recom
mended
by
CD
CG
ov:
Revie
wbuild
ing
codes
toallo
wfr
eer
access
and
availa
bili
tyof
sta
irs.
PS
,C
S:
Support
for
localin
itia
tives
inbuild
ings.
Indiv
idualadapte
dhealth
behavio
ur
change
pro
gra
mm
es
Pro
gra
mm
es
tailo
red
toth
ein
div
idual
and
deliv
-ere
din
gro
up
sett
ings,
or
by
mail,
tele
phone
or
direct
ed
media
Eig
hte
en
stu
die
sre
vie
wed
and
these
inte
rventions
str
ongly
recom
mended
by
CD
CG
ov,
CS
,P
S:
Fundin
gand
support
for
indiv
idu-
ally
tailo
red
physic
alactiv
ity
pro
gra
mm
es
School-based
physic
aleduca
tion
Curr
icula
and
polic
ies
toin
cre
ase
modera
teand
vig
oro
us
activity
Thirte
en
stu
die
sre
vie
wed
and
this
inte
rvention
was
str
ongly
recom
mended
by
CD
CG
ov:
Sch
ool
polic
ies
on
physic
al
educa
tion
and
physic
alactiv
ity
part
icip
ation
Socia
lsupport
inte
rventions
incom
munity
settin
gs
Build
ing
and
str
ength
enin
gsoci
al
netw
ork
sto
support
physic
al
activity
(e.g
.buddy
syste
ms,
walk
ing
gro
ups,
work
pla
ce-b
ased
gro
ups)
Nin
estu
die
sre
vie
wed
and
this
inte
rvention
was
str
ongly
recom
mended
by
CD
CP
S,
CS
:E
nable
and
support
the
str
ength
enin
gof
soci
alnetw
ork
sto
encoura
ge
physic
alactivity
Enhanced
access
topla
ces
for
physic
alactivity
with
info
rmational
outr
each
activ
itie
s
Incre
asin
gacce
ss
and
reducin
gbarr
iers
topla
ces
for
physic
alactiv
ity
Tw
elv
estu
die
sre
vie
wed
and
this
inte
rvention
was
str
ongly
recom
mended
by
CD
CG
ov:
Polic
ies
and
fundin
gsupport
toenhance
acce
ss
topla
ces
for
physic
al
activity
.M
onitoring
acce
ss.
PS
.C
S:
Support
impro
ved
access
Gov,
nationalgovern
ment;
CS
,civ
ilsocie
ty;
IC,
inte
rnationalcom
munity;
PS
,private
secto
r.*A
ctive
transport
inclu
des
walk
ing,
cyclin
gand
public
transport
.
BA Swinburn et al.136
tax) on the main sources of saturated fat in the diet would
prevent between 900 and 1000 deaths a year in the UK by
reducing the demand for those foods. Such proposals are
usually contentious168 and governments are generally
loath to enact such policies.
Another fiscal concept is the application of a small tax
(too small to affect sales) on high volume foods of low
nutritional value such as soft drinks, confectionery and
snack foods. Such taxes currently apply in several
jurisdictions in the US and Canada169 although none of
this revenue is used for health gains (such as funding
nutrition programmes or subsidising fruits and
vegetables) but that possibility remains.
Nutrition information panels
Full nutrition information panels on foods have been or
are being introduced by regulation in many countries. Do
nutrition panels influence the food choices made by
consumers and/or the food formulations made by
manufacturers towards foods with a lower fat or energy
content? Most of the available information comes from
cross-sectional surveys from the US where nutrition panels
have been mandatory on packaged foods since 1994170.
In the US, about two thirds of people report using
nutrition panels42 and this appears to significantly
influence food choices. One survey reported that nutrition
panels had changed food choices for 56% of respondents
and in another survey, nutrition panels had stimulated
some food selections and averted other selections in 22
and 34% of respondents, respectively171. A higher use of
nutrition panels was associated with female sex172, higher
educational attainment170 greater nutrition knowledge
and awareness173 and a stronger belief in the importance
of diet in the prevention or management of disease170.
People with some existing conditions such as obesity,
hypertension or high cholesterol are more likely to use
nutrition panels. Obese people are more likely to refer to
grams of fat or calorie information than normal-weight
people170, and those who reported being on a low fat diet
were almost ten times more likely to read the label42,170.
The difference in percent energy from dietary fat between
label readers and non-label readers has been variously
estimated as 13%174, 9% (unadjusted) and 5% (adjusted for
demographic, psychosocial and behavioural variables)170.
The relationship between label-reading and fruits and
vegetables consumption is less clear170,175.
On balance, mandated nutrition information panels
appear to (1) facilitate the food choices of those who are
trying to reduce their fat intake, (2) influence the food
choices of a large proportion of the population, (3) have
greater impact among women, higher educated people
and those with established beliefs and knowledge about
diet–disease relationships. The impact of mandatory
nutrition panels on the formulation and reformulation of
manufactured foods may also be significant but it is not
well documented. The magnitude of the potential impact
and wide reach of mandatory nutrition information panels
argue for this to be a key strategy to improve the nutrition
status of populations. However, it needs to be comple-
mented by other strategies that will influence the food
choices of low income and less educated consumers173.
Nutrition ‘signposting’ programmes
Nutrition ‘signposts’ are signals (such as logos) at point of
choice which indicate to the consumer that a food meets
certain nutrition standards. An example is the ‘Pick the
Tick’ symbol programme run by the National Heart
Foundations in Australia and New Zealand176. While such
signpost systems and endorsements have attracted some
criticism177, they do make identifying healthier food
choices simpler for consumers176, and are frequently used
by shoppers when choosing products176,177. In addition,
the nutrition criteria for the products serve as ‘de facto’
standards for product formulation and many manufac-
turers will formulate or reformulate products to meet those
standards177. Energy density criteria are needed for low fat
products.
Nutrition claims
Nutrition claims are regulated in most countries because of
the potential for misleading information to be promoted.
In the US, over the last 10 years, 20–37% of new products
carry a nutrition claim with over half those claims in recent
years being for reduced or low fat171. The claims clearly
provide information about some aspect of the content of
the food but for some restrained eaters, ‘low fat’ or ‘low
calorie’ claims can become an unconscious message to eat
more of the product or accompanying foods178. In some
manufactured products, the fat content has been reduced
so that a low fat claim can be made, but the energy density
remains high87 negating the potential benefit for reducing
weight gain.
Overall, nutrition claims are an important influence on
the food choices of consumers and the formulation of food
by manufacturers. There can be some negative conse-
quences when the messages or signals are misleading or
are taken in the wrong way. The regulations for nutrition
claims need to ensure that products with claims for ‘low or
reduced fat’ also have comparable reductions in energy
density so that low fat, high energy foods are excluded
from making the claim.
Reducing food marketing directed at children
Reducing the huge volume of marketing of high fat/sugar
foods and drinks and fast food restaurants to young
children, particularly through the powerful medium of
television advertisements, is a potential strategy that is
advocated by a number of health and community-based
organisations161,179. It is, of course, a highly contentious
strategy. The advertising and food industries oppose
regulations to limit advertising to children and focus on
nutrition education and physical activity strategies180.
Diet, nutrition and the prevention of excess weight gain and obesity 137

The evidence to show that banning television advertis-
ing to young children influences behaviours is not
available because there is very little experience in this
strategy. Television advertising to children under 12 years
has not been permitted in Sweden since commercial
television began over a decade ago. Norway, Austria,
Ireland, Australia, Greece and Denmark also have some
restrictions on television advertising to young children.
The implementation of this strategy will, therefore, rest
on a strong rationale and the political will to reduce the
use of young children as a target for promoting foods that
are not recommended in the dietary guidelines181. The
whole area is very complex and any regulations would not
be able to protect children from all aspects of marketing of
fast food restaurants and high fat/sugar foods and drinks
and nor would advertising bans solve childhood obesity.
However, there is currently a substantial imbalance in the
volume and sophistication of messages aimed at children
that promote energy dense, micronutrient-poor products
versus healthier options.
A strong argument could be made for banning all
television advertisements aimed at young children
because the advertisements depend on ‘pester power’
and seek to undermine the parents’ attempts at providing
healthy food choices for their children. The fact that
children would still be seeing some television advertise-
ments during adult programming times or through other
marketing strategies such as billboards and print media
does not negate the rationale for controls on the use of the
most persuasive medium (television) aimed at the most
vulnerable and gullible of audiences (young children).
Public debates over balancing the competing rights of
companies versus parents and policy analyses of the
potential impacts of advertisement bans would be
important first steps in such a controversial strategy.
Community-wide interventions
There have been at least seventeen community-based
interventions to improve dietary patterns and related risk
factors such as BMI or serum cholesterol levels145. Many of
the trials involved sizeable communities (over 1,00,000
people) and long periods (some over 10 years) and most
were in North America and Europe. Most of these studies,
however, did not find any significant change in dietary
behaviours or risk factors. In those studies with statistically
significant changes, the magnitude of the change was only
modest. The favourable results for reducing cardiovas-
cular risk from the North Karelia project were impressive
especially in the early years of the project, but reducing the
population’s mean BMI was not one of the main targets for
intervention and this remained unaffected by the
project182. The Minnesota Heart Health programme was
a large randomised field trial that failed to influence
cardiovascular risk or obesity in the intervention
populations over a 6-year period183. Many of the
interventions had strong educational, mass media or
mass screening components and few involved more
environmental or policy initiatives.
At the moment there is insufficient evidence to support
the widespread use of community-based interventions to
reduce obesity. The approach, however, remains attractive
for further research because it has the potential to
influence a large number of people in a variety of settings.
A greater focus on environmental changes and limiting the
interventions to ‘demonstration areas’ may help to build
the evidence in this area.
Schools and other educational institutions
Schools, pre-schools and after-school care settings are well
placed to influence the food environment and learning
opportunities around nutrition as well as being a potential
vehicle to influence parents and the wider community. A
1997 review of school-based cardiovascular disease
prevention studies that involved classroom health
education identified 16 such studies, of which 10 were
from the US184. While the average percent of positive
outcomes across the trials was 31% (effect ratio), for
adiposity it was only 16%.
The largest study (CATCH) involved over 5000 children
in 56 intervention schools and 40 control schools over 3
school years185. The interventions were school food
service modifications, enhanced physical education and
increased classroom health curricula in 28 schools and the
above components plus family education in another 28
schools. While the interventions significantly decreased fat
in the school lunches and increased vigorous activity, no
differences in body size were seen between the
intervention and control schools. A more recent, smaller
study (10 schools) from the UK used a variety of school-
based interventions, most of which were successfully
implemented186. Despite these promising changes, there
was no difference in body size changes between
intervention and control schools187.
The Planet Health study was a multi-dimensional
intervention study that involved nearly 1300 children in
10 schools and it did show a decrease in obesity
prevalence (in girls only). The intervention was an
educational one focused on decreasing television viewing,
decreasing high fat food, increasing fruit and vegetable
intake and increasing physical activity146.
In a review of environmental interventions to reduce
energy and fat intake in educational settings, Hider found
24 studies, 21 of which were in primary schools145.
Changes in food sales were noted in some studies188, but
dietary behaviour was unaltered in most cases.
Overall, it appears that school-related behaviours can be
influenced by school-based programmes but these are not
usually of sufficient magnitude to influence changes in
obesity prevalence. This may not be surprising when one
considers that the vast majority of children’s waking hours
over a year are spent outside school. A reduction in
television viewing seems to be a key strategy for
BA Swinburn et al.138

school-based education intervention189. Further interven-
tion research is needed in school-based programmes with
potentially greater effectiveness achieved by integrating
school programmes into community programmes and by
focusing on broader environmental and community
changes145,184.
Workplaces
A review of studies of workplace-based interventions on
aspects of dietary intake, found 16 studies, 10 of which
were from the US and seven were randomised trials145.
They used a mixture of educational and environmental
strategies, mainly centred on the workplace canteen. The
results were mixed with some showing no impact of the
programme and others showing significant but modest
benefits in dietary intake and food sales indicators. A
sustained impact on reducing BMI has been difficult to
achieve, although reduced serum cholesterol levels have
been achieved in some studies190.
While workplaces remain an important setting to reach
adult men, the impact of intervention programmes have
been modest at best.
Breastfeeding
In a systematic review of breastfeeding promotion
programmes, Fairbank et al.191 found a positive effect of
the programmes on increasing the initiation of breastfeed-
ing in most (41 of 48) studies reviewed, with a statistically
significant difference being demonstrated in just under
half of the intervention groups (20 of 48) when compared
to control groups. No interventions reported statistically
significant negative effects. The provision of literature
alone did not appear to be successful in increasing
breastfeeding initiation192, however, group or regular one-
on-one education not only increased the initiation but also
duration of breastfeeding193, especially among women
who planned to bottlefeed. More success was reported for
immigrant women when culture-specific education was
used194. From these studies, it has been demonstrated that
breastfeeding initiation and duration rates can be
increased when information is delivered in small,
informal, culture-specific groups191.
Promotion of healthy eating guidelines and
messages
The mass media campaigns and other communication
strategies are used in many countries to educate the public
about healthy eating choices. In the US, the ‘Healthy
Eating Pyramid’, the ‘5-a-day for better health’ campaign
and National Cholesterol Education Programme42 are well
known examples.
Such campaigns and promotions can have a significant
impact on awareness, attitudes, knowledge, and intention
to change195 but behavioural change is not usually
influenced. An exception may be if the message is highly
specific and achievable. An example of such a campaign
targeted a behaviour change from using high fat to low fat
milk. Low fat milk sales increased by about 50% (from 29%
of total sales to 46%) and this was maintained 6 months
after the campaign196.
The messages appear to be more widely heard and
acted upon by people from higher socioeconomic
backgrounds and with a higher educational attainment197.
Surveys have shown that although compliance with
recommendations has risen since the 1980s, and many
people had heard some messages, there was still a
considerable number of people who were not familiar
with the dietary guidelines197,198. Obesity is increasing at a
time when healthy eating messages have never been more
prevalent.
Overall, the promotion of healthier eating choices
appears to be a necessary strategy for improving dietary
intake, but is unlikely to be sufficient for most people to
change behaviours. It may be an important motivating
force for higher income people (who tend to live in less
obesogenic environments) but for low income groups it is
generally not sufficient to effect significant behaviour
changes.
Treatment
Substantial proportions of the population in many parts of
the world are already overweight or obese, and therefore,
efforts to reduce obesity prevalence must not only focus
on the prevention of obesity in those who have not yet
become obese (primary prevention), but also on preven-
tion of further weight gain and promotion of weight loss in
those who are already obese before they develop the
complications of obesity (secondary prevention). In
contrast to the primary prevention of obesity, where
only limited evidence exists to support many of the
potential interventions, substantial data exist on effica-
cious approaches to treatment. The principal setting for
weight loss is likely to be in physician offices or other
health care settings.
Approaches to weight loss and weight maintenance
have been summarised in various evidence-based reports
such as the NIH clinical guidelines on the identification,
evaluation and treatment of overweight and obesity in
adults199. In general, treatments using diet, physical
activity and medications are ‘efficacious’ (i.e. they promote
weight loss in clinical trial settings with careful patient
selection, close monitoring and high adherence rates in
the short term). Studies with long term follow up,
however, are disappointing as patients return towards
their original weights. What is, therefore, lacking are
positive ‘effectiveness’ studies whereby the efficacious
interventions are translated into practice in settings where
medical care is routinely delivered. Because primary care
settings are where most patients are seen and where most
physicians work, demonstrably effective obesity treatment
strategies are essential. Gastroplastic surgery is virtually
Diet, nutrition and the prevention of excess weight gain and obesity 139

the only intervention with long term proven effectiveness
and cost effectiveness200.
It is evident that there are a number of major barriers to
the effective management of obesity within most health
systems. It is beyond the scope of this report to detail
these, but they include a lack of effective interventions in
primary care settings, the lack of self-efficacy on the part of
physicians for managing obesity, the dearth of trained
health professionals to oversee and provide these
therapies201, and in most countries, the financial reimbur-
sement systems that mitigate against best practice
management of obesity. The paradox is that, while there
is little investment in financing obesity management, there
are huge downstream costs associated with the manage-
ment of its complications.
Physical activity
Potential strategies for promoting physical activity are also
shown in the table for completeness. Most of these come
from the US Center for Disease Control and Prevention
review of the effectiveness of interventions to increase
physical activity6.
Population goals and dietary guidelines
Population monitoring programmes for obesity and
certain nutrients are a vital part of a comprehensive
strategy to reduce obesity. The classification categories of
BMI and waist circumference are those defined in the
previous WHO report on obesity8 although the debate
continues about appropriate cut off points for some non-
European ethnic groups17. A population goal for median
BMI for adults is between 21 and 23 kg/m2 because this
reflects an optimum distribution where the population
proportions of underweight and overweight are mini-
mised. For adults, individual goals should be to remain in
the healthy weight range (BMI 18.5–25 kg/m2) and to gain
less than 5 kg over adult life.
The relevant population nutrient goals relate to dietary
fat, free sugars and dietary NSP/fibre. The mean total fat
intake of a population is an indicator of energy density and
it should be less than 30% of energy. Similarly, a mean free
sugar intake of less than 10% of energy would also reflect a
low mean energy density of foods and drinks. The free
sugar population goal is particularly important for
children. Population groups that are very physically active
and have a diets that are high in vegetables, legumes, fruits
and whole grain cereals may sustain a total fat intake of up
to 35% without the risk of unhealthy weight gain.
Achieving these population goals will require, among
other things, the development of food-based dietary
guidelines that are relevant and specific for each country.
Guidelines on the preparation and use of food-based
dietary guidelines are published elsewhere202. The
physical activity levels needed to avoid unhealthy weight
gain in adult life are unknown but may in the order of an
hour per day of moderate intensity activity on most days of
the week7.
Conclusions
Obesity is arguably the biggest challenge among the
epidemics facing the world because it is on the rise in low-
and high income countries, no country has a track record
in terms of attenuating and reversing the epidemic, and it
has several major downstream health consequences in
terms of diabetes, cardiovascular diseases, some cancers
and arthritis that are very common and expensive to treat.
The Epidemiological Triad is helpful in identifying
potential food and nutrition drivers of the epidemic and
strategies for interventions. The main food-related vectors
that promote the passive overconsumption of total energy
are: energy dense foods (principally related their fat
content but sometimes their carbohydrate content), high
energy drinks, and large portion sizes. The environmental
factors tend to be multiple in each of the settings in which
food is consumed and include physical, economic, policy
and socio-cultural dimensions. There is an urgent need to
focus attention on measuring these environmental
influences, assessing their impacts on energy intake and
testing interventions designed to make them less
obesogenic. Much more research is needed in these area
and some recommendations for priorities in future
research are shown in Table 3.
A variety of potential interventions and their impli-
cations have also been outlined. Overall, the level of
evidence for population-based interventions is weak
either because they have been tried and shown to have
a modest impact (such as dietary guidelines and
workplace interventions) or they have not been tried
and evaluated (such as fiscal food policies and banning
Table 3 Research recommendations
† Build evidence of the impact of environmental/educationalinterventions in a variety of settings such as schools and othereducational settings, workplaces, restaurants/cafeterias/cafes andother settings and institutions with catered food.† Build the evidence of the impact of food labelling interventions(nutrition information panels, food claims, signposting pro-grammes) on consumer choice, food formulation and dietary pat-terns.† Improve the methods for measuring body composition, dietaryintake, physical activity in populations.† Develop and validate indicators for environmental determi-nants of obesity and weight gain.† Maintain and enhance systems for monitoring trends in over-weight/obesity, nutrition and physical activity and their environ-mental determinants.† Conduct the body composition studies and prospective studiesneeded to define equivalent (equivalent body composition/equiva-lent disease risk) BMI values across different ethnic groups anddefine ethnic-specific cut-off points.† Conduct studies to define the mechanisms by which low SESpromotes overweight and obesity.† Conduct trials on the impact of carbohydrate type (glycemicindex) on body weight.
BA Swinburn et al.140

television advertisements to young children). In either
case, the need to continue to develop and evaluate
population-based interventions (especially environmental
interventions) is paramount. A failure to act in a
substantive way will undoubtedly result in continued
massive increases in obesity and its complications—the
burden of which will become unbearable for most
countries.
Acknowledgements
An earlier version of this paper was prepared for the Joint
WHO/FAO Expert Consultation on diet, nutrition and the
prevention of chronic diseases (Geneva, 28 January–1
February 2002). The authors wish to thank Professor
George A. Bray, Pennington Biomedical Research Center,
Baton Rouge, USA, and Professor Stephen Rossner,
Obesity Unit, Huddinge Hospital, Stockholm, Sweden,
for the valuable comments they provided on the earlier
version. The authors are particularly indebted to Dr Bill
Dietz, Center for Disease Control and Prevention, Atlanta,
USA, for his contribution to the paper, Dr Martijn Katan,
Wageningen University, Wageningen, The Netherlands,
for his comments and Ms Helen La Fontaine, Deakin
University, Melbourne, Australia, for help in preparation of
the manuscript.
References
1 World Cancer Research Fund. Food, Nutrition, and thePrevention of Cancer: A Global Perspective. Washington,DC: American Institute for Cancer Research, 1997.
2 Black AE, Goldberg GR, Jebb SA, Livingstone MBE, Cole T,Prentice AM. Critical evaluation of energy intake data usingfundamental principles of energy physiology: 2. Evaluatingthe results of published surveys. European Journal ofClinical Nutrition 1991; 45: 583–99.
3 Heitmann BL, Lissner L. Dietary underreporting by obeseindividuals—is it specific or non-specific? British MedicalJournal 1995; 311(7011): 986–9.
4 Briss PA, Zaza S, Pappaioanou M, Fielding J, Wright-DeAguero L, Truman BI, et al. Developing an evidence-basedGuide to Community Preventive Services—methods. TheTask Force on Community Preventive Services. AmericanJournal of Preventive Medicine 2000; 18(1): 35–43.
5 DiPietro L. Physical activity, body weight, and adiposity: anepidemiologic perspective. Exercise and Sport SciencesReview 1995; 23: 275–303.
6 Centers for Disease Control and Prevention. IncreasingPhysical Activity. A Report on Recommendations of theTask Force on Community Preventive Services. Atlanta GA.:Centers for Disease Control and Prevention, 2001.
7 WHO. Weight control and physical activity. In: Bianchini F,ed. IARC Handbooks of Cancer Prevention. Lyon, France:IARC Press, 2002.
8 Obesity: Preventing and Managing the Global Epidemic.Report of a WHO Consultation. WHO Technical ReportSeries No. 894. Geneva, Switzerland: WHO, 2000.
9 Seidell JC. Obesity: a growing problem. Acta PaediatricaSupplement 1999; 88(428): 46–50.
10 Bell AC, Ge K, Popkin BM. Weight gain and its predictorsin Chinese adults. International Journal of Obesity andRelated Metabolic Disorders 2001; 25(7): 1079–86.
11 Hodge AM, Dowse GK, Zimmet PZ. Obesity in Pacificpopulations. Pacific Health Dialog 1996; 3(1): 77–86.
12 Bell AC, Swinburn BA, Simmons D, Wang W, Amosa H,Gatland B. Heart disease and diabetes risk factors in PacificIslands communities and relationships with measures ofbody fat. New Zealand Medical Journal 2001; 114: 208–13.
13 Seidell JC, Rissanen A, Prevalence of Obesity in Adults: TheGlobal Epidemic. In: Bray GA, Bouchard C, eds. Handbookof Obesity, 2004 (In press).
14 Pena M, Bacallao J, ed. Obesity and Poverty: A New PublicHealth Challenge. Washington, DC: Pan American HealthOrganization (PAHO), 2000.
15 Monteiro CA, Mondini L, de Souza AL, Popkin BM. Thenutrition transition in Brazil. European Journal of ClinicalNutrition 1995; 49(2): 105–13.
16 Swinburn BA, Ley SJ, Carmichael HE, Plank LD. Body sizeand composition in Polynesians. International Journalof Obesity and Related Metabolic Disorders 1999; 23(11):1178–83.
17 WHO Regional Office for the Western Pacific. The Asia-Pacific Perspective: Redefining Obesity and its Treatment.Manila, Philippines: World Health Organization, 2000.
18 Deurenberg P, Deurenberg-Yap M, Guricci S. Asians aredifferent from Caucasians and from each other in their bodymass index/body fat per cent relationship. Obesity Reviews2002; 3(3): 141–6.
19 Sjostrom L. Impacts of body weight, body composition, andadipose tissue distribution on morbidity and mortality. In:Stunkard AJ, Wadden TA, eds. Obesity: Theory and Therapy.2nd ed; New York: Raven Press, 1992.
20 McKeigue PM. Metabolic consequences of obesity andbody fat pattern: lessons from migrant studies. In: ShettyPS, McPherson K, eds. The Origins and Consequences ofObesity. Chichester: John Wiley & Sons, 1996.
21 Popkin BM. The nutrition transition and obesity in thedeveloping world. Journal of Nutrition 2001; 131(3):871S–3S.
22 Drewnowski A. Nutrition transition and global dietarytrends. Nutrition 2000; 16(7–8): 486–7.
23 Jung RT. Obesity as a disease. British Medical Bulletin 1997;53(2): 307–21.
24 Manson JE, Willett WC, Stampfer MJ, Colditz GA, Hunter DJ,Hankinson SE, et al. Body weight and mortality amongwomen. New England Journal of Medicine 1995; 333(11):677–85.
25 Zimmet P, Alberti KG, Shaw J. Global and societalimplications of the diabetes epidemic. Nature 2001;414(6865): 782–7.
26 Colditz GA, Willett WC, Rotnitzky A, Manson JE. Weightgain as a risk factor for clinical diabetes mellitus in women.Annals of Internal Medicine 1995; 1221 April: 481–6.
27 Savage PJ, Bennett PH, Senter RG, Miller M. Highprevalence of diabetes in young Pima Indians: evidenceof phenotypic variation in a genetically isolated population.Diabetes 1979; 28(10): 937–42.
28 Rosenbloom AL, Joe JR, Young RS, Winter WE. Emergingepidemic of type 2 diabetes in youth. Diabetes Care 1999;22(2): 345–54.
29 Cockram CS. The epidemiology of diabetes mellitus in theAsia-Pacific region. Hong Kong Medical Journal 2000; 6(1):43–52.
30 Segal L, Carter R, Zimmet P. The cost of obesity: theAustralian perspective. Pharmacoeconomics 1994;5(Suppl.): 45–52.
31 Swinburn B, Ashton T, Gillespie J, Cox B, Menon A,Simmons D, et al. Health care costs of obesity in NewZealand. International Journal of Obesity and RelatedMetabolic Disorders 1997; 21(10): 891–6.
32 Seidell JC. The impact of obesity on health status: someimplications for health care costs. International Journal
Diet, nutrition and the prevention of excess weight gain and obesity 141

of Obesity and Related Metabolic Disorders 1995;19(Suppl. 6): S13–6.
33 Wolf AM, Colditz GA. Social and economic effects of bodyweight in the United States. American Journal of ClinicalNutrition 1996; 63(3 Suppl): 466S–9S.
34 Egger G, Swinburn B. An “ecological” approach to theobesity pandemic. British Medical Journal 1997;315(7106): 477–80.
35 Green SM, Burley VJ. The effects of snacking on energyintake and body weight. Nutrition Bulletin BNF 1996; 21:103–7.
36 Zizza C, Siega-Riz AM, Popkin BM. Significant increase inyoung adults’ snacking between 1977–1978 and 1994–1996 represents a cause for concern! Preventive Medicine2001; 32(4): 303–10.
37 Drummond S, Crombie N, Kirk T. A critique of the effectsof snacking on body weight status. European Journal ofClinical Nutrition 1996; 50(12): 779–83.
38 Mela DJ. Determinants of food choice: relationships withobesity and weight control. Obesity Research 2001;9(Suppl. 5): S249–55.
39 Smith CF, Williamson DA, Bray GA, Ryan DH. Flexible vs.rigid dieting strategies: relationship with adverse beha-vioural outcomes. Appetite 1999; 32(3): 295–305.
40 Yanovski SZ, Sebring NG. Recorded food intake of obesewomen with binge eating disorder before and after weightloss. International Journal of Eating Disorders 1994; 15(2):135–50.
41 Schenck CH, Mahowald MW. Review of nocturnal sleep-related eating disorders. International Journal of EatingDisorders 1994; 15(4): 343–56.
42 French SA, Story M, Jeffery RW. Environmental influenceson eating and physical activity. Annual Reviews of PublicHealth 2001; 22: 309–35.
43 Lin B-H, Frazao E, Guthrie J. Away-From-Home FoodsIncreasingly Important to Quality of American Diet. Jan.Report No.: Agriculture Information Bulletin No. 749.Washington, DC: Economic Research Service, US Dept ofAgriculture, 1999.
44 McCrory MA, Fuss PJ, Hays NP, Vinken AG, Greenberg AS,Roberts SB. Overeating in America: association betweenrestaurant food consumption and body fatness in healthyadult men and women ages 19 to 80. Obesity Research 1999;7(6): 564–71.
45 Jeffery RW, French SA. Epidemic obesity in the UnitedStates: are fast foods and television viewing contributing?American Journal of Public Health 1998; 88(2): 277–80.
46 Binkley JK, Eales J, Jekanowski M. The relation betweendietary change and rising US obesity. International Journalof Obesity and Related Metabolic Disorders 2000; 24(8):1032–9.
47 Dietz WH. Breastfeeding may help prevent childhoodoverweight. Journal of the American Medical Association2001; 285(19): 2506–7.
48 Stark O, Atkins E, Wolff OH, Douglas JW. Longitudinalstudy of obesity in the National Survey of Health andDevelopment. British Medical Journal (Clinical ResearchEducation) 1981; 283(6283): 13–7.
49 Butte NF. The role of breastfeeding in obesity. PediatricClinics of North America 2001; 48(1): 189–98.
50 von Kries R, Koletzko B, Sauerwald T, von Mutius E,Barnert D, Grunert V, et al. Breast feeding and obesity:cross sectional study. British Medical Journal 1999;319(7203): 147–50.
51 Wadsworth M, Marshall S, Hardy R, Paul A. Breastfeeding and obesity. Relation may be accounted for bysocial factors. British Medical Journal 1999; 319(7224):1576.
52 Gillman MW, Rifas-Shiman SL, Camargo CA Jr., Berkey CS,Frazier AL, Rockett HR, et al. Risk of overweight among
adolescents who were breastfed as infants. Journal of theAmerican Medical Association 2001; 285(19): 2461–7.
53 Hediger ML, Overpeck MD, Kuczmarski RJ, Ruan WJ.Association between infant breastfeeding and overweightin young children. Journal of the American MedicalAssociation 2001; 285(19): 2453–60.
54 Parsons TJ, Power C, Logan S, Summerbell CD. Childhoodpredictors of adult obesity: a systematic review. Inter-national Journal of Obesity and Related MetabolicDisorders 1999; 23(Suppl. 8): S1–107.
55 Popkin BM, Richards MK, Montiero CA. Stunting isassociated with overweight in children of four nationsthat are undergoing the nutrition transition. Journal ofNutrition 1996; 126(12): 3009–16.
56 Schroeder DG, Martorell R, Flores R. Infant and childgrowth and fatness and fat distribution in Guatemalanadults. American Journal of Epidemiology 1999; 149(2):177–85.
57 Godfrey KM, Barker DJ. Fetal nutrition and adult disease.American Journal of Clinical Nutrition 2000; 71(Suppl. 5):1344S–52S.
58 Katan MB, Grundy SM, Willett WC. Should a low-fat, high-carbohydrate diet be recommended for everyone? Beyondlow-fat diets. New England Journal of Medicine 1997;337(8): 563–6 Discussion 566–7.
59 Willett WC. Dietary fat and obesity: an unconvincingrelation. American Journal of Clinical Nutrition 1998;68(6): 1149–50.
60 Bray GA, Popkin BM. Dietary fat intake does affect obesity!American Journal of Clinical Nutrition 1998; 68(6):1157–73.
61 Seidell JC. Dietary fat and obesity: an epidemiologicperspective. American Journal of Clinical Nutrition 1998;67(Suppl. 3): 546S–50S.
62 Lissner L, Heitmann BL. Dietary fat and obesity: evidencefrom epidemiology. European Journal of Clinical Nutrition1995; 49(2): 79–90.
63 Reaven GM. Do high carbohydrate diets prevent thedevelopment or attenuate the manifestations (or both) ofsyndrome X? A viewpoint strongly against. CurrentOpinion in Lipidology 1997; 8(1): 23–7.
64 Golay A, Eigenheer C, Morel Y, Kujawski P, Lehmann T,de Tonnac N. Weight-loss with low or high carbohydratediet? International Journal of Obesity and RelatedMetabolic Disorders 1996; 20(12): 1067–72.
65 Garg A, Bantle JP, Henry RR, Coulston AM, Griver KA, RaatzSK, et al. Effects of varying carbohydrate content of diet inpatients with non-insulin-dependent diabetes mellitus.Journal of the American Medical Association 1994;271(18): 1421–8.
66 Duncan KH, Bacon JA, Weinsier RL. The effects of high andlow energy density diets on satiety, energy intake, andeating time of obese and nonobese subjects. AmericanJournal of Clinical Nutrition 1983; 37(5): 763–7.
67 Tremblay A, Lavallee N, Almeras N, Allard L, Despres JP,Bouchard C. Nutritional determinants of the increase inenergy intake associated with a high-fat diet. AmericanJournal of Clinical Nutrition 1991; 53(5): 1134–7.
68 Stubbs RJ, Ritz P, Coward WA, Prentice AM. Covertmanipulation of the ratio of dietary fat to carbohydrateand energy density: effect on food intake and energybalance in free-living men eating ad libitum. AmericanJournal of Clinical Nutrition 1995; 62(2): 330–7.
69 Stubbs RJ, Harbron CG, Murgatroyd PR, Prentice AM.Covert manipulation of dietary fat and energy density:effect on substrate flux and food intake in men eating adlibitum. American Journal of Clinical Nutrition 1995;62(2): 316–29.
70 Tremblay A, Plourde G, Despres JP, Bouchard C. Impact ofdietary fat content and fat oxidation on energy intake in
BA Swinburn et al.142

humans. American Journal of Clinical Nutrition 1989;49(5): 799–805.
71 Thomas CD, Peters JC, Reed GW, Abumrad NN, Sun M, HillJO. Nutrient balance and energy expenditure during adlibitum feeding of high-fat and high-carbohydrate diets inhumans. American Journal of Clinical Nutrition 1992;55(5): 934–42.
72 Lissner L, Levitsky DA, Strupp BJ, Kalkwarf HJ, Roe DA.Dietary fat and the regulation of energy intake in humansubjects. American Journal of Clinical Nutrition 1987;46(6): 886–92.
73 Kendall A, Levitsky DA, Strupp BJ, Lissner L. Weight losson a low-fat diet: consequence of the imprecision of thecontrol of food intake in humans. American Journal ofClinical Nutrition 1991; 53(5): 1124–9.
74 Willett WC. Dietary fat plays a major role in obesity: no.Obesity Reviews 2002; 3(2): 59–68.
75 Astrup A, Grunwald GK, Melanson EL, Saris WH, Hill JO.The role of low-fat diets in body weight control: a meta-analysis of ad libitum dietary intervention studies.International Journal of Obesity and Related MetabolicDisorders 2000; 24(12): 1545–52.
76 Swinburn BA, Metcalf PA, Ley SJ. Long term (5 year) effectsof a reduced-fat diet intervention in individuals withglucose intolerance. Diabetes Care 2001; 24: 619–24.
77 Weststrate JA, van het Hof KH, van den Berg H, Velthuis-te-Wierik EJ, de Graaf C, Zimmermanns NJ, et al. Acomparison of the effect of free access to reduced fatproducts or their full fat equivalents on food intake, bodyweight, blood lipids and fat-soluble antioxidants levels andhaemostasis variables. European Journal of ClinicalNutrition 1998; 52(6): 389–95.
78 Ravussin E, Swinburn BA. Metabolic predictors of obesity:cross-sectional versus longitudinal data. InternationalJournal of Obesity and Related Metabolic Disorders 1993;17(Suppl. 3): S28–S31 Discussion S41–2.
79 Ornish D, Brown SE, Scherwitz LW, Billings JH, ArmstrongWT, Ports TA, et al. Lifestyle changes and heart disease.Lancet 1990; 336(8717): 741–2.
80 Shintani TT, Hughes CK, Beckham S, O’Connor HK.Obesity and cardiovascular risk intervention through the adlibitum feeding of traditional Hawaiian diet. AmericanJournal of Clinical Nutrition 1991; 53: 1647s–51s.
81 Holt S, Miller JC, Petocz P, Farmakalidis E. A satiety index ofcommon foods. European Journal of Clinical Nutrition1995; 49: 675–90.
82 Blundell JE. Food intake and body weight regulation. In:Bouchard C, Bray GA, eds. Regulation Body Weight:Biological and Behavioural Mechanisms. Chichester/NewYork/Brisbane/Toronto/Singapore: John Wiley & Sons,1996.
83 Stubbs RJ, Harbron CG, Prentice AM. Covert manipulationof the dietary fat to carbohydrate ratio of isoenergeticallydense diets: effect on food intake in feeding men adlibitum. International Journal of Obesity and RelatedMetabolic Disorders 1996; 20(7): 651–60.
84 Rolls BJ, Bell EA, Castellanos VH, Chow M, Pelkman CL,Thorwart ML. Energy density but not fat content of foodsaffected energy intake in lean and obese women. AmericanJournal of Clinical Nutrition 1999; 69(5): 863–71.
85 Prentice AM. Manipulation of dietary fat and energy densityand subsequent effects on substrate flux and food intake.American Journal of Clinical Nutrition 1998; 67(3 Suppl.):535S–41S.
86 Yao M, Roberts SB. Dietary energy density and weightregulation. Nutrition Reviews 2001; 59(8 Pt 1): 247–58.
87 Seidell JC. Prevention of obesity: the role of the foodindustry. Nutrition, Metabolism, and CardiovascularDiseases 1999; 9(1): 45–50.
88 Rolls BJ, Bell EA, Thorwart ML. Water incorporated into a
food but not served with a food decreases energy intakein lean women. American Journal of Clinical Nutrition1999; 70(4): 448–55.
89 Flatt JP. The difference in the storage capacities forcarbohydrate and for fat, and its implications in theregulation of body weight. Annals of the New YorkAcademy of Sciences 1987; 499: 104–23.
90 Hellerstein MK. De novo lipogenesis in humans: metabolicand regulatory aspects. European Journal of ClinicalNutrition 1999; 53(Suppl. 1): S53–65.
91 Horton TJ, Drougas H, Brachey A, Reed GW, Peters JC, HillJO. Fat and carbohydrate overfeeding in humans: differenteffects on energy storage. American Journal of ClinicalNutrition 1995; 62(1): 19–29.
92 Stubbs RJ, Murgatroyd PR, Goldberg GR, Prentice AM.Carbohydrate balance and the regulation of day-to-dayfood intake in humans. American Journal of ClinicalNutrition 1993; 57(6): 897–903.
93 Shetty PS, Prentice AM, Goldberg GR, Murgatroyd PR,McKenna AP, Stubbs RJ, et al. Alterations in fuel selectionand voluntary food intake in response to isoenergeticmanipulation of glycogen stores in humans. AmericanJournal of Clinical Nutrition 1994; 60(4): 534–43.
94 Schwartz M, Schultz Y, Piolino V, Schneider H, Febler JP.Thermogenesis in obese women: effect of fructose vs.glucose added to a meal. American Journal of Physiology1992; 262: 394–401.
95 Heini AF, Weinsier RL. Divergent trends in obesity and fatintake patterns: the American paradox. American Journalof Medicine 1997; 102(3): 259–64.
96 Harnack LJ, Jeffery RW, Boutelle KN. Temporal trends inenergy intake in the United States: an ecologic perspective.American Journal of Clinical Nutrition 2000; 71(6):1478–84.
97 Howard BV, Abbott WG, Swinburn BA. Evaluation ofmetabolic effects of substitution of complex carbohydratesfor saturated fat in individuals with obesity and NIDDM.Diabetes Care 1991; 14(9): 786–95.
98 Schaeffer EJ, Lichtenstein AH, Lamon-Fava S, McNamara JR,Schaefer MM, Rasmussen HM, et al. Body weight and low-density lipoprotein cholesterol changes after consumptionof a low-fat ad libitum diet. Journal of the AmericanMedical Association 1995; 274: 1450–5.
99 Leenen R, van der Kooy K, Meyboom S, Seidell JC,Deurenberg P, Weststrate JA. Relative effects of weight lossand dietary fat modification on serum lipid levels in thedietary treatment of obesity. Journal of Lipid Research 1993;34(12): 2183–91.
100 Saris WH, Astrup A, Prentice AM, Zunft HJ, Formiguera X,Verboeket-van de Venne WP, et al. Randomized controlledtrial of changes in dietary carbohydrate/fat ratio and simplevs complex carbohydrates on body weight and bloodlipids: the CARMEN study. The Carbohydrate RatioManagement in European National diets. InternationalJournal of Obesity and Related Metabolic Disorders 2000;24(10): 1310–8.
101 Williams PT. Viewpoint. Sugar: is there a need for a dietaryguideline in Australia? Australian Journal of Nutrition andDietetics 2000; 58: 26–31.
102 Gibson SA. Consumption and sources of sugar in the dietsof British school children. Are high sugar diets inferior?Journal of Human Nutrition and Dietetics 1993; 6: 355–71.
103 Lewis CJ, Park YK, Dexter PB, Yetley EA. Nutrient intakesand body weights of persons consuming high andmoderate levels of added sugars. Journal of the AmericanDietetic Association 1992; 92(6): 708–13.
104 ‘Dietary sugars and human disease’: conclusions andrecommendations. British Dental Journal 1990; 168(2): 46.
105 Naismith DJ, Nelson M, Burley B, Gattenby S. Does a high-sugar diet promote overweight in children and lead to
Diet, nutrition and the prevention of excess weight gain and obesity 143

nutrient deficiencies? Journal of Human Nutrition andDietetics 1995; 8: 249–54.
106 Hill JO, Prentice AM. Sugar and body weight regulation.American Journal of Clinical Nutrition 1995; 62(Suppl. 1):264S–73S Discussion 273S–74S.
107 Bellisle F, Rolland-Cachera MF. How sugar-containingdrinks might increase adiposity in children. Lancet 2001;357(9255): 490–1.
108 Drewnowski A, Kurth C, Holden-Wiltse J, Saari J. Foodpreferences in human obesity: carbohydrates versus fats.Appetite 1992; 18(3): 207–21.
109 Rolls BJ, Hetherington M. The role of variety in eating andbody weight regulation. In: Sheperd R, ed. Handbook of thePsychophysiology of Human Eating. Sussex, England: JohnWiley & Sons, 1989.
110 Anderson GH. Sugars, sweetness, and food intake.American Journal of Clinical Nutrition 1995; 62(Suppl.):195s–202s.
111 Raben A, Macdonald I, Astrup A. Replacement of dietary fatby sucrose or starch: effects on 14 d ad libitum energyintake, energy expenditure and body weight in formerlyobese and never-obese subjects. International Journal ofObesity and Related Metabolic Disorders 1997; 21(10):846–59.
112 Mattes RD. Dietary compensation by humans for sup-plemental energy provided as ethanol or carbohydrate influids. Physiology & Behavior 1996; 59(1): 179–87.
113 Tordoff MG, Alleva AM. Effect of drinking soda sweetenedwith aspartame or high-fructose corn syrup on food intakeand body weight. American Journal of Clinical Nutrition1990; 51(6): 963–9.
114 Harnack L, Stang J, Story M. Soft drink consumption amongUS children and adolescents: nutritional consequences.Journal of the American Dietetic Association 1999; 99(4):436–41.
115 Ludwig DS, Peterson KE, Gortmaker SL. Relation betweenconsumption of sugar-sweetened drinks and childhoodobesity: a prospective, observational analysis. Lancet 2001;357(9255): 505–8.
116 Ludwig DS, Majzoub JA, Al-Zahrani A, Dallal GE, Blanco I,Roberts SB. High glycemic index foods, overeating, andobesity. Pediatrics 1999; 103(3): E26.
117 Ludwig DS. Dietary glycemic index and obesity. Journal ofNutrition 2000; 130(2S Suppl.): 280S–3S.
118 Brand-Miller J, Holt SHA, Pawlak DB, McMillan J. Glycemicindex and obesity. American Journal of Clinical Nutrition2002; 76: 281S–5S.
119 Holt S, Brand J, Soveny C, Hansky J. Relationship of satietyto postprandial glycemic, insulin and cholecystokininresponses. Appetite 1992; 18(2): 129–41.
120 Agus MS, Swain JF, Larson CL, Eckert EA, Ludwig DS.Dietary composition and physiologic adaptations to energyrestriction. American Journal of Clinical Nutrition 2000;71: 901–7.
121 Slabber M, Barnard HC, Kuyl JM, Dannhauser A, Schall R.Effects of a low-insulin-response, energy-restricted diet onweight loss and plasma insulin concentrations in hyper-insulinemic obese females. American Journal of ClinicalNutrition 1994; 60(1): 48–53.
122 Spieth LE, Harnish JD, Lenders CM, Raezer LB, Pereira MA,Hangen SJ, et al. A low-glycemic index diet in the treatmentof pediatric obesity. Archives of Pediatrics & AdolescentMedicine 2000; 154(9): 947–51.
123 Roberts SB. High-glycemic index foods, hunger, andobesity: is there a connection? Nutrition Reviews 2000;58(6): 163–9.
124 Pereira MA, Ludwig DS. Dietary fiber and body-weightregulation. Observations and mechanisms. PediatricClinics of North America 2001; 48(4): 969–80.
125 Howarth NC, Saltzman E, Roberts SB. Dietary fiber andweight regulation. Nutrition Reviews 2001; 59(5): 129–39.
126 Burton-Freeman B. Dietary fiber and energy regulation.Journal of Nutrition 2000; 130(2S Suppl.): 272S–5S.
127 Gurr MI. Diet, nutrition and the prevention of chronicdiseases (WHO, 1990). European Journal of ClinicalNutrition 1991; 45(12): 619–23.
128 Latner JD, Schwartz M. The effects of a high-carbohydrate,high-protein or balanced lunch upon later food intake andhunger ratings. Appetite 1999; 33(1): 119–28.
129 Long SJ, Jeffcoat AR, Millward DJ. Effect of habitual dietary-protein intake on appetite and satiety. Appetite 2000; 35(1):79–88.
130 Astrup A, Raben A. Carbohydrate and obesity. Inter-national Journal of Obesity and Related MetabolicDisorders 1995; 19(Suppl. 5): S27–37.
131 Prentice AM. Alcohol and obesity. International Journal ofObesity and Related Metabolic Disorders 1995; 19(Suppl 5):S44–50.
132 Sonko BJ, Prentice AM, Murgatroyd PR, Goldberg GR, vande Ven ML, Coward WA. Effect of alcohol on postmeal fatstorage. American Journal of Clinical Nutrition 1994;59(3): 619–25.
133 Lands WE. Alcohol and energy intake. American Journal ofClinical Nutrition 1995; 62(5 Suppl.): 1101S–6S.
134 Rose D, Murphy SP, Hudes M, Viteri FE. Food energyremains constant with increasing alcohol intake. Journal ofthe American Dietetic Association 1995; 95(6): 698–700.
135 Suter PM, Hasler E, Vetter W. Effects of alcohol on energymetabolism and body weight regulation: is alcohol a riskfactor for obesity? Nutrition Reviews 1997; 55(5): 157–71.
136 Hellerstedt WL, Jeffery RW, Murray DM. The associationbetween alcohol intake and adiposity in the generalpopulation. American Journal of Epidemiology 1990;132(4): 594–611.
137 Emery EM, Schmid TL, Kahn HS, Filozof PP. A review of theassociation between abdominal fat distribution, healthoutcome measures, and modifiable risk factors. AmericanJournal of Health Promotion 1993; 7(5): 342–53.
138 Wansink B. Can package size accelerate usage volume?Journal of Marketing 1996; 60(3): 1–22.
139 Rolls BJ, Engell D, Birch LL. Serving portion size influences5-year-old but not 3-year-old children’s food intakes.Journal of the American Dietetic Association 2000; 100(2):232–4.
140 Swinburn B, Egger G, Raza F. Dissecting obesogenicenvironments: the development and application of aframework for identifying and prioritizing environmentalinterventions for obesity. Preventive Medicine 1999; 29(6 Pt1): 563–70.
141 Stunkard AJ. Socioeconomic status and obesity. In:Cadwick DJ, Cardew G, eds. The Origins and Conse-quences of Obesity. Chichester: Wiley, 1996, 174–93.
142 Monteiro CA, Conde WL, Popkin BM. Independent effectsof income and education on the risk of obesity in theBrazilian adult population. Journal of Nutrition 2001;131(3): 881S–6S.
143 Subramania SV, Kawachi I, Kennedy BP. Does the state youlive in make a difference? Multilevel analysis of self-ratedhealth in the US. Social Science & Medicine 2001; 53(1):9–19.
144 Reidpath DD, Burns C, Garrard J, Mahoney M, TownsendM. An ecological study of the relationship betweensocioeconomic status and obesogenic environments.Health and Place 2002; 8(2): 141–5.
145 Hider P. Environmental interventions to reduce energyintake or density. A critical appraisal of the literature. NewZealand Health Technology Assessment Report 2001; 4(2).
146 Gortmaker SL, Peterson K, Wiecha J, Sobol AM, Dixit S,Fox MK, et al. Reducing obesity via a school-based
BA Swinburn et al.144

interdisciplinary intervention among youth: Planet Health.Archives of Pediatrics & Adolescent Medicine 1999; 153(4):409–18.
147 Campbell K, Crawford D. Family food environmentsas determinants of preschool-aged children’s eatingbehaviours: implications for obesity prevention policy: areview. Australian Journal of Nutrition and Dietetics 2001;58(1): 19–25.
148 Hearn MD, Baranowski T, Baranowski J. Environmentalinfluences on dietary behaviour among children: avail-ability and accessibility of fruits and vegetables enableconsumption. Journal of Health Education 1998; 29(1):26–32.
149 Sullivan SA, Birch L. Pass the sugar, pass the salt:experience dictates preference. Developmental Psychology1990; 26(546): 551.
150 Sullivan SA, Birch LL. Infant dietary experience andacceptance of solid foods. Pediatrics 1994; 93(2): 271–7.
151 Gibson EL, Wardle J, Watts CJ. Fruit and vegetableconsumption, nutritional knowledge and beliefs in mothersand children. Appetite 1998; 31(2): 205–28.
152 Borah-Giddens J, Falciglia GA. A meta-analysis of therelationship in food preferences between parents andchildren. Journal of Nutrition Education 1993; 25: 102–7.
153 Skinner J, Carruth BR, Moran J, Houck K, Schmidhammer J,Reed A, et al. Toddler’s food preferences: concordancewith family member’s preferences. Journal of NutritionEducation 1998; 30: 17–22.
154 Endicott RC. Ad Age Datacenter–46th Annual Report: 10Leading National Advertisers. Advertising Age. http://www.adage.com (verified September 2001).
155 Hill JM, Radimer KL. A content analysis of foodadvertisements in television for Australian children.Australian Journal of Nutrition and Dietetics 1997; 54(4):174–81.
156 Nestle M, Wing R, Birch L, DiSogra L, Drewnowski A,Middleton S, et al. Behavioral and social influences on foodchoice. Nutrition Reviews 1998; 56(5 Pt 2): S50–S64Discussion S64–74.
157 Hammond KM, Wyllie A, Casswell S. The extent and natureof televised food advertising to New Zealand children andadolescents. Australian and New Zealand Journal ofPublic Health 1999; 23(1): 49–55.
158 Feldwick P. Food advertising and the nation’s diet: what arethe real issues? Business Strategy Reviews 1995; 6(1): 61–9.
159 Lewis MK, Hill AJ. Food advertising on British children’stelevision: a content analysis and experimental study withnine-year olds. International Journal of Obesity andRelated Metabolic Disorders 1998; 22(3): 206–14.
160 Taras HL, Sallis JF, Patterson TL, Nader PR, Nelson JA.Television’s influence on children’s diet and physicalactivity. Journal of Developmental and Behavioral Pedi-atrics 1989; 10(4): 176–80.
161 Children, adolescents, and advertising. Committee onCommunications, American Academy of Pediatrics. Pedi-atrics 1995; 95(2): 295–7.
162 Colby JJ, Elder JP, Peterson G, Knisley PM, Carleton RA.Promoting the selection of healthy food through menu itemdescription in a family-style restaurant. American Journalof Preventive Medicine 1987; 3(3): 171–7.
163 Chu C, Driscoll T, Dwyer S. The health-promotingworkplace: an integrative perspective. Australian andNew Zealand Journal of Public Health 1997; 21(4): 377–85.
164 Schmitz M, Fielding J. Point-of-choice nutritional labeling—evaluation in a worksite cafeteria. Journal of NutritionEducation 1986; 18(1 Suppl.): 65s–8s.
165 Winett RA, Wagner JL, Moore JF, Walker WB, Hite LA, LeahyM, et al. An experimental evaluation of a prototype publicaccess nutrition information system for supermarkets.Health Psychology 1991; 10(1): 75–8.
166 Guo X, Popkin BM, Mroz TA, Zhai F. Food price policy canfavorably alter macronutrient intake in China. Journal ofNutrition 1999; 129(5): 994–1001.
167 Marshall T. Exploring a fiscal food policy: the case of dietand ischaemic heart disease. British Medical Journal 2000;320(7230): 301–5.
168 O’Rourke A. VAT and fat. Will sales tax influenceconsumption? British Medical Journal 2000; 320(7247):1469 Discussion 1470.
169 Jacobson MF, Brownell KD. Small taxes on soft drinks andsnack foods to promote health. American Journal of PublicHealth 2000; 90(6): 854–7.
170 Neuhouser ML, Kristal AR, Patterson RE. Use of foodnutrition labels is associated with lower fat intake. Journalof the American Dietetic Association 1999; 99(1): 45–53.
171 Weimer J. Accelerating the trend toward healthy eating.America’s Eating Habits: Changes and Consequences.Washington, DC: USDA/Econ. Res. Serv., 1999, 385–401.
172 Smith CS, Taylor JG, Stephen AM. Use of food labels andbeliefs about diet–disease relationships among universitystudents. Public Health Nutrition 1999; 3(2): 175–82.
173 Wang G, Fletcher SM, Carley DH. Consumer utilization offood labeling as a source of nutrition information. Journalof Consumer Affairs 1995; 29(2): 368.
174 Zarkin GA, Dean N, Mauskopf JA, Williams R. Potentialhealth benefits of nutrition label changes. AmericanJournal of Public Health 1993; 83(5): 717–24.
175 Kreuter MW, Brennan LK, Scharff DP, Lukwago SN. Donutrition label readers eat healthier diets? Behavioralcorrelates of adults’ use of food labels. American Journalof Preventive Medicine 1997; 13(4): 277–83.
176 Noakes M, Crawford D. The National Heart Foundation’s“Pick the Tick” program. Consumer awareness, attitudesand interpretation. Food Australia 1991; 43(6): 266–62.
177 Young LR, Swinburn B. The impact of the Pick theTick food information programme on the salt content offood in New Zealand. Health Promotion International2002; 17(1): 13–9.
178 Miller DL, Castellanos VH, Shide DJ, Peters JC, Rolls BJ.Effect of fat-free potato chips with and without nutritionlabels on fat and energy intakes. American Journal ofClinical Nutrition 1998; 68(2): 282–90.
179 Sustain: The Alliance for Better Food and Farming. TVDinners – What’s being served up by the advertisers? 2001.London. ISBN 1903060168.
180 O’Brien D. The gathering storm: Marketing food tochildren. American Association of Advertising Agencies.Bulletin 6228, 3 March 2003.
181 Television food advertising during children’s viewing times.Policy statement of the Public Health Association ofAustralia. http://www.phaa.net.av/policy (verified October2002).
182 Pietinen P, Nissinen A, Vartiainen E, Tuomilehto A,Uusitalo U, Ketola A, et al. Dietary changes in the NorthKarelia Project (1972–1982). Preventive Medicine 1988;17(2): 183–93.
183 Luepker RV, Murray DM, Jacobs DR Jr., Mittelmark MB,Bracht N, Carlaw R, et al. Community education forcardiovascular disease prevention: risk factor changes inthe Minnesota Heart Health Program. American Journal ofPublic Health 1994; 84(9): 1383–93.
184 Resnicow K, Robinson TN. School-based cardiovasculardisease prevention studies: review and synthesis. Annals ofEpidemiology 1997; S7: S14–S31.
185 Luepker RV, Perry CL, McKinlay SM, Nader PR, Parcel GS,Stone EJ, et al. Outcomes of a field trial to improvechildren’s dietary patterns and physical activity: The childand adolescent trial for cardiovascular health. CATCHcollaborative group. Journal of the American MedicalAssociation 1996; 275(10): 768–76.
Diet, nutrition and the prevention of excess weight gain and obesity 145

186 Sahota P, Rudolf MC, Dixey R, Hill AJ, Barth JH, Cade J.Evaluation of implementation and effect of primary schoolbased intervention to reduce risk factors for obesity. BritishMedical Journal 2001; 323(7320): 1027.
187 Sahota P, Rudolf MC, Dixey R, Hill AJ, Barth JH, Cade J.Randomised controlled trial of primary school basedintervention to reduce risk factors for obesity. BritishMedical Journal 2001; 323(7320): 1029–32.
188 Carter M, Swinburn B. Measuring the impact of a schoolfood programme on food sales in New Zealand. HealthPromotion International 1999; 14(4): 307–16.
189 Robinson TN. Reducing children’s television viewing toprevent obesity: a randomized controlled trial. Journal ofthe American Medical Association 1999; 282(16): 1561–7.
190 Nicholson C, Shrapnel B, Bauman A, Booth M, Burt S. Acontrolled trial evaluation of a worksite nutrition educationprogram. Australian Journal of Nutrition and Dietetics1993; 50(1): 4–8.
191 Fairbank L, O’Meara S, Renfrew MJ, Woolridge M,Sowden AJ, Lister-Sharp D. A systematic review to evaluatethe effectiveness of interventions to promote the initiationof breastfeeding. Health Technology Assessment 2000;4(25): 1–171.
192 Gilmore M, O’Driscoll D, Murphy H. A pilot survey of anattempt to promote breastfeeding. Irish Journal of MedicalSciences 1979; 148(9–10): 272–5.
193 Kistin N, Benton D, Rao S, Sullivan M. Breast-feeding ratesamong black urban low-income women: effect of prenataleducation. Pediatrics 1990; 86(5): 741–6.
194 Rossiter JC. The effect of a culture-specific educationprogram to promote breastfeeding among Vietnamese
women in Sydney. International Journal of NursingStudies 1994; 31(4): 369–79.
195 van Wechem SN, Brug J, van Assema P, Kistemaker C,Riedstra M, Lowik MR. Fat Watch: a nationwide campaign inThe Netherlands to reduce fat intake—effect evaluation.Nutrition and Health 1998; 12(2): 119–30.
196 Reger B, Wootan MG, Booth-Butterfield S. Using massmedia to promote healthy eating: a community-baseddemonstration project. Preventive Medicine 1999; 29(5):414–21.
197 Turrell G. Compliance with the Australian Dietary Guide-lines in the early 1990’s: have population-based healthpromotion programs been effective? Nutrition and Health1997; 11(4): 271–88.
198 Geiger CJ. Communicating dietary guidelines for Amer-icans: room for improvement. Journal of the AmericanDietetic Association 2001; 101(7): 793–7.
199 Clinical guidelines on the identification, evaluation, andtreatment of overweight and obesity in adults. NationalHeart, Lung, and Blood Institute, National Institutes ofHealth Publication 98–4083. 1998.
200 Sjostrom L, Narbro K, Sjostrom D. Costs and benefits whentreating obesity. International Journal of Obesity andRelated Metabolic Disorders 1995; 19(Suppl. 6): S9–12.
201 Galuska DA, Will JC, Serdula MK, Ford ES. Are health careprofessionals advising obese patients to lose weight?Journal of the American Medical Association 1999;282(16): 1576–8.
202 Preparation and Use of Food-based Dietary Guidelines.Report of a Joint FAO/WHO Consultation. WHO TechnicalReport Series No. 880. Geneva, Switzerland: World HealthOrganisation, 1996.
BA Swinburn et al.146