Embed Size (px)
Citation preview

1
Diesel and marine fuel emissions in NSW - sources and trends
NSW EPA Shipping Emissions
Stakeholder Workshop Friday 14th November 2014
Nick Agapides, Manager Major Air Projects
2
Inventory provides sound evidence • Greater metropolitan region including
Sydney, Newcastle and Wollongong where 75% of NSW population lives

3
Inventory provides sound evidence • Natural and human-made sources like
commercial businesses, household activities, EPA-licensed industry, off-road transport and registered vehicles
4
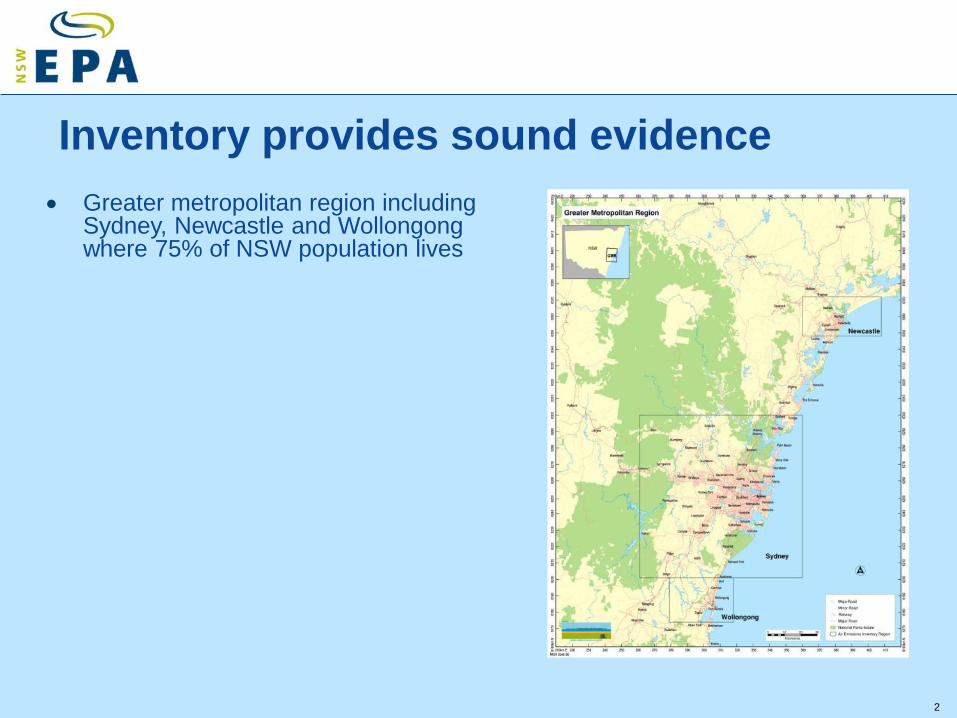
Inventory provides sound evidence • Over 1000 substances, including criteria
pollutants, organics, metals, PAH, PCDD/PCDF, ammonia and GHG
5
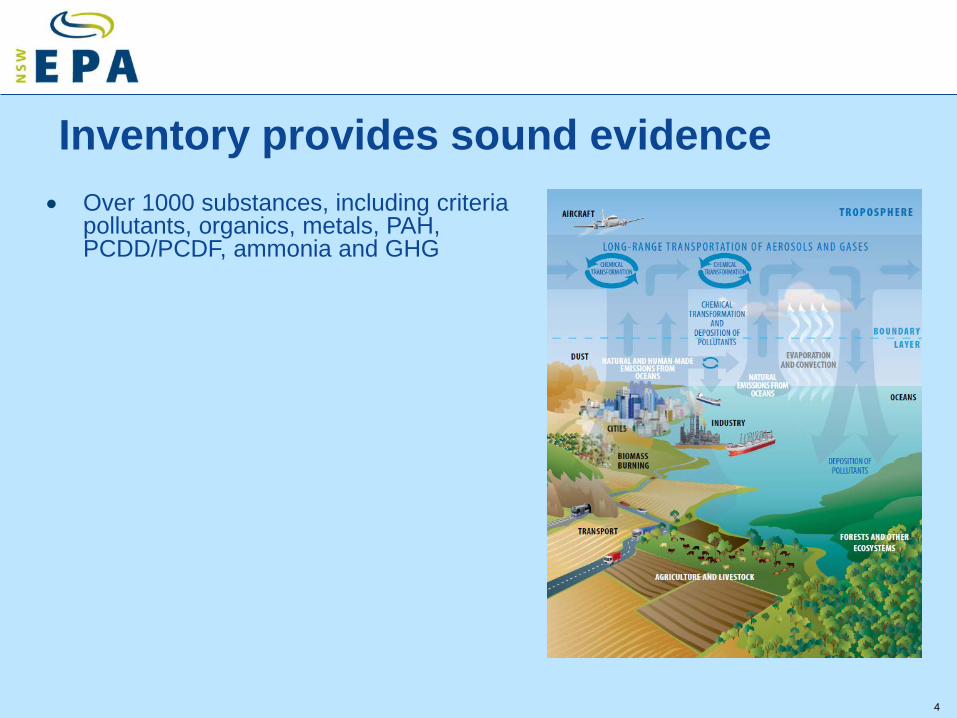
Inventory provides sound evidence • Compiled in 1992, 2003, 2008 and 2013
(in progress) to provide sound evidence for improving air quality

6
Inventory provides sound evidence • Transport a significant source of PM and
ozone precursors
0%
10%
20%
30%
40%
50%
60%
70%
80%
90%
Transport Other Man-Made
NOx VOC PM2.5
Transport vs. Other Man-Made (2008)

7
Direct and indirect formation of ozone & PM • Ozone is formed from NOx and VOC
precursors
• PM includes:
- direct emissions (soot, crustal)
- secondary organic and inorganic (sulfate and nitrate) aerosols

Diesel & marine fuel transport emissions are significant
8

Diesel & marine fuel transport emissions are significant
9

10
Major diesel & marine fuel transport emission sources
0 5,000 10,000 15,000 20,000 25,000 30,000 35,000
Industrial Vehicles and Equipment - Diesel
Heavy Duty Commercial Diesel - Exhaust
Ships Main Engine - Residual Oil
Locomotives - Line Haul
Commercial Boats - Diesel
Light Duty Diesel - Exhaust
Ships Auxilliary Engine - Residual Oil
Locomotives - Passenger
Ships Main Engine - Diesel Oil
Ships Auxilliary Engine - Diesel Oil
Other
Tonnes/year
Sour
ce
Diesel & marine fuel transport NOx emissions in the GMR
On-road dieselNon-road diesel & marine

11
Major diesel & marine fuel transport emission sources
0 500 1,000 1,500 2,000 2,500
Industrial Vehicles and Equipment - Diesel
Heavy Duty Commercial Diesel - Exhaust
Ships Main Engine - Residual Oil
Light Duty Diesel - Exhaust
Ships Auxilliary Engine - Residual Oil
Ships Auxilliary Boiler - Residual Oil
Locomotives - Line Haul
Commercial Boats - Diesel
Locomotives - Passenger
Lawn Mowing (Public Open Spaces) - Diesel
Other
Tonnes/year
Sour
ce
Diesel & marine fuel transport PM2.5 emissions in the GMR
On-road dieselNon-road diesel & marine

12
Emissions vs diesel & marine fuel consumption
0%
10%
20%
30%
40%
50%
60%
70%
80%
Non-road diesel & marine On-road diesel
Emissions vs Diesel & Marine Fuel Consumption in the GMR
NOx - kg/year
PM2.5 - kg/year
Diesel & marine fuel - kL/year
13
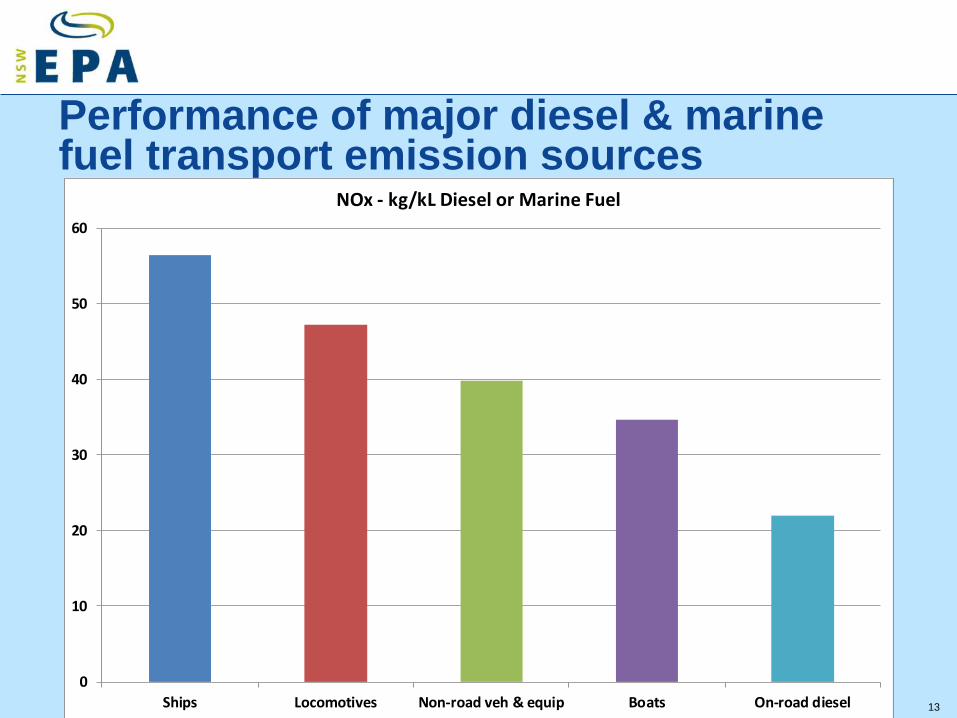
Performance of major diesel & marine fuel transport emission sources
0
10
20
30
40
50
60
Ships Locomotives Non-road veh & equip Boats On-road diesel
NOx - kg/kL Diesel or Marine Fuel
14
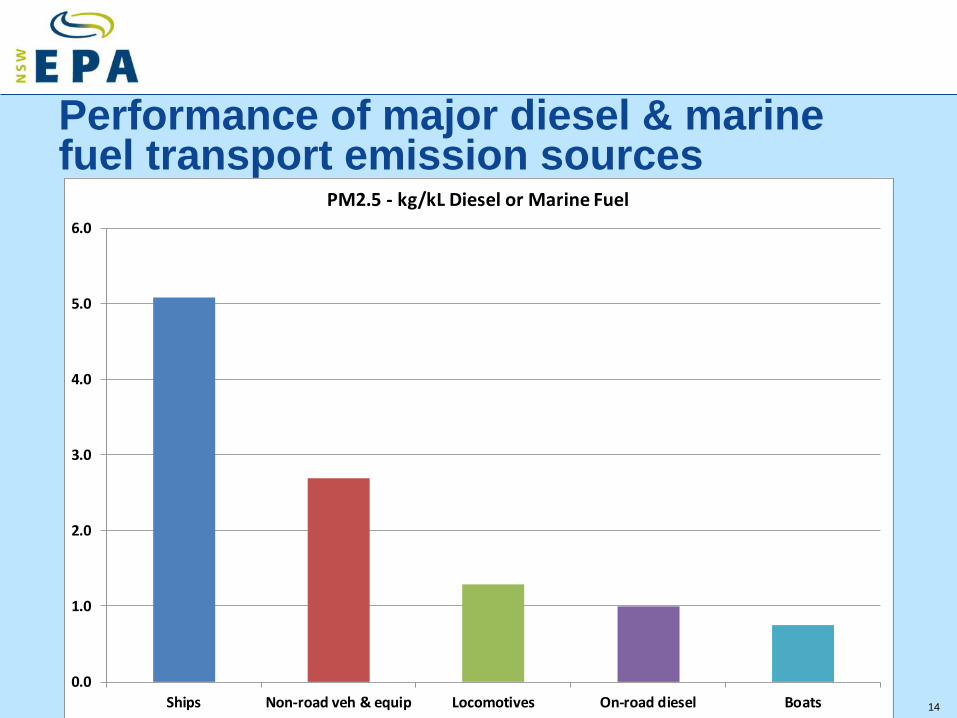
Performance of major diesel & marine fuel transport emission sources
0.0
1.0
2.0
3.0
4.0
5.0
6.0
Ships Non-road veh & equip Locomotives On-road diesel Boats
PM2.5 - kg/kL Diesel or Marine Fuel
15
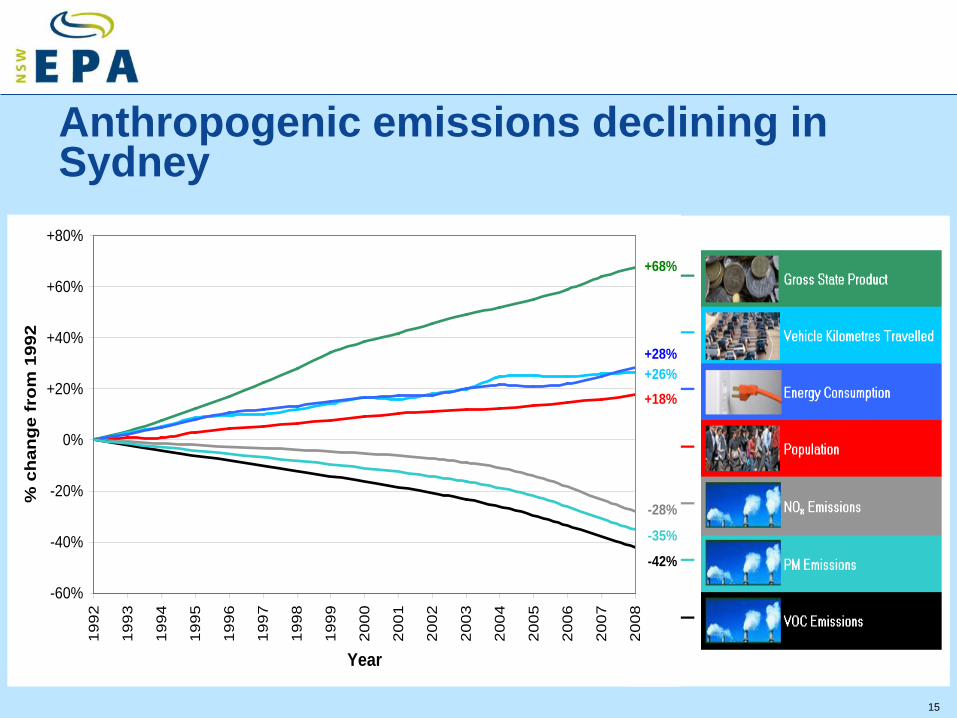
Anthropogenic emissions declining in Sydney
+68%
+18%+26%+28%
-28%
-42%
-35%
-60%
-40%
-20%
0%
+20%
+40%
+60%
+80%
1992
1993
1994
1995
1996
1997
1998
1999
2000
2001
2002
2003
2004
2005
2006
2007
2008
Year
% c
han
ge
fro
m 1
992
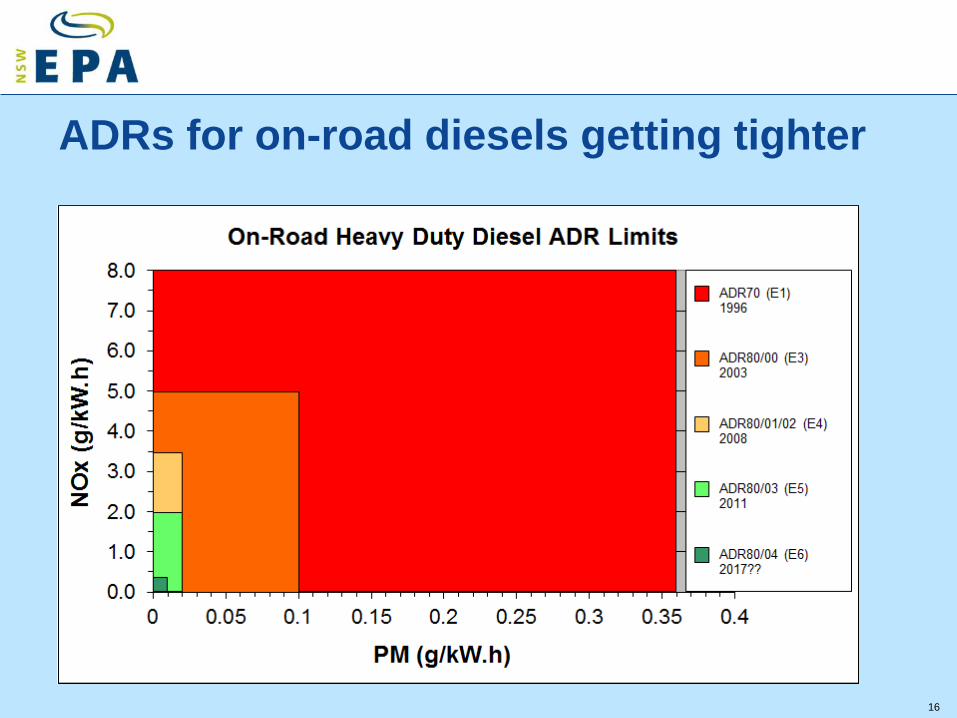
ADRs for on-road diesels getting tighter
16

17
Future diesel & marine fuel consumption
0
20
40
60
80
100
120
140
Dies
el &
mar
ine
fuel
cons
umpt
ion
(PJ/
year
)
BREE forecast diesel & marine fuel consumption in NSW by sector
Air transport
Manufacturing and Construction
Electricity generation
Commercial and services
Rail transport
Water transport
Agriculture
Mining
Non-road & marine transport
Road transport
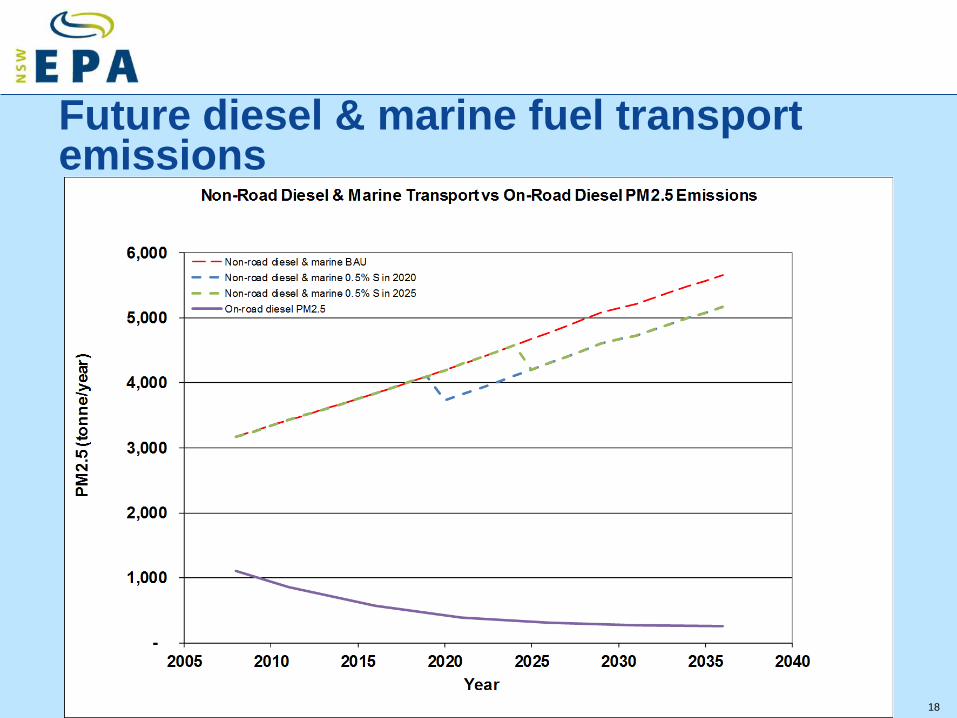
18
Future diesel & marine fuel transport emissions

19
Where do marine fuel transport emissions occur
Newcastle21%
Port Jackson18%
Port Botany49%
Port Kembla12%
PM2.5 emissons by port in the GMR
20
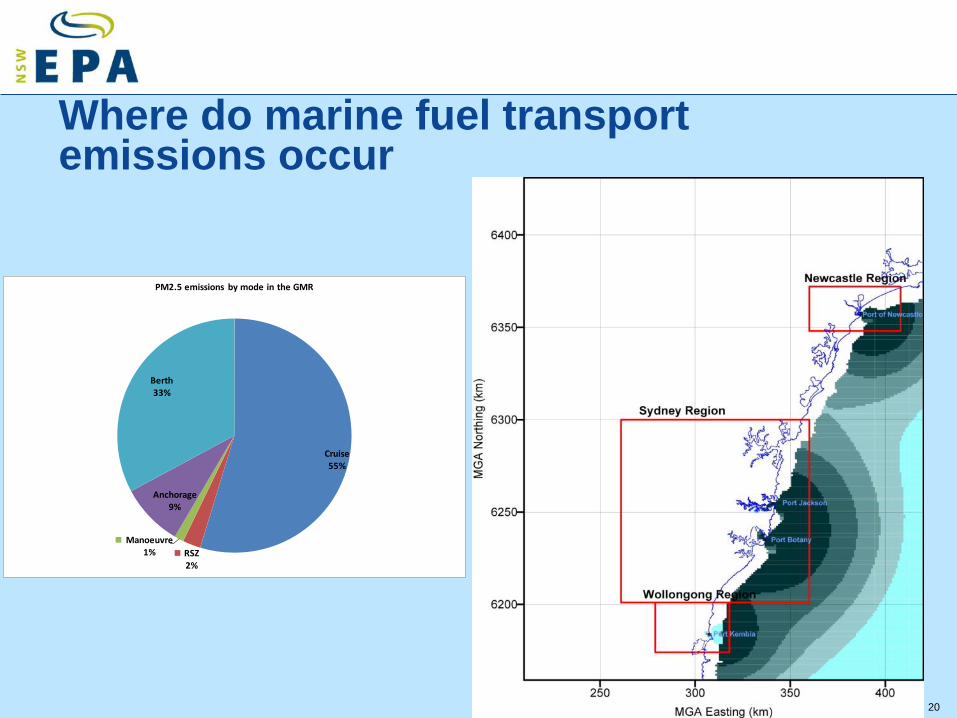
Where do marine fuel transport emissions occur
Cruise55%
RSZ2%
Manoeuvre1%
Anchorage9%
Berth33%
PM2.5 emissions by mode in the GMR

21
Potential benefits of reducing marine fuel transport emissions
-
100
200
300
400
500
600
700
800
900
1,000
IFO380 LS380 (1%) IFO180 LS180 (1%)
Mar
ine
fuel
pric
e (2
014
AUD/
tonn
e)
Fuel
Marine fuel prices from Bunkerworld - 2014 AUD/tonne
Singapore
Sydney? ?
? = estimate
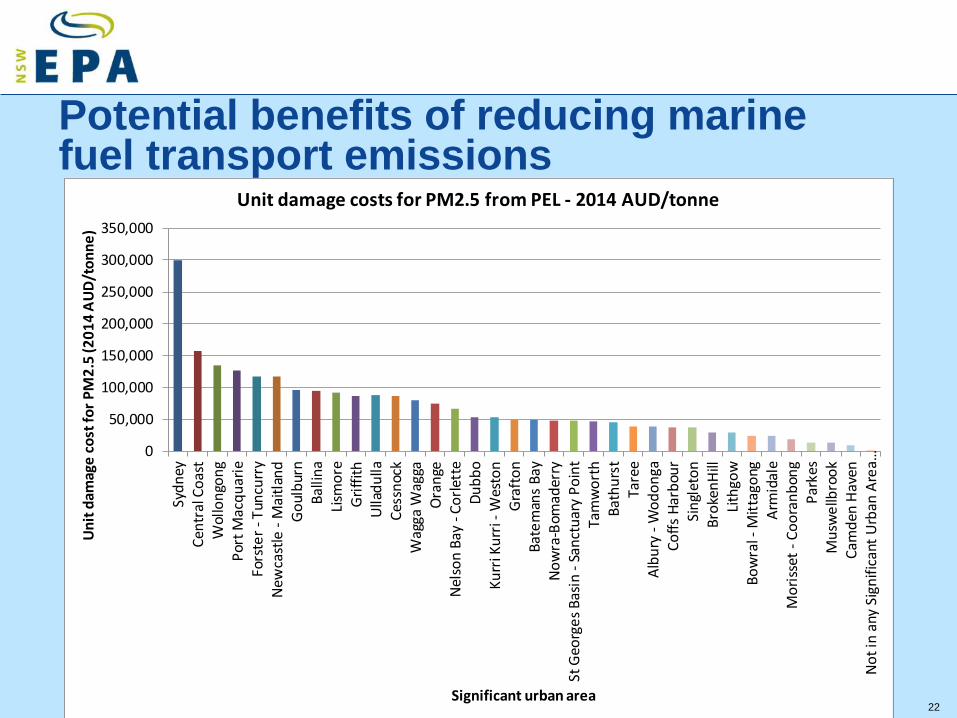
22
Potential benefits of reducing marine fuel transport emissions
0
50,000
100,000
150,000
200,000
250,000
300,000
350,000
Sydn
eyCe
ntra
l Coa
stW
ollo
ngon
gPo
rt M
acqu
arie
Fors
ter -
Tun
curr
yNe
wca
stle
- M
aitla
ndGo
ulbu
rnBa
llina
Lism
ore
Griff
ithUl
ladu
llaCe
ssno
ckW
agga
Wag
gaOr
ange
Nelso
n Ba
y - C
orle
tte
Dubb
oKu
rri K
urri
- Wes
ton
Graf
ton
Bate
man
s Bay
Now
ra-B
omad
erry
St G
eorg
es B
asin
- Sa
nctu
ary
Poin
tTa
mw
orth
Bath
urst
Tare
eAl
bury
- W
odon
gaCo
ffs H
arbo
urSi
ngle
ton
Brok
enHi
llLit
hgow
Bow
ral -
Mitt
agon
gAr
mid
ale
Mor
isset
- Co
oran
bong
Park
esM
usw
ellb
rook
Cam
den
Have
nNo
t in
any
Sign
ifica
nt U
rban
Are
a…
Unit
dam
age
cost
for P
M2.
5 (2
014
AUD/
tonn
e)
Significant urban area
Unit damage costs for PM2.5 from PEL - 2014 AUD/tonne
23
Potential benefits of reducing marine fuel transport emissions
0
100
200
300
400
500
600
700
800
900
Newcastle Port Jackson Port Botany Port Kembla Total
PM2.
5 em
issi
ons (
tonn
e/ye
ar)
Port
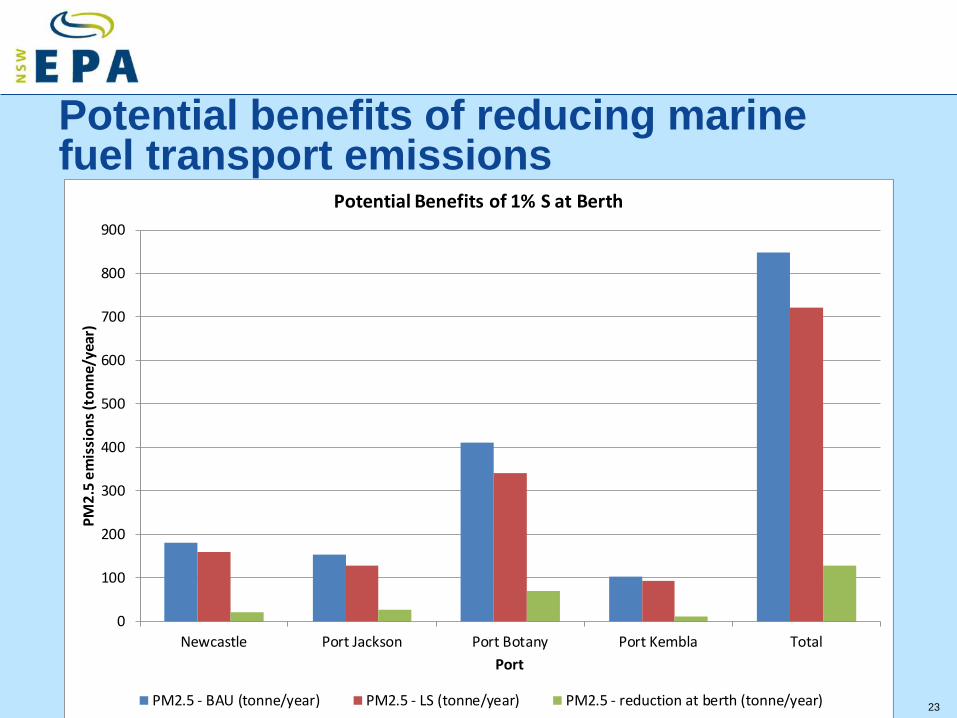
Potential Benefits of 1% S at Berth
PM2.5 - BAU (tonne/year) PM2.5 - LS (tonne/year) PM2.5 - reduction at berth (tonne/year)
24
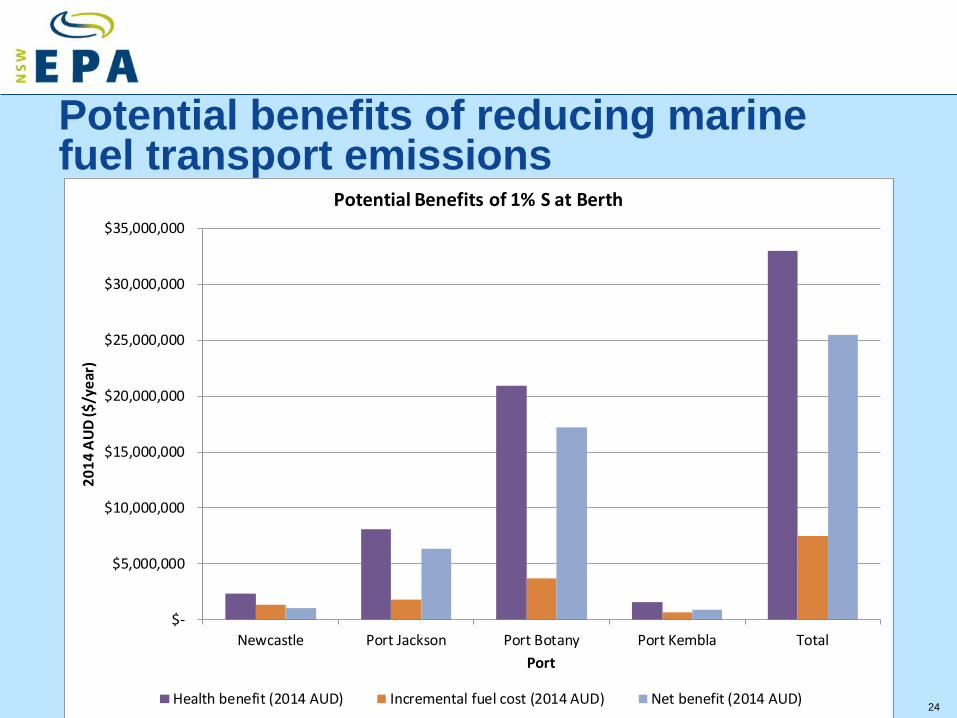
Potential benefits of reducing marine fuel transport emissions
$-
$5,000,000
$10,000,000
$15,000,000
$20,000,000
$25,000,000
$30,000,000
$35,000,000
Newcastle Port Jackson Port Botany Port Kembla Total
2014
AUD
($/y
ear)
Port
Potential Benefits of 1% S at Berth
Health benefit (2014 AUD) Incremental fuel cost (2014 AUD) Net benefit (2014 AUD)
25
Conclusions • Non-road diesel & marine fuel emissions a significant source of PM and
ozone precursor emissions
• Non-road diesel & marine fuel consumption similar to on-road diesel but likely to increase
• ADRs have been successful at reducing on-road diesel emissions
• Technologies and cleaner fuels are available to reduce non-road diesel & marine fuel emissions but cost is likely to be a major issue in some cases
• A significant health benefit can be achieved by reducing non-road diesel & marine fuel emissions

26
Questions?