Embed Size (px)
Citation preview

Electric Power Technical Conference
October 2015Tinaja Hills, AZ
Use of Gas Gensets in Standby Applications
Michael Devine
Introduction• Mike Devine
- EP Gas Product / Marketing Manager Caterpillar Energy Solutions
- 40 years with Caterpillar
Agenda
• Differences between diesel and gas products
• How engines accept loads
• Factors effecting gas engine load acceptance
• Gas gen sets for Emergency Power Supply
• Why natural gas in standby
• Gas standby gen sets for distributed generation
• Maintaining gas gen sets for highest reliability
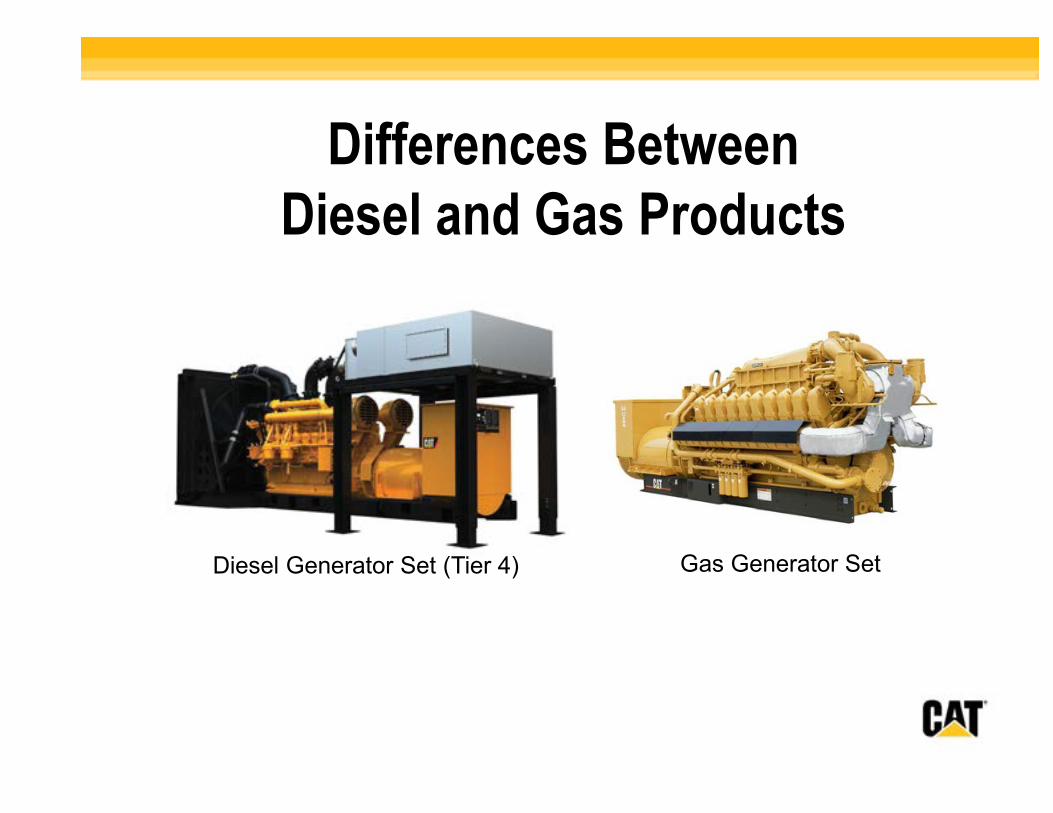
Differences Between Diesel and Gas Products
Gas Generator SetDiesel Generator Set (Tier 4)
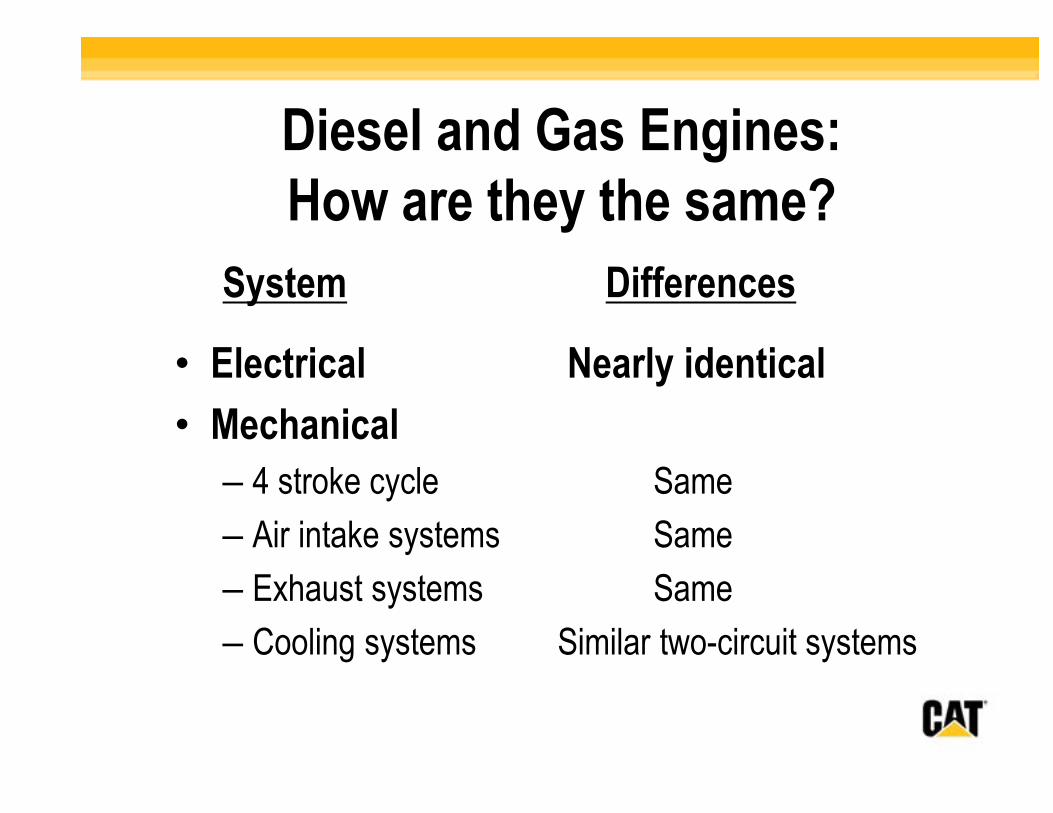
Diesel and Gas Engines: How are they the same?
System Differences
• Electrical Nearly identical
• Mechanical
– 4 stroke cycle Same
– Air intake systems Same
– Exhaust systems Same
– Cooling systems Similar two-circuit systems
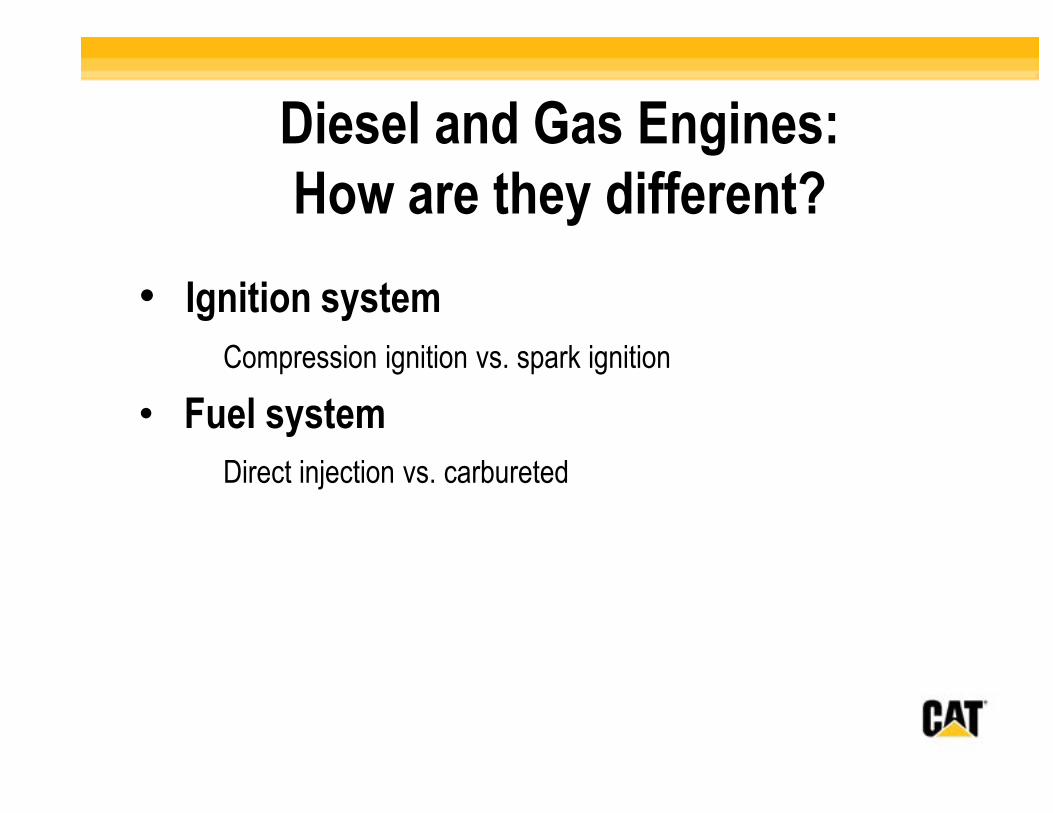
Diesel and Gas Engines:How are they different?
• Ignition system
Compression ignition vs. spark ignition
• Fuel system
Direct injection vs. carbureted
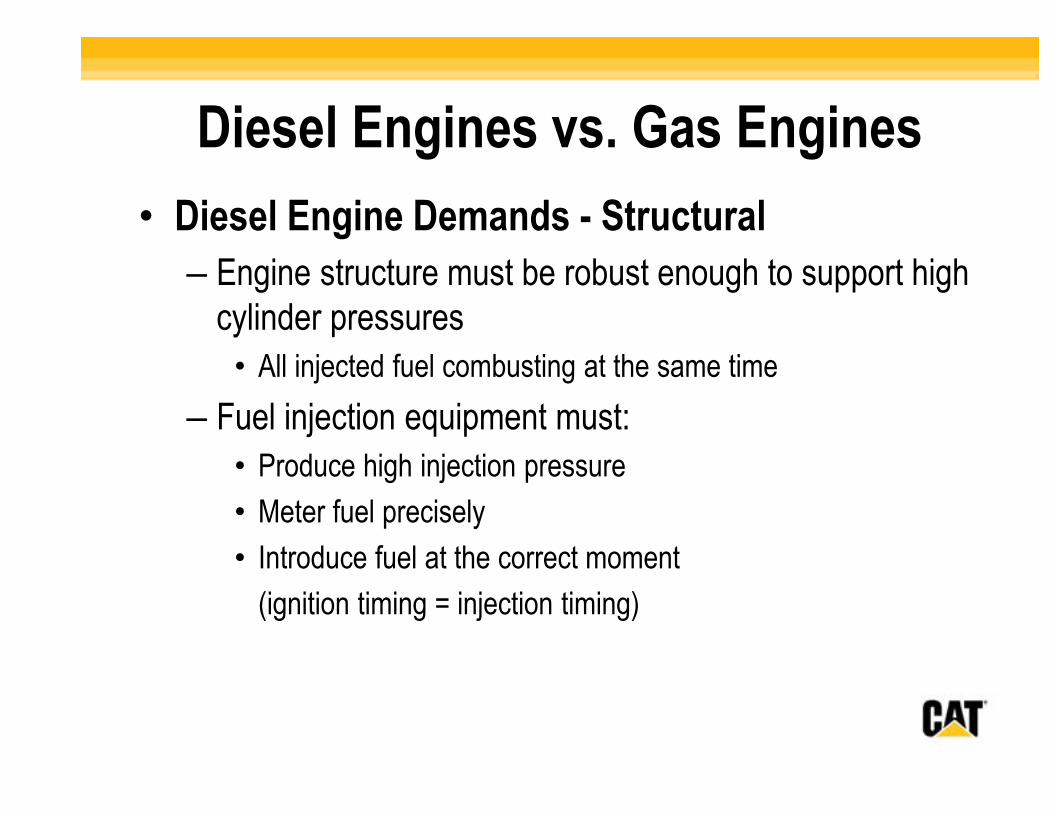
Diesel Engines vs. Gas Engines
• Diesel Engine Demands - Structural
– Engine structure must be robust enough to support high cylinder pressures
• All injected fuel combusting at the same time
– Fuel injection equipment must:
• Produce high injection pressure
• Meter fuel precisely
• Introduce fuel at the correct moment
(ignition timing = injection timing)
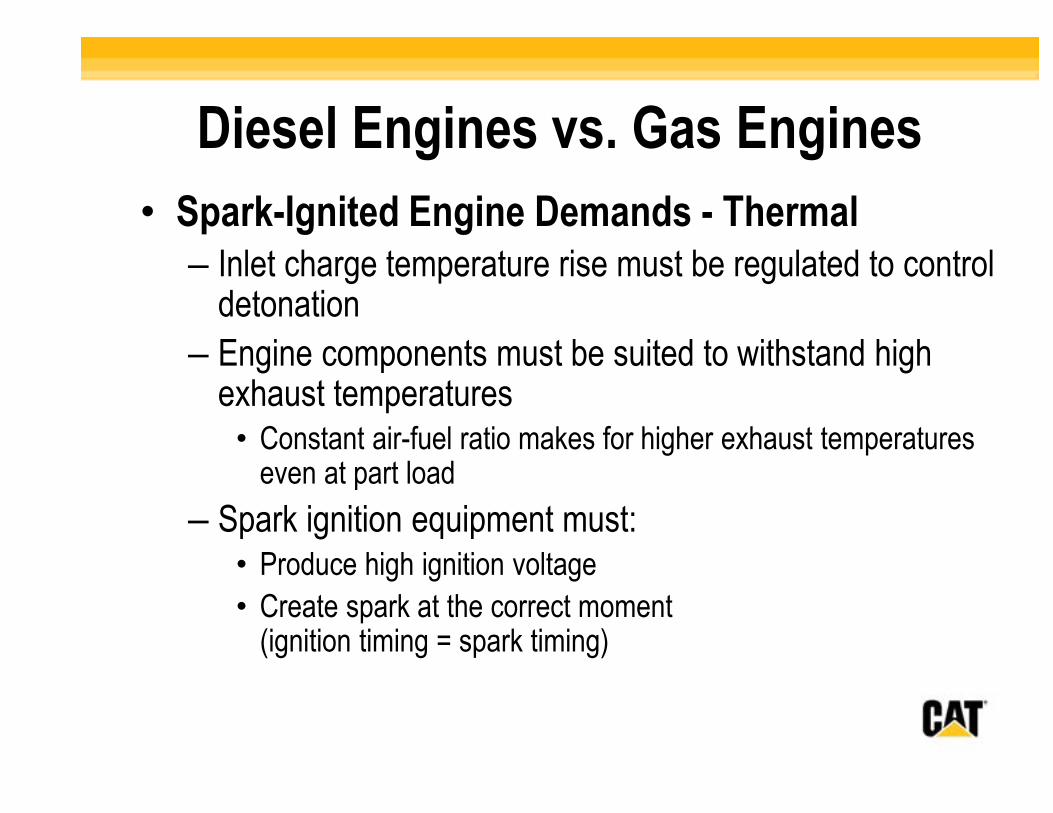
Diesel Engines vs. Gas Engines
• Spark-Ignited Engine Demands - Thermal– Inlet charge temperature rise must be regulated to control
detonation
– Engine components must be suited to withstand high exhaust temperatures
• Constant air-fuel ratio makes for higher exhaust temperatures even at part load
– Spark ignition equipment must:• Produce high ignition voltage
• Create spark at the correct moment (ignition timing = spark timing)
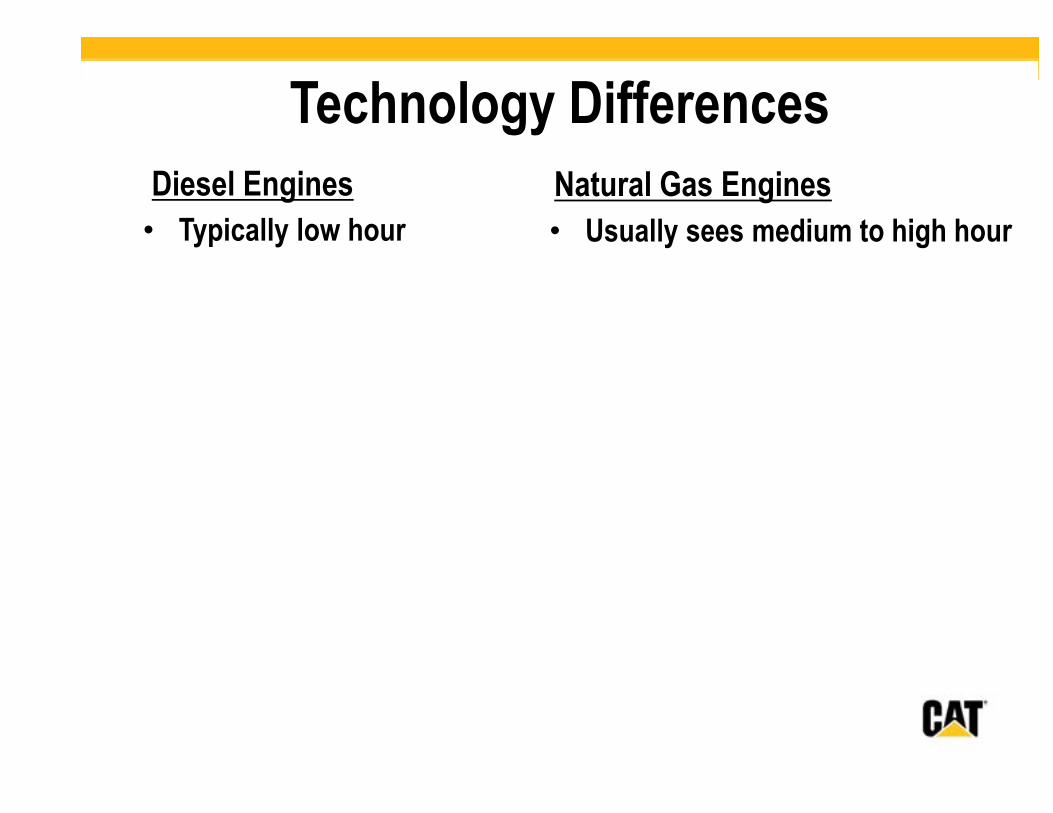
Technology Differences
Diesel Engines
• Typically low hour
Natural Gas Engines
• Usually sees medium to high hour
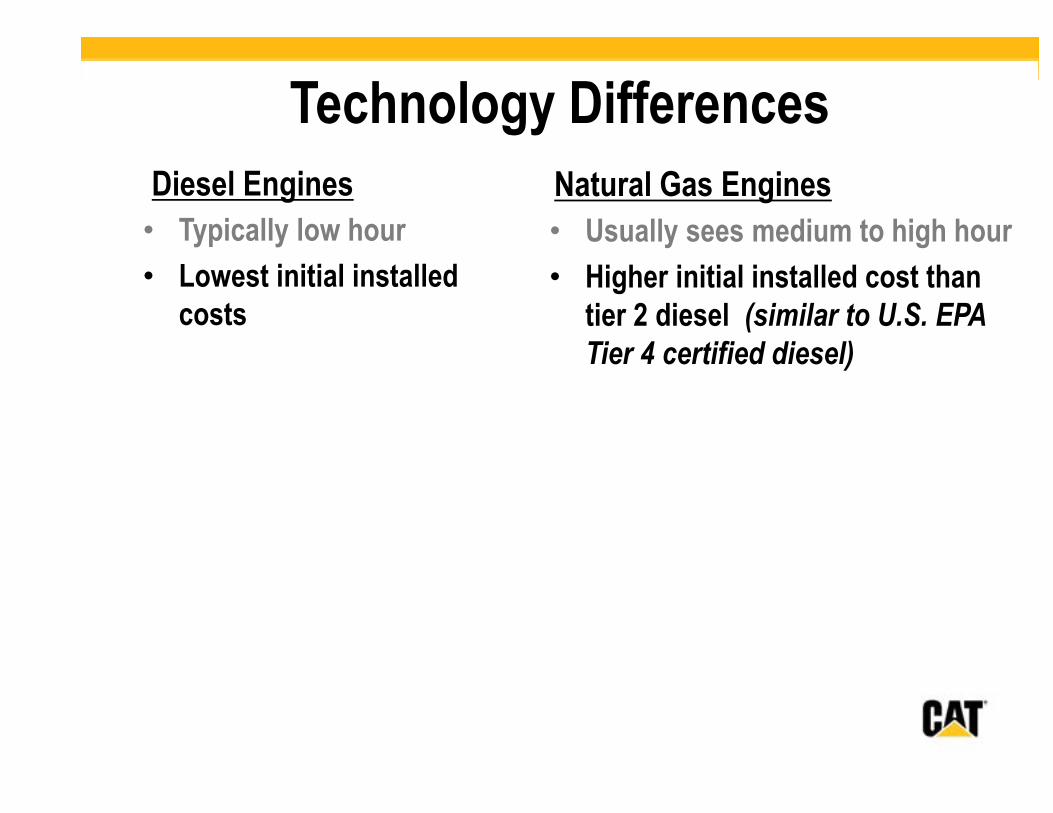
Technology Differences
Diesel Engines
• Typically low hour
• Lowest initial installed costs
Natural Gas Engines
• Usually sees medium to high hour
• Higher initial installed cost than tier 2 diesel (similar to U.S. EPA
Tier 4 certified diesel)
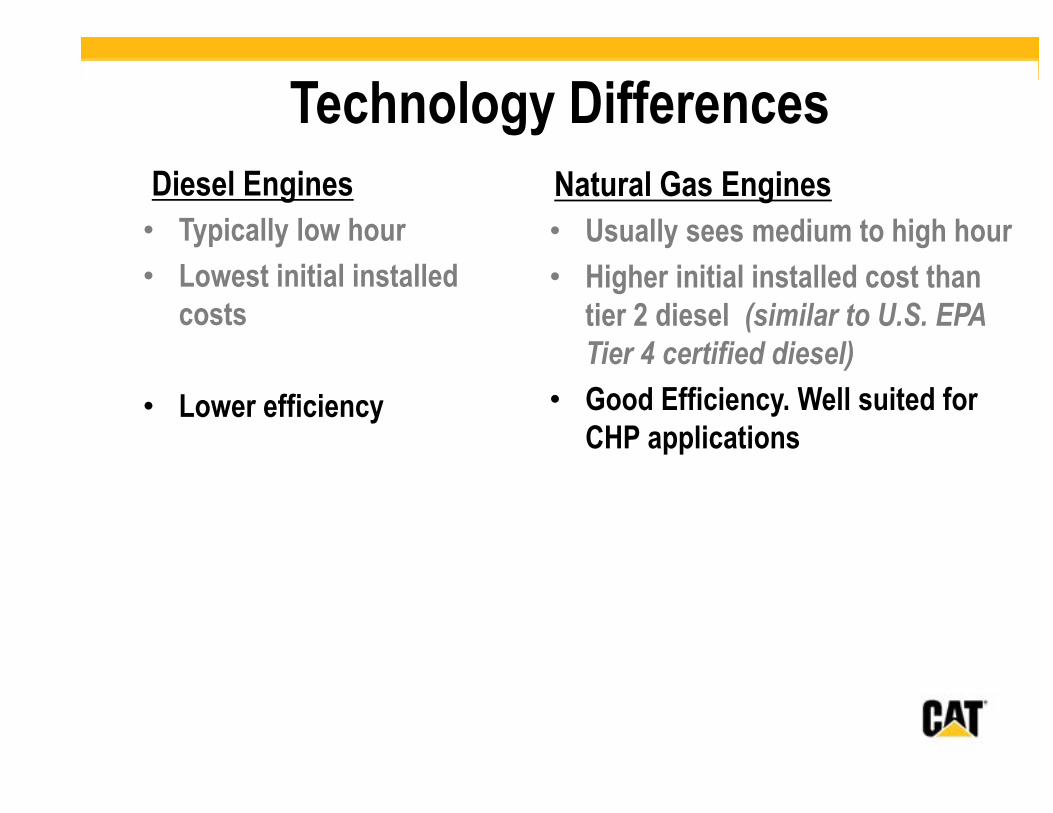
Technology Differences
Diesel Engines
• Typically low hour
• Lowest initial installed costs
• Lower efficiency
Natural Gas Engines
• Usually sees medium to high hour
• Higher initial installed cost than tier 2 diesel (similar to U.S. EPA
Tier 4 certified diesel)
• Good Efficiency. Well suited for CHP applications
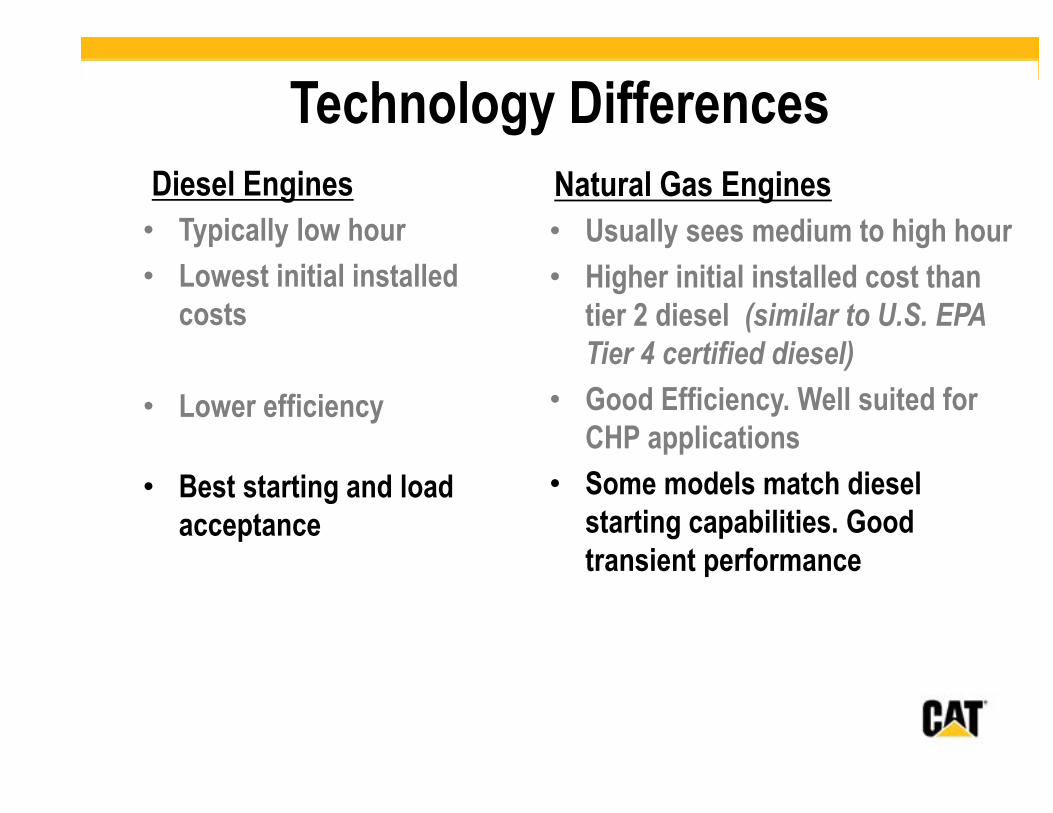
Technology Differences
Diesel Engines
• Typically low hour
• Lowest initial installed costs
• Lower efficiency
• Best starting and load acceptance
Natural Gas Engines
• Usually sees medium to high hour
• Higher initial installed cost than tier 2 diesel (similar to U.S. EPA
Tier 4 certified diesel)
• Good Efficiency. Well suited for CHP applications
• Some models match diesel starting capabilities. Good transient performance
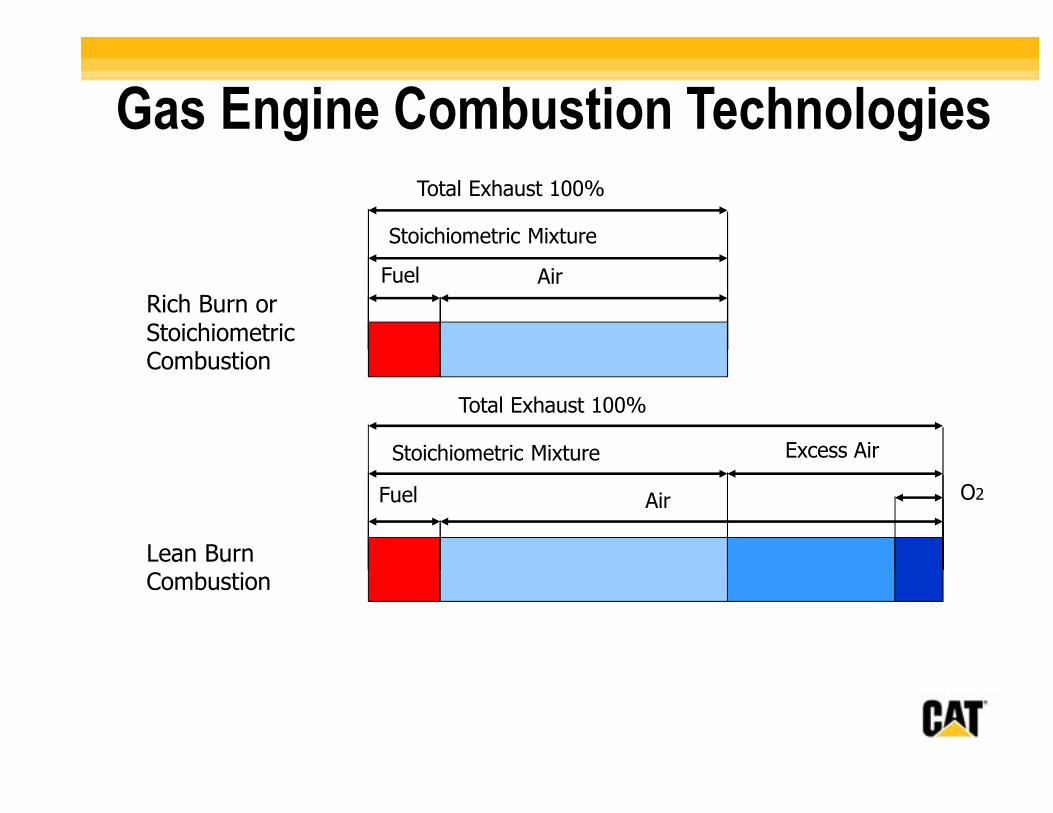
Gas Engine Combustion Technologies
Rich Burn or
Stoichiometric
Combustion
Total Exhaust 100%
Stoichiometric Mixture
AirFuel
O2
Lean Burn
Combustion
Fuel
Stoichiometric Mixture Excess Air
Total Exhaust 100%
Air
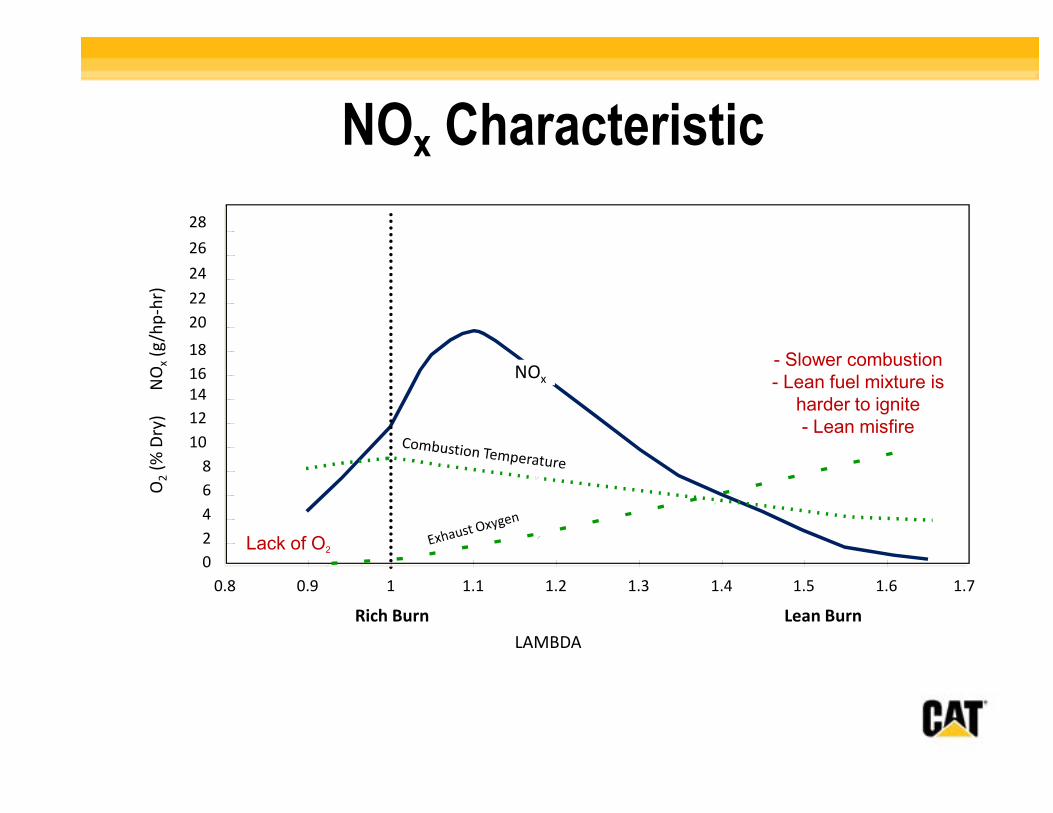
NOx Characteristic
NOx
Lack of O2
- Slower combustion
- Lean fuel mixture is
harder to ignite
- Lean misfire
0
2
4
6
8
10
12
14
16
18
20
22
O2
(% D
ry)
N
Ox
(g/h
p-h
r)
24
26
28
Rich Burn
LAMBDA
Lean Burn
0.8 0.9 1 1.1 1.2 1.3 1.4 1.5 1.6 1.7
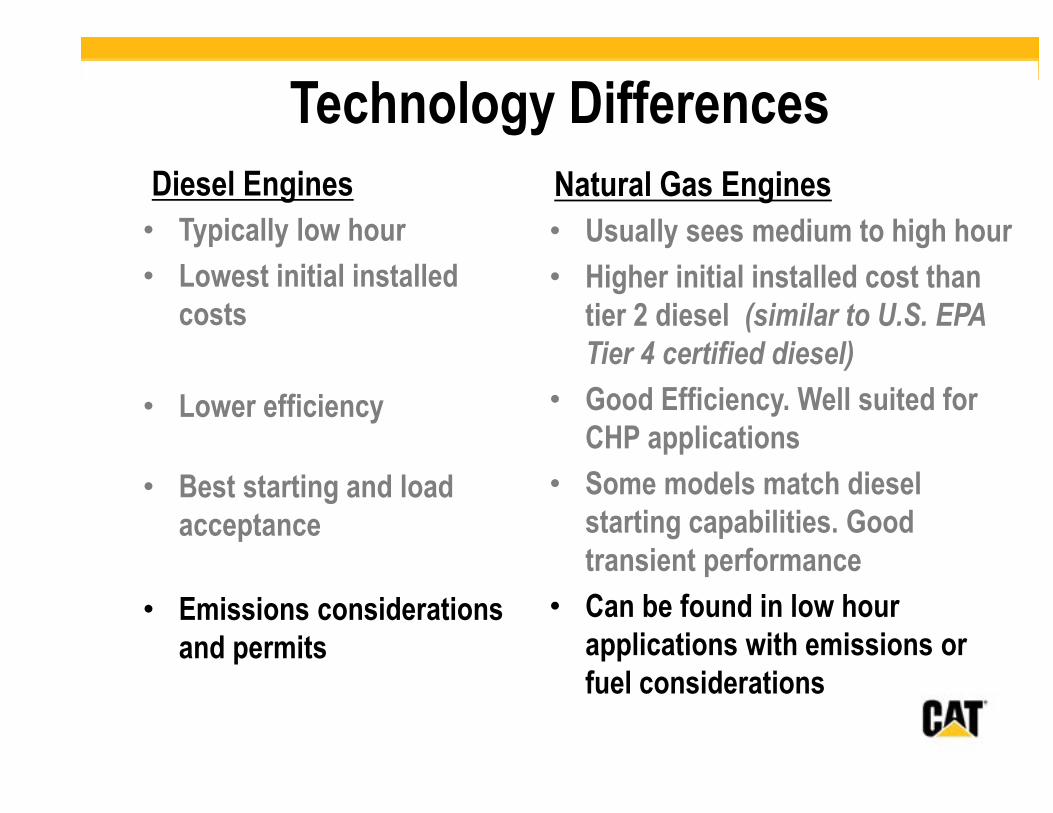
Technology Differences
Diesel Engines
• Typically low hour
• Lowest initial installed costs
• Lower efficiency
• Best starting and load acceptance
• Emissions considerations and permits
Natural Gas Engines
• Usually sees medium to high hour
• Higher initial installed cost than tier 2 diesel (similar to U.S. EPA
Tier 4 certified diesel)
• Good Efficiency. Well suited for CHP applications
• Some models match diesel starting capabilities. Good transient performance
• Can be found in low hour applications with emissions or fuel considerations
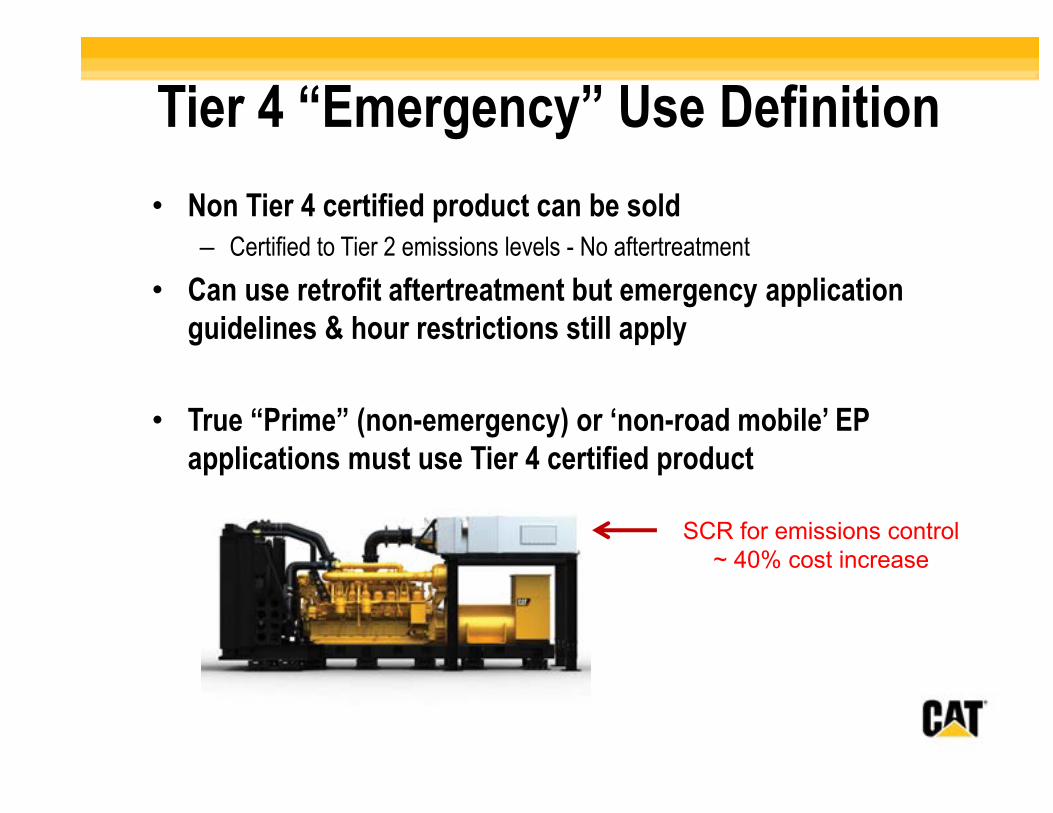
Tier 4 “Emergency” Use Definition
• Non Tier 4 certified product can be sold
– Certified to Tier 2 emissions levels - No aftertreatment
• Can use retrofit aftertreatment but emergency application guidelines & hour restrictions still apply
• True “Prime” (non-emergency) or ‘non-road mobile’ EP applications must use Tier 4 certified product
SCR for emissions control
~ 40% cost increase
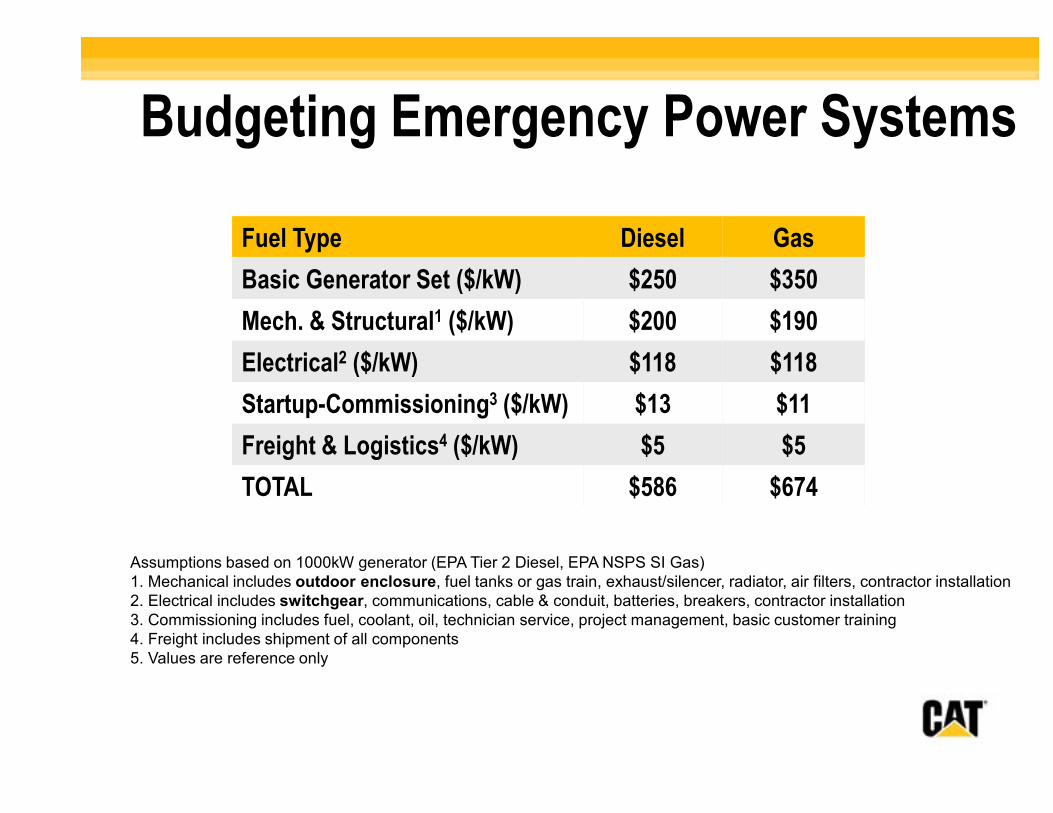
Budgeting Emergency Power Systems
Fuel Type Diesel Gas
Basic Generator Set ($/kW) $250 $350
Mech. & Structural1 ($/kW) $200 $190
Electrical2 ($/kW) $118 $118
Startup-Commissioning3 ($/kW) $13 $11
Freight & Logistics4 ($/kW) $5 $5
TOTAL $586 $674
Assumptions based on 1000kW generator (EPA Tier 2 Diesel, EPA NSPS SI Gas)
1. Mechanical includes outdoor enclosure, fuel tanks or gas train, exhaust/silencer, radiator, air filters, contractor installation
2. Electrical includes switchgear, communications, cable & conduit, batteries, breakers, contractor installation
3. Commissioning includes fuel, coolant, oil, technician service, project management, basic customer training
4. Freight includes shipment of all components
5. Values are reference only
How Engines Accept Loads
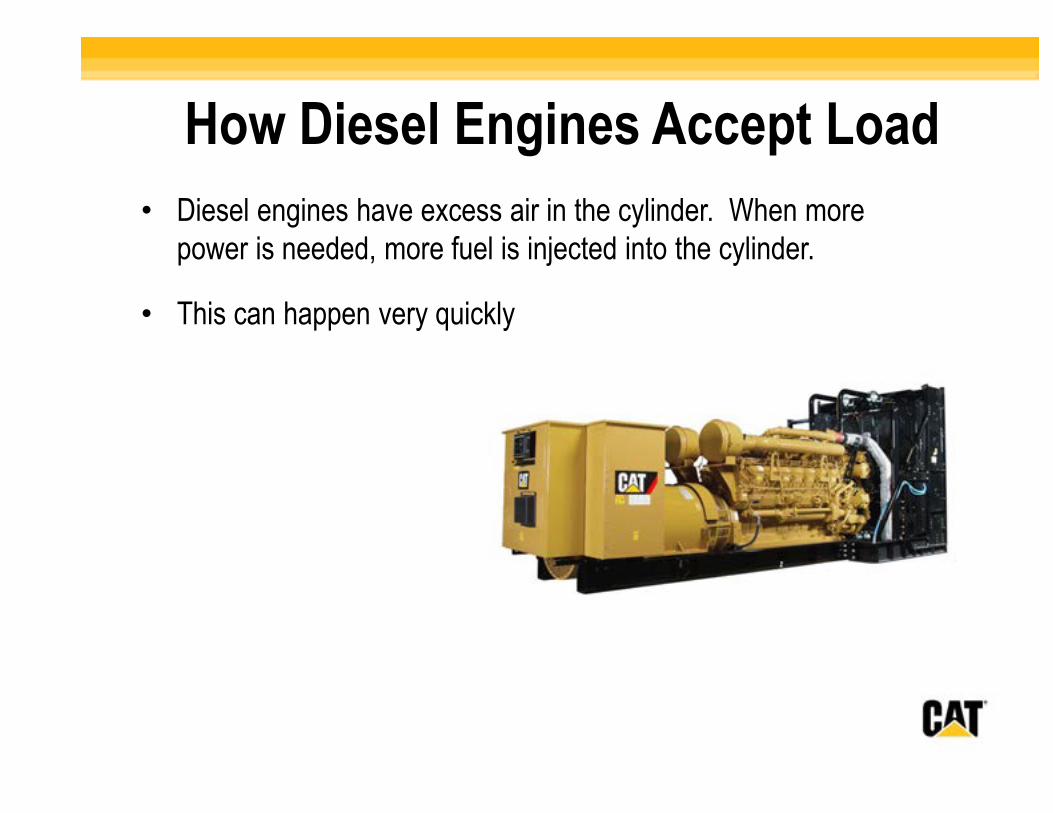
• Diesel engines have excess air in the cylinder. When more power is needed, more fuel is injected into the cylinder.
• This can happen very quickly
How Diesel Engines Accept Load
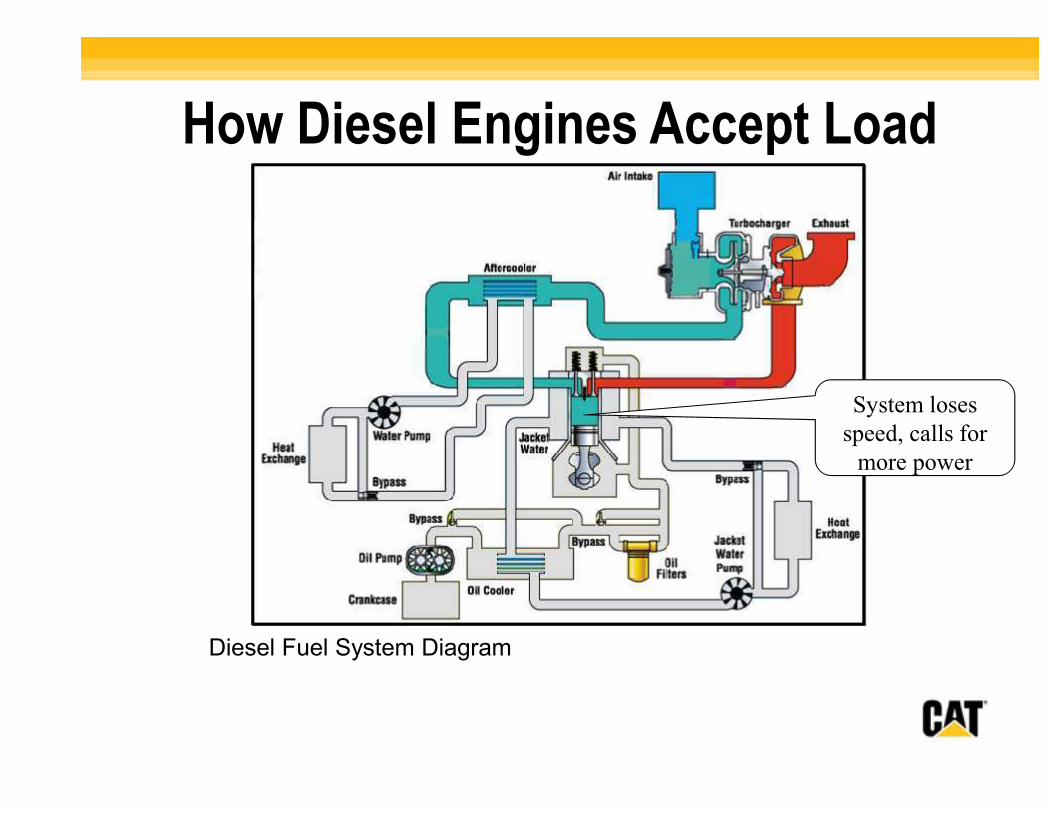
Diesel Fuel System Diagram
System loses
speed, calls for
more power
How Diesel Engines Accept Load
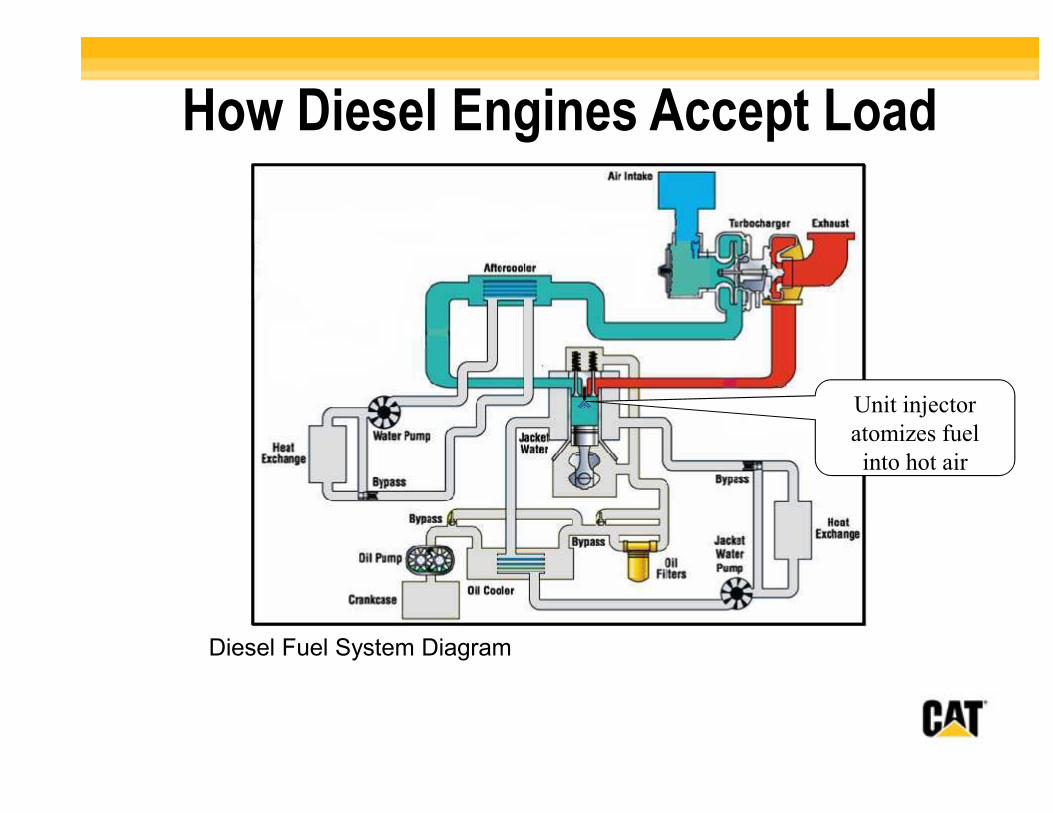
Unit injector
atomizes fuel
into hot air
Diesel Fuel System Diagram
How Diesel Engines Accept Load
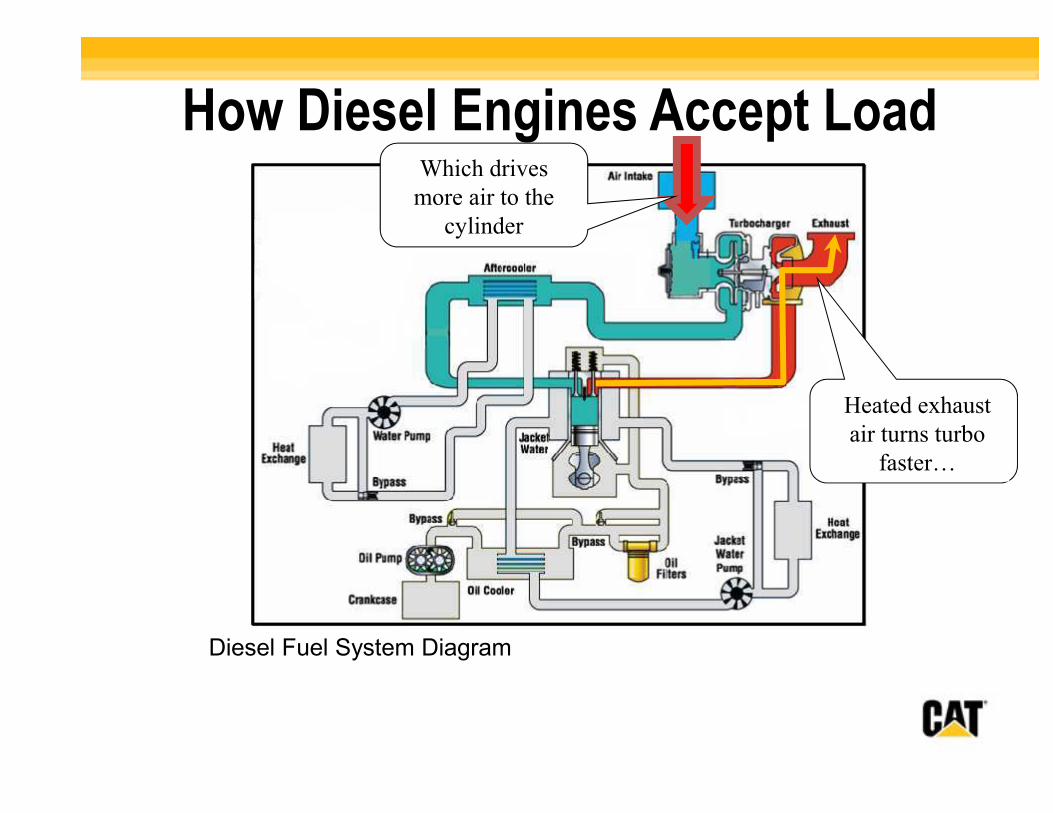
Which drives
more air to the
cylinder
Heated exhaust
air turns turbo
faster…
Diesel Fuel System Diagram
How Diesel Engines Accept Load
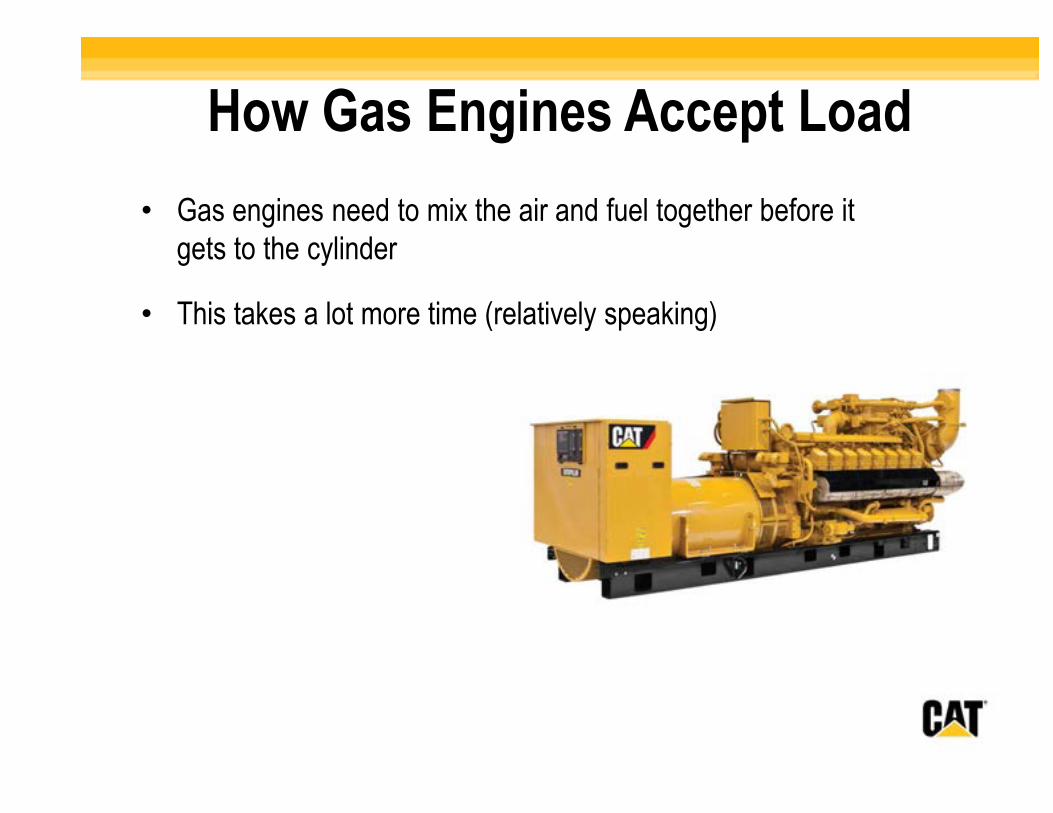
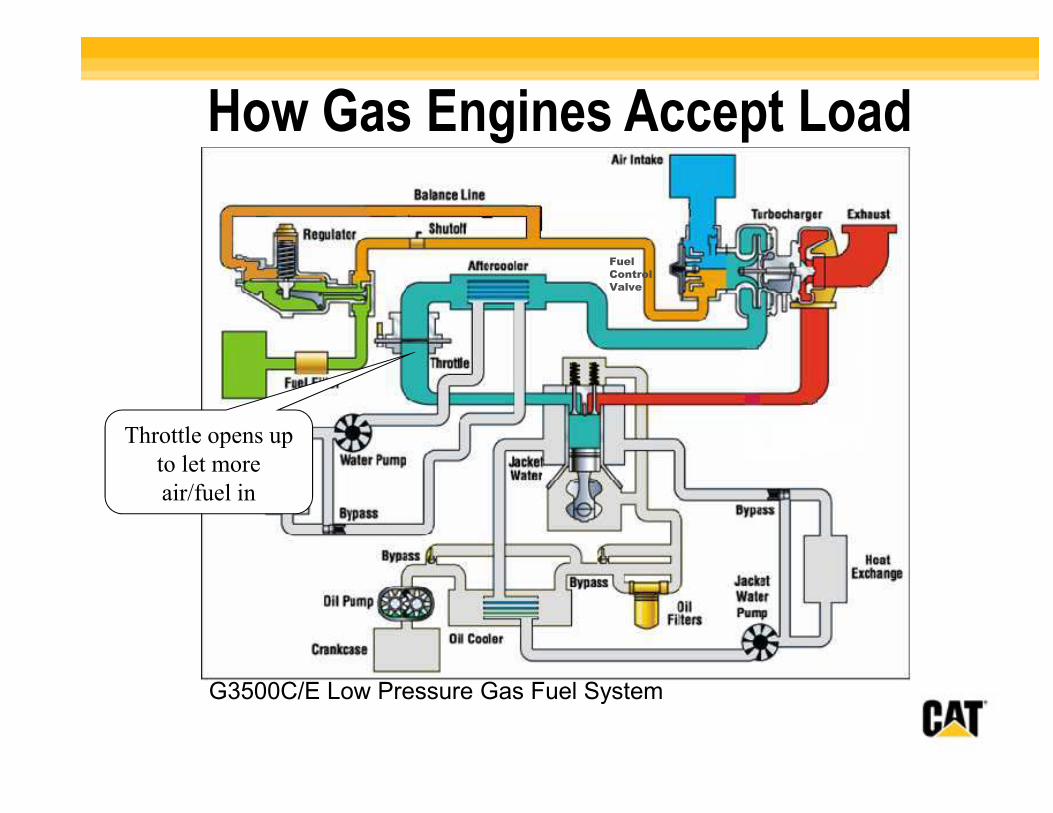
• Gas engines need to mix the air and fuel together before it gets to the cylinder
• This takes a lot more time (relatively speaking)
How Gas Engines Accept Load
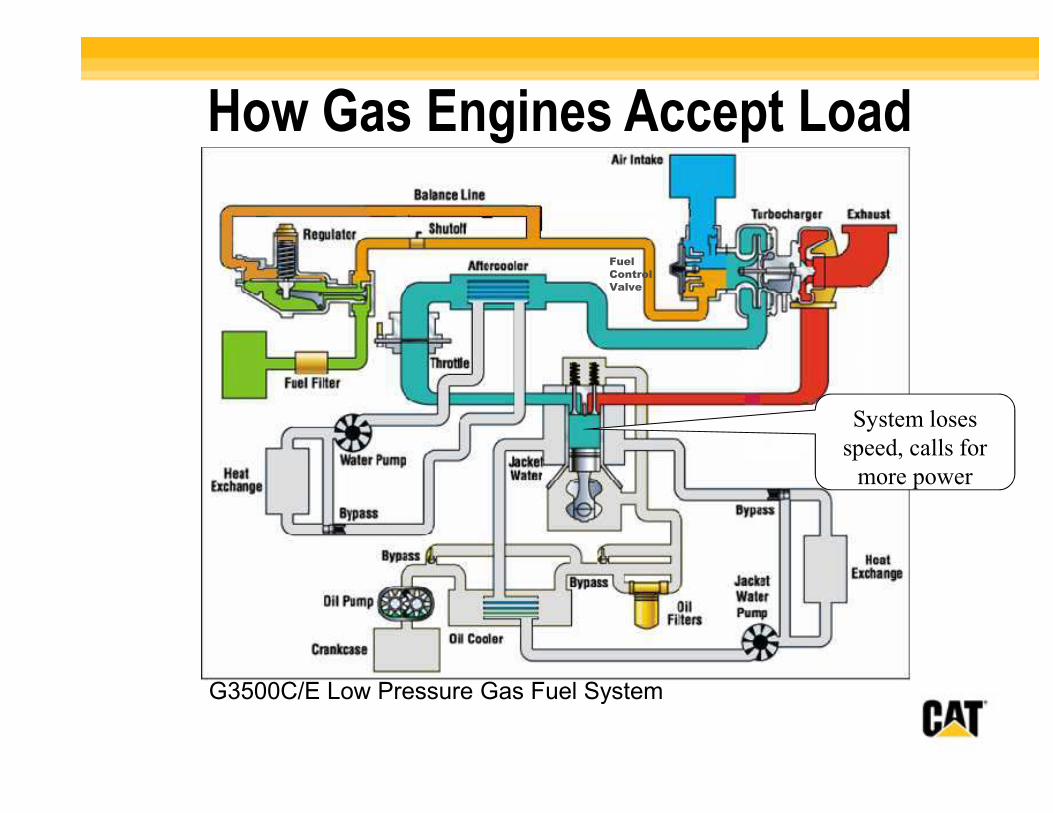
Fuel
Control
Valve
G3500C/E Low Pressure Gas Fuel System
System loses
speed, calls for
more power
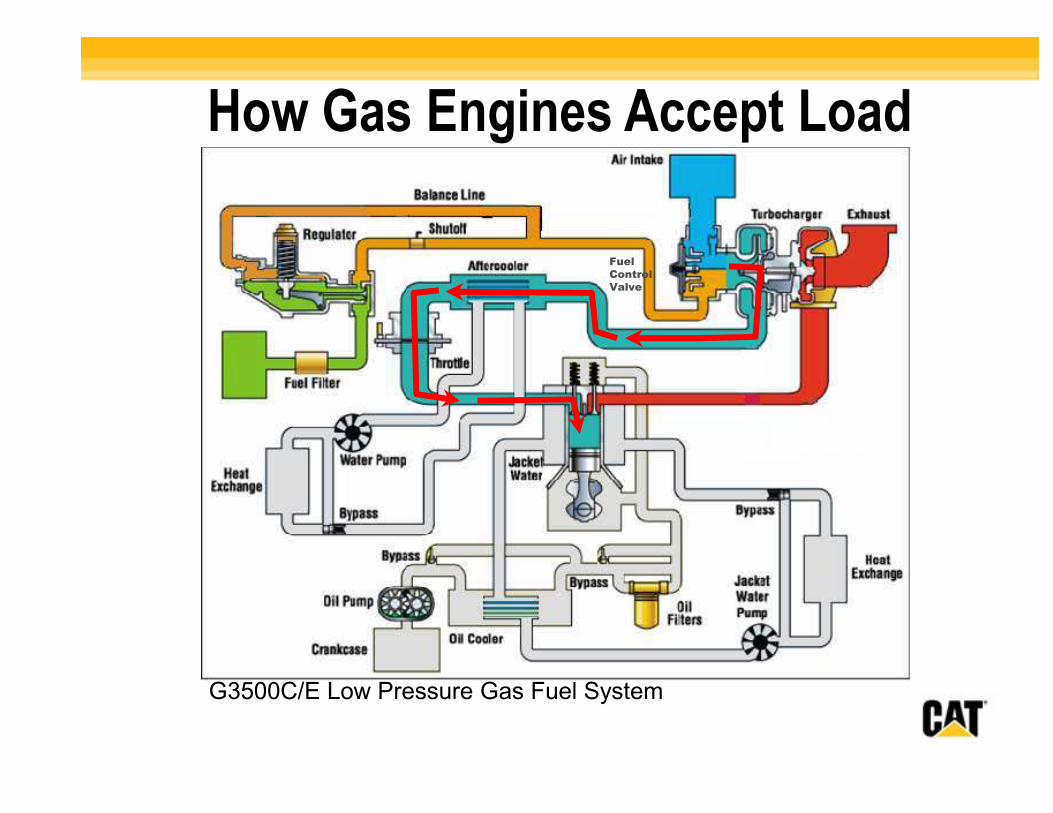
How Gas Engines Accept Load
Fuel
Control
Valve
Throttle opens up
to let more
air/fuel in
G3500C/E Low Pressure Gas Fuel System
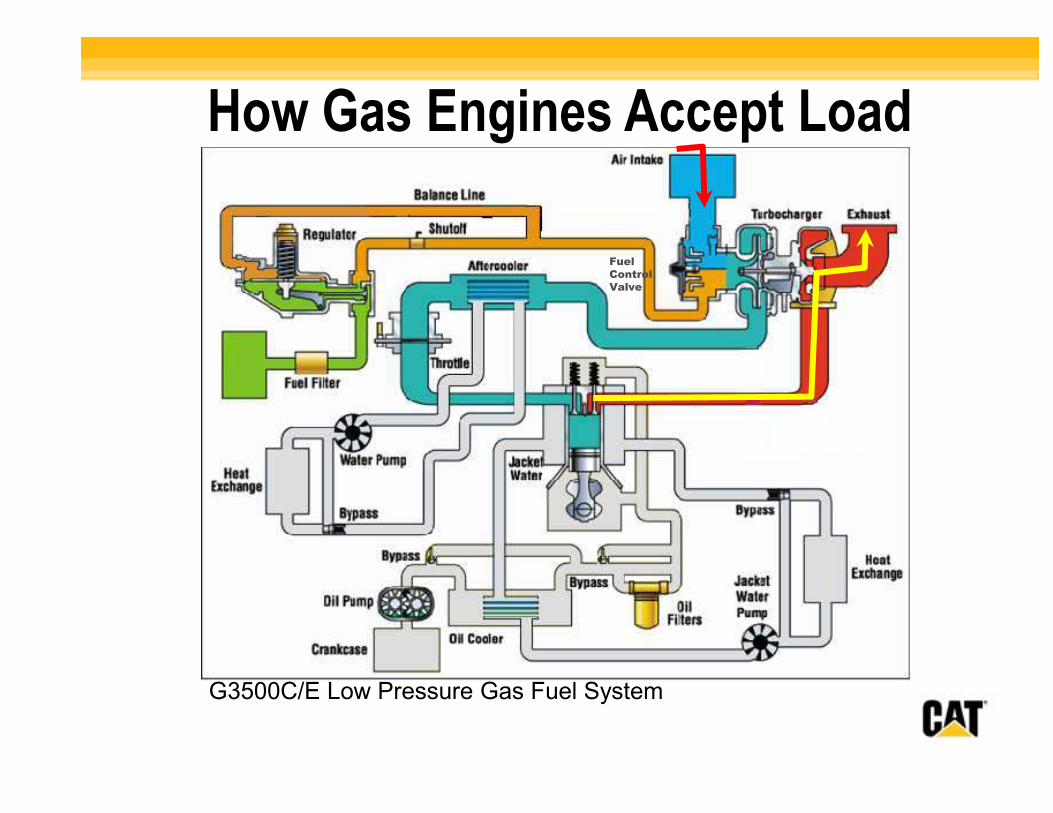
How Gas Engines Accept Load
Fuel
Control
Valve
G3500C/E Low Pressure Gas Fuel System
How Gas Engines Accept Load
Fuel
Control
Valve
G3500C/E Low Pressure Gas Fuel System
How Gas Engines Accept Load
Comparing Diesel and Gas Ratings
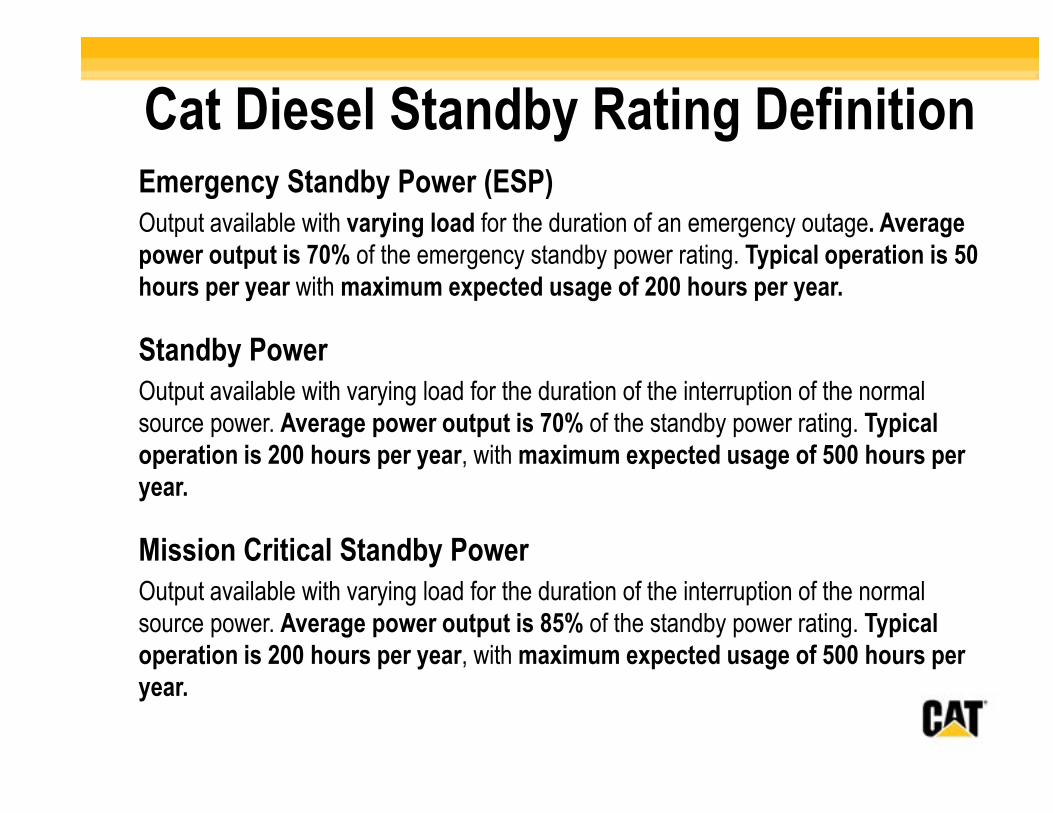
Cat Diesel Standby Rating DefinitionEmergency Standby Power (ESP)
Output available with varying load for the duration of an emergency outage. Average power output is 70% of the emergency standby power rating. Typical operation is 50 hours per year with maximum expected usage of 200 hours per year.
Standby Power
Output available with varying load for the duration of the interruption of the normal source power. Average power output is 70% of the standby power rating. Typical operation is 200 hours per year, with maximum expected usage of 500 hours per year.
Mission Critical Standby Power
Output available with varying load for the duration of the interruption of the normal source power. Average power output is 85% of the standby power rating. Typical operation is 200 hours per year, with maximum expected usage of 500 hours per year.
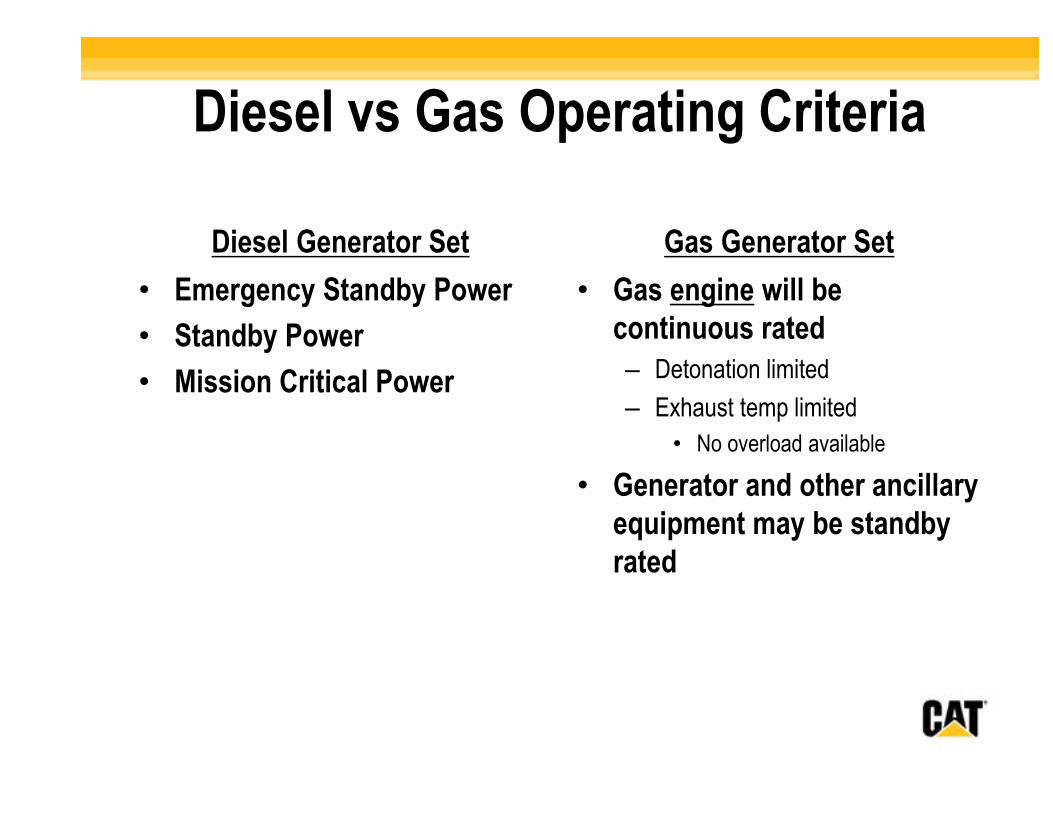
Diesel vs Gas Operating Criteria
Diesel Generator Set
• Emergency Standby Power
• Standby Power
• Mission Critical Power
Gas Generator Set
• Gas engine will be continuous rated
– Detonation limited
– Exhaust temp limited
• No overload available
• Generator and other ancillary equipment may be standby rated
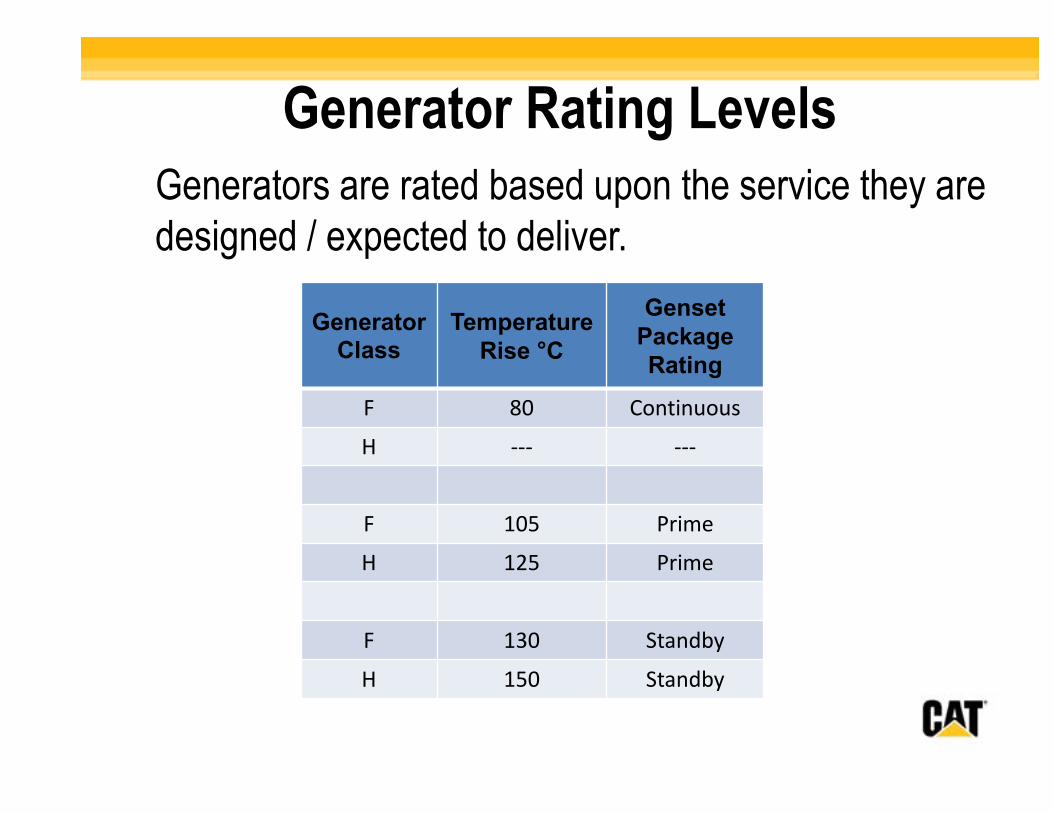
GeneratorClass
TemperatureRise °C
GensetPackageRating
F 80 Continuous
H --- ---
F 105 Prime
H 125 Prime
F 130 Standby
H 150 Standby
Generator Rating LevelsGenerators are rated based upon the service they are designed / expected to deliver.
Factors Effecting Gas Engine Loading
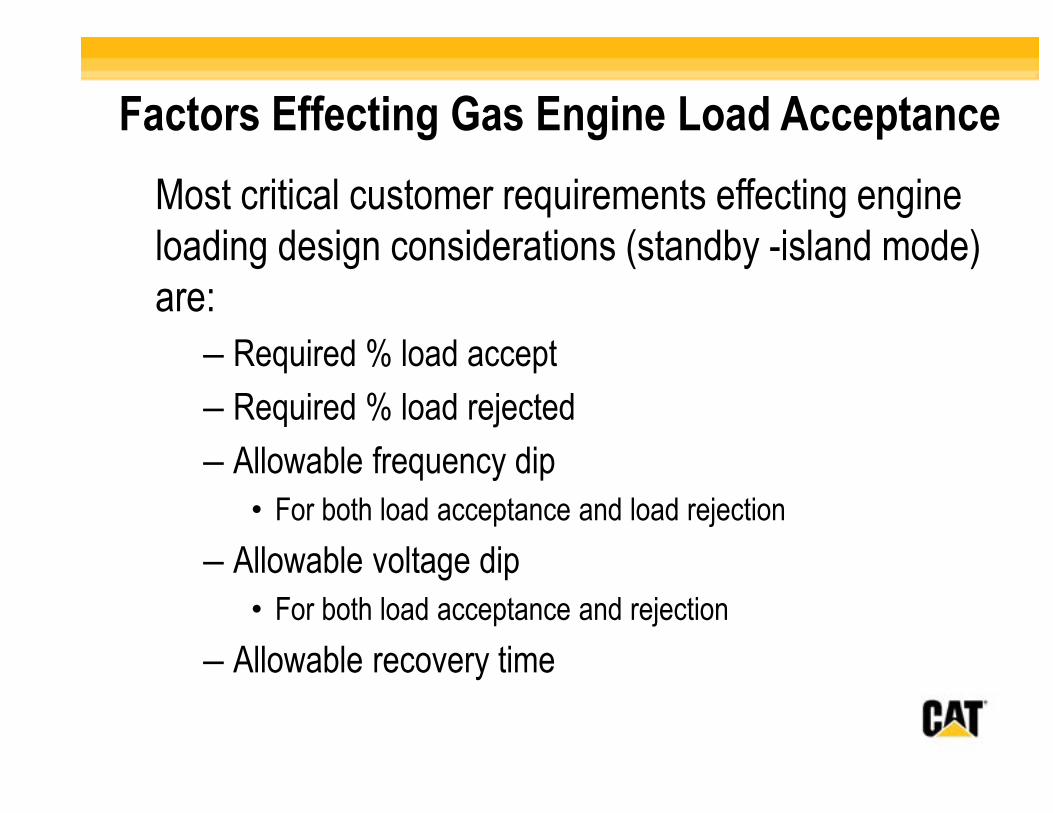
Factors Effecting Gas Engine Load Acceptance
Most critical customer requirements effecting engine loading design considerations (standby -island mode) are:
– Required % load accept
– Required % load rejected
– Allowable frequency dip
• For both load acceptance and load rejection
– Allowable voltage dip
• For both load acceptance and rejection
– Allowable recovery time
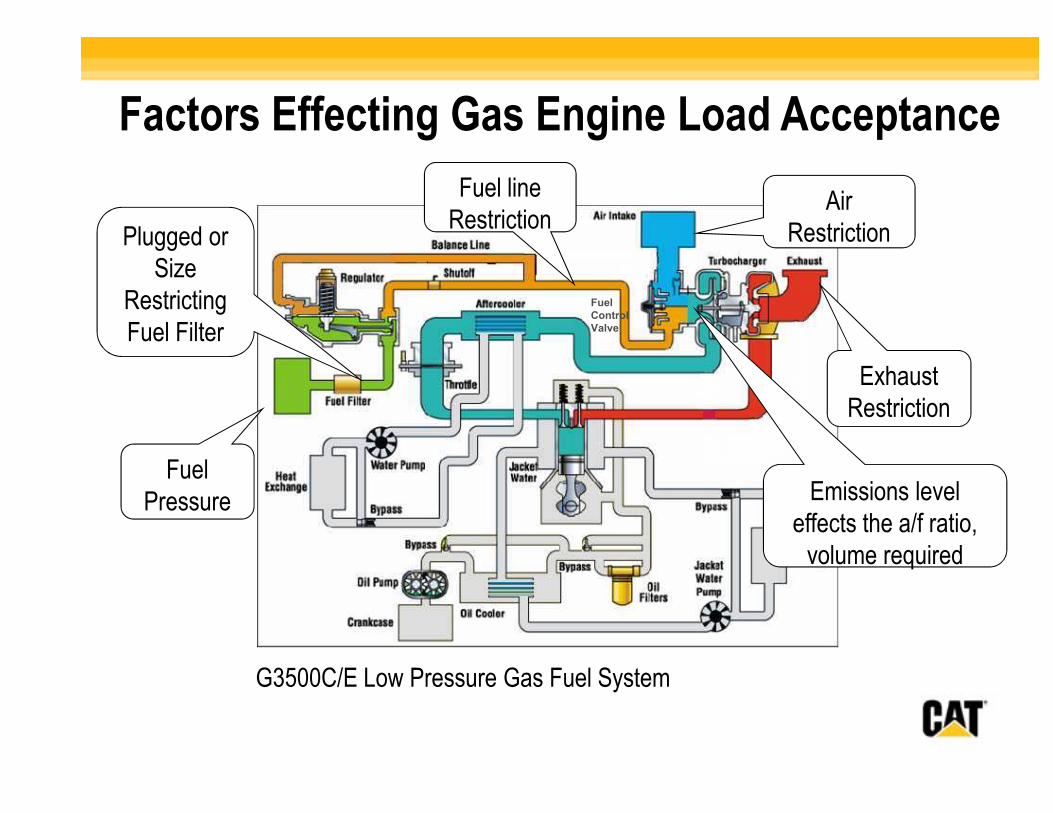
Fuel Control Valve
G3500C/E Low Pressure Gas Fuel System
Fuel Pressure
Fuel line Restriction
Exhaust Restriction
Air RestrictionPlugged or
Size Restricting Fuel Filter
Emissions level effects the a/f ratio,
volume required
Factors Effecting Gas Engine Load Acceptance
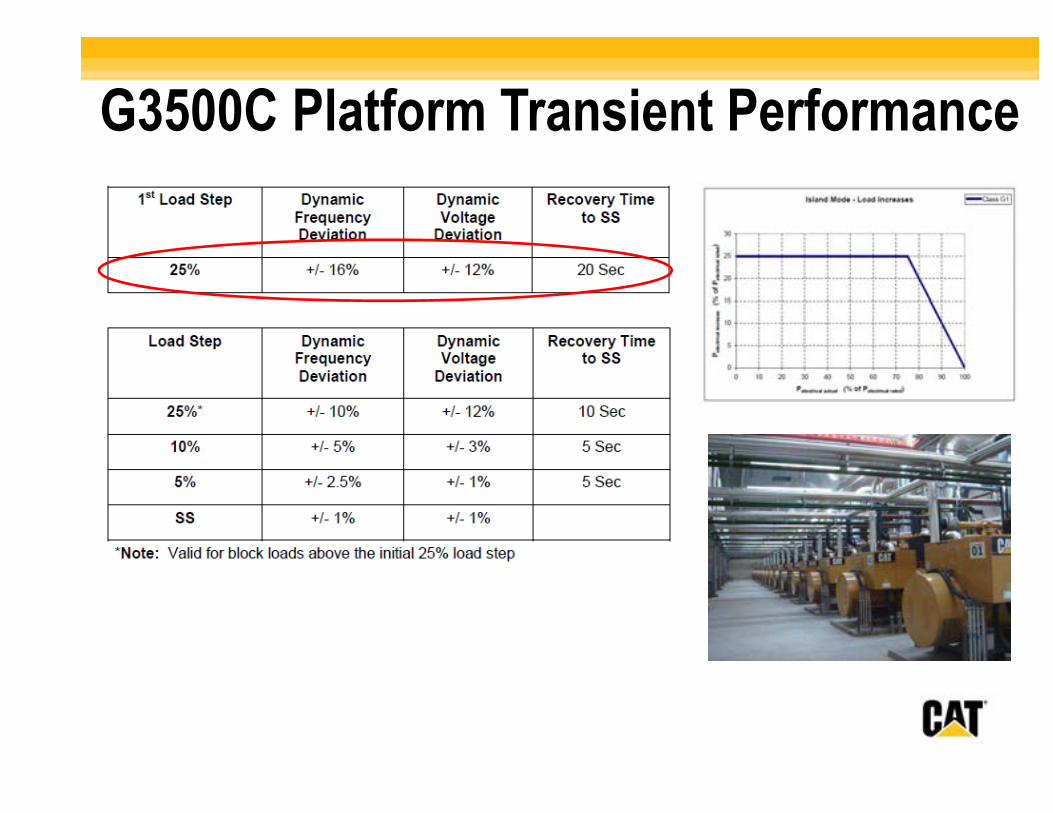
G3500C Platform Transient Performance
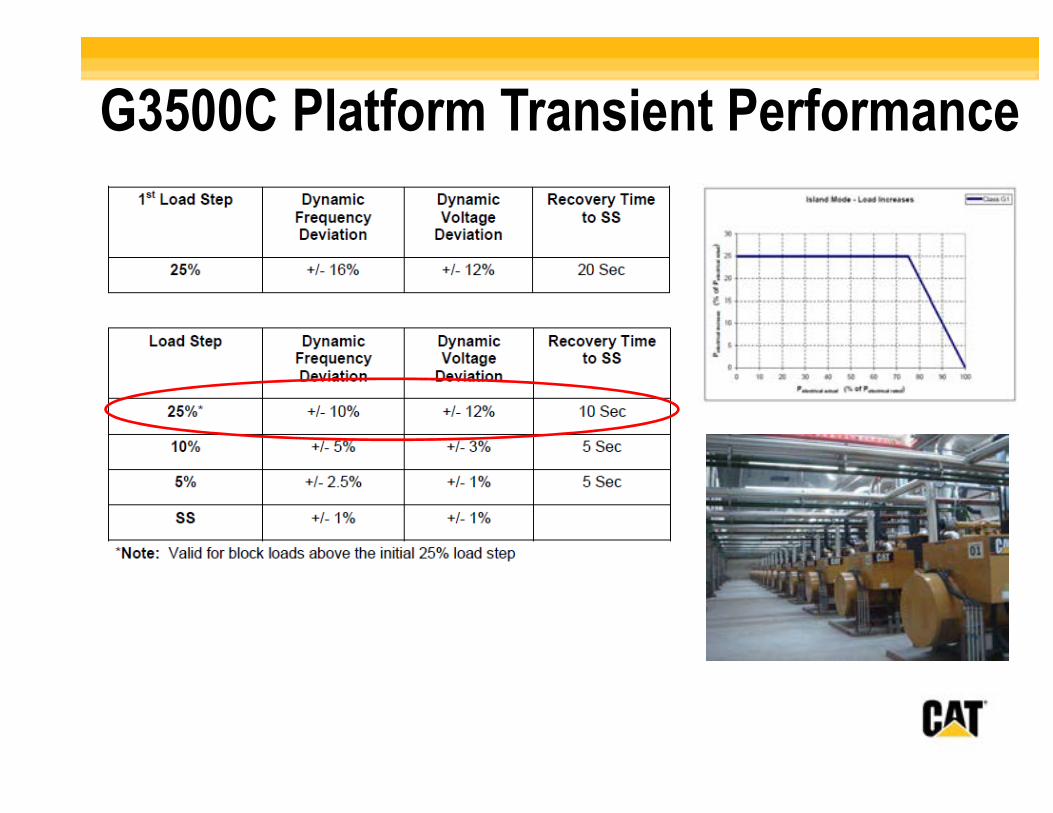
G3500C Platform Transient Performance
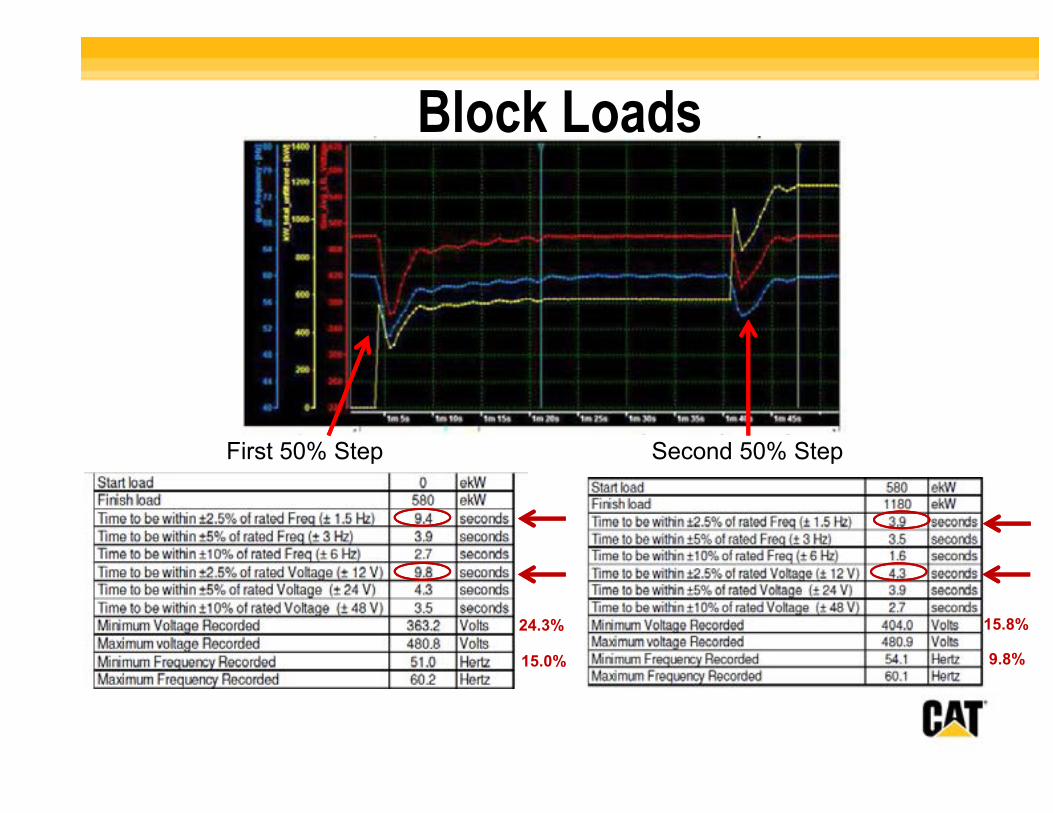
Block Loads
First 50% Step Second 50% Step
24.3%
15.0% 9.8%
15.8%
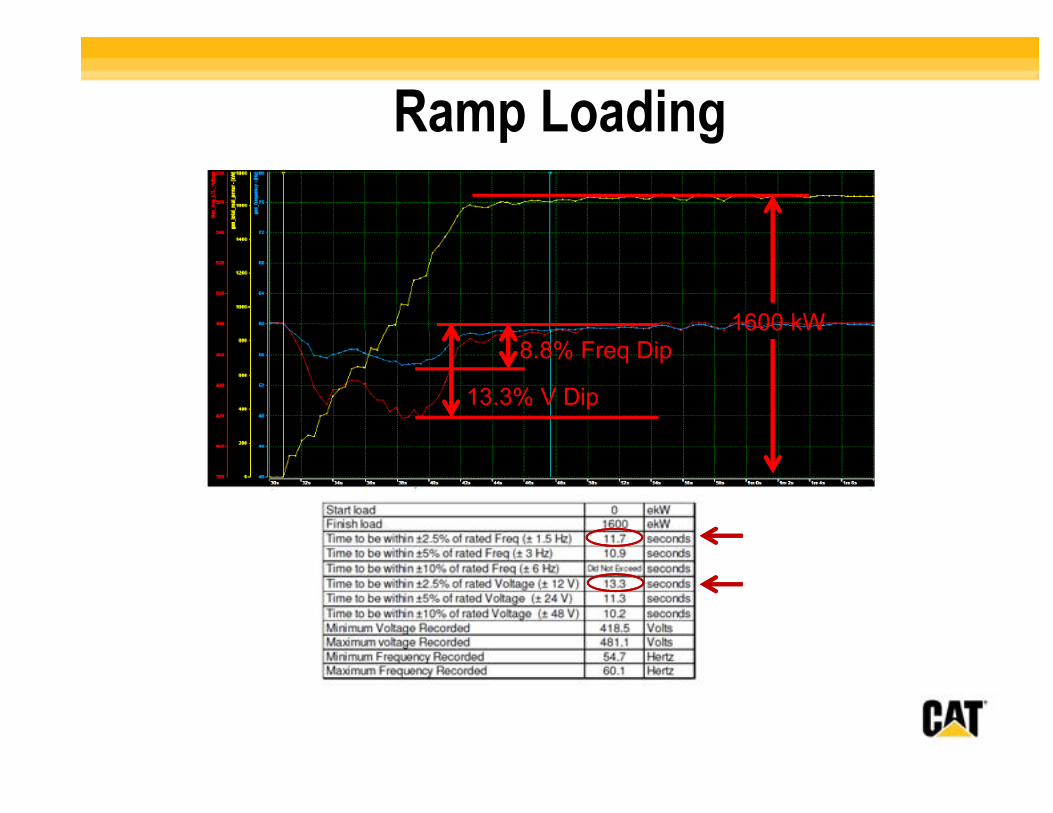
Ramp Loading
*** Add Load Curves Here ***1600 kW
13.3% V Dip
8.8% Freq Dip
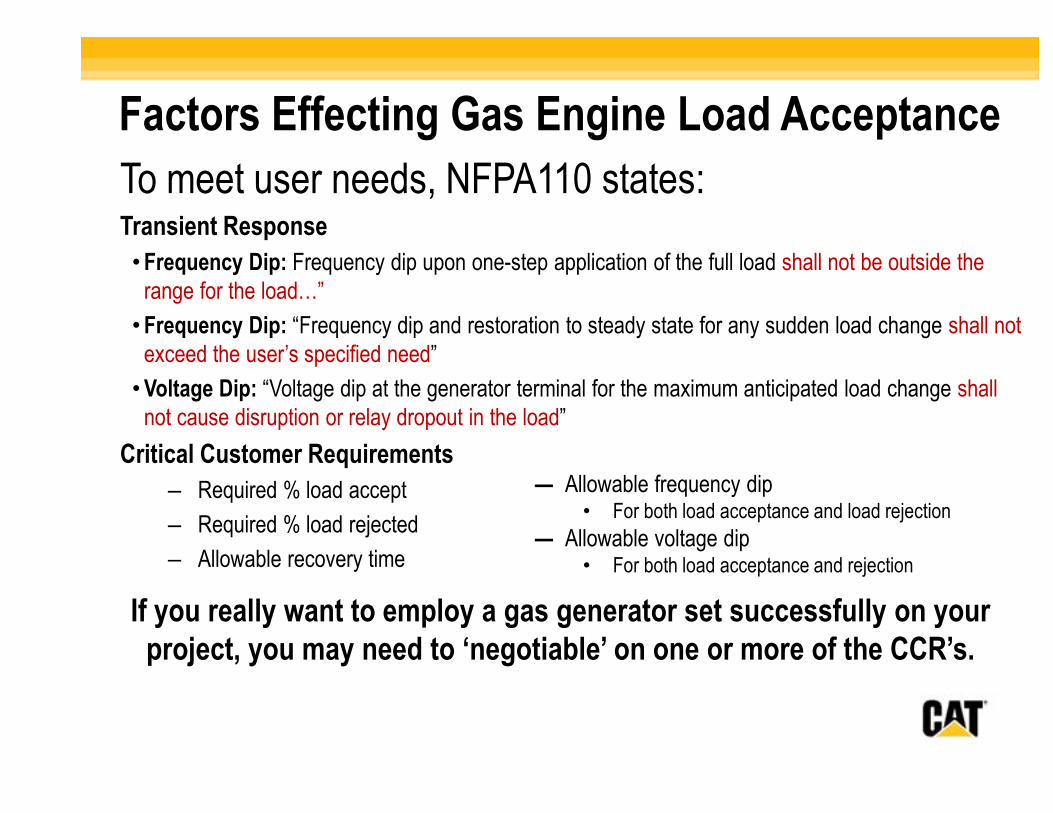
Factors Effecting Gas Engine Load Acceptance
To meet user needs, NFPA110 states:Transient Response
• Frequency Dip: Frequency dip upon one-step application of the full load shall not be outside the range for the load…”
• Frequency Dip: “Frequency dip and restoration to steady state for any sudden load change shall not exceed the user’s specified need”
• Voltage Dip: “Voltage dip at the generator terminal for the maximum anticipated load change shall not cause disruption or relay dropout in the load”
Critical Customer Requirements
– Required % load accept
– Required % load rejected
– Allowable recovery time
If you really want to employ a gas generator set successfully on your project, you may need to ‘negotiable’ on one or more of the CCR’s.
― Allowable frequency dip• For both load acceptance and load rejection
― Allowable voltage dip• For both load acceptance and rejection
Emergency Power Supply Gas Generator Sets
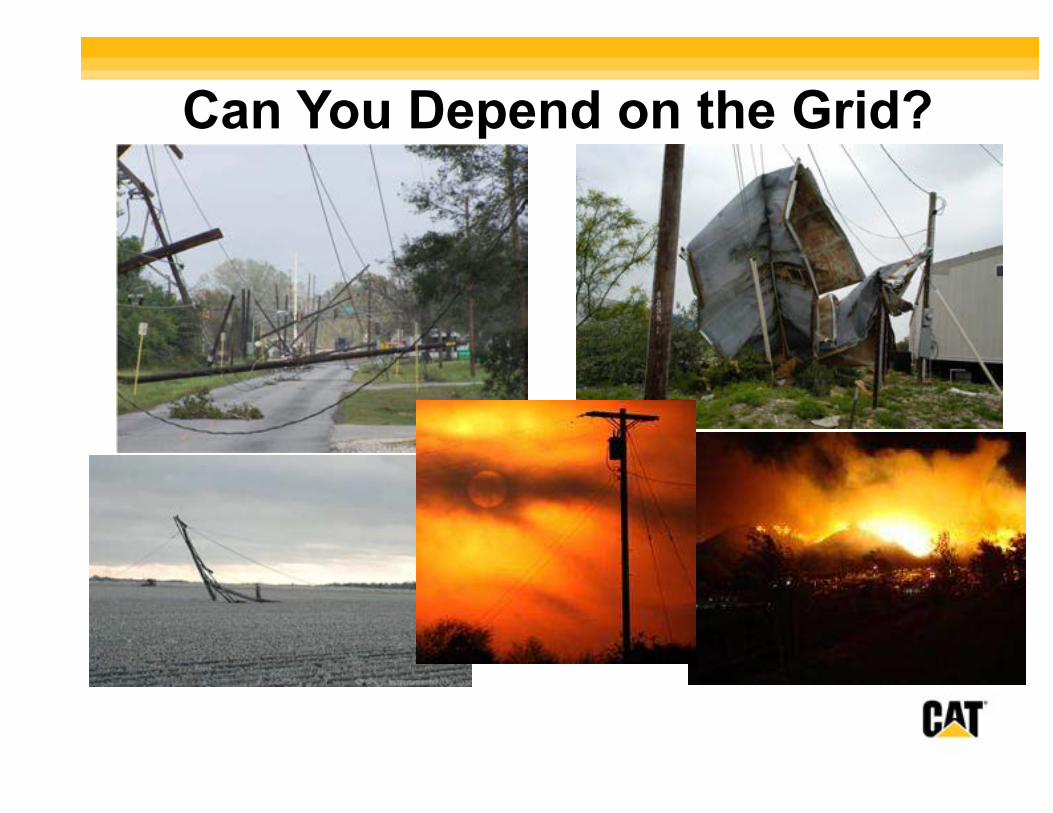
Can You Depend on the Grid?
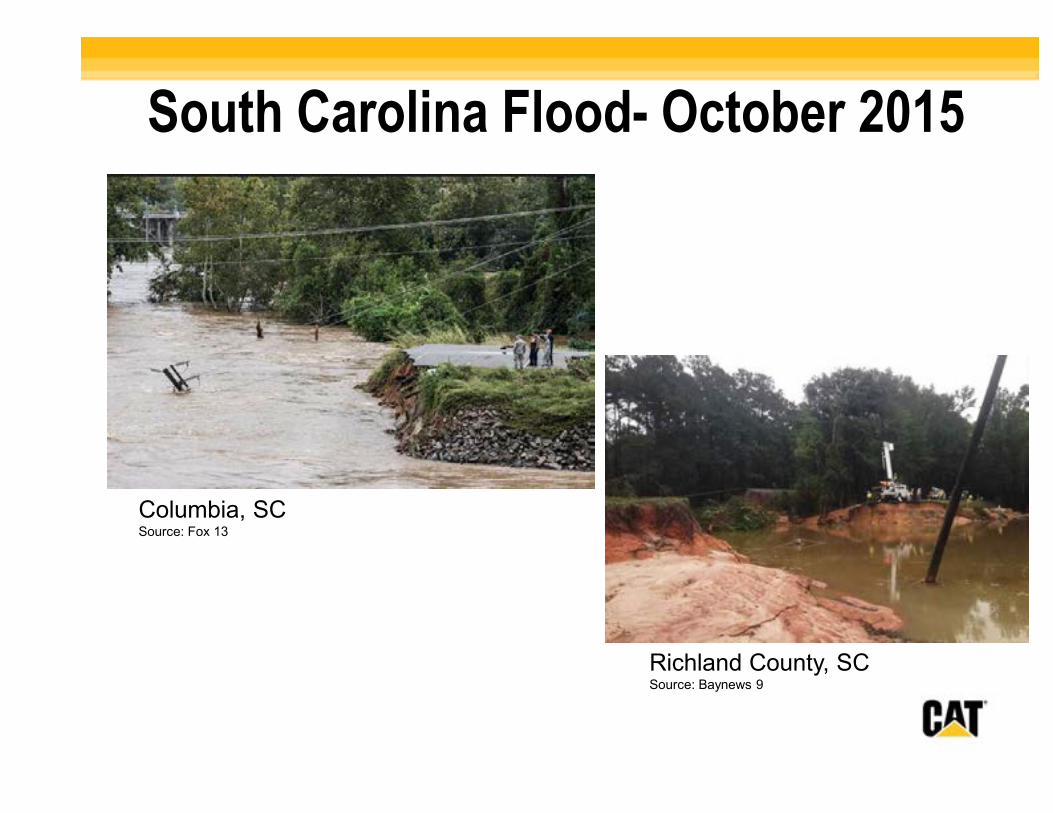
South Carolina Flood- October 2015
Richland County, SCSource: Baynews 9
Columbia, SCSource: Fox 13
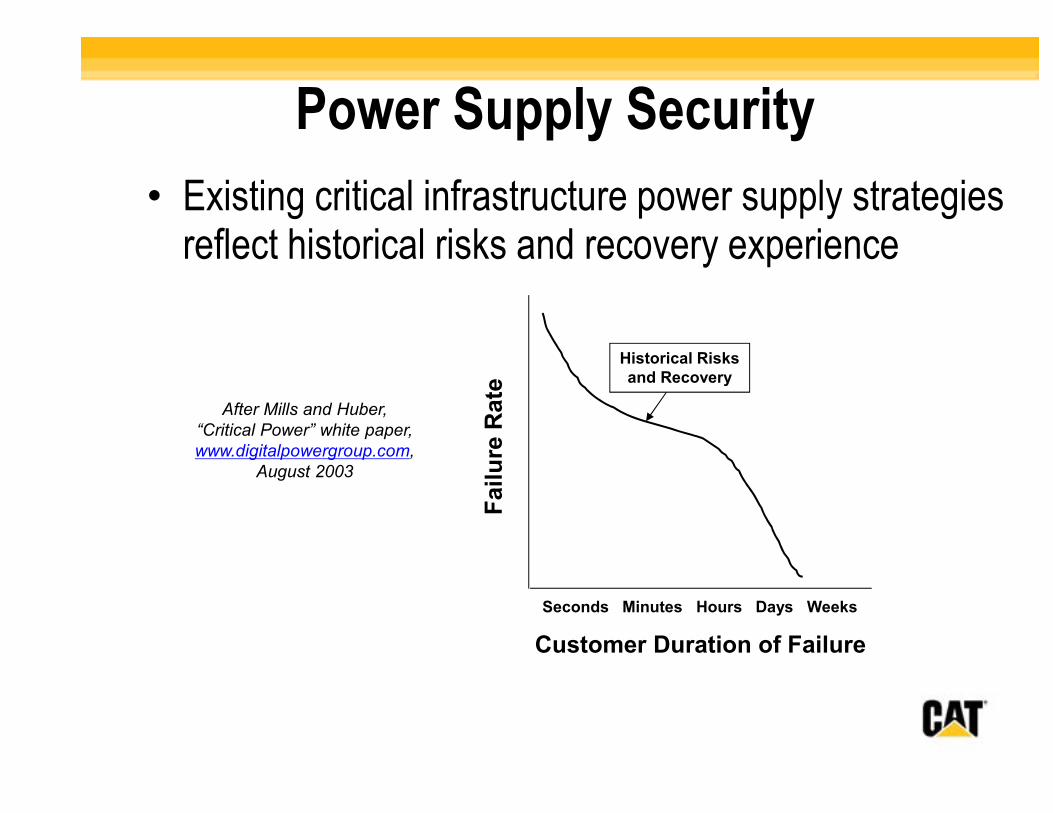
Power Supply Security
• Existing critical infrastructure power supply strategies reflect historical risks and recovery experience
Customer Duration of Failure
Fail
ure
Rate
Seconds Minutes Hours Days Weeks
Historical Risksand Recovery
After Mills and Huber,
“Critical Power” white paper,
www.digitalpowergroup.com,
August 2003
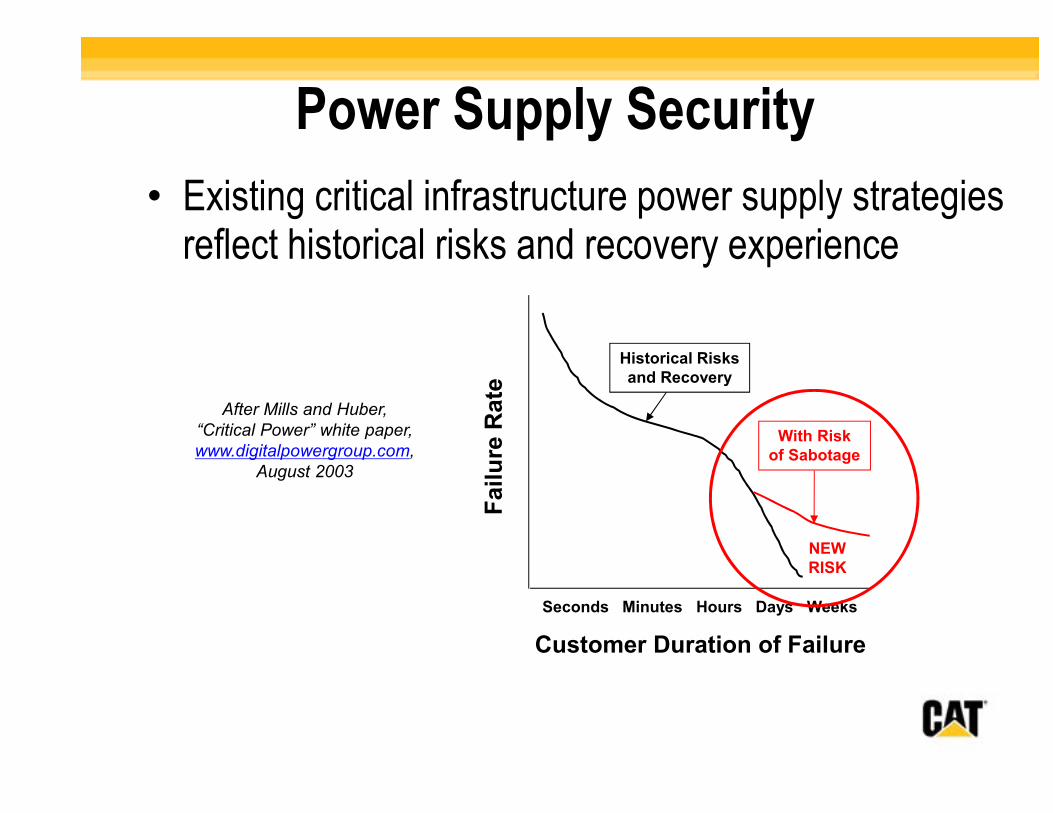
With Riskof Sabotage
NEWRISK
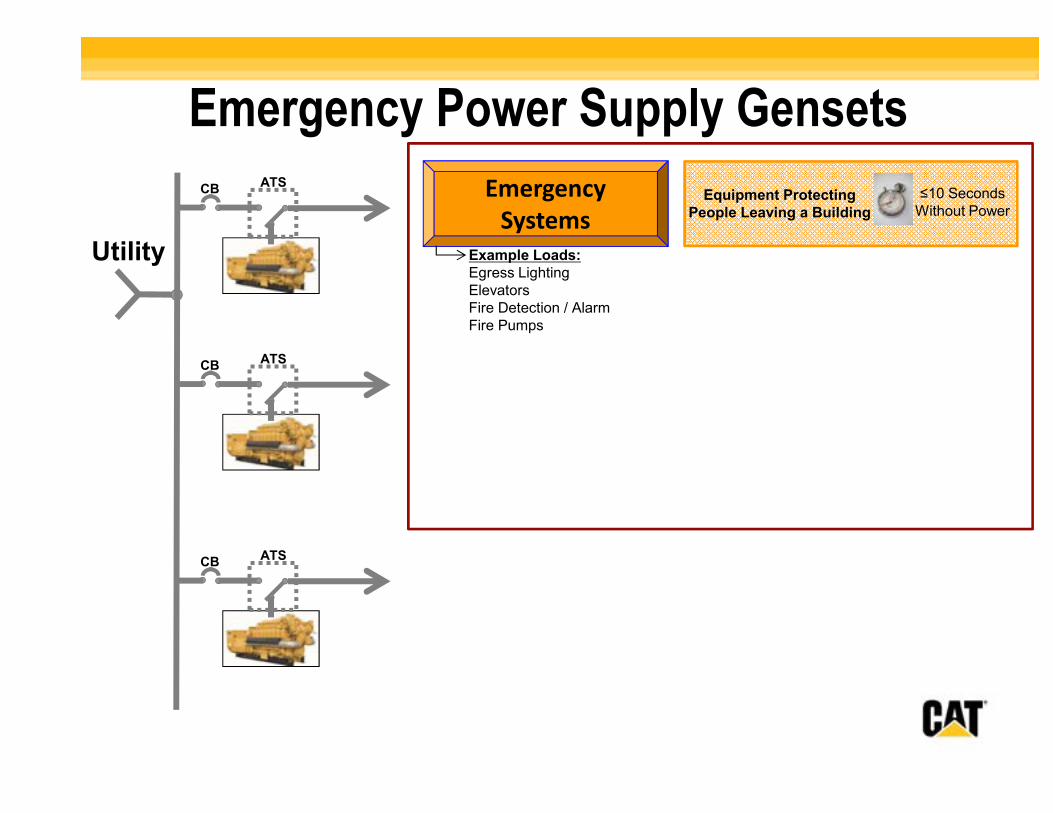
Emergency Power Supply Gensets
Emergency
Systems
Example Loads:Egress Lighting
Elevators
Fire Detection / Alarm
Fire Pumps
≤10 Seconds
Without PowerEquipment Protecting
People Leaving a Building
Utility
CBATS
CB ATS
CB ATS
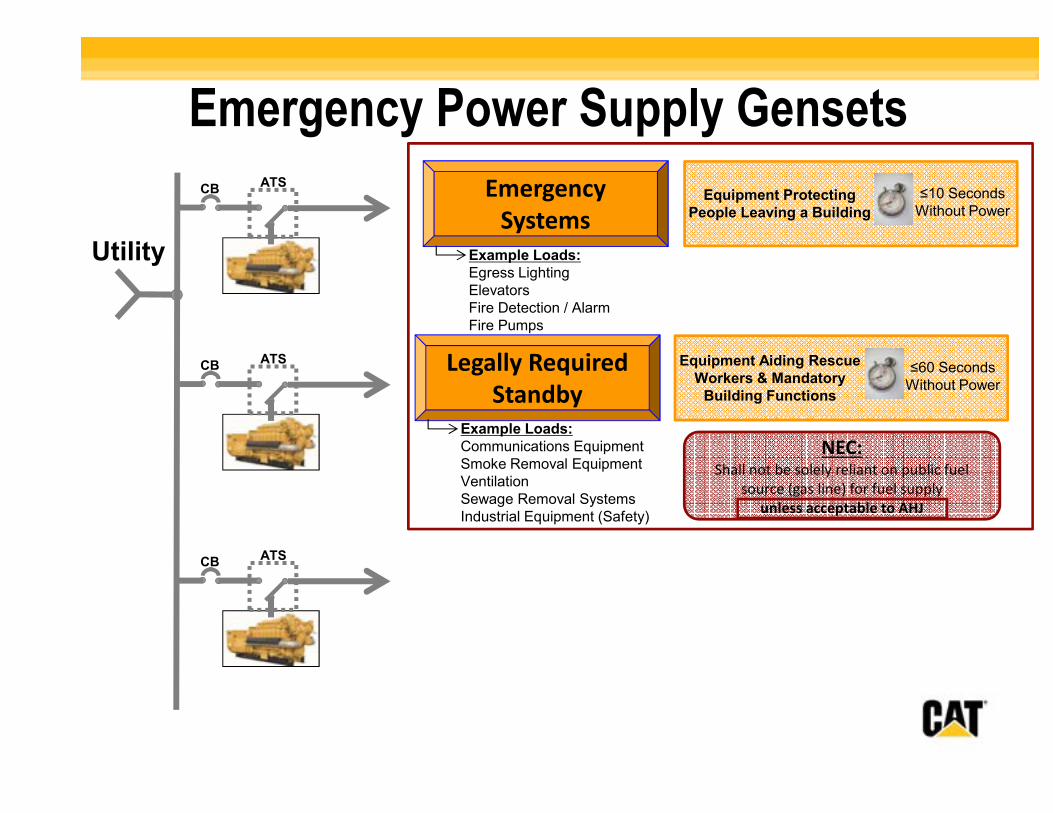
Emergency
Systems
Example Loads:Egress Lighting
Elevators
Fire Detection / Alarm
Fire Pumps
≤10 Seconds
Without PowerEquipment Protecting
People Leaving a Building
Legally Required
Standby
Example Loads:Communications Equipment
Smoke Removal Equipment
Ventilation
Sewage Removal Systems
Industrial Equipment (Safety)
≤60 Seconds
Without Power
Equipment Aiding Rescue Workers & Mandatory
Building Functions
NEC:Shall not be solely reliant on public fuel
source (gas line) for fuel supply
unless acceptable to AHJ
Emergency Power Supply Gensets
Utility
CBATS
CB ATS
CB ATS
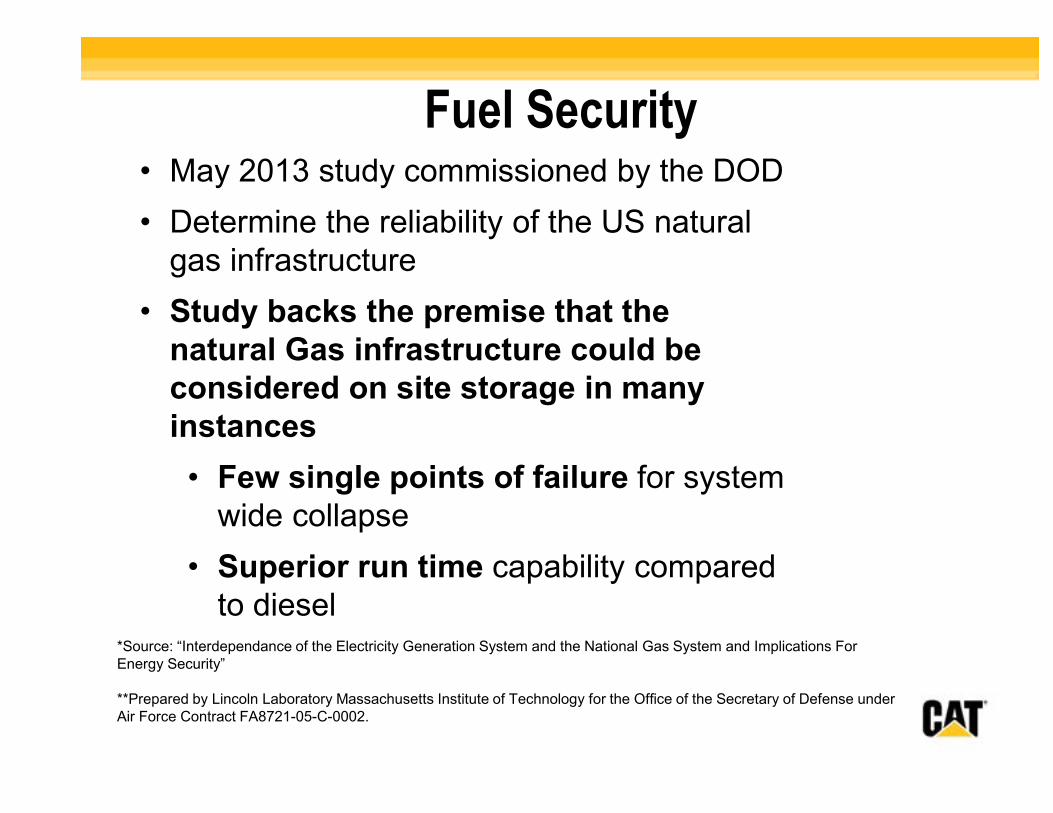
Fuel Security
*Source: “Interdependance of the Electricity Generation System and the National Gas System and Implications For
Energy Security”
**Prepared by Lincoln Laboratory Massachusetts Institute of Technology for the Office of the Secretary of Defense under
Air Force Contract FA8721-05-C-0002.
• May 2013 study commissioned by the DOD
• Determine the reliability of the US natural
gas infrastructure
• Study backs the premise that the natural Gas infrastructure could be considered on site storage in many instances
• Few single points of failure for system
wide collapse
• Superior run time capability compared
to diesel
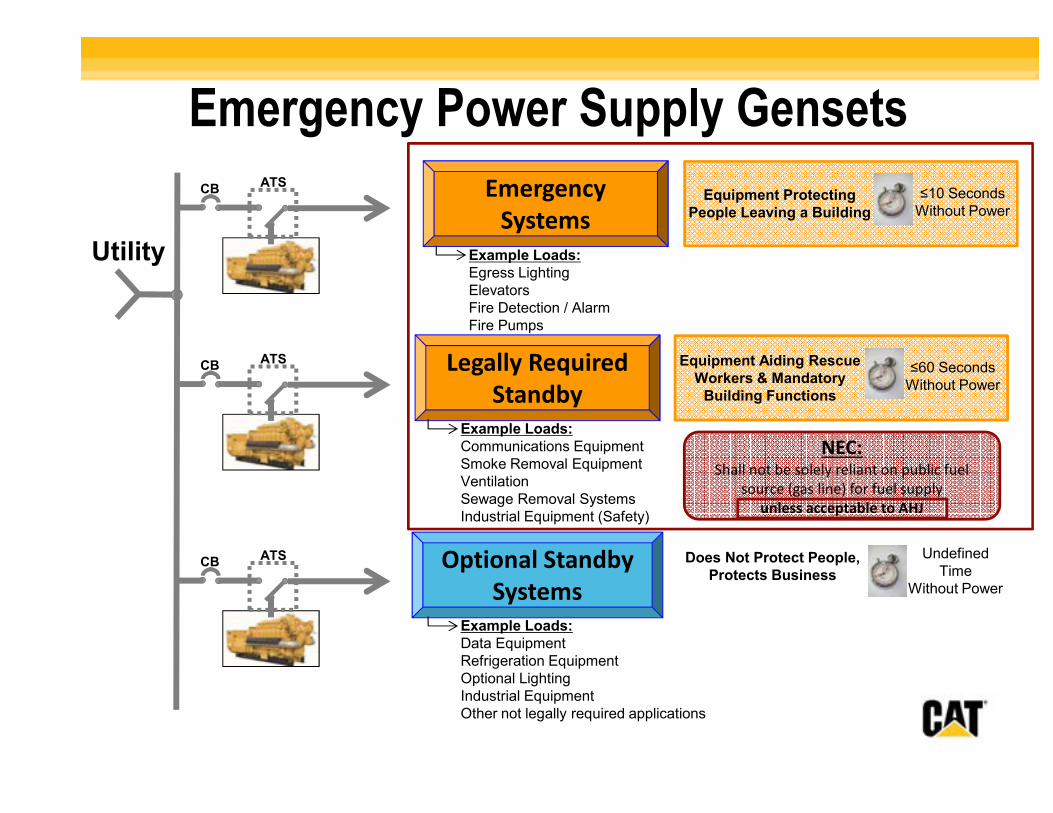
Emergency
Systems
Example Loads:Egress Lighting
Elevators
Fire Detection / Alarm
Fire Pumps
Utility
CBATS
CB ATS
CB ATS
≤10 Seconds
Without PowerEquipment Protecting
People Leaving a Building
Legally Required
Standby
Example Loads:Communications Equipment
Smoke Removal Equipment
Ventilation
Sewage Removal Systems
Industrial Equipment (Safety)
≤60 Seconds
Without Power
Equipment Aiding Rescue Workers & Mandatory
Building Functions
NEC:Shall not be solely reliant on public fuel
source (gas line) for fuel supply
unless acceptable to AHJ
Optional Standby
Systems
Example Loads:Data Equipment
Refrigeration Equipment
Optional Lighting
Industrial Equipment
Other not legally required applications
Undefined
Time
Without Power
Does Not Protect People, Protects Business
Emergency Power Supply Gensets
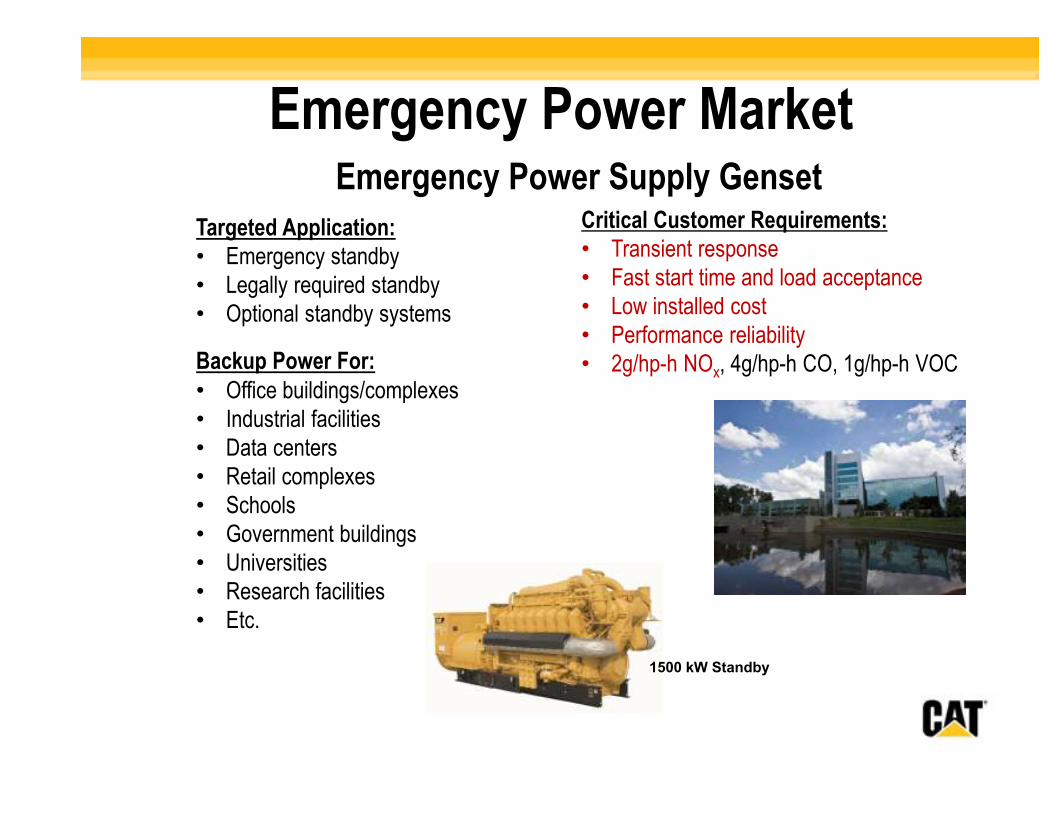
Emergency Power Supply Genset
Targeted Application:• Emergency standby• Legally required standby• Optional standby systems
Backup Power For:• Office buildings/complexes• Industrial facilities• Data centers• Retail complexes• Schools• Government buildings• Universities• Research facilities• Etc.
1500 kW Standby
Emergency Power Market
Critical Customer Requirements:• Transient response• Fast start time and load acceptance• Low installed cost• Performance reliability• 2g/hp-h NOx, 4g/hp-h CO, 1g/hp-h VOC
Why Gas Generator Sets in Standby?
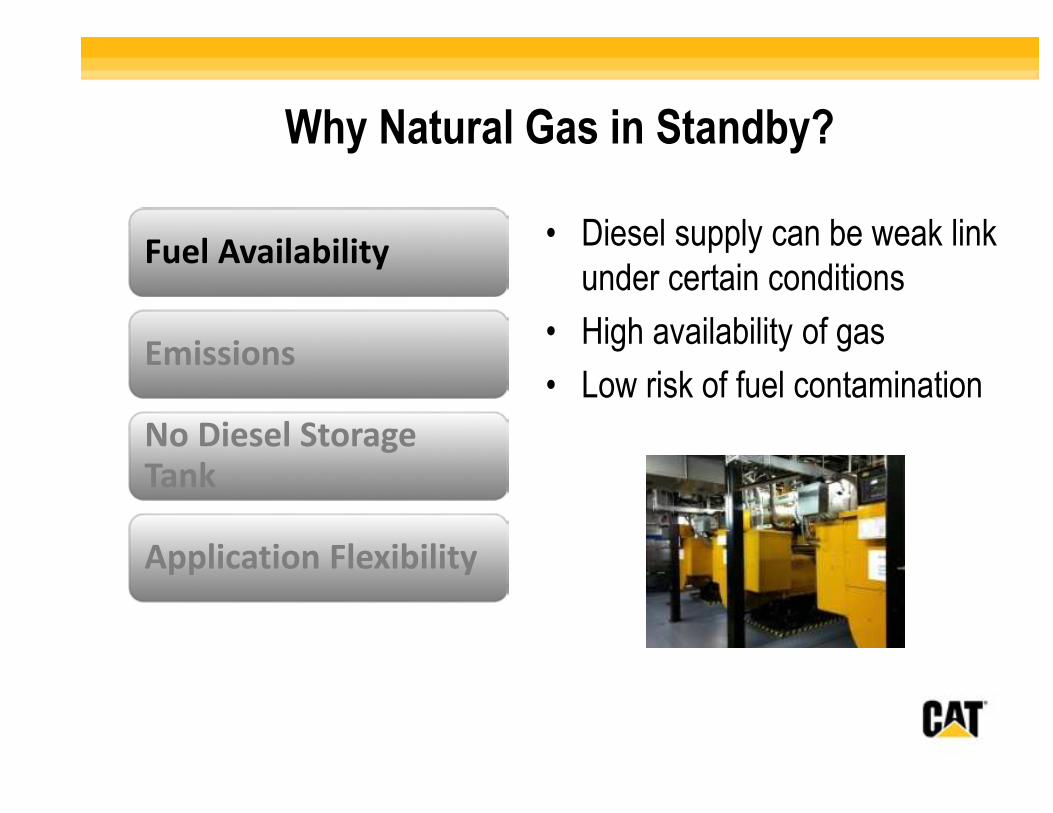
Why Natural Gas in Standby?
Fuel Availability
Emissions
No Diesel Storage Tank
Application Flexibility
• Diesel supply can be weak link under certain conditions
• High availability of gas
• Low risk of fuel contamination
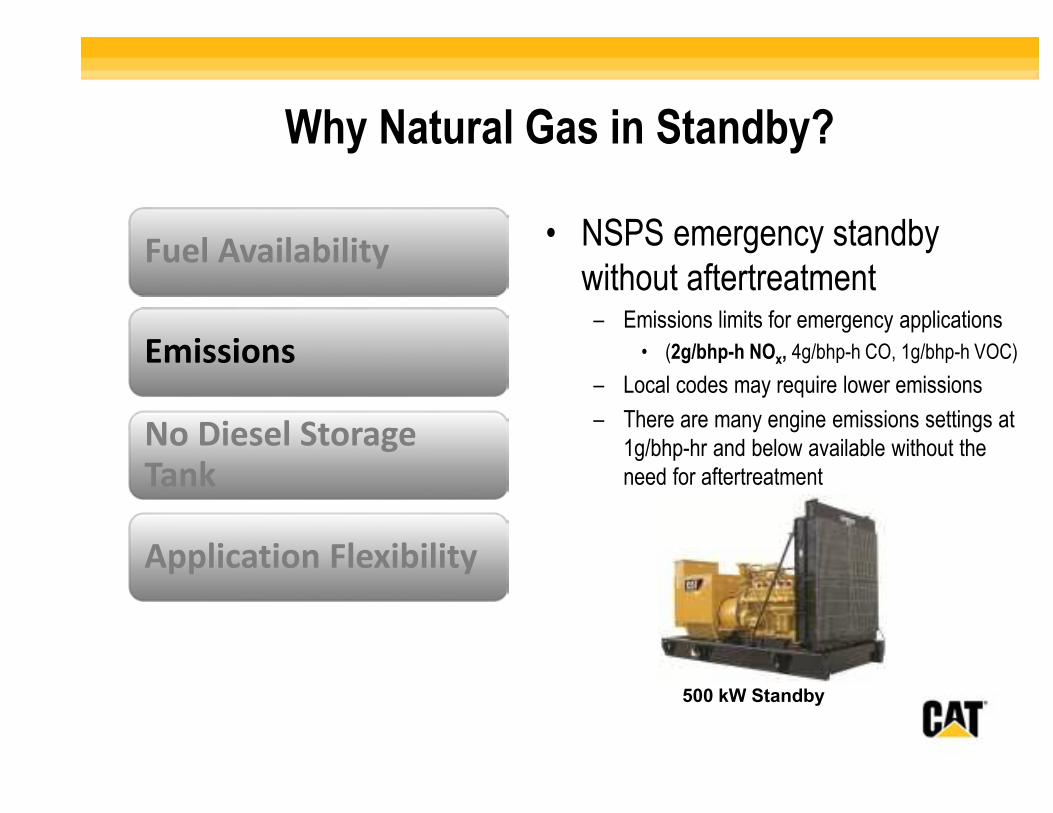
Why Natural Gas in Standby?
Fuel Availability
Emissions
No Diesel Storage Tank
Application Flexibility
• NSPS emergency standby without aftertreatment
– Emissions limits for emergency applications
• (2g/bhp-h NOx, 4g/bhp-h CO, 1g/bhp-h VOC)
– Local codes may require lower emissions
– There are many engine emissions settings at 1g/bhp-hr and below available without the need for aftertreatment
500 kW Standby
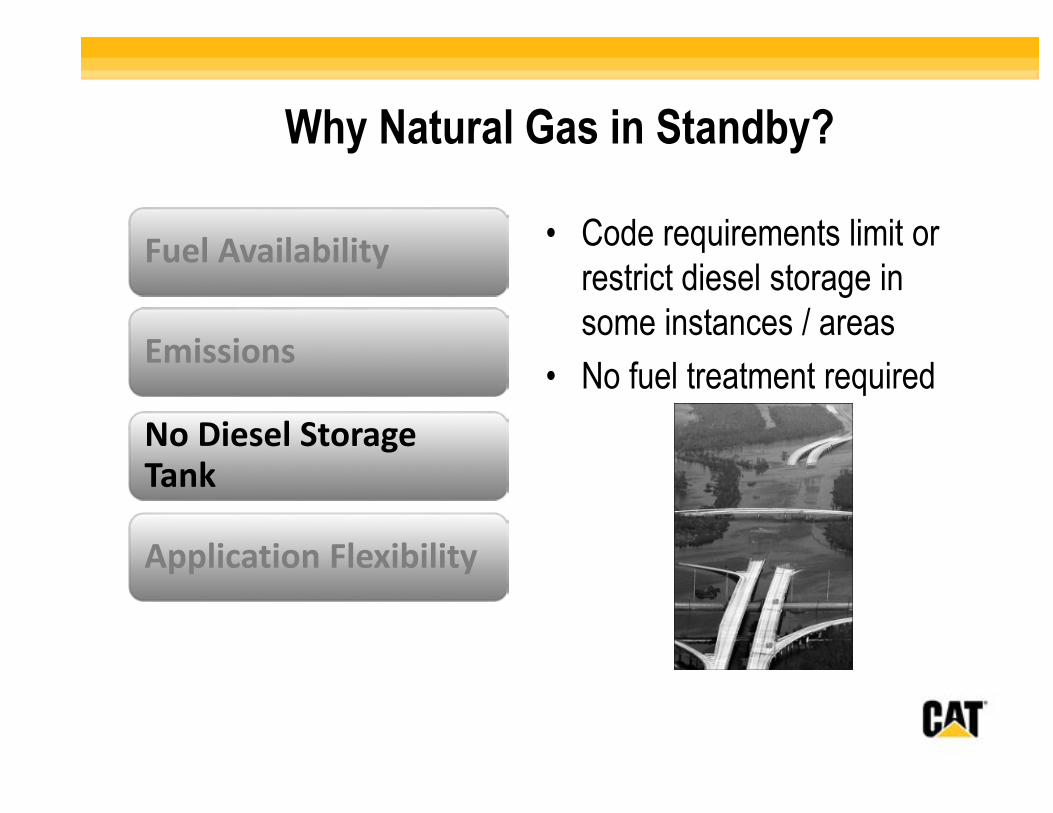
Why Natural Gas in Standby?
Fuel Availability
Emissions
No Diesel Storage Tank
Application Flexibility
• Code requirements limit or restrict diesel storage in some instances / areas
• No fuel treatment required
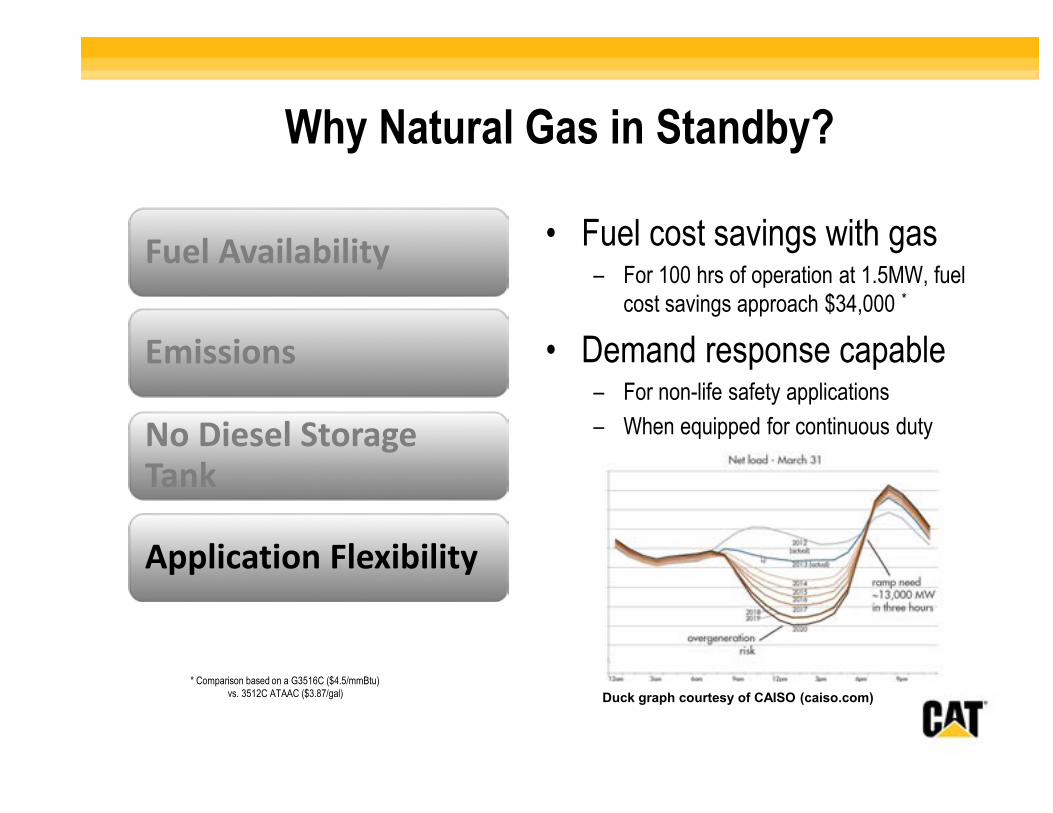
Why Natural Gas in Standby?
Fuel Availability
Emissions
No Diesel Storage Tank
Application Flexibility
• Fuel cost savings with gas– For 100 hrs of operation at 1.5MW, fuel
cost savings approach $34,000 *
• Demand response capable– For non-life safety applications
– When equipped for continuous duty
Duck graph courtesy of CAISO (caiso.com)
* Comparison based on a G3516C ($4.5/mmBtu) vs. 3512C ATAAC ($3.87/gal)
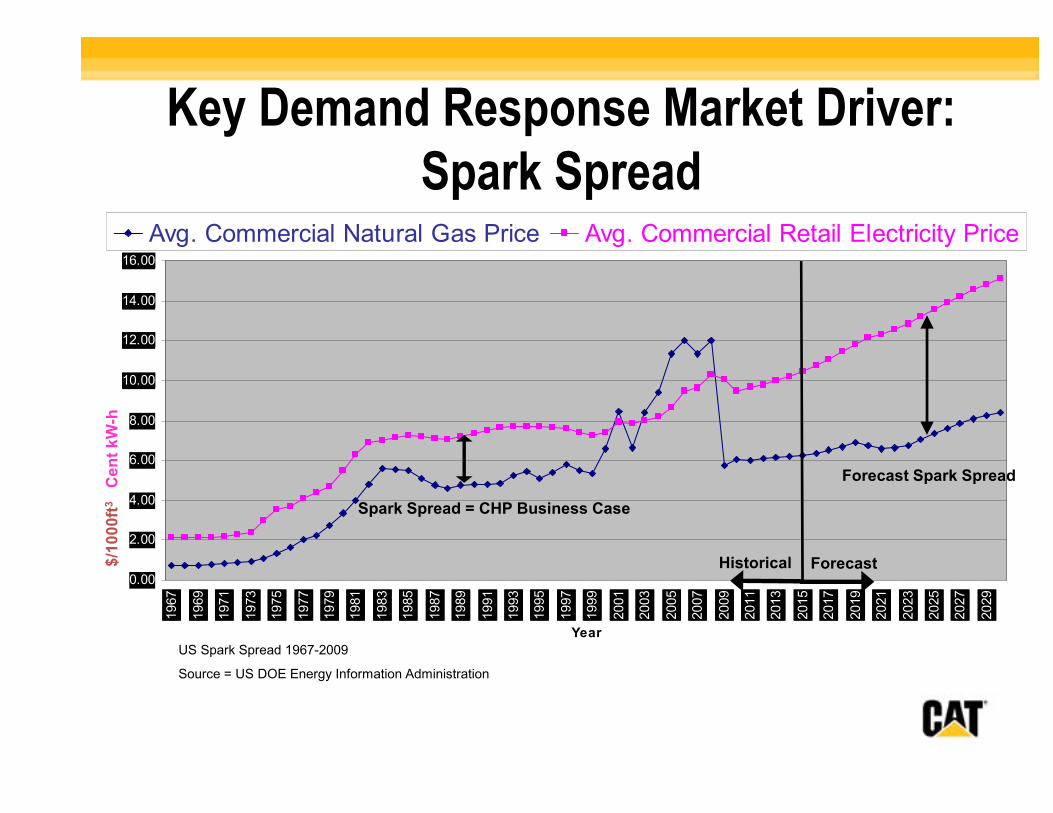
US Spark Spread 1967-2009
Source = US DOE Energy Information Administration
Key Demand Response Market Driver: Spark Spread
0.00
2.00
4.00
6.00
8.00
10.00
12.00
14.00
16.00
1967
1969
1971
1973
1975
1977
1979
1981
1983
1985
1987
1989
1991
1993
1995
1997
1999
2001
2003
2005
2007
2009
2011
2013
2015
2017
2019
2021
2023
2025
2027
2029
Year
Avg. Commercial Natural Gas Price Avg. Commercial Retail Electricity Price
Forecast
Spark Spread = CHP Business Case
Forecast Spark Spread
Historical$/1
00
0ft
3C
en
t k
W-h
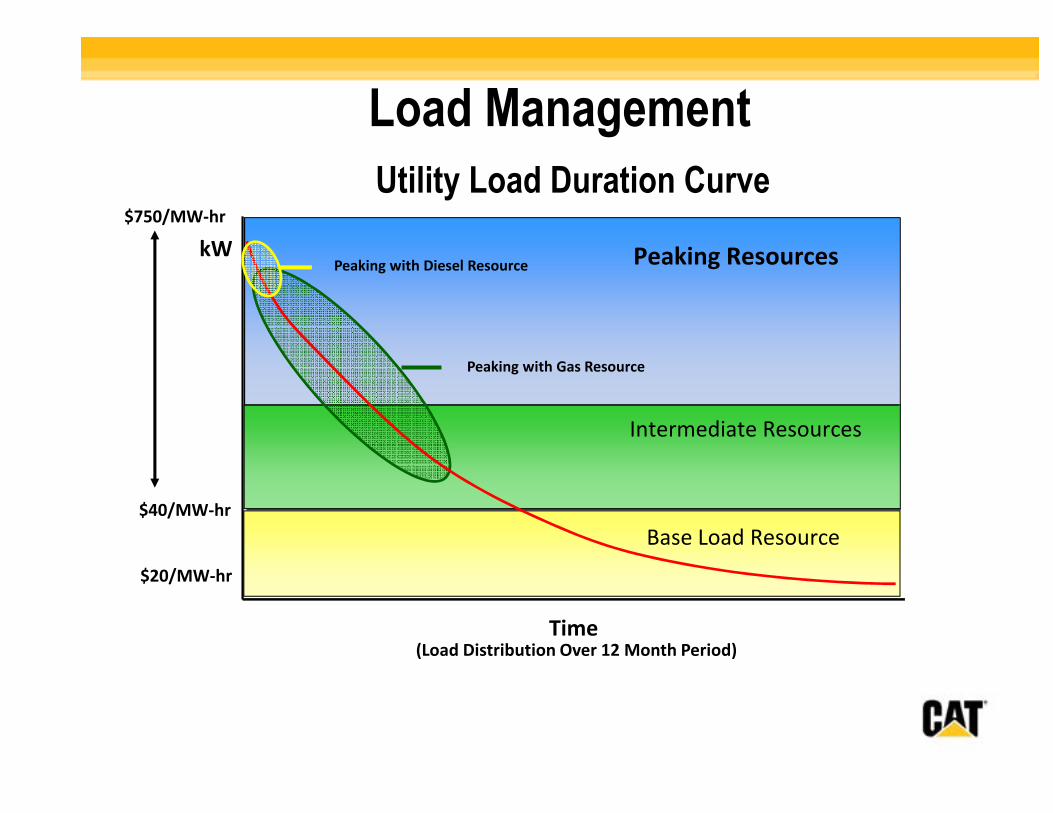
kW
Time(Load Distribution Over 12 Month Period)
$750/MW-hr
$20/MW-hr
$40/MW-hr
Base Load Resource
Intermediate Resources
Peaking Resources
Peaking with Gas Resource
Peaking with Diesel Resource
Load Management
Utility Load Duration Curve
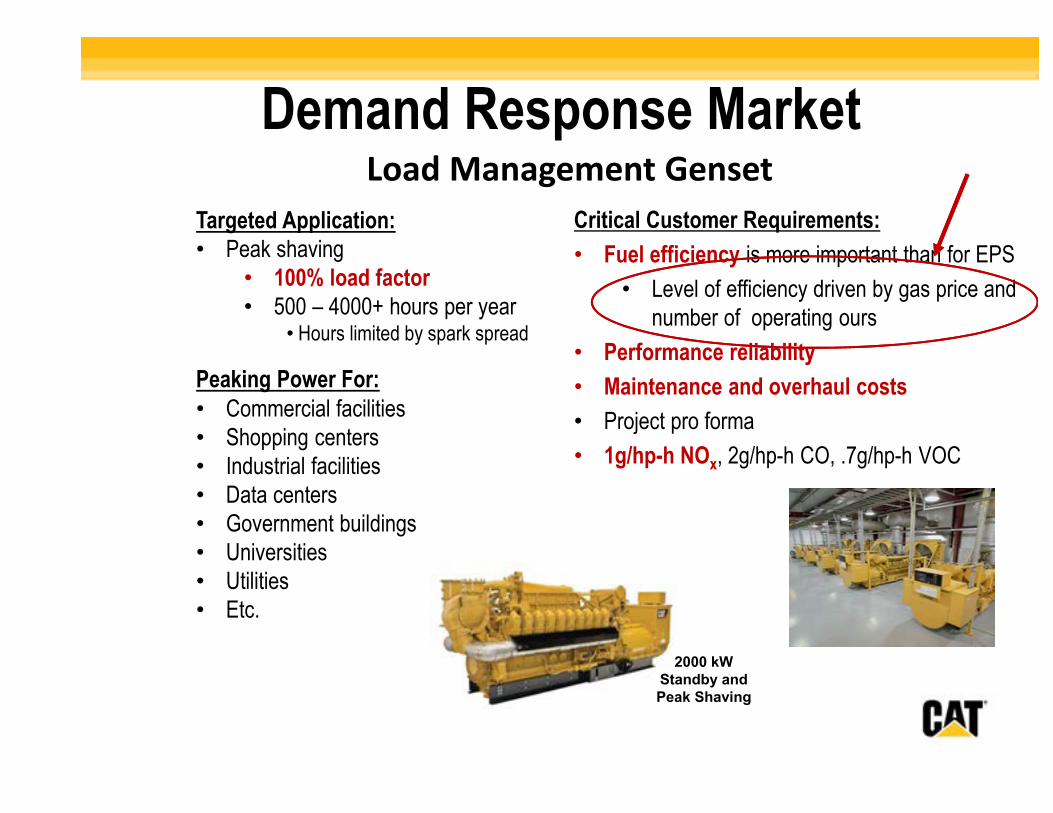
Demand Response Market Load Management Genset
Targeted Application:• Peak shaving
• 100% load factor• 500 – 4000+ hours per year
• Hours limited by spark spread
Peaking Power For:• Commercial facilities • Shopping centers• Industrial facilities• Data centers• Government buildings• Universities• Utilities• Etc.
Critical Customer Requirements:
• Fuel efficiency is more important than for EPS
• Level of efficiency driven by gas price and number of operating ours
• Performance reliability
• Maintenance and overhaul costs
• Project pro forma
• 1g/hp-h NOx, 2g/hp-h CO, .7g/hp-h VOC
2000 kW Standby and Peak Shaving
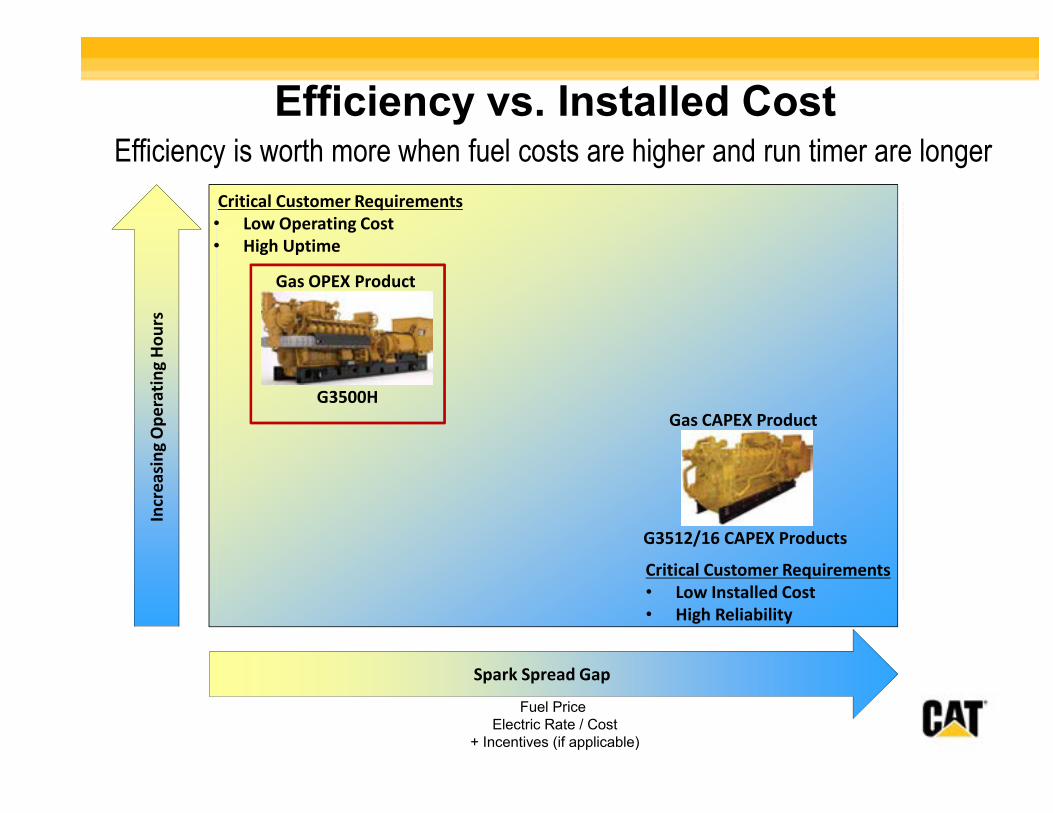
Efficiency vs. Installed CostIn
cre
asi
ng
Op
era
tin
g H
ou
rs
Spark Spread Gap
Critical Customer Requirements
• Low Operating Cost
• High Uptime
G3512/16 CAPEX Products
Gas CAPEX Product
G3500H
Gas OPEX Product
Critical Customer Requirements
• Low Installed Cost
• High Reliability
Efficiency is worth more when fuel costs are higher and run timer are longer
Fuel Price
Electric Rate / Cost
+ Incentives (if applicable)
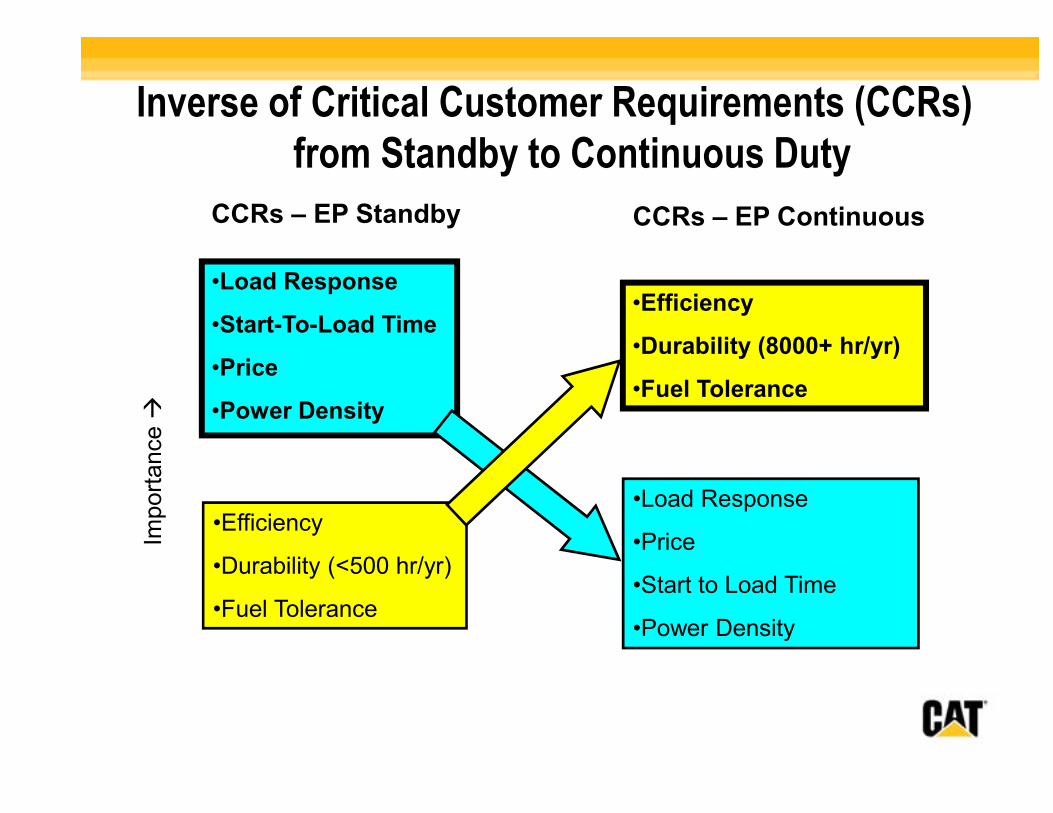
•Load Response
•Start-To-Load Time
•Price
•Power Density
•Load Response
•Price
•Start to Load Time
•Power Density
•Efficiency
•Durability (<500 hr/yr)
•Fuel Tolerance
•Efficiency
•Durability (8000+ hr/yr)
•Fuel Tolerance
CCRs – EP ContinuousCCRs – EP Standby
Import
ance �
Inverse of Critical Customer Requirements (CCRs) from Standby to Continuous Duty
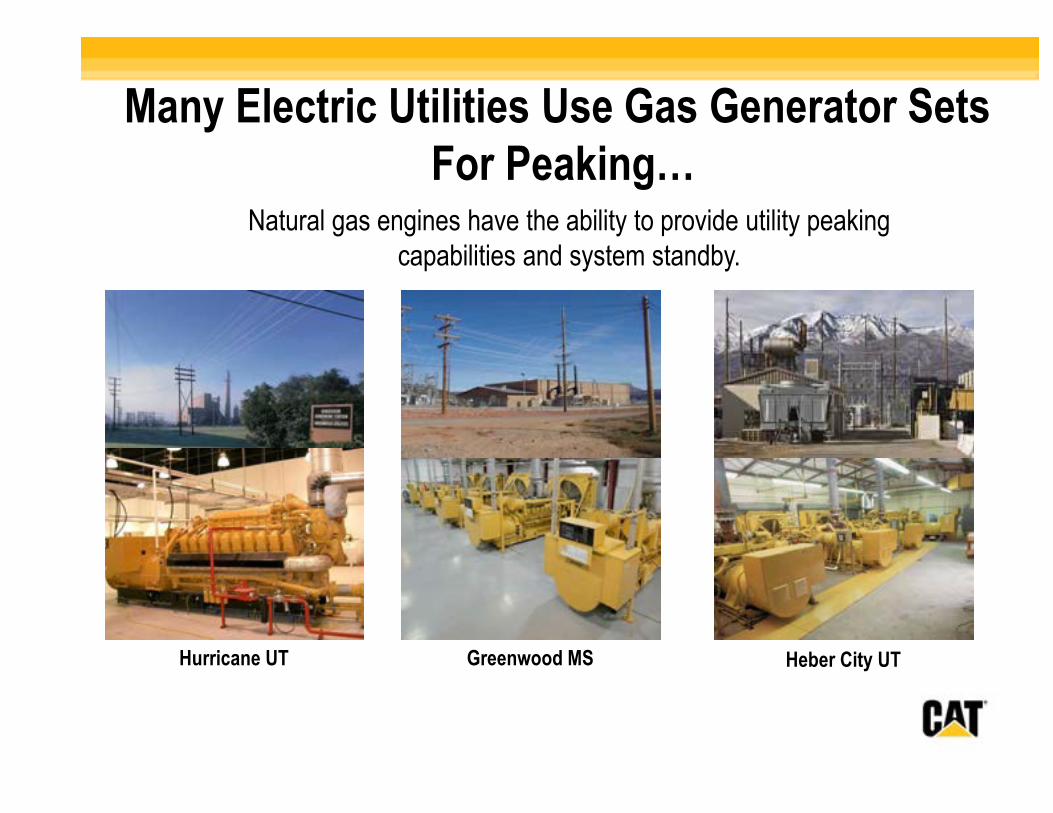
Greenwood MSHurricane UT Heber City UT
Many Electric Utilities Use Gas Generator SetsFor Peaking…
Natural gas engines have the ability to provide utility peaking capabilities and system standby.
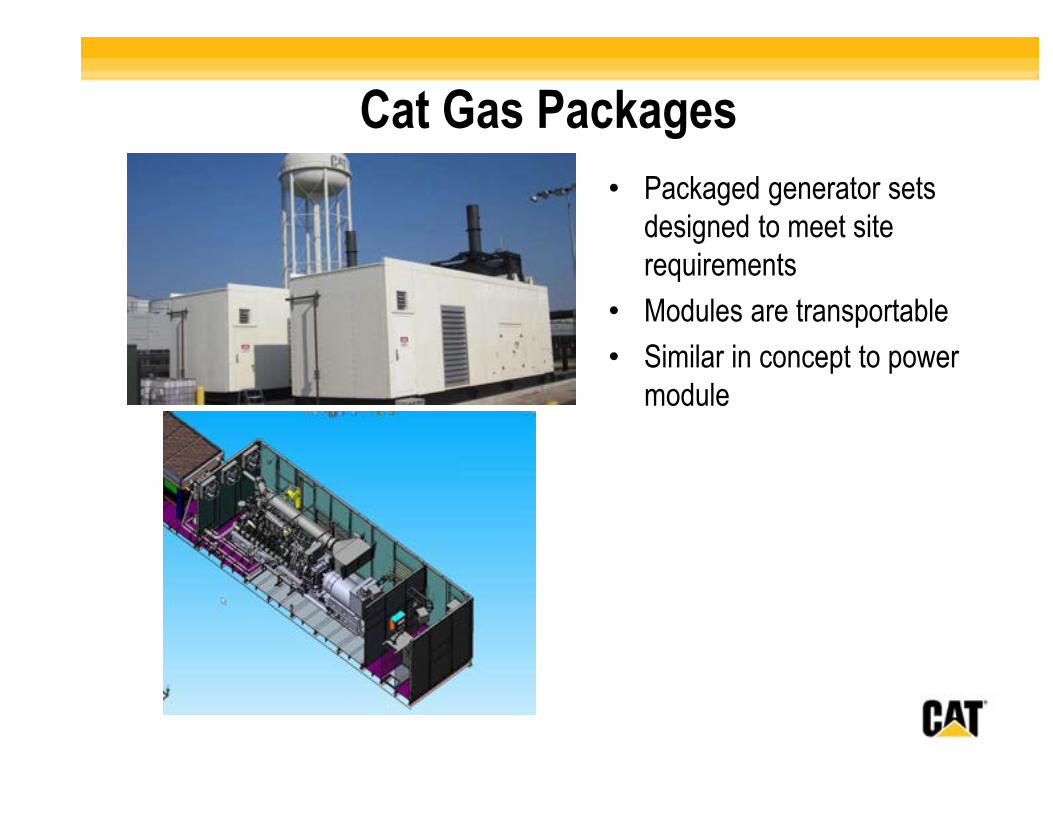
Cat Gas Packages
• Packaged generator sets designed to meet site requirements
• Modules are transportable
• Similar in concept to power module
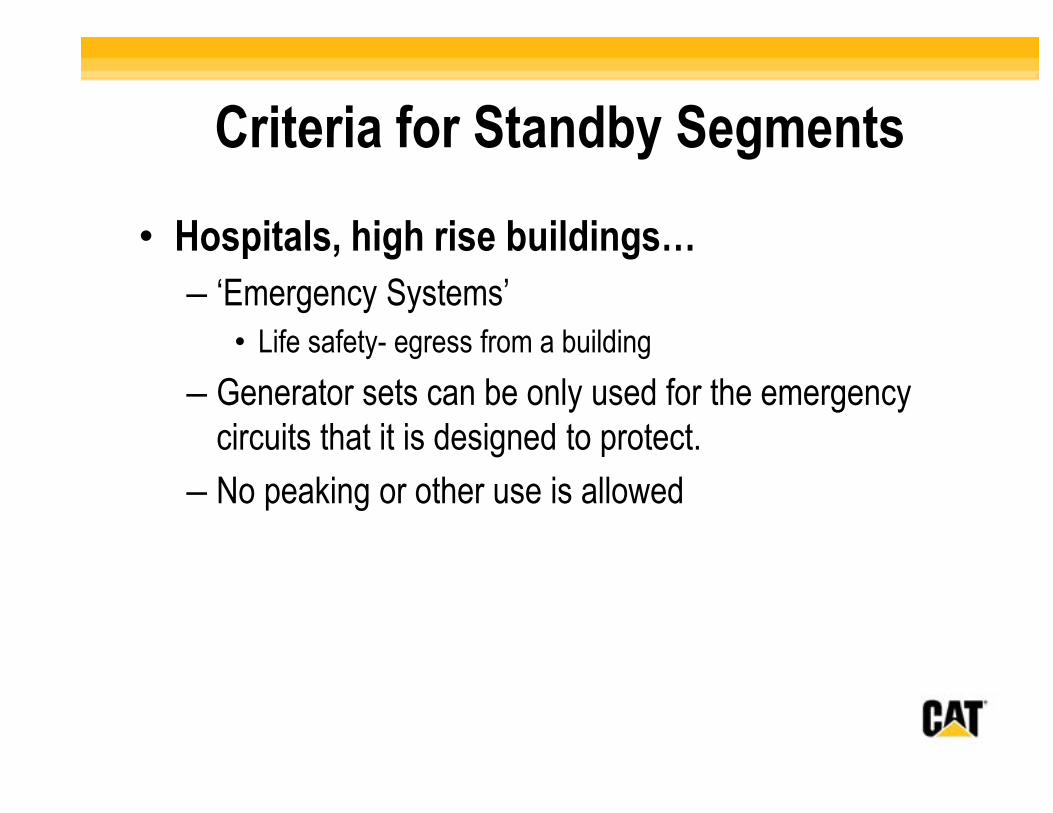
Criteria for Standby Segments
• Hospitals, high rise buildings…
– ‘Emergency Systems’
• Life safety- egress from a building
– Generator sets can be only used for the emergency circuits that it is designed to protect.
– No peaking or other use is allowed
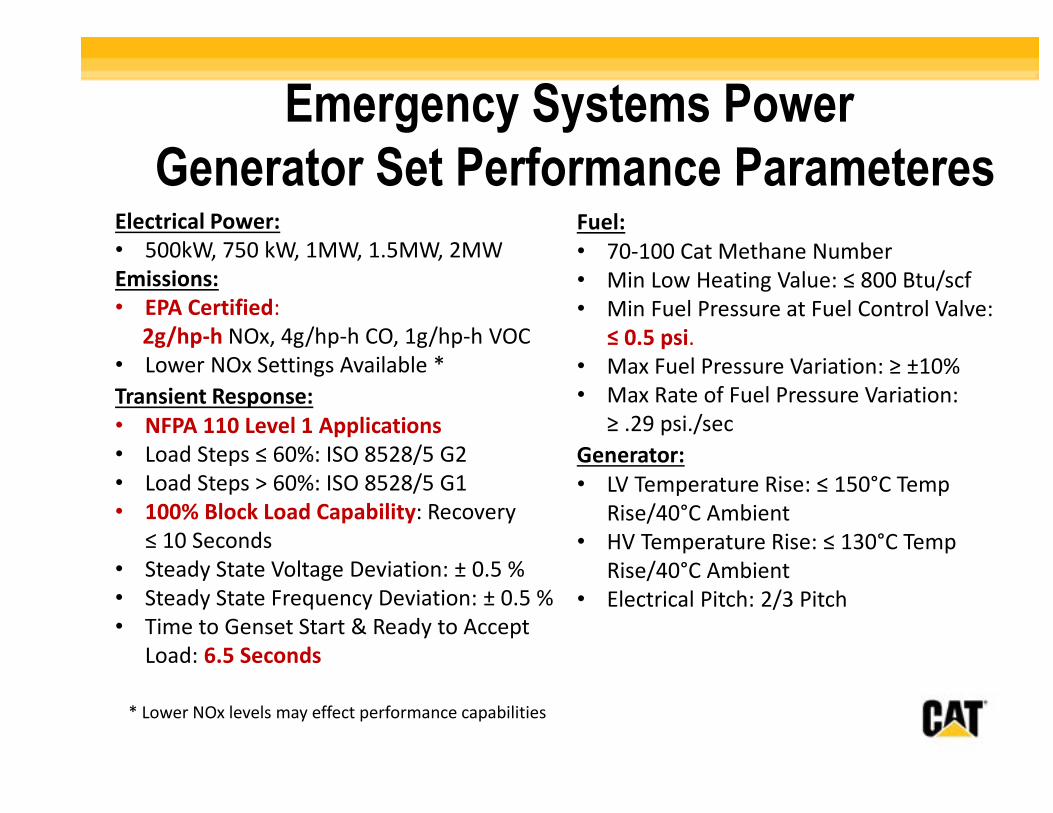
Electrical Power:
• 500kW, 750 kW, 1MW, 1.5MW, 2MW
Emissions:
• EPA Certified:
2g/hp-h NOx, 4g/hp-h CO, 1g/hp-h VOC
• Lower NOx Settings Available *
Transient Response:
• NFPA 110 Level 1 Applications
• Load Steps ≤ 60%: ISO 8528/5 G2
• Load Steps > 60%: ISO 8528/5 G1
• 100% Block Load Capability: Recovery
≤ 10 Seconds
• Steady State Voltage Deviation: ± 0.5 %
• Steady State Frequency Deviation: ± 0.5 %
• Time to Genset Start & Ready to Accept
Load: 6.5 Seconds
Emergency Systems PowerGenerator Set Performance Parameteres
Fuel:
• 70-100 Cat Methane Number
• Min Low Heating Value: ≤ 800 Btu/scf
• Min Fuel Pressure at Fuel Control Valve:
≤ 0.5 psi.
• Max Fuel Pressure Variation: ≥ ±10%
• Max Rate of Fuel Pressure Variation:
≥ .29 psi./sec
Generator:
• LV Temperature Rise: ≤ 150°C Temp
Rise/40°C Ambient
• HV Temperature Rise: ≤ 130°C Temp
Rise/40°C Ambient
• Electrical Pitch: 2/3 Pitch
* Lower NOx levels may effect performance capabilities
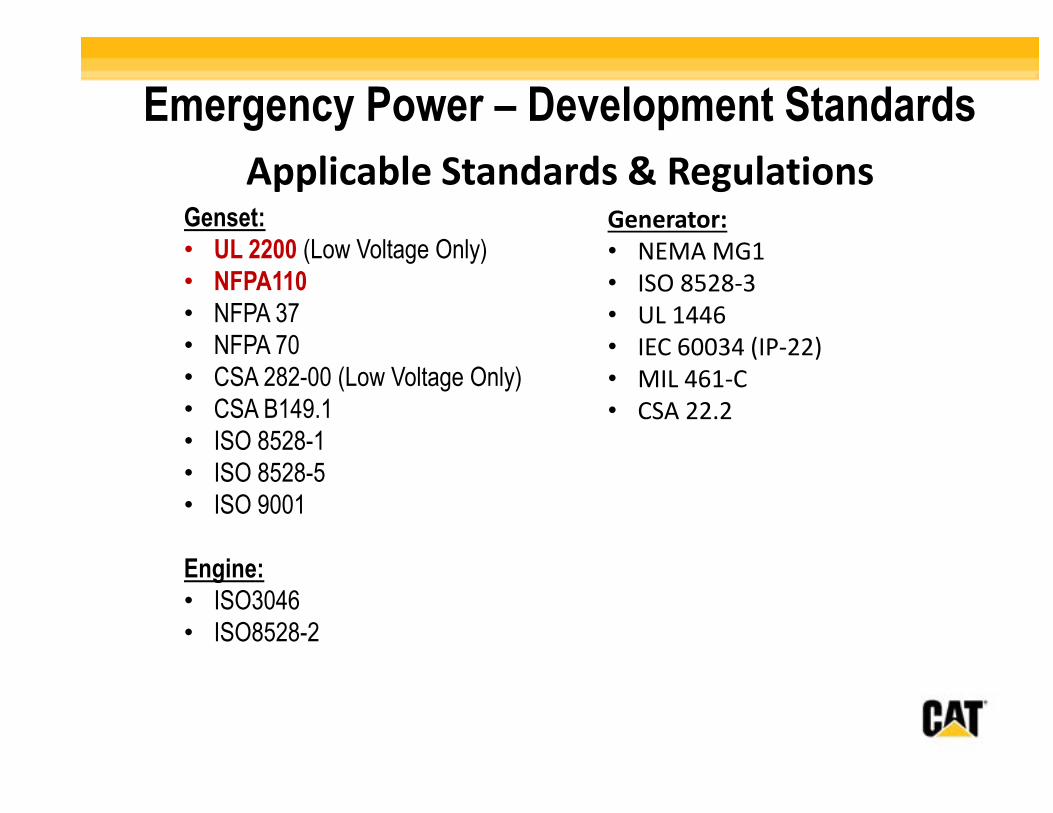
Emergency Power – Development Standards
Genset:• UL 2200 (Low Voltage Only)• NFPA110• NFPA 37• NFPA 70• CSA 282-00 (Low Voltage Only)• CSA B149.1• ISO 8528-1• ISO 8528-5• ISO 9001
Engine:• ISO3046• ISO8528-2
Applicable Standards & RegulationsGenerator:
• NEMA MG1
• ISO 8528-3
• UL 1446
• IEC 60034 (IP-22)
• MIL 461-C
• CSA 22.2
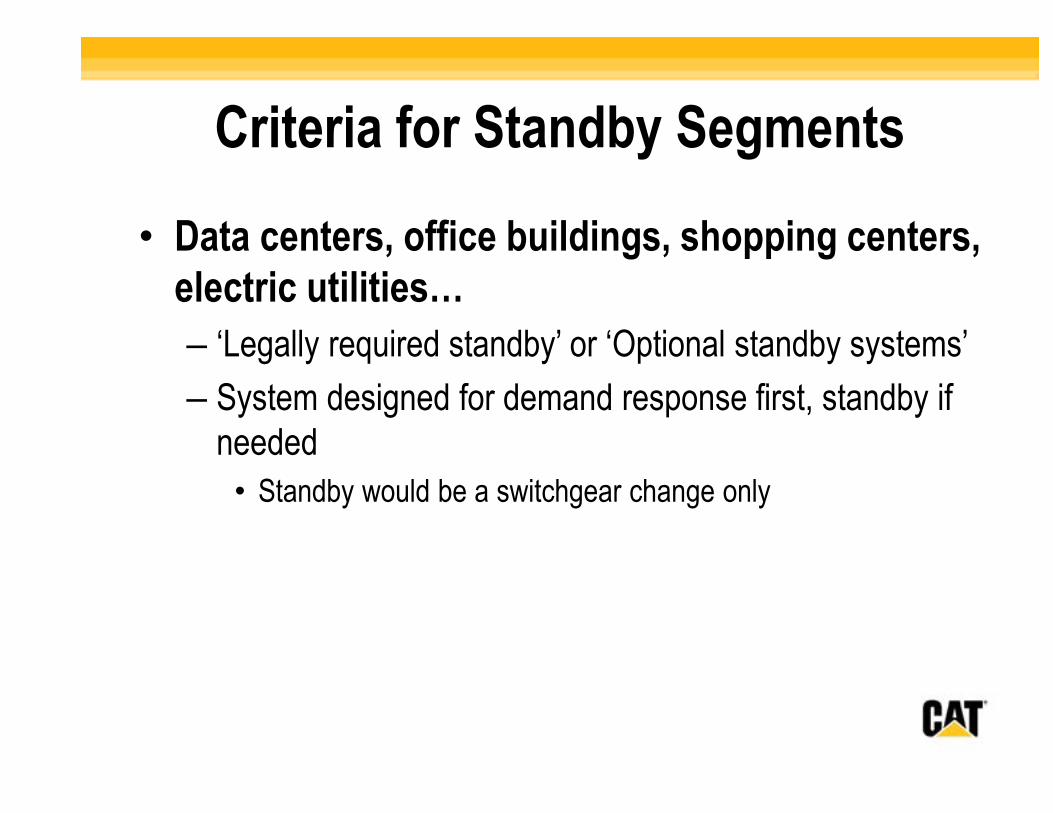
Criteria for Standby Segments
• Data centers, office buildings, shopping centers, electric utilities…
– ‘Legally required standby’ or ‘Optional standby systems’
– System designed for demand response first, standby if needed
• Standby would be a switchgear change only
Maintaining Gas Generator Sets for Highest Reliability
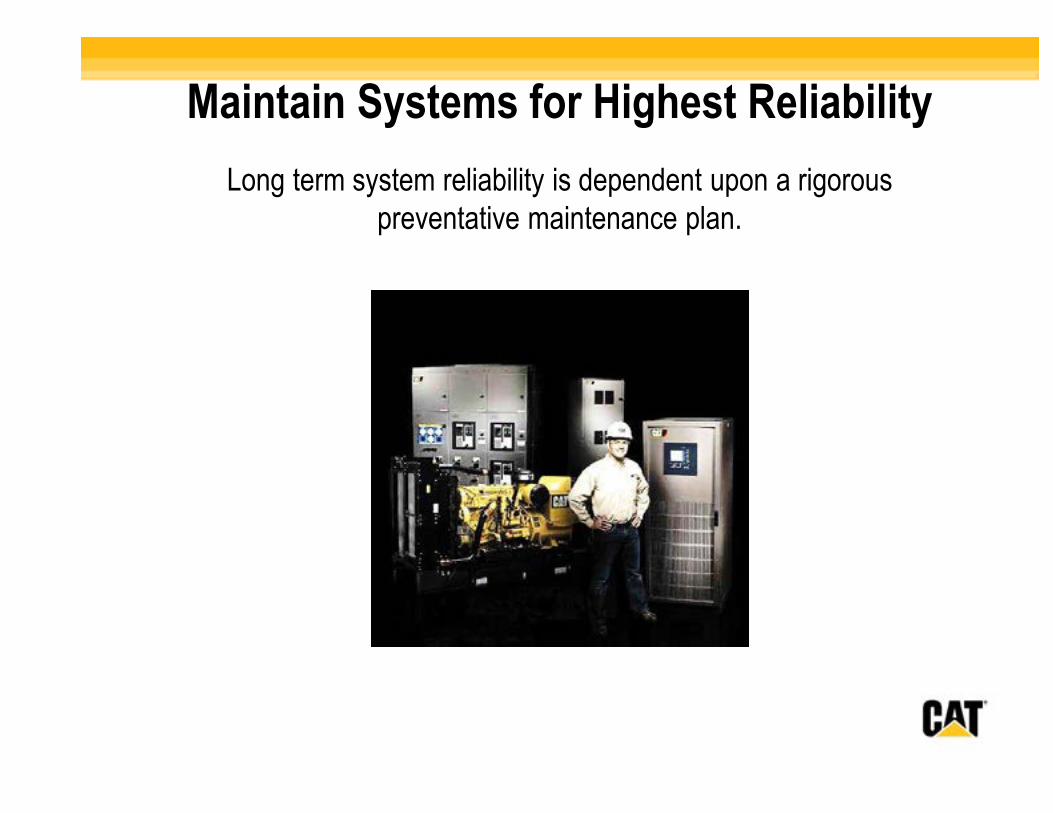
Long term system reliability is dependent upon a rigorous preventative maintenance plan.
Maintain Systems for Highest Reliability
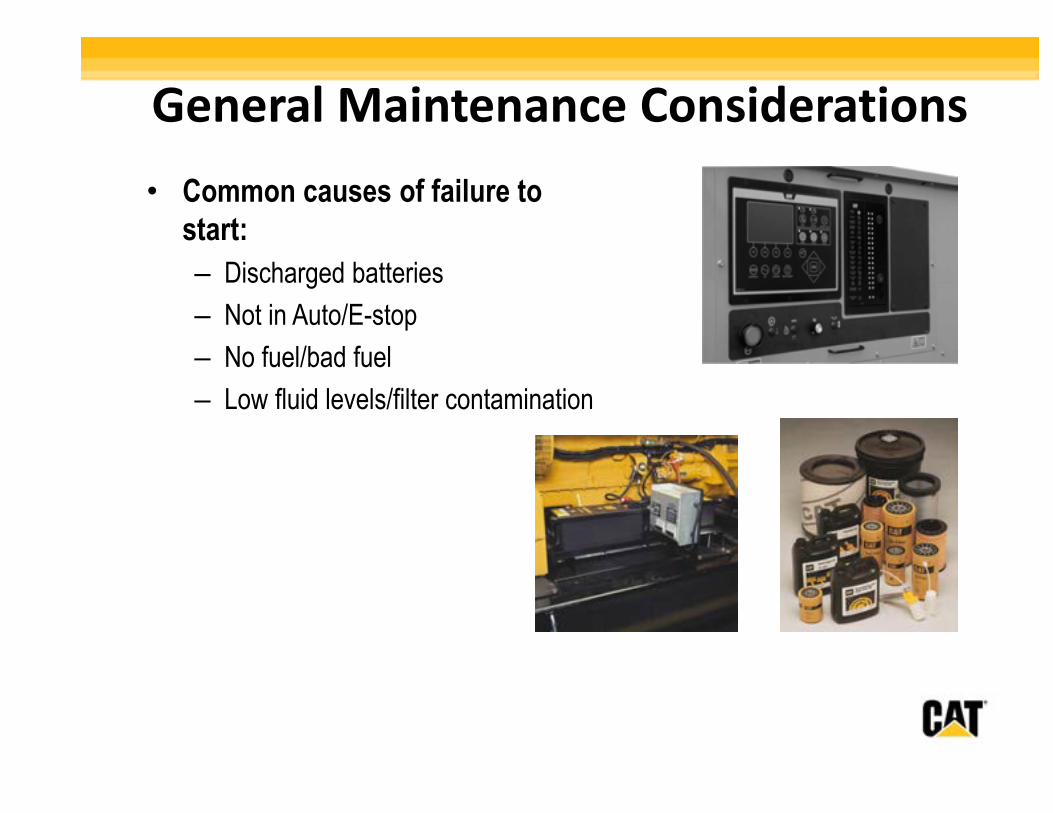
• Common causes of failure to start:
– Discharged batteries
– Not in Auto/E-stop
– No fuel/bad fuel
– Low fluid levels/filter contamination
General Maintenance Considerations
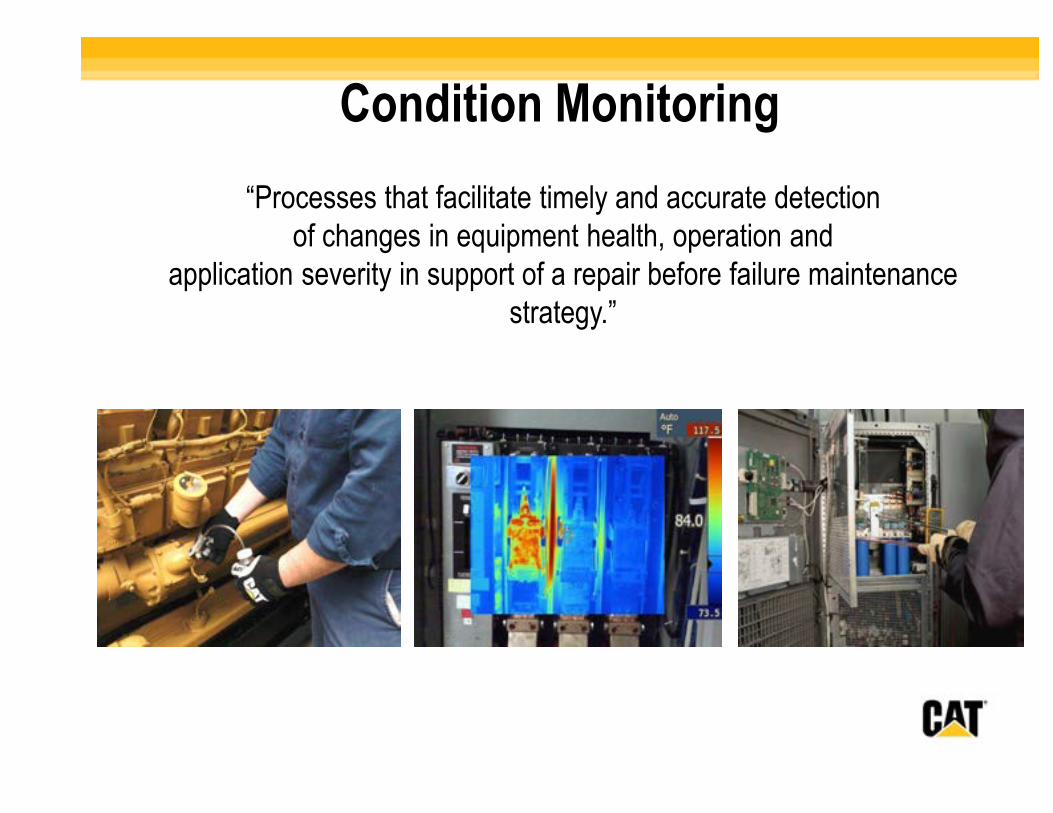
Condition Monitoring
“Processes that facilitate timely and accurate detection of changes in equipment health, operation and
application severity in support of a repair before failure maintenance strategy.”
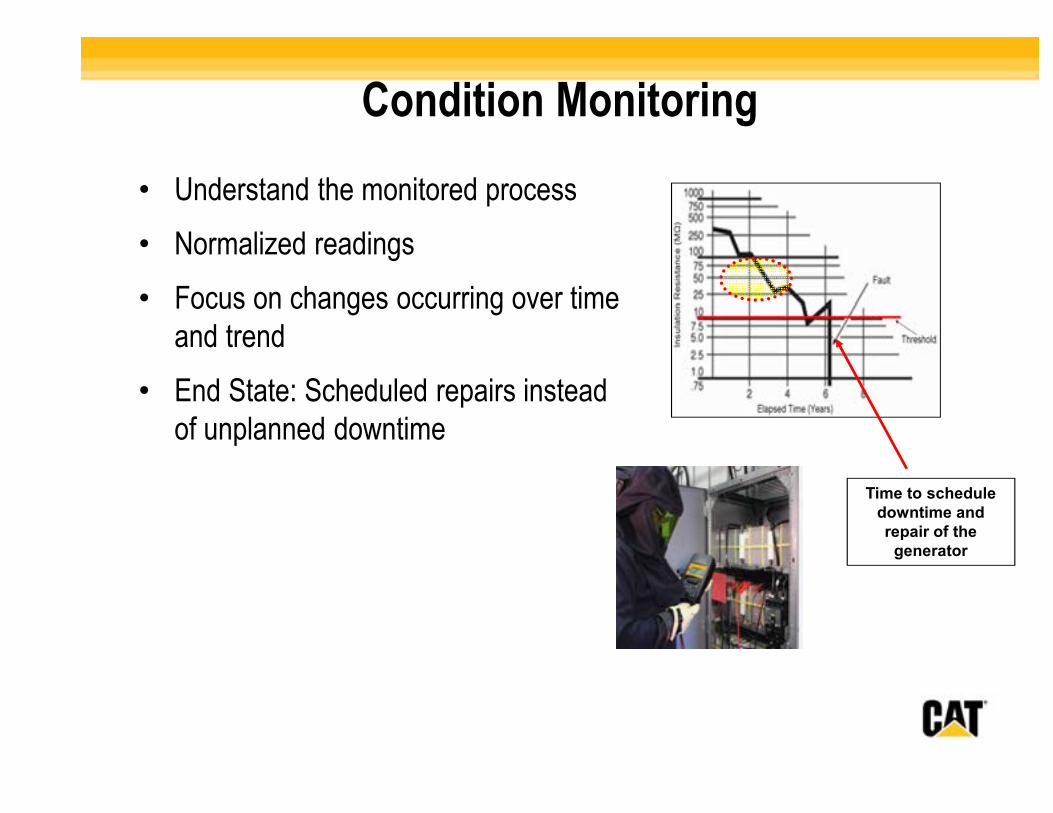
• Understand the monitored process
• Normalized readings
• Focus on changes occurring over time and trend
• End State: Scheduled repairs instead of unplanned downtime
Time to schedule downtime and repair of the
generator
Condition Monitoring
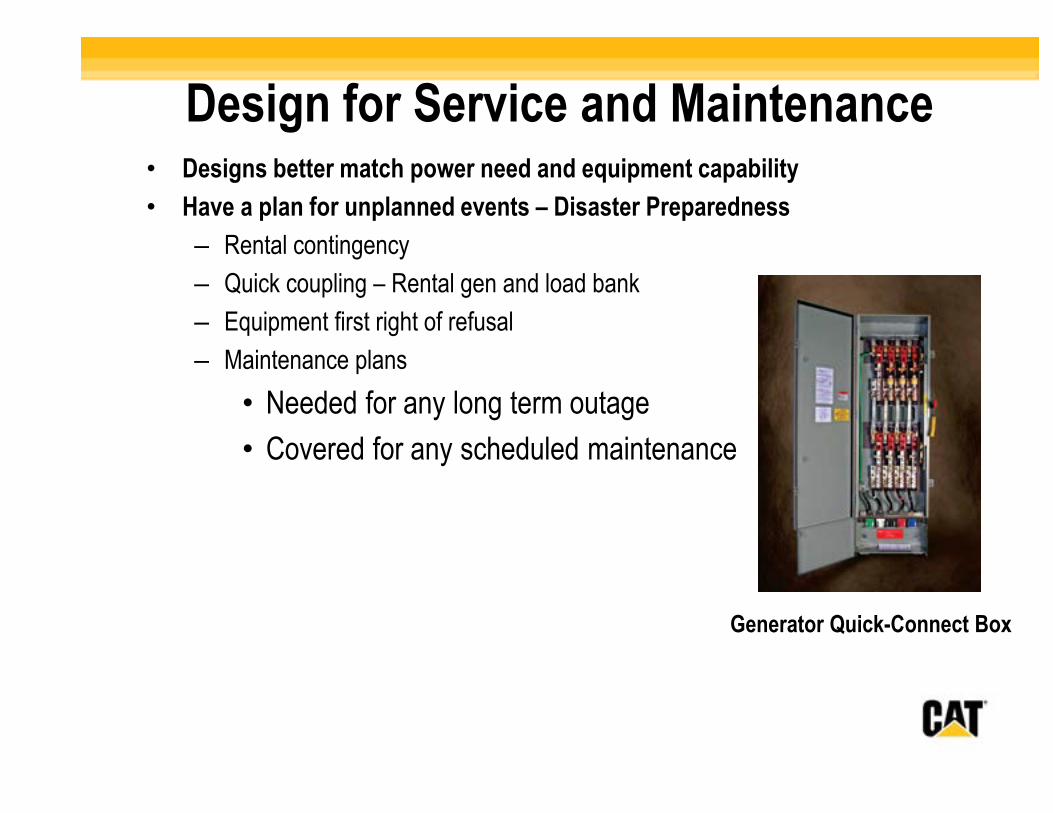
• Designs better match power need and equipment capability
• Have a plan for unplanned events – Disaster Preparedness
– Rental contingency
– Quick coupling – Rental gen and load bank
– Equipment first right of refusal
– Maintenance plans
• Needed for any long term outage
• Covered for any scheduled maintenance
Design for Service and Maintenance
Generator Quick-Connect Box
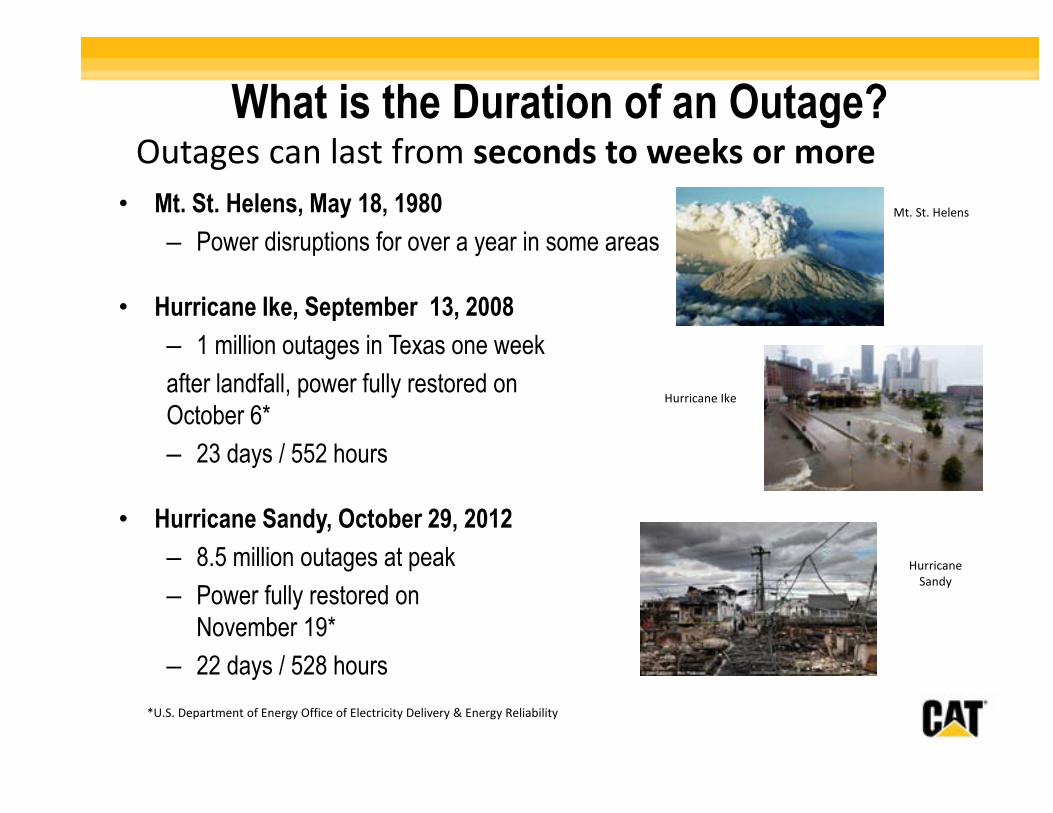
• Mt. St. Helens, May 18, 1980
– Power disruptions for over a year in some areas
• Hurricane Ike, September 13, 2008
– 1 million outages in Texas one week
after landfall, power fully restored on October 6*
– 23 days / 552 hours
• Hurricane Sandy, October 29, 2012
– 8.5 million outages at peak
– Power fully restored on November 19*
– 22 days / 528 hours
*U.S. Department of Energy Office of Electricity Delivery & Energy Reliability
What is the Duration of an Outage?Outages can last from seconds to weeks or more
Mt. St. Helens
Hurricane Ike
Hurricane
Sandy
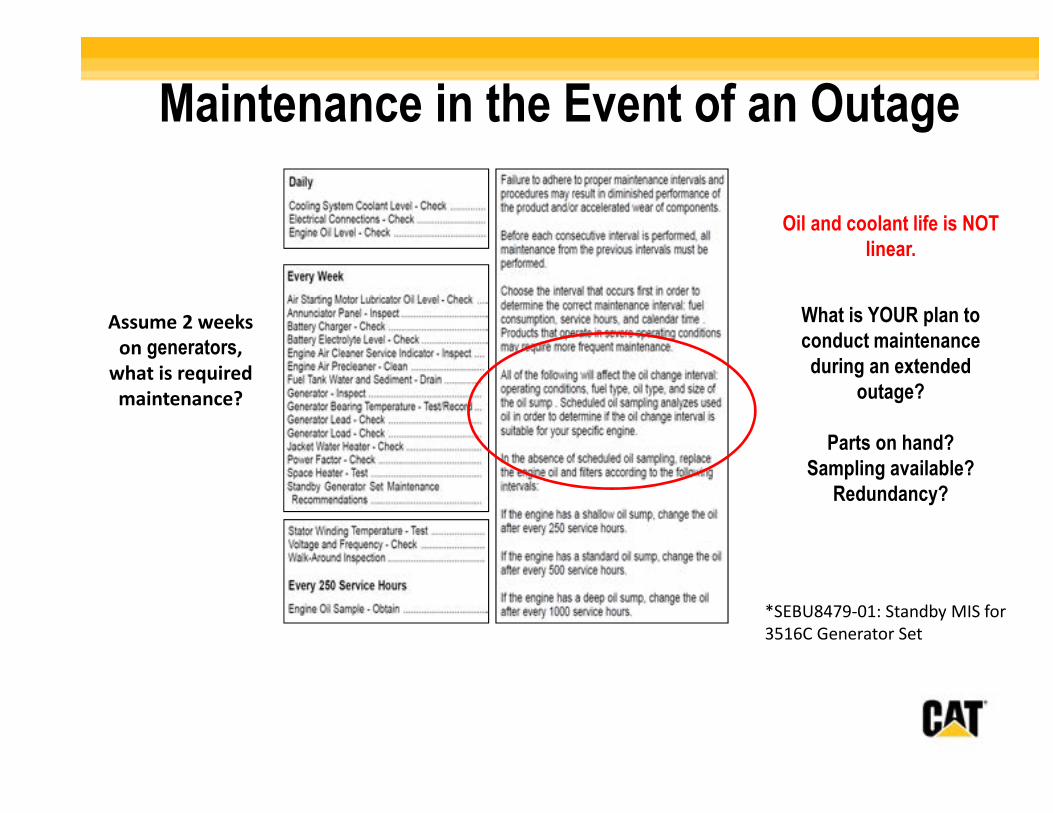
What is YOUR plan to conduct maintenance during an extended
outage?
Parts on hand?Sampling available?
Redundancy?
Oil and coolant life is NOT linear.
*SEBU8479-01: Standby MIS for
3516C Generator Set
Assume 2 weeks
on generators,
what is required
maintenance?
Maintenance in the Event of an Outage
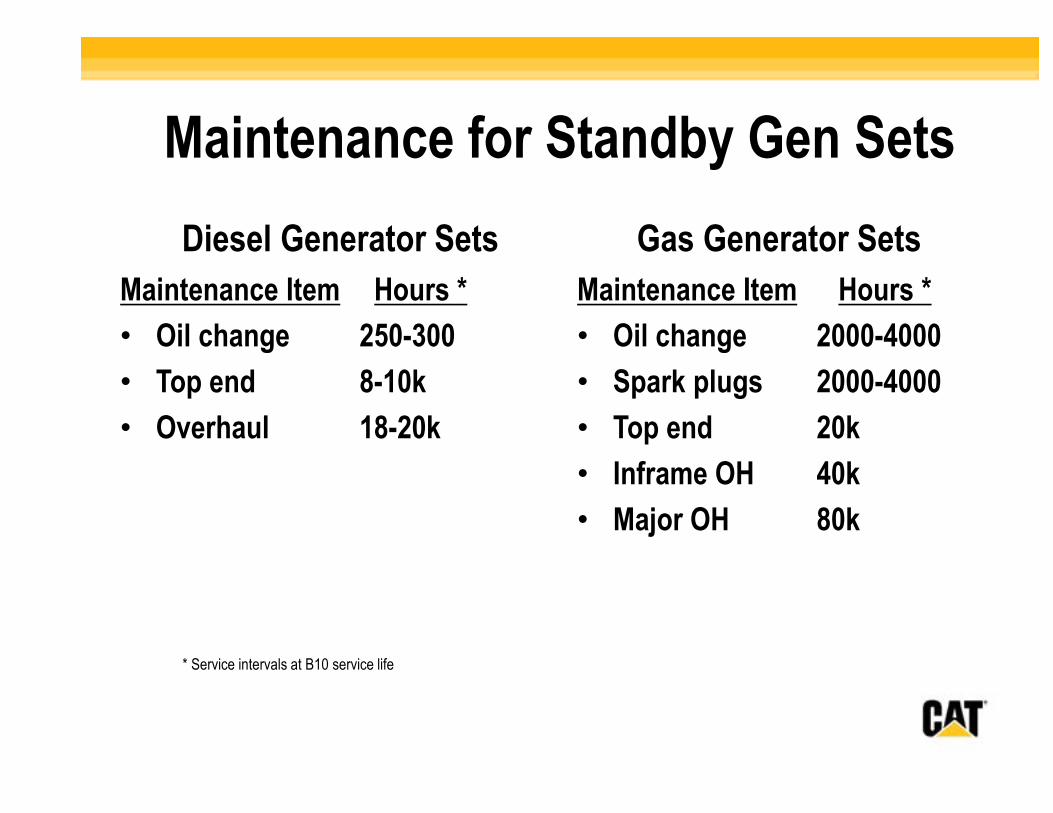
Maintenance for Standby Gen Sets
Diesel Generator Sets
Maintenance Item Hours *
• Oil change 250-300
• Top end 8-10k
• Overhaul 18-20k
Gas Generator Sets
Maintenance Item Hours *
• Oil change 2000-4000
• Spark plugs 2000-4000
• Top end 20k
• Inframe OH 40k
• Major OH 80k
* Service intervals at B10 service life
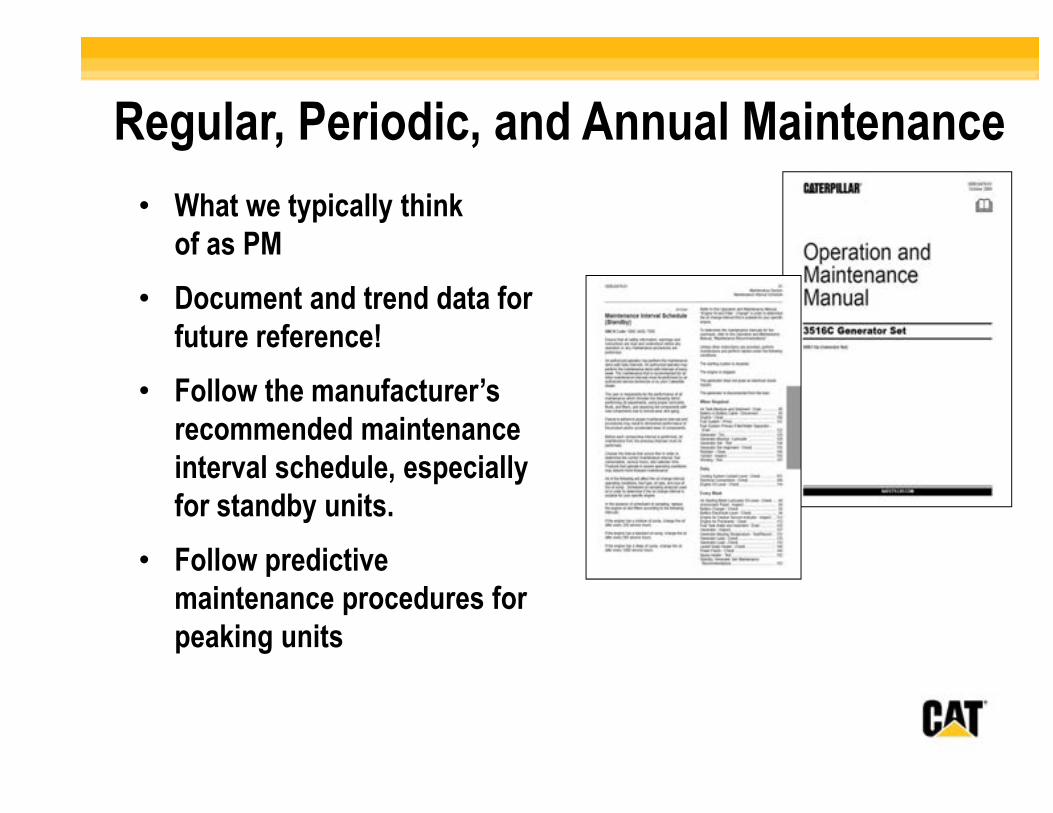
Regular, Periodic, and Annual Maintenance
• What we typically think of as PM
• Document and trend data for future reference!
• Follow the manufacturer’s recommended maintenance interval schedule, especially for standby units.
• Follow predictive maintenance procedures for peaking units
Predictive Maintenance
• Monitor all aspects of engine operation
• Monitor wear trends
• Repair before failure
• Develop a long term strategy for engine and generator maintenance
• Having a good maintenance plan will reduce downtime
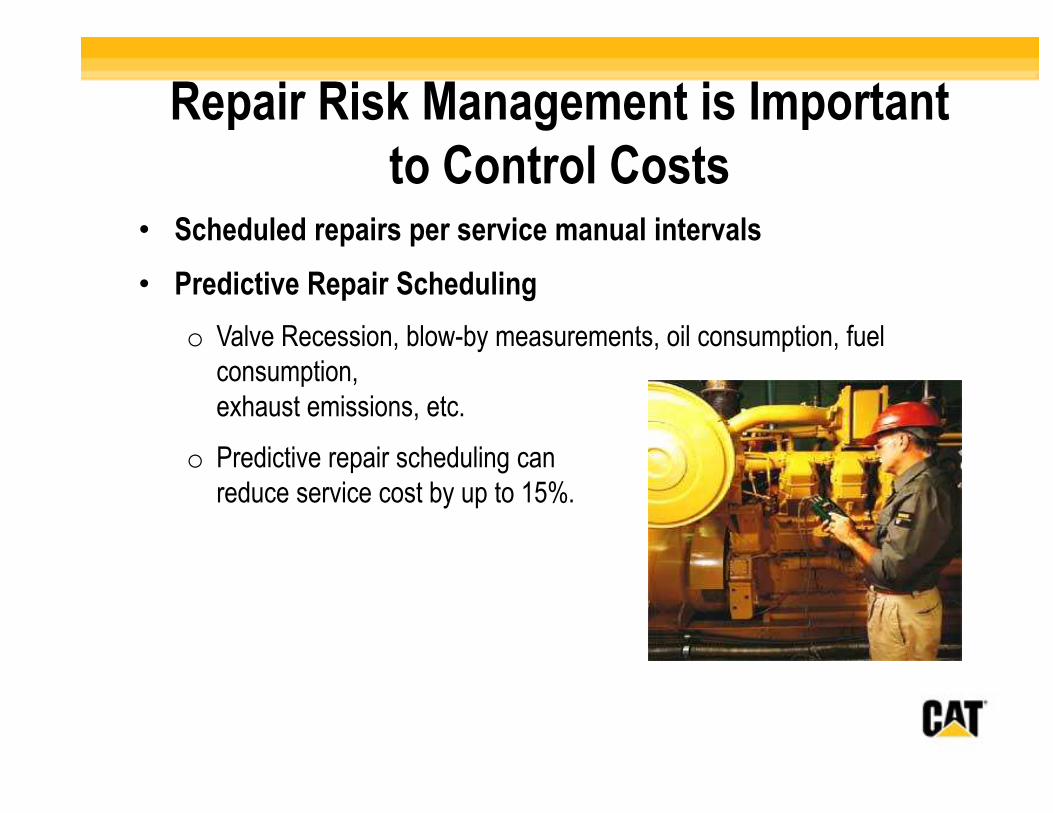
Repair Risk Management is Important to Control Costs
• Scheduled repairs per service manual intervals
• Predictive Repair Scheduling
o Valve Recession, blow-by measurements, oil consumption, fuel consumption, exhaust emissions, etc.
o Predictive repair scheduling can reduce service cost by up to 15%.
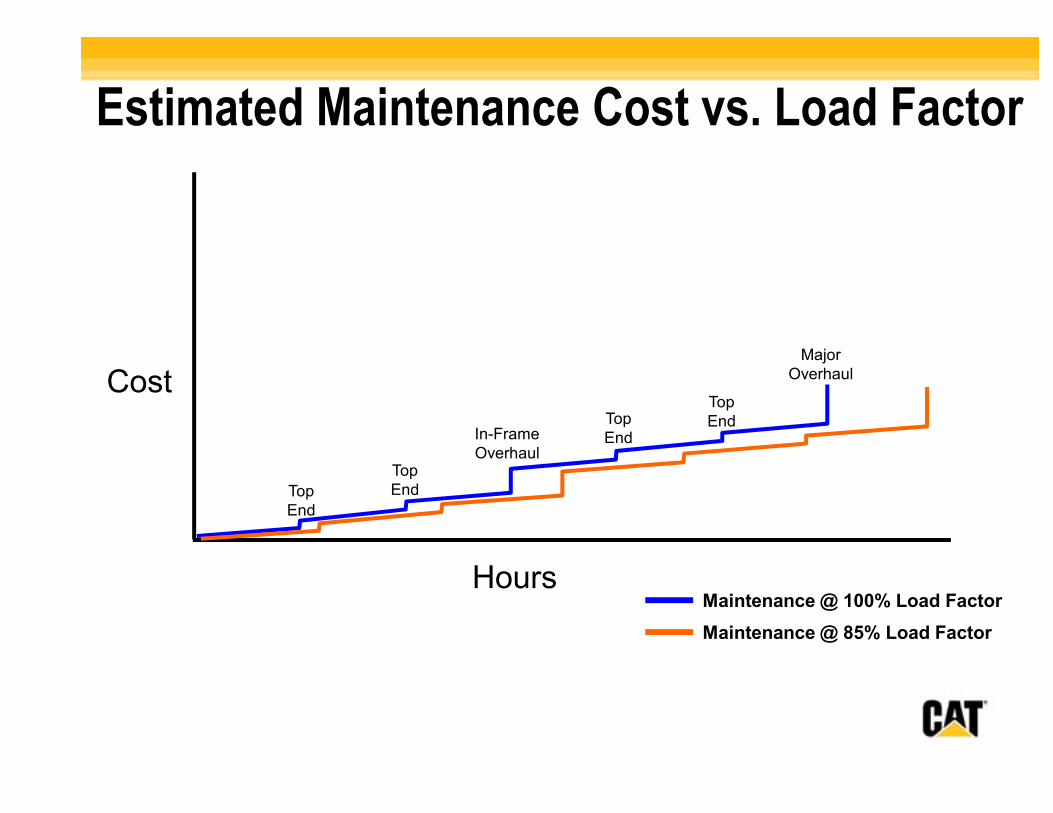
Estimated Maintenance Cost vs. Load Factor
Top
End
Top
End
Top
End
Top
EndIn-Frame
Overhaul
Major
Overhaul
Hours
Cost
Maintenance @ 100% Load Factor
Maintenance @ 85% Load Factor
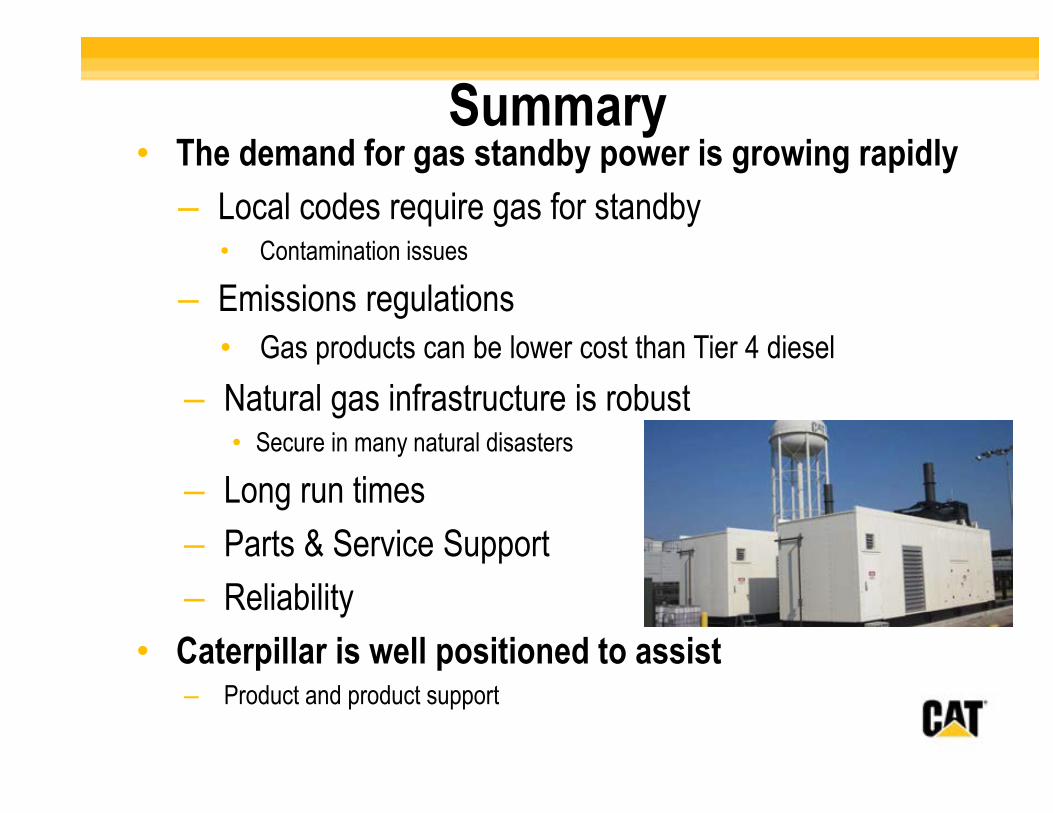
Summary• The demand for gas standby power is growing rapidly
– Local codes require gas for standby• Contamination issues
– Emissions regulations
• Gas products can be lower cost than Tier 4 diesel
– Natural gas infrastructure is robust• Secure in many natural disasters
– Long run times
– Parts & Service Support
– Reliability
• Caterpillar is well positioned to assist – Product and product support
Questions?
Information contained in this publication may be considered confidential. Discretion is recommended when distributing. Materials and specifications are subject to change without notice. CAT, CATERPILLAR, BUILT FOR IT, their respective logos, “Caterpillar Yellow”, the “Power Edge” trade dress as well as corporate and product identity used herein, are
trademarks of Caterpillar and may not be used without permission.
http://www.cat-electricpower.com/© 2015 Caterpillar Inc.
All rights reserved.