Embed Size (px)
DESCRIPTION
Dielectric theory
Citation preview
72A-1974-01 Rev. B 3/05 14-1
Dielectric Theory and Practice
Seventh Edition
Doble Engineering Company 85 Walnut Street
Watertown, Massachusetts 02272-9107 (USA)
Telephone: (617) 926-4900
Fax: (617) 926-0528 www.doble.com
72A-1974-01 Rev. B 3/05 14-1
NOTICE
This Reference Publication (the “Reference Book”) is solely the property of the Doble Engineering Company (Doble®) and, along with the subject matter to which it applies, is provided for the exclusive use of Doble Clients (the “Client”) under contractual agreement for Doble® test equipment and services. In no event does the Doble Engineering Company assume liability for any technical or editorial errors of commission or omission; nor is Doble liable for direct, indirect, incidental, or consequential damages arising out of reliance, inaccurate third party information or the inability of the Client to use this Reference Book properly. Copyright laws protect this Reference Book; all rights are reserved. No part of this Reference Book shall be reproduced, stored in a retrieval system, or transmitted by any means, electronic, mechanical, photocopying, recording, or otherwise without written permission from the Doble Engineering Company. Doble and the Doble logo are registered in the U.S. Patent and Trademark Office and are trademarks of the Doble Engineering Company. Doble® is providing the information contained herein for reference purposes only. Doble® makes no warranty or representation that the Reference Book will meet the Client’s requirements. This Reference Book is intended to provide a basic understanding and general application of the principles set forth herein. Comments contained herein relating to safety represent minimum guidelines, and should never be compromised; however, it is foreseeable that the minimum safety guidelines may be supplemented in order to conform to Client’s company safety and compliance regulations. Client is responsible for applying the information contained herein in strict accordance with industry as well as Client’s company compliance and safety regulations. The techniques and procedures described herein are based on years of experience with some tried and proven methods. However, the basic recommendations contained herein cannot cover all test situations and there may be instances when Doble® should be consulted directly. Doble® is not responsible for the MISUSE OR RELIANCE ON THIS PUBLICATION; ANY OPINIONS CONTAINED HEREIN OR AS A RESULT OF MODIFICATION BY ANYONE OTHER THAN DOBLE® OR AN AUTHORIZED DOBLE REPRESENTATIVE. THERE ARE NO WARRANTIES, EXPRESSED OR IMPLIED, MADE WITH RESPECT TO THIS REFERENCE BOOK INCLUDING, BUT NOT LIMITED TO, ANY IMPLIED WARRANTIES OF MERCHANTABILITY AND FITNESS FOR A PARTICULAR PURPOSE. DOBLE® EXPRESSLY DISCLAIMS ALL WARRANTIES NOT STATED HEREIN. IT IS UNDERSTOOD THAT MUCH OF THIS INFORMATION (ALTHOUGH OWNED BY DOBLE®) HAS BEEN COMPILED FROM OR CONVEYED BY THIRD PARTIES WHO IN DOBLE’S REASONABLE ASSESSMENT ARE LEADING AUTHORITIES IN THE INDUSTRY, ALTHOUGH DOBLE HAS REVIEWED THE INFORMATION WITH REASONABLE CARE, THE VERACITY AND RELIABILITY OF THE INFORMATION AND IT’S APPLICATION IS NOT ABSOLUTE. UNDER NO CIRCUMSTANCES WILL DOBLE BE LIABLE TO CLIENT OR ANY PARTY WHO RELIES IN THE INFORMATION FOR ANY DAMAGES, INCLUDING WITHOUT LIMITATION, PERSONAL INJURY OR PROPERTY DAMAGE CAUSED BY THE USE OR APPLICATION OF THE INFORMATION CONTAINED HEREIN, ANY INCIDENTAL OR CONSEQUENTIAL DAMAGES, EXPENSES, LOST PROFITS, LOST SAVINGS, OR OTHER DAMAGES ARISING OUT OF THE USE OF OR INABILITY TO USE THIS INFORMATION SUCCESSFULY.
Some states do not a l low the l imi tat ion or exclusion of l iabi l i ty for incidental or consequent ial damages, so the above l imitat ion or exclusion may not apply.
© Copyright , 2004
By DOBLE ENGINEERING COMPANY
All Rights Reserved
72A-1974-01 Rev. B 3/05 14-1
Foreword
This publication is another in a series of reference books and guides prepared by Doble Company staff members, and also by the Doble Company in cooperation with its Client Committees. In 1962, at its Annual Client Conference, the Doble Company scheduled the first of a series of basic lectures on Dielectric Theory and Behavior. This was followed in succeeding years with similar presentations on the application, behavior and deterioration of electrical insulation. The general acceptance and interest shown in these lectures prompted the Doble Company to reprint the series for publication and distribution to its Client Group. It is believed that the contents of this publication will be of value to power-system operators and others concerned with electrical apparatus insulation, its operation, testing and maintenance.
72A-1974-01 Rev. B 3/05 14-1
Table of Contents
Chapter 1 - Dielectric Theory and Practice ...................................................................................................................1 1.1 Introduction ...................................................................................................................................................1 1.2 American Standard Definitions .....................................................................................................................2 1.3 Capacitance....................................................................................................................................................6 1.4 Insulation Losses .........................................................................................................................................12 1.5 Dielectric Phenomena..................................................................................................................................14 1.6 Polarization..................................................................................................................................................14 1.7 Alternating-Current Characteristics.............................................................................................................16 1.8 Ionization And Corona ................................................................................................................................22 1.9 Causes of Dielectric Failure.........................................................................................................................25 1.10 Dielectric Measurements .............................................................................................................................26
Chapter 2 - Types and Applications - of Electrical Insulation.....................................................................................32 2.1 Introduction .................................................................................................................................................32 2.2 Definitions of Insulating Materials ..............................................................................................................33 2.3 Properties of Insulating Materials................................................................................................................34 2.4 Characteristics and Applications of Insulating Materials ............................................................................34 2.5 Gases ...........................................................................................................................................................35 2.6 Class of Materials (900 C)............................................................................................................................40 2.7 Class A Materials (105°C)...........................................................................................................................43 2.8 Underground Power Cables.........................................................................................................................56 2.9 Class C Insulation (No Temperature Limit Selected)..................................................................................68
Chapter 3 - Discussion of the Deterioration of Insulation - and it’s Detection...........................................................76 3.1 Introduction .................................................................................................................................................76
Chapter 4 - Mechanisms of the Electric Breakdown of Dielectric .............................................................................82 4.1 Introduction .................................................................................................................................................82 4.2 Gases ...........................................................................................................................................................82 4.3 Liquid Dielectrics ........................................................................................................................................92 4.4 Solid Dielectrics ..........................................................................................................................................96 4.5 Summary ...................................................................................................................................................116 4.6 Conclusion.................................................................................................................................................117 6.3 6.1 Introduction .........................................................................................................................................128 6.4 6.2 Corona Wave Form .............................................................................................................................131 6.5 Equivalent Corona Circuit .........................................................................................................................131 6.6 Ionization in Thin Voids............................................................................................................................132 6.7 Thickness of Thin Voids............................................................................................................................135 6.8 Zig-Zag Tangential Failures ......................................................................................................................135 6.9 Thin Voids in Laminated Insulation ..........................................................................................................136 6.10 Power Loss in Thin Voids .........................................................................................................................136 6.11 Internal Ionization in the Slots of Electrical Machinery ............................................................................137 6.12 Voids in Power Cables ..............................................................................................................................138 6.13 Thickness of Voids within Cable Insulation..............................................................................................139 6.14 Extruded and Molded Insulations..............................................................................................................140 6.15 Encapsulated Transformers .......................................................................................................................141 6.16 External Ionization ....................................................................................................................................142 6.17 Bibliography..............................................................................................................................................143
Chapter 7 - Capacitance Concepts.............................................................................................................................145 8.1 Introduction ...............................................................................................................................................152 8.2 Electric Conductors ...................................................................................................................................152 8.3 Insulators ...................................................................................................................................................153 8.4 Polarization................................................................................................................................................157 8.5 Dielectric Losses .......................................................................................................................................160 8.6 Deterioration and Temperature..................................................................................................................165 8.7 Power Losses in Bushings .........................................................................................................................166
72A-1974-01 Rev. B 3/05 14-1
8.8 The U-Shaped Power-Factor Characteristic ..............................................................................................168 8.9 Table of Multipliers for Converting Power Factors to 20°C Temperature ................................................171
Chapter 9 - DC Testing of Insulation and High Voltage DC Withstand Testing......................................................174 9.1 Introduction ...............................................................................................................................................174 9.2 Discharge...................................................................................................................................................177 9.3 Insulation Resistance .................................................................................................................................177 9.4 Polarization Index......................................................................................................................................177 9.5 Electroendosmosis (Electric Endosmose*)................................................................................................178 9.6 DC Charge and Discharge Characteristics with Reversed Polarity of Large Turbo-Generators ...............181 9.7 High-Voltage Insulation Under Direct-and Alternating-Current Testing .................................................184 9.8 Transformer Oil .........................................................................................................................................185 9.9 Composite Insulation.................................................................................................................................189 9.10 References .................................................................................................................................................193
Chapter 10 - Induced Voltage on De-Energized Lines and Equipment....................................................................194 10.1 Introduction ...............................................................................................................................................194 10.2 Equipotential Surface ................................................................................................................................198 10.3 Overhead Power Lines...............................................................................................................................198 10.4 Method of Images......................................................................................................................................200 10.5 Potential in Field Betwee Energized Conductor and Earth........................................................................202 10.6 Field Produced by Three-Phase Line.........................................................................................................206 10.7 Capacitive Coupling ..................................................................................................................................207 10.8 Electromagnetic Induction.........................................................................................................................212 10.9 References .................................................................................................................................................216
Chapter 11 - Lightning ...........................................................................................................................................217 11.1 Introduction ...............................................................................................................................................217 11.2 Origin of Lightning and it’s Formation in the Clouds *(I) To (8) ..................................................................217 11.3 Lightning by Induction ..............................................................................................................................218 11.4 Lightning Strokes (1) - (8) .............................................................................................................................219 11.5 Lightning Stroke on Line...........................................................................................................................224 11.6 Velocities of Strokes..................................................................................................................................225 11.7 Current and Energy of Lightning...............................................................................................................225 11.8 Measuring Lightning .................................................................................................................................226 11.9 Nonrinder-Relay Oscillograph...................................................................................................................226 11.10 Cathode-Ray Tube Oscillograph ...............................................................................................................228 11.11 The Klydonograph (l), (2), (14) ....................................................................................................................229 11.12 Magnetic Surge Crest Ammeter(15) ............................................................................................................231 11.13 Lightning Waves on Transmission Lines ..................................................................................................232 11.14 Surge Generators - Artificial Lightning.....................................................................................................233 11.15 Impulse Wave Shapes................................................................................................................................235 11.16 Chopped Waves (24)....................................................................................................................................237 11.17 Lightning Damage .....................................................................................................................................239 11.18 Lightning Protection – Lightning Arresters...............................................................................................240 11.19 Types of Lightning Arresters.....................................................................................................................242 11.20 Insulation Coordination .............................................................................................................................244 11.21 Summary ...................................................................................................................................................245 11.22 Bibliography..............................................................................................................................................246
Chapter 12 - Ferroresonance......................................................................................................................................248 12.1 Introduction ...............................................................................................................................................248 12.2 References .................................................................................................................................................278 12.3 Appendix ...................................................................................................................................................280
Chapter 13 - Measurement of Exciting Current to Detect Damage in Three-Phase Transformers..........................283 13.1 Introduction ...............................................................................................................................................283 13.2 The Ust1 Method for Measuring the Exciting Currentin Individual Windings.........................................285 13.3 Two Windings in Parallel – The Third Short Circuited.............................................................................291 13.4 Series-Parallel Method ..............................................................................................................................296 13.5 References .................................................................................................................................................300
72A-1974-01 Rev. B 3/05 14-1
Chapter 14 – Displaced and Damaged Transformer Coils and Their Detection.......................................................302 14.1 Introduction ...............................................................................................................................................302 14.2 Electromechanical Forces Acting On Transformer Windings ...................................................................305 14.2.1 Radial Forces .............................................................................................................................................306 14.2.2 Axial Forces...............................................................................................................................................307 14.3 Compression in an Energized Coil ............................................................................................................309 14.3.1 Core-Type Transformers ...........................................................................................................................310 14.3.2 Shell-Type Transformers ...........................................................................................................................310 14.3.3 Capacitance................................................................................................................................................311 14.4 Effects of Displacements of Windings on Transformer Parameters ..........................................................312 14.5 Diagnostic Methods for Damage Detection...............................................................................................313
Chapter 15 - Corona Discharge in Generator Slots and its Measurement .................................................................326 15.1 Summary ...................................................................................................................................................326 15.2 Ionization of a Gas.....................................................................................................................................326 15.3 Generator Slot Insulation...........................................................................................................................327 15.4 Deterioration Process.................................................................................................................................328 15.5 Corona-Discharge Measurements..............................................................................................................329 15.6 Capacitance................................................................................................................................................329 15.7 Power Factor..............................................................................................................................................329 15.8 Slot Probes.................................................................................................................................................330 15.9 Corona and Pulse Discharge......................................................................................................................332 15.10 Attenuation Of Pulses................................................................................................................................333 15.11 Procedure For Probe Testing .....................................................................................................................334 15.12 Effect of Time on Mica-Insulati on Corona Discharge..............................................................................335 15.13 Effect of Rotor...........................................................................................................................................335 15.14 Coil Reversal .............................................................................................................................................336 15.15 Trapezoidal Characteristic .........................................................................................................................338 15.16 General Results Of Probe Tests .................................................................................................................339 15.17 Conclusions ...............................................................................................................................................339 15.18 References .................................................................................................................................................340
Chapter 16 – Restricted Ionization in High Voltage Insulation.................................................................................341 16.1 Summary ...................................................................................................................................................341 16.2 Ionization in Impregnated-Paper Insulation ..............................................................................................341 16.3 Equations of Power Characteristics ...........................................................................................................344 16.4 Experimental Investigation of Restricted Ionization .................................................................................347 16.5 Results .......................................................................................................................................................349 16.6 Parallel Artificial Ionization Gap...............................................................................................................352 16.7 ASTM Method B13-16.................................................................................................................................353 16.8 Linear Ionization Power Characteristics....................................................................................................355 16.9 Definitions .................................................................................................................................................355 16.10 References .................................................................................................................................................355
72A-1974-01 Rev. B 3/05 1-1
Chapter 1 - Dielectric Theory and Practice Professor C. L. Dawes and E. H. Povey
Doble Engineering Company
1.1 Introduction In the domain of electrical technology there are three fundamental circuits: the electric circuit, the dielectric circuit and the magnetic circuit. These three circuits are analogous in many respects. For example, there is a driving force in each: electromotive force (E) in both the electric and the dielectric circuits and magnetomotive force (F) in the magnetic circuit. Electric flux ψ in the dielectric circuit and magnetic flux φ in the magnetic circuit correspond to current I in the electric circuit. Both dielectric “resistance” S and magnetic “resistance” ℜ correspond to electric resistance R. The formulas for each of these
resistances are similar; for example, R= p L/A; S=r∈
1 ; and ℜ=rµ
1 L/A where p is
resistivity, r∈ is ureleative capacitivity and or µr is relative permeability, each of its own particular medium. L is the length of the circuit having uniform cross section A. Also, each circuit conforms to Ohm’s Law: for example, I=E/R; ψ = E/S; φ = F/ℜ. The practical treatment of these circuits differs. For example, the electric circuit almost always consists of wire in which the length is very great in comparison with the cross-sectional dimensions and the current is confined to the wire so that its path is very definite. In both the dielectric and magnetic circuits the length of the path is short relative to the cross-sectional dimensions. The paths usually are quite irregular and there is a large proportion of leakage flux usually into the air. Moreover, in the usual electric circuit ρ the resistively is well known and is constant at any given temperature whereas in the magnetic circuit µr depends on the flux density as well as the previous history of the iron and may vary in a ratio as high as 100 to 1. Thus it is much more difficult to make precise calculations for the dielectric and the magnetic circuits than for the electric circuit. Furthermore, electric current is readily measured as by the insertion of an ammeter in the circuit. There is no such simple method for measuring electric and magnetic flux. The dielectric circuit differs further from both the electric circuit and the magnetic circuit in three respects: in its design, its predictability and its reliability. For example, electrical conductors can be selected to carry any designated current safely and indefinitely without damage to the conductor itself, barring overheating caused by some external effect such as short-circuit or lightning currents. Likewise, a magnetic circuit operates indefinitely without injury to the magnetic medium, no matter how high values the flux may attain. However, in the dielectric circuit, particularly at high voltages, no matter how conservatively the circuit may be designed, performance is more or less unpredictable as evidenced by the frequent failures of insulation, which occur in electric systems. Moreover the magnetic circuit can carry an indefinite amount of flux without injury. This is not true of the dielectric circuit for when the value of the electric flux exceeds some critical value, it causes breakdown of the dielectric. Through the years leading scientists such as chemists, physicists and engineers have worked unceasingly on research to
72A-1974-01 Rev. B 3/05 1-2
determine the mechanism of dielectric breakdown and its prevention, and although much has been learned, there is still much which is not as yet understood. The following discussion will be devoted almost entirely to the dielectric circuit describing the elements and phenomena which determine the charging currents, the dielectric losses, the power factor, the loss factor, the electric stresses and dielectric breakdown. Also discussed are the applications of dielectrics to capacitors, bushings and cables. The dielectric circuit involves several terms and parameters, and a better understanding of its characteristics and performance is obtained if these terms are defined. The following definitions are based on a late draft of Group 05 of the American Standard Definitions of Electrical Terms now in the last stages of revision, but not as yet published.
1.2 American Standard Definitions
Capacitance (Capacity)* Capacitance is that property of a capacitor or of a system of conductors and dielectrics, which permits the storage of electrically separated charges when potential differences exist between the conductors. The capacitance of a capacitor is defined to be the ratio of the electric charge that has been transferred from one electrode to the other to the resulting difference of potential between the electrodes. The value of this ratio is independent of the magnitude of the transferred charge.
)(
)()(
coulomb
voltVQfaradC =
Capacitor (Condenser)* A capacitor is a device consisting of two insulated conductors A and B each having an extended surface which is exposed to the surface of the other but separated from it by a layer (generally thin) of insulating medium which is so arranged and used that the electric charge on conductor A is equal but opposite in kind to the charge on B. The two conductors are called the electrodes of the capacitor. By the charge in the capacitor is meant the electric charge that may be thought of as having been transferred from one electrode to the other.
Conduction Current The conduction current Ic through a surface in an imperfect, isotropic dielectric is the current, which is proportional to the potential gradient. The conduction current is not dependent on the time that the electric field has been applied to the dielectric, and hence is measured after the electric field has remained unchanged for so long a time that the current has become constant. The general equation fn, the conduction current is
( )AmperesdAEp
Ic )(1∫ ∫=
Where ρ is the resistively of the dielectric, E is the electric intensity at an element of surface A and the integral of the scalar product is taken over the entire surface. *Deprecated
72A-1974-01 Rev. B 3/05 1-3
Dielectric A dielectric is a medium in which it is possible to produce and maintain an electric field with little or no supply of energy from outside sources. The energy required to produce the electric field is recoverable, in whole or in part, when the field is removed. Vacuums, as well as all insulating materials are dielectrics.
Perfect Dielectric (Ideal Dielectric) A perfect dielectric is a dielectric in which all of the energy required to establish an electric field in the dielectric is recoverable when the field or impressed voltage is removed. Therefore, a perfect dielectric has zero conductivity and all absorption phenomena are absent. A high vacuum is the only known perfect dielectric.
Imperfect Dielectric An imperfect dielectric is a dielectric in which a part of the energy required to establish an electric field in the dielectric is not returned to the electric system when the field is removed. The energy, which is not returned, is converted into heat in the dielectric.
Dielectric Absorption Dielectric absorption is a phenomenon, which occurs, in imperfect dielectrics whereby positive and negative charges are separated and then accumulated at certain regions within the volume of the dielectric. This phenomenon manifests itself usually as a gradually decreasing current with time after the applications of a fixed do voltage.
Dielectric Constant, Symbol: ∈, ∈1, ∈r (Capacitivity) (Permittivity) (Specific Inductive Capacitance)* The (relative) dielectric constant of any medium is the ratio of the capacitance of a given configuration of electrodes with the medium as a dielectric, to the capacitance of the same configuration with a vacuum as the dielectric between the electrodes.
Note The value of the absolute dielectric constant depends on the system of units used. When not otherwise stated, reference to the dielectric constant is to the relative value defined above.
Dielectric Dissipation Factor, Symbol: tan δ, (D) The dissipation factor is the tangent of the loss angle or the cotangent of the phase angle of the dielectric.
Dielectric Loss Dielectric loss is the time rate at which electric energy is transformed into heat in a dielectric when it is subjected to an electric field. The heat generated per unit volume of material upon the application of sinusoidal voltage is given in terms of watts by the expression:
W = 5/9 Є " f E2 x 10-12 watts/cm 3
Where E is the gradient in volts per cm, f is the frequency, and Є " is the loss factor.
72A-1974-01 Rev. B 3/05 1-4
Dielectric Loss Angle, Symbol: δ (Dielectric Phase Difference) Dielectric loss angle is the difference between ninety degrees (90°) and the dielectric phase angle.
Dielectric Loss Factor, Symbol: Є" (Dielectric Loss Index) The dielectric loss factor of a material is the product of its (relative) dielectric constant and its dissipation factor, (tangent of the dielectric loss angle).
Dielectric Phase Angle, Symbol: θ Dielectric phase angle is the angular difference in phase between the sinusoidal alternating potential difference applied to a dielectric and the component of the resulting alternating current having the same period as the potential difference.
Dielectric Power Factor, Symbol: Cos θ , Sin δ The dielectric power factor of a material is the ratio of the power dissipated in the material in watts to the product of the effective voltage and current in volt-amperes when tested under a sinusoidal voltage and prescribed conditions. Numerically is may be expressed as the cosine of the dielectric phase angle (or sine of the dielectric loss angle.)
Dielectric Strength (Electric Strength) (Breakdown Strength) The dielectric strength of a material is the potential gradient at which electrical failure or breakdown occurs. To obtain the true dielectric strength the actual maximum gradient must be considered, or the test piece and electrodes must be designed so that uniform gradient is obtained. The value obtained for the dielectric strength in practical tests will usually depend on the thickness of the material and on the method and conditions of test.
Electric Charge, Symbol : Q (Charge) (Quantity of Electricity)* The electric charge on (or in) a body or within a closed surface is the excess of one kind of electricity over the other kind. A plus sign indicates that the positive electricity is in excess; a minus sign indicates that the negative is in excess.
*Deprecated
Electric Displacement Symbol: ψ (Electric Flux) The electric displacement outward through a surface is the surface integral of the normal outward component of the electric displacement density over the surface.
Note The electric displacement outward through a closed surface is equal to K times the total electric conduction charge enclosed.
72A-1974-01 Rev. B 3/05 1-5
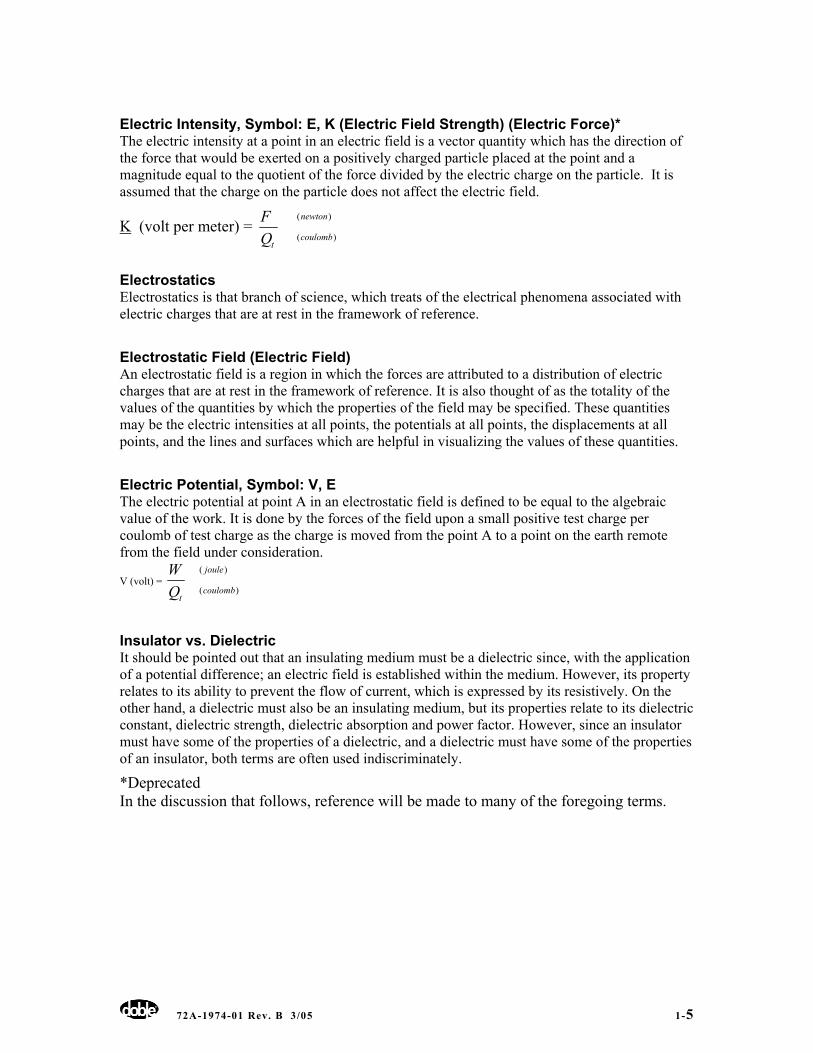
Electric Intensity, Symbol: E, K (Electric Field Strength) (Electric Force)* The electric intensity at a point in an electric field is a vector quantity which has the direction of the force that would be exerted on a positively charged particle placed at the point and a magnitude equal to the quotient of the force divided by the electric charge on the particle. It is assumed that the charge on the particle does not affect the electric field.
K (volt per meter) = )(
)(
newton
coulombtQ
F
Electrostatics Electrostatics is that branch of science, which treats of the electrical phenomena associated with electric charges that are at rest in the framework of reference.
Electrostatic Field (Electric Field) An electrostatic field is a region in which the forces are attributed to a distribution of electric charges that are at rest in the framework of reference. It is also thought of as the totality of the values of the quantities by which the properties of the field may be specified. These quantities may be the electric intensities at all points, the potentials at all points, the displacements at all points, and the lines and surfaces which are helpful in visualizing the values of these quantities.
Electric Potential, Symbol: V, E The electric potential at point A in an electrostatic field is defined to be equal to the algebraic value of the work. It is done by the forces of the field upon a small positive test charge per coulomb of test charge as the charge is moved from the point A to a point on the earth remote from the field under consideration.
V (volt) = )(
)(
joule
coulombtQ
W
Insulator vs. Dielectric It should be pointed out that an insulating medium must be a dielectric since, with the application of a potential difference; an electric field is established within the medium. However, its property relates to its ability to prevent the flow of current, which is expressed by its resistively. On the other hand, a dielectric must also be an insulating medium, but its properties relate to its dielectric constant, dielectric strength, dielectric absorption and power factor. However, since an insulator must have some of the properties of a dielectric, and a dielectric must have some of the properties of an insulator, both terms are often used indiscriminately.
*Deprecated In the discussion that follows, reference will be made to many of the foregoing terms.
72A-1974-01 Rev. B 3/05 1-6
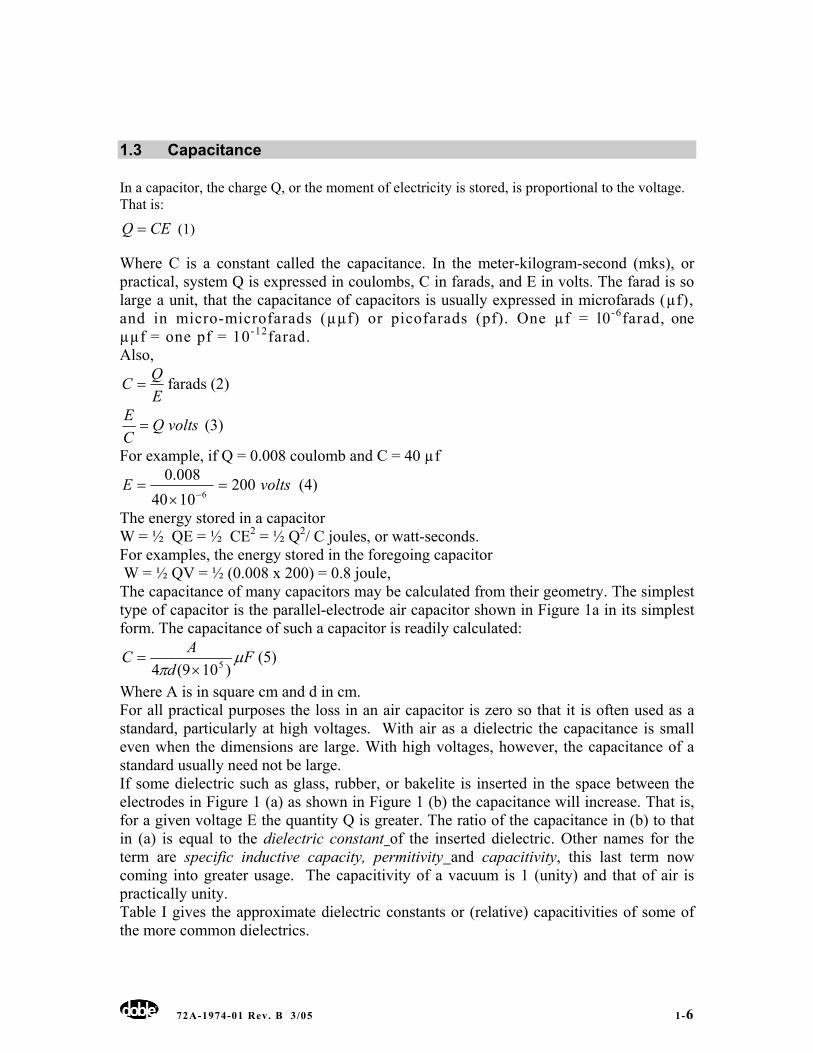
1.3 Capacitance
In a capacitor, the charge Q, or the moment of electricity is stored, is proportional to the voltage. That is:
CEQ = (1)
Where C is a constant called the capacitance. In the meter-kilogram-second (mks), or practical, system Q is expressed in coulombs, C in farads, and E in volts. The farad is so large a unit, that the capacitance of capacitors is usually expressed in microfarads (µf), and in micro-microfarads (µµf) or picofarads (pf). One µf = l0-6farad, one µµf = one pf = 10-12farad. Also,
EQC = farads (2)
voltsQCE
= (3)
For example, if Q = 0.008 coulomb and C = 40 µf
voltsE 2001040008.0
6=
×=
− (4)
The energy stored in a capacitor W = ½ QE = ½ CE2 = ½ Q2/ C joules, or watt-seconds. For examples, the energy stored in the foregoing capacitor W = ½ QV = ½ (0.008 x 200) = 0.8 joule, The capacitance of many capacitors may be calculated from their geometry. The simplest type of capacitor is the parallel-electrode air capacitor shown in Figure 1a in its simplest form. The capacitance of such a capacitor is readily calculated:
Fd
AC µπ )109(4 5×
= (5)
Where A is in square cm and d in cm. For all practical purposes the loss in an air capacitor is zero so that it is often used as a standard, particularly at high voltages. With air as a dielectric the capacitance is small even when the dimensions are large. With high voltages, however, the capacitance of a standard usually need not be large. If some dielectric such as glass, rubber, or bakelite is inserted in the space between the electrodes in Figure 1 (a) as shown in Figure 1 (b) the capacitance will increase. That is, for a given voltage E the quantity Q is greater. The ratio of the capacitance in (b) to that in (a) is equal to the dielectric constant of the inserted dielectric. Other names for the term are specific inductive capacity, permitivity and capacitivity, this last term now coming into greater usage. The capacitivity of a vacuum is 1 (unity) and that of air is practically unity. Table I gives the approximate dielectric constants or (relative) capacitivities of some of the more common dielectrics.
72A-1974-01 Rev. B 3/05 1-7
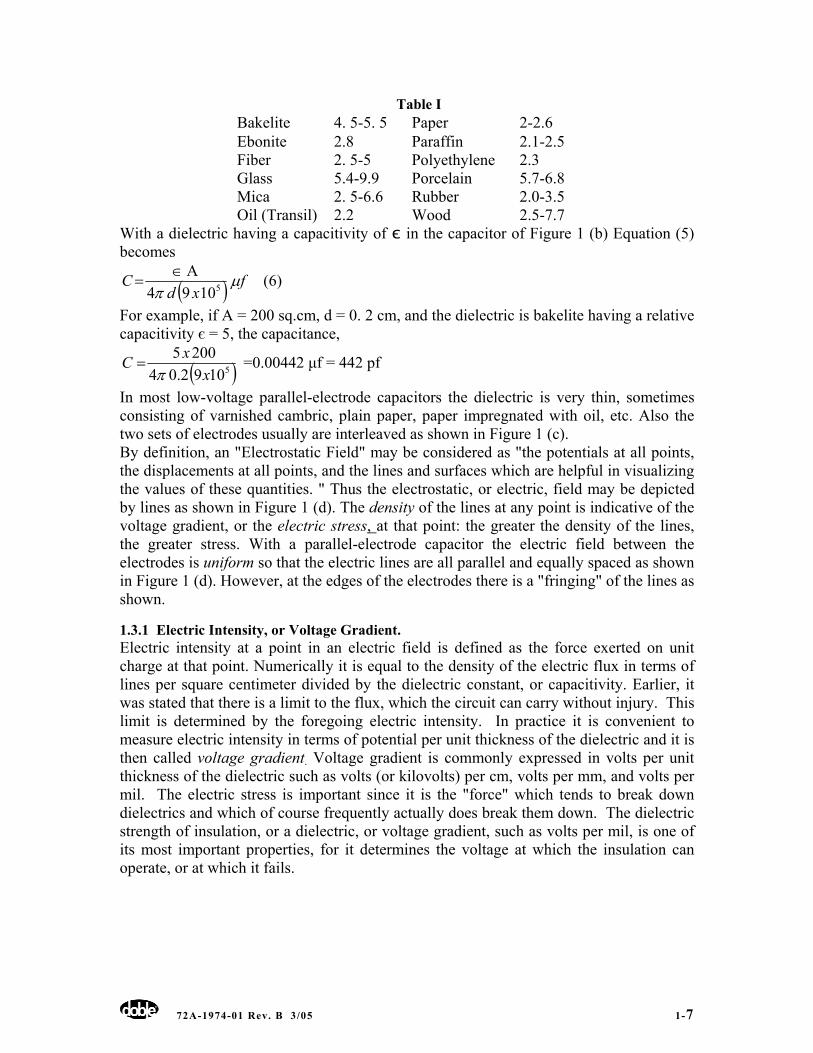
Table I Bakelite 4. 5-5. 5 Paper 2-2.6 Ebonite 2.8 Paraffin 2.1-2.5 Fiber 2. 5-5 Polyethylene 2.3 Glass 5.4-9.9 Porcelain 5.7-6.8 Mica 2. 5-6.6 Rubber 2.0-3.5 Oil (Transil) 2.2 Wood 2.5-7.7
With a dielectric having a capacitivity of є in the capacitor of Figure 1 (b) Equation (5) becomes
( ) fxd
C µπ 51094
Α∈= (6)
For example, if A = 200 sq.cm, d = 0. 2 cm, and the dielectric is bakelite having a relative capacitivity є = 5, the capacitance,
( )51092.042005
xxC
π= =0.00442 µf = 442 pf
In most low-voltage parallel-electrode capacitors the dielectric is very thin, sometimes consisting of varnished cambric, plain paper, paper impregnated with oil, etc. Also the two sets of electrodes usually are interleaved as shown in Figure 1 (c). By definition, an "Electrostatic Field" may be considered as "the potentials at all points, the displacements at all points, and the lines and surfaces which are helpful in visualizing the values of these quantities. " Thus the electrostatic, or electric, field may be depicted by lines as shown in Figure 1 (d). The density of the lines at any point is indicative of the voltage gradient, or the electric stress, at that point: the greater the density of the lines, the greater stress. With a parallel-electrode capacitor the electric field between the electrodes is uniform so that the electric lines are all parallel and equally spaced as shown in Figure 1 (d). However, at the edges of the electrodes there is a "fringing" of the lines as shown.
1.3.1 Electric Intensity, or Voltage Gradient. Electric intensity at a point in an electric field is defined as the force exerted on unit charge at that point. Numerically it is equal to the density of the electric flux in terms of lines per square centimeter divided by the dielectric constant, or capacitivity. Earlier, it was stated that there is a limit to the flux, which the circuit can carry without injury. This limit is determined by the foregoing electric intensity. In practice it is convenient to measure electric intensity in terms of potential per unit thickness of the dielectric and it is then called voltage gradient. Voltage gradient is commonly expressed in volts per unit thickness of the dielectric such as volts (or kilovolts) per cm, volts per mm, and volts per mil. The electric stress is important since it is the "force" which tends to break down dielectrics and which of course frequently actually does break them down. The dielectric strength of insulation, or a dielectric, or voltage gradient, such as volts per mil, is one of its most important properties, for it determines the voltage at which the insulation can operate, or at which it fails.
72A-1974-01 Rev. B 3/05 1-8
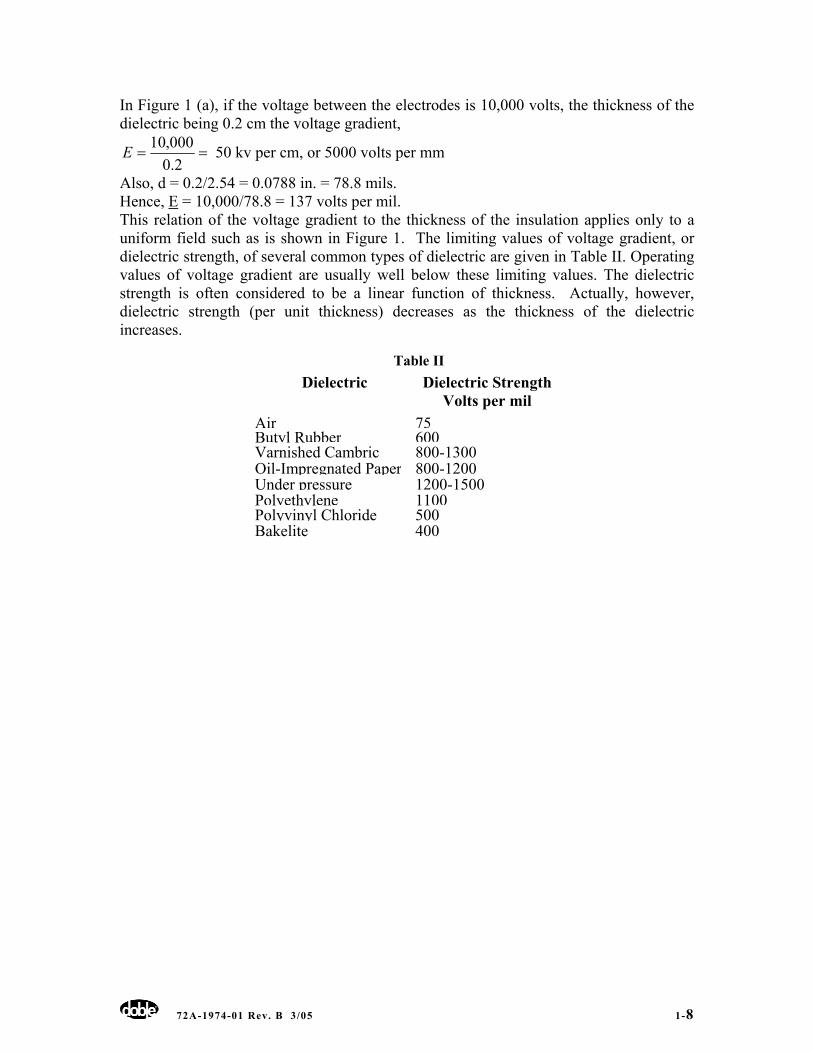
In Figure 1 (a), if the voltage between the electrodes is 10,000 volts, the thickness of the dielectric being 0.2 cm the voltage gradient,
==2.0
000,10E 50 kv per cm, or 5000 volts per mm
Also, d = 0.2/2.54 = 0.0788 in. = 78.8 mils. Hence, E = 10,000/78.8 = 137 volts per mil. This relation of the voltage gradient to the thickness of the insulation applies only to a uniform field such as is shown in Figure 1. The limiting values of voltage gradient, or dielectric strength, of several common types of dielectric are given in Table II. Operating values of voltage gradient are usually well below these limiting values. The dielectric strength is often considered to be a linear function of thickness. Actually, however, dielectric strength (per unit thickness) decreases as the thickness of the dielectric increases.
Table II Dielectric
Dielectric Strength
Volts per mil Air 75Butyl Rubber 600Varnished Cambric 800-1300Oil-Impregnated Paper 800-1200Under pressure 1200-1500Polyethylene 1100Polyvinyl Chloride 500Bakelite 400
72A-1974-01 Rev. B 3/05 1-9
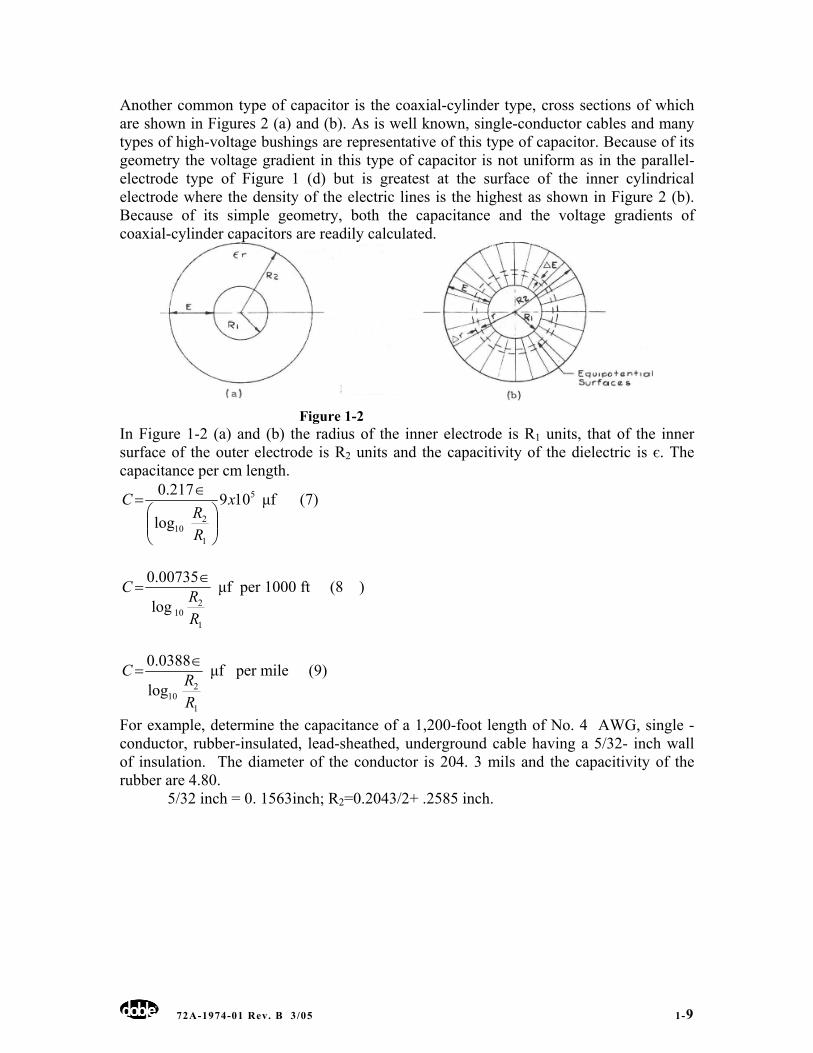
Another common type of capacitor is the coaxial-cylinder type, cross sections of which are shown in Figures 2 (a) and (b). As is well known, single-conductor cables and many types of high-voltage bushings are representative of this type of capacitor. Because of its geometry the voltage gradient in this type of capacitor is not uniform as in the parallel-electrode type of Figure 1 (d) but is greatest at the surface of the inner cylindrical electrode where the density of the electric lines is the highest as shown in Figure 2 (b). Because of its simple geometry, both the capacitance and the voltage gradients of coaxial-cylinder capacitors are readily calculated.
Figure 1-2
In Figure 1-2 (a) and (b) the radius of the inner electrode is R1 units, that of the inner surface of the outer electrode is R2 units and the capacitivity of the dielectric is є. The capacitance per cm length.
5
1
210
109log
217.0 x
RR
C
⎟⎟⎠
⎞⎜⎜⎝
⎛∈
= µf (7)
1
210log
00735.0
RRC ∈
= µf per 1000 ft (8 )
1
210log
0388.0
RRC ∈
= µf per mile (9)
For example, determine the capacitance of a 1,200-foot length of No. 4 AWG, single -conductor, rubber-insulated, lead-sheathed, underground cable having a 5/32- inch wall of insulation. The diameter of the conductor is 204. 3 mils and the capacitivity of the rubber are 4.80.
5/32 inch = 0. 1563inch; R2=0.2043/2+ .2585 inch.
72A-1974-01 Rev. B 3/05 1-10
Using Equation
1022.02585.0log
80.400735.02.110
xC = = 53.2log
0353.02.110
(10)
403.00353.02.1= = 0.105 µf
Fundamentally, the voltage gradient at any radius r within the dielectric is the ratio of a voltage ∆ E across a very thin layer ∆ r at radius r of the insulation to ∆ r, Figure 2 (b), that is, it is equal to ∆ E / ∆r.
1
210log
434.0
RRr
Ε=Ε (11)
With a homogenous dielectric the voltage gradient at radius r is given by where E is the voltage between the electrodes, R2 is the inner radius of the outer electrode and R1 is the radius of the inner electrode. If r is in mils, E is in volts per mil Equation (10) shows that the voltage gradient varies inversely as the radius r, so that it is a maximum at the surface of the inner cylinder. When r is a minimum and the gradient is a minimum at the inner surface of the outer cylinder where r is a maximum. The variation in gradient is also shown in Figure 2 (b) by the varying density of the electric lines. For the foregoing example determine the gradient in volts per mil at the surface of the conductor (El ) and at the inner surface of the sheath (E2) when the applied Voltage E is 5,000 volts. Using Equation (10), at the conductor surface
1022.02585.0log2.102
000,5434.0
10
xE = = 4031.02.102
170.2x
=52.6 volts per mil At the inner surface of the sheath
4031.05.258000,5434.0
2 xx
=Ε = 20.8 volts per mil
More as a simple criterion, rather than as a true evaluation of the dielectric, the average stress is often used. For example, under the foregoing conditions, the average stress
3.156000,5
=Εav = 32 volts per mil
It has been noted that from Equation (10) the stress varies inversely as the radius r. It can be shown that with a given voltage E and with R2 constant, a decrease in R1 tends to increase the maximum stress at the surface of the inner cylinder, while at the same time the thickness of the wall of insulation increases which tends to reduce the stress. The minimum stress at the surface of the inner cylinder occurs when the ratio R2 /R1 = 2.718, the Naperian logarithmic base. From the fact that the voltage at the surface of the inner cylinder varies inversely as the
72A-1974-01 Rev. B 3/05 1-11
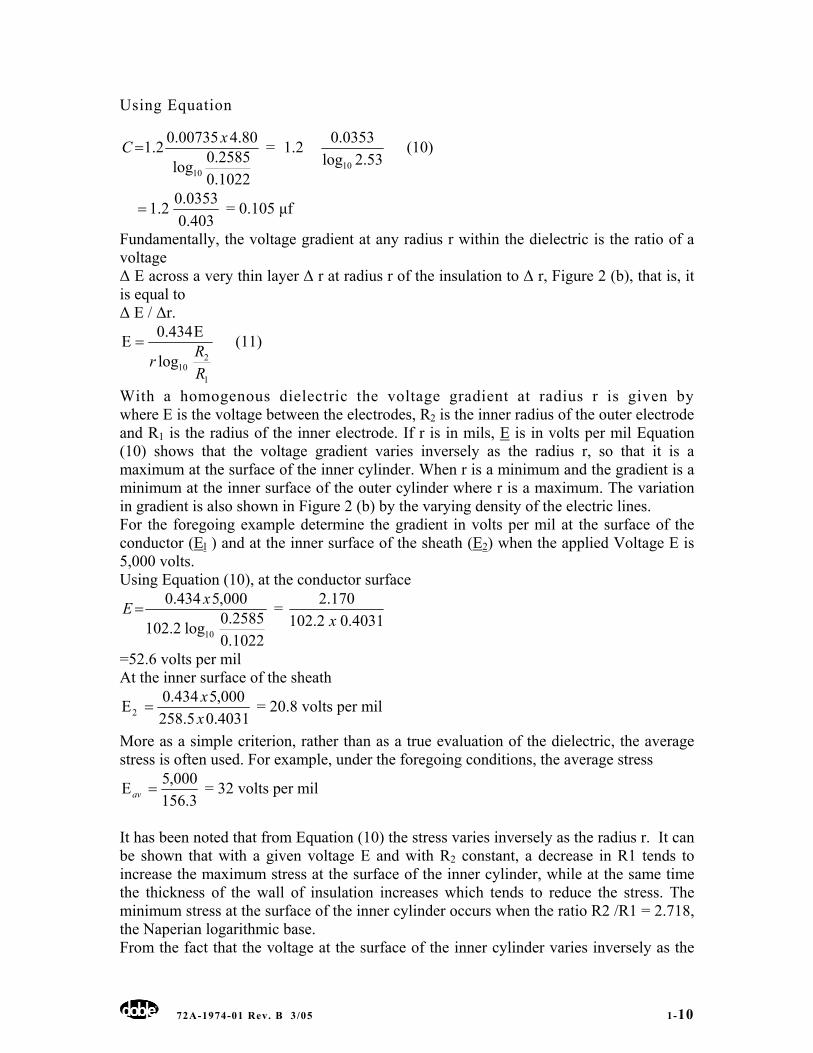
radius of the cylinder, it follows that even with a low voltage, as the radius of the cylinder approaches zero, the gradient at the conductor approaches infinity. Thus, in the application of insulation, sharp corners and points should always be avoided. Figure 1-3 (a) shows the electric lines in insulation applied to a conductor with a rectangular cross section. Note the concentration of the electric lines at the four corners of the conductor, which shows that the insulation at these points is being subjected to a very high electrical stresses. Such corners should of course be rounded. Figure 1-3 (b) shows the effect of a small metallic protuberance on the surface of a conductor. Note how the electric lines concentrate at the sharp tip, causing very high stress in the insulation, which may ulti-mately result in a failure. In air when a high voltage is applied to a metallic point or a wire of small radius. Figure 1-3 (c), the high concentration of electric stress breaks down the air causing ionization, or corona, a reddish-blue discharge. Corona forms on overhead lines at very high voltage and it is difficult to eliminate it not only on the line conductors but also at any corners or projections, such as on the bolt heads and nuts of the hardware used with the suspension clamps. Ionization also causes deterioration of fibrous and other insulations. This will be discussed later.
Figure 1-3
An equipotential surface is one between any two points of which there is no difference of potential. Within a dielectric such a surface is usually fictitious, that is, it is not a physical entity although any equipotential surface can be replaced by a thin conducting sheet without disturbing the electric field. At every point in an. electric field the electric lines and the equipotential surfaces intersect at right angles. In the parallelelectrode capacitor Figure1 (d), the equipotential surfaces are parallel to the two electrodes. In the cylindrical capacitor Figure 1-2 (b), the equipotential surfaces are thin coaxial cylinders; such a surface at radius r is shown. Equipotential surfaces are also shown in Figure 1-3 (a) and (b). The geometry of Figure 1 and Figure 1-2 is such that the capacitance and electric stress can be calculated mathematically. In the majority of the applications of insulation, how-ever, the geometry is usually much more complex and does not render itself to such rel-atively simple calculations. There is, however, a mathematical-geometrical technique called conformal mapping by which many complex electric fields can be resolved into uniform ones such as is shown in Figure 1 (d) and the capacitance and all stresses ac-curately calculated and then transformed back to the original field. Experimentally the electric lines may be simulated by current-flow lines in water, the boundaries of the water
72A-1974-01 Rev. B 3/05 1-12
conforming geometrically to the boundaries of the electric field. Points of equipotential are followed by two probes connected to a millivoltmeter; at equipotential points the millivoltmeter reads zero. Should neither of these methods be applicable it is possible to map the field graphically, more or less by trial and error.
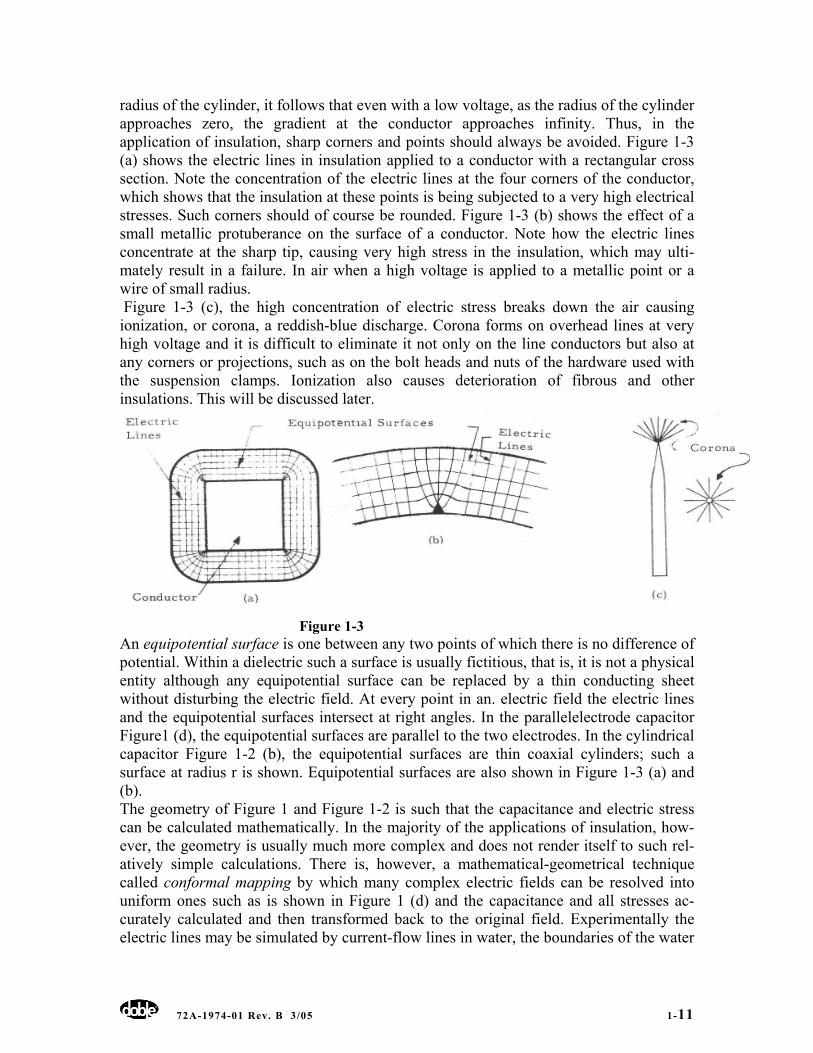
1.4 Insulation Losses In the foregoing definitions of dielectrics such terms as conduction, energy returned to the system and energy loss, power factor and dielectric absorption are all included. The significance of these terms may be understood by a consideration of an elementary circuit. Figure 1-4 shows a source of emf E such as a battery, a switch S, and a capacitor C having a dielectric which may be solid, liquid, or viscous, in series with a galvanometer G. By closing the blade of switch S upwards, the battery is connected to the capacitor through the galvanometer G; by closing the switch blade downwards the capacitor is short-circuited through the galvanometer.
Figure 1-4
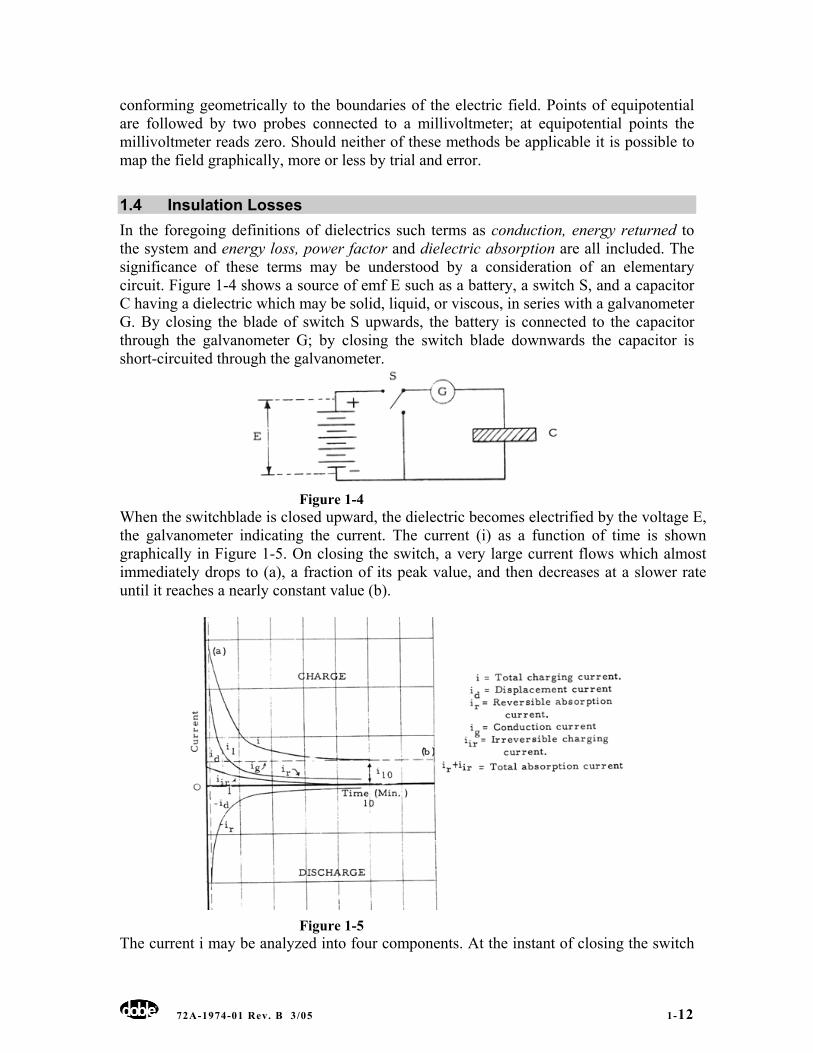
When the switchblade is closed upward, the dielectric becomes electrified by the voltage E, the galvanometer indicating the current. The current (i) as a function of time is shown graphically in Figure 1-5. On closing the switch, a very large current flows which almost immediately drops to (a), a fraction of its peak value, and then decreases at a slower rate until it reaches a nearly constant value (b).
Figure 1-5
The current i may be analyzed into four components. At the instant of closing the switch
72A-1974-01 Rev. B 3/05 1-13
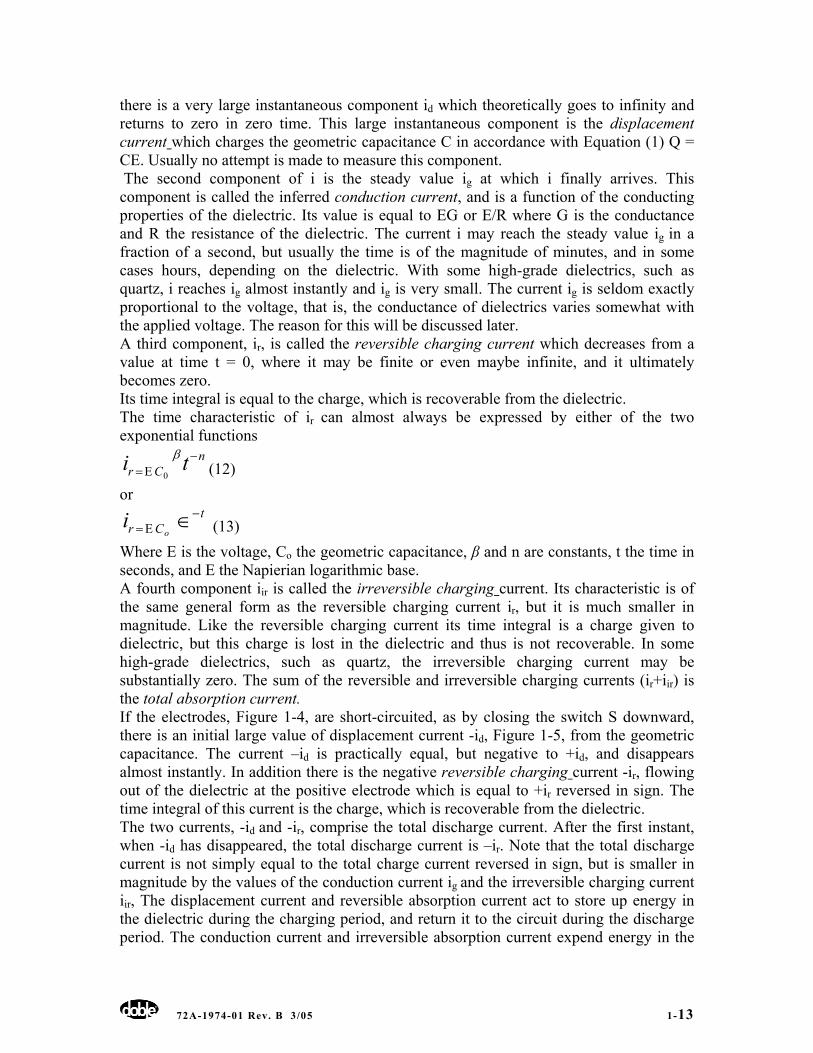
there is a very large instantaneous component id which theoretically goes to infinity and returns to zero in zero time. This large instantaneous component is the displacement current which charges the geometric capacitance C in accordance with Equation (1) Q = CE. Usually no attempt is made to measure this component. The second component of i is the steady value ig at which i finally arrives. This component is called the inferred conduction current, and is a function of the conducting properties of the dielectric. Its value is equal to EG or E/R where G is the conductance and R the resistance of the dielectric. The current i may reach the steady value ig in a fraction of a second, but usually the time is of the magnitude of minutes, and in some cases hours, depending on the dielectric. With some high-grade dielectrics, such as quartz, i reaches ig almost instantly and ig is very small. The current ig is seldom exactly proportional to the voltage, that is, the conductance of dielectrics varies somewhat with the applied voltage. The reason for this will be discussed later. A third component, ir, is called the reversible charging current which decreases from a value at time t = 0, where it may be finite or even maybe infinite, and it ultimately becomes zero. Its time integral is equal to the charge, which is recoverable from the dielectric. The time characteristic of ir can almost always be expressed by either of the two exponential functions
nCr ti −
Ε=β
0 (12) or
tCr o
i −Ε= ∈ (13)
Where E is the voltage, Co the geometric capacitance, β and n are constants, t the time in seconds, and E the Napierian logarithmic base. A fourth component iir is called the irreversible charging current. Its characteristic is of the same general form as the reversible charging current ir, but it is much smaller in magnitude. Like the reversible charging current its time integral is a charge given to dielectric, but this charge is lost in the dielectric and thus is not recoverable. In some high-grade dielectrics, such as quartz, the irreversible charging current may be substantially zero. The sum of the reversible and irreversible charging currents (ir+iir) is the total absorption current. If the electrodes, Figure 1-4, are short-circuited, as by closing the switch S downward, there is an initial large value of displacement current -id, Figure 1-5, from the geometric capacitance. The current –id is practically equal, but negative to +id, and disappears almost instantly. In addition there is the negative reversible charging current -ir, flowing out of the dielectric at the positive electrode which is equal to +ir reversed in sign. The time integral of this current is the charge, which is recoverable from the dielectric. The two currents, -id and -ir, comprise the total discharge current. After the first instant, when -id has disappeared, the total discharge current is –ir. Note that the total discharge current is not simply equal to the total charge current reversed in sign, but is smaller in magnitude by the values of the conduction current ig and the irreversible charging current iir, The displacement current and reversible absorption current act to store up energy in the dielectric during the charging period, and return it to the circuit during the discharge period. The conduction current and irreversible absorption current expend energy in the
72A-1974-01 Rev. B 3/05 1-14
dielectric. In determining insulation resistance it would be rational to make the measurement when the current 1 reaches the conduction current ig. However, the rate of decrease of current I varies widely among the different dielectrics as has already been pointed out. In some dielectrics, such as oiled paper, it may be hours before the current reaches a constant value. Thus, in order to avoid an unreasonable wait for the current to become constant to obtain comparable data. Also, to set a lower limit for the insulation resistance, the value of current is taken after some arbitrary time period, the general practice being to take it at one minute, such as the current il in Figure 5. The polarization index defined as the ratio of the resistance at 10 minutes (R10) to that at one minute (R1), or R10/R1. In Figure 5 this would correspond to the ratio of the current il, at one minute to i10 at 10 minutes, or i1/ i10 since the currents are inversely as the resistances. It would also follow that if an alternating emf were applied to the dielectric there would be a continual charging and discharging of the geometrical capacitance and thus there would be an alternating charging current. In addition, during each half cycle, there would be the same absorptive effects as well as conductive, which occurred during charge and discharge as shown by the curves of Figure 5. These losses, rather than being only momentary, as with the d-c charge and discharge, will be repetitive. Thus at a frequency of 60 cycles per second, there will be 120 periods of charge and 120 periods of discharge second.
1.5 Dielectric Phenomena The foregoing phenomena show that dielectrics have the property of both temporary and permanent absorption of electric charges as well as the property of apparent conduction. From the days of the earliest experimenters such as Franklin and Faraday, attempts have been made to explain this electrical behavior of dielectrics. Both Faraday and Maxwell postulated that the dielectric was made up of minute resistors and capacitors in series-parallel combinations. The charge and discharge characteristics of such a composite dielectric would be exponential, (Equation (l2), the type of function which many of the experimental charge and discharge characteristics follow. Several other similar analogous theories were proposed. However, as experimental data accumulated and measurements were extended over wide frequency and temperature ranges, these relatively simple theories became inadequate, and in the new knowledge of atomic and molecular structure which modern physics and chemistry have developed, they have even become irrational.
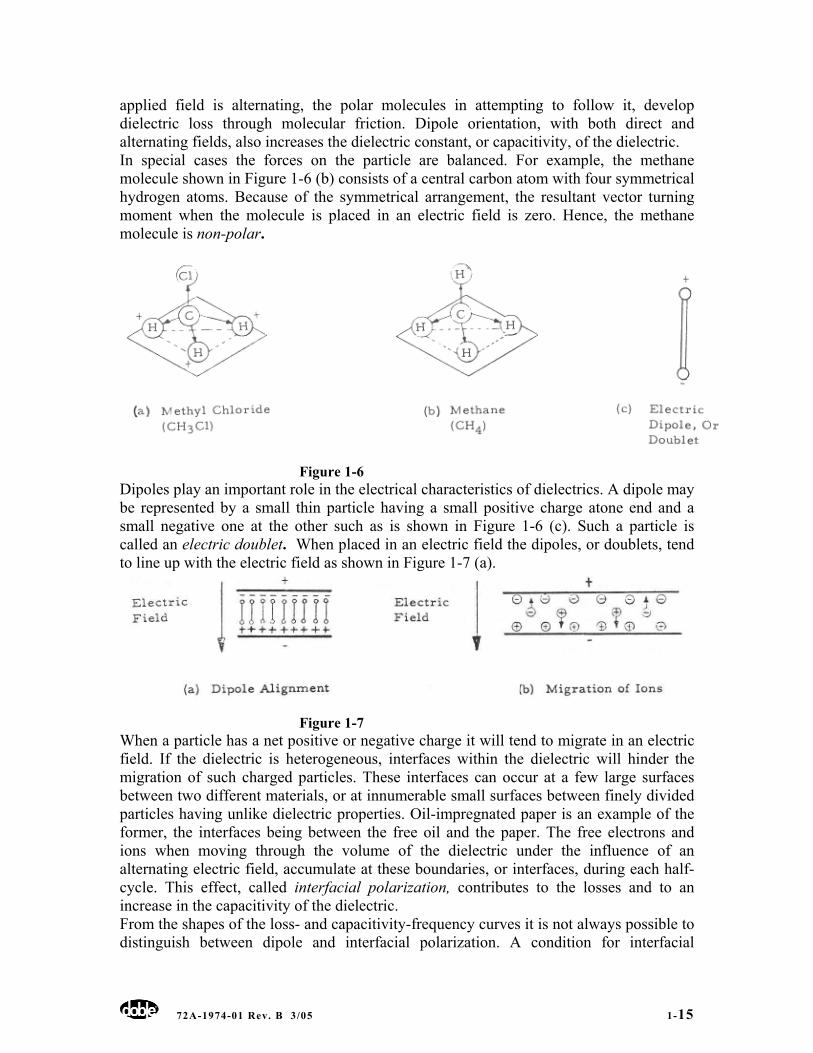
1.6 Polarization When an electric field is applied to a dielectric, forces on the positive and negative charges inherent in the particles, which make up the dielectric, tend to orient the particles in line with the field. Consider the methyl-chloride molecule shown in Figure 1-6 (a). This consists of a central carbon atom, three hydrogen atoms having a positive charge, and one chlorine atom having a negative charge. It is clear that with this unsymmetrical arrangement of charges, when such a molecule is placed in an electric field, it will develop a vector turning moment. Such a molecule is called a dipole, and its behavior in an electric field is called dipole polarization. When a direct-current field is applied there is a time lag before the polar molecules become aligned with the electric field. If the
72A-1974-01 Rev. B 3/05 1-15
applied field is alternating, the polar molecules in attempting to follow it, develop dielectric loss through molecular friction. Dipole orientation, with both direct and alternating fields, also increases the dielectric constant, or capacitivity, of the dielectric. In special cases the forces on the particle are balanced. For example, the methane molecule shown in Figure 1-6 (b) consists of a central carbon atom with four symmetrical hydrogen atoms. Because of the symmetrical arrangement, the resultant vector turning moment when the molecule is placed in an electric field is zero. Hence, the methane molecule is non-polar.
Figure 1-6
Dipoles play an important role in the electrical characteristics of dielectrics. A dipole may be represented by a small thin particle having a small positive charge atone end and a small negative one at the other such as is shown in Figure 1-6 (c). Such a particle is called an electric doublet. When placed in an electric field the dipoles, or doublets, tend to line up with the electric field as shown in Figure 1-7 (a).
Figure 1-7
When a particle has a net positive or negative charge it will tend to migrate in an electric field. If the dielectric is heterogeneous, interfaces within the dielectric will hinder the migration of such charged particles. These interfaces can occur at a few large surfaces between two different materials, or at innumerable small surfaces between finely divided particles having unlike dielectric properties. Oil-impregnated paper is an example of the former, the interfaces being between the free oil and the paper. The free electrons and ions when moving through the volume of the dielectric under the influence of an alternating electric field, accumulate at these boundaries, or interfaces, during each half-cycle. This effect, called interfacial polarization, contributes to the losses and to an increase in the capacitivity of the dielectric. From the shapes of the loss- and capacitivity-frequency curves it is not always possible to distinguish between dipole and interfacial polarization. A condition for interfacial
72A-1974-01 Rev. B 3/05 1-16
polarization is an inequality in the product of the capacitivity and resistivity for at least two of the materials composing the dielectric. That is
2211 ρρ ∈≠∈ (14) Where єl and є2 are the respective capacitivities of the two dielectrics and ρl and ρ2 their respective resistivities. Charged particles, such as are shown in Figure 1-7 (b), which are not interrupted by interfacial barriers, and make their way through the dielectric from one electrode to the other, constitute the conduction, or leakage, current and are not a part of the polarization phenomenon. Electronic polarization is due to the distortion in the atom of the orbital electrons with respect to the atomic nucleus. This polarization is essentially instantaneous and occurs at optical frequencies so that as far as usual dielectric phenomena are concerned its effect is negligible. Atomic polarization is not thoroughly understood but appears to be due to the dis-placement of the atoms within the molecules and occurs in the infrared frequencies. So far as the usual dielectric phenomena are concerned, its effect is negligible.
1.7 Alternating-Current Characteristics
1.7.1 Power Factor The power factor of a dielectric is an indication of its loss per unit volume, provided the capacitivity remains constant. Thus the power factor is an inherent property of the dielectric and is independent of volume. Like any a-c circuit, the power factor of a dielectric is
θCosEPFP ==1
.. (15)
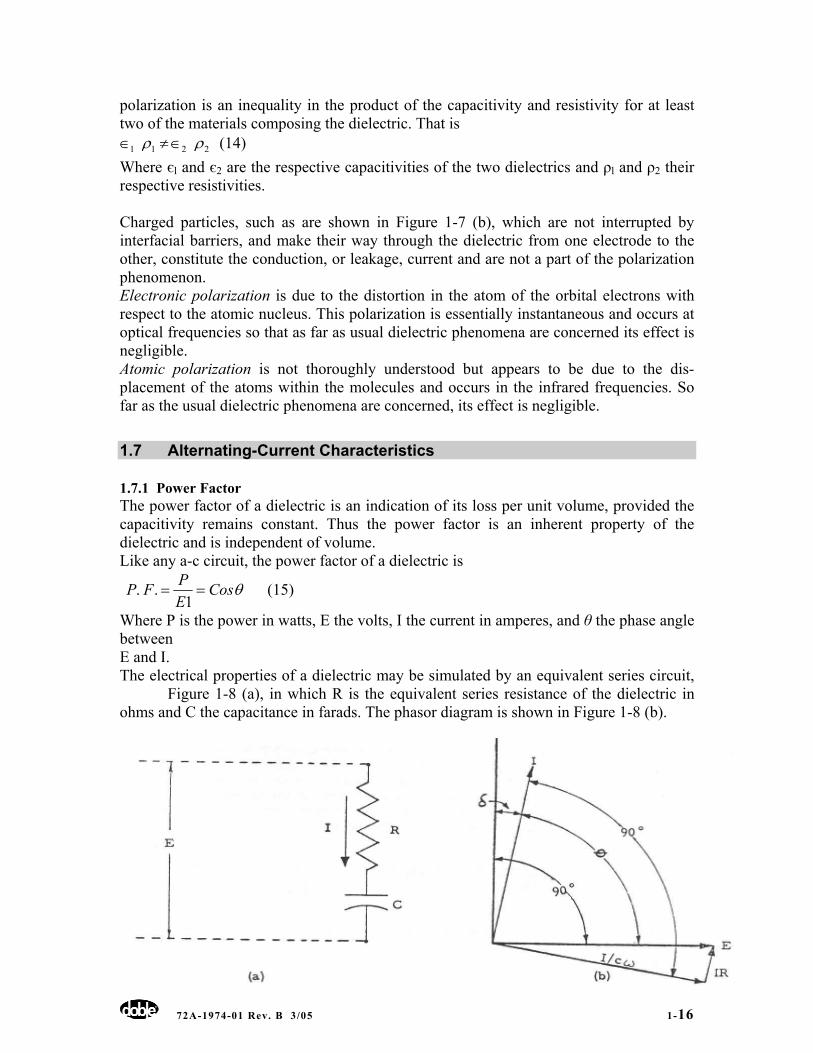
Where P is the power in watts, E the volts, I the current in amperes, and θ the phase angle between E and I. The electrical properties of a dielectric may be simulated by an equivalent series circuit, Figure 1-8 (a), in which R is the equivalent series resistance of the dielectric in ohms and C the capacitance in farads. The phasor diagram is shown in Figure 1-8 (b).
72A-1974-01 Rev. B 3/05 1-17
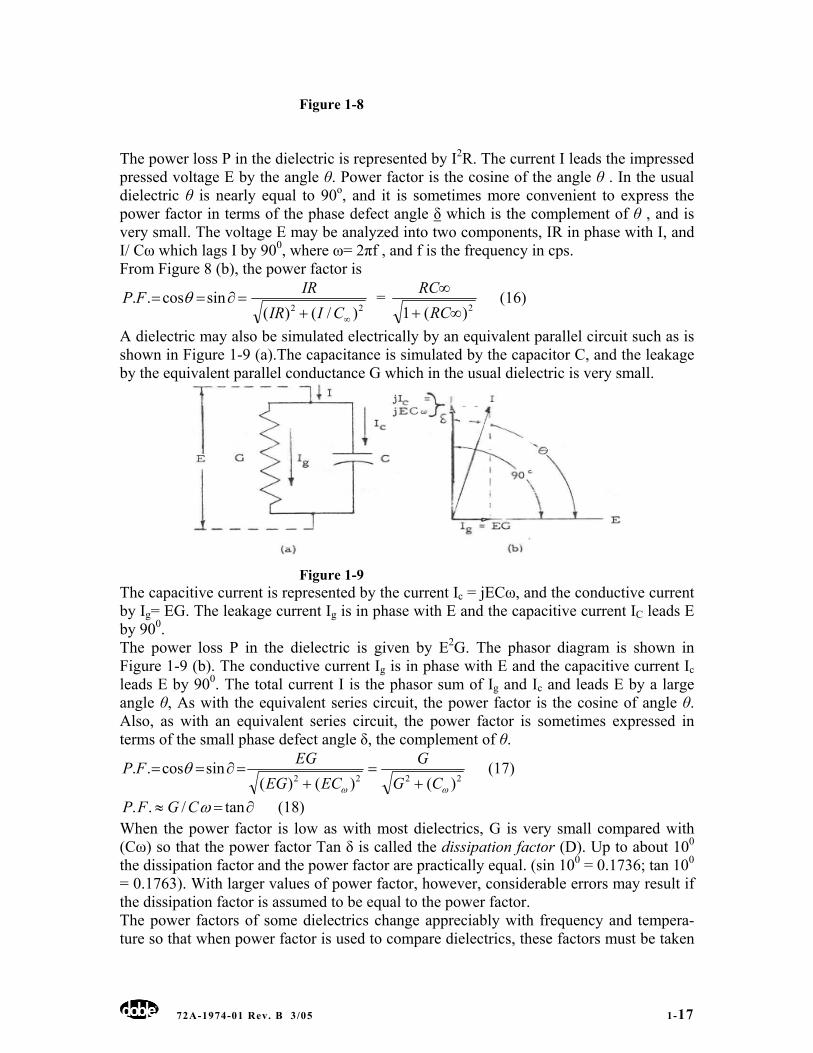
Figure 1-8 The power loss P in the dielectric is represented by I2R. The current I leads the impressed pressed voltage E by the angle θ. Power factor is the cosine of the angle θ . In the usual dielectric θ is nearly equal to 90o, and it is sometimes more convenient to express the power factor in terms of the phase defect angle δ which is the complement of θ , and is very small. The voltage E may be analyzed into two components, IR in phase with I, and I/ Cω which lags I by 900, where ω= 2πf , and f is the frequency in cps. From Figure 8 (b), the power factor is
22 )/()(sincos..
∞+=∂==
CIIRIRFP θ =
2)(1 ∞+
∞
RCRC (16)
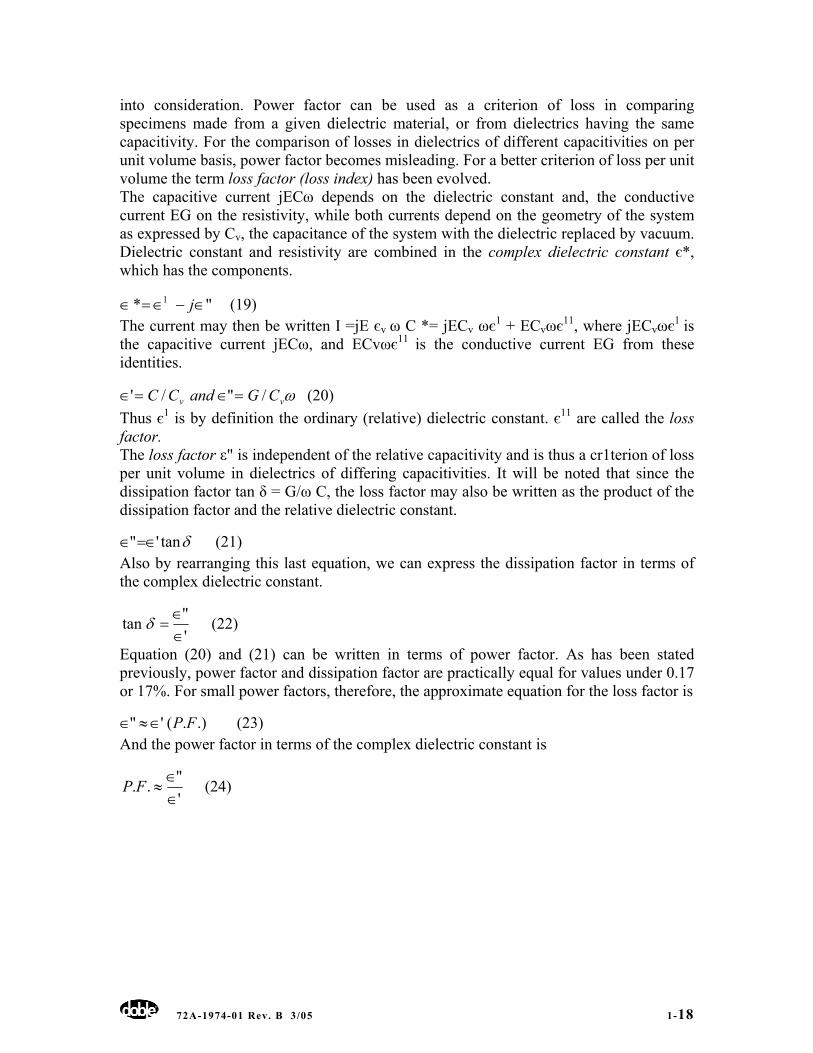
A dielectric may also be simulated electrically by an equivalent parallel circuit such as is shown in Figure 1-9 (a).The capacitance is simulated by the capacitor C, and the leakage by the equivalent parallel conductance G which in the usual dielectric is very small.
Figure 1-9
The capacitive current is represented by the current Ic = jECω, and the conductive current by Ig= EG. The leakage current Ig is in phase with E and the capacitive current IC leads E by 900. The power loss P in the dielectric is given by E2G. The phasor diagram is shown in Figure 1-9 (b). The conductive current Ig is in phase with E and the capacitive current Ic leads E by 900. The total current I is the phasor sum of Ig and Ic and leads E by a large angle θ, As with the equivalent series circuit, the power factor is the cosine of angle θ. Also, as with an equivalent series circuit, the power factor is sometimes expressed in terms of the small phase defect angle δ, the complement of θ.
2222 )()()(sincos..
ωω
θCG
GECEG
EGFP+
=+
=∂== (17)
∂=≈ tan/.. ωCGFP (18) When the power factor is low as with most dielectrics, G is very small compared with (Cω) so that the power factor Tan δ is called the dissipation factor (D). Up to about 100 the dissipation factor and the power factor are practically equal. (sin 100 = 0.1736; tan 100 = 0.1763). With larger values of power factor, however, considerable errors may result if the dissipation factor is assumed to be equal to the power factor. The power factors of some dielectrics change appreciably with frequency and tempera-ture so that when power factor is used to compare dielectrics, these factors must be taken
72A-1974-01 Rev. B 3/05 1-18
into consideration. Power factor can be used as a criterion of loss in comparing specimens made from a given dielectric material, or from dielectrics having the same capacitivity. For the comparison of losses in dielectrics of different capacitivities on per unit volume basis, power factor becomes misleading. For a better criterion of loss per unit volume the term loss factor (loss index) has been evolved. The capacitive current jECω depends on the dielectric constant and, the conductive current EG on the resistivity, while both currents depend on the geometry of the system as expressed by Cv, the capacitance of the system with the dielectric replaced by vacuum. Dielectric constant and resistivity are combined in the complex dielectric constant є*, which has the components.
"* 1 ∈−∈=∈ j (19) The current may then be written I =jE єv ω C *= jECv ωє1 + ECvωє11, where jECvωє1 is the capacitive current jECω, and ECvωє11 is the conductive current EG from these identities.
ωvv CGandCC /"/' =∈=∈ (20) Thus є1 is by definition the ordinary (relative) dielectric constant. є11 are called the loss factor. The loss factor ε" is independent of the relative capacitivity and is thus a cr1terion of loss per unit volume in dielectrics of differing capacitivities. It will be noted that since the dissipation factor tan δ = G/ω C, the loss factor may also be written as the product of the dissipation factor and the relative dielectric constant.
δtan'"=∈∈ (21) Also by rearranging this last equation, we can express the dissipation factor in terms of the complex dielectric constant.
'"tan
∈∈
=δ (22)
Equation (20) and (21) can be written in terms of power factor. As has been stated previously, power factor and dissipation factor are practically equal for values under 0.17 or 17%. For small power factors, therefore, the approximate equation for the loss factor is
.).('" FP∈≈∈ (23) And the power factor in terms of the complex dielectric constant is
'"..
∈∈
≈FP (24)
72A-1974-01 Rev. B 3/05 1-19
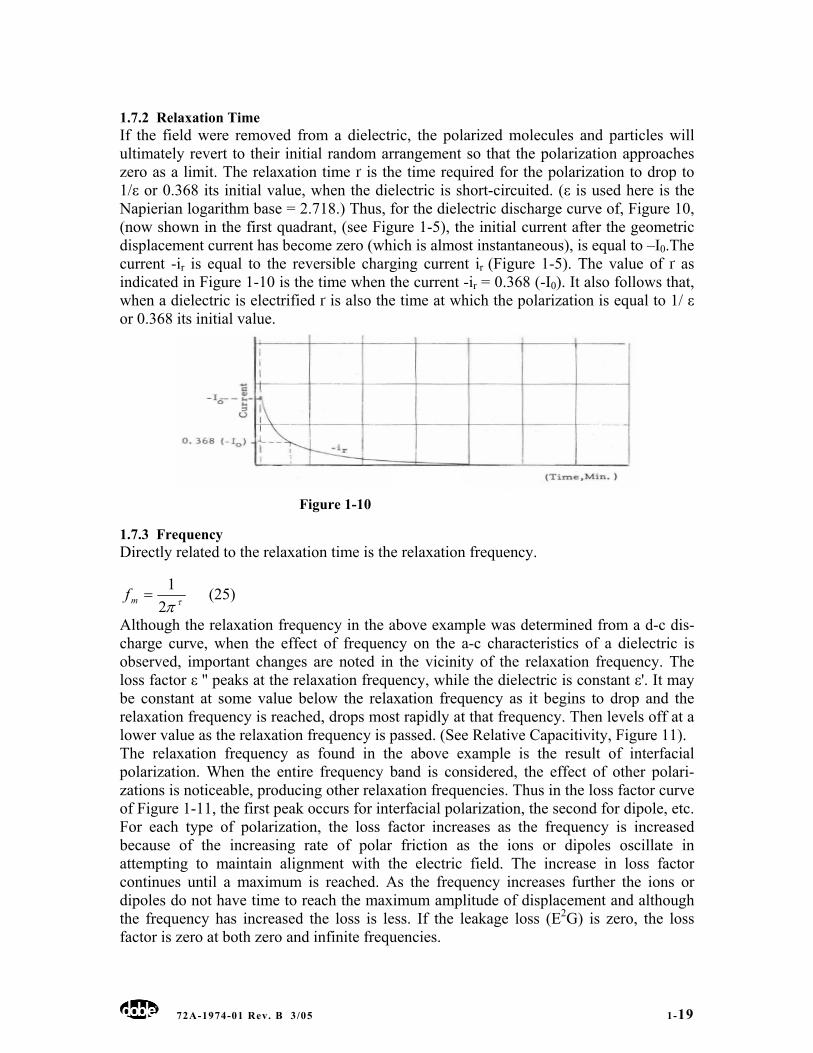
1.7.2 Relaxation Time If the field were removed from a dielectric, the polarized molecules and particles will ultimately revert to their initial random arrangement so that the polarization approaches zero as a limit. The relaxation time ґ is the time required for the polarization to drop to 1/ε or 0.368 its initial value, when the dielectric is short-circuited. (ε is used here is the Napierian logarithm base = 2.718.) Thus, for the dielectric discharge curve of, Figure 10, (now shown in the first quadrant, (see Figure 1-5), the initial current after the geometric displacement current has become zero (which is almost instantaneous), is equal to –I0.The current -ir is equal to the reversible charging current ir (Figure 1-5). The value of ґ as indicated in Figure 1-10 is the time when the current -ir = 0.368 (-I0). It also follows that, when a dielectric is electrified ґ is also the time at which the polarization is equal to 1/ ε or 0.368 its initial value.
Figure 1-10
1.7.3 Frequency Directly related to the relaxation time is the relaxation frequency.
τπ21
=mf (25)
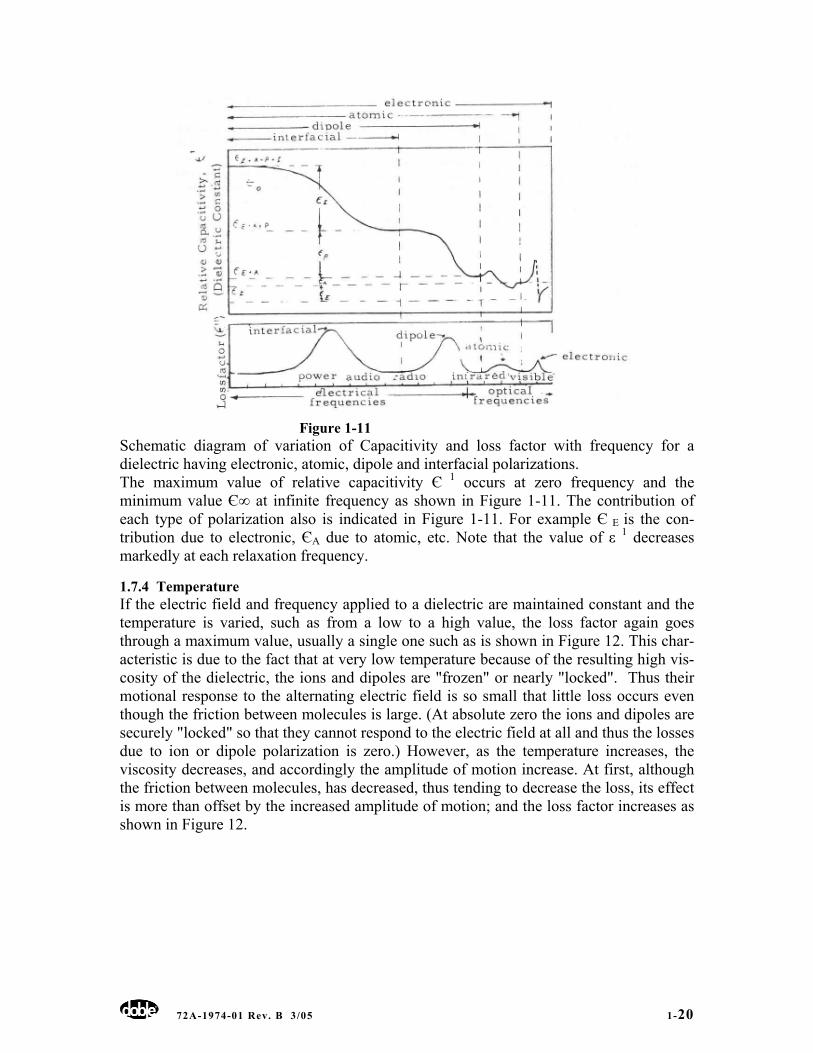
Although the relaxation frequency in the above example was determined from a d-c dis-charge curve, when the effect of frequency on the a-c characteristics of a dielectric is observed, important changes are noted in the vicinity of the relaxation frequency. The loss factor ε '' peaks at the relaxation frequency, while the dielectric is constant ε'. It may be constant at some value below the relaxation frequency as it begins to drop and the relaxation frequency is reached, drops most rapidly at that frequency. Then levels off at a lower value as the relaxation frequency is passed. (See Relative Capacitivity, Figure 11). The relaxation frequency as found in the above example is the result of interfacial polarization. When the entire frequency band is considered, the effect of other polari-zations is noticeable, producing other relaxation frequencies. Thus in the loss factor curve of Figure 1-11, the first peak occurs for interfacial polarization, the second for dipole, etc. For each type of polarization, the loss factor increases as the frequency is increased because of the increasing rate of polar friction as the ions or dipoles oscillate in attempting to maintain alignment with the electric field. The increase in loss factor continues until a maximum is reached. As the frequency increases further the ions or dipoles do not have time to reach the maximum amplitude of displacement and although the frequency has increased the loss is less. If the leakage loss (E2G) is zero, the loss factor is zero at both zero and infinite frequencies.
72A-1974-01 Rev. B 3/05 1-20
Figure 1-11
Schematic diagram of variation of Capacitivity and loss factor with frequency for a dielectric having electronic, atomic, dipole and interfacial polarizations. The maximum value of relative capacitivity Є 1 occurs at zero frequency and the minimum value Є∞ at infinite frequency as shown in Figure 1-11. The contribution of each type of polarization also is indicated in Figure 1-11. For example Є E is the con-tribution due to electronic, ЄA due to atomic, etc. Note that the value of ε 1 decreases markedly at each relaxation frequency.
1.7.4 Temperature If the electric field and frequency applied to a dielectric are maintained constant and the temperature is varied, such as from a low to a high value, the loss factor again goes through a maximum value, usually a single one such as is shown in Figure 12. This char-acteristic is due to the fact that at very low temperature because of the resulting high vis-cosity of the dielectric, the ions and dipoles are "frozen" or nearly "locked". Thus their motional response to the alternating electric field is so small that little loss occurs even though the friction between molecules is large. (At absolute zero the ions and dipoles are securely "locked" so that they cannot respond to the electric field at all and thus the losses due to ion or dipole polarization is zero.) However, as the temperature increases, the viscosity decreases, and accordingly the amplitude of motion increase. At first, although the friction between molecules, has decreased, thus tending to decrease the loss, its effect is more than offset by the increased amplitude of motion; and the loss factor increases as shown in Figure 12.
72A-1974-01 Rev. B 3/05 1-21
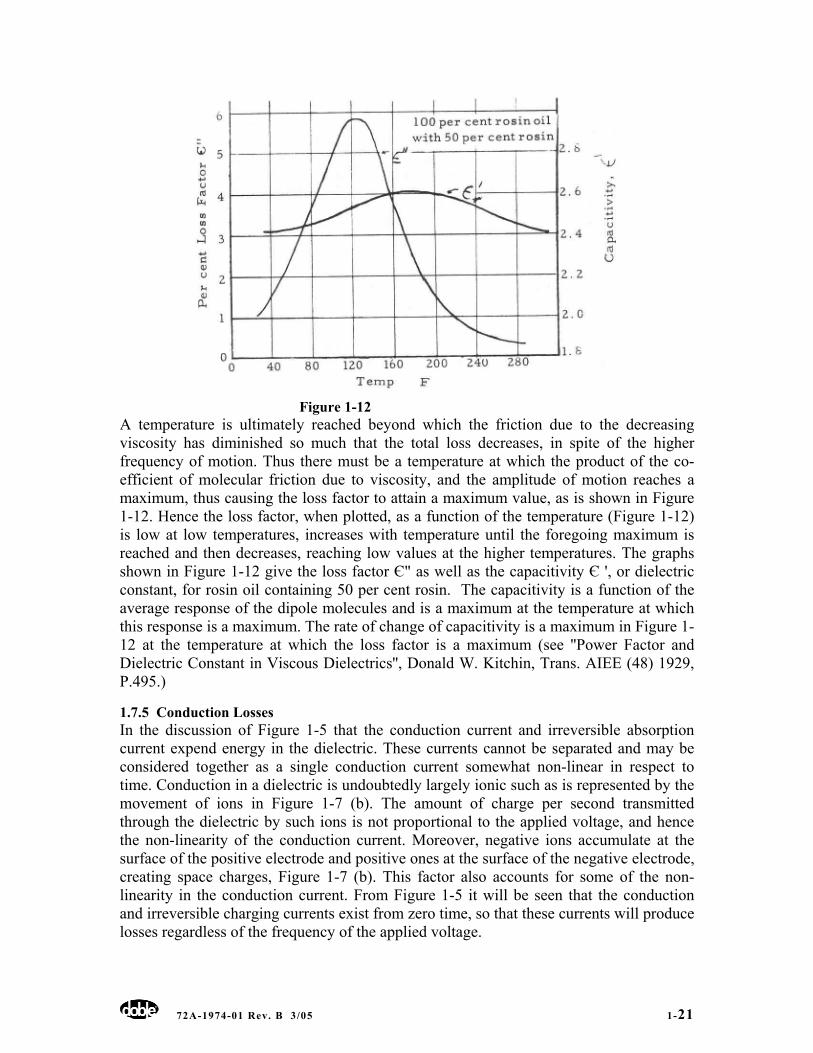
Figure 1-12
A temperature is ultimately reached beyond which the friction due to the decreasing viscosity has diminished so much that the total loss decreases, in spite of the higher frequency of motion. Thus there must be a temperature at which the product of the co-efficient of molecular friction due to viscosity, and the amplitude of motion reaches a maximum, thus causing the loss factor to attain a maximum value, as is shown in Figure 1-12. Hence the loss factor, when plotted, as a function of the temperature (Figure 1-12) is low at low temperatures, increases with temperature until the foregoing maximum is reached and then decreases, reaching low values at the higher temperatures. The graphs shown in Figure 1-12 give the loss factor Є" as well as the capacitivity Є ', or dielectric constant, for rosin oil containing 50 per cent rosin. The capacitivity is a function of the average response of the dipole molecules and is a maximum at the temperature at which this response is a maximum. The rate of change of capacitivity is a maximum in Figure 1-12 at the temperature at which the loss factor is a maximum (see ''Power Factor and Dielectric Constant in Viscous Dielectrics'', Donald W. Kitchin, Trans. AIEE (48) 1929, P.495.)
1.7.5 Conduction Losses In the discussion of Figure 1-5 that the conduction current and irreversible absorption current expend energy in the dielectric. These currents cannot be separated and may be considered together as a single conduction current somewhat non-linear in respect to time. Conduction in a dielectric is undoubtedly largely ionic such as is represented by the movement of ions in Figure 1-7 (b). The amount of charge per second transmitted through the dielectric by such ions is not proportional to the applied voltage, and hence the non-linearity of the conduction current. Moreover, negative ions accumulate at the surface of the positive electrode and positive ones at the surface of the negative electrode, creating space charges, Figure 1-7 (b). This factor also accounts for some of the non-linearity in the conduction current. From Figure 1-5 it will be seen that the conduction and irreversible charging currents exist from zero time, so that these currents will produce losses regardless of the frequency of the applied voltage.
72A-1974-01 Rev. B 3/05 1-22
1.8 Ionization And Corona Figure 1-3, (c) shows the formation of corona at a sharp point to which has been applied a high voltage and it is stated in connection therewith that the high concentration of electric stress breaks down the air causing ionization, or corona. With a sharp point, such as a needlepoint, because of the very- high concentration of electric lines, corona forms quite readily at moderate voltages. Actually corona begins to form when the electric stress in air reaches a critical value equal approximately to 30 kilovolts per cm. or 75 volts per mil. The air then ''breaks down'' becoming divided into positive and negative ions. The following definitions relate to ionization phenomena. Ion: an ion is an electrical portion of matter of subatomic, atomic or molecular dimensions. The charge on an ion is an integer multiple of one electric unit, and may be negative or positive. Ionization: the process by which neutral molecules or atoms disassociate to form positively and negatively charged particles. Those species, which are positively charged, are positive ions, while those negatively charged may be negative ions or electrons. Electrical discharge: the phenomenon accompanying any ionization in a dielectric, which occurs as a result of the application of an electric field. Two classes of discharge may be distinguished:
(a) Those discharges which, once initiated, do not require for their continuance a source of externally supplied electrons or ions, are termed self-sustained discharges, and usually require minimum critical voltages for their inception and extinction.
(b) Those discharges which do require for their continuance a source of externally supplied electrons or ions are termed non self-sustained discharges and do not possess minimum critical voltages for their inception or extinction.
Corona: self-sustained electrical discharges in which the field-intensified ionization is localized over only a portion of the distance between the electrodes. This may occur either because of field non-uniformities such as are present at electrode edges, points or wires, or over non-uniformly conducting surfaces, or because the voltage across one of two or more dielectrics in series between the electrodes does not attain the minimum critical value required to support self-sustained discharges in this dielectric. Continuous corona: corona pulses, which recur at regular intervals for periods of several minutes or more. Intermittent corona: corona pulses, which recur at regular intervals for periods of from several cycles of applied voltage to seconds with similar or longer periods between discharges. Corona streamer: a highly localized filamentary type of corona discharge. Corona inception voltage: the minimum voltage, which must be applied to the system to initiate corona. Corona extinction voltage: the minimum voltage applied to the system at which corona discharge once started can be maintained.
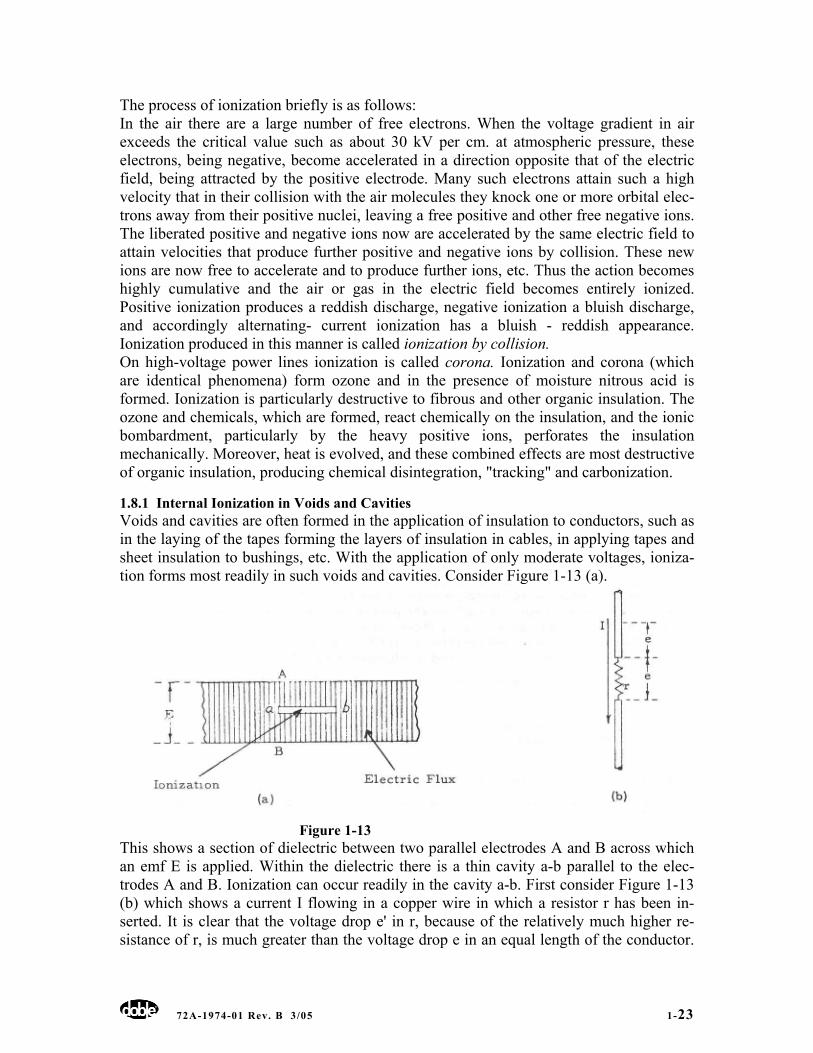
72A-1974-01 Rev. B 3/05 1-23
The process of ionization briefly is as follows: In the air there are a large number of free electrons. When the voltage gradient in air exceeds the critical value such as about 30 kV per cm. at atmospheric pressure, these electrons, being negative, become accelerated in a direction opposite that of the electric field, being attracted by the positive electrode. Many such electrons attain such a high velocity that in their collision with the air molecules they knock one or more orbital elec-trons away from their positive nuclei, leaving a free positive and other free negative ions. The liberated positive and negative ions now are accelerated by the same electric field to attain velocities that produce further positive and negative ions by collision. These new ions are now free to accelerate and to produce further ions, etc. Thus the action becomes highly cumulative and the air or gas in the electric field becomes entirely ionized. Positive ionization produces a reddish discharge, negative ionization a bluish discharge, and accordingly alternating- current ionization has a bluish - reddish appearance. Ionization produced in this manner is called ionization by collision. On high-voltage power lines ionization is called corona. Ionization and corona (which are identical phenomena) form ozone and in the presence of moisture nitrous acid is formed. Ionization is particularly destructive to fibrous and other organic insulation. The ozone and chemicals, which are formed, react chemically on the insulation, and the ionic bombardment, particularly by the heavy positive ions, perforates the insulation mechanically. Moreover, heat is evolved, and these combined effects are most destructive of organic insulation, producing chemical disintegration, "tracking" and carbonization.
1.8.1 Internal Ionization in Voids and Cavities Voids and cavities are often formed in the application of insulation to conductors, such as in the laying of the tapes forming the layers of insulation in cables, in applying tapes and sheet insulation to bushings, etc. With the application of only moderate voltages, ioniza-tion forms most readily in such voids and cavities. Consider Figure 1-13 (a).
Figure 1-13
This shows a section of dielectric between two parallel electrodes A and B across which an emf E is applied. Within the dielectric there is a thin cavity a-b parallel to the elec-trodes A and B. Ionization can occur readily in the cavity a-b. First consider Figure 1-13 (b) which shows a current I flowing in a copper wire in which a resistor r has been in-serted. It is clear that the voltage drop e' in r, because of the relatively much higher re-sistance of r, is much greater than the voltage drop e in an equal length of the conductor.
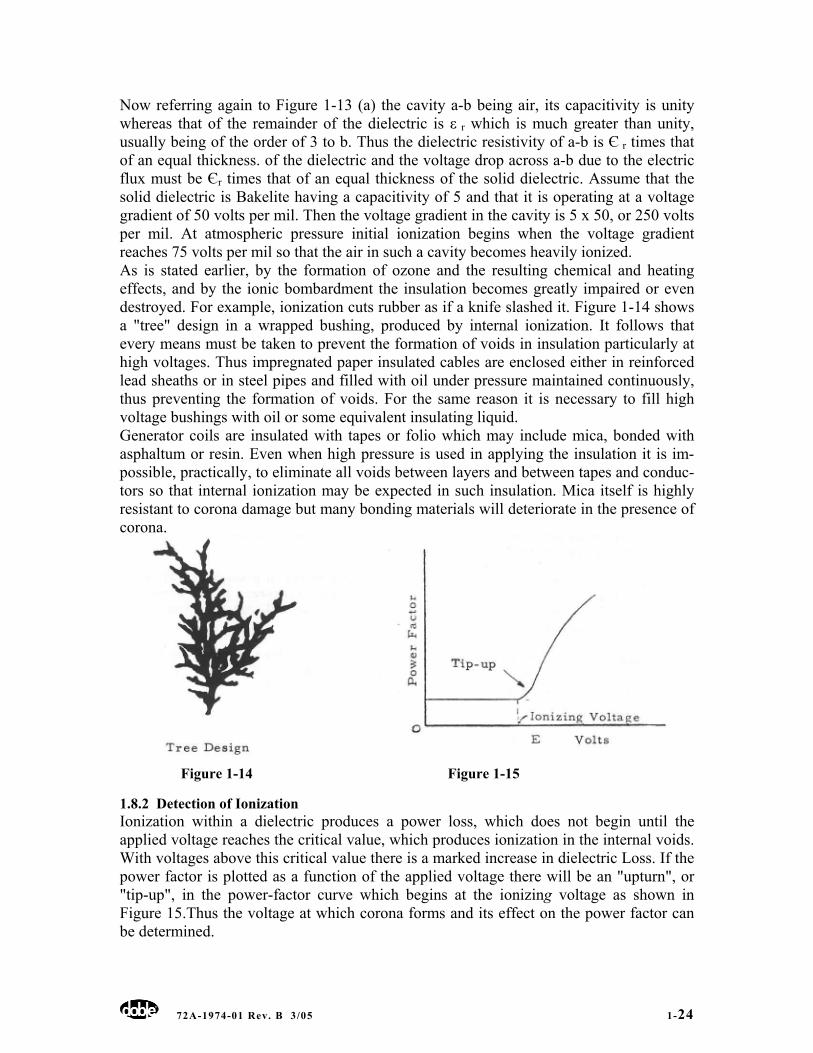
72A-1974-01 Rev. B 3/05 1-24
Now referring again to Figure 1-13 (a) the cavity a-b being air, its capacitivity is unity whereas that of the remainder of the dielectric is ε r which is much greater than unity, usually being of the order of 3 to b. Thus the dielectric resistivity of a-b is Є r times that of an equal thickness. of the dielectric and the voltage drop across a-b due to the electric flux must be Єr times that of an equal thickness of the solid dielectric. Assume that the solid dielectric is Bakelite having a capacitivity of 5 and that it is operating at a voltage gradient of 50 volts per mil. Then the voltage gradient in the cavity is 5 x 50, or 250 volts per mil. At atmospheric pressure initial ionization begins when the voltage gradient reaches 75 volts per mil so that the air in such a cavity becomes heavily ionized. As is stated earlier, by the formation of ozone and the resulting chemical and heating effects, and by the ionic bombardment the insulation becomes greatly impaired or even destroyed. For example, ionization cuts rubber as if a knife slashed it. Figure 1-14 shows a "tree" design in a wrapped bushing, produced by internal ionization. It follows that every means must be taken to prevent the formation of voids in insulation particularly at high voltages. Thus impregnated paper insulated cables are enclosed either in reinforced lead sheaths or in steel pipes and filled with oil under pressure maintained continuously, thus preventing the formation of voids. For the same reason it is necessary to fill high voltage bushings with oil or some equivalent insulating liquid. Generator coils are insulated with tapes or folio which may include mica, bonded with asphaltum or resin. Even when high pressure is used in applying the insulation it is im-possible, practically, to eliminate all voids between layers and between tapes and conduc-tors so that internal ionization may be expected in such insulation. Mica itself is highly resistant to corona damage but many bonding materials will deteriorate in the presence of corona.
Figure 1-14 Figure 1-15
1.8.2 Detection of Ionization Ionization within a dielectric produces a power loss, which does not begin until the applied voltage reaches the critical value, which produces ionization in the internal voids. With voltages above this critical value there is a marked increase in dielectric Loss. If the power factor is plotted as a function of the applied voltage there will be an "upturn", or "tip-up", in the power-factor curve which begins at the ionizing voltage as shown in Figure 15.Thus the voltage at which corona forms and its effect on the power factor can be determined.
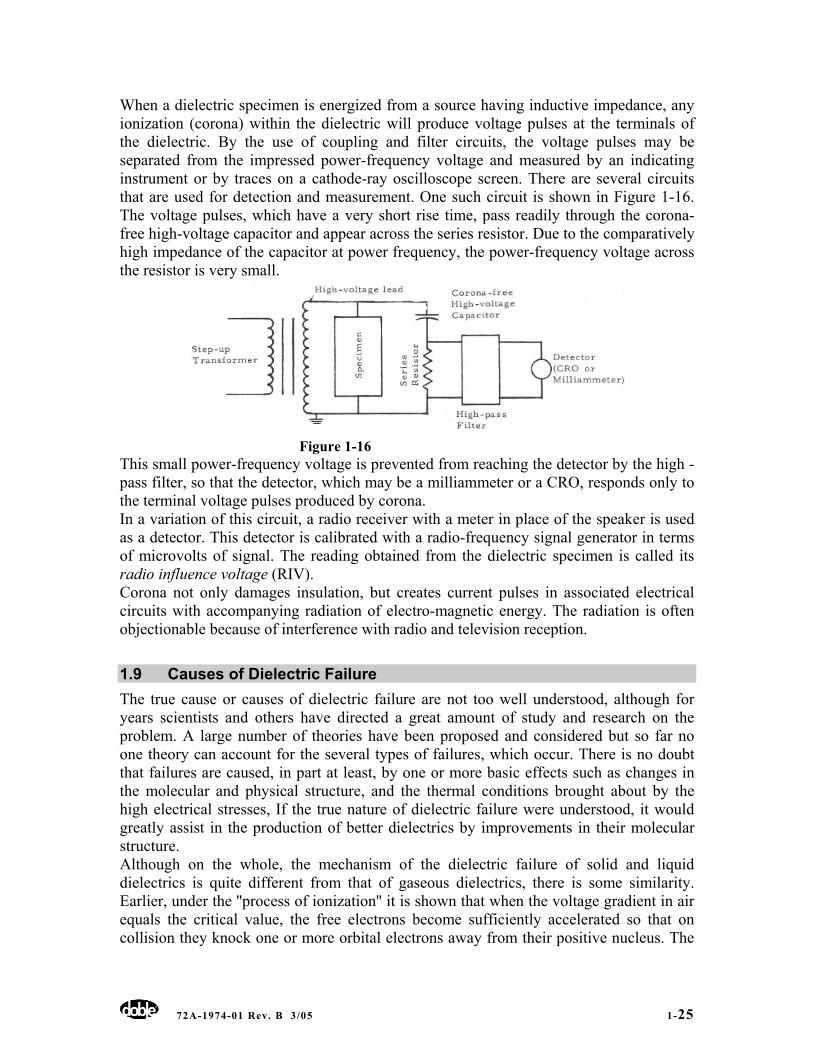
72A-1974-01 Rev. B 3/05 1-25
When a dielectric specimen is energized from a source having inductive impedance, any ionization (corona) within the dielectric will produce voltage pulses at the terminals of the dielectric. By the use of coupling and filter circuits, the voltage pulses may be separated from the impressed power-frequency voltage and measured by an indicating instrument or by traces on a cathode-ray oscilloscope screen. There are several circuits that are used for detection and measurement. One such circuit is shown in Figure 1-16. The voltage pulses, which have a very short rise time, pass readily through the corona-free high-voltage capacitor and appear across the series resistor. Due to the comparatively high impedance of the capacitor at power frequency, the power-frequency voltage across the resistor is very small.
Figure 1-16
This small power-frequency voltage is prevented from reaching the detector by the high -pass filter, so that the detector, which may be a milliammeter or a CRO, responds only to the terminal voltage pulses produced by corona. In a variation of this circuit, a radio receiver with a meter in place of the speaker is used as a detector. This detector is calibrated with a radio-frequency signal generator in terms of microvolts of signal. The reading obtained from the dielectric specimen is called its radio influence voltage (RIV). Corona not only damages insulation, but creates current pulses in associated electrical circuits with accompanying radiation of electro-magnetic energy. The radiation is often objectionable because of interference with radio and television reception.
1.9 Causes of Dielectric Failure The true cause or causes of dielectric failure are not too well understood, although for years scientists and others have directed a great amount of study and research on the problem. A large number of theories have been proposed and considered but so far no one theory can account for the several types of failures, which occur. There is no doubt that failures are caused, in part at least, by one or more basic effects such as changes in the molecular and physical structure, and the thermal conditions brought about by the high electrical stresses, If the true nature of dielectric failure were understood, it would greatly assist in the production of better dielectrics by improvements in their molecular structure. Although on the whole, the mechanism of the dielectric failure of solid and liquid dielectrics is quite different from that of gaseous dielectrics, there is some similarity. Earlier, under the ''process of ionization'' it is shown that when the voltage gradient in air equals the critical value, the free electrons become sufficiently accelerated so that on collision they knock one or more orbital electrons away from their positive nucleus. The
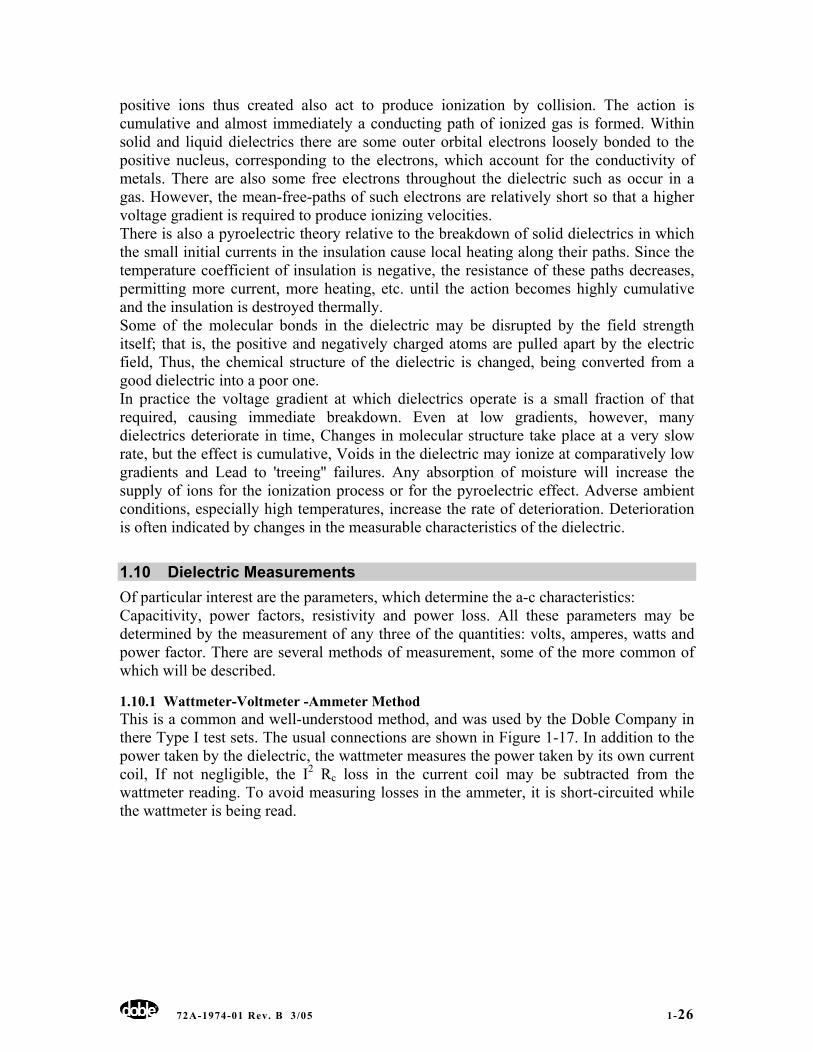
72A-1974-01 Rev. B 3/05 1-26
positive ions thus created also act to produce ionization by collision. The action is cumulative and almost immediately a conducting path of ionized gas is formed. Within solid and liquid dielectrics there are some outer orbital electrons loosely bonded to the positive nucleus, corresponding to the electrons, which account for the conductivity of metals. There are also some free electrons throughout the dielectric such as occur in a gas. However, the mean-free-paths of such electrons are relatively short so that a higher voltage gradient is required to produce ionizing velocities. There is also a pyroelectric theory relative to the breakdown of solid dielectrics in which the small initial currents in the insulation cause local heating along their paths. Since the temperature coefficient of insulation is negative, the resistance of these paths decreases, permitting more current, more heating, etc. until the action becomes highly cumulative and the insulation is destroyed thermally. Some of the molecular bonds in the dielectric may be disrupted by the field strength itself; that is, the positive and negatively charged atoms are pulled apart by the electric field, Thus, the chemical structure of the dielectric is changed, being converted from a good dielectric into a poor one. In practice the voltage gradient at which dielectrics operate is a small fraction of that required, causing immediate breakdown. Even at low gradients, however, many dielectrics deteriorate in time, Changes in molecular structure take place at a very slow rate, but the effect is cumulative, Voids in the dielectric may ionize at comparatively low gradients and Lead to 'treeing'' failures. Any absorption of moisture will increase the supply of ions for the ionization process or for the pyroelectric effect. Adverse ambient conditions, especially high temperatures, increase the rate of deterioration. Deterioration is often indicated by changes in the measurable characteristics of the dielectric.
1.10 Dielectric Measurements Of particular interest are the parameters, which determine the a-c characteristics: Capacitivity, power factors, resistivity and power loss. All these parameters may be determined by the measurement of any three of the quantities: volts, amperes, watts and power factor. There are several methods of measurement, some of the more common of which will be described.
1.10.1 Wattmeter-Voltmeter -Ammeter Method This is a common and well-understood method, and was used by the Doble Company in there Type I test sets. The usual connections are shown in Figure 1-17. In addition to the power taken by the dielectric, the wattmeter measures the power taken by its own current coil, If not negligible, the I2 Rc loss in the current coil may be subtracted from the wattmeter reading. To avoid measuring losses in the ammeter, it is short-circuited while the wattmeter is being read.
72A-1974-01 Rev. B 3/05 1-27
Figure 1-17
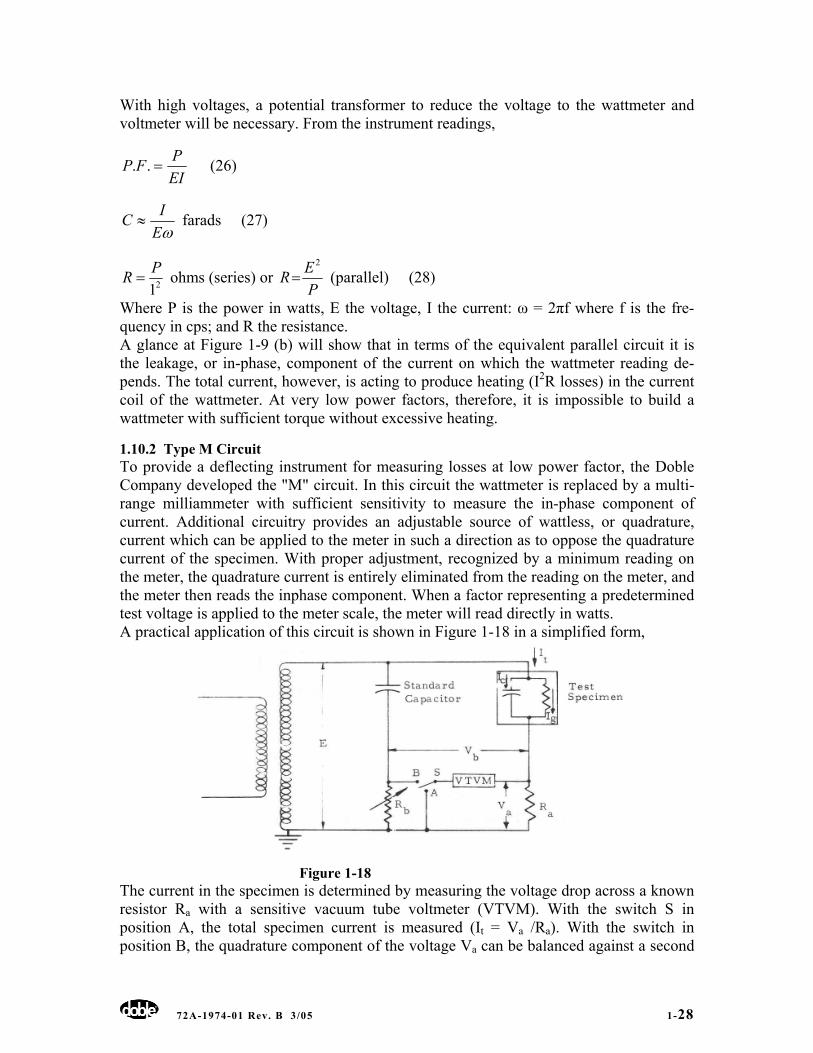
72A-1974-01 Rev. B 3/05 1-28
With high voltages, a potential transformer to reduce the voltage to the wattmeter and voltmeter will be necessary. From the instrument readings,
EIPFP =.. (26)
ωEIC ≈ farads (27)
21PR = ohms (series) or
PER
2
= (parallel) (28)
Where P is the power in watts, E the voltage, I the current: ω = 2πf where f is the fre-quency in cps; and R the resistance. A glance at Figure 1-9 (b) will show that in terms of the equivalent parallel circuit it is the leakage, or in-phase, component of the current on which the wattmeter reading de-pends. The total current, however, is acting to produce heating (I2R losses) in the current coil of the wattmeter. At very low power factors, therefore, it is impossible to build a wattmeter with sufficient torque without excessive heating.
1.10.2 Type M Circuit To provide a deflecting instrument for measuring losses at low power factor, the Doble Company developed the "M" circuit. In this circuit the wattmeter is replaced by a multi-range milliammeter with sufficient sensitivity to measure the in-phase component of current. Additional circuitry provides an adjustable source of wattless, or quadrature, current which can be applied to the meter in such a direction as to oppose the quadrature current of the specimen. With proper adjustment, recognized by a minimum reading on the meter, the quadrature current is entirely eliminated from the reading on the meter, and the meter then reads the inphase component. When a factor representing a predetermined test voltage is applied to the meter scale, the meter will read directly in watts. A practical application of this circuit is shown in Figure 1-18 in a simplified form,
Figure 1-18
The current in the specimen is determined by measuring the voltage drop across a known resistor Ra with a sensitive vacuum tube voltmeter (VTVM). With the switch S in position A, the total specimen current is measured (It = Va /Ra). With the switch in position B, the quadrature component of the voltage Va can be balanced against a second
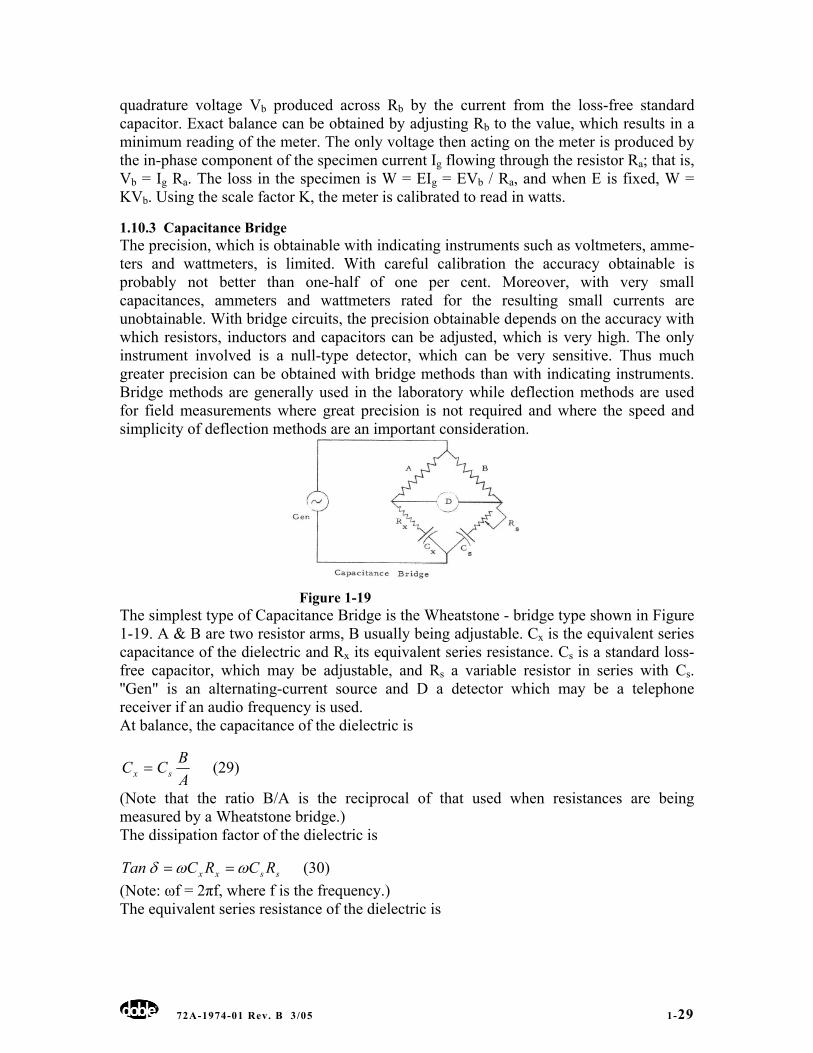
72A-1974-01 Rev. B 3/05 1-29
quadrature voltage Vb produced across Rb by the current from the loss-free standard capacitor. Exact balance can be obtained by adjusting Rb to the value, which results in a minimum reading of the meter. The only voltage then acting on the meter is produced by the in-phase component of the specimen current Ig flowing through the resistor Ra; that is, Vb = Ig Ra. The loss in the specimen is W = EIg = EVb / Ra, and when E is fixed, W = KVb. Using the scale factor K, the meter is calibrated to read in watts.
1.10.3 Capacitance Bridge The precision, which is obtainable with indicating instruments such as voltmeters, amme-ters and wattmeters, is limited. With careful calibration the accuracy obtainable is probably not better than one-half of one per cent. Moreover, with very small capacitances, ammeters and wattmeters rated for the resulting small currents are unobtainable. With bridge circuits, the precision obtainable depends on the accuracy with which resistors, inductors and capacitors can be adjusted, which is very high. The only instrument involved is a null-type detector, which can be very sensitive. Thus much greater precision can be obtained with bridge methods than with indicating instruments. Bridge methods are generally used in the laboratory while deflection methods are used for field measurements where great precision is not required and where the speed and simplicity of deflection methods are an important consideration.
Figure 1-19
The simplest type of Capacitance Bridge is the Wheatstone - bridge type shown in Figure 1-19. A & B are two resistor arms, B usually being adjustable. Cx is the equivalent series capacitance of the dielectric and Rx its equivalent series resistance. Cs is a standard loss-free capacitor, which may be adjustable, and Rs a variable resistor in series with Cs. ''Gen" is an alternating-current source and D a detector which may be a telephone receiver if an audio frequency is used. At balance, the capacitance of the dielectric is
ABCC sx = (29)
(Note that the ratio B/A is the reciprocal of that used when resistances are being measured by a Wheatstone bridge.) The dissipation factor of the dielectric is
ssxx RCRCTan ωωδ == (30) (Note: ωf = 2πf, where f is the frequency.) The equivalent series resistance of the dielectric is
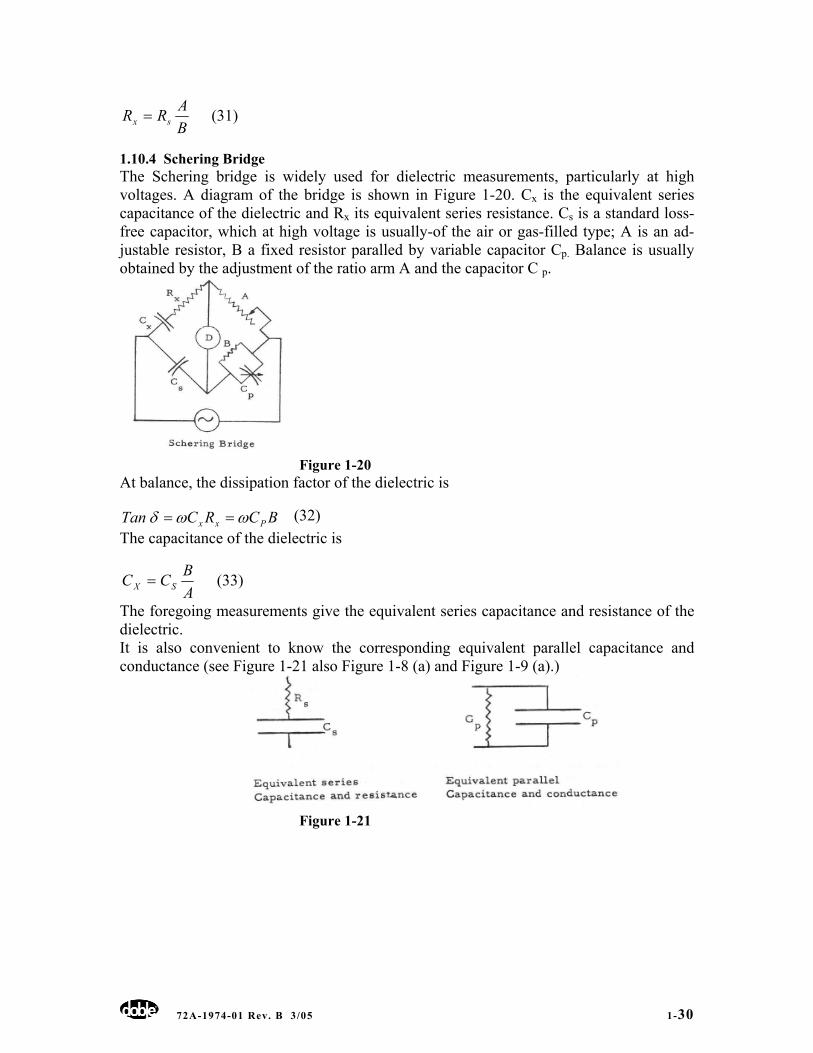
72A-1974-01 Rev. B 3/05 1-30
BARR sx = (31)
1.10.4 Schering Bridge The Schering bridge is widely used for dielectric measurements, particularly at high voltages. A diagram of the bridge is shown in Figure 1-20. Cx is the equivalent series capacitance of the dielectric and Rx its equivalent series resistance. Cs is a standard loss-free capacitor, which at high voltage is usually-of the air or gas-filled type; A is an ad-justable resistor, B a fixed resistor paralled by variable capacitor Cp. Balance is usually obtained by the adjustment of the ratio arm A and the capacitor C p.
Figure 1-20
At balance, the dissipation factor of the dielectric is
BCRCTan Pxx ωωδ == (32)
The capacitance of the dielectric is
ABCC SX = (33)
The foregoing measurements give the equivalent series capacitance and resistance of the dielectric. It is also convenient to know the corresponding equivalent parallel capacitance and conductance (see Figure 1-21 also Figure 1-8 (a) and Figure 1-9 (a).)
Figure 1-21
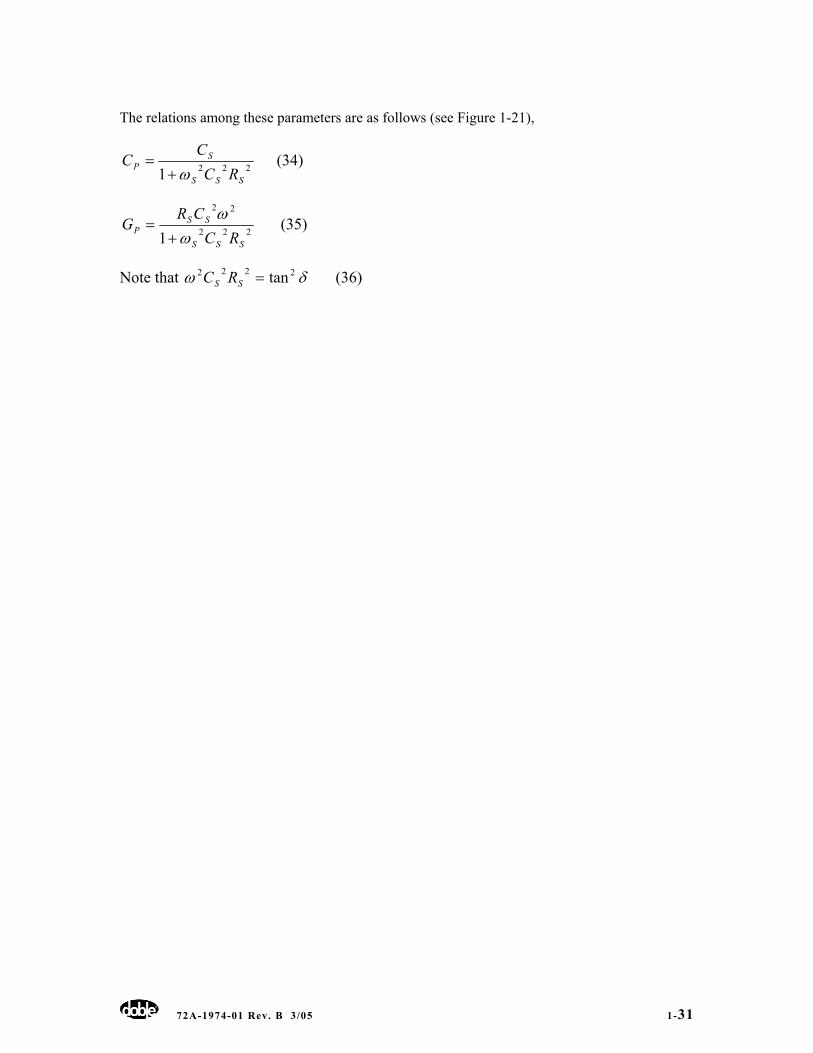
72A-1974-01 Rev. B 3/05 1-31
The relations among these parameters are as follows (see Figure 1-21),
2221 SSS
SP RC
CC
ω+= (34)
222
22
1 SSS
SSP RC
CRG
ωω
+= (35)
Note that δω 2222 tan=SS RC (36)
72A-1974-01 Rev. B 2/05 2-32
Chapter 2 - Types and Applications - of Electrical Insulation Professor C. L. Dawes and E. H. Povey
Doble Engineering Company
2.1 Introduction The treatise "Dielectric Theory and Practice" (1) presented at the 1962 Client Conference was devoted primarily to the basic phenomena, which underlie the behavior of dielectrics. Dielectrics and their properties were defined in accordance with the standard definitions of ASA. A dielectric was defined as a medium in which it is possible to produce and maintain an electric field with little or no supply of energy from outside sources, and that a vacuum is the only perfect dielectric. An insulating material is one in which a small, but not negligible, current flows, when a potential difference is applied between any two points. It follows that an insulating material is also a dielectric and that a dielectric is also an insulating material, each having both dielectric and insulating properties. Hence, both terms are often used indiscriminately when reference is made to a given material. In the foregoing treatise (1) there were also presented the characteristics of the dielectric circuit including resistance, conductance, capacitance and power factor. Then there followed a description of the basic elements which constitute the body of dielectrics such as atoms, positive and negative ions, polar and non-polar molecules; also their behavior in direct-current and alternating-current fields. It was shown that the lateral movement of positive and negative ions and the rotation of the dipoles in the electric field accounted for many of the well-known characteristics of dielectrics such as absorption, conduction, power loss, and capacitivity, and that these were functions of field strength, frequency and temperature. In as much as electrical apparatus, with its insulation, is used for many and diverse applications, it is exposed to wide ranges of environment, such as temperature, moisture, exposure to weather, chemicals, etc. Hence, among the insulating materials there must be a wide range and diversity of electrical and physical properties to meet these many different requirements. It is the purpose of this treatise to describe a limited number of the well-known types of insulation, their electrical properties and characteristics under operating conditions, as functions of voltage gradient, temperature and frequency. So far as possible these characteristics are related to the fundamental behavior of the basic elements of the dielectrics, which were described in the prior treatise. The applications of these different insulations to the types of apparatus to which they are adapted are then described. One major factor affecting the life of an insulating material is thermal degradation, although moisture, chemical contamination, corona, voltage stress, and mechanical stress may also contribute to its deterioration, especially after the material has been weakened by thermal degradation. Data obtained from accepted test procedures and from field tests have permitted the evaluation of the thermal life of several of the insulating materials. Based on these data the AIEE(2) has established temperature classifications so as to facilitate comparison among such materials and to provide a single letter to designate each class for purposes of standardization. These classifications, given in Table I, are based on nominal thermal life at the temperature assigned to each class.
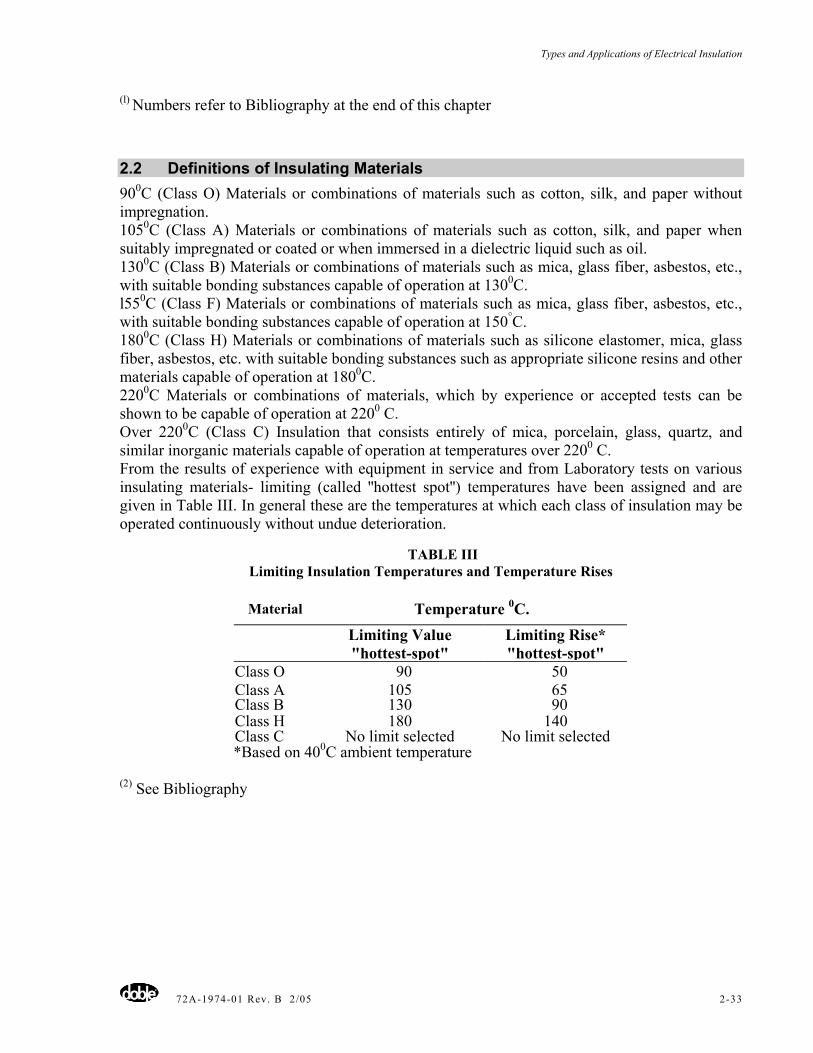
Types and Applications of Electrical Insulation
72A-1974-01 Rev. B 2/05 2-33
(l) Numbers refer to Bibliography at the end of this chapter
2.2 Definitions of Insulating Materials 900C (Class O) Materials or combinations of materials such as cotton, silk, and paper without impregnation. 1050C (Class A) Materials or combinations of materials such as cotton, silk, and paper when suitably impregnated or coated or when immersed in a dielectric liquid such as oil. 1300C (Class B) Materials or combinations of materials such as mica, glass fiber, asbestos, etc., with suitable bonding substances capable of operation at 1300C. l550C (Class F) Materials or combinations of materials such as mica, glass fiber, asbestos, etc., with suitable bonding substances capable of operation at 150°C. 1800C (Class H) Materials or combinations of materials such as silicone elastomer, mica, glass fiber, asbestos, etc. with suitable bonding substances such as appropriate silicone resins and other materials capable of operation at 1800C. 2200C Materials or combinations of materials, which by experience or accepted tests can be shown to be capable of operation at 2200 C. Over 2200C (Class C) Insulation that consists entirely of mica, porcelain, glass, quartz, and similar inorganic materials capable of operation at temperatures over 2200 C. From the results of experience with equipment in service and from Laboratory tests on various insulating materials- limiting (called ''hottest spot'') temperatures have been assigned and are given in Table III. In general these are the temperatures at which each class of insulation may be operated continuously without undue deterioration.
TABLE III Limiting Insulation Temperatures and Temperature Rises
Material Temperature 0C.
Limiting Value "hottest-spot"
Limiting Rise* "hottest-spot"
Class O 90 50 Class A 105 65Class B 130 90Class H 180 140Class C No limit selected No limit selected *Based on 400C ambient temperature
(2) See Bibliography
Types and Applications of Electrical Insulation
72A-1974-01 Rev. B 2/05 2-34
In addition, the life of a given class of insulating material depends on the degree and intermittency of the loading. Also the type and size of the equipment being used, the type of service to which the equipment is subjected, the degree of the exclusion of moisture, dirt and chemicals, the care which it receives during installation, its maintenance during operation, and the mechanical vibration and forces to which it is subjected. Hottest-spot temperatures depend on the thickness of the insulation, its geometry and its thermal conductivity. Such temperatures may be measured directly by an embedded detector, such as a thermocouple, located at the spot. Thermometers ordinarily measure only surface temperatures, and resistance measurements give only the temperature of the winding. From experience the hottest-spot temperature may be evaluated from data obtained by these three methods. The other properties of insulating materials, whose consideration is often necessary, are surface leakage, resistance to moisture, chemicals, oils, gases and insects, and mechanical properties. Most of these properties can be measured by standard tests prescribed by AIEE, ASTM and NEMA. The important electrical characteristics of insulations (and dielectrics) are volume resistivity, power factor, dissipation factor, capacitivity, or dielectric constant, and dielectric strength. These characteristics are functions of temperature, voltage gradient and frequency as will be shown later.
2.3 Properties of Insulating Materials
Volume Resistivity LARp = (usually expressed in ohm-cm)
Where R is the resistance of a length L of the material having a uniform cross Section A. ( ) δθ sincos1 ===
EIPPFFactorPower
Where P is the power in watts, E the volts and I the current in amperes, θ is the phase angle between E and I and δ is the angle of defect (=900- θ). Power factor is generally expressed as a decimal or in percent.
δθ tancot ==FactornDissipatio With most dielectrics δ is small so that .sincoscot δδθθ ≈≈ Tanand Capacitivity Є is the ratio of the charge in a capacitor at a given voltage to the charge when the dielectric is a vacuum, and is expressed as a number.
2.4 Characteristics and Applications of Insulating Materials The characteristics and applications of insulating materials will be considered under the following categories: Gases, specifically Air, Nitrogen, and Sulphur Hexafluoride (SF6); then liquid and solid insulations in order of their AIEE temperature classification as follows:
Types and Applications of Electrical Insulation
72A-1974-01 Rev. B 2/05 2-35
2.4.1 AIEE Temperature Classifications Class O (90°C)- Paper, pressboard and fabrics. Class A (105°C) - Varnish, cloths, oil (a leading impregnant); impregnated paper and its application to capacitors, cables and high-voltage bushings; dielectric breakdown. Class B (130° C); Class F (155° C); H (180°C). Mica plate with organic binding compounds. 220°C; over 220°C (Class C). Mica, heater-plate, high-heat mica plate, glass.
2.5 Gases
2.5.1 Air Air is an excellent insulator and dielectric so far as dielectric loss (zero) is concerned but its dielectric strength is ordinarily much less than that of usual insulating materials. Resistivity Infinitycmohm ≈−, Power Factor, Dissipation Factor = zero Normal Dielectric Strength = 54 Volts (RMS) per mil (76 Volts, peak) 21. 1Kv (RMS) per cm (30 kv; peak) all at atmospheric pressure 76 cm mercury. (See Fig. 1.) (1)Bibliography (1) pages 16-19 (Superior parenthetical numbers refer to Bibliography reference.
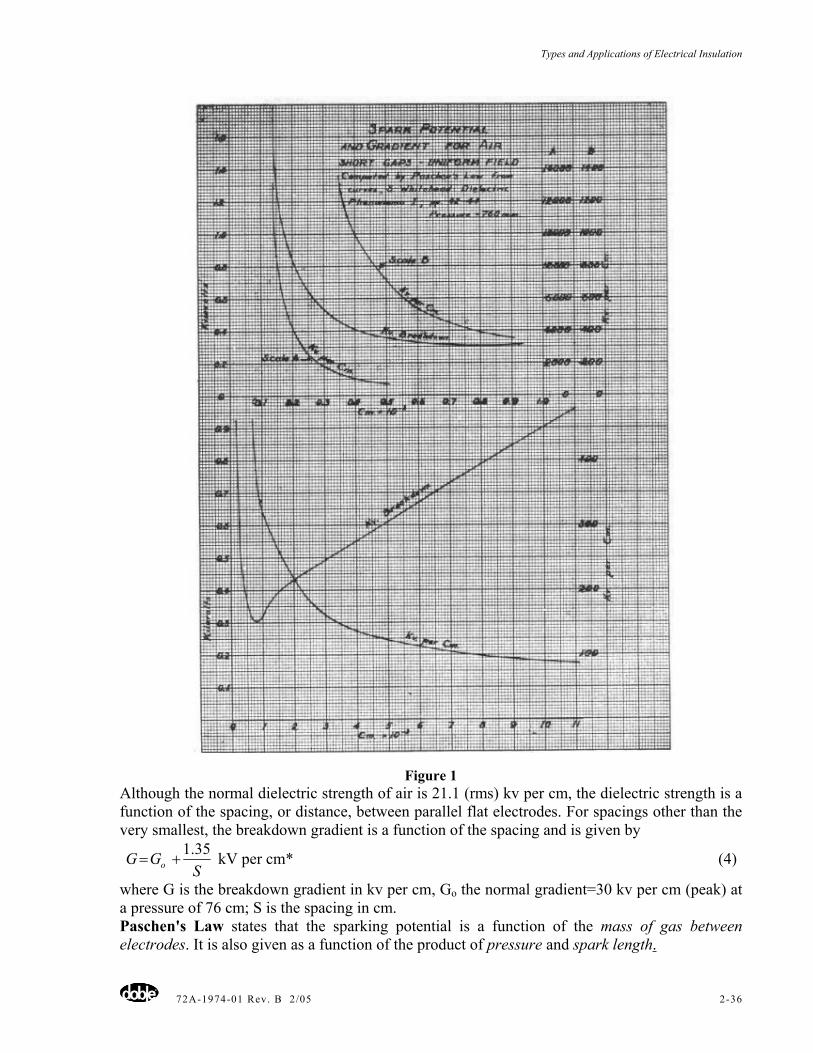
Types and Applications of Electrical Insulation
72A-1974-01 Rev. B 2/05 2-36
Figure 1 Although the normal dielectric strength of air is 21.1 (rms) kv per cm, the dielectric strength is a function of the spacing, or distance, between parallel flat electrodes. For spacings other than the very smallest, the breakdown gradient is a function of the spacing and is given by
S
GG o35.1
+= kV per cm* (4)
where G is the breakdown gradient in kv per cm, Go the normal gradient=30 kv per cm (peak) at a pressure of 76 cm; S is the spacing in cm. Paschen's Law states that the sparking potential is a function of the mass of gas between electrodes. It is also given as a function of the product of pressure and spark length.
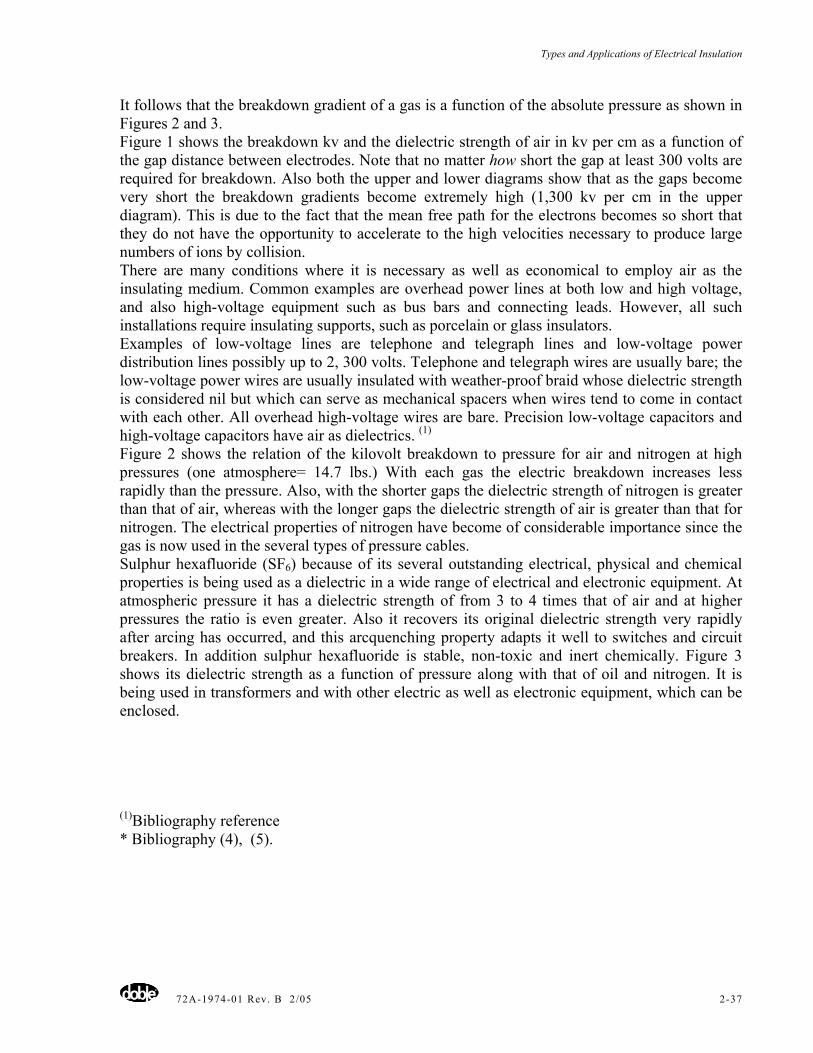
Types and Applications of Electrical Insulation
72A-1974-01 Rev. B 2/05 2-37
It follows that the breakdown gradient of a gas is a function of the absolute pressure as shown in Figures 2 and 3. Figure 1 shows the breakdown kv and the dielectric strength of air in kv per cm as a function of the gap distance between electrodes. Note that no matter how short the gap at least 300 volts are required for breakdown. Also both the upper and lower diagrams show that as the gaps become very short the breakdown gradients become extremely high (1,300 kv per cm in the upper diagram). This is due to the fact that the mean free path for the electrons becomes so short that they do not have the opportunity to accelerate to the high velocities necessary to produce large numbers of ions by collision. There are many conditions where it is necessary as well as economical to employ air as the insulating medium. Common examples are overhead power lines at both low and high voltage, and also high-voltage equipment such as bus bars and connecting leads. However, all such installations require insulating supports, such as porcelain or glass insulators. Examples of low-voltage lines are telephone and telegraph lines and low-voltage power distribution lines possibly up to 2, 300 volts. Telephone and telegraph wires are usually bare; the low-voltage power wires are usually insulated with weather-proof braid whose dielectric strength is considered nil but which can serve as mechanical spacers when wires tend to come in contact with each other. All overhead high-voltage wires are bare. Precision low-voltage capacitors and high-voltage capacitors have air as dielectrics. (1)
Figure 2 shows the relation of the kilovolt breakdown to pressure for air and nitrogen at high pressures (one atmosphere= 14.7 lbs.) With each gas the electric breakdown increases less rapidly than the pressure. Also, with the shorter gaps the dielectric strength of nitrogen is greater than that of air, whereas with the longer gaps the dielectric strength of air is greater than that for nitrogen. The electrical properties of nitrogen have become of considerable importance since the gas is now used in the several types of pressure cables. Sulphur hexafluoride (SF6) because of its several outstanding electrical, physical and chemical properties is being used as a dielectric in a wide range of electrical and electronic equipment. At atmospheric pressure it has a dielectric strength of from 3 to 4 times that of air and at higher pressures the ratio is even greater. Also it recovers its original dielectric strength very rapidly after arcing has occurred, and this arcquenching property adapts it well to switches and circuit breakers. In addition sulphur hexafluoride is stable, non-toxic and inert chemically. Figure 3 shows its dielectric strength as a function of pressure along with that of oil and nitrogen. It is being used in transformers and with other electric as well as electronic equipment, which can be enclosed. (1)Bibliography reference * Bibliography (4), (5).
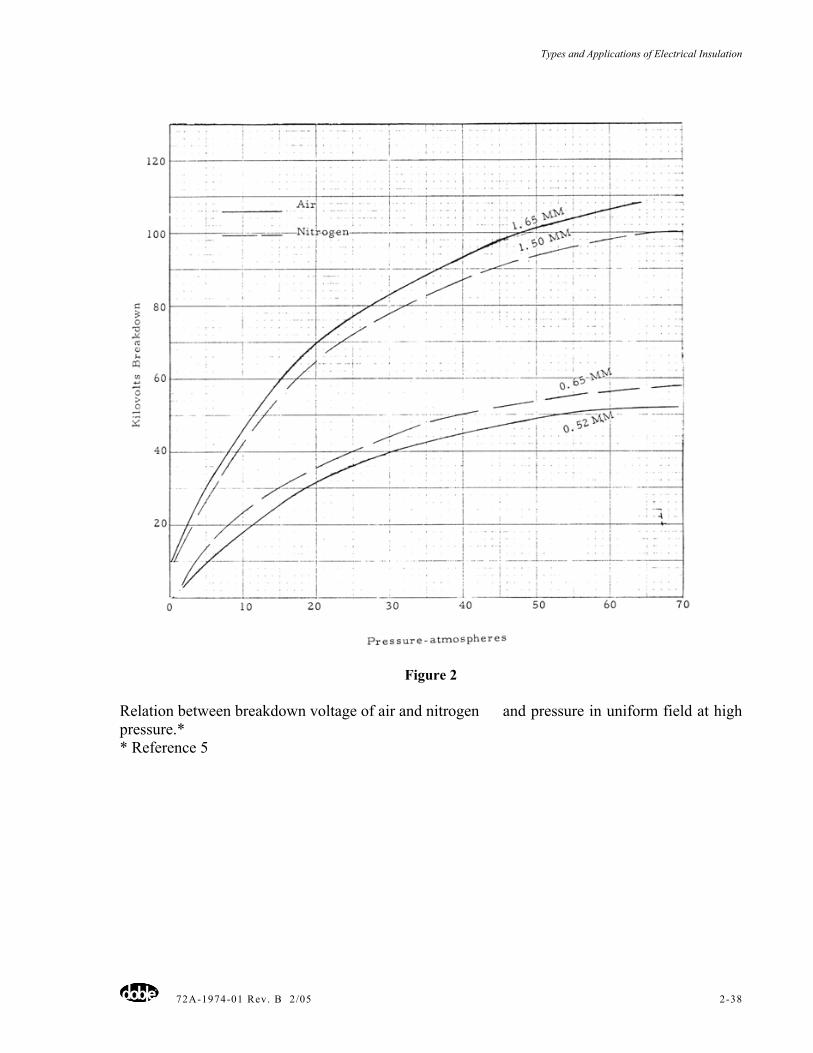
Types and Applications of Electrical Insulation
72A-1974-01 Rev. B 2/05 2-38
Figure 2 Relation between breakdown voltage of air and nitrogen and pressure in uniform field at high pressure.* * Reference 5
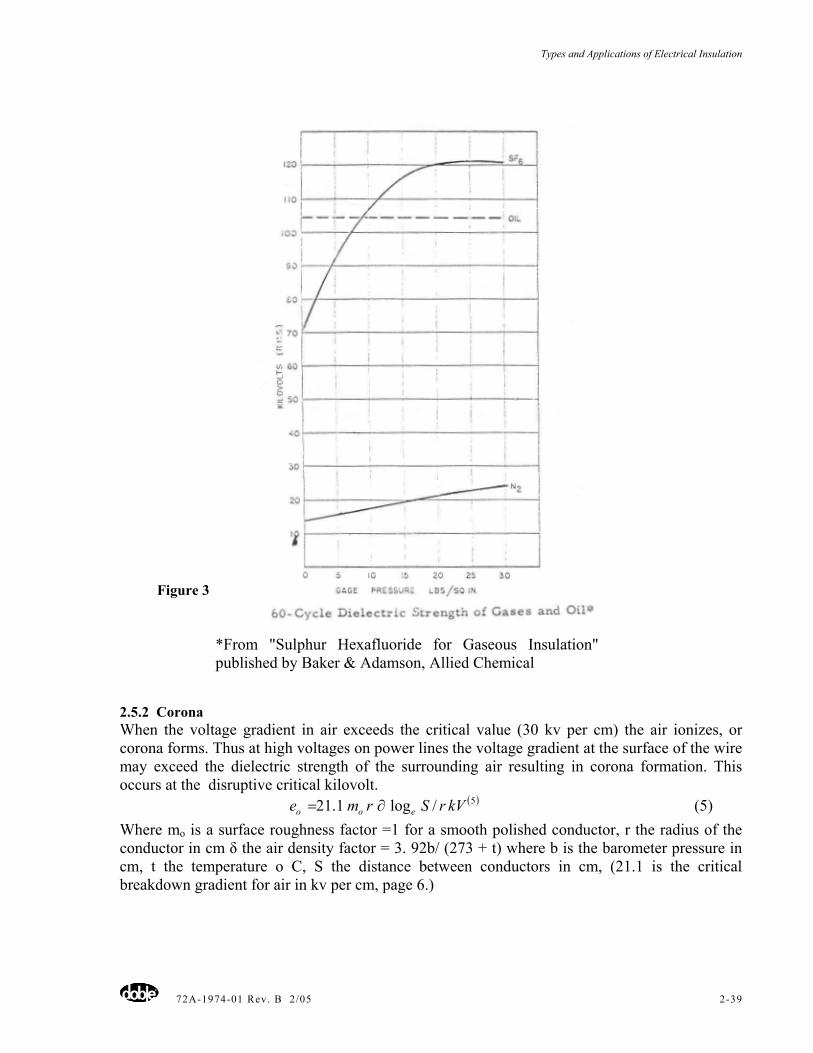
Types and Applications of Electrical Insulation
72A-1974-01 Rev. B 2/05 2-39
Figure 3
*From "Sulphur Hexafluoride for Gaseous Insulation" published by Baker & Adamson, Allied Chemical
2.5.2 Corona When the voltage gradient in air exceeds the critical value (30 kv per cm) the air ionizes, or corona forms. Thus at high voltages on power lines the voltage gradient at the surface of the wire may exceed the dielectric strength of the surrounding air resulting in corona formation. This occurs at the disruptive critical kilovolt.
( )5/log1.21 kVrSrme eoo ∂= (5) Where mo is a surface roughness factor =1 for a smooth polished conductor, r the radius of the conductor in cm δ the air density factor = 3. 92b/ (273 + t) where b is the barometer pressure in cm, t the temperature o C, S the distance between conductors in cm, (21.1 is the critical breakdown gradient for air in kv per cm, page 6.)
Types and Applications of Electrical Insulation
72A-1974-01 Rev. B 2/05 2-40
Figure 4
Transmission line corona loss
Figure 4 shows the fair and foul weather corona loss for a 3-phase line with ACSR (aluminum cable steel reinforced) 1. 65 inches diameter. Note that the foul weather loss exceeds the fair-weather loss by a large amount. In the design of the recent extra-high-voltage (EHV) power lines, 345-500 kv, corona is the paramount problem, not only because of the accompanying power loss but also because of radio interference (RI). The high dielectric strength of gases at high pressures makes possible their use as the primary dielectric for cables. Nitrogen is used almost entirely because it is chemically inert and its cost is low. When under high pressure (Figure 2) it has high dielectric strength and corona cannot occur. Because of such high dielectric strength it is used as the gas in pressure types of underground cables.
2.6 Class of Materials (900 C) Cotton, silk, paper, etc., without impregnation. Cotton, linen and silk inherently are hygroscopic materials and normally contain 8. 5 to 11.0% water but under humid conditions can absorb 20% to 30% by weight and still appear dry. Such moisture is very deleterious to insulating and dielectric properties so that when in use the materials should be dry and protected from moisture. The best insulating properties develop when such materials are impregnated, (Class A). Untreated fabrics are used for sleeving and webbing and as insulation for magnet wire although such wire usually has enamel coating, also.
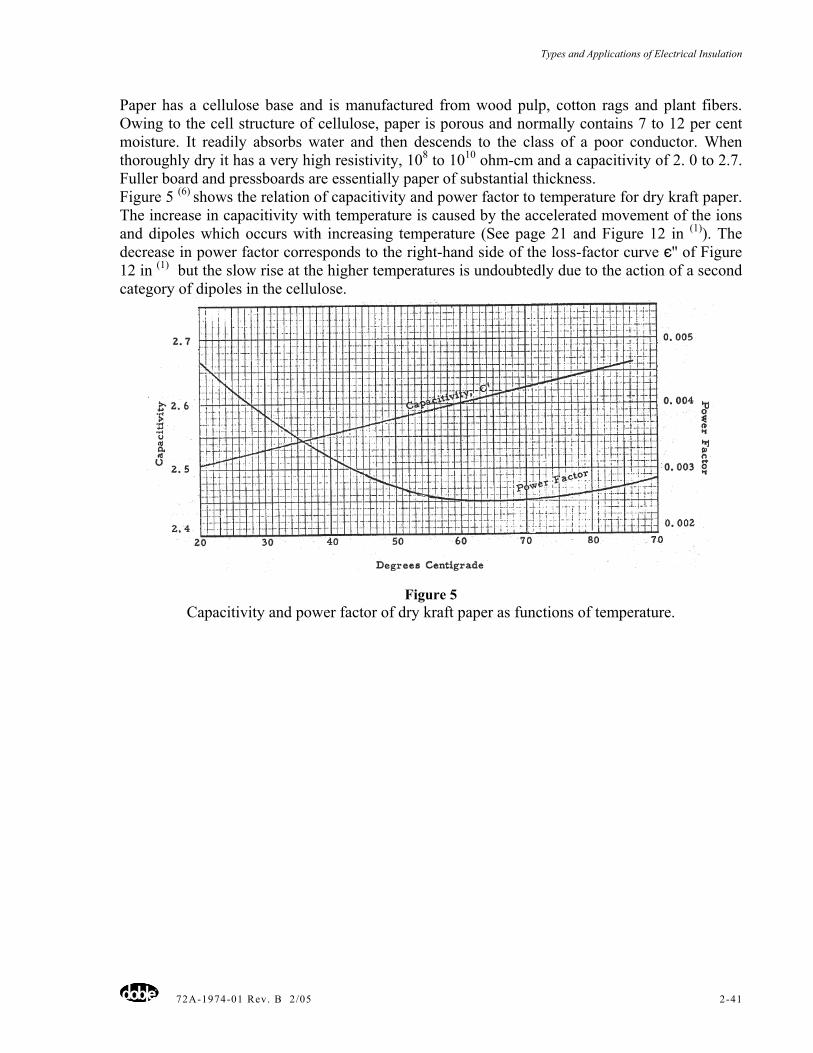
Types and Applications of Electrical Insulation
72A-1974-01 Rev. B 2/05 2-41
Paper has a cellulose base and is manufactured from wood pulp, cotton rags and plant fibers. Owing to the cell structure of cellulose, paper is porous and normally contains 7 to 12 per cent moisture. It readily absorbs water and then descends to the class of a poor conductor. When thoroughly dry it has a very high resistivity, 108 to 1010 ohm-cm and a capacitivity of 2. 0 to 2.7. Fuller board and pressboards are essentially paper of substantial thickness. Figure 5 (6) shows the relation of capacitivity and power factor to temperature for dry kraft paper. The increase in capacitivity with temperature is caused by the accelerated movement of the ions and dipoles which occurs with increasing temperature (See page 21 and Figure 12 in (1)). The decrease in power factor corresponds to the right-hand side of the loss-factor curve є'' of Figure 12 in (1) but the slow rise at the higher temperatures is undoubtedly due to the action of a second category of dipoles in the cellulose.
Figure 5 Capacitivity and power factor of dry kraft paper as functions of temperature.
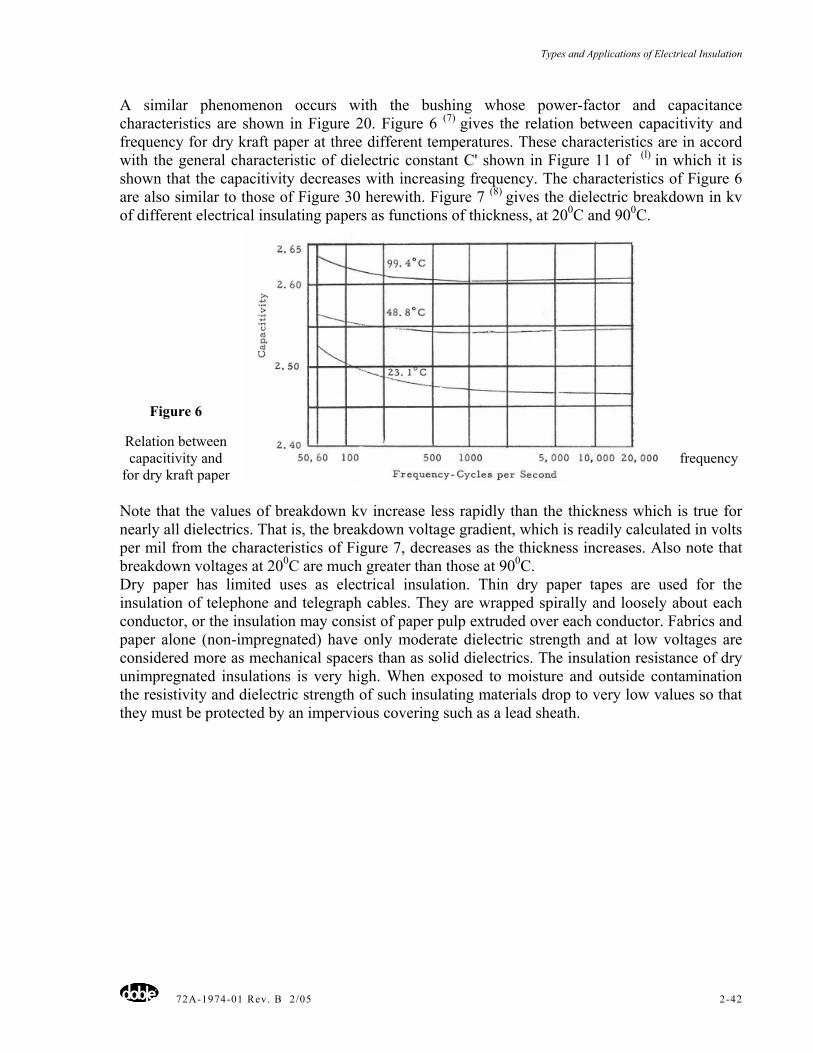
Types and Applications of Electrical Insulation
72A-1974-01 Rev. B 2/05 2-42
A similar phenomenon occurs with the bushing whose power-factor and capacitance characteristics are shown in Figure 20. Figure 6 (7) gives the relation between capacitivity and frequency for dry kraft paper at three different temperatures. These characteristics are in accord with the general characteristic of dielectric constant C' shown in Figure 11 of (l) in which it is shown that the capacitivity decreases with increasing frequency. The characteristics of Figure 6 are also similar to those of Figure 30 herewith. Figure 7 (8) gives the dielectric breakdown in kv of different electrical insulating papers as functions of thickness, at 200C and 900C.
Figure 6
Relation between capacitivity and frequency
for dry kraft paper Note that the values of breakdown kv increase less rapidly than the thickness which is true for nearly all dielectrics. That is, the breakdown voltage gradient, which is readily calculated in volts per mil from the characteristics of Figure 7, decreases as the thickness increases. Also note that breakdown voltages at 200C are much greater than those at 900C. Dry paper has limited uses as electrical insulation. Thin dry paper tapes are used for the insulation of telephone and telegraph cables. They are wrapped spirally and loosely about each conductor, or the insulation may consist of paper pulp extruded over each conductor. Fabrics and paper alone (non-impregnated) have only moderate dielectric strength and at low voltages are considered more as mechanical spacers than as solid dielectrics. The insulation resistance of dry unimpregnated insulations is very high. When exposed to moisture and outside contamination the resistivity and dielectric strength of such insulating materials drop to very low values so that they must be protected by an impervious covering such as a lead sheath.
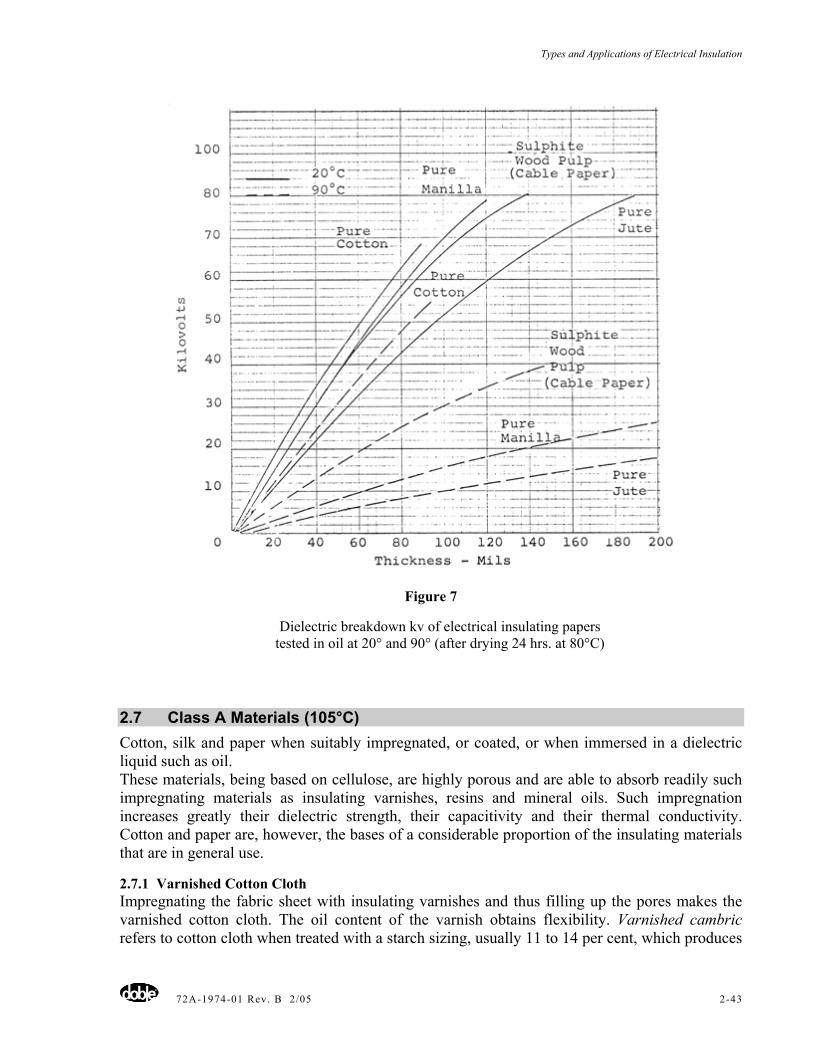
Types and Applications of Electrical Insulation
72A-1974-01 Rev. B 2/05 2-43
Figure 7
Dielectric breakdown kv of electrical insulating papers tested in oil at 20° and 90° (after drying 24 hrs. at 80°C)
2.7 Class A Materials (105°C) Cotton, silk and paper when suitably impregnated, or coated, or when immersed in a dielectric liquid such as oil. These materials, being based on cellulose, are highly porous and are able to absorb readily such impregnating materials as insulating varnishes, resins and mineral oils. Such impregnation increases greatly their dielectric strength, their capacitivity and their thermal conductivity. Cotton and paper are, however, the bases of a considerable proportion of the insulating materials that are in general use.
2.7.1 Varnished Cotton Cloth Impregnating the fabric sheet with insulating varnishes and thus filling up the pores makes the varnished cotton cloth. The oil content of the varnish obtains flexibility. Varnished cambric refers to cotton cloth when treated with a starch sizing, usually 11 to 14 per cent, which produces
Types and Applications of Electrical Insulation
72A-1974-01 Rev. B 2/05 2-44
a stiff cloth. The varnish is applied in from two to eight coats, baked dry between applications. The thicknesses of the sheets range from 5 to 20 mils. Varnished cloth and cambric are resistant to petrolatum and transformer oils and to corona and ozone. Table III gives normal values of tensile strength and dielectric strength of varnished cloths in accordance with NEMA standards.
TABLE III Properties of Varnished Cloths and Tapes
Type Thickness Mils. Tensile Strength lb. per in. Width
Dielectric Strength Volts per mil.
5 32 800 Black Cotton 10-15 38 900
5 32 700 Yellow Cotton
10-15 38 800 2-3 14 1, 800 5 16 1, 600Yellow Silk
7-8 16 1, 500
Power Factor - Approximately 8 per cent
Although Table III gives normal, or representative, values of dielectric strength for varnished cloths and tapes, as with air, the dielectric strength (volts per mil) is a function of the thickness, decreasing with increasing thickness of the insulation. Figure 8 (8) gives the dielectric breakdown voltage for common types of sheet and board insulation as a function of the thickness, plotted with log-log coordinates. The relation between the breakdown voltage and thickness may be expressed as
NCTKv = (6)
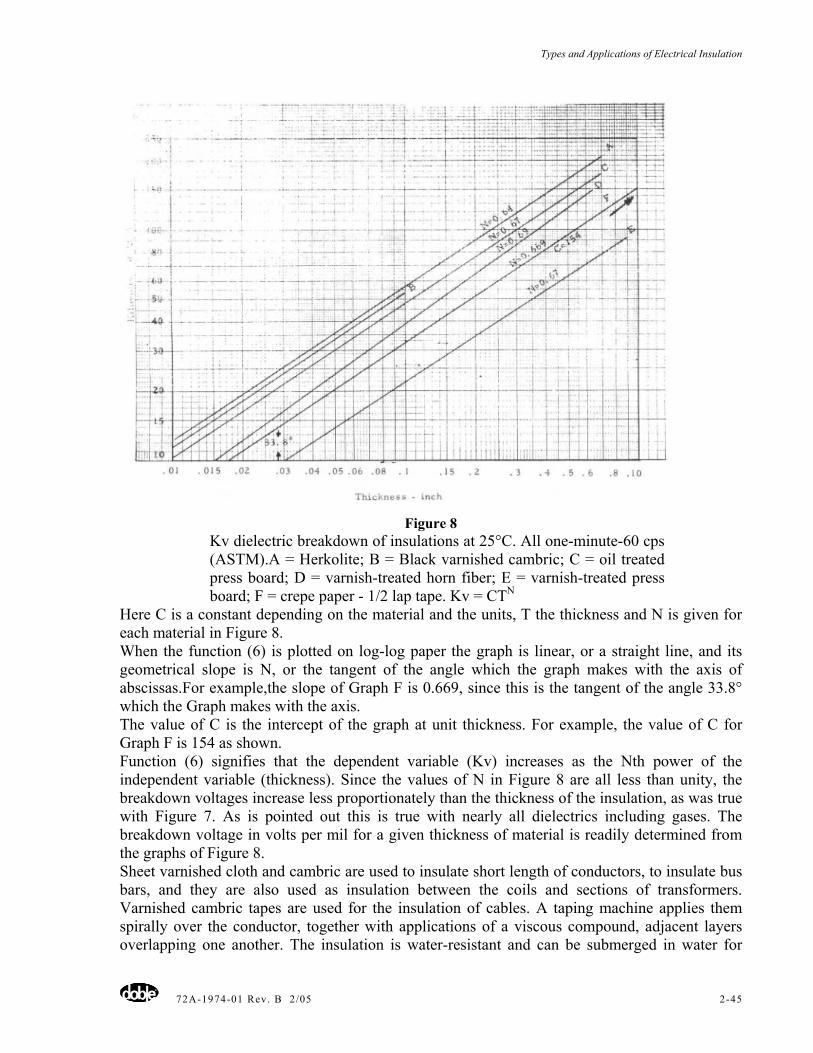
Types and Applications of Electrical Insulation
72A-1974-01 Rev. B 2/05 2-45
Figure 8 Kv dielectric breakdown of insulations at 25°C. All one-minute-60 cps (ASTM).A = Herkolite; B = Black varnished cambric; C = oil treated press board; D = varnish-treated horn fiber; E = varnish-treated press board; F = crepe paper - 1/2 lap tape. Kv = CTN
Here C is a constant depending on the material and the units, T the thickness and N is given for each material in Figure 8. When the function (6) is plotted on log-log paper the graph is linear, or a straight line, and its geometrical slope is N, or the tangent of the angle which the graph makes with the axis of abscissas.For example,the slope of Graph F is 0.669, since this is the tangent of the angle 33.8° which the Graph makes with the axis. The value of C is the intercept of the graph at unit thickness. For example, the value of C for Graph F is 154 as shown. Function (6) signifies that the dependent variable (Kv) increases as the Nth power of the independent variable (thickness). Since the values of N in Figure 8 are all less than unity, the breakdown voltages increase less proportionately than the thickness of the insulation, as was true with Figure 7. As is pointed out this is true with nearly all dielectrics including gases. The breakdown voltage in volts per mil for a given thickness of material is readily determined from the graphs of Figure 8. Sheet varnished cloth and cambric are used to insulate short length of conductors, to insulate bus bars, and they are also used as insulation between the coils and sections of transformers. Varnished cambric tapes are used for the insulation of cables. A taping machine applies them spirally over the conductor, together with applications of a viscous compound, adjacent layers overlapping one another. The insulation is water-resistant and can be submerged in water for
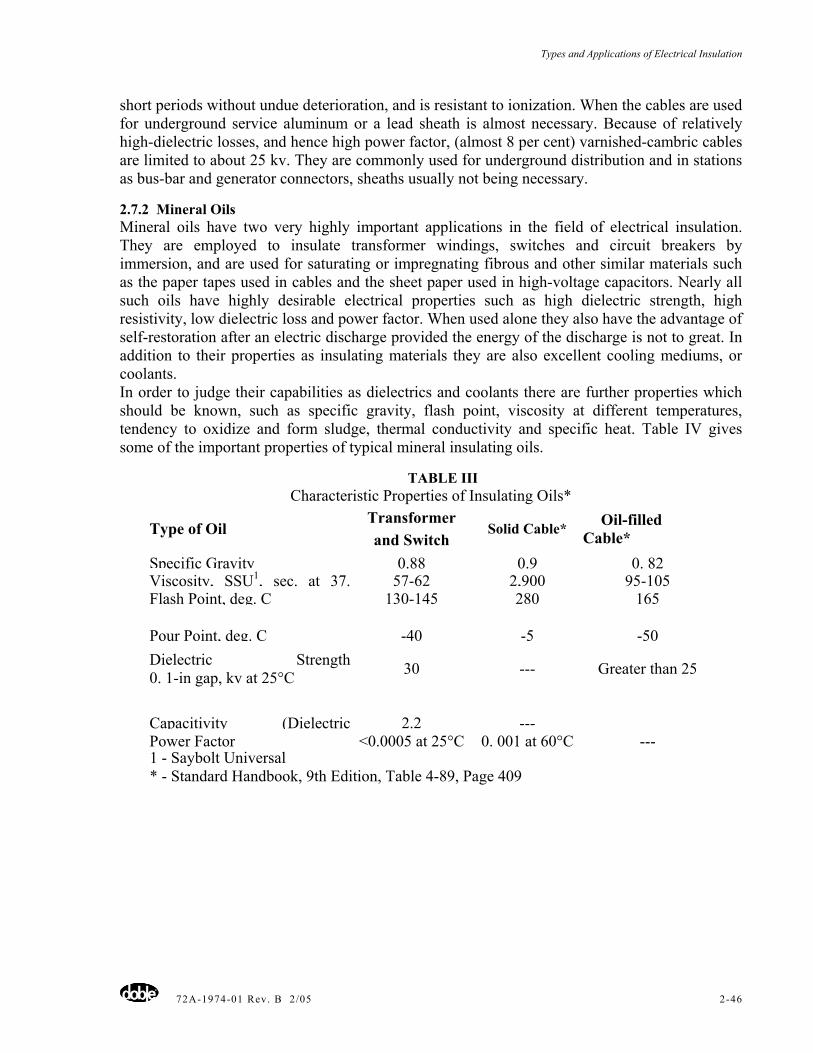
Types and Applications of Electrical Insulation
72A-1974-01 Rev. B 2/05 2-46
short periods without undue deterioration, and is resistant to ionization. When the cables are used for underground service aluminum or a lead sheath is almost necessary. Because of relatively high-dielectric losses, and hence high power factor, (almost 8 per cent) varnished-cambric cables are limited to about 25 kv. They are commonly used for underground distribution and in stations as bus-bar and generator connectors, sheaths usually not being necessary.
2.7.2 Mineral Oils Mineral oils have two very highly important applications in the field of electrical insulation. They are employed to insulate transformer windings, switches and circuit breakers by immersion, and are used for saturating or impregnating fibrous and other similar materials such as the paper tapes used in cables and the sheet paper used in high-voltage capacitors. Nearly all such oils have highly desirable electrical properties such as high dielectric strength, high resistivity, low dielectric loss and power factor. When used alone they also have the advantage of self-restoration after an electric discharge provided the energy of the discharge is not to great. In addition to their properties as insulating materials they are also excellent cooling mediums, or coolants. In order to judge their capabilities as dielectrics and coolants there are further properties which should be known, such as specific gravity, flash point, viscosity at different temperatures, tendency to oxidize and form sludge, thermal conductivity and specific heat. Table IV gives some of the important properties of typical mineral insulating oils.
TABLE III Characteristic Properties of Insulating Oils*
Type of Oil Transformer and Switch
Solid Cable* Oil-filled Cable*
Specific Gravity 0.88 0.9 0. 82Viscosity, SSU1, sec. at 37. 57-62 2,900 95-105Flash Point, deg. C 130-145 280 165 Pour Point, deg. C -40 -5 -50Dielectric Strength0. 1-in gap, kv at 25°C 30 --- Greater than 25
Capacitivity (Dielectric 2.2 --- Power Factor <0.0005 at 25°C 0. 001 at 60°C ---1 - Saybolt Universal * - Standard Handbook, 9th Edition, Table 4-89, Page 409
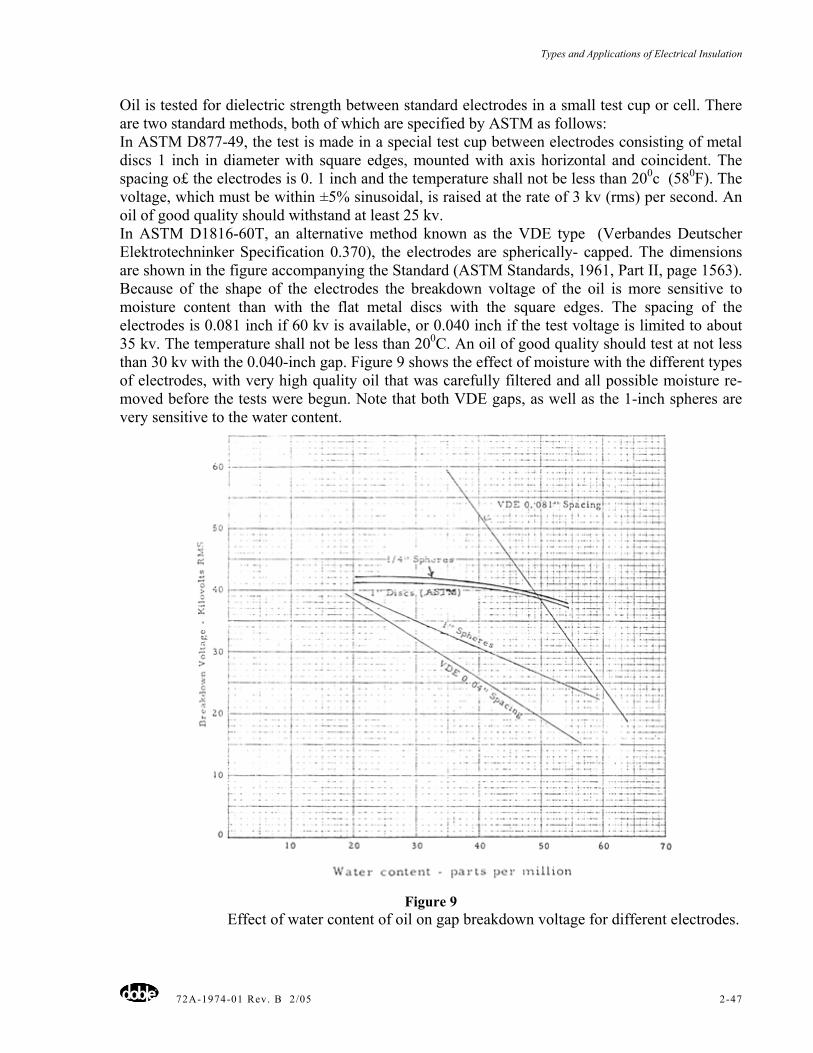
Types and Applications of Electrical Insulation
72A-1974-01 Rev. B 2/05 2-47
Oil is tested for dielectric strength between standard electrodes in a small test cup or cell. There are two standard methods, both of which are specified by ASTM as follows: In ASTM D877-49, the test is made in a special test cup between electrodes consisting of metal discs 1 inch in diameter with square edges, mounted with axis horizontal and coincident. The spacing o£ the electrodes is 0. 1 inch and the temperature shall not be less than 200c (580F). The voltage, which must be within ±5% sinusoidal, is raised at the rate of 3 kv (rms) per second. An oil of good quality should withstand at least 25 kv. In ASTM D1816-60T, an alternative method known as the VDE type (Verbandes Deutscher Elektrotechninker Specification 0.370), the electrodes are spherically- capped. The dimensions are shown in the figure accompanying the Standard (ASTM Standards, 1961, Part II, page 1563). Because of the shape of the electrodes the breakdown voltage of the oil is more sensitive to moisture content than with the flat metal discs with the square edges. The spacing of the electrodes is 0.081 inch if 60 kv is available, or 0.040 inch if the test voltage is limited to about 35 kv. The temperature shall not be less than 200C. An oil of good quality should test at not less than 30 kv with the 0.040-inch gap. Figure 9 shows the effect of moisture with the different types of electrodes, with very high quality oil that was carefully filtered and all possible moisture re-moved before the tests were begun. Note that both VDE gaps, as well as the 1-inch spheres are very sensitive to the water content.
Figure 9 Effect of water content of oil on gap breakdown voltage for different electrodes.
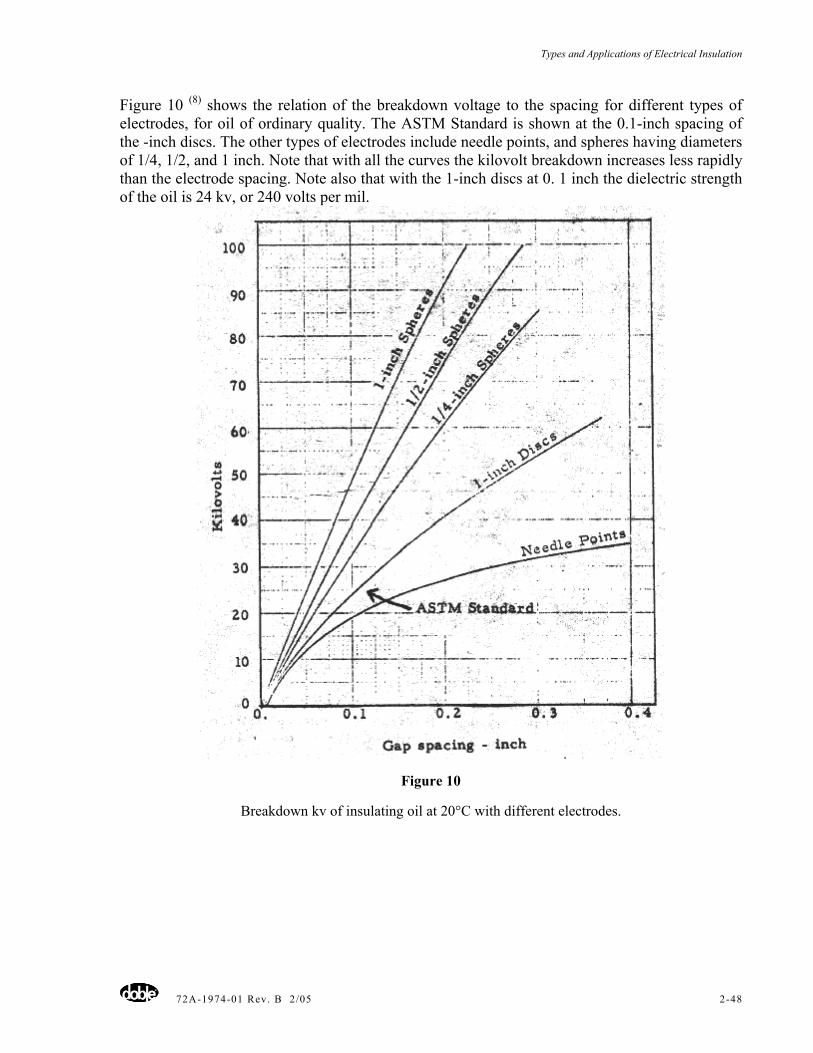
Types and Applications of Electrical Insulation
72A-1974-01 Rev. B 2/05 2-48
Figure 10 (8) shows the relation of the breakdown voltage to the spacing for different types of electrodes, for oil of ordinary quality. The ASTM Standard is shown at the 0.1-inch spacing of the -inch discs. The other types of electrodes include needle points, and spheres having diameters of 1/4, 1/2, and 1 inch. Note that with all the curves the kilovolt breakdown increases less rapidly than the electrode spacing. Note also that with the 1-inch discs at 0. 1 inch the dielectric strength of the oil is 24 kv, or 240 volts per mil.
Figure 10
Breakdown kv of insulating oil at 20°C with different electrodes.
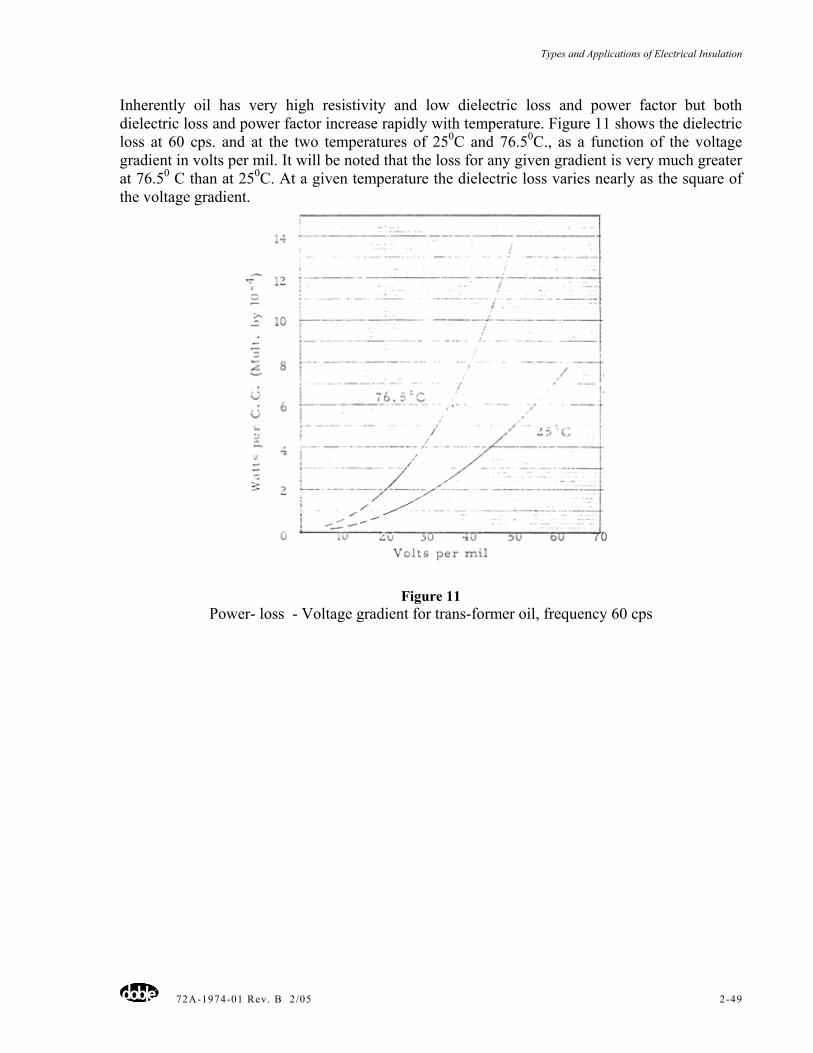
Types and Applications of Electrical Insulation
72A-1974-01 Rev. B 2/05 2-49
Inherently oil has very high resistivity and low dielectric loss and power factor but both dielectric loss and power factor increase rapidly with temperature. Figure 11 shows the dielectric loss at 60 cps. and at the two temperatures of 250C and 76.50C., as a function of the voltage gradient in volts per mil. It will be noted that the loss for any given gradient is very much greater at 76.50 C than at 250C. At a given temperature the dielectric loss varies nearly as the square of the voltage gradient.
Figure 11 Power- loss - Voltage gradient for trans-former oil, frequency 60 cps
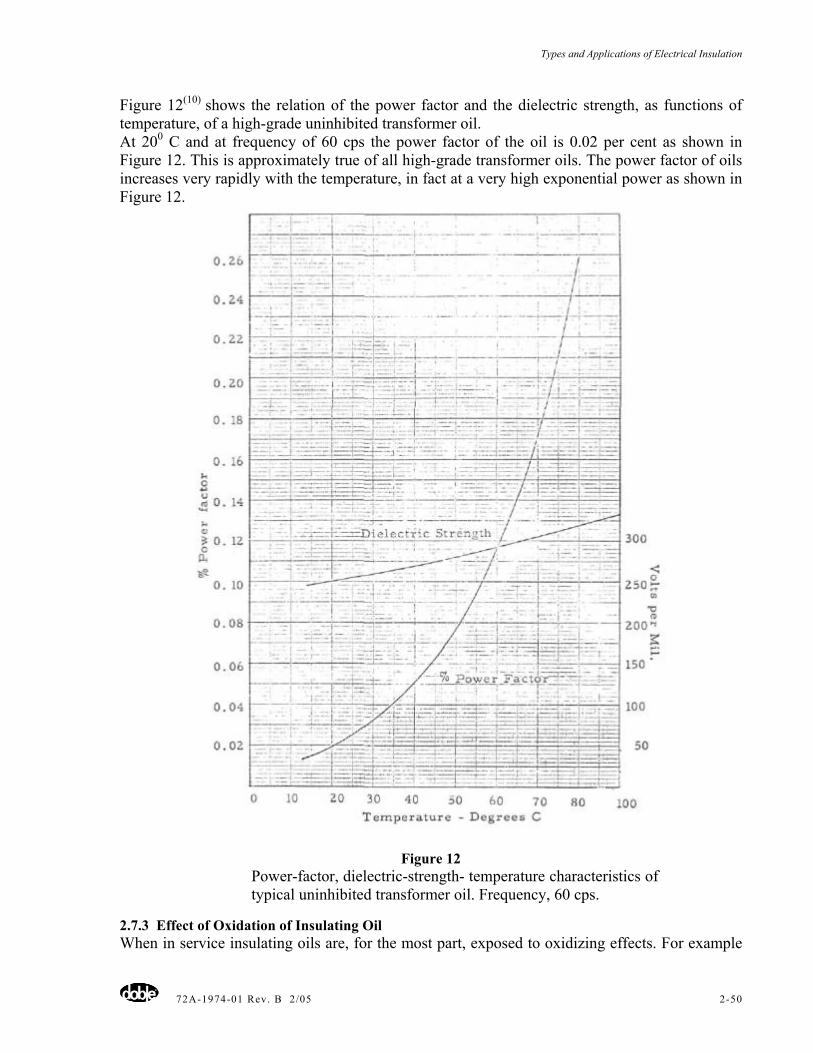
Types and Applications of Electrical Insulation
72A-1974-01 Rev. B 2/05 2-50
Figure 12(10) shows the relation of the power factor and the dielectric strength, as functions of temperature, of a high-grade uninhibited transformer oil. At 200 C and at frequency of 60 cps the power factor of the oil is 0.02 per cent as shown in Figure 12. This is approximately true of all high-grade transformer oils. The power factor of oils increases very rapidly with the temperature, in fact at a very high exponential power as shown in Figure 12.
Figure 12 Power-factor, dielectric-strength- temperature characteristics of typical uninhibited transformer oil. Frequency, 60 cps.
2.7.3 Effect of Oxidation of Insulating Oil When in service insulating oils are, for the most part, exposed to oxidizing effects. For example
Types and Applications of Electrical Insulation
72A-1974-01 Rev. B 2/05 2-51
in transformers, unless special devices such as ''breathers" and, conservators are installed, the circulating oil comes more or less in contact with the air at the top of the transformer tank. Without such special devices, the air at the top of the tank expands when the temperature of the transformer is increasing and some of the air is expelled through the gasket. When the transformer cools, the air is drawn in. Transformers then are continually "breathing" and in so doing, they draw in new air from outside containing moisture. The oil thus absorbs oxygen and moisture from this air and ultimately its dielectric properties deteriorate and sludge and acids form. Since both sludge and acids cause high deterioration in both the electrical and dielectric properties of the oil, and sludge clogs the oil passages in electrical equipment, it is advantageous to use oil, which is stable or resistant to deterioration by oxidation. The Doble Oxidizer was developed to accelerate the oxidizing action and to rate oils for oxidation resistance. A sample of oil is placed in a test tube together with a coil of copper wire and maintained at 950C while dry air is bubbled through it. The sample is inspected periodically for visual evidence of sludge. The length of time required to produce visible sludge is used as an index of oil stability. Experience with the Doble Oxidizer indicates that certain crudest and certain refining processes produce thy most stable oils. The results of the oxidizer tests are therefore considered in the selection of oil, even in applications where minimum exposure to oxygen is anticipated. The oxidizer test has been enhanced by including a continuous measurement of the oil power factor during the test run has enhanced the oxidizer test. With this feature, the test is called the Doble Power-Factor Valued Oxidation (PFVO) Test. (11) Power factor is recorded automatically as a function of the oxidation time, from which a characteristic graph for the oil under test can be produced thereby, affording an excellent continuity bench mark. Figure 13 shows two typical PFVO graphs. In typical oils as shown in Figure 13 the power factor at first increases to a peak, then decreases to a lower value and then under the oxidizing process increases continuously until a "sludge'' or ''end point" is reached. The dotted line is a "bogey" established as a result of long experiences with good oils. Those oils whose characteristic lies below this "bogey" line are considered good oils and those characteristic lies above are considered poor oils. Thus A is considered a "good" oil, and B ''poor" oil. With oil sludge begins to form at 72 hours, and with oil B sludge begins to form at 48 hours, giving the two, respective end points shown in Figure 13. Oil A is known as a "72-hour" oil and oil B a "48-hour'' oil.(1)
2.7.4 Impregnated Paper Paper is a cellulose product consisting of about 48 per cent carbon, 46 per cent oxygen and 6 per cent hydrogen. It consists of innumerable small cells, or pores, contained within the cellulose. It is thus well adapted to impregnation with varnishes, gums, synthetic resins, petrolatum and petroleum, or mineral oils. Such impregnation produces many beneficial results. (1) The impregnating materials fill up the porous cells in the paper thus excluding moisture. (2) The dielectric strength is increased usually to a value far exceeding the sum of that of the basic material (paper) and that of the impregnant (oil). (3) The heat-resistance of the basic material is often substantially increased. (4) The thermal conductivity of the impregnated paper is increased over that of the paper alone resulting in much better heat dissipation.
(1) After December 1, 1963 these oils would be rated as having a 64-hour, and 40-hour life, respectively.
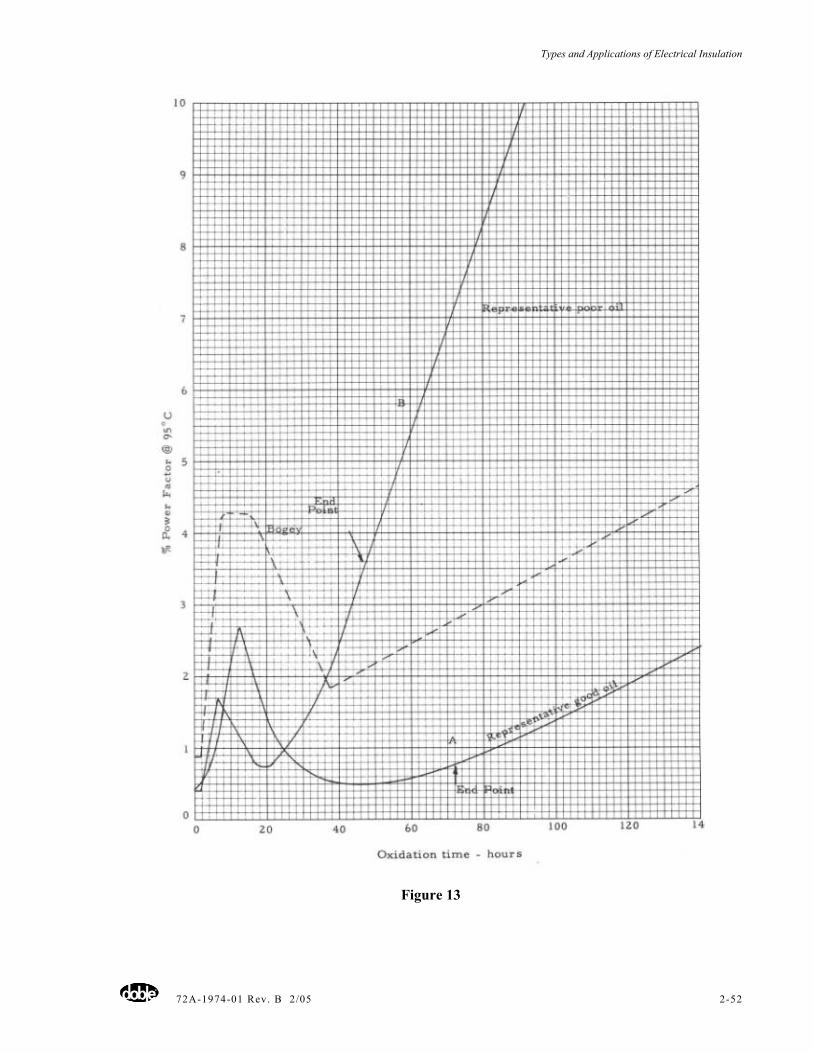
Types and Applications of Electrical Insulation
72A-1974-01 Rev. B 2/05 2-52
Figure 13
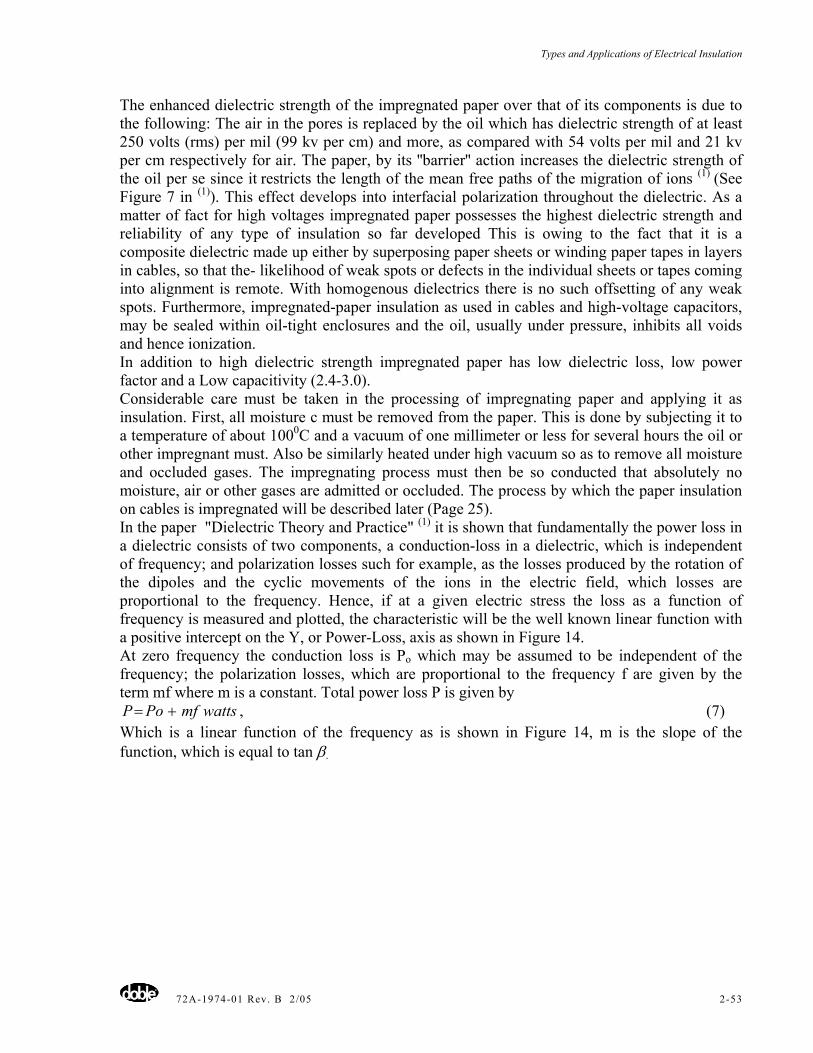
Types and Applications of Electrical Insulation
72A-1974-01 Rev. B 2/05 2-53
The enhanced dielectric strength of the impregnated paper over that of its components is due to the following: The air in the pores is replaced by the oil which has dielectric strength of at least 250 volts (rms) per mil (99 kv per cm) and more, as compared with 54 volts per mil and 21 kv per cm respectively for air. The paper, by its ''barrier'' action increases the dielectric strength of the oil per se since it restricts the length of the mean free paths of the migration of ions (1) (See Figure 7 in (1)). This effect develops into interfacial polarization throughout the dielectric. As a matter of fact for high voltages impregnated paper possesses the highest dielectric strength and reliability of any type of insulation so far developed This is owing to the fact that it is a composite dielectric made up either by superposing paper sheets or winding paper tapes in layers in cables, so that the- likelihood of weak spots or defects in the individual sheets or tapes coming into alignment is remote. With homogenous dielectrics there is no such offsetting of any weak spots. Furthermore, impregnated-paper insulation as used in cables and high-voltage capacitors, may be sealed within oil-tight enclosures and the oil, usually under pressure, inhibits all voids and hence ionization. In addition to high dielectric strength impregnated paper has low dielectric loss, low power factor and a Low capacitivity (2.4-3.0). Considerable care must be taken in the processing of impregnating paper and applying it as insulation. First, all moisture c must be removed from the paper. This is done by subjecting it to a temperature of about 1000C and a vacuum of one millimeter or less for several hours the oil or other impregnant must. Also be similarly heated under high vacuum so as to remove all moisture and occluded gases. The impregnating process must then be so conducted that absolutely no moisture, air or other gases are admitted or occluded. The process by which the paper insulation on cables is impregnated will be described later (Page 25). In the paper "Dielectric Theory and Practice" (1) it is shown that fundamentally the power loss in a dielectric consists of two components, a conduction-loss in a dielectric, which is independent of frequency; and polarization losses such for example, as the losses produced by the rotation of the dipoles and the cyclic movements of the ions in the electric field, which losses are proportional to the frequency. Hence, if at a given electric stress the loss as a function of frequency is measured and plotted, the characteristic will be the well known linear function with a positive intercept on the Y, or Power-Loss, axis as shown in Figure 14. At zero frequency the conduction loss is Po which may be assumed to be independent of the frequency; the polarization losses, which are proportional to the frequency f are given by the term mf where m is a constant. Total power loss P is given by
wattsmfPoP += , (7) Which is a linear function of the frequency as is shown in Figure 14, m is the slope of the function, which is equal to tan β.
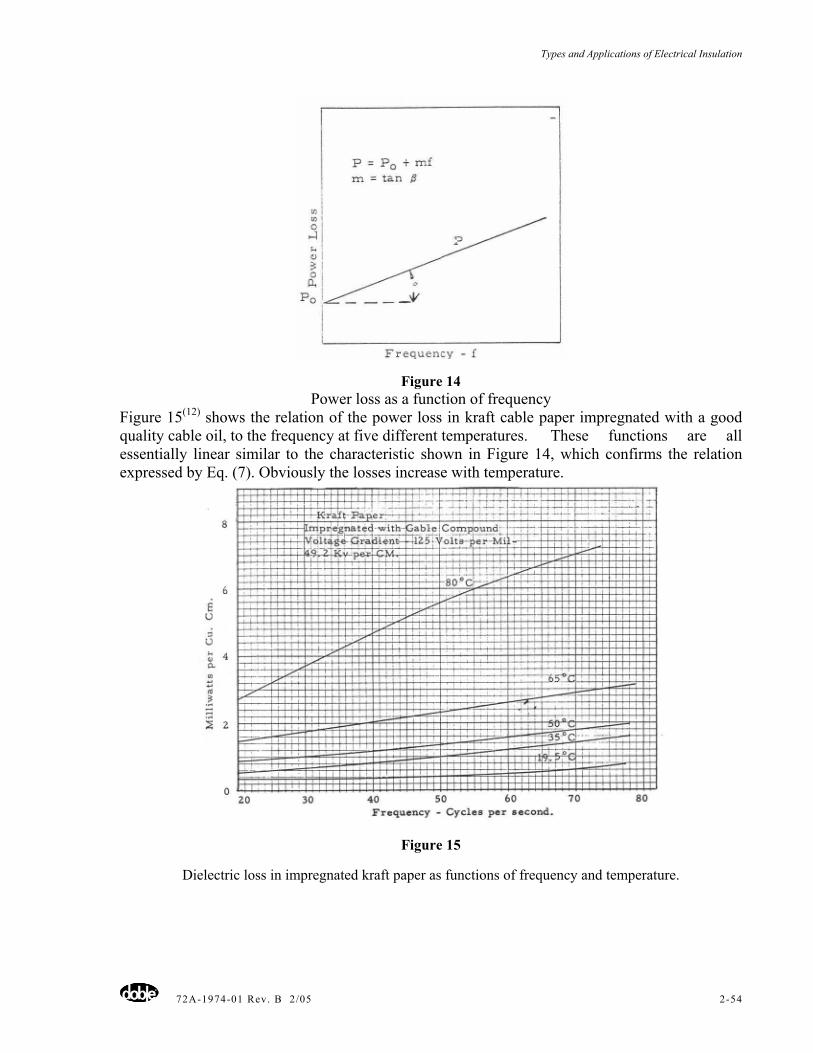
Types and Applications of Electrical Insulation
72A-1974-01 Rev. B 2/05 2-54
Figure 14 Power loss as a function of frequency
Figure 15(12) shows the relation of the power loss in kraft cable paper impregnated with a good quality cable oil, to the frequency at five different temperatures. These functions are all essentially linear similar to the characteristic shown in Figure 14, which confirms the relation expressed by Eq. (7). Obviously the losses increase with temperature.
Figure 15
Dielectric loss in impregnated kraft paper as functions of frequency and temperature.
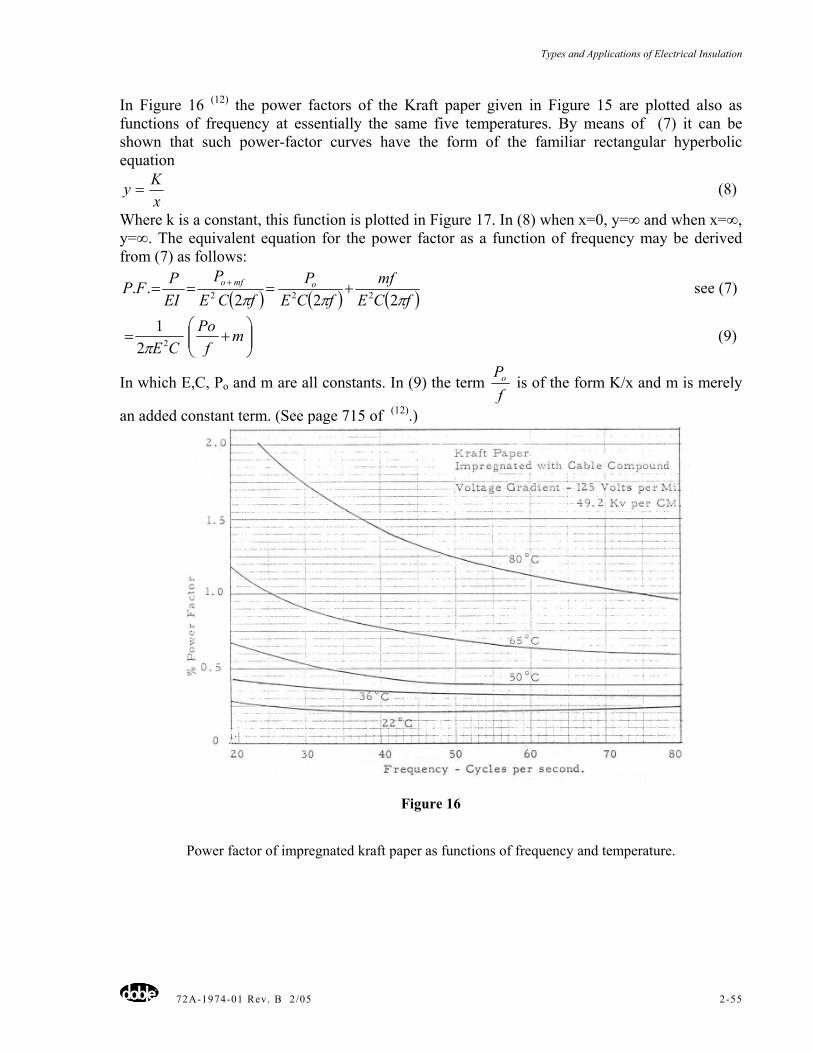
Types and Applications of Electrical Insulation
72A-1974-01 Rev. B 2/05 2-55
In Figure 16 (12) the power factors of the Kraft paper given in Figure 15 are plotted also as functions of frequency at essentially the same five temperatures. By means of (7) it can be shown that such power-factor curves have the form of the familiar rectangular hyperbolic equation
xKy = (8)
Where k is a constant, this function is plotted in Figure 17. In (8) when x=0, y=∞ and when x=∞, y=∞. The equivalent equation for the power factor as a function of frequency may be derived from (7) as follows:
( ) ( ) ( )fCEmf
fCEP
fCEP
EIPFP omfo
πππ 222.. 222 +=== + see (7)
⎟⎟⎠
⎞⎜⎜⎝
⎛+= m
fPo
CE 221
π (9)
In which E,C, Po and m are all constants. In (9) the term f
Po is of the form K/x and m is merely
an added constant term. (See page 715 of (12).)
Figure 16
Power factor of impregnated kraft paper as functions of frequency and temperature.
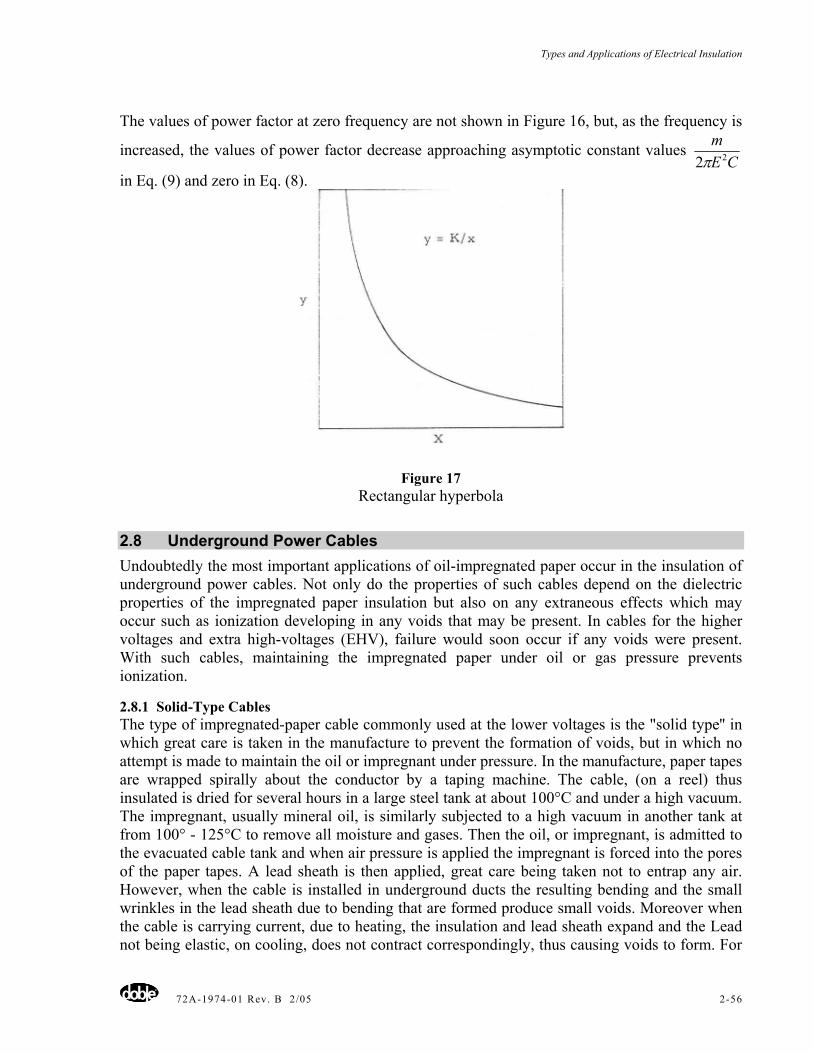
Types and Applications of Electrical Insulation
72A-1974-01 Rev. B 2/05 2-56
The values of power factor at zero frequency are not shown in Figure 16, but, as the frequency is
increased, the values of power factor decrease approaching asymptotic constant values CE
m22π
in Eq. (9) and zero in Eq. (8).
Figure 17 Rectangular hyperbola
2.8 Underground Power Cables Undoubtedly the most important applications of oil-impregnated paper occur in the insulation of underground power cables. Not only do the properties of such cables depend on the dielectric properties of the impregnated paper insulation but also on any extraneous effects which may occur such as ionization developing in any voids that may be present. In cables for the higher voltages and extra high-voltages (EHV), failure would soon occur if any voids were present. With such cables, maintaining the impregnated paper under oil or gas pressure prevents ionization.
2.8.1 Solid-Type Cables The type of impregnated-paper cable commonly used at the lower voltages is the "solid type'' in which great care is taken in the manufacture to prevent the formation of voids, but in which no attempt is made to maintain the oil or impregnant under pressure. In the manufacture, paper tapes are wrapped spirally about the conductor by a taping machine. The cable, (on a reel) thus insulated is dried for several hours in a large steel tank at about 100°C and under a high vacuum. The impregnant, usually mineral oil, is similarly subjected to a high vacuum in another tank at from 100° - 125°C to remove all moisture and gases. Then the oil, or impregnant, is admitted to the evacuated cable tank and when air pressure is applied the impregnant is forced into the pores of the paper tapes. A lead sheath is then applied, great care being taken not to entrap any air. However, when the cable is installed in underground ducts the resulting bending and the small wrinkles in the lead sheath due to bending that are formed produce small voids. Moreover when the cable is carrying current, due to heating, the insulation and lead sheath expand and the Lead not being elastic, on cooling, does not contract correspondingly, thus causing voids to form. For
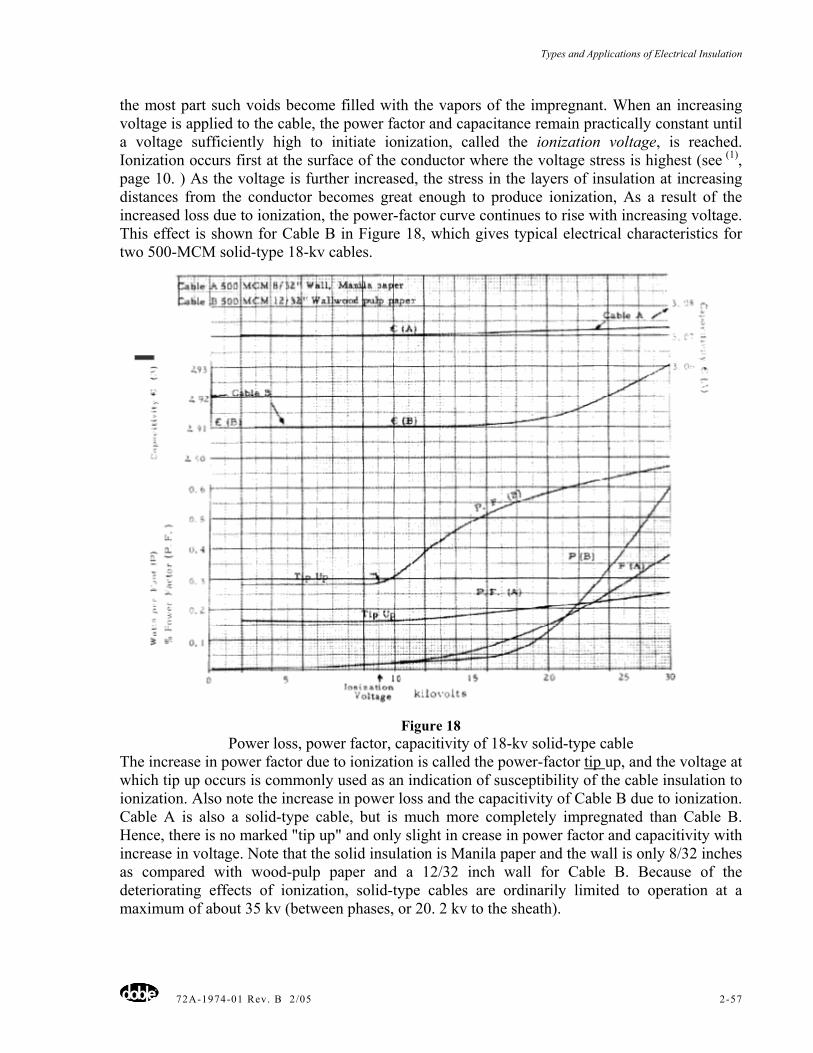
Types and Applications of Electrical Insulation
72A-1974-01 Rev. B 2/05 2-57
the most part such voids become filled with the vapors of the impregnant. When an increasing voltage is applied to the cable, the power factor and capacitance remain practically constant until a voltage sufficiently high to initiate ionization, called the ionization voltage, is reached. Ionization occurs first at the surface of the conductor where the voltage stress is highest (see (1), page 10. ) As the voltage is further increased, the stress in the layers of insulation at increasing distances from the conductor becomes great enough to produce ionization, As a result of the increased loss due to ionization, the power-factor curve continues to rise with increasing voltage. This effect is shown for Cable B in Figure 18, which gives typical electrical characteristics for two 500-MCM solid-type 18-kv cables.
Figure 18 Power loss, power factor, capacitivity of 18-kv solid-type cable
The increase in power factor due to ionization is called the power-factor tip up, and the voltage at which tip up occurs is commonly used as an indication of susceptibility of the cable insulation to ionization. Also note the increase in power loss and the capacitivity of Cable B due to ionization. Cable A is also a solid-type cable, but is much more completely impregnated than Cable B. Hence, there is no marked "tip up" and only slight in crease in power factor and capacitivity with increase in voltage. Note that the solid insulation is Manila paper and the wall is only 8/32 inches as compared with wood-pulp paper and a 12/32 inch wall for Cable B. Because of the deteriorating effects of ionization, solid-type cables are ordinarily limited to operation at a maximum of about 35 kv (between phases, or 20. 2 kv to the sheath).
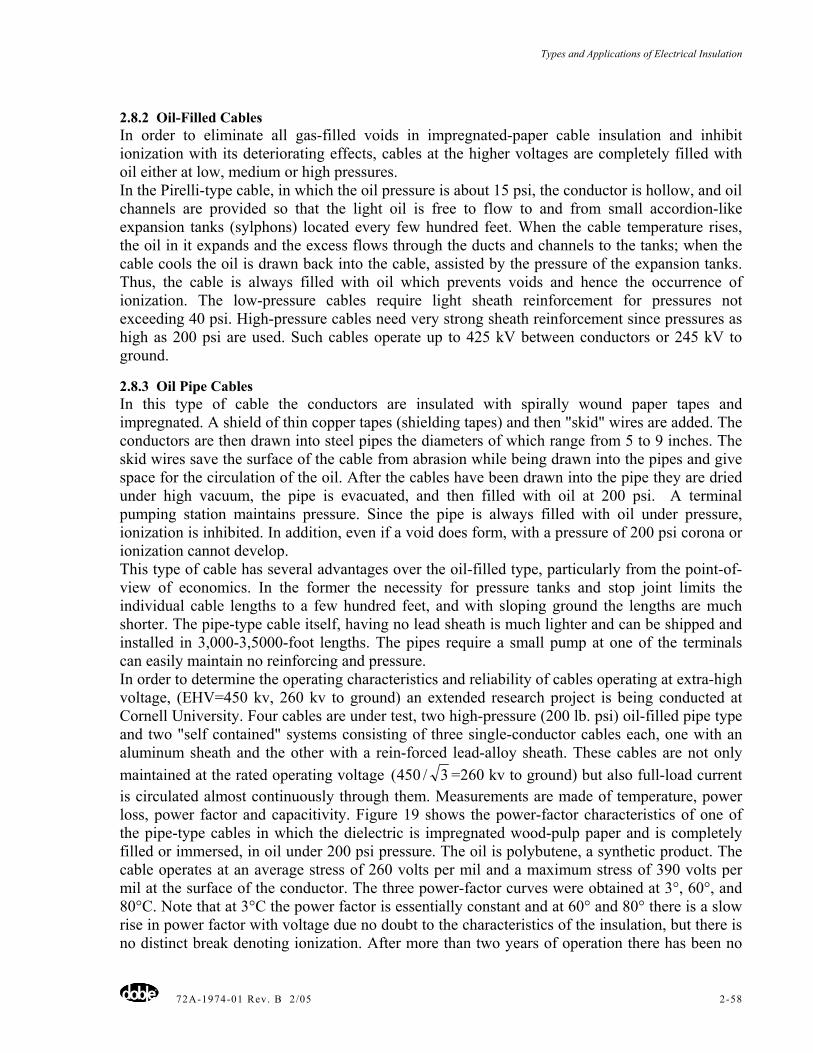
Types and Applications of Electrical Insulation
72A-1974-01 Rev. B 2/05 2-58
2.8.2 Oil-Filled Cables In order to eliminate all gas-filled voids in impregnated-paper cable insulation and inhibit ionization with its deteriorating effects, cables at the higher voltages are completely filled with oil either at low, medium or high pressures. In the Pirelli-type cable, in which the oil pressure is about 15 psi, the conductor is hollow, and oil channels are provided so that the light oil is free to flow to and from small accordion-like expansion tanks (sylphons) located every few hundred feet. When the cable temperature rises, the oil in it expands and the excess flows through the ducts and channels to the tanks; when the cable cools the oil is drawn back into the cable, assisted by the pressure of the expansion tanks. Thus, the cable is always filled with oil which prevents voids and hence the occurrence of ionization. The low-pressure cables require light sheath reinforcement for pressures not exceeding 40 psi. High-pressure cables need very strong sheath reinforcement since pressures as high as 200 psi are used. Such cables operate up to 425 kV between conductors or 245 kV to ground.
2.8.3 Oil Pipe Cables In this type of cable the conductors are insulated with spirally wound paper tapes and impregnated. A shield of thin copper tapes (shielding tapes) and then "skid" wires are added. The conductors are then drawn into steel pipes the diameters of which range from 5 to 9 inches. The skid wires save the surface of the cable from abrasion while being drawn into the pipes and give space for the circulation of the oil. After the cables have been drawn into the pipe they are dried under high vacuum, the pipe is evacuated, and then filled with oil at 200 psi. A terminal pumping station maintains pressure. Since the pipe is always filled with oil under pressure, ionization is inhibited. In addition, even if a void does form, with a pressure of 200 psi corona or ionization cannot develop. This type of cable has several advantages over the oil-filled type, particularly from the point-of-view of economics. In the former the necessity for pressure tanks and stop joint limits the individual cable lengths to a few hundred feet, and with sloping ground the lengths are much shorter. The pipe-type cable itself, having no lead sheath is much lighter and can be shipped and installed in 3,000-3,5000-foot lengths. The pipes require a small pump at one of the terminals can easily maintain no reinforcing and pressure. In order to determine the operating characteristics and reliability of cables operating at extra-high voltage, (EHV=450 kv, 260 kv to ground) an extended research project is being conducted at Cornell University. Four cables are under test, two high-pressure (200 lb. psi) oil-filled pipe type and two "self contained" systems consisting of three single-conductor cables each, one with an aluminum sheath and the other with a rein-forced lead-alloy sheath. These cables are not only maintained at the rated operating voltage 3/450( =260 kv to ground) but also full-load current is circulated almost continuously through them. Measurements are made of temperature, power loss, power factor and capacitivity. Figure 19 shows the power-factor characteristics of one of the pipe-type cables in which the dielectric is impregnated wood-pulp paper and is completely filled or immersed, in oil under 200 psi pressure. The oil is polybutene, a synthetic product. The cable operates at an average stress of 260 volts per mil and a maximum stress of 390 volts per mil at the surface of the conductor. The three power-factor curves were obtained at 3°, 60°, and 80°C. Note that at 3°C the power factor is essentially constant and at 60° and 80° there is a slow rise in power factor with voltage due no doubt to the characteristics of the insulation, but there is no distinct break denoting ionization. After more than two years of operation there has been no
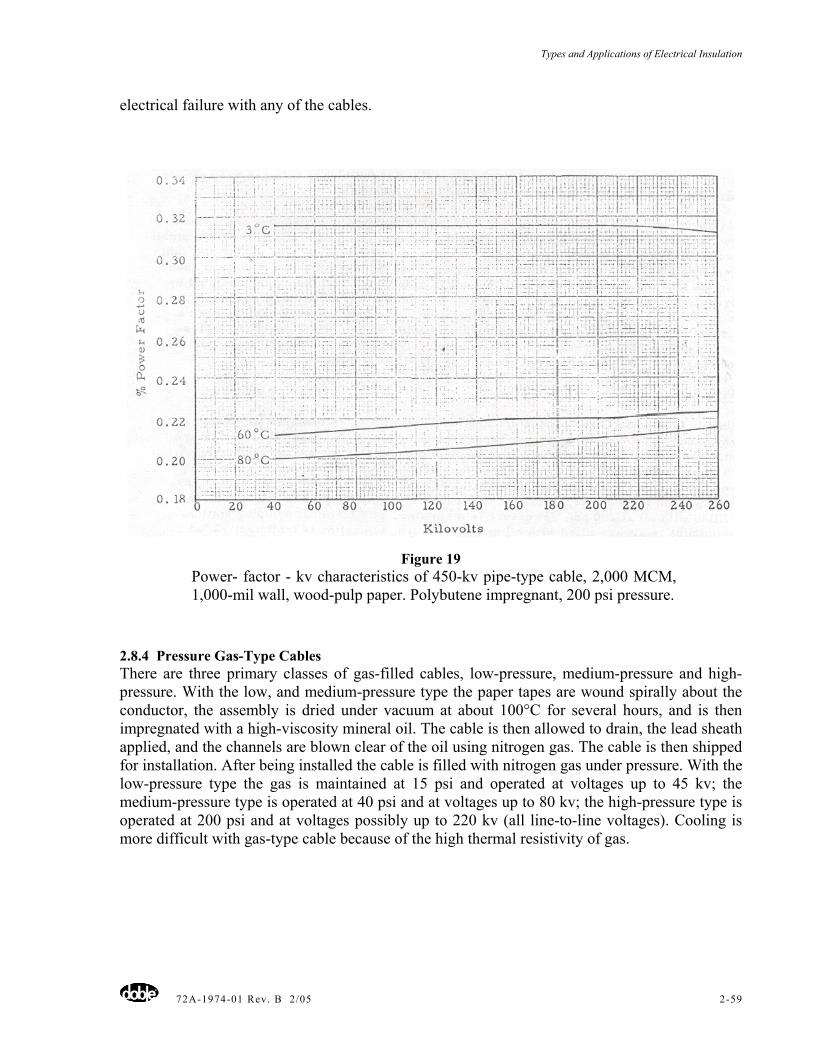
Types and Applications of Electrical Insulation
72A-1974-01 Rev. B 2/05 2-59
electrical failure with any of the cables.
Figure 19 Power- factor - kv characteristics of 450-kv pipe-type cable, 2,000 MCM, 1,000-mil wall, wood-pulp paper. Polybutene impregnant, 200 psi pressure.
2.8.4 Pressure Gas-Type Cables There are three primary classes of gas-filled cables, low-pressure, medium-pressure and high-pressure. With the low, and medium-pressure type the paper tapes are wound spirally about the conductor, the assembly is dried under vacuum at about 100°C for several hours, and is then impregnated with a high-viscosity mineral oil. The cable is then allowed to drain, the lead sheath applied, and the channels are blown clear of the oil using nitrogen gas. The cable is then shipped for installation. After being installed the cable is filled with nitrogen gas under pressure. With the low-pressure type the gas is maintained at 15 psi and operated at voltages up to 45 kv; the medium-pressure type is operated at 40 psi and at voltages up to 80 kv; the high-pressure type is operated at 200 psi and at voltages possibly up to 220 kv (all line-to-line voltages). Cooling is more difficult with gas-type cable because of the high thermal resistivity of gas.
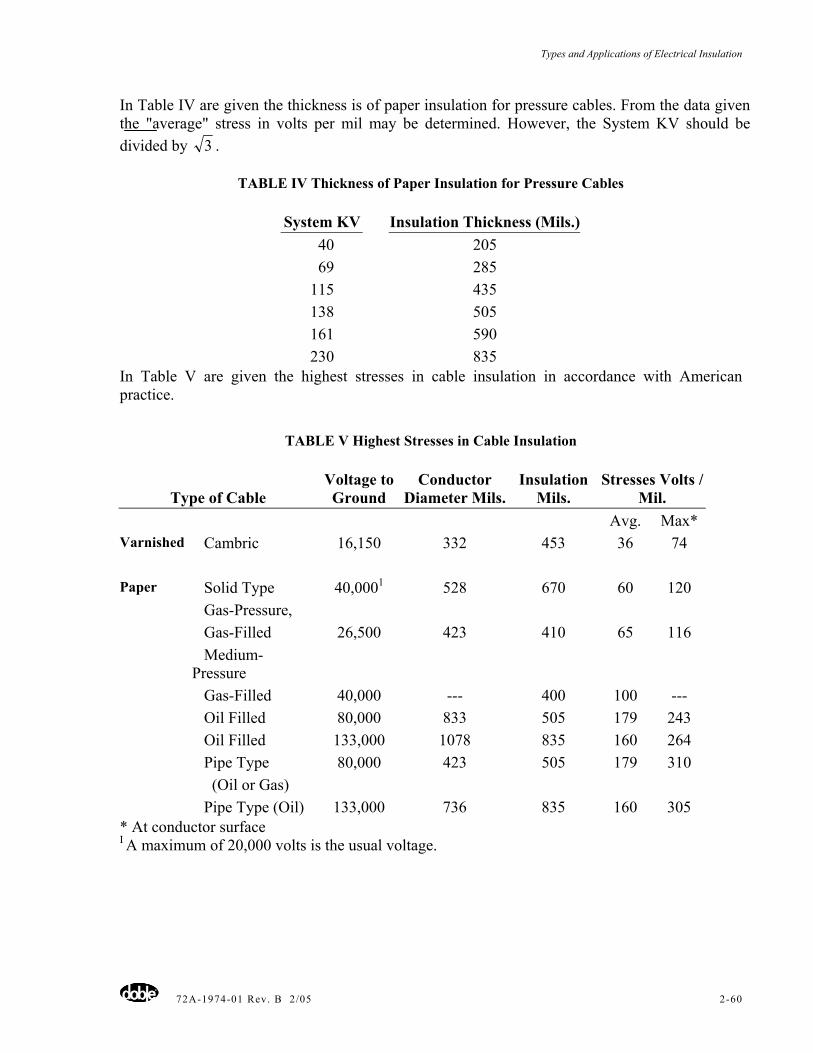
Types and Applications of Electrical Insulation
72A-1974-01 Rev. B 2/05 2-60
In Table IV are given the thickness is of paper insulation for pressure cables. From the data given the "average" stress in volts per mil may be determined. However, the System KV should be divided by 3 .
TABLE IV Thickness of Paper Insulation for Pressure Cables
System KV Insulation Thickness (Mils.)
40 205 69 285 115 435 138 505 161 590 230 835
In Table V are given the highest stresses in cable insulation in accordance with American practice.
TABLE V Highest Stresses in Cable Insulation
Type of Cable Voltage to Ground
Conductor Diameter Mils.
Insulation Mils.
Stresses Volts / Mil.
Avg. Max* Cambric 16,150 332 453 36 74 Varnished
Solid Type 40,0001 528 670 60 120 Gas-Pressure, Gas-Filled 26,500 423 410 65 116 Medium-Pressure
Gas-Filled 40,000 --- 400 100 --- Oil Filled 80,000 833 505 179 243 Oil Filled 133,000 1078 835 160 264 Pipe Type 80,000 423 505 179 310 (Oil or Gas)
Paper
Pipe Type (Oil) 133,000 736 835 160 305 * At conductor surface I A maximum of 20,000 volts is the usual voltage.
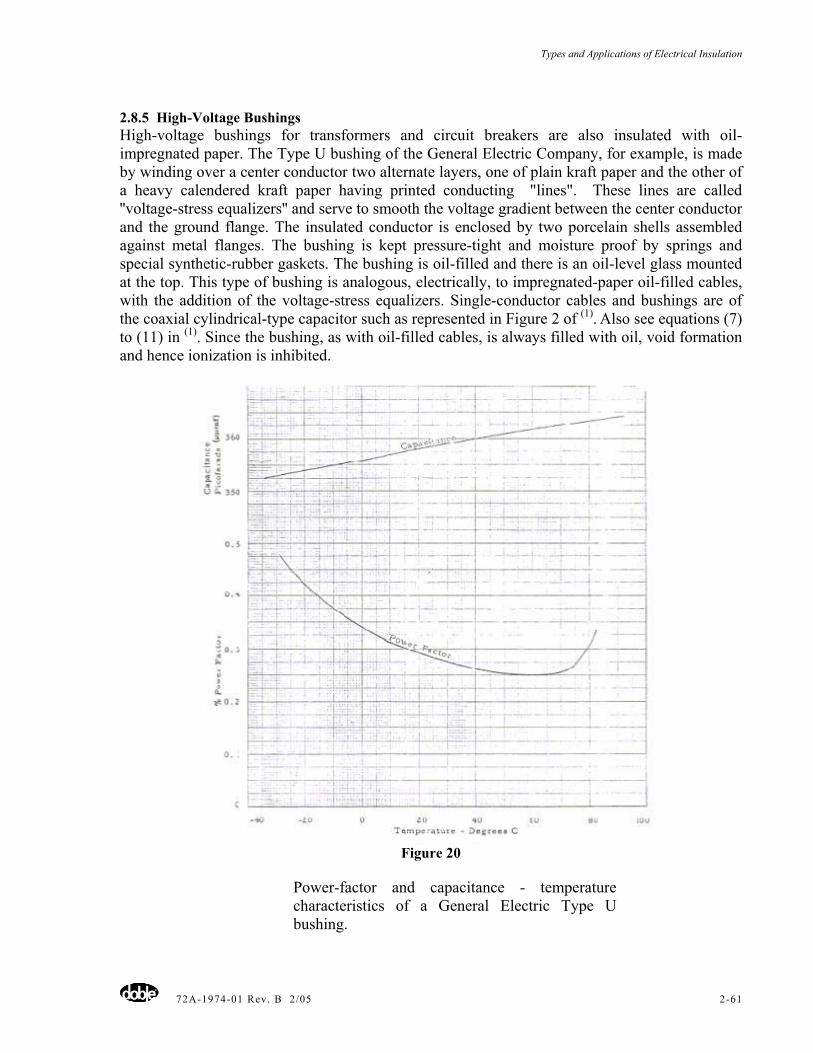
Types and Applications of Electrical Insulation
72A-1974-01 Rev. B 2/05 2-61
2.8.5 High-Voltage Bushings High-voltage bushings for transformers and circuit breakers are also insulated with oil-impregnated paper. The Type U bushing of the General Electric Company, for example, is made by winding over a center conductor two alternate layers, one of plain kraft paper and the other of a heavy calendered kraft paper having printed conducting "lines". These lines are called ''voltage-stress equalizers'' and serve to smooth the voltage gradient between the center conductor and the ground flange. The insulated conductor is enclosed by two porcelain shells assembled against metal flanges. The bushing is kept pressure-tight and moisture proof by springs and special synthetic-rubber gaskets. The bushing is oil-filled and there is an oil-level glass mounted at the top. This type of bushing is analogous, electrically, to impregnated-paper oil-filled cables, with the addition of the voltage-stress equalizers. Single-conductor cables and bushings are of the coaxial cylindrical-type capacitor such as represented in Figure 2 of (1). Also see equations (7) to (11) in (1). Since the bushing, as with oil-filled cables, is always filled with oil, void formation and hence ionization is inhibited.
Figure 20
Power-factor and capacitance - temperature characteristics of a General Electric Type U bushing.
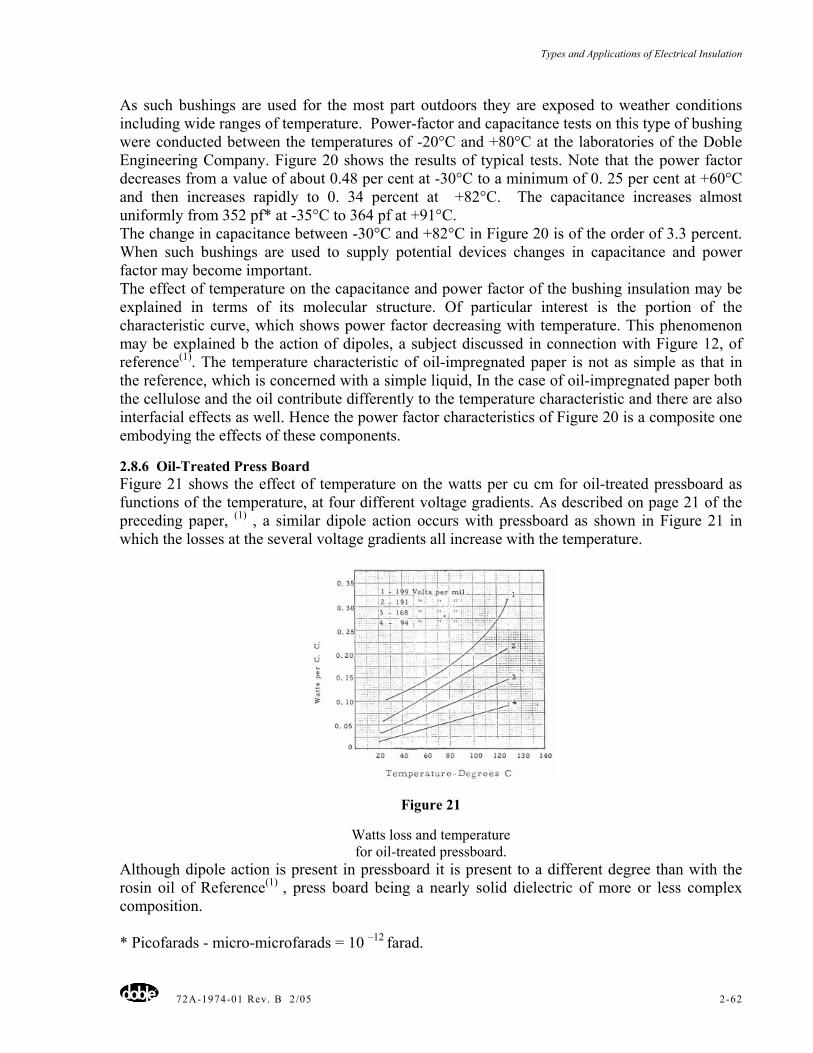
Types and Applications of Electrical Insulation
72A-1974-01 Rev. B 2/05 2-62
As such bushings are used for the most part outdoors they are exposed to weather conditions including wide ranges of temperature. Power-factor and capacitance tests on this type of bushing were conducted between the temperatures of -20°C and +80°C at the laboratories of the Doble Engineering Company. Figure 20 shows the results of typical tests. Note that the power factor decreases from a value of about 0.48 per cent at -30°C to a minimum of 0. 25 per cent at +60°C and then increases rapidly to 0. 34 percent at +82°C. The capacitance increases almost uniformly from 352 pf* at -35°C to 364 pf at +91°C. The change in capacitance between -30°C and +82°C in Figure 20 is of the order of 3.3 percent. When such bushings are used to supply potential devices changes in capacitance and power factor may become important. The effect of temperature on the capacitance and power factor of the bushing insulation may be explained in terms of its molecular structure. Of particular interest is the portion of the characteristic curve, which shows power factor decreasing with temperature. This phenomenon may be explained b the action of dipoles, a subject discussed in connection with Figure 12, of reference(1). The temperature characteristic of oil-impregnated paper is not as simple as that in the reference, which is concerned with a simple liquid, In the case of oil-impregnated paper both the cellulose and the oil contribute differently to the temperature characteristic and there are also interfacial effects as well. Hence the power factor characteristics of Figure 20 is a composite one embodying the effects of these components.
2.8.6 Oil-Treated Press Board Figure 21 shows the effect of temperature on the watts per cu cm for oil-treated pressboard as functions of the temperature, at four different voltage gradients. As described on page 21 of the preceding paper, (1) , a similar dipole action occurs with pressboard as shown in Figure 21 in which the losses at the several voltage gradients all increase with the temperature.
Figure 21
Watts loss and temperature for oil-treated pressboard.
Although dipole action is present in pressboard it is present to a different degree than with the rosin oil of Reference(1) , press board being a nearly solid dielectric of more or less complex composition. * Picofarads - micro-microfarads = 10 –12 farad.
Types and Applications of Electrical Insulation
72A-1974-01 Rev. B 2/05 2-63
2.8.7 Effect of Time on Breakdown voltages Dr. Steinmetz once made the statement that dielectric breakdown depends not only on the, applied voltage gradient, but also that it requires energy to breakdown a dielectric (13). Energy is the product of power and time. Thus, a dielectric which may withstand a very high voltage under a very short-time impulse may readily break down if a much lower voltage is applied over a considerable period of time. For example, a dielectric will withstand the very high voltage of a lightning stroke whereas the same dielectric will breakdown at a 60-cycle voltage whose value is only 20 to 30 per cent that of the lightning stroke. One theory of this effect is that it requires time for the ions, dipoles and impurities in the insulation to come into alignment with the electric field and thus provide a path of decreased dielectric strength. Also a dielectric is weakened by thermal effects and these develop with the time that a voltage is applied. Breakdown also can be due to a needlepoint effect. The filament of the insulation subject to the highest voltage gradient starts to break down at one point, effectively acting as a needlepoint path penetrating into the body of the dielectric (see Figure 3 in (1)). The greater the time of the application of voltage greater the needlepoint penetrates and greater the stress on the remaining insulation, until the needle-paint path penetrates the entire thickness of insulation, thus rupturing the insulation completely. (This needle-point theory is analyzed more in detail in the treatise “Mechanism of the Electric Breakdown of Dielectrics” which will be presented at the 1964 Conference.) The effect of time on the dielectric strength, or breakdown voltage, of oil-treated pressboard is well illustrated in Figure 22. Note that the dielectric strength in the "A" (or impulse) Region is many times the long-time dielectric strength shown in the latter part of the "C" Region".
2.8.8 Mica Plate(15)
The importance and, in many cases, the indispensability, of mica as an electrical insulation material is well recognized. The term mica is applied to a group of minerals characterized by a perfect basal cleavage, that is, they can be split readily in one direction into a great number of thin, tough, elastic laminae. The micas most commonly used for electrical insulation are Muscovite (white, or India, mica) and phlogopite (amber mica). Chemically the micas are complex silicates of aluminum with potassium, magnesium and other elements. They have a melting point of 6500 - 8750C, although they dehydrate to an amorphous powder rather than actually melting in the ordinary sense. The importance of mica as an electrical insulator and dielectric lies in its extremely high insulation resistance and dielectric strength, its resistance to changes with temperature up to red heat (4000C), its complete resistance to the action of water and of oils, and it s excellent mechanical characteristics. It is tough and flexible and may be readily fabricated, cut and punched and when fabricated may be formed into most any desired shape. These properties have made mica indispensable in innumerable insulation applications and up to the present time no suitable substitute has been found. Table VII lists some of the important properties of pure mica.
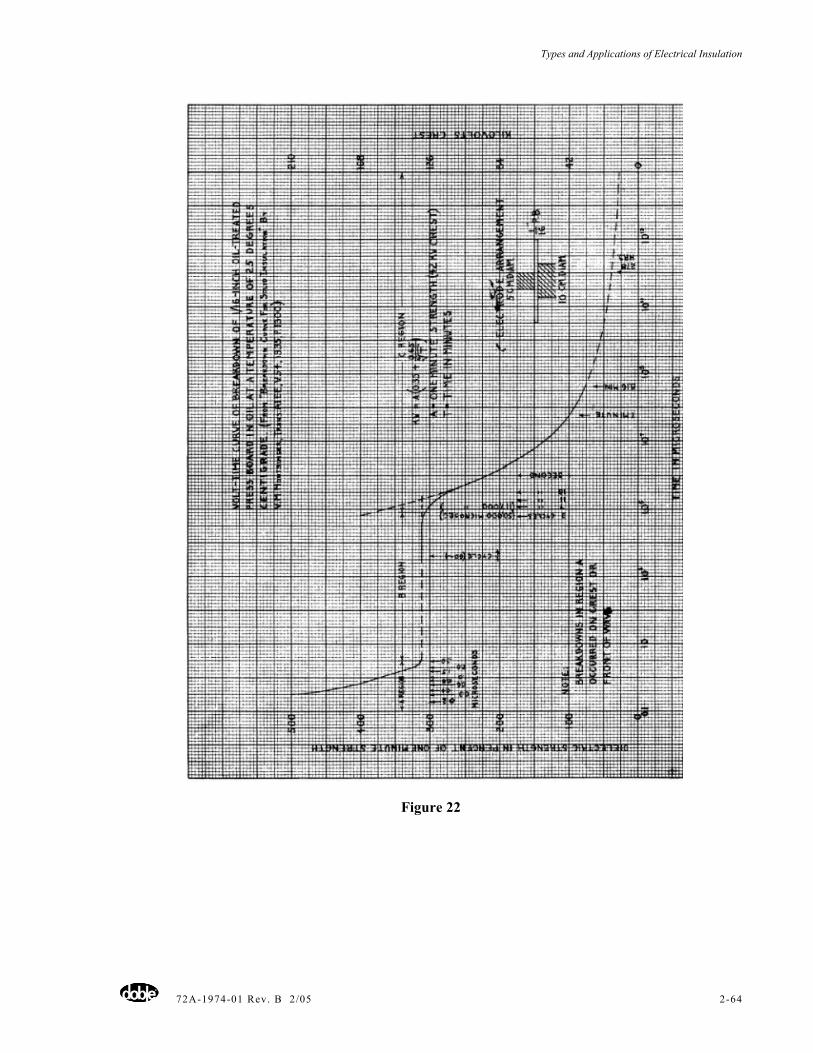
Types and Applications of Electrical Insulation
72A-1974-01 Rev. B 2/05 2-64
Figure 22
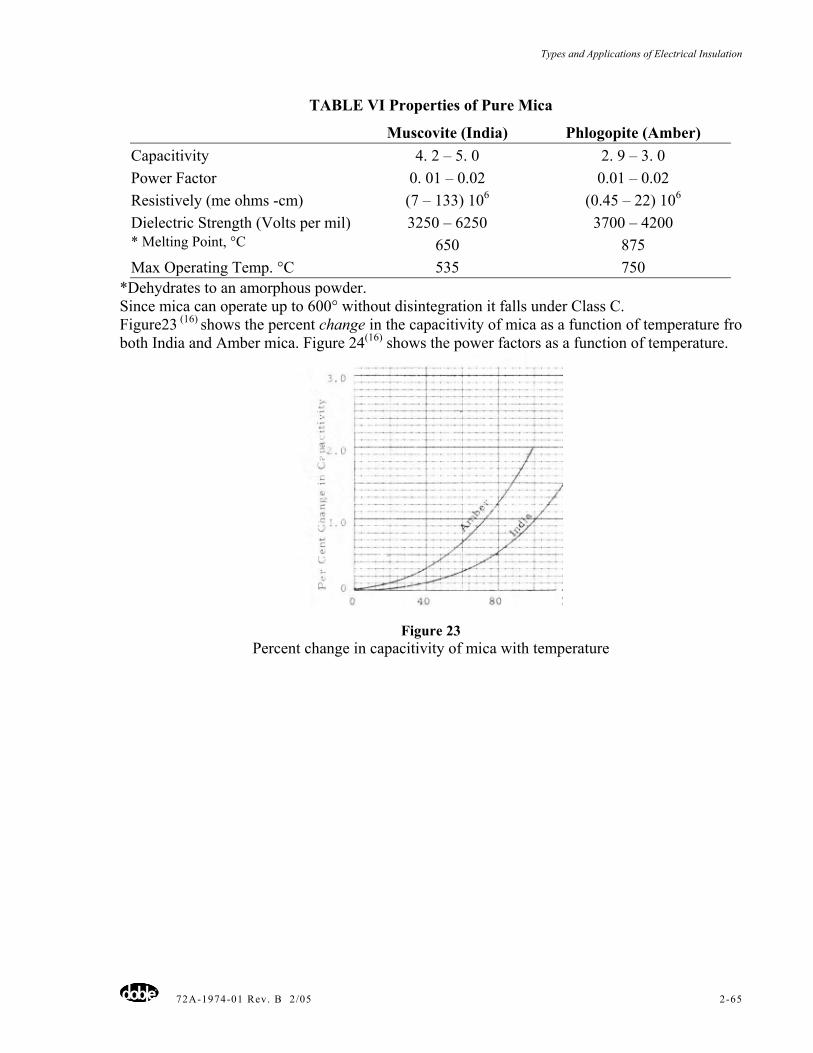
Types and Applications of Electrical Insulation
72A-1974-01 Rev. B 2/05 2-65
TABLE VI Properties of Pure Mica
Muscovite (India) Phlogopite (Amber) Capacitivity 4. 2 – 5. 0 2. 9 – 3. 0 Power Factor 0. 01 – 0.02 0.01 – 0.02 Resistively (me ohms -cm) (7 – 133) 106 (0.45 – 22) 106 Dielectric Strength (Volts per mil) 3250 – 6250 3700 – 4200 * Melting Point, °C 650 875 Max Operating Temp. °C 535 750
*Dehydrates to an amorphous powder. Since mica can operate up to 600° without disintegration it falls under Class C. Figure23 (16) shows the percent change in the capacitivity of mica as a function of temperature fro both India and Amber mica. Figure 24(16) shows the power factors as a function of temperature.
Figure 23 Percent change in capacitivity of mica with temperature
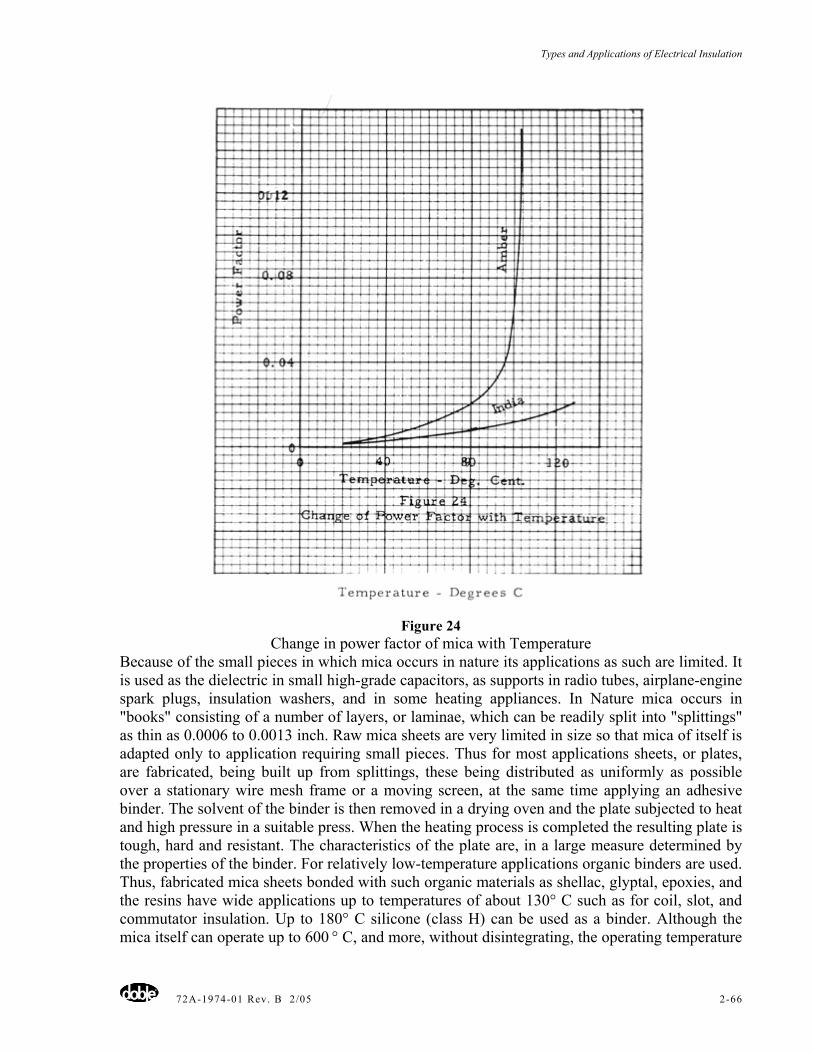
Types and Applications of Electrical Insulation
72A-1974-01 Rev. B 2/05 2-66
Figure 24 Change in power factor of mica with Temperature
Because of the small pieces in which mica occurs in nature its applications as such are limited. It is used as the dielectric in small high-grade capacitors, as supports in radio tubes, airplane-engine spark plugs, insulation washers, and in some heating appliances. In Nature mica occurs in "books" consisting of a number of layers, or laminae, which can be readily split into "splittings" as thin as 0.0006 to 0.0013 inch. Raw mica sheets are very limited in size so that mica of itself is adapted only to application requiring small pieces. Thus for most applications sheets, or plates, are fabricated, being built up from splittings, these being distributed as uniformly as possible over a stationary wire mesh frame or a moving screen, at the same time applying an adhesive binder. The solvent of the binder is then removed in a drying oven and the plate subjected to heat and high pressure in a suitable press. When the heating process is completed the resulting plate is tough, hard and resistant. The characteristics of the plate are, in a large measure determined by the properties of the binder. For relatively low-temperature applications organic binders are used. Thus, fabricated mica sheets bonded with such organic materials as shellac, glyptal, epoxies, and the resins have wide applications up to temperatures of about 130° C such as for coil, slot, and commutator insulation. Up to 180° C silicone (class H) can be used as a binder. Although the mica itself can operate up to 600 ° C, and more, without disintegrating, the operating temperature
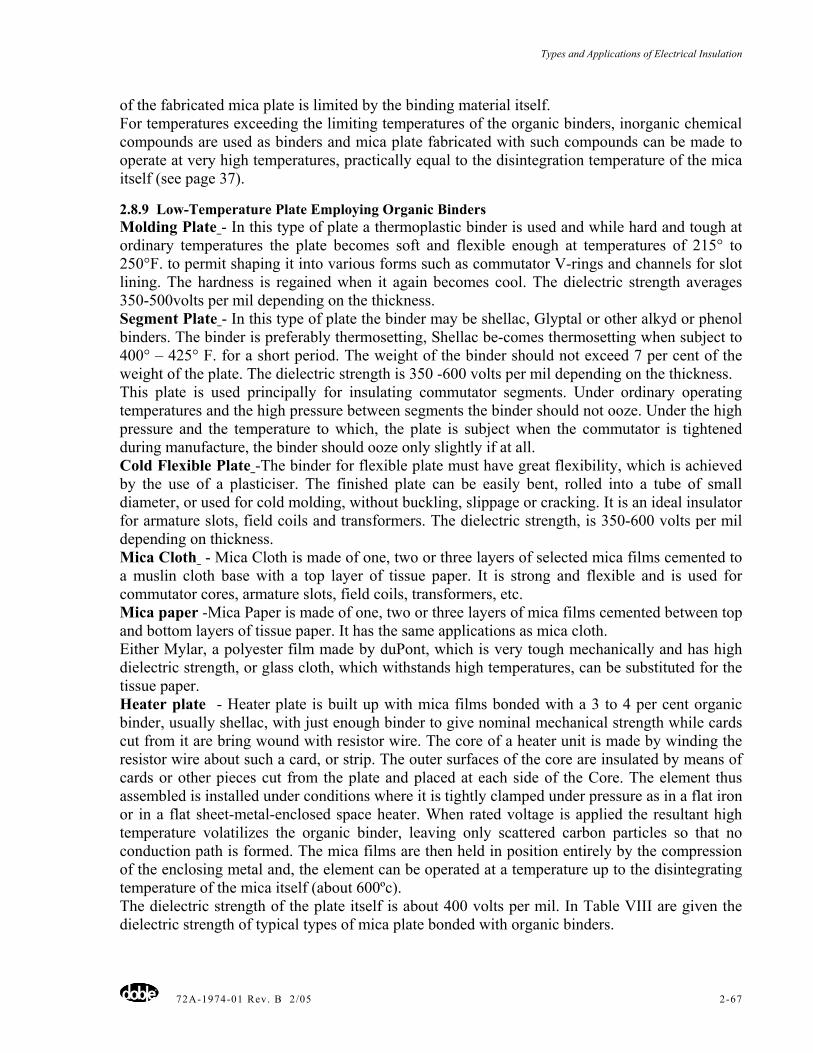
Types and Applications of Electrical Insulation
72A-1974-01 Rev. B 2/05 2-67
of the fabricated mica plate is limited by the binding material itself. For temperatures exceeding the limiting temperatures of the organic binders, inorganic chemical compounds are used as binders and mica plate fabricated with such compounds can be made to operate at very high temperatures, practically equal to the disintegration temperature of the mica itself (see page 37).
2.8.9 Low-Temperature Plate Employing Organic Binders Molding Plate - In this type of plate a thermoplastic binder is used and while hard and tough at ordinary temperatures the plate becomes soft and flexible enough at temperatures of 215° to 250°F. to permit shaping it into various forms such as commutator V-rings and channels for slot lining. The hardness is regained when it again becomes cool. The dielectric strength averages 350-500volts per mil depending on the thickness. Segment Plate - In this type of plate the binder may be shellac, Glyptal or other alkyd or phenol binders. The binder is preferably thermosetting, Shellac be-comes thermosetting when subject to 400° – 425° F. for a short period. The weight of the binder should not exceed 7 per cent of the weight of the plate. The dielectric strength is 350 -600 volts per mil depending on the thickness. This plate is used principally for insulating commutator segments. Under ordinary operating temperatures and the high pressure between segments the binder should not ooze. Under the high pressure and the temperature to which, the plate is subject when the commutator is tightened during manufacture, the binder should ooze only slightly if at all. Cold Flexible Plate -The binder for flexible plate must have great flexibility, which is achieved by the use of a plasticiser. The finished plate can be easily bent, rolled into a tube of small diameter, or used for cold molding, without buckling, slippage or cracking. It is an ideal insulator for armature slots, field coils and transformers. The dielectric strength, is 350-600 volts per mil depending on thickness. Mica Cloth - Mica Cloth is made of one, two or three layers of selected mica films cemented to a muslin cloth base with a top layer of tissue paper. It is strong and flexible and is used for commutator cores, armature slots, field coils, transformers, etc. Mica paper -Mica Paper is made of one, two or three layers of mica films cemented between top and bottom layers of tissue paper. It has the same applications as mica cloth. Either Mylar, a polyester film made by duPont, which is very tough mechanically and has high dielectric strength, or glass cloth, which withstands high temperatures, can be substituted for the tissue paper. Heater plate - Heater plate is built up with mica films bonded with a 3 to 4 per cent organic binder, usually shellac, with just enough binder to give nominal mechanical strength while cards cut from it are bring wound with resistor wire. The core of a heater unit is made by winding the resistor wire about such a card, or strip. The outer surfaces of the core are insulated by means of cards or other pieces cut from the plate and placed at each side of the Core. The element thus assembled is installed under conditions where it is tightly clamped under pressure as in a flat iron or in a flat sheet-metal-enclosed space heater. When rated voltage is applied the resultant high temperature volatilizes the organic binder, leaving only scattered carbon particles so that no conduction path is formed. The mica films are then held in position entirely by the compression of the enclosing metal and, the element can be operated at a temperature up to the disintegrating temperature of the mica itself (about 600ºc). The dielectric strength of the plate itself is about 400 volts per mil. In Table VIII are given the dielectric strength of typical types of mica plate bonded with organic binders.
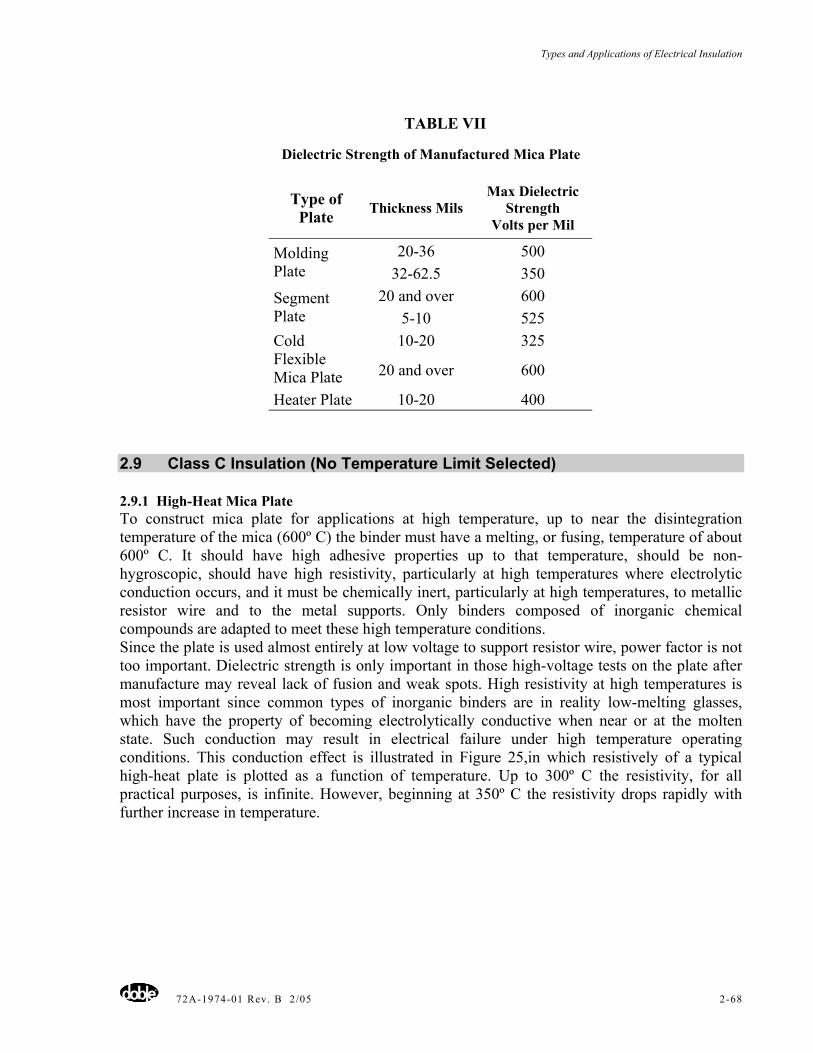
Types and Applications of Electrical Insulation
72A-1974-01 Rev. B 2/05 2-68
TABLE VII
Dielectric Strength of Manufactured Mica Plate
Type of Plate Thickness Mils
Max Dielectric Strength
Volts per Mil
20-36 500 Molding Plate 32-62.5 350
20 and over 600 Segment Plate 5-10 525
10-20 325 Cold Flexible Mica Plate 20 and over 600
Heater Plate 10-20 400
2.9 Class C Insulation (No Temperature Limit Selected)
2.9.1 High-Heat Mica Plate To construct mica plate for applications at high temperature, up to near the disintegration temperature of the mica (600º C) the binder must have a melting, or fusing, temperature of about 600º C. It should have high adhesive properties up to that temperature, should be non-hygroscopic, should have high resistivity, particularly at high temperatures where electrolytic conduction occurs, and it must be chemically inert, particularly at high temperatures, to metallic resistor wire and to the metal supports. Only binders composed of inorganic chemical compounds are adapted to meet these high temperature conditions. Since the plate is used almost entirely at low voltage to support resistor wire, power factor is not too important. Dielectric strength is only important in those high-voltage tests on the plate after manufacture may reveal lack of fusion and weak spots. High resistivity at high temperatures is most important since common types of inorganic binders are in reality low-melting glasses, which have the property of becoming electrolytically conductive when near or at the molten state. Such conduction may result in electrical failure under high temperature operating conditions. This conduction effect is illustrated in Figure 25,in which resistively of a typical high-heat plate is plotted as a function of temperature. Up to 300º C the resistivity, for all practical purposes, is infinite. However, beginning at 350º C the resistivity drops rapidly with further increase in temperature.
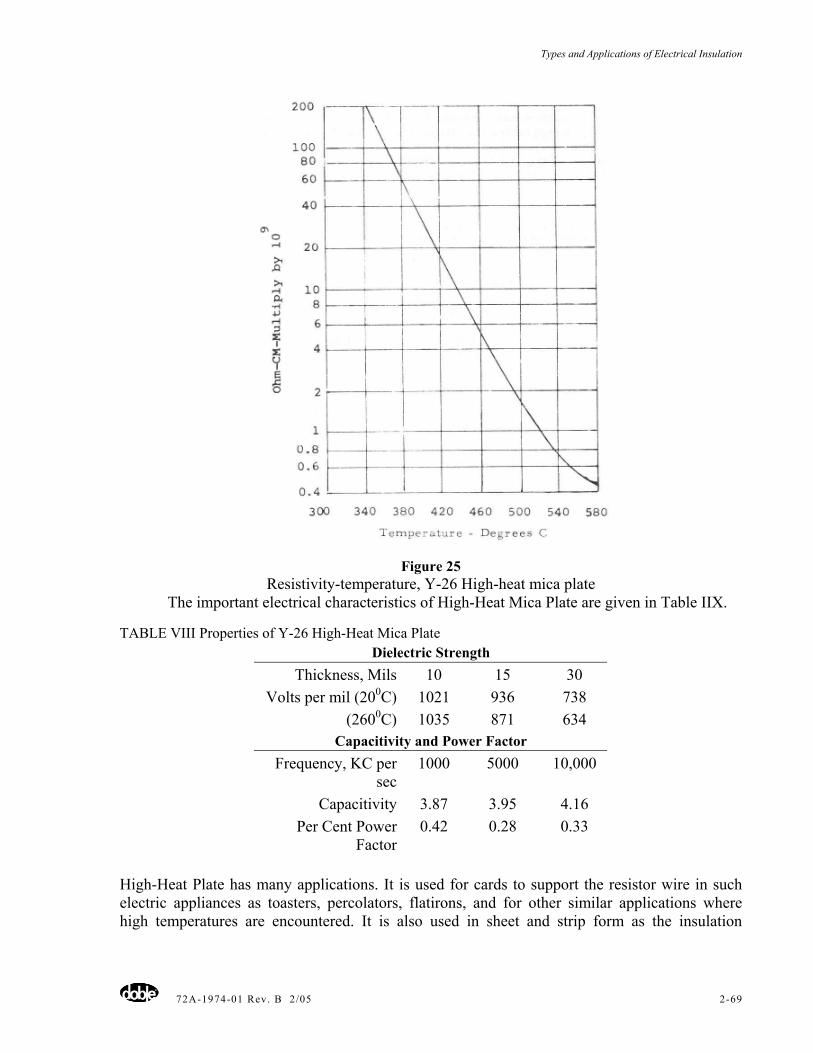
Types and Applications of Electrical Insulation
72A-1974-01 Rev. B 2/05 2-69
Figure 25 Resistivity-temperature, Y-26 High-heat mica plate
The important electrical characteristics of High-Heat Mica Plate are given in Table IIX.
TABLE VIII Properties of Y-26 High-Heat Mica Plate Dielectric Strength
Thickness, Mils 10 15 30 Volts per mil (200C) 1021 936 738
(2600C) 1035 871 634 Capacitivity and Power Factor
Frequency, KC per sec
1000 5000 10,000
Capacitivity 3.87 3.95 4.16 Per Cent Power
Factor0.42 0.28 0.33
High-Heat Plate has many applications. It is used for cards to support the resistor wire in such electric appliances as toasters, percolators, flatirons, and for other similar applications where high temperatures are encountered. It is also used in sheet and strip form as the insulation
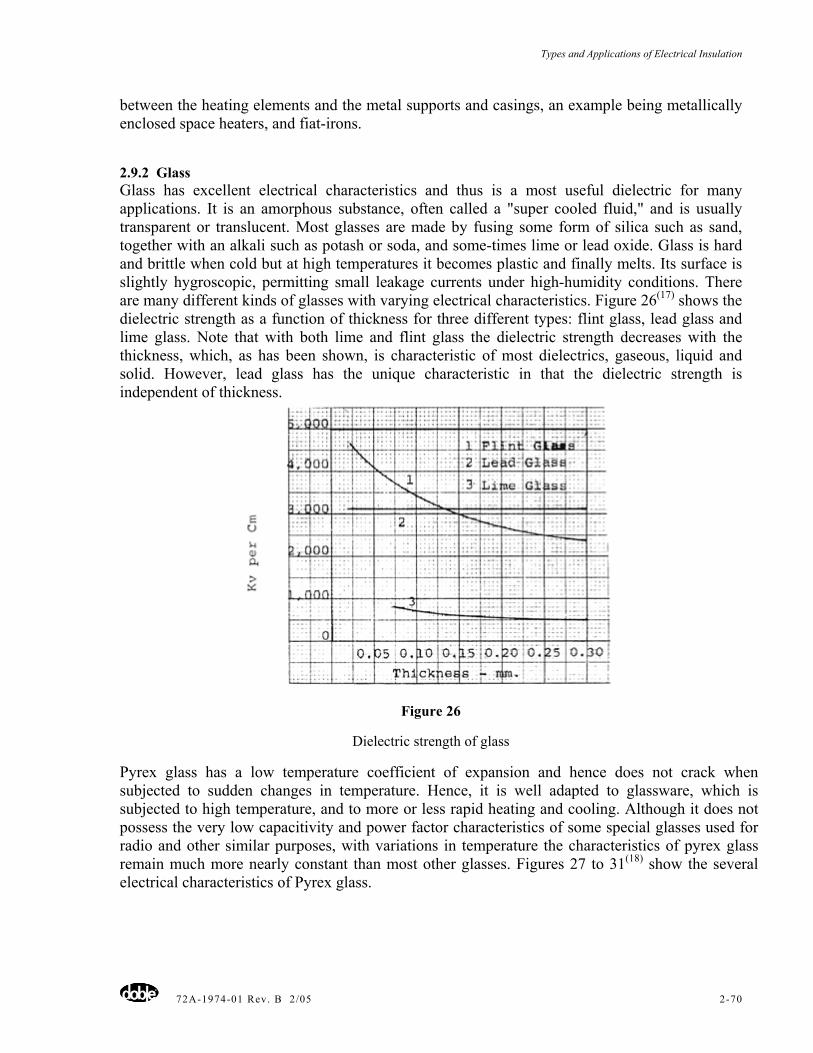
Types and Applications of Electrical Insulation
72A-1974-01 Rev. B 2/05 2-70
between the heating elements and the metal supports and casings, an example being metallically enclosed space heaters, and fiat-irons.
2.9.2 Glass Glass has excellent electrical characteristics and thus is a most useful dielectric for many applications. It is an amorphous substance, often called a "super cooled fluid," and is usually transparent or translucent. Most glasses are made by fusing some form of silica such as sand, together with an alkali such as potash or soda, and some-times lime or lead oxide. Glass is hard and brittle when cold but at high temperatures it becomes plastic and finally melts. Its surface is slightly hygroscopic, permitting small leakage currents under high-humidity conditions. There are many different kinds of glasses with varying electrical characteristics. Figure 26(17) shows the dielectric strength as a function of thickness for three different types: flint glass, lead glass and lime glass. Note that with both lime and flint glass the dielectric strength decreases with the thickness, which, as has been shown, is characteristic of most dielectrics, gaseous, liquid and solid. However, lead glass has the unique characteristic in that the dielectric strength is independent of thickness.
Figure 26
Dielectric strength of glass
Pyrex glass has a low temperature coefficient of expansion and hence does not crack when subjected to sudden changes in temperature. Hence, it is well adapted to glassware, which is subjected to high temperature, and to more or less rapid heating and cooling. Although it does not possess the very low capacitivity and power factor characteristics of some special glasses used for radio and other similar purposes, with variations in temperature the characteristics of pyrex glass remain much more nearly constant than most other glasses. Figures 27 to 31(18) show the several electrical characteristics of Pyrex glass.
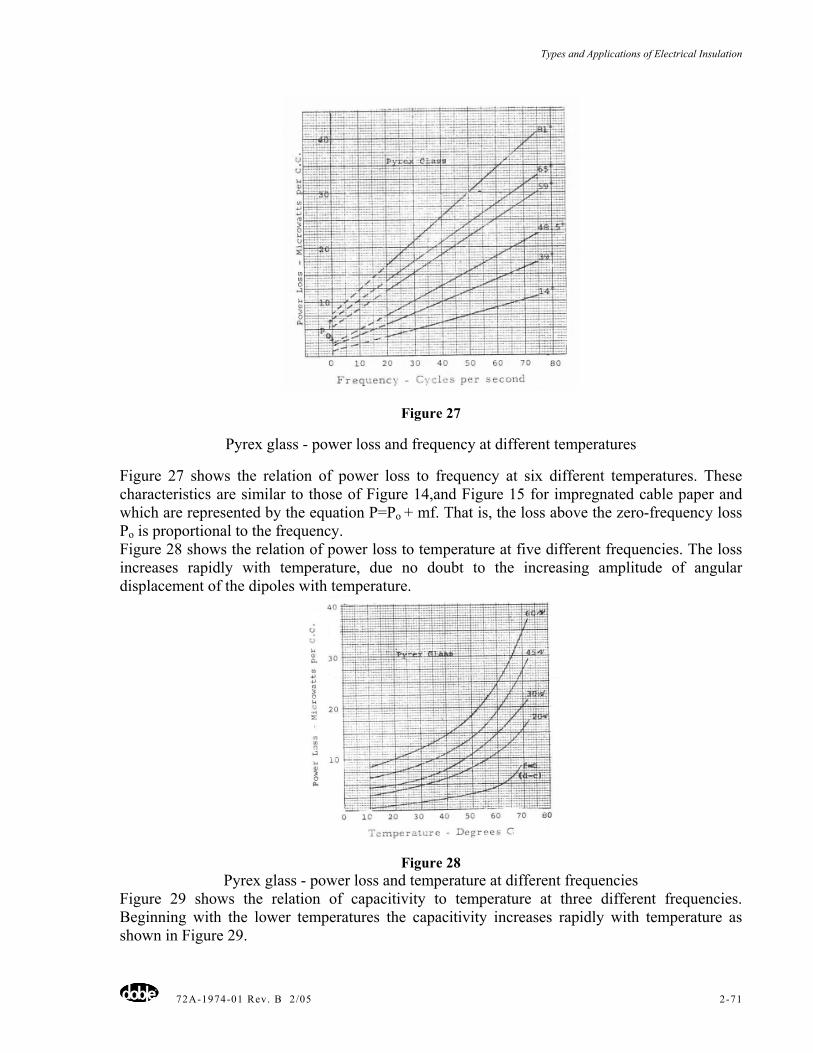
Types and Applications of Electrical Insulation
72A-1974-01 Rev. B 2/05 2-71
Figure 27
Pyrex glass - power loss and frequency at different temperatures
Figure 27 shows the relation of power loss to frequency at six different temperatures. These characteristics are similar to those of Figure 14,and Figure 15 for impregnated cable paper and which are represented by the equation P=Po + mf. That is, the loss above the zero-frequency loss Po is proportional to the frequency. Figure 28 shows the relation of power loss to temperature at five different frequencies. The loss increases rapidly with temperature, due no doubt to the increasing amplitude of angular displacement of the dipoles with temperature.
Figure 28 Pyrex glass - power loss and temperature at different frequencies
Figure 29 shows the relation of capacitivity to temperature at three different frequencies. Beginning with the lower temperatures the capacitivity increases rapidly with temperature as shown in Figure 29.
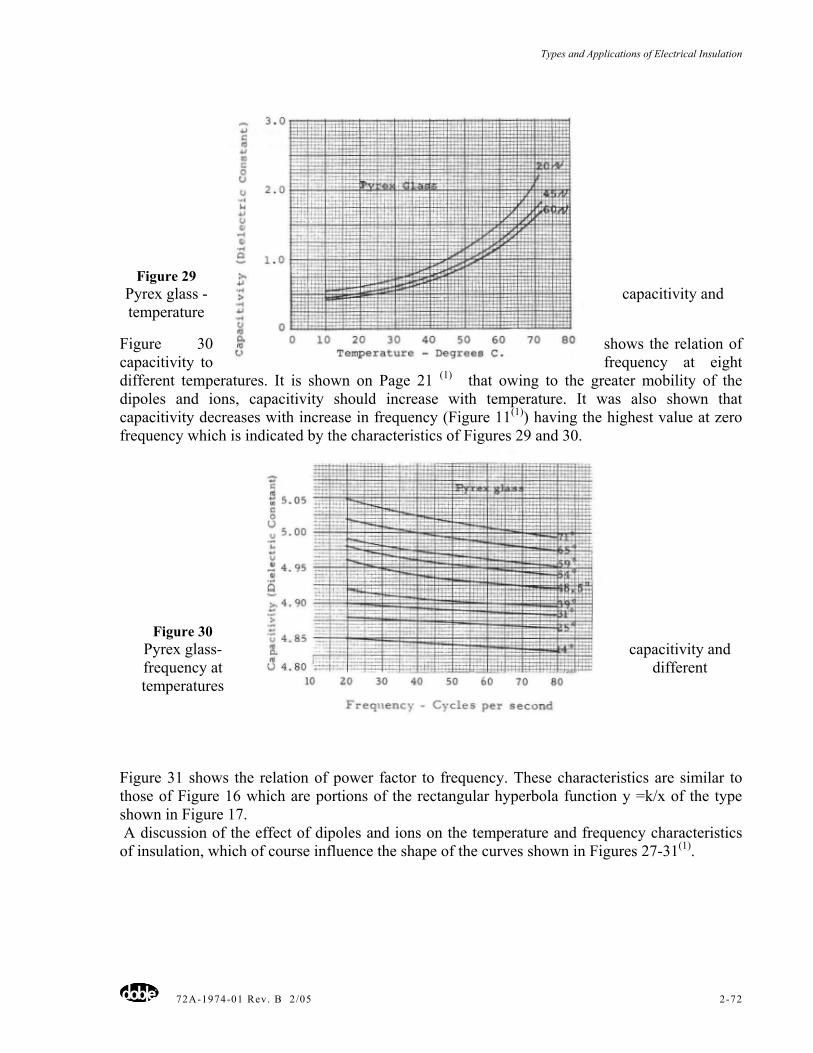
Types and Applications of Electrical Insulation
72A-1974-01 Rev. B 2/05 2-72
Figure 29 Pyrex glass - capacitivity and temperature
Figure 30 shows the relation of capacitivity to frequency at eight different temperatures. It is shown on Page 21 (1) that owing to the greater mobility of the dipoles and ions, capacitivity should increase with temperature. It was also shown that capacitivity decreases with increase in frequency (Figure 11(1)) having the highest value at zero frequency which is indicated by the characteristics of Figures 29 and 30.
Figure 30 Pyrex glass- capacitivity and frequency at different temperatures
Figure 31 shows the relation of power factor to frequency. These characteristics are similar to those of Figure 16 which are portions of the rectangular hyperbola function y =k/x of the type shown in Figure 17. A discussion of the effect of dipoles and ions on the temperature and frequency characteristics of insulation, which of course influence the shape of the curves shown in Figures 27-31(1).
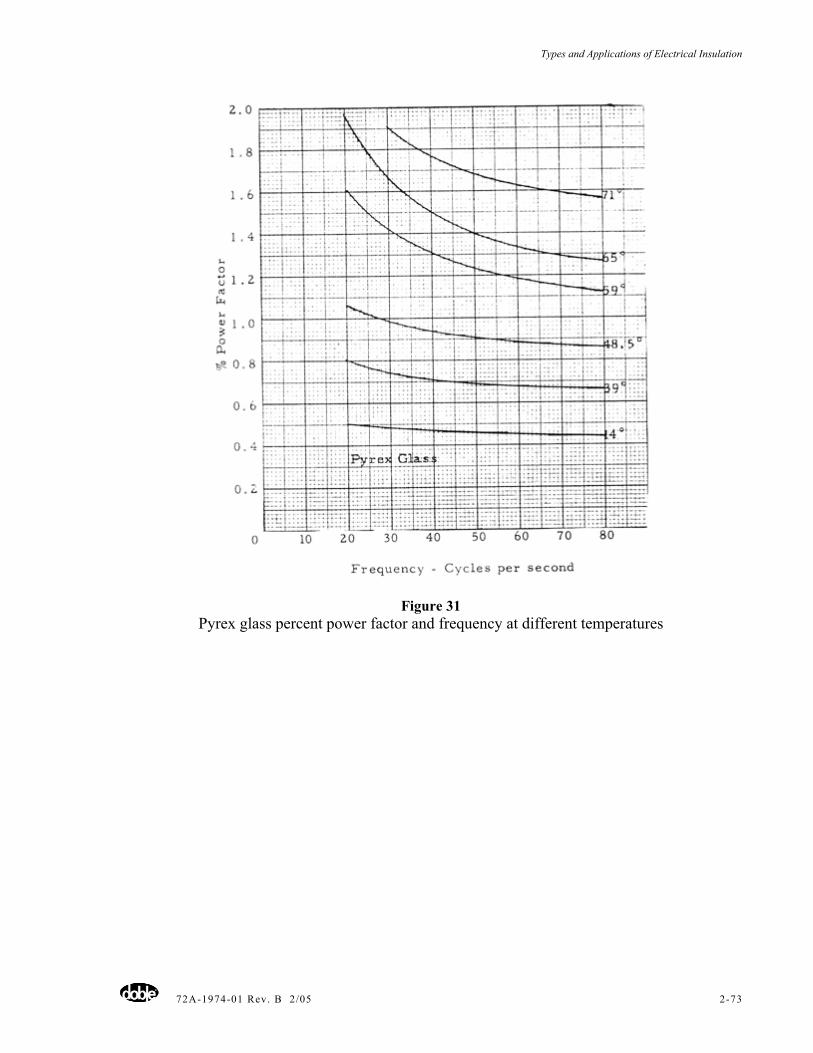
Types and Applications of Electrical Insulation
72A-1974-01 Rev. B 2/05 2-73
Figure 31 Pyrex glass percent power factor and frequency at different temperatures
Types and Applications of Electrical Insulation
72A-1974-01 Rev. B 2/05 2-74
BIBLIOGRAPHY
1. Dielectric Theory and practice, C. L. Dawes and E. H. Povey, 1962 Doble Engineering Conference.
2. AIEE Standard No. 1, June 1957, "General principles upon which Temperature Limits are based on the Rating of Electrical Equipment".
3. Electricity in Gases, (a book), Oxford (Clarendon Press) 1915, S. Townsend. 4. Characteristics of Restricted Ionization and Its Relation to Voids in Insulating
Materials, C. L. Dawes and P. H. Humphries, Trans. AIEE 1940 (59) p.701. 5. Dielectric Phenomena (a book), S. Whitehead, D. Van Nostrand Company. 6. Dielectric Phenomena in High-Voltage Engineering, F. W. peck, Jr. (a book),
McGraw-Hill Book Company, 1929. 7. Dielectric Properties of Cellulose Paper II, J. B. Whitehead and E. W.
Greenfield Trans. AIEE, 1934 (53) P. 1498. 8. Electrical Insulating Materials (a book), Allan Monkhouse, Sir Isaac Pitman &
Sons, Ltd. (London (page 30)). 9. Transformer Engineering (a book), L. F. Blume, John Wiley & Son, page 410. 10. Data from Laboratories of Doble Engineering Company. 11. "Required characteristics of Electrical Insulating Oils can be Specified",
Frank C. Doble, Conference Paper, AIEE Winter General Meeting, N. Y., January 1962.
12. The Electrical Characteristics of Impregnated Cable Paper, C. L. Dawes, and P. H. Humphries, Trans AIEE, 1933, (52) Pages 711-720.
13. Electric Stresses in Cables, W. A. Del Mar, Trans. AIEE 1962, (81) Discussion by G. J. Crowdes and C. L. Dawes, (Pages 121 and 131.)
14. Breakdown Curve for Solid Dielectrics, V. M. Montsinger, Trans. AIEE, 1935, (54), Page 1300.
15. Built-up Mica Plate for High Temperature Application, C. L. Dawes and W. R. Mansfield, Electrical Engineering, Vol. 71 (1952) No. 8 December.
16. Standard Handbook for Electrical Engineers, 9th Edition Section 4, Par. 497, page 391.
17. (16) Section 4, Par. 519, Page 397. 18. Dielectric Data on "Pyrex", C. L. Dawes and P. H. Humphries, Electrical
World, 1928 Page 1331.

Types and Applications of Electrical Insulation
72A-1974-01 Rev. B 2/05 2-75
Types and Applications of Electrical Insulation
72A-1974-01 Rev. B 2/05 2-76
Chapter 3 - Discussion of the Deterioration of Insulation - and it’s Detection
E. H. Povey Doble Engineering Company
3.1 Introduction Insulation is used as a barrier to prevent the loss of electrical energy from a live conductor. The insulation must also support or position the conductor. A practical insulation system, therefore, must contain some material, which has both dielectric and mechanical strength. Insulation is deteriorated when it has lost a significant portion of its original dielectric or mechanical strength. A continuation of the deterioration process leads to eventual electrical or mechanical failure. A purely mechanical process such as excessive appalled force or vibration may cause deterioration. Temperature cycling of an insulation structure often imposes internal mechanical forces. High temperatures may be a contributing factor in certain insulating materials, which lose mechanical strength when hot. Such a process may result in cracks or voids in the insulation, destroying its integrity as insulation. Thus, even when mechanical forces are the chief deteriorating factor, an insulation may fail electrically before it fails mechanically.
Deterioration may be chemical in nature. There is ageing or the slow reaction of the insulation with substances present in its normal environment, also the swifter reaction with unintentional contaminants. Most chemical reactions are temperature sensitive and proceed at a higher rate when the temperature is high. Chemical deterioration can lead to mechanical failure, but here again, electrical failure is more common.
Since the failure of insulation in service can lead to dire consequences, it is highly desirable to be able to locate deteriorated insulation before failure occurs. The question arises as to whether any tests can be made on the mechanical or electrical proper ties of the insulation, which will reveal the presence of deterioration. Unfortunately, installed insulating structures do not lend themselves to the application of mechanical tests. Electrical tests, however, are easy to apply. Since deterioration commonly leads to electrical failure, it would appear possible to detect deterioration by electrical tests. To understand how electrical tests might reveal the condition of insulation, one must start with at least an elementary understanding of the electrical structure of matter. The basic unit of matter is, of course, the atom. Crudely described, the atom has a positively charged central core or nucleus around which negatively charged electrons of equal total charge are distributed in one or more shells at various distances from the core. Each shell requires a certain number of electrons to fill it. The inner shells are normally filled, but the outermost shell may contain any number of electrons from one to the complete quota. The number of inner shells and the number of electrons normally in the outer shell may distinguish atoms of different elements. When an atom is subject to an electric field, the electron is displaced toward the positive electrode and the nucleus is displaced toward the negative electrode. The movement of charges constitutes an electric current. If the atom is merely strained and remains intact,
Types and Applications of Electrical Insulation
72A-1974-01 Rev. B 2/05 2-77
the current is called a displacement current. If electrons are detached from their parent atom, the resulting current is called a conduction current. When an outer shell of an atom contains only a solitary electron, this electron is easily freed. Materials with this type of atom are copper, gold, and silver, which are good conductors. On the other hand, atoms, which have a full outer shell, tend to be good insulators. The noble gases have this type of atom. Special mention might be made of the fluorine and chlorine atom, which lack one electron of having a full outer shell. Such atoms tend to "capture" stray electrons, and thus have useful insulating qualities. Most insulating materials are formed of combinations of two or more atoms, which associate to form molecules. The individual atoms have incomplete outer shells of electrons, but they arrange themselves in groups, or molecules, to share these electrons. The electrons are thus bound in the molecule and require comparative large amounts of energy to free. In a simple example of such an arrangement, an atom having only two electrons in its outer shell might join with an atom, which lacks two electrons in its outer shell. The molecules of most insulations are composed of many atoms bonded in complex arrangements. While the number of atoms in a molecule may be great, the types of atoms, or the elements represented, may be few. Molecules of rubber, polystyrene, polyethylene, paraffin, and transformer oils are all various arrangements of carbon and hydrogen atoms. Cellulose, Bakelite, Plexiglas and epoxy resins are combinations of carbon, hydrogen, and oxygen. Sulphur hexafluoride, as the name specifies, is a combination of sulphur and fluorine. While it is difficult to free an electron from such a molecule, electrons do become free to form a conduction current when the insulation breaks down. In fact, small conduction currents are noted in liquid and solid insulation at voltages below the breakdown value. If this low-voltage conduction current can be shown to be influenced by deterioration in the insulation, then a measure of this current will serve as a nondestructive test on the insulation. A spectacular example of change in conduction current with deterioration occurs in solid insulation, which becomes contaminated with moisture. A water molecule is easily ionized and so furnishes a source of free electrons, which move between the molecules of the solid insulation to increase the normal conduction current. Water molecules may also weaken the bonding of the atoms in the molecules of insulation, so those electrons may be freed from those molecules at energy levels lower than normal. In general, it may be said that any contaminant increases the conduction current. Slower chemical reactions that occur as an ageing process may not cause an increase in conduction current, and in fact, may even lead to a decrease. A decrease in conduction current is often noticed in insulation, which runs hot, since the heat tends to drive off moisture and other volatile constituents. The decrease in conduction current signifies an improvement in dielectric properties, but at the same time the ageing process tends to embrittle the insulation and reduce its mechanical strength. As mentioned previously, mechanical weakness can lead to an electrical failure. A conduction current measurement, therefore, requires intelligent interpretation to serve as an indicator of the deterioration of dielectric properties. Measurements of conduction currents are comparatively simple where the insulation is homogeneous. Where the insulation is composed of two or more materials, or where only
Types and Applications of Electrical Insulation
72A-1974-01 Rev. B 2/05 2-78
a portion of the insulating path is deteriorated, the measurement is complicated by interfacial polarization. When a voltage stress is applied, the flow or drift of free electrons is greater in some parts of the insulation than in other parts. In other words, the conductivity is not the same in all parts of the insulation. The heavier electron flow in areas of higher conductivity cannot continue in areas of lower conductivity, so electrons pile up at the interfaces between areas of differing conductivity. The accumulated charges change the stress distribution within the insulation, decreasing the stress on the areas of high conductivity and increasing the stress on areas of low conductivity. Finally, an internal stress distribution is reached which results in a steady continuous electron flow throughout the insulation. The transient current, which flows to build up the internal charges, is called the absorption current, while the final steady current is called the true conduction current. The time required for the establishment of the steady-state stress pattern within the insulation varies considers ability with the materials involved. In some cases it can be annoyingly long. Contaminants, particularly moisture, increase the conductivity of the better insulation or provide shunting paths for the electron flow. Conduction currents are thereby increased and the interfacial polarization reduced. The interfacial polarization effect may be used as a measure of moisture in insulation. For example, in a Class B insulated generator, a steady voltage is applied between the winding and frame, and measurements of current are made after one and ten minutes. If the ratio of these two currents is 2 or greater, the winding is considered dry, and if lower, the winding is suspected of being wet. The time required for completion of the absorption transient may be avoided by the use of an alternating test voltage. With alternating voltage, however, a simple current measurement is not sufficient, since only a small fraction of the current that flows may be conduction current. Most of the current consists of the flow of electrons necessary to charge the metallic electrodes (required even when the insulation is a vacuum) and to compensate for the displacement of bound electrons within the insulation. When the volt-age is alternating, however, the current is, of course, also alternating and has a measurable phase relation with the voltage. For a sinusoidal voltage the current may be considered as having two components, one in phase with the voltage and one in quadrature with the voltage. The charging current, and to a large extent, the displacement current, are quadrature currents. The conduction current is in phase with the voltage, and the displacement current may have a small in-phase component. The in-phase component is quite useable as an indicator of deterioration due to contamination. A common way of measuring in-phase current is with a wattmeter, an instrument constructed to indicate the product of the in-phase current and the test voltage. The Doble Type M circuit will indicate directly the in-phase component of current, but to give a reading comparable to a wattmeter, the meter scale on the Type M set is multi-plied by a voltage factor. There are several circuits for reading power factor, which is the ratio of the in-phase to the total current, or for reading dissipation factor, which is the ratio of the in-phase to the quadrature current. Power factor and dissipation factors have the advantage that, as ratios, they are independent of the amount of insulation being measured.
Not all deterioration, which leads to the failure of insulation, can be ascribed to contamination. There is another broad category, which involves ionization. In a broad sense, the freeing of one electron from a stable atom or molecule constitutes ionization.
Types and Applications of Electrical Insulation
72A-1974-01 Rev. B 2/05 2-79
When the term is used in connection with high-voltage insulation, it usually refers to progressive ionization involving a large number of electrons. The situation occurs where a free electron under the acceleration of an electric field acquires sufficient energy to free two or more electrons on impact with neighboring molecules, starting what is often called an electron avalanche. The avalanche creates so many free electrons that the insulating properties of the substance are entirely destroyed in the area involved. The energy acquired by a free electron depends not only on the strength of the electric field but also on the distance, which the electron can travel unimpeded. The distance between molecules is greater in a gas than in a liquid or solid, so that ionization is produced at lower field strengths in a gas. When ionization occurs in a gas, some of the energy is expended as visible radiation.
Types and Applications of Electrical Insulation
72A-1974-01 Rev. B 2/05 2-80
Ionization in a gas subject to a uniform field between two electrodes will result in complete breakdown of insulation between the electrodes. If, however, the electric field is not uniform, the avalanche or discharge may be limited to the areas of highest stress. Outside of this area the field is so weak that electrons entering it do not receive sufficient energy to continue the avalanche. Thus ionization (corona) is often noted in a small area surrounding a transmission line conductor. Ionization of gas often leads to undesirable consequences. When the bonding electrons are freed by ionization, stable molecules are broken down into their more active constituents. These constituents may then combine with other materials to produce unwanted effects. For example, ionization of air produces ozone, which attacks any exposed copper parts to form oxides of copper. Another objectionable consequence of ionization is radiated energy, which produces interference in high-frequency communication channels. Because gases ionize at relatively low field intensities, a gas inclusion (a void) in solid insulation may ionize when the solid insulation is under normal operating stress. In this case, the solid material stops the avalanche and the energy acquired by the electrons is dissipated as heat at the interface. When an alternating voltage stress is applied, the continual bombardment of the interface by electron avalanches tends to erode the solid insulation. This process damages many insulating materials and finally leads to a puncture entirely through the insulation. Ionization produced in insulating liquids is in many respects like that produced in a gas. Higher stresses are necessary to initiate ionization in an insulating liquid, but once a discharge starts it may decompose the molecules in the immediate area so that a gas is produced. Unlike a solid, however, the liquid can circulate. A liquid subject to continued, limited or partial discharges at some point would therefore tend to suffer general decomposition or deterioration. From the preceding discussion it may be concluded that ionization generally has a deteriorating effect on insulation. Fortunately, the detection of ionization is often a simple procedure, although an evaluation of its destructiveness is more complicated. When considerable ionization is present, it may be evaluated from loss or power-factor measurements. The power factor of most insulations is independent of voltage stress up to the value at which ionization commences. The increase of power factor with voltage, or power factor "tip-up," is therefore a measure of ionization. Detection of a single void discharge in an ordinary insulator by measurement of loss at power frequency is usually difficult because the loss may be very small. Single void discharges may be detected by one of several methods, including radio-influence-voltage, which are based on the fact that electron avalanche is a very rapid phenomenon, in the fractional microsecond range. Pulse disturbances created in the external circuit by the avalanche are isolated by filters, amplified and detected by an oscilloscope or radio receiver. In summary, the following points are important:
1. Most contaminants, and especially moisture, increase the conductivity of insulation. Presence of contamination can therefore be detected by measurements of leakage current or power factor.
2. Mechanical weakness induced by heat and age may decrease rather than in-crease the conductivity of insulation.
Types and Applications of Electrical Insulation
72A-1974-01 Rev. B 2/05 2-81
3. Ionization is generally harmful to insulation. It may be detected by power factor tip-up, by radio-influence-measurements or by pulse techniques.
Discussion ot the Detrioration of Insulation and it’s Detection
72A-1974-01 Rev. B 2/05 2-82
Chapter 4 - Mechanisms of the Electric Breakdown of Dielectric
C.L. Dawes Doble Engineering Company
4.1 Introduction In the first of these treatises "Dielectric Theory and Practice" (1)*, presented at the 1962 Conference, the basic phenomena underlying the behavior of dielectrics, together with the corresponding theories, were presented and analyzed. In the second treatise "Various Types and Applications of Electrical Insulation", presented at the 1963 Conference, the properties of insulating materials, as related to their prescribed operating temperatures and their industrial applications, were described. In(1), page 26, it is stated: "The true cause or causes of dielectric failure are not too well understood, although for years scientists and others have directed a great amount of study and research on the problem. A large number of theories have been proposed and considered; but, so far, no one theory can account for the several types of failure, which occur. " It is the purpose of this treatise to present and analyze many of these theories, which relate to the mechanism of breakdown, and to illustrate them by experimental and actual breakdowns. Basically, there are three different types of dielectrics: gaseous, liquid, and solid. The mechanism of breakdown for each of these three types will be presented in sequence. Many dielectrics are combinations of these three, such as gaseous voids in solid dielec-trics, solid dielectrics such as paper impregnated with oil, and gas entrapped in oil. Of the three basic types of dielectrics, the mechanism of breakdown of the gaseous types is best understood. This is owing to the fact that their atomic and molecular structure are relatively simple; and, for the most part, are well known. They are homogeneous; the paths of the electrons and ions are unobstructed, except at the electrodes; and the molecular behavior of gases, particularly under dynamic conditions, is well understood.
4.2 Gases Ionic Conduction in Gases In Reference (1), Page 22 and 23, there are definitions of "Ion", "Ionization", "Electrical Discharge", "Corona", and similar terms related to electrical phenomena in gases. Also, there is a brief description of the mechanism of ionization and the degradation of insulation caused by ionization occurring within internal voids. These several phenomena will be further discussed and analyzed. An atom is composed of a central nucleus, or proton, which is positively charged and which accounts for most of the mass of the atom, and planetary electrons which circulate around the nucleus in discrete orbits, each of which has a definite energy level. An atom in which the negative charges on the planetary electrons are equal to the net positive charge in the nucleus is a neutral atom. When an electric field is applied to a gas, there is a force of attraction tending to pull the nucleus to the negative electrode and the electrons to the positive electrode. However the field necessary to separate the nucleus and electrons is so tremendous that it could almost never be attained in practice; and long be-fore any such field could be approached, the nucleus and the electrons will have become
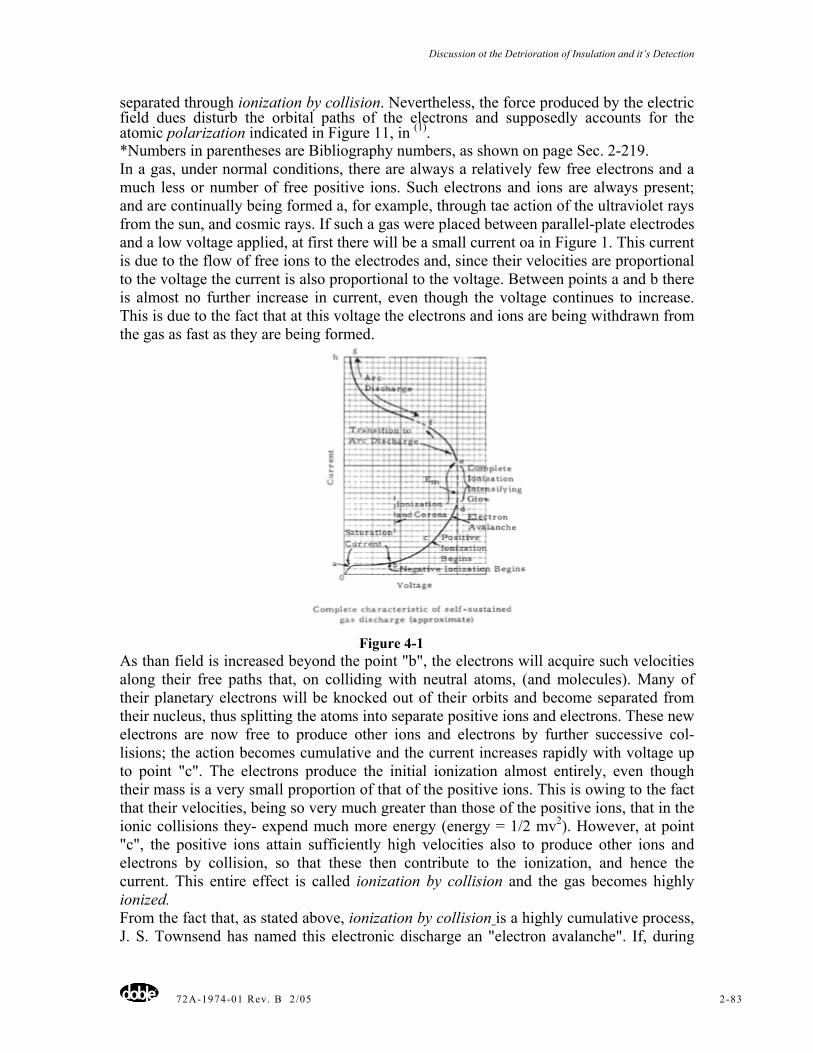
Discussion ot the Detrioration of Insulation and it’s Detection
72A-1974-01 Rev. B 2/05 2-83
separated through ionization by collision. Nevertheless, the force produced by the electric field dues disturb the orbital paths of the electrons and supposedly accounts for the atomic polarization indicated in Figure 11, in (1). *Numbers in parentheses are Bibliography numbers, as shown on page Sec. 2-219. In a gas, under normal conditions, there are always a relatively few free electrons and a much less or number of free positive ions. Such electrons and ions are always present; and are continually being formed a, for example, through tae action of the ultraviolet rays from the sun, and cosmic rays. If such a gas were placed between parallel-plate electrodes and a low voltage applied, at first there will be a small current oa in Figure 1. This current is due to the flow of free ions to the electrodes and, since their velocities are proportional to the voltage the current is also proportional to the voltage. Between points a and b there is almost no further increase in current, even though the voltage continues to increase. This is due to the fact that at this voltage the electrons and ions are being withdrawn from the gas as fast as they are being formed.
Figure 4-1
As than field is increased beyond the point "b", the electrons will acquire such velocities along their free paths that, on colliding with neutral atoms, (and molecules). Many of their planetary electrons will be knocked out of their orbits and become separated from their nucleus, thus splitting the atoms into separate positive ions and electrons. These new electrons are now free to produce other ions and electrons by further successive col-lisions; the action becomes cumulative and the current increases rapidly with voltage up to point "c". The electrons produce the initial ionization almost entirely, even though their mass is a very small proportion of that of the positive ions. This is owing to the fact that their velocities, being so very much greater than those of the positive ions, that in the ionic collisions they- expend much more energy (energy = 1/2 mv2). However, at point "c", the positive ions attain sufficiently high velocities also to produce other ions and electrons by collision, so that these then contribute to the ionization, and hence the current. This entire effect is called ionization by collision and the gas becomes highly ionized. From the fact that, as stated above, ionization by collision is a highly cumulative process, J. S. Townsend has named this electronic discharge an "electron avalanche". If, during
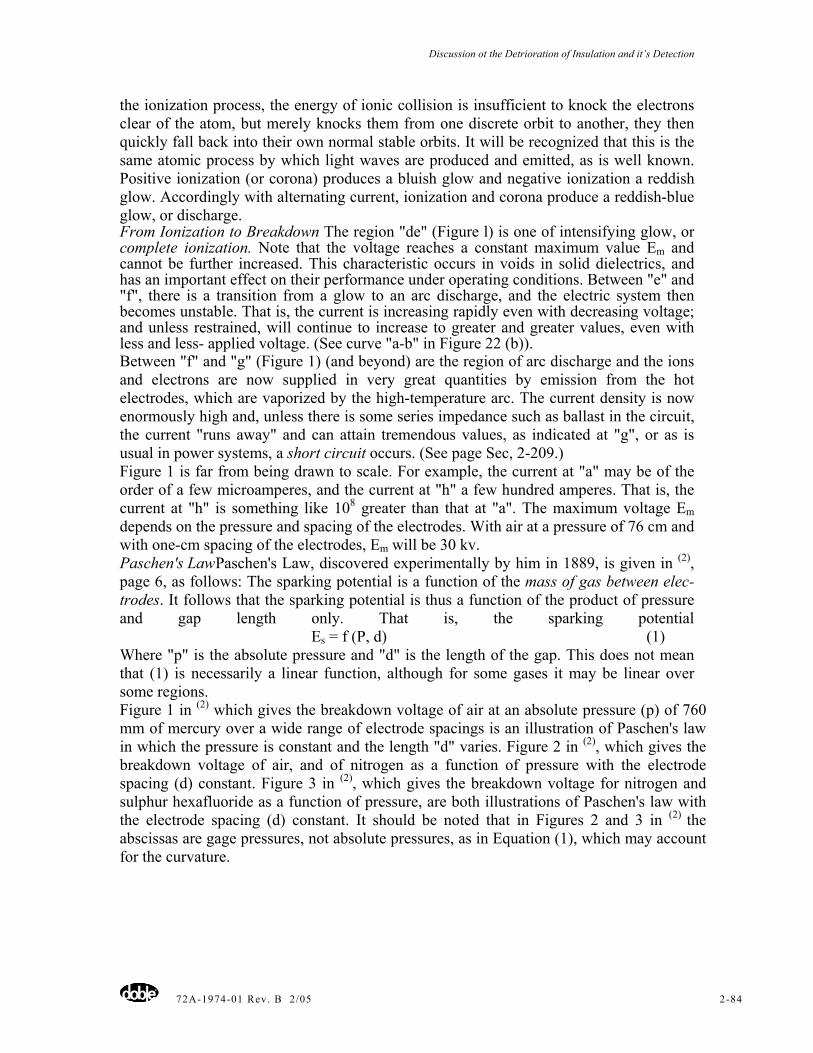
Discussion ot the Detrioration of Insulation and it’s Detection
72A-1974-01 Rev. B 2/05 2-84
the ionization process, the energy of ionic collision is insufficient to knock the electrons clear of the atom, but merely knocks them from one discrete orbit to another, they then quickly fall back into their own normal stable orbits. It will be recognized that this is the same atomic process by which light waves are produced and emitted, as is well known. Positive ionization (or corona) produces a bluish glow and negative ionization a reddish glow. Accordingly with alternating current, ionization and corona produce a reddish-blue glow, or discharge. From Ionization to Breakdown The region "de" (Figure l) is one of intensifying glow, or complete ionization. Note that the voltage reaches a constant maximum value Em and cannot be further increased. This characteristic occurs in voids in solid dielectrics, and has an important effect on their performance under operating conditions. Between "e" and "f", there is a transition from a glow to an arc discharge, and the electric system then becomes unstable. That is, the current is increasing rapidly even with decreasing voltage; and unless restrained, will continue to increase to greater and greater values, even with less and less- applied voltage. (See curve "a-b" in Figure 22 (b)). Between "f" and "g" (Figure 1) (and beyond) are the region of arc discharge and the ions and electrons are now supplied in very great quantities by emission from the hot electrodes, which are vaporized by the high-temperature arc. The current density is now enormously high and, unless there is some series impedance such as ballast in the circuit, the current "runs away" and can attain tremendous values, as indicated at "g", or as is usual in power systems, a short circuit occurs. (See page Sec, 2-209.) Figure 1 is far from being drawn to scale. For example, the current at "a" may be of the order of a few microamperes, and the current at "h" a few hundred amperes. That is, the current at "h" is something like 108 greater than that at "a". The maximum voltage Em depends on the pressure and spacing of the electrodes. With air at a pressure of 76 cm and with one-cm spacing of the electrodes, Em will be 30 kv. Paschen's Law Paschen's Law, discovered experimentally by him in 1889, is given in (2), page 6, as follows: The sparking potential is a function of the mass of gas between elec-trodes. It follows that the sparking potential is thus a function of the product of pressure and gap length only. That is, the sparking potential Es = f (P, d) (1) Where "p" is the absolute pressure and "d" is the length of the gap. This does not mean that (1) is necessarily a linear function, although for some gases it may be linear over some regions. Figure 1 in (2) which gives the breakdown voltage of air at an absolute pressure (p) of 760 mm of mercury over a wide range of electrode spacings is an illustration of Paschen's law in which the pressure is constant and the length "d" varies. Figure 2 in (2), which gives the breakdown voltage of air, and of nitrogen as a function of pressure with the electrode spacing (d) constant. Figure 3 in (2), which gives the breakdown voltage for nitrogen and sulphur hexafluoride as a function of pressure, are both illustrations of Paschen's law with the electrode spacing (d) constant. It should be noted that in Figures 2 and 3 in (2) the abscissas are gage pressures, not absolute pressures, as in Equation (1), which may account for the curvature.
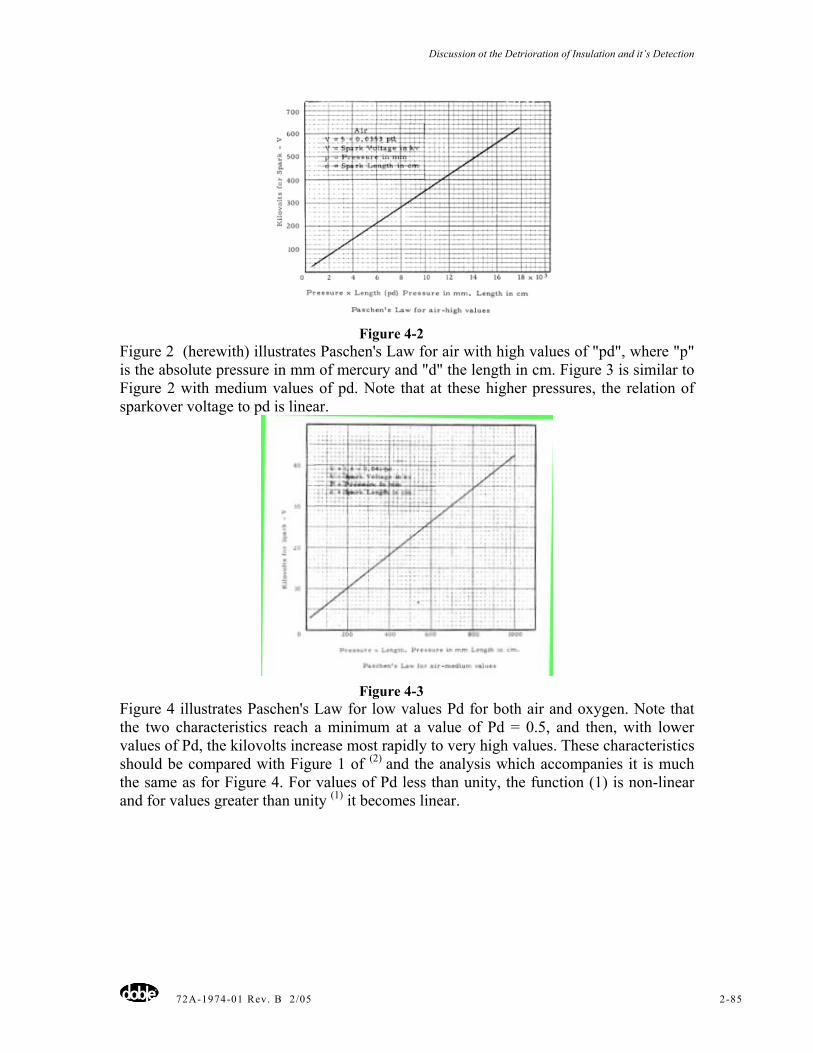
Discussion ot the Detrioration of Insulation and it’s Detection
72A-1974-01 Rev. B 2/05 2-85
Figure 4-2
Figure 2 (herewith) illustrates Paschen's Law for air with high values of "pd", where "p" is the absolute pressure in mm of mercury and "d" the length in cm. Figure 3 is similar to Figure 2 with medium values of pd. Note that at these higher pressures, the relation of sparkover voltage to pd is linear.
Figure 4-3
Figure 4 illustrates Paschen's Law for low values Pd for both air and oxygen. Note that the two characteristics reach a minimum at a value of Pd = 0.5, and then, with lower values of Pd, the kilovolts increase most rapidly to very high values. These characteristics should be compared with Figure 1 of (2) and the analysis which accompanies it is much the same as for Figure 4. For values of Pd less than unity, the function (1) is non-linear and for values greater than unity (1) it becomes linear.
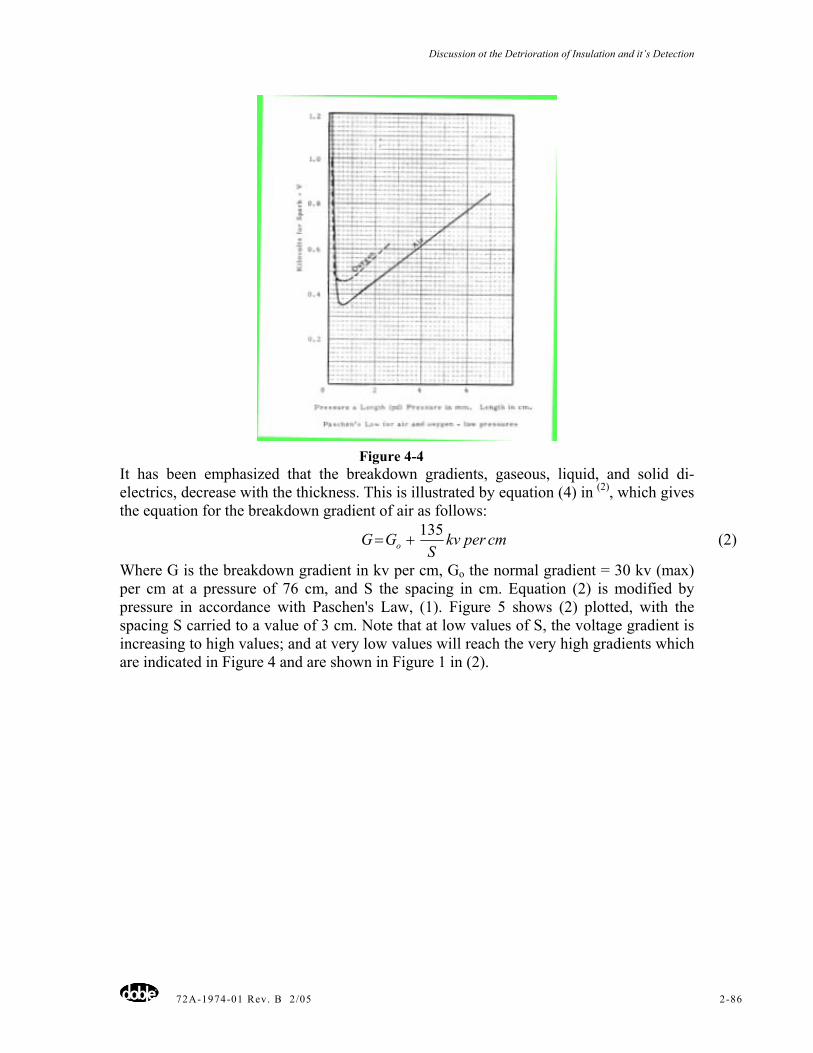
Discussion ot the Detrioration of Insulation and it’s Detection
72A-1974-01 Rev. B 2/05 2-86
Figure 4-4
It has been emphasized that the breakdown gradients, gaseous, liquid, and solid di-electrics, decrease with the thickness. This is illustrated by equation (4) in (2), which gives the equation for the breakdown gradient of air as follows:
cmperkvS
GG o135
+= (2)
Where G is the breakdown gradient in kv per cm, Go the normal gradient = 30 kv (max) per cm at a pressure of 76 cm, and S the spacing in cm. Equation (2) is modified by pressure in accordance with Paschen's Law, (1). Figure 5 shows (2) plotted, with the spacing S carried to a value of 3 cm. Note that at low values of S, the voltage gradient is increasing to high values; and at very low values will reach the very high gradients which are indicated in Figure 4 and are shown in Figure 1 in (2).
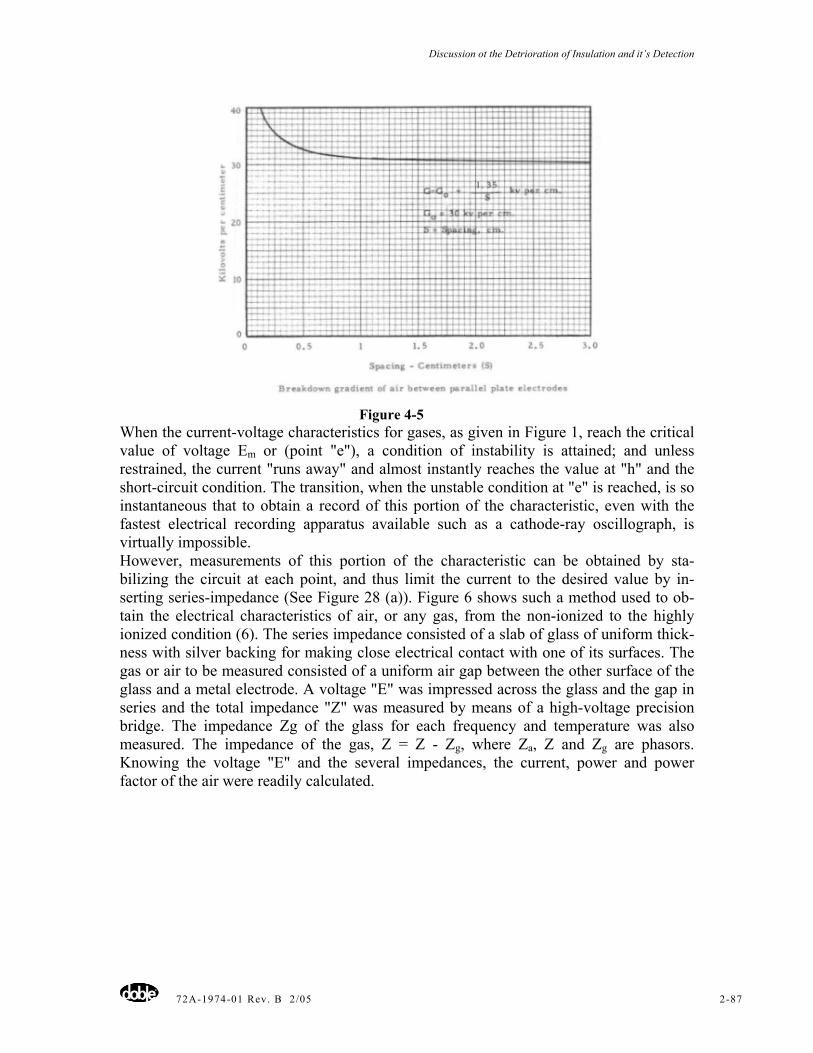
Discussion ot the Detrioration of Insulation and it’s Detection
72A-1974-01 Rev. B 2/05 2-87
Figure 4-5
When the current-voltage characteristics for gases, as given in Figure 1, reach the critical value of voltage Em or (point "e"), a condition of instability is attained; and unless restrained, the current "runs away" and almost instantly reaches the value at "h" and the short-circuit condition. The transition, when the unstable condition at "e" is reached, is so instantaneous that to obtain a record of this portion of the characteristic, even with the fastest electrical recording apparatus available such as a cathode-ray oscillograph, is virtually impossible. However, measurements of this portion of the characteristic can be obtained by sta-bilizing the circuit at each point, and thus limit the current to the desired value by in-serting series-impedance (See Figure 28 (a)). Figure 6 shows such a method used to ob-tain the electrical characteristics of air, or any gas, from the non-ionized to the highly ionized condition (6). The series impedance consisted of a slab of glass of uniform thick-ness with silver backing for making close electrical contact with one of its surfaces. The gas or air to be measured consisted of a uniform air gap between the other surface of the glass and a metal electrode. A voltage "E" was impressed across the glass and the gap in series and the total impedance "Z" was measured by means of a high-voltage precision bridge. The impedance Zg of the glass for each frequency and temperature was also measured. The impedance of the gas, Z = Z - Zg, where Za, Z and Zg are phasors. Knowing the voltage "E" and the several impedances, the current, power and power factor of the air were readily calculated.
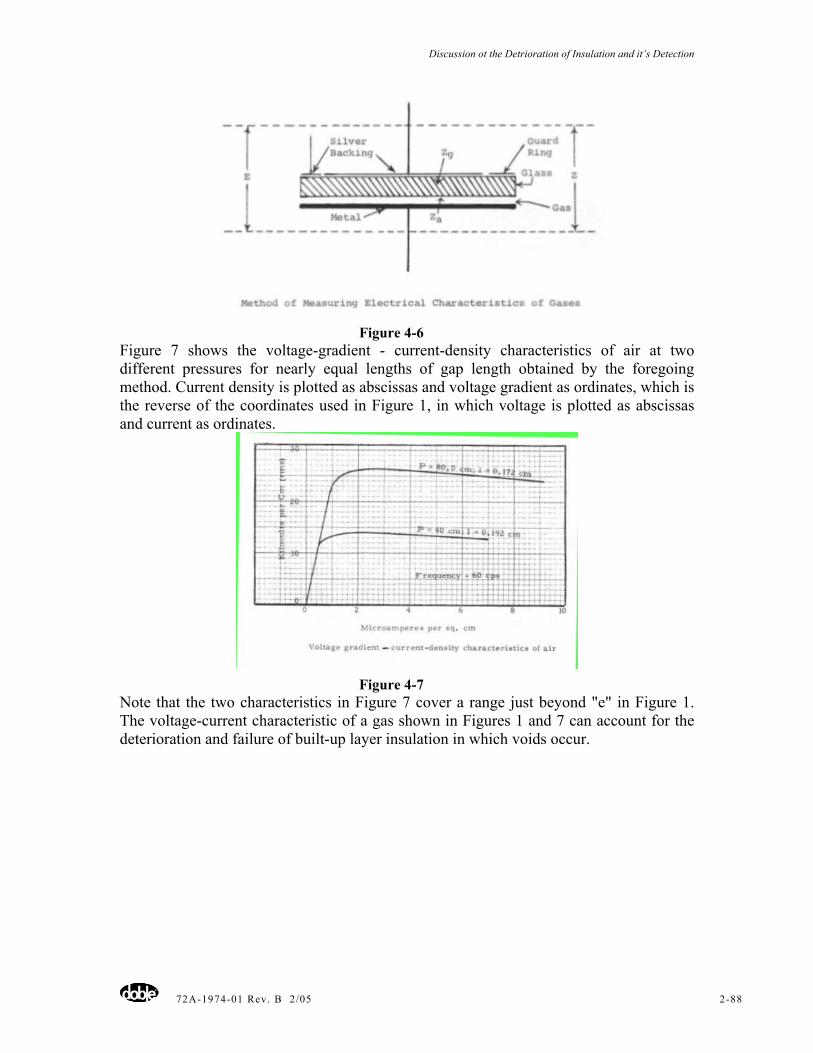
Discussion ot the Detrioration of Insulation and it’s Detection
72A-1974-01 Rev. B 2/05 2-88
Figure 4-6
Figure 7 shows the voltage-gradient - current-density characteristics of air at two different pressures for nearly equal lengths of gap length obtained by the foregoing method. Current density is plotted as abscissas and voltage gradient as ordinates, which is the reverse of the coordinates used in Figure 1, in which voltage is plotted as abscissas and current as ordinates.
Figure 4-7
Note that the two characteristics in Figure 7 cover a range just beyond "e" in Figure 1. The voltage-current characteristic of a gas shown in Figures 1 and 7 can account for the deterioration and failure of built-up layer insulation in which voids occur.
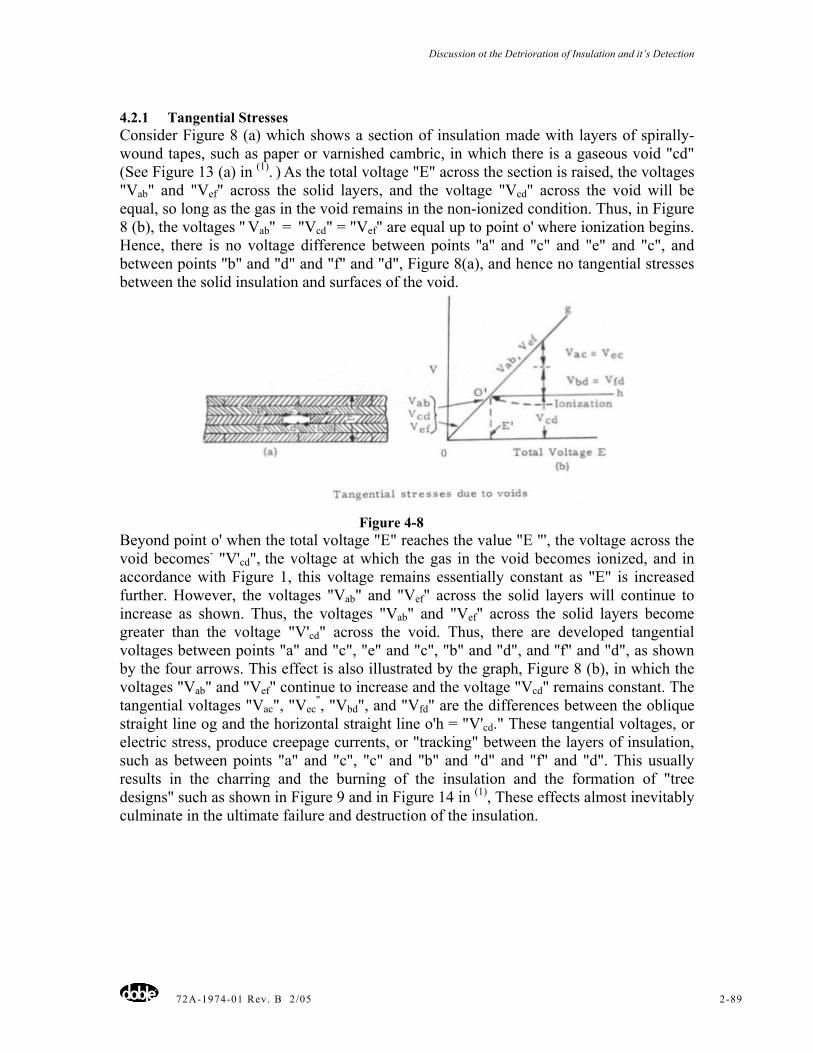
Discussion ot the Detrioration of Insulation and it’s Detection
72A-1974-01 Rev. B 2/05 2-89
4.2.1 Tangential Stresses Consider Figure 8 (a) which shows a section of insulation made with layers of spirally-wound tapes, such as paper or varnished cambric, in which there is a gaseous void "cd" (See Figure 13 (a) in (1). ) As the total voltage "E" across the section is raised, the voltages "Vab" and "Vef" across the solid layers, and the voltage "Vcd" across the void will be equal, so long as the gas in the void remains in the non-ionized condition. Thus, in Figure 8 (b), the voltages '' Vab'' = "Vcd" = "Vef" are equal up to point o' where ionization begins. Hence, there is no voltage difference between points ''a'' and "c" and "e" and "c", and between points "b" and "d" and "f" and "d", Figure 8(a), and hence no tangential stresses between the solid insulation and surfaces of the void.
Figure 4-8
Beyond point o' when the total voltage "E" reaches the value "E "', the voltage across the void becomes- "V'cd", the voltage at which the gas in the void becomes ionized, and in accordance with Figure 1, this voltage remains essentially constant as "E" is increased further. However, the voltages "Vab" and "Vef" across the solid layers will continue to increase as shown. Thus, the voltages "Vab" and "Vef" across the solid layers become greater than the voltage "V'cd" across the void. Thus, there are developed tangential voltages between points "a" and "c", "e" and "c", "b" and "d", and ''f" and "d", as shown by the four arrows. This effect is also illustrated by the graph, Figure 8 (b), in which the voltages "Vab" and "Vef" continue to increase and the voltage "Vcd" remains constant. The tangential voltages "Vac", "Vec
", "Vbd", and "Vfd" are the differences between the oblique straight line og and the horizontal straight line o'h = "V'cd." These tangential voltages, or electric stress, produce creepage currents, or "tracking" between the layers of insulation, such as between points "a" and "c", "c" and "b" and "d" and "f" and "d". This usually results in the charring and the burning of the insulation and the formation of "tree designs" such as shown in Figure 9 and in Figure 14 in (1), These effects almost inevitably culminate in the ultimate failure and destruction of the insulation.
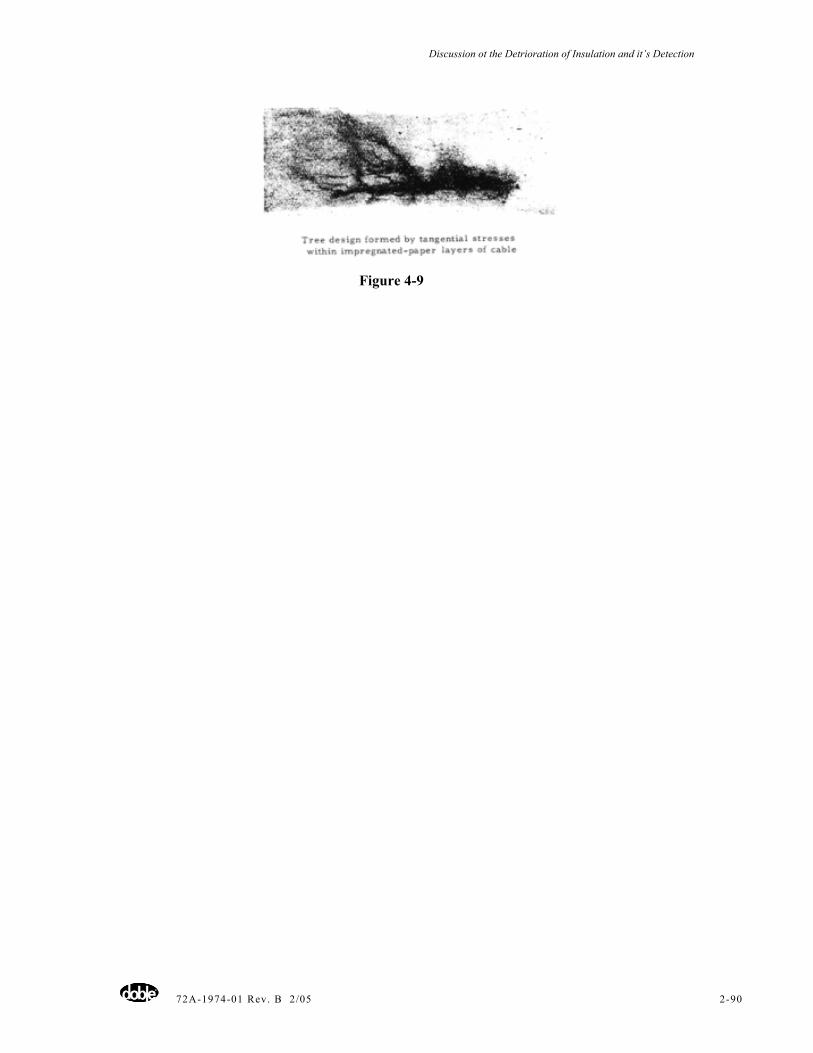
Discussion ot the Detrioration of Insulation and it’s Detection
72A-1974-01 Rev. B 2/05 2-90
Figure 4-9
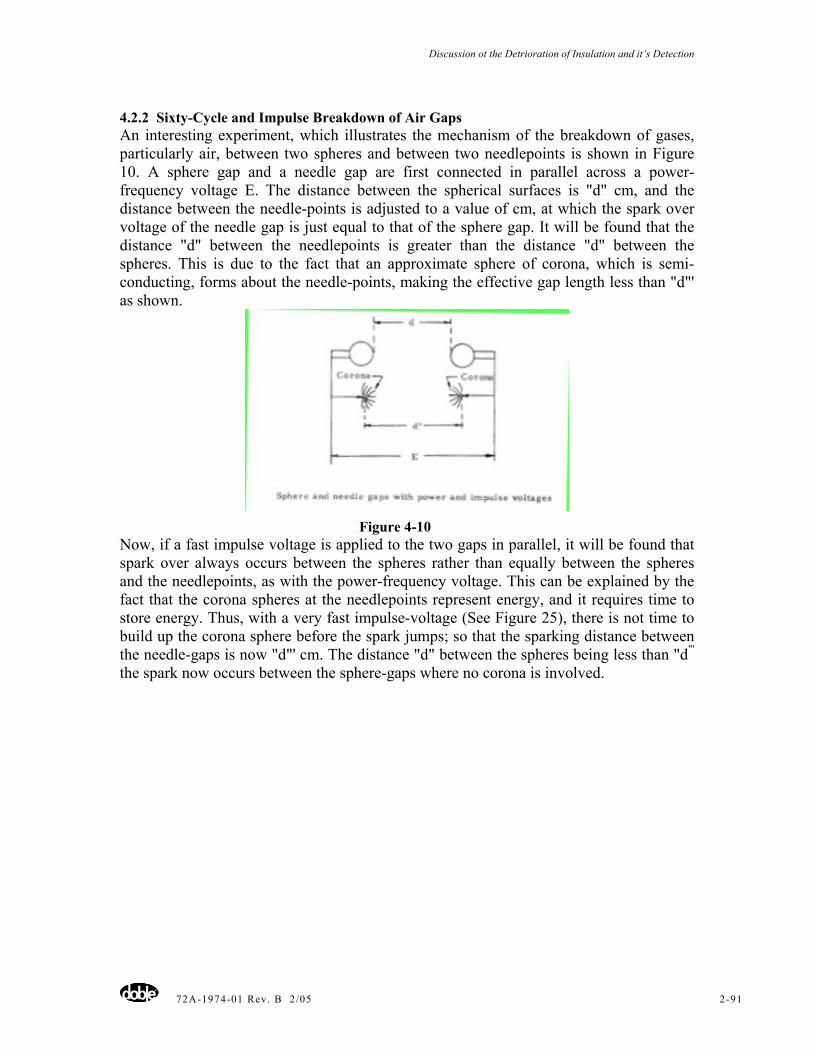
Discussion ot the Detrioration of Insulation and it’s Detection
72A-1974-01 Rev. B 2/05 2-91
4.2.2 Sixty-Cycle and Impulse Breakdown of Air Gaps An interesting experiment, which illustrates the mechanism of the breakdown of gases, particularly air, between two spheres and between two needlepoints is shown in Figure 10. A sphere gap and a needle gap are first connected in parallel across a power-frequency voltage E. The distance between the spherical surfaces is "d" cm, and the distance between the needle-points is adjusted to a value of cm, at which the spark over voltage of the needle gap is just equal to that of the sphere gap. It will be found that the distance "d" between the needlepoints is greater than the distance "d" between the spheres. This is due to the fact that an approximate sphere of corona, which is semi-conducting, forms about the needle-points, making the effective gap length less than "d"' as shown.
Figure 4-10
Now, if a fast impulse voltage is applied to the two gaps in parallel, it will be found that spark over always occurs between the spheres rather than equally between the spheres and the needlepoints, as with the power-frequency voltage. This can be explained by the fact that the corona spheres at the needlepoints represent energy, and it requires time to store energy. Thus, with a very fast impulse-voltage (See Figure 25), there is not time to build up the corona sphere before the spark jumps; so that the sparking distance between the needle-gaps is now "d"' cm. The distance "d" between the spheres being less than "d"' the spark now occurs between the sphere-gaps where no corona is involved.
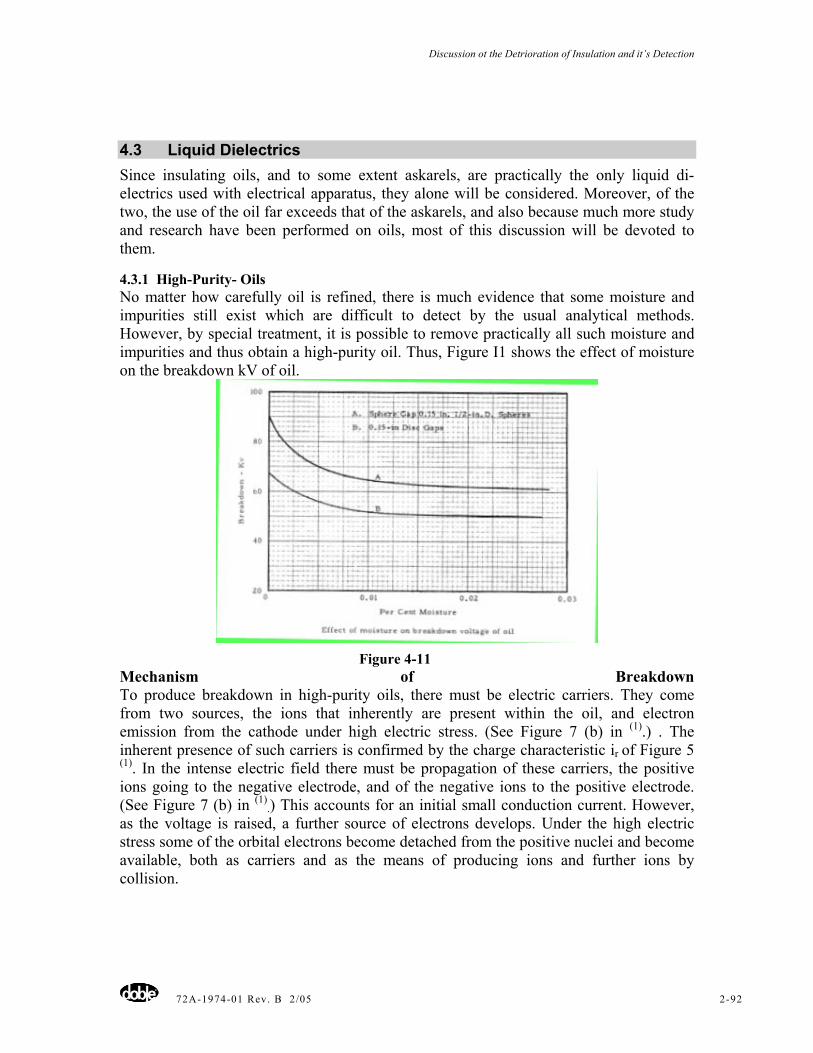
Discussion ot the Detrioration of Insulation and it’s Detection
72A-1974-01 Rev. B 2/05 2-92
4.3 Liquid Dielectrics Since insulating oils, and to some extent askarels, are practically the only liquid di-electrics used with electrical apparatus, they alone will be considered. Moreover, of the two, the use of the oil far exceeds that of the askarels, and also because much more study and research have been performed on oils, most of this discussion will be devoted to them.
4.3.1 High-Purity- Oils No matter how carefully oil is refined, there is much evidence that some moisture and impurities still exist which are difficult to detect by the usual analytical methods. However, by special treatment, it is possible to remove practically all such moisture and impurities and thus obtain a high-purity oil. Thus, Figure I1 shows the effect of moisture on the breakdown kV of oil.
Figure 4-11
Mechanism of Breakdown To produce breakdown in high-purity oils, there must be electric carriers. They come from two sources, the ions that inherently are present within the oil, and electron emission from the cathode under high electric stress. (See Figure 7 (b) in (1).) . The inherent presence of such carriers is confirmed by the charge characteristic ir of Figure 5 (1). In the intense electric field there must be propagation of these carriers, the positive ions going to the negative electrode, and of the negative ions to the positive electrode. (See Figure 7 (b) in (1)
.) This accounts for an initial small conduction current. However, as the voltage is raised, a further source of electrons develops. Under the high electric stress some of the orbital electrons become detached from the positive nuclei and become available, both as carriers and as the means of producing ions and further ions by collision.
Discussion ot the Detrioration of Insulation and it’s Detection
72A-1974-01 Rev. B 2/05 2-93
As the voltage is raised, cumulative ionization by collision and ionic avalanches develop in much the same manner as they do in gases (page 2-202) except that the mean-free- path of the electrons and ions obviously is much shorter. Also, inherently, gas is readily absorbed by oil and, unless the oil is most thoroughly degassed, minute gas bubbles mar be present and these become ionized and contribute to the collision phenomena and ultimate breakdown. As the voltage reaches higher values, transient flashes may pass between the electrodes, which are known as pilot or preliminary sparks. If the gap is large, streamers may spread out between the gaps, particularly with spheres. These are known as high-voltage streamers. Before ultimate breakdown, a glow, similar to corona in air, sometimes occurs. This is known as corona in liquids. These effects, known as discharges in liquids, indicate that a measure of instability, such as in gases shown at point "f" and beyond in Figure 1, occurs. When breakdown occurs, an arc is formed within the liquid and, for the time, the insulating properties of the oil are completely lost. The breakdown voltage (BDV) is also called the spark over voltage. The term critical voltage is used generally to denote a voltage at which the foregoing discharge effects take place. The heat of the arc in the liquid carbonizes the oil in its vicinity, and the carbon particles ultimately diffuse throughout the body of the oil, producing contamination; and thus greatly impairing the dielectric and insulating properties of the oil. For a detailed analysis of the mechanism of the breakdown of oils with impulse voltages see Bibliography 9.
4.3.2 Good Oils Good, or commercially refined, oils will inevitably contain some contaminants, which can only be removed by the most careful treatment, as stated above. Such contaminants may consist of some moisture, of minute amounts of dissolved solids such as paraffin and wax, dissolved electrolytes, and colloidal and carbon particles of sub-microscopic size. Moisture occurs as (1) a true solution; (2) a colloidal solution; (3) an emulsion; and (4) condensed on nuclei. Also, as with high-purity oils, such oils must contain free ions also to account for their conductivity characteristics, their temperature coefficient, and their irreversible charge current ir shown in Figure 5 in (1). Mechanism of a Breakdown The mechanism of breakdown of good oils in general is the same as for the high-purity oils, except that the contaminants add to the carriers; that is, the carriers are accelerated by the high-strength electric field, producing further ions (and electrons) by collision until the action becomes cumulative, reaching avalanche proportions. Also, as with high-purity oils, some of the orbital electrons become detached from the positive nuclei, adding their effect to the collisions and electronic avalanches. As the voltage becomes higher and higher, pilot, or preliminary, sparks and corona occur which develop into high-voltage streamers, followed by ultimate breakdown. However, because of the presence of the contaminants, resulting in many more carriers than with high-purity oils, ionization reaches the cumulative condition at much lower voltages. Moreover, the dielectric constants of the contaminants are inherently greater than those for the oil itself; so that they tend to line up between the electrodes, offering a path of lowered resistance to breakdown. Spheres are frequently used for electrodes in breakdown tests of oil, since with them the breakdown voltage is quite sensitive to moisture. Several investigators, (7), (8), have found that the breakdown voltage between spheres in oil follow the well-know linear function given by
Discussion ot the Detrioration of Insulation and it’s Detection
72A-1974-01 Rev. B 2/05 2-94
y = Xo + mx (3) Which is exemplified by Equation (7), P = Po + mf watts on page 22 in (2). Xo is the in-tercept on the zero y-ordinate and m is the slope.
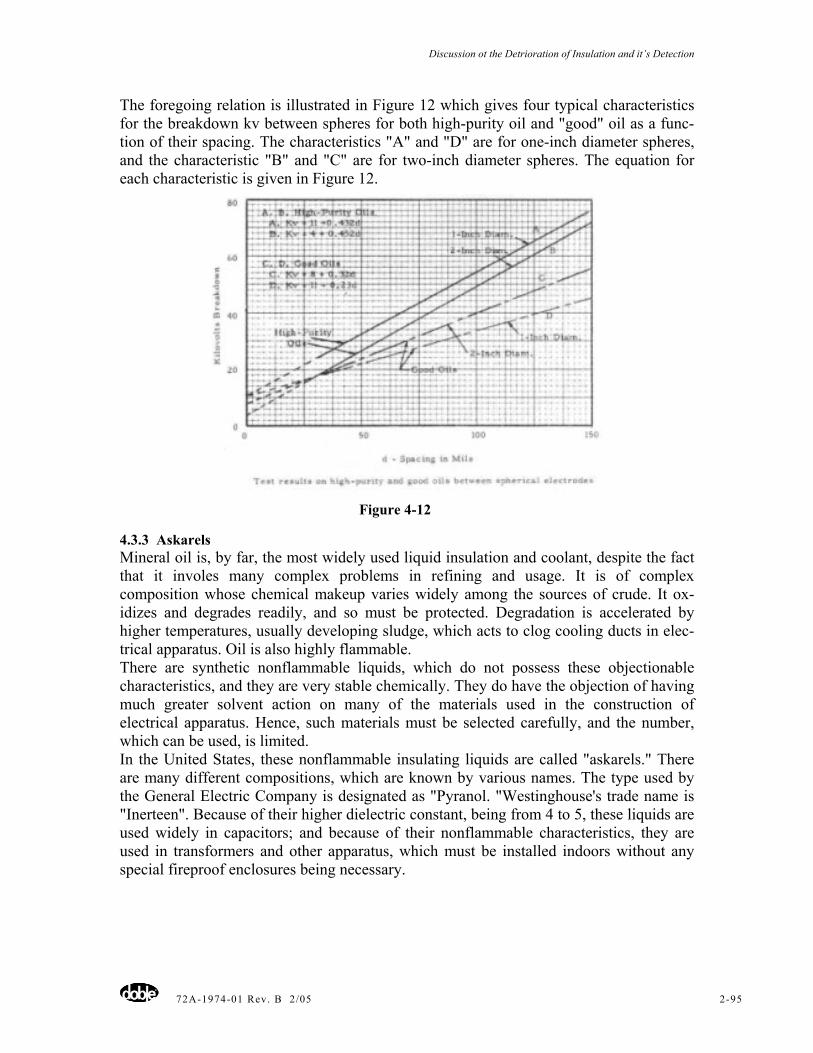
Discussion ot the Detrioration of Insulation and it’s Detection
72A-1974-01 Rev. B 2/05 2-95
The foregoing relation is illustrated in Figure 12 which gives four typical characteristics for the breakdown kv between spheres for both high-purity oil and "good" oil as a func-tion of their spacing. The characteristics "A" and "D" are for one-inch diameter spheres, and the characteristic "B" and "C" are for two-inch diameter spheres. The equation for each characteristic is given in Figure 12.
Figure 4-12
4.3.3 Askarels Mineral oil is, by far, the most widely used liquid insulation and coolant, despite the fact that it involes many complex problems in refining and usage. It is of complex composition whose chemical makeup varies widely among the sources of crude. It ox-idizes and degrades readily, and so must be protected. Degradation is accelerated by higher temperatures, usually developing sludge, which acts to clog cooling ducts in elec-trical apparatus. Oil is also highly flammable. There are synthetic nonflammable liquids, which do not possess these objectionable characteristics, and they are very stable chemically. They do have the objection of having much greater solvent action on many of the materials used in the construction of electrical apparatus. Hence, such materials must be selected carefully, and the number, which can be used, is limited. In the United States, these nonflammable insulating liquids are called "askarels." There are many different compositions, which are known by various names. The type used by the General Electric Company is designated as "Pyranol. "Westinghouse's trade name is "Inerteen". Because of their higher dielectric constant, being from 4 to 5, these liquids are used widely in capacitors; and because of their nonflammable characteristics, they are used in transformers and other apparatus, which must be installed indoors without any special fireproof enclosures being necessary.
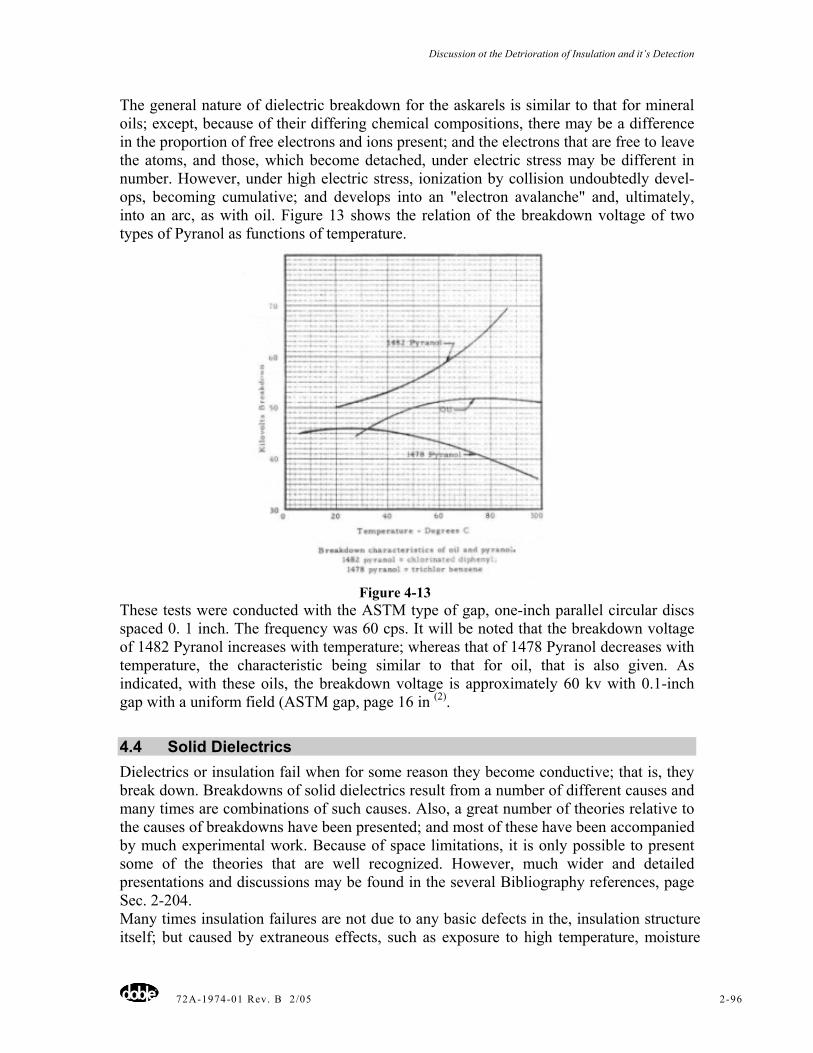
Discussion ot the Detrioration of Insulation and it’s Detection
72A-1974-01 Rev. B 2/05 2-96
The general nature of dielectric breakdown for the askarels is similar to that for mineral oils; except, because of their differing chemical compositions, there may be a difference in the proportion of free electrons and ions present; and the electrons that are free to leave the atoms, and those, which become detached, under electric stress may be different in number. However, under high electric stress, ionization by collision undoubtedly devel-ops, becoming cumulative; and develops into an "electron avalanche" and, ultimately, into an arc, as with oil. Figure 13 shows the relation of the breakdown voltage of two types of Pyranol as functions of temperature.
Figure 4-13
These tests were conducted with the ASTM type of gap, one-inch parallel circular discs spaced 0. 1 inch. The frequency was 60 cps. It will be noted that the breakdown voltage of 1482 Pyranol increases with temperature; whereas that of 1478 Pyranol decreases with temperature, the characteristic being similar to that for oil, that is also given. As indicated, with these oils, the breakdown voltage is approximately 60 kv with 0.1-inch gap with a uniform field (ASTM gap, page 16 in (2).
4.4 Solid Dielectrics Dielectrics or insulation fail when for some reason they become conductive; that is, they break down. Breakdowns of solid dielectrics result from a number of different causes and many times are combinations of such causes. Also, a great number of theories relative to the causes of breakdowns have been presented; and most of these have been accompanied by much experimental work. Because of space limitations, it is only possible to present some of the theories that are well recognized. However, much wider and detailed presentations and discussions may be found in the several Bibliography references, page Sec. 2-204. Many times insulation failures are not due to any basic defects in the, insulation structure itself; but caused by extraneous effects, such as exposure to high temperature, moisture
Discussion ot the Detrioration of Insulation and it’s Detection
72A-1974-01 Rev. B 2/05 2-97
and chemicals. These produce carbonization, cracking, surface tracking, and physical and chemical degradation (see (2)). Also, insulation often fails because of surface injury due to external arcing and to mechanical injury. Many of the foregoing failures can occur at low voltages, far below the dielectric strength of the insulation materials. These types of failures will not be discussed, since their causes are external to the effects, which develop. Within the insulations themselves; and usually they are readily determined by external examination. The following analyses will be directed to failures caused by the effects of electrical stresses and temperature on the internal physical and molecular structure of insulations usually at high-voltage stresses.
4.4.1 Internal Ionization On page 2-204s with reference to Figure 8, it is shown that with an ionized void within insulation, tangential electrical stresses are developed which produce curr creepage, the formation of "tree designs", followed by charring of the insulation and usually ultimate breakdown. In addition, a destructive ionic bombardment effect occurs. On Page 24 in (1), it is stated briefly that the formation of ionization or corona with in restricted voids also acts to destroy the insulation by ionic bombardment, chemical action and heating. For examples in Figure 8 (a), the ionization formed in the void "cd" consists of the highly-active ionized gas and ozone; and the ions in the intense electric field attain high velocities. Thus, the walls "c" and "d" of the void are not only subjected to highlyactinic chemical actions but simultaneously to atomic and ionic bombardments as well as to the heat developed in the corona. The most effective bombardment comes from the positive ions whose mass is something like 1800 times that of the electrons. Minute pinholesin the paper produced by these ions are common. Also, the organic impregnating com-pound, under the severe chemical action of the ozone, becomes polmerized into solid wax-like substances resulting in chemical degradation and a gas. It is clear that these in-ternal destructive effects will almost inevitably result in the final breakdown of the insulation. Thus, every precaution should be taken to prevent voids in the high-voltage insulation.
4.4.2 Intrinsic Electric Breakdown In insulators, the electrons are quite firmly locked to the atoms so that at ordinary electrical stresses they are not free to move from atom to atom, as they are in the conductors. Thus, at normal values of voltages the current due to atomic movement is very small; and often is negligible. The small conduction currents which usually is measurable, (See (1), Figure 7 (b)), is believed to be due to ions. However, at high stresses, more electrons become detached from the atoms and are able to carry charges; hence they produce current. This is sometimes referred to as "internalfteld emission." As the stress is carried to higher and higher values, more and more electrons are released until, at some critical value of stress, the electron emission, and hence the current, increases without limit. This is sometimes called the "critical current density" theory; and the sudden, large increase in electron emission is likened to the "electron avalanche" for gases, (page Sec. 2-202).
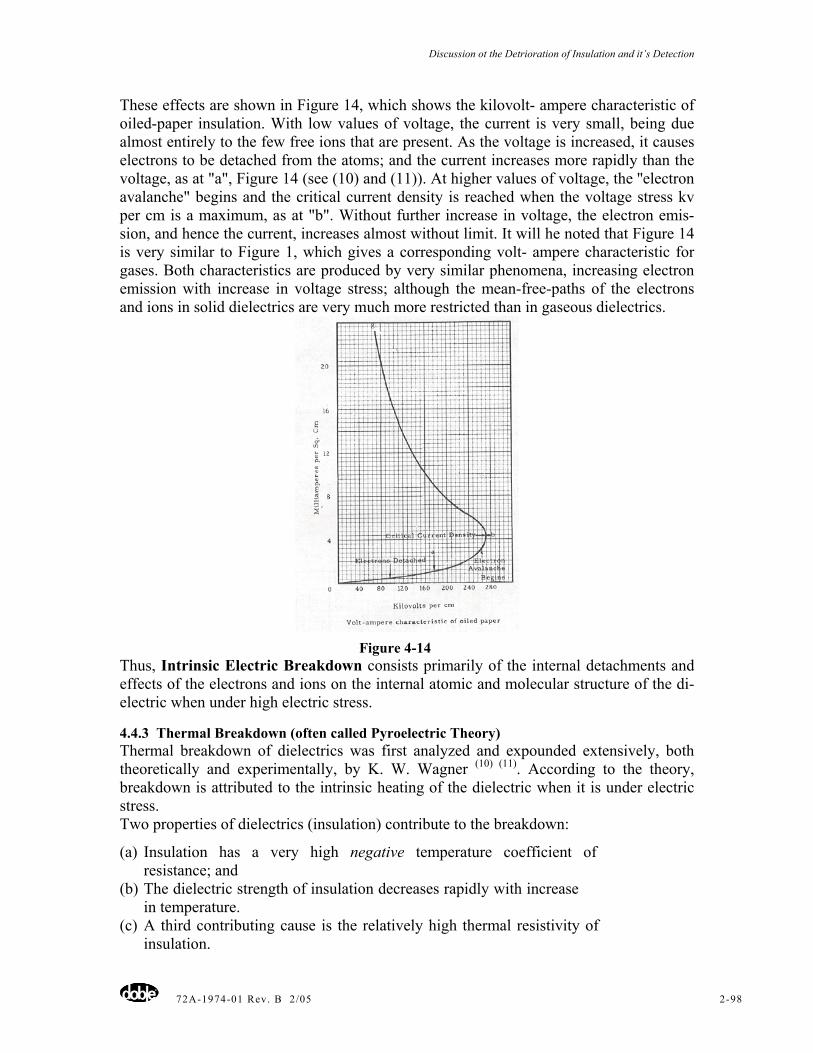
Discussion ot the Detrioration of Insulation and it’s Detection
72A-1974-01 Rev. B 2/05 2-98
These effects are shown in Figure 14, which shows the kilovolt- ampere characteristic of oiled-paper insulation. With low values of voltage, the current is very small, being due almost entirely to the few free ions that are present. As the voltage is increased, it causes electrons to be detached from the atoms; and the current increases more rapidly than the voltage, as at "a", Figure 14 (see (10) and (11)). At higher values of voltage, the ''electron avalanche" begins and the critical current density is reached when the voltage stress kv per cm is a maximum, as at "b". Without further increase in voltage, the electron emis-sion, and hence the current, increases almost without limit. It will he noted that Figure 14 is very similar to Figure 1, which gives a corresponding volt- ampere characteristic for gases. Both characteristics are produced by very similar phenomena, increasing electron emission with increase in voltage stress; although the mean-free-paths of the electrons and ions in solid dielectrics are very much more restricted than in gaseous dielectrics.
Figure 4-14
Thus, Intrinsic Electric Breakdown consists primarily of the internal detachments and effects of the electrons and ions on the internal atomic and molecular structure of the di-electric when under high electric stress.
4.4.3 Thermal Breakdown (often called Pyroelectric Theory) Thermal breakdown of dielectrics was first analyzed and expounded extensively, both theoretically and experimentally, by K. W. Wagner (10) (11). According to the theory, breakdown is attributed to the intrinsic heating of the dielectric when it is under electric stress. Two properties of dielectrics (insulation) contribute to the breakdown:
(a) Insulation has a very high negative temperature coefficient of resistance; and
(b) The dielectric strength of insulation decreases rapidly with increase in temperature.
(c) A third contributing cause is the relatively high thermal resistivity of insulation.
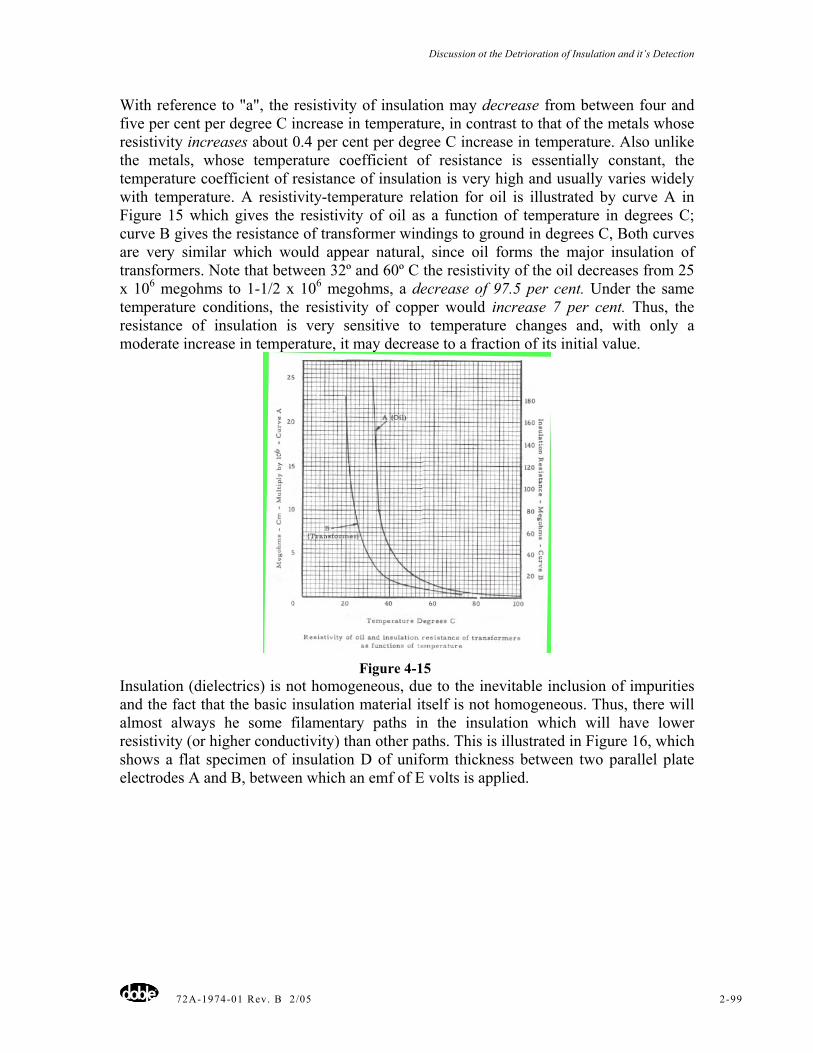
Discussion ot the Detrioration of Insulation and it’s Detection
72A-1974-01 Rev. B 2/05 2-99
With reference to "a", the resistivity of insulation may decrease from between four and five per cent per degree C increase in temperature, in contrast to that of the metals whose resistivity increases about 0.4 per cent per degree C increase in temperature. Also unlike the metals, whose temperature coefficient of resistance is essentially constant, the temperature coefficient of resistance of insulation is very high and usually varies widely with temperature. A resistivity-temperature relation for oil is illustrated by curve A in Figure 15 which gives the resistivity of oil as a function of temperature in degrees C; curve B gives the resistance of transformer windings to ground in degrees C, Both curves are very similar which would appear natural, since oil forms the major insulation of transformers. Note that between 32º and 60º C the resistivity of the oil decreases from 25 x 106 megohms to 1-1/2 x 106 megohms, a decrease of 97.5 per cent. Under the same temperature conditions, the resistivity of copper would increase 7 per cent. Thus, the resistance of insulation is very sensitive to temperature changes and, with only a moderate increase in temperature, it may decrease to a fraction of its initial value.
Figure 4-15
Insulation (dielectrics) is not homogeneous, due to the inevitable inclusion of impurities and the fact that the basic insulation material itself is not homogeneous. Thus, there will almost always he some filamentary paths in the insulation which will have lower resistivity (or higher conductivity) than other paths. This is illustrated in Figure 16, which shows a flat specimen of insulation D of uniform thickness between two parallel plate electrodes A and B, between which an emf of E volts is applied.
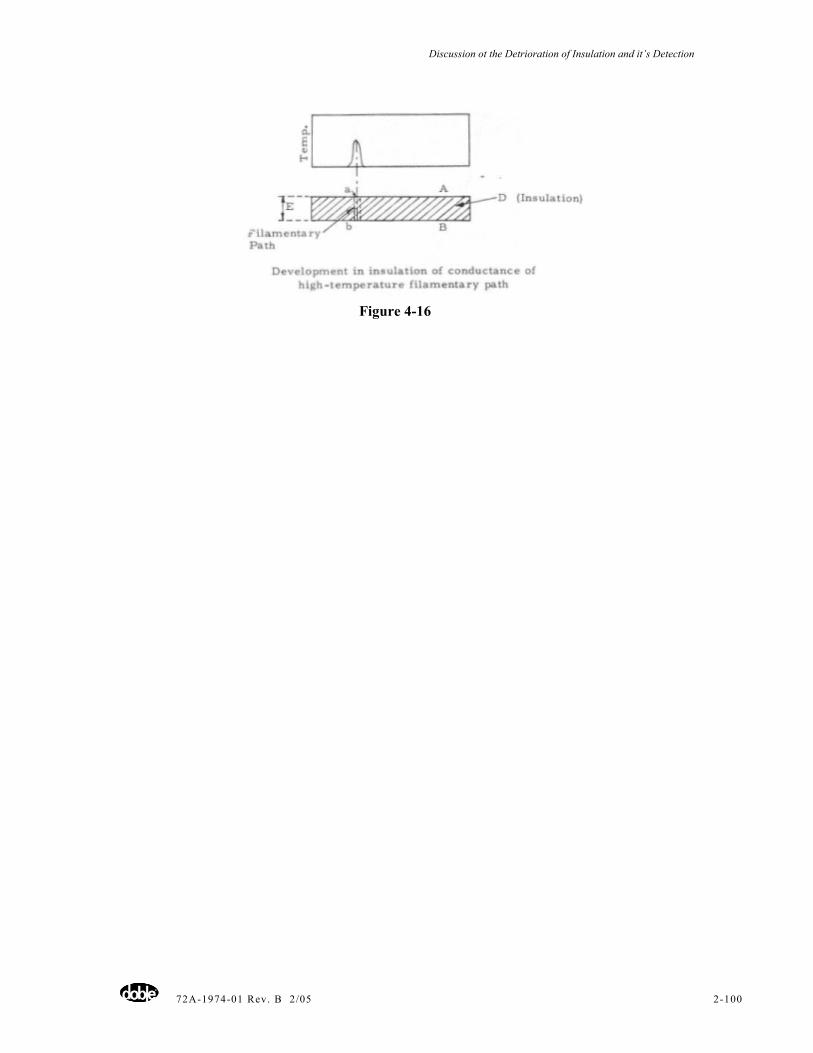
Discussion ot the Detrioration of Insulation and it’s Detection
72A-1974-01 Rev. B 2/05 2-100
Figure 4-16
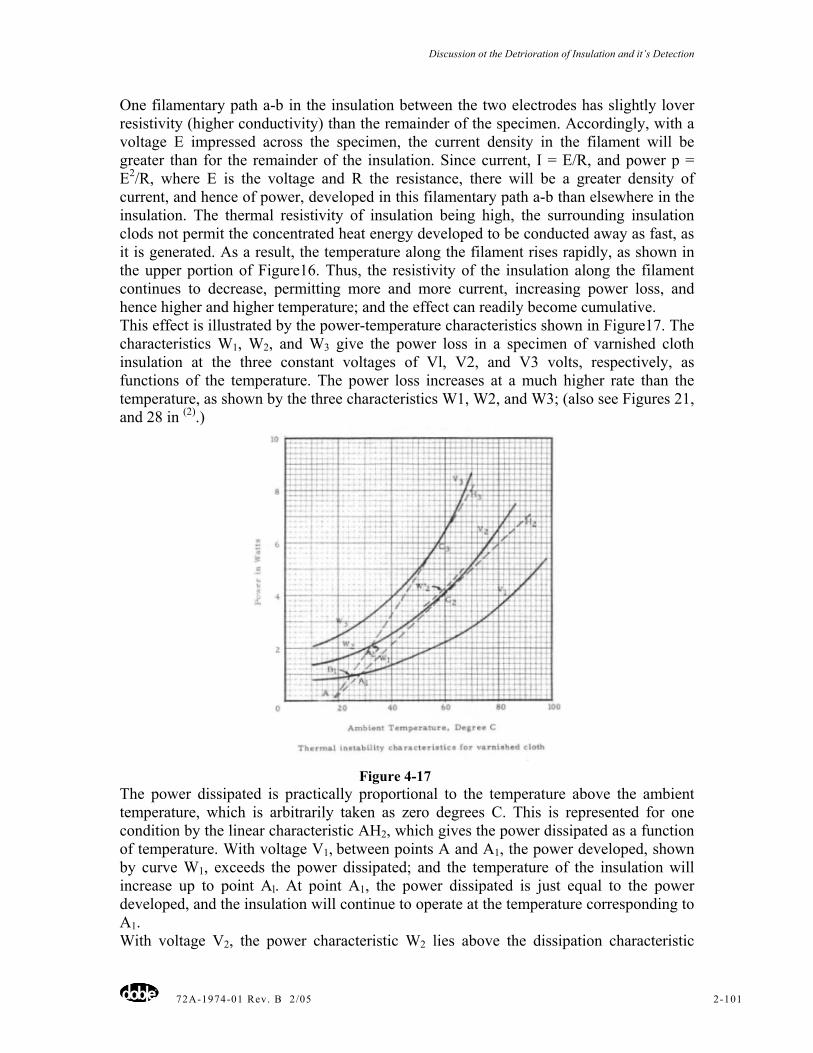
Discussion ot the Detrioration of Insulation and it’s Detection
72A-1974-01 Rev. B 2/05 2-101
One filamentary path a-b in the insulation between the two electrodes has slightly lover resistivity (higher conductivity) than the remainder of the specimen. Accordingly, with a voltage E impressed across the specimen, the current density in the filament will be greater than for the remainder of the insulation. Since current, I = E/R, and power p = E2/R, where E is the voltage and R the resistance, there will be a greater density of current, and hence of power, developed in this filamentary path a-b than elsewhere in the insulation. The thermal resistivity of insulation being high, the surrounding insulation clods not permit the concentrated heat energy developed to be conducted away as fast, as it is generated. As a result, the temperature along the filament rises rapidly, as shown in the upper portion of Figure16. Thus, the resistivity of the insulation along the filament continues to decrease, permitting more and more current, increasing power loss, and hence higher and higher temperature; and the effect can readily become cumulative. This effect is illustrated by the power-temperature characteristics shown in Figure17. The characteristics W1, W2, and W3 give the power loss in a specimen of varnished cloth insulation at the three constant voltages of Vl, V2, and V3 volts, respectively, as functions of the temperature. The power loss increases at a much higher rate than the temperature, as shown by the three characteristics W1, W2, and W3; (also see Figures 21, and 28 in (2).)
Figure 4-17
The power dissipated is practically proportional to the temperature above the ambient temperature, which is arbitrarily taken as zero degrees C. This is represented for one condition by the linear characteristic AH2, which gives the power dissipated as a function of temperature. With voltage V1, between points A and A1, the power developed, shown by curve W1, exceeds the power dissipated; and the temperature of the insulation will increase up to point Al. At point A1, the power dissipated is just equal to the power developed, and the insulation will continue to operate at the temperature corresponding to A1. With voltage V2, the power characteristic W2 lies above the dissipation characteristic
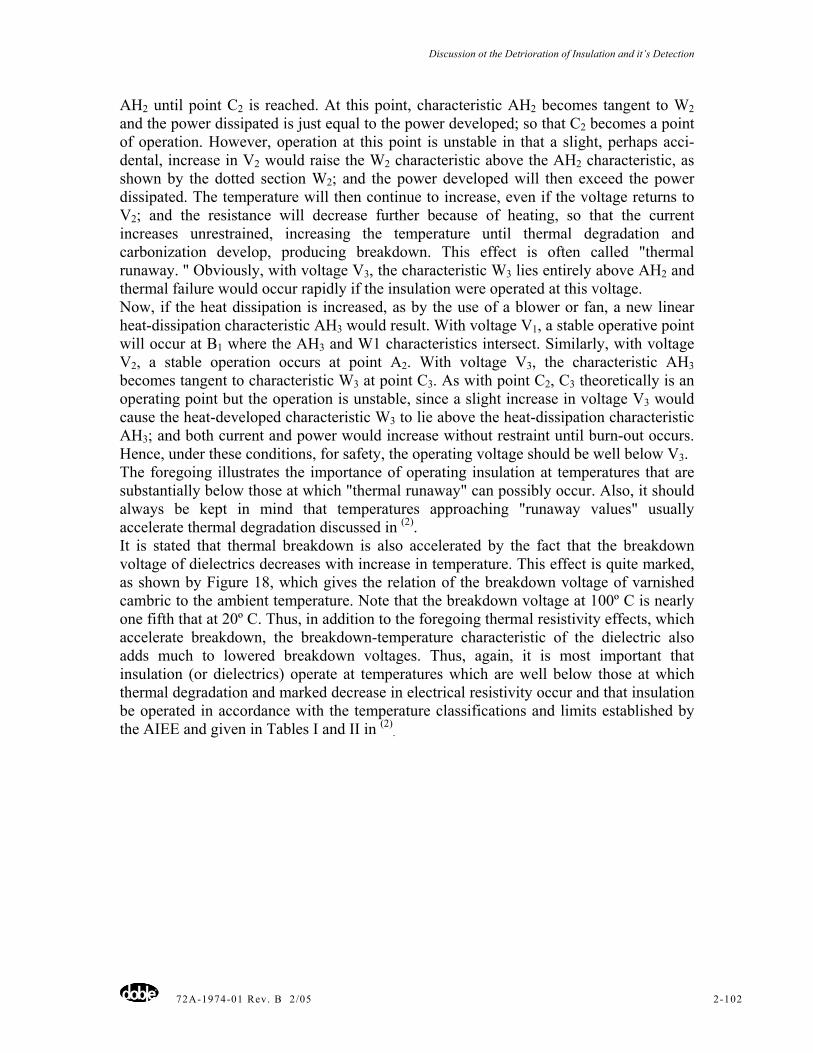
Discussion ot the Detrioration of Insulation and it’s Detection
72A-1974-01 Rev. B 2/05 2-102
AH2 until point C2 is reached. At this point, characteristic AH2 becomes tangent to W2 and the power dissipated is just equal to the power developed; so that C2 becomes a point of operation. However, operation at this point is unstable in that a slight, perhaps acci-dental, increase in V2 would raise the W2 characteristic above the AH2 characteristic, as shown by the dotted section W2; and the power developed will then exceed the power dissipated. The temperature will then continue to increase, even if the voltage returns to V2; and the resistance will decrease further because of heating, so that the current increases unrestrained, increasing the temperature until thermal degradation and carbonization develop, producing breakdown. This effect is often called "thermal runaway. '' Obviously, with voltage V3, the characteristic W3 lies entirely above AH2 and thermal failure would occur rapidly if the insulation were operated at this voltage. Now, if the heat dissipation is increased, as by the use of a blower or fan, a new linear heat-dissipation characteristic AH3 would result. With voltage V1, a stable operative point will occur at B1 where the AH3 and W1 characteristics intersect. Similarly, with voltage V2, a stable operation occurs at point A2. With voltage V3, the characteristic AH3 becomes tangent to characteristic W3 at point C3. As with point C2, C3 theoretically is an operating point but the operation is unstable, since a slight increase in voltage V3 would cause the heat-developed characteristic W3 to lie above the heat-dissipation characteristic AH3; and both current and power would increase without restraint until burn-out occurs. Hence, under these conditions, for safety, the operating voltage should be well below V3. The foregoing illustrates the importance of operating insulation at temperatures that are substantially below those at which "thermal runaway" can possibly occur. Also, it should always be kept in mind that temperatures approaching "runaway values" usually accelerate thermal degradation discussed in (2). It is stated that thermal breakdown is also accelerated by the fact that the breakdown voltage of dielectrics decreases with increase in temperature. This effect is quite marked, as shown by Figure 18, which gives the relation of the breakdown voltage of varnished cambric to the ambient temperature. Note that the breakdown voltage at 100º C is nearly one fifth that at 20º C. Thus, in addition to the foregoing thermal resistivity effects, which accelerate breakdown, the breakdown-temperature characteristic of the dielectric also adds much to lowered breakdown voltages. Thus, again, it is most important that insulation (or dielectrics) operate at temperatures which are well below those at which thermal degradation and marked decrease in electrical resistivity occur and that insulation be operated in accordance with the temperature classifications and limits established by the AIEE and given in Tables I and II in (2)
.
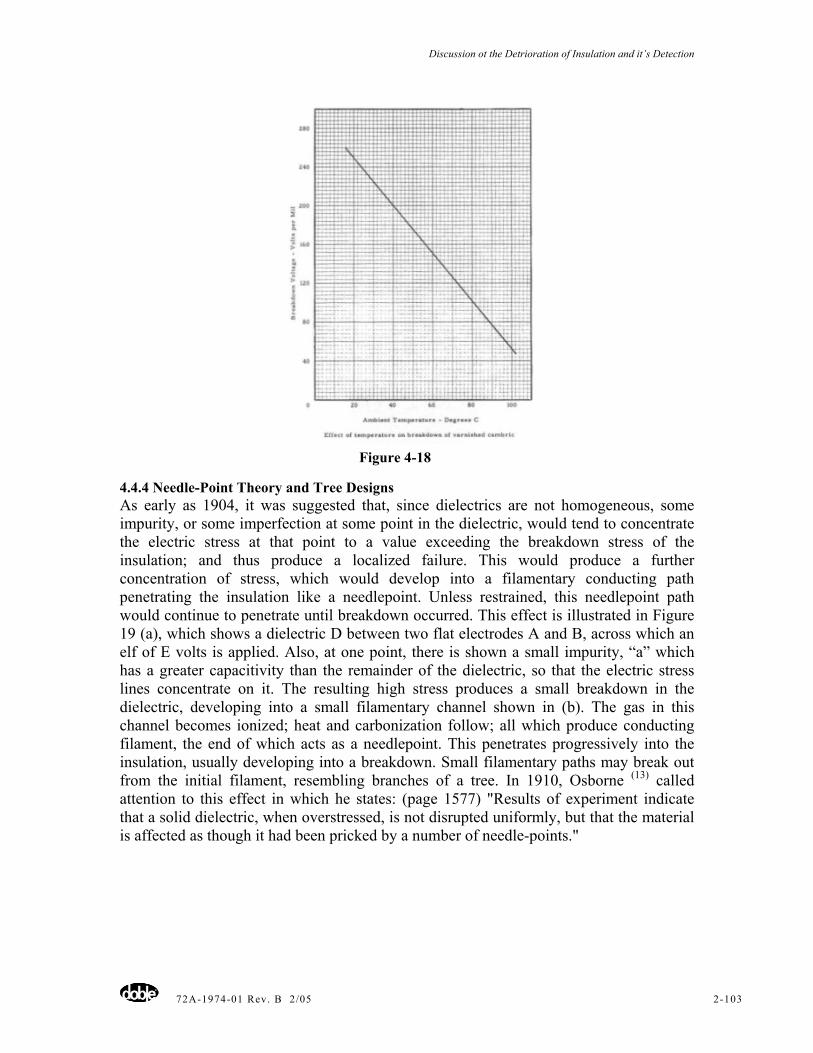
Discussion ot the Detrioration of Insulation and it’s Detection
72A-1974-01 Rev. B 2/05 2-103
Figure 4-18
4.4.4 Needle-Point Theory and Tree Designs As early as 1904, it was suggested that, since dielectrics are not homogeneous, some impurity, or some imperfection at some point in the dielectric, would tend to concentrate the electric stress at that point to a value exceeding the breakdown stress of the insulation; and thus produce a localized failure. This would produce a further concentration of stress, which would develop into a filamentary conducting path penetrating the insulation like a needlepoint. Unless restrained, this needlepoint path would continue to penetrate until breakdown occurred. This effect is illustrated in Figure 19 (a), which shows a dielectric D between two flat electrodes A and B, across which an elf of E volts is applied. Also, at one point, there is shown a small impurity, “a” which has a greater capacitivity than the remainder of the dielectric, so that the electric stress lines concentrate on it. The resulting high stress produces a small breakdown in the dielectric, developing into a small filamentary channel shown in (b). The gas in this channel becomes ionized; heat and carbonization follow; all which produce conducting filament, the end of which acts as a needlepoint. This penetrates progressively into the insulation, usually developing into a breakdown. Small filamentary paths may break out from the initial filament, resembling branches of a tree. In 1910, Osborne (13) called attention to this effect in which he states: (page 1577) "Results of experiment indicate that a solid dielectric, when overstressed, is not disrupted uniformly, but that the material is affected as though it had been pricked by a number of needle-points."
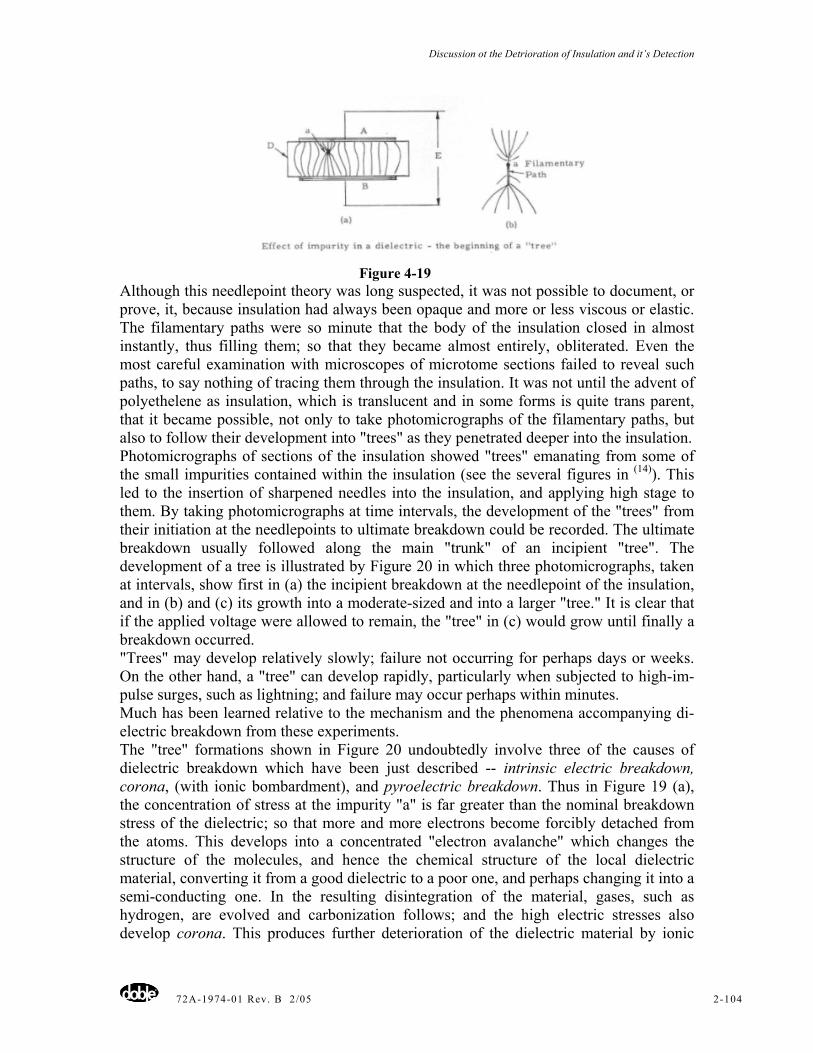
Discussion ot the Detrioration of Insulation and it’s Detection
72A-1974-01 Rev. B 2/05 2-104
Figure 4-19
Although this needlepoint theory was long suspected, it was not possible to document, or prove, it, because insulation had always been opaque and more or less viscous or elastic. The filamentary paths were so minute that the body of the insulation closed in almost instantly, thus filling them; so that they became almost entirely, obliterated. Even the most careful examination with microscopes of microtome sections failed to reveal such paths, to say nothing of tracing them through the insulation. It was not until the advent of polyethelene as insulation, which is translucent and in some forms is quite trans parent, that it became possible, not only to take photomicrographs of the filamentary paths, but also to follow their development into "trees" as they penetrated deeper into the insulation. Photomicrographs of sections of the insulation showed "trees" emanating from some of the small impurities contained within the insulation (see the several figures in (14)). This led to the insertion of sharpened needles into the insulation, and applying high stage to them. By taking photomicrographs at time intervals, the development of the "trees" from their initiation at the needlepoints to ultimate breakdown could be recorded. The ultimate breakdown usually followed along the main "trunk" of an incipient "tree". The development of a tree is illustrated by Figure 20 in which three photomicrographs, taken at intervals, show first in (a) the incipient breakdown at the needlepoint of the insulation, and in (b) and (c) its growth into a moderate-sized and into a larger "tree." It is clear that if the applied voltage were allowed to remain, the "tree" in (c) would grow until finally a breakdown occurred. "Trees" may develop relatively slowly; failure not occurring for perhaps days or weeks. On the other hand, a "tree" can develop rapidly, particularly when subjected to high-im-pulse surges, such as lightning; and failure may occur perhaps within minutes. Much has been learned relative to the mechanism and the phenomena accompanying di-electric breakdown from these experiments. The "tree" formations shown in Figure 20 undoubtedly involve three of the causes of dielectric breakdown which have been just described -- intrinsic electric breakdown, corona, (with ionic bombardment), and pyroelectric breakdown. Thus in Figure 19 (a), the concentration of stress at the impurity "a" is far greater than the nominal breakdown stress of the dielectric; so that more and more electrons become forcibly detached from the atoms. This develops into a concentrated "electron avalanche" which changes the structure of the molecules, and hence the chemical structure of the local dielectric material, converting it from a good dielectric to a poor one, and perhaps changing it into a semi-conducting one. In the resulting disintegration of the material, gases, such as hydrogen, are evolved and carbonization follows; and the high electric stresses also develop corona. This produces further deterioration of the dielectric material by ionic
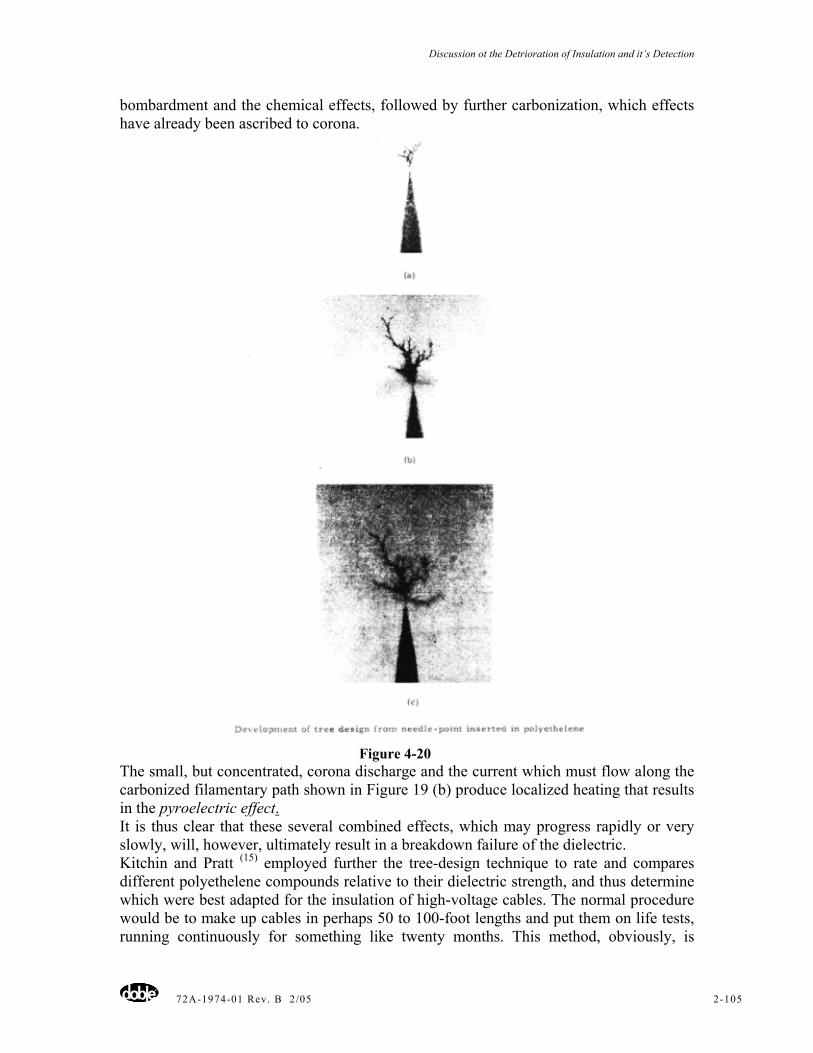
Discussion ot the Detrioration of Insulation and it’s Detection
72A-1974-01 Rev. B 2/05 2-105
bombardment and the chemical effects, followed by further carbonization, which effects have already been ascribed to corona.
Figure 4-20
The small, but concentrated, corona discharge and the current which must flow along the carbonized filamentary path shown in Figure 19 (b) produce localized heating that results in the pyroelectric effect. It is thus clear that these several combined effects, which may progress rapidly or very slowly, will, however, ultimately result in a breakdown failure of the dielectric. Kitchin and Pratt (15) employed further the tree-design technique to rate and compares different polyethelene compounds relative to their dielectric strength, and thus determine which were best adapted for the insulation of high-voltage cables. The normal procedure would be to make up cables in perhaps 50 to 100-foot lengths and put them on life tests, running continuously for something like twenty months. This method, obviously, is
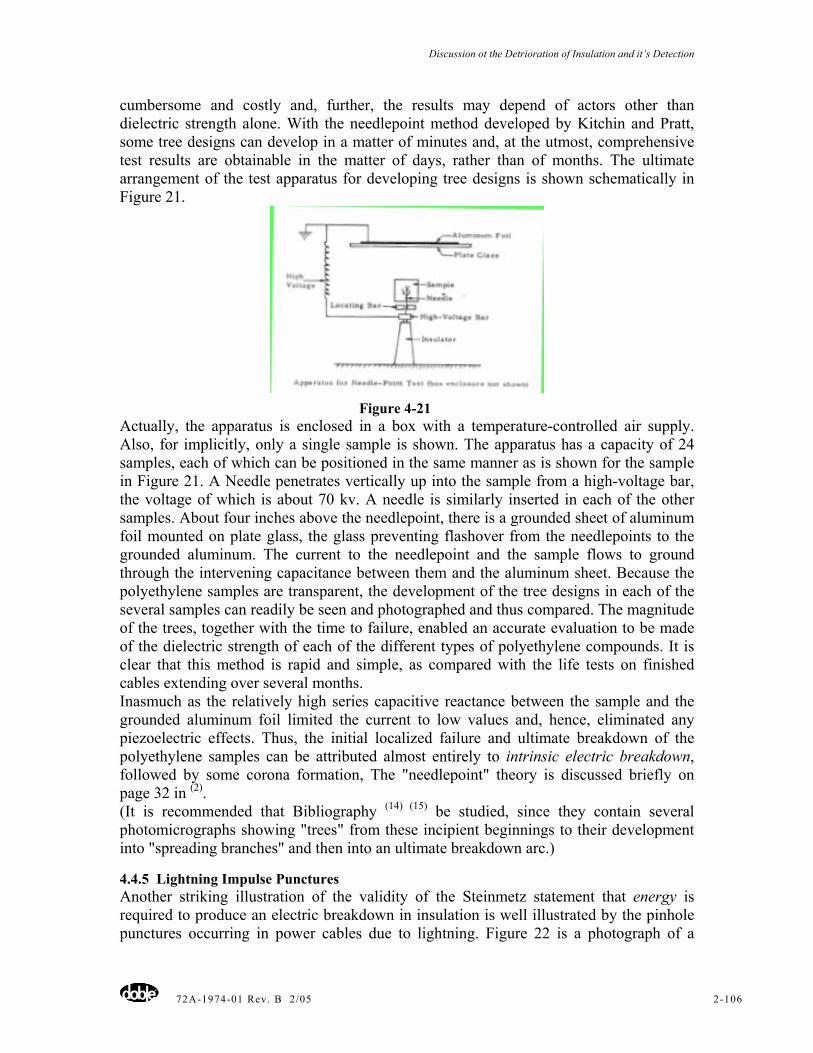
Discussion ot the Detrioration of Insulation and it’s Detection
72A-1974-01 Rev. B 2/05 2-106
cumbersome and costly and, further, the results may depend of actors other than dielectric strength alone. With the needlepoint method developed by Kitchin and Pratt, some tree designs can develop in a matter of minutes and, at the utmost, comprehensive test results are obtainable in the matter of days, rather than of months. The ultimate arrangement of the test apparatus for developing tree designs is shown schematically in Figure 21.
Figure 4-21
Actually, the apparatus is enclosed in a box with a temperature-controlled air supply. Also, for implicitly, only a single sample is shown. The apparatus has a capacity of 24 samples, each of which can be positioned in the same manner as is shown for the sample in Figure 21. A Needle penetrates vertically up into the sample from a high-voltage bar, the voltage of which is about 70 kv. A needle is similarly inserted in each of the other samples. About four inches above the needlepoint, there is a grounded sheet of aluminum foil mounted on plate glass, the glass preventing flashover from the needlepoints to the grounded aluminum. The current to the needlepoint and the sample flows to ground through the intervening capacitance between them and the aluminum sheet. Because the polyethylene samples are transparent, the development of the tree designs in each of the several samples can readily be seen and photographed and thus compared. The magnitude of the trees, together with the time to failure, enabled an accurate evaluation to be made of the dielectric strength of each of the different types of polyethylene compounds. It is clear that this method is rapid and simple, as compared with the life tests on finished cables extending over several months. Inasmuch as the relatively high series capacitive reactance between the sample and the grounded aluminum foil limited the current to low values and, hence, eliminated any piezoelectric effects. Thus, the initial localized failure and ultimate breakdown of the polyethylene samples can be attributed almost entirely to intrinsic electric breakdown, followed by some corona formation, The "needlepoint" theory is discussed briefly on page 32 in (2). (It is recommended that Bibliography (14) (15) be studied, since they contain several photomicrographs showing "trees" from these incipient beginnings to their development into "spreading branches" and then into an ultimate breakdown arc.)
4.4.5 Lightning Impulse Punctures Another striking illustration of the validity of the Steinmetz statement that energy is required to produce an electric breakdown in insulation is well illustrated by the pinhole punctures occurring in power cables due to lightning. Figure 22 is a photograph of a
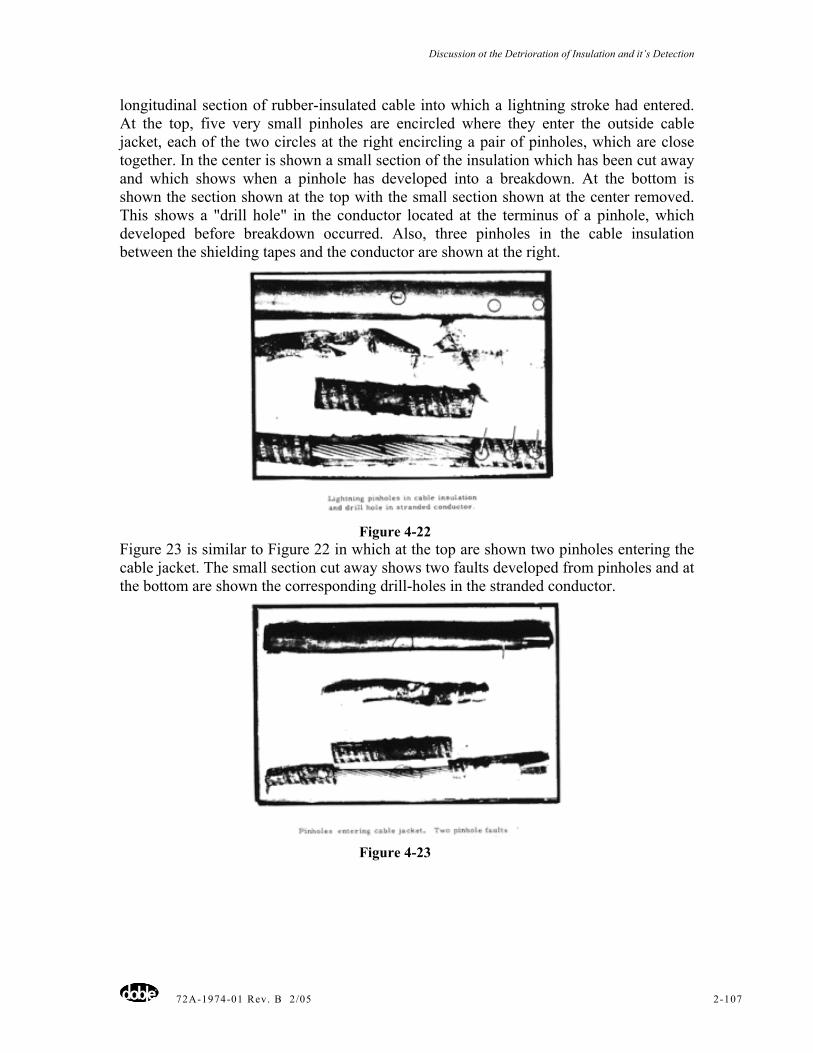
Discussion ot the Detrioration of Insulation and it’s Detection
72A-1974-01 Rev. B 2/05 2-107
longitudinal section of rubber-insulated cable into which a lightning stroke had entered. At the top, five very small pinholes are encircled where they enter the outside cable jacket, each of the two circles at the right encircling a pair of pinholes, which are close together. In the center is shown a small section of the insulation which has been cut away and which shows when a pinhole has developed into a breakdown. At the bottom is shown the section shown at the top with the small section shown at the center removed. This shows a "drill hole" in the conductor located at the terminus of a pinhole, which developed before breakdown occurred. Also, three pinholes in the cable insulation between the shielding tapes and the conductor are shown at the right.
Figure 4-22
Figure 23 is similar to Figure 22 in which at the top are shown two pinholes entering the cable jacket. The small section cut away shows two faults developed from pinholes and at the bottom are shown the corresponding drill-holes in the stranded conductor.
Figure 4-23
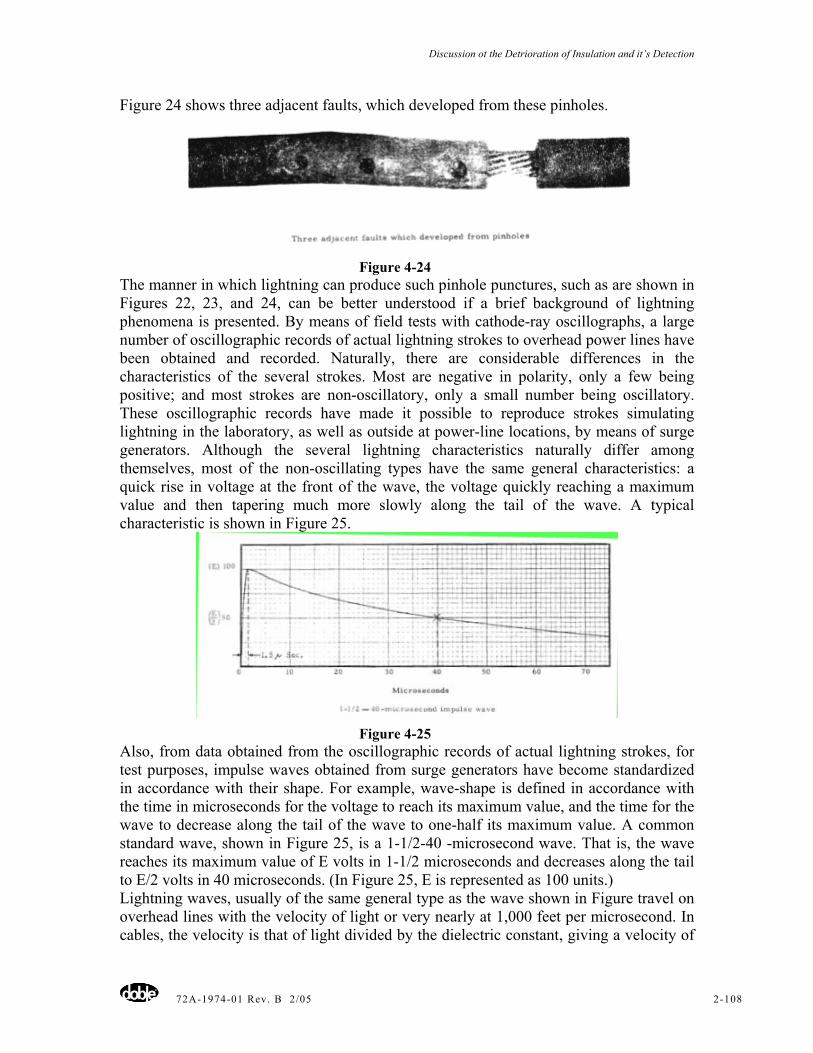
Discussion ot the Detrioration of Insulation and it’s Detection
72A-1974-01 Rev. B 2/05 2-108
Figure 24 shows three adjacent faults, which developed from these pinholes.
Figure 4-24
The manner in which lightning can produce such pinhole punctures, such as are shown in Figures 22, 23, and 24, can be better understood if a brief background of lightning phenomena is presented. By means of field tests with cathode-ray oscillographs, a large number of oscillographic records of actual lightning strokes to overhead power lines have been obtained and recorded. Naturally, there are considerable differences in the characteristics of the several strokes. Most are negative in polarity, only a few being positive; and most strokes are non-oscillatory, only a small number being oscillatory. These oscillographic records have made it possible to reproduce strokes simulating lightning in the laboratory, as well as outside at power-line locations, by means of surge generators. Although the several lightning characteristics naturally differ among themselves, most of the non-oscillating types have the same general characteristics: a quick rise in voltage at the front of the wave, the voltage quickly reaching a maximum value and then tapering much more slowly along the tail of the wave. A typical characteristic is shown in Figure 25.
Figure 4-25
Also, from data obtained from the oscillographic records of actual lightning strokes, for test purposes, impulse waves obtained from surge generators have become standardized in accordance with their shape. For example, wave-shape is defined in accordance with the time in microseconds for the voltage to reach its maximum value, and the time for the wave to decrease along the tail of the wave to one-half its maximum value. A common standard wave, shown in Figure 25, is a 1-1/2-40 -microsecond wave. That is, the wave reaches its maximum value of E volts in 1-1/2 microseconds and decreases along the tail to E/2 volts in 40 microseconds. (In Figure 25, E is represented as 100 units.) Lightning waves, usually of the same general type as the wave shown in Figure travel on overhead lines with the velocity of light or very nearly at 1,000 feet per microsecond. In cables, the velocity is that of light divided by the dielectric constant, giving a velocity of
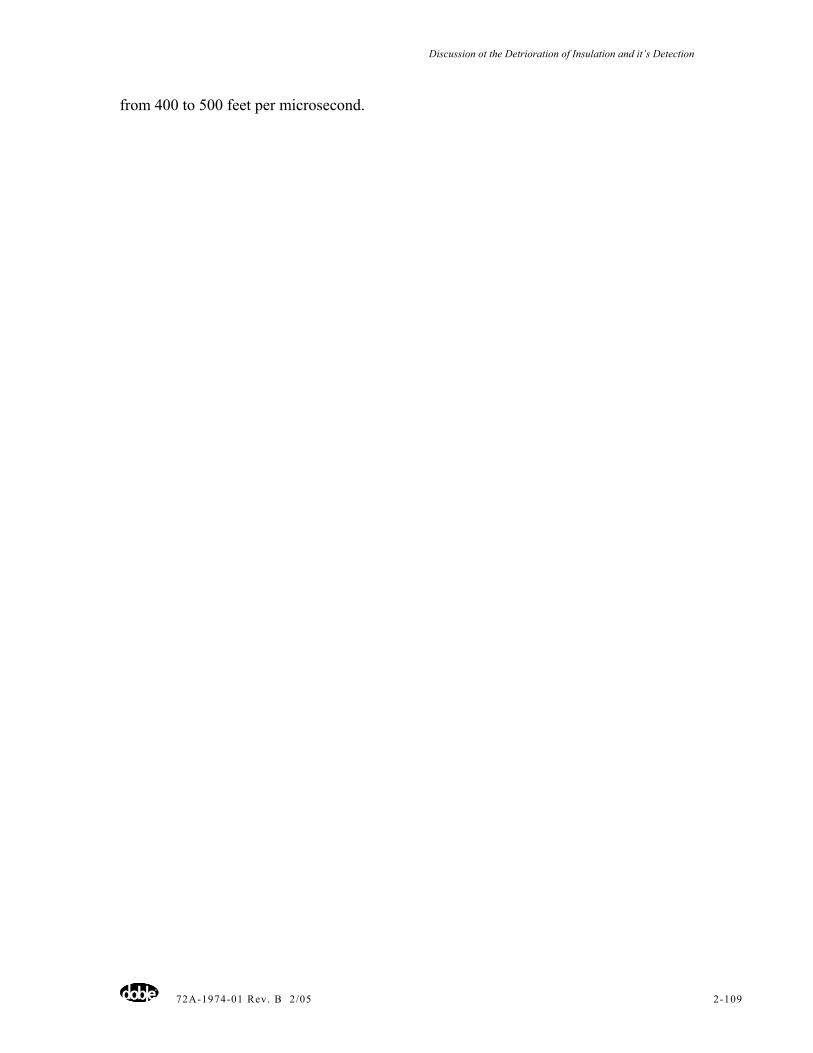
Discussion ot the Detrioration of Insulation and it’s Detection
72A-1974-01 Rev. B 2/05 2-109
from 400 to 500 feet per microsecond.
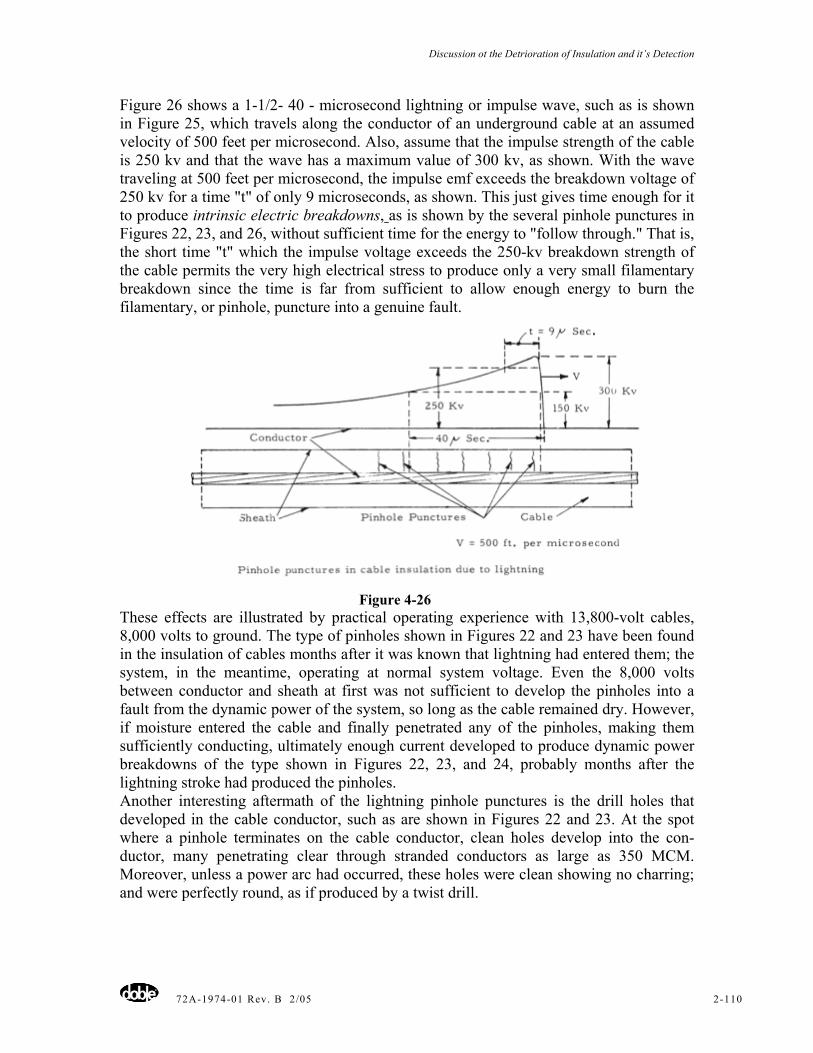
Discussion ot the Detrioration of Insulation and it’s Detection
72A-1974-01 Rev. B 2/05 2-110
Figure 26 shows a 1-1/2- 40 - microsecond lightning or impulse wave, such as is shown in Figure 25, which travels along the conductor of an underground cable at an assumed velocity of 500 feet per microsecond. Also, assume that the impulse strength of the cable is 250 kv and that the wave has a maximum value of 300 kv, as shown. With the wave traveling at 500 feet per microsecond, the impulse emf exceeds the breakdown voltage of 250 kv for a time "t" of only 9 microseconds, as shown. This just gives time enough for it to produce intrinsic electric breakdowns, as is shown by the several pinhole punctures in Figures 22, 23, and 26, without sufficient time for the energy to "follow through." That is, the short time "t" which the impulse voltage exceeds the 250-kv breakdown strength of the cable permits the very high electrical stress to produce only a very small filamentary breakdown since the time is far from sufficient to allow enough energy to burn the filamentary, or pinhole, puncture into a genuine fault.
Figure 4-26
These effects are illustrated by practical operating experience with 13,800-volt cables, 8,000 volts to ground. The type of pinholes shown in Figures 22 and 23 have been found in the insulation of cables months after it was known that lightning had entered them; the system, in the meantime, operating at normal system voltage. Even the 8,000 volts between conductor and sheath at first was not sufficient to develop the pinholes into a fault from the dynamic power of the system, so long as the cable remained dry. However, if moisture entered the cable and finally penetrated any of the pinholes, making them sufficiently conducting, ultimately enough current developed to produce dynamic power breakdowns of the type shown in Figures 22, 23, and 24, probably months after the lightning stroke had produced the pinholes. Another interesting aftermath of the lightning pinhole punctures is the drill holes that developed in the cable conductor, such as are shown in Figures 22 and 23. At the spot where a pinhole terminates on the cable conductor, clean holes develop into the con-ductor, many penetrating clear through stranded conductors as large as 350 MCM. Moreover, unless a power arc had occurred, these holes were clean showing no charring; and were perfectly round, as if produced by a twist drill.
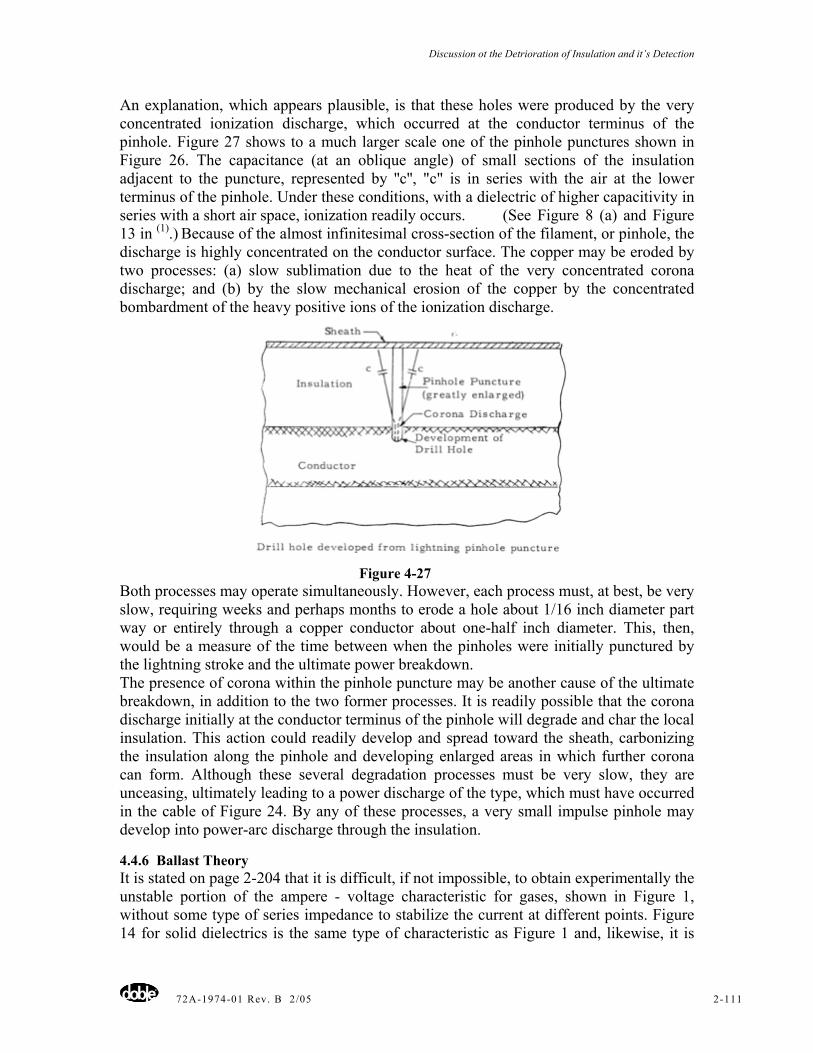
Discussion ot the Detrioration of Insulation and it’s Detection
72A-1974-01 Rev. B 2/05 2-111
An explanation, which appears plausible, is that these holes were produced by the very concentrated ionization discharge, which occurred at the conductor terminus of the pinhole. Figure 27 shows to a much larger scale one of the pinhole punctures shown in Figure 26. The capacitance (at an oblique angle) of small sections of the insulation adjacent to the puncture, represented by ''c'', "c" is in series with the air at the lower terminus of the pinhole. Under these conditions, with a dielectric of higher capacitivity in series with a short air space, ionization readily occurs. (See Figure 8 (a) and Figure 13 in (1).) Because of the almost infinitesimal cross-section of the filament, or pinhole, the discharge is highly concentrated on the conductor surface. The copper may be eroded by two processes: (a) slow sublimation due to the heat of the very concentrated corona discharge; and (b) by the slow mechanical erosion of the copper by the concentrated bombardment of the heavy positive ions of the ionization discharge.
Figure 4-27
Both processes may operate simultaneously. However, each process must, at best, be very slow, requiring weeks and perhaps months to erode a hole about 1/16 inch diameter part way or entirely through a copper conductor about one-half inch diameter. This, then, would be a measure of the time between when the pinholes were initially punctured by the lightning stroke and the ultimate power breakdown. The presence of corona within the pinhole puncture may be another cause of the ultimate breakdown, in addition to the two former processes. It is readily possible that the corona discharge initially at the conductor terminus of the pinhole will degrade and char the local insulation. This action could readily develop and spread toward the sheath, carbonizing the insulation along the pinhole and developing enlarged areas in which further corona can form. Although these several degradation processes must be very slow, they are unceasing, ultimately leading to a power discharge of the type, which must have occurred in the cable of Figure 24. By any of these processes, a very small impulse pinhole may develop into power-arc discharge through the insulation.
4.4.6 Ballast Theory It is stated on page 2-204 that it is difficult, if not impossible, to obtain experimentally the unstable portion of the ampere - voltage characteristic for gases, shown in Figure 1, without some type of series impedance to stabilize the current at different points. Figure 14 for solid dielectrics is the same type of characteristic as Figure 1 and, likewise, it is
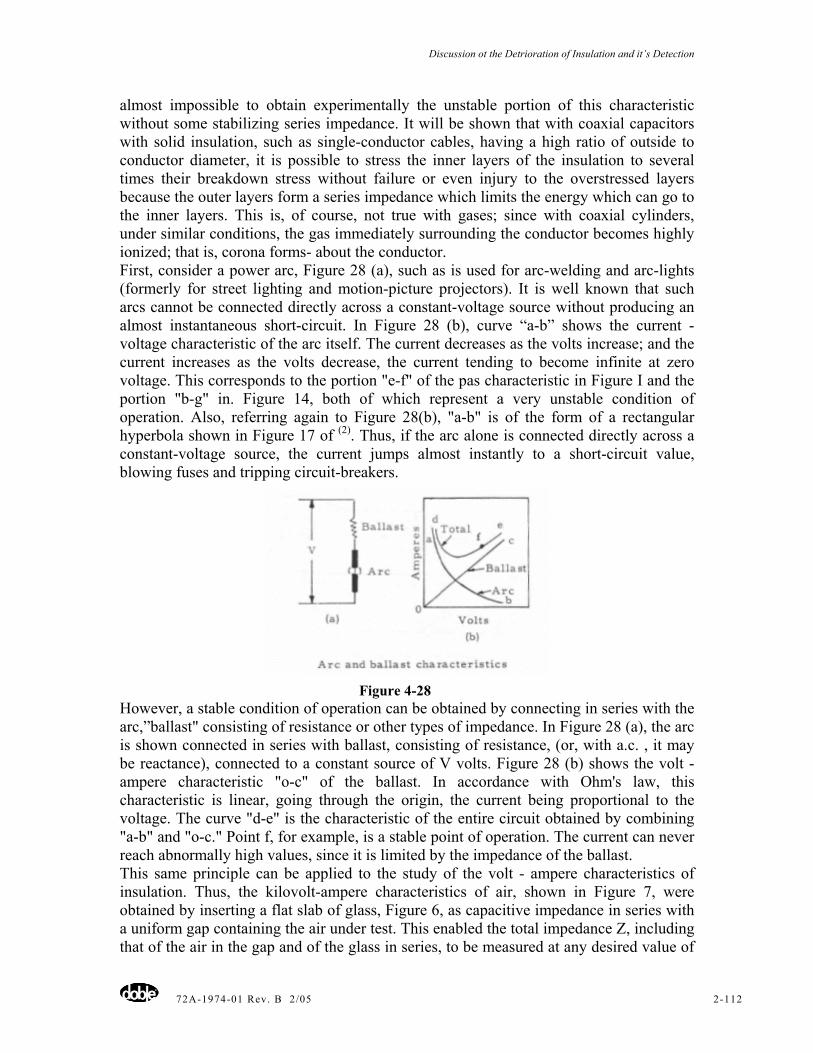
Discussion ot the Detrioration of Insulation and it’s Detection
72A-1974-01 Rev. B 2/05 2-112
almost impossible to obtain experimentally the unstable portion of this characteristic without some stabilizing series impedance. It will be shown that with coaxial capacitors with solid insulation, such as single-conductor cables, having a high ratio of outside to conductor diameter, it is possible to stress the inner layers of the insulation to several times their breakdown stress without failure or even injury to the overstressed layers because the outer layers form a series impedance which limits the energy which can go to the inner layers. This is, of course, not true with gases; since with coaxial cylinders, under similar conditions, the gas immediately surrounding the conductor becomes highly ionized; that is, corona forms- about the conductor. First, consider a power arc, Figure 28 (a), such as is used for arc-welding and arc-lights (formerly for street lighting and motion-picture projectors). It is well known that such arcs cannot be connected directly across a constant-voltage source without producing an almost instantaneous short-circuit. In Figure 28 (b), curve “a-b” shows the current - voltage characteristic of the arc itself. The current decreases as the volts increase; and the current increases as the volts decrease, the current tending to become infinite at zero voltage. This corresponds to the portion "e-f" of the pas characteristic in Figure I and the portion "b-g" in. Figure 14, both of which represent a very unstable condition of operation. Also, referring again to Figure 28(b), "a-b" is of the form of a rectangular hyperbola shown in Figure 17 of (2). Thus, if the arc alone is connected directly across a constant-voltage source, the current jumps almost instantly to a short-circuit value, blowing fuses and tripping circuit-breakers.
Figure 4-28
However, a stable condition of operation can be obtained by connecting in series with the arc,”ballast" consisting of resistance or other types of impedance. In Figure 28 (a), the arc is shown connected in series with ballast, consisting of resistance, (or, with a.c. , it may be reactance), connected to a constant source of V volts. Figure 28 (b) shows the volt - ampere characteristic "o-c" of the ballast. In accordance with Ohm's law, this characteristic is linear, going through the origin, the current being proportional to the voltage. The curve "d-e" is the characteristic of the entire circuit obtained by combining "a-b" and "o-c." Point f, for example, is a stable point of operation. The current can never reach abnormally high values, since it is limited by the impedance of the ballast. This same principle can be applied to the study of the volt - ampere characteristics of insulation. Thus, the kilovolt-ampere characteristics of air, shown in Figure 7, were obtained by inserting a flat slab of glass, Figure 6, as capacitive impedance in series with a uniform gap containing the air under test. This enabled the total impedance Z, including that of the air in the gap and of the glass in series, to be measured at any desired value of
Discussion ot the Detrioration of Insulation and it’s Detection
72A-1974-01 Rev. B 2/05 2-113
current, making it possible to determine the impedance characteristics of the ionized air in the manner described.
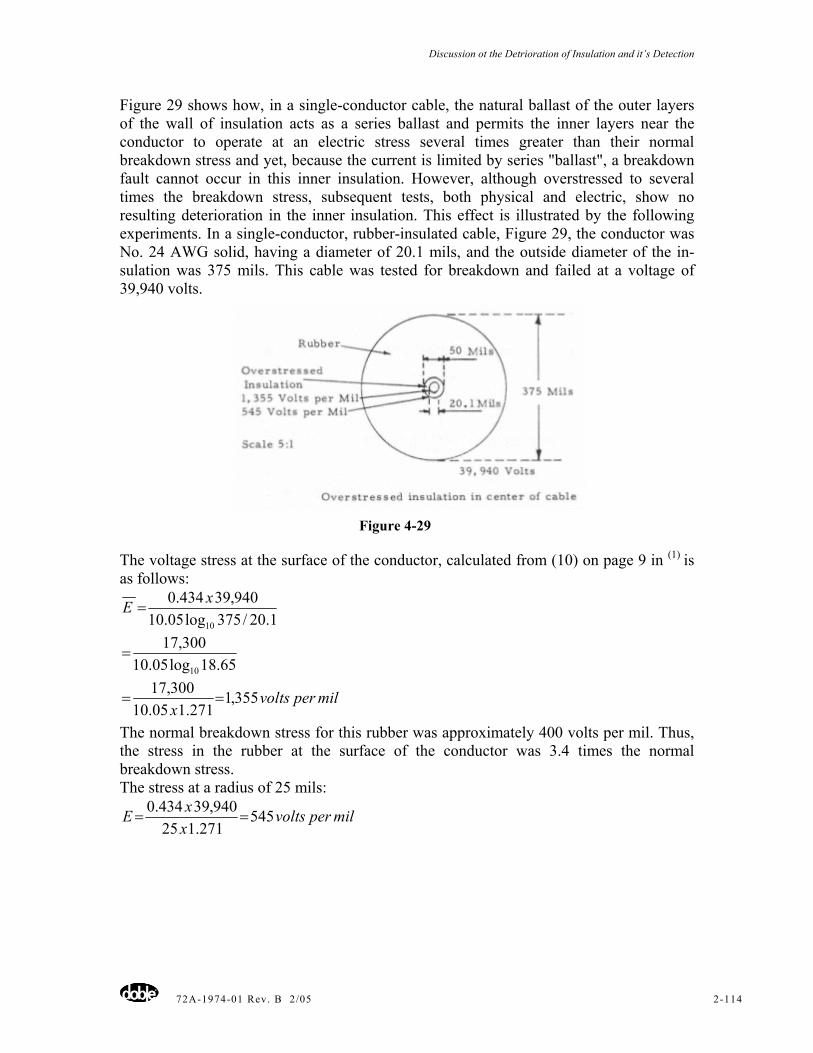
Discussion ot the Detrioration of Insulation and it’s Detection
72A-1974-01 Rev. B 2/05 2-114
Figure 29 shows how, in a single-conductor cable, the natural ballast of the outer layers of the wall of insulation acts as a series ballast and permits the inner layers near the conductor to operate at an electric stress several times greater than their normal breakdown stress and yet, because the current is limited by series "ballast", a breakdown fault cannot occur in this inner insulation. However, although overstressed to several times the breakdown stress, subsequent tests, both physical and electric, show no resulting deterioration in the inner insulation. This effect is illustrated by the following experiments. In a single-conductor, rubber-insulated cable, Figure 29, the conductor was No. 24 AWG solid, having a diameter of 20.1 mils, and the outside diameter of the in-sulation was 375 mils. This cable was tested for breakdown and failed at a voltage of 39,940 volts.
Figure 4-29
The voltage stress at the surface of the conductor, calculated from (10) on page 9 in (1) is as follows:
1.20/375log05.10940,39434.0
10
xE =
65.18log05.10300,17
10
=
milpervoltsx
355,1271.105.10
300,17==
The normal breakdown stress for this rubber was approximately 400 volts per mil. Thus, the stress in the rubber at the surface of the conductor was 3.4 times the normal breakdown stress. The stress at a radius of 25 mils:
milpervoltsxxE 545
271.125940,39434.0
==
Discussion ot the Detrioration of Insulation and it’s Detection
72A-1974-01 Rev. B 2/05 2-115
Hence, the entire insulation within a radius of 25 mils was stressed well above the breakdown stress of the insulation; the stress at the surface of the conductor being 3.4 times the normal breakdown value. Most careful microscopic examinations failed to
reveal any physical injury or electrical deterioration whatsoever in this highly-stressed insulation. Also, separate electrical tests conducted on such overstressed insulation failed to reveal any weakening in its dielectric strength. These effects have been confirmed by others, (Bibliography (16), an extended discussion of which can be found in Bibliography (17)). For example, the following is a quotation: "In 1922, the ballast theory, although not known by that name, was formulated with additional experimental backing by K. W. Wagner, who expressed it as follows (17). According to the so-called maximum strength theory, an insulating material exposed to a non-uniform electrical field should rupture as soon as the field strength has passed a certain limit anywhere within the dielectric. But this conclusion has proved to contradict experience in many cases. The dielectric is capable of withstanding overstraining without damage, supposing that the strained parts of the dielectric contained in the path of the current prevent the latter from increasing excessively. Rupture does not occur before the condition of the whole path of the current has become unstable. " In support of this theory, Wagner cited the following experiment: "An impregnated paper-insulated cable was subjected for a certain length of time to a stress far in excess of the limit as estimated from tests on flat samples. Then the paper insulation was unwound until the supposedly overstressed part was reached. What remained of the cable section was then provided with a metal cylinder and subjected to an electrical tension. The test showed it to be perfectly intact and it ruptured only at the normal limit." All the foregoing further confirms the statement by Steinmetz, which has already been emphasized, that in addition to high electric stress, energy also is required to produce an electric breakdown. Thus, the parts of the dielectric, acting as "ballast", prevent the flow of energy to the overstressed inner layers of the insulation, such energy being necessary for dielectric breakdown. Many other research workers have made extended investigations of insulation, which has been subjected to extra-high electrical stresses that are many times the breakdown stress; yet, because of the series ballast, they did not break down. So far as is known in these investigations, no physical or electrical change in the highly overstressed insulation was detected. This effect still remains one of the unsolved mysteries in the field of dielectrics. The situation is summarized by A. Gemant: "A certain field intensity is evidently a necessary condition for a breakdown; however, not a sufficient one. " On page 2-204 the method of measuring the electrical characteristics of ionized air was described briefly. A slab of glass in series with the air gap stabilized the current at each point at which a measurement was made (also see Figure 6). Thus, the glass acted as series "ballast. " With reference to Figure 21, which shows the arrangement by which the dielectric strength of samples of polyethylene were compared, it is stated that "The relatively high series capacitive reactance between the sample and the grounded aluminum foil limited the current to low values...... " It is clear that this series reactance, consisting of the air path above the sample together with the plate glass, also acted as "ballast" to limit the current to the sample; and thus prevented its complete breakdown.
Discussion ot the Detrioration of Insulation and it’s Detection
72A-1974-01 Rev. B 2/05 2-116
4.5 Summary In this paper, an attempt has been made to analyze briefly some of the prevalent mech-anisms by which electric breakdowns occur in the three types of dielectrics: gases, liquids and solid dielectrics. These mechanisms are summarized as follows: Gases Ionization by collision is initiated by the few free electrons always present in a gas, followed by an electron avalanche; the voltage across the ionized space reaches a maximum value; and then diminishes as the discharge finally becomes a large-current arc. Paschen's Law states that the sparking potential is a function of the mass of gas between electrodes. Ionized voids within insulation produce tree designs, accompanied by carbonization and chemical degradation. Liquids In high-purity oils, the initial carriers are the few ions and free electrons inherently- present. In good oils, additional carriers consist of impurities such as minute particles of solid matter and moisture. At high voltage ionization by collision develops, followed by electron avalanches, pilot sparks, high-voltage streamers, "corona and discharges in liquids," and then breakdown. The breakdown voltage is known as the spark over, or the critical voltage. Askarels are non-flammable insulating liquids haying a higher dielectric constant than mineral oils. There is the objection that they have greater solvent action on the usual insulating materials than mineral oils. Solid Dielectrics The mechanisms of breakdown are as follows: Internal ionization, in which the insulation is destroyed internally (usually slowly) by ionization discharges within internal voids. Intrinsic Electric Breakdown in which high electrical stresses ultimately detaches outer electrons from the atoms, these becoming charge-carriers. This is known as "internal field emission." At the "critical current density" there is a sudden increase in field emission, which develops into an avalanche-type of electron emission and finally results in a high-current arc discharge and breakdown. Thermal Breakdown (Piezoelectric Theory) occurs when a small non-homogeneous element of the insulation has a resistively lower than the remainder of the insulation. The increased localized current is enhanced by the high negative temperature coefficient of resistance, and low thermal conductivity. The heating energy develops faster than it can be conducted away and "thermal runaway" takes place, the insulation breaking down due to local high thermal degradation. Needle-Point Theory and Tree Designs The needle-point theory assumes that a small impurity causes a local concentration of electric stress which at first produces a very localized filamentary conducting path that penetrates the insulation like a needle-point. The theory is substantiated by the researches of Kitchin and Pratt who took photomicrographs of the filamentary paths and ''tree designs'' resulting from needlepoints inserted into polyethylene insulation.
Discussion ot the Detrioration of Insulation and it’s Detection
72A-1974-01 Rev. B 2/05 2-117
Lightning Impulse Punctures A lightning wave traveling at high speed through a cable produces a series of small filamentary punctures in the wall of insulation but the wave passes by so quickly that there is not time to develop the energy necessary to develop a power fault. The slow accumulation of moisture, or the chemical degradation in the filament due to corona discharges, makes it possible for the power voltage to ultimately produce a breakdown. Concurrently, the concentrated corona discharge at the terminus o£ the filaments develops ''drill holes'' in the cable conductor. Ballast Theory Because of the coaxial cylindrical geometry of single conductor cables, it is possible to subject the insulation near the conductor to electric stresses several times the normal breakdown value. However, because the outer layers of the insulation, which act as series impedance, limit the enemy, these overstressed inner layers do not show any indications of breakdown or of deterioration.
4.6 Conclusion There are many other theories relative to the mechanism of the electric breakdown of insulation, such as the instability of its crystalline structure under electric stress, mechanical fatigue, progressive breakdown, and several others involving changes in atomic structure. However, the theories, which have been presented, have been subjected to much study and research and are generally accepted as the important ones. Further and more detailed analysis of these theories may be found in the following Bibliography references, as well as those, which are beyond the scope of this treatise.
Discussion ot the Detrioration of Insulation and it’s Detection
72A-1974-01 Rev. B 2/05 2-118
BIBLIOGRAPHY
1. Dielectric Theory & Practice – Professor C. L. Dawes and E. H. Povey Presented at the 196Z Doble Conference
2. Various Types and Applications of Electrical Insulation – C. L. Dawes and E. H. Povey Presented at the 1963 Doble Conference
3. Dielectric Phenomena (a book) – S. Whitehead D. VanNostrand Company 4. Ions, Electrons, and Ionizing Radiations (a book) – J. A. Crowthers Longmans,
Green & Company 5. Gaseous Conductors (a book) – J. D. Cobine McGraw-Hill Book Company 6. Characteristics of Restricted Ionization and its Relation to Voids in
Insulating Materials – C. L. Dawes & P. H, Humphries Trans. AIEE, 1940 (Vol. 59), Page 701
7. Dielectric Phenomena II, Electrical Discharges in Liquids (a book) – S. Whitehead D. VanNostrand Company
8. Dielectric Phenomena (a book) – F. W. Peek McGraw-Hill Book Company
9. Propagation Mechanism of Impulse Corona and Breakdown in Oil, T. W. Liao and J. G. Anderson, Trans. AIEE, 1953 (Vol. 72, Pt. I), Page 641
10. The Physical Nature of the Electrical Breakdown of Solid Dielectrics - K. W. Wagner Trans. AIEE, 1922 (Vol. XLI), Page 288
11. The Mechanism of Breakdown of Dielectrics - P. L. Hoover Trans. AIEE, 1926 (Vol. XLV), Page 983
12. Insulation of Electric Machines (a book) – Turner & Hobart Whittaker & Company
13. Potential Stresses in Dielectrics – Harold S. Osborne Trans. AIEE, 1910 (Vol. XXIX), Page 1553
14. Treeing in Polyethelene as a Prelude to Breakdown – D. W. Kitchin & O. S. Pratt Trans. AIEE. 1958 (Vol. 77), Page 180
15. An Accelerated Screening Test for Polyethelene High-Voltage Insulation D. W. Kitchin & O. S. Pratt Trans. AIEE, 1962 (Vol. 81), Page 112
16. Potential Gradient in Cables – W. I. Middleton, C. L. Dawes, E. W. Davis Trans. AIEE, 1922 (Vol. XLI), Page 570
17. Electric Stresses in Cables – W. A. Del Mar Trans. AIEE, 1962 (Vol. 81), Page 121
18. Insulating Materials for Design & Engineering Practice (a book) – Frank M, Clark, John Wiley & Sons

Discussion ot the Detrioration of Insulation and it’s Detection
72A-1974-01 Rev. B 2/05 2-119
19. Dielectric Materials and Applications (a book) – Arthur von Hippel Technology Press of M. I. T. and John Wiley & Sons
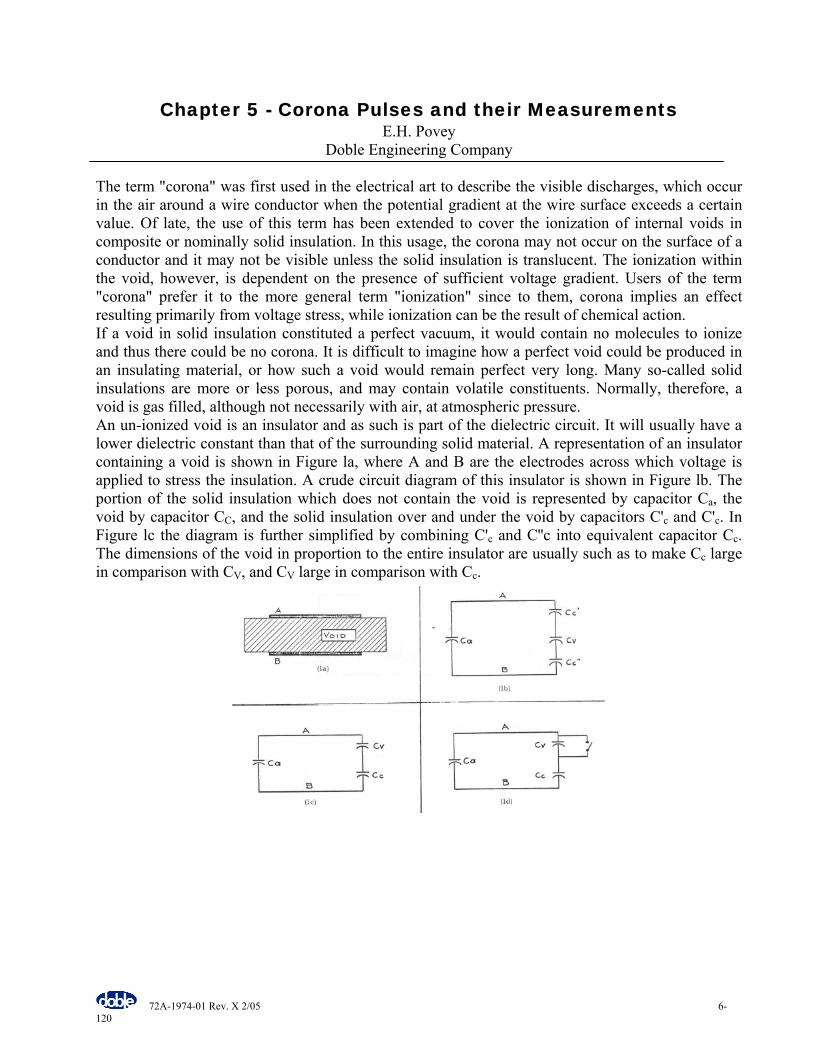
72A-1974-01 Rev. X 2/05 6-120
Chapter 5 - Corona Pulses and their Measurements E.H. Povey
Doble Engineering Company The term "corona" was first used in the electrical art to describe the visible discharges, which occur in the air around a wire conductor when the potential gradient at the wire surface exceeds a certain value. Of late, the use of this term has been extended to cover the ionization of internal voids in composite or nominally solid insulation. In this usage, the corona may not occur on the surface of a conductor and it may not be visible unless the solid insulation is translucent. The ionization within the void, however, is dependent on the presence of sufficient voltage gradient. Users of the term "corona" prefer it to the more general term "ionization" since to them, corona implies an effect resulting primarily from voltage stress, while ionization can be the result of chemical action. If a void in solid insulation constituted a perfect vacuum, it would contain no molecules to ionize and thus there could be no corona. It is difficult to imagine how a perfect void could be produced in an insulating material, or how such a void would remain perfect very long. Many so-called solid insulations are more or less porous, and may contain volatile constituents. Normally, therefore, a void is gas filled, although not necessarily with air, at atmospheric pressure. An un-ionized void is an insulator and as such is part of the dielectric circuit. It will usually have a lower dielectric constant than that of the surrounding solid material. A representation of an insulator containing a void is shown in Figure la, where A and B are the electrodes across which voltage is applied to stress the insulation. A crude circuit diagram of this insulator is shown in Figure lb. The portion of the solid insulation which does not contain the void is represented by capacitor Ca, the void by capacitor CC, and the solid insulation over and under the void by capacitors C'c and C'c. In Figure lc the diagram is further simplified by combining C'c and C''c into equivalent capacitor Cc. The dimensions of the void in proportion to the entire insulator are usually such as to make Cc large in comparison with CV, and CV large in comparison with Cc.
Effects of Corona and Ionization on Dielectrics
72A-1974-01 Rev. X 2/05 6-121
When voltage is applied to the terminals of the insulator a portion of the voltage appears across the void. Because of the lower dielectric constant of the void, the stress is higher in the void than in the adjoining solid insulation. Gas in general has a lower dielectric strength than solid insulations. The void, therefore, may break down at an applied voltage well under the normal operating voltage of the insulator. Breakdown of the gas in the void is due to a cumulative ionization process, commonly called an electron avalanche. A free electron loosed from its parent molecule by thermal agitation or cosmic radiation is forced to move by the electric field. Aided by the comparatively long distances between molecules in a gas, the electron acquires sufficient energy to free other electrons on impact with a molecule. The process continues with more and more electrons involved, so that the entire void may be ionized in a fraction of a microsecond. The ionized void is conducting and thus will not support a potential difference between its surfaces. In the diagram of Figure ld, the ionized state may be represented by closing the switch which short-circuits the void capacitance. Once there is no potential gradient within the void, the gas proceeds to de-ionize. The free electrons for the most part lose their excess energy on impact with the solid insulation at the void surfaces, and are recaptured by the gas molecules. De-ionization probably proceeds as an exponential function of time. Observations of corona produced by high-frequency voltages suggest that de-ionization is nearly complete in a microsecond. Small but persistent after-effects such as the heating of the void surfaces by electron bombardment probably account for the fact that once sufficient alternating voltage is applied to initiate corona, the voltage must be reduced by an appreciable amount before the corona becomes extinct. The model circuit of Figure 1 is useful in approximating the actual quantities involved in a void discharge. It will be observed that except for the switch, the only elements in the circuit are capacitors, which suggests a simple review of capacitor circuits at this point. When capacitors are connected in parallel, the resulting capacitance is the sum of the individual capacitances, or
+++= 321 CCCCp (1)
When capacitors are series, the inverse of the resulting capacitance is the sum of the inverse of each individual capacitor.
+++= 321 /1/1/1/1 CCCCs (2)
For only two capacitances in series, the relation simplifies to
21
21
CCCC
Cs += (3)
And a few simple calculations will show that the resulting capacitance Cs is always smaller than either of the individual capacitances C, or C2. When a voltage difference is applied across two capacitors in series, the voltage divides in inverse proportion to the two capacitances. That is
1221 // CCVV = (4)
Effects of Corona and Ionization on Dielectrics
72A-1974-01 Rev. X 2/05 6-122
From which
21
21 CC
CVV+
= (5)
Where V is applied voltage, i.e. V = V1 + V2 When these relations are applied to the circuit of Figure Id, the normal capacitance of the specimen is found to be
cv
cvan CC
CCCC+
+= (6)
During ionization (while the switch is closed), the capacitance of the specimen increases to
Ci = Ca = Cc (7) From the effect on the specimen capacitance caused by the void ionization, it is possible to approximate by calculation what happens to the voltage at the terminals of the specimen during ionization. The specimen is energized by a 60-cycle voltage source, but in terms of the time required for void ionization, the voltage is changing very slowly. Then the specimen reaches the value required initiating ionization in the void, the subsequent discharge is so rapid that the voltage source, because of its impedance, cannot control the specimen voltage for this brief period. The source can therefore be neglected in the calculations, which start with the specimen charged up to the ionization voltage V. The charge stored in a capacitor is the product of voltage and capacitance, so that the charge in the specimen at the start of ionization is
Q = VCn (8) The occurrence of ionization (the closing of the switch in Figure Id) does not provide a path for a transfer of charge from one terminal to another, therefore, the terminal charge cannot change. The charge equation during ionization becomes
Q = (V - ∆V) Ci (9) Where ∆ V is a voltage drop at the specimen terminals. Since capacitance Ci in (9) is greater than capacitance Cn in (8), the voltage drop ∆ V is necessary to maintain the equality of charge Q in (8) and (9). The magnitude of ∆ V may be calculated from (6), (7), (8), and (9).
( )( )cacv
c
CCCCCVV
++=∆
2
(10)
It will be seen, therefore, that the ionization of a void in a specimen of insulation results in a sudden voltage drop at the specimen terminals, providing the voltage source is effectively prevented from maintaining the applied voltage. The provision is met practically by putting an inductance (a radio-frequency coil) or resistance in series with the supply lead.
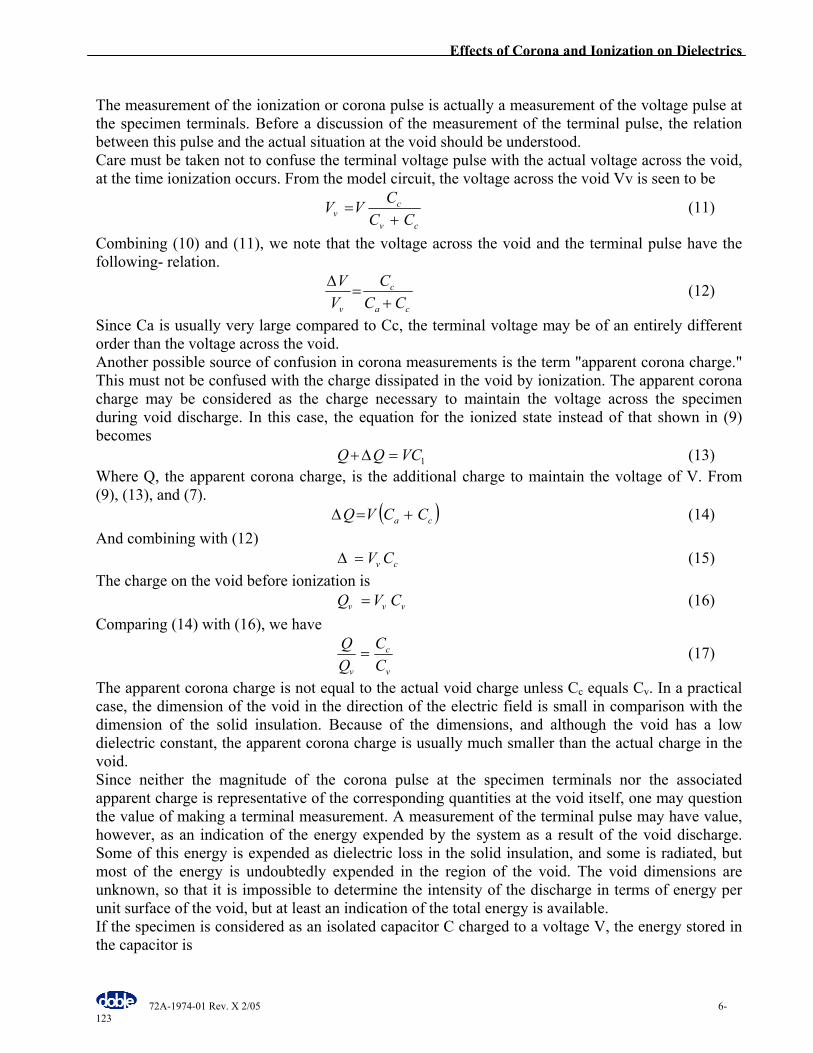
Effects of Corona and Ionization on Dielectrics
72A-1974-01 Rev. X 2/05 6-123
The measurement of the ionization or corona pulse is actually a measurement of the voltage pulse at the specimen terminals. Before a discussion of the measurement of the terminal pulse, the relation between this pulse and the actual situation at the void should be understood. Care must be taken not to confuse the terminal voltage pulse with the actual voltage across the void, at the time ionization occurs. From the model circuit, the voltage across the void Vv is seen to be
cv
cv CC
CVV+
= (11)
Combining (10) and (11), we note that the voltage across the void and the terminal pulse have the following- relation.
ca
c
v CCC
VV
+=
∆ (12)
Since Ca is usually very large compared to Cc, the terminal voltage may be of an entirely different order than the voltage across the void. Another possible source of confusion in corona measurements is the term "apparent corona charge." This must not be confused with the charge dissipated in the void by ionization. The apparent corona charge may be considered as the charge necessary to maintain the voltage across the specimen during void discharge. In this case, the equation for the ionized state instead of that shown in (9) becomes
1VCQQ =∆+ (13) Where Q, the apparent corona charge, is the additional charge to maintain the voltage of V. From (9), (13), and (7).
( )ca CCVQ +=∆ (14) And combining with (12)
cv CV=∆ (15) The charge on the void before ionization is
vvv CVQ = (16) Comparing (14) with (16), we have
v
c
v CC
= (17)
The apparent corona charge is not equal to the actual void charge unless Cc equals Cv. In a practical case, the dimension of the void in the direction of the electric field is small in comparison with the dimension of the solid insulation. Because of the dimensions, and although the void has a low dielectric constant, the apparent corona charge is usually much smaller than the actual charge in the void. Since neither the magnitude of the corona pulse at the specimen terminals nor the associated apparent charge is representative of the corresponding quantities at the void itself, one may question the value of making a terminal measurement. A measurement of the terminal pulse may have value, however, as an indication of the energy expended by the system as a result of the void discharge. Some of this energy is expended as dielectric loss in the solid insulation, and some is radiated, but most of the energy is undoubtedly expended in the region of the void. The void dimensions are unknown, so that it is impossible to determine the intensity of the discharge in terms of energy per unit surface of the void, but at least an indication of the total energy is available. If the specimen is considered as an isolated capacitor C charged to a voltage V, the energy stored in the capacitor is
Effects of Corona and Ionization on Dielectrics
72A-1974-01 Rev. X 2/05 6-124
VQCVJ 2/12/1 2 == (18) When the void ionizes and there is no net loss of charge, the charge is constant and any change in energy must be proportional to the change in voltage. From (18) the proportion is shown to be
VCQVJ 2/12/1 ==
∆∆ (19)
A rearrangement of (10) shows that for a discharge of given energy, the magnitude of the voltage pulse at the specimen is inversely proportional to the specimen capacitance. Therefore, when corona pulses from specimens of differing capacitances are being compared, the pulse magnitudes must be weighted in proportion to the specimen capacitance. The dimensional product of voltage and capacitance is charge. If a charge Q is defined as being equal to C ∆ V, it can be substituted into equation 19, so that
QVJ ∆=∆ 2/1 (20) ∆Q is called the apparent corona charge. Note that this definition of corona charge (∆Q = C∆V) is different from that used in arriving at expression (13) where the capacitance at ionization was used rather than the capacitance before ionization. Practically, the difference may be ignored. In practice the most valuable use of apparent corona charge is for comparing corona pulses obtained on various lengths of identically made cable. For specific insulating units (insulators or pieces of apparatus) it is usual to establish a criterion for each size and type. Since comparisons are then made on units of the same capacitance, they can be made in terms of pulse voltage. Note that in equation (9) and (10) and (11), the terminal voltage is a factor in the energy expended. This factor is usually ignored when charge is considered as an indicator of energy loss. Perhaps it is assumed that in similar equipment corona will occur at approximately the same voltage, and may thus be factored out in a comparison or results. The preceding portion of this paper has discussed how a void discharge causes a voltage pulse at the specimen terminals, and how the terminal pulse is related to the pulse at the void. The model circuit used in the discussion is a simplification of conditions as they actually exist, but in general the conclusions reached are believed to be valid. The remainder of the paper will deal with circuits used to measure terminal pulses.
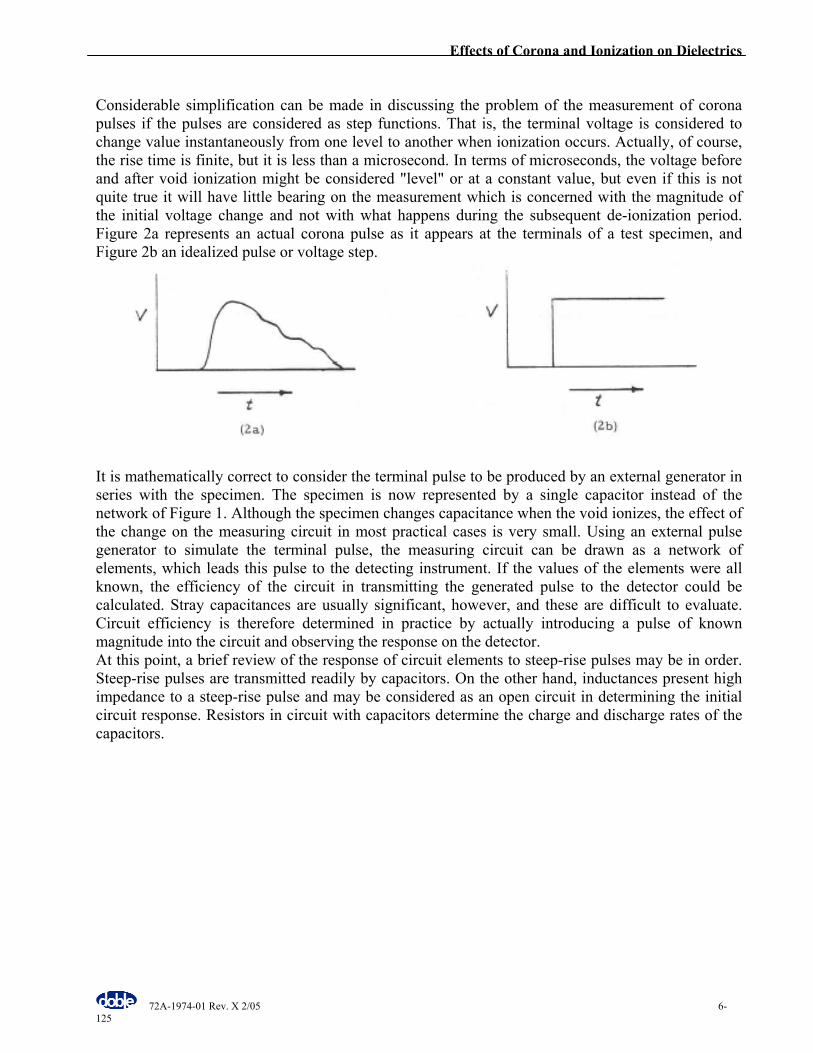
Effects of Corona and Ionization on Dielectrics
72A-1974-01 Rev. X 2/05 6-125
Considerable simplification can be made in discussing the problem of the measurement of corona pulses if the pulses are considered as step functions. That is, the terminal voltage is considered to change value instantaneously from one level to another when ionization occurs. Actually, of course, the rise time is finite, but it is less than a microsecond. In terms of microseconds, the voltage before and after void ionization might be considered "level" or at a constant value, but even if this is not quite true it will have little bearing on the measurement which is concerned with the magnitude of the initial voltage change and not with what happens during the subsequent de-ionization period. Figure 2a represents an actual corona pulse as it appears at the terminals of a test specimen, and Figure 2b an idealized pulse or voltage step.
It is mathematically correct to consider the terminal pulse to be produced by an external generator in series with the specimen. The specimen is now represented by a single capacitor instead of the network of Figure 1. Although the specimen changes capacitance when the void ionizes, the effect of the change on the measuring circuit in most practical cases is very small. Using an external pulse generator to simulate the terminal pulse, the measuring circuit can be drawn as a network of elements, which leads this pulse to the detecting instrument. If the values of the elements were all known, the efficiency of the circuit in transmitting the generated pulse to the detector could be calculated. Stray capacitances are usually significant, however, and these are difficult to evaluate. Circuit efficiency is therefore determined in practice by actually introducing a pulse of known magnitude into the circuit and observing the response on the detector. At this point, a brief review of the response of circuit elements to steep-rise pulses may be in order. Steep-rise pulses are transmitted readily by capacitors. On the other hand, inductances present high impedance to a steep-rise pulse and may be considered as an open circuit in determining the initial circuit response. Resistors in circuit with capacitors determine the charge and discharge rates of the capacitors.
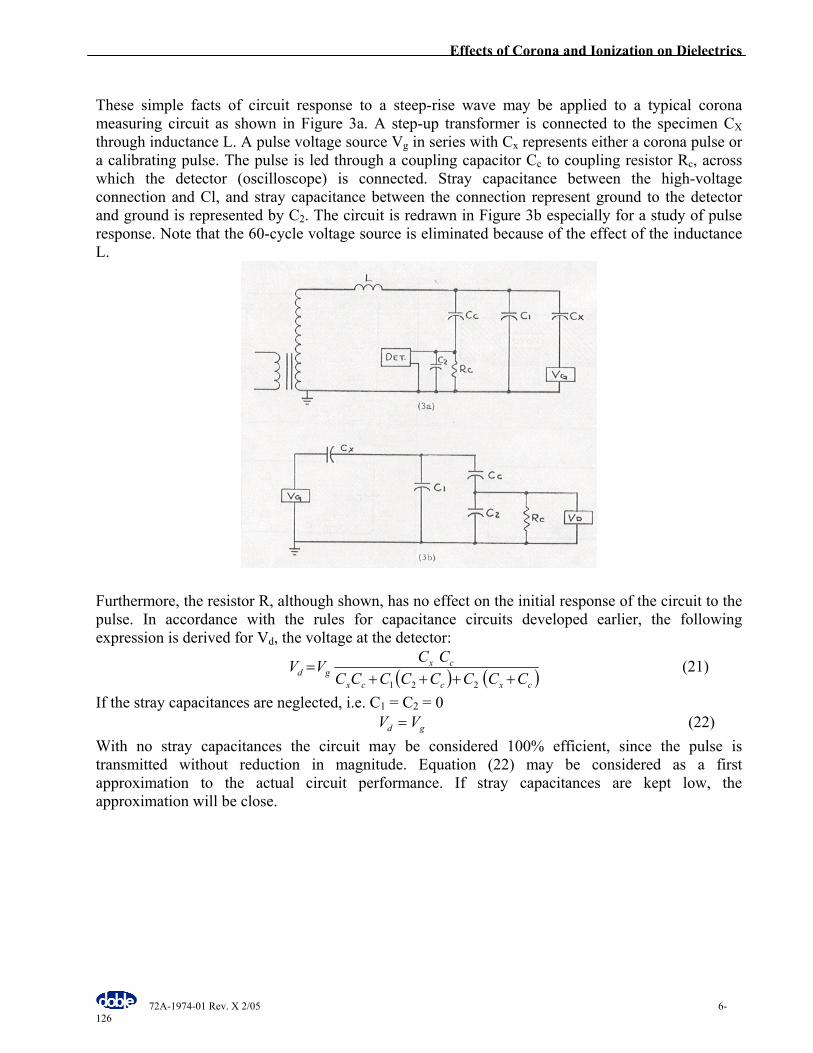
Effects of Corona and Ionization on Dielectrics
72A-1974-01 Rev. X 2/05 6-126
These simple facts of circuit response to a steep-rise wave may be applied to a typical corona measuring circuit as shown in Figure 3a. A step-up transformer is connected to the specimen CX through inductance L. A pulse voltage source Vg in series with Cx represents either a corona pulse or a calibrating pulse. The pulse is led through a coupling capacitor Cc to coupling resistor Rc, across which the detector (oscilloscope) is connected. Stray capacitance between the high-voltage connection and Cl, and stray capacitance between the connection represent ground to the detector and ground is represented by C2. The circuit is redrawn in Figure 3b especially for a study of pulse response. Note that the 60-cycle voltage source is eliminated because of the effect of the inductance L.
Furthermore, the resistor R, although shown, has no effect on the initial response of the circuit to the pulse. In accordance with the rules for capacitance circuits developed earlier, the following expression is derived for Vd, the voltage at the detector:
( ) ( )cxccx
cxgd CCCCCCCC
CCVV++++
=221
(21)
If the stray capacitances are neglected, i.e. C1 = C2 = 0 gd VV = (22)
With no stray capacitances the circuit may be considered 100% efficient, since the pulse is transmitted without reduction in magnitude. Equation (22) may be considered as a first approximation to the actual circuit performance. If stray capacitances are kept low, the approximation will be close.
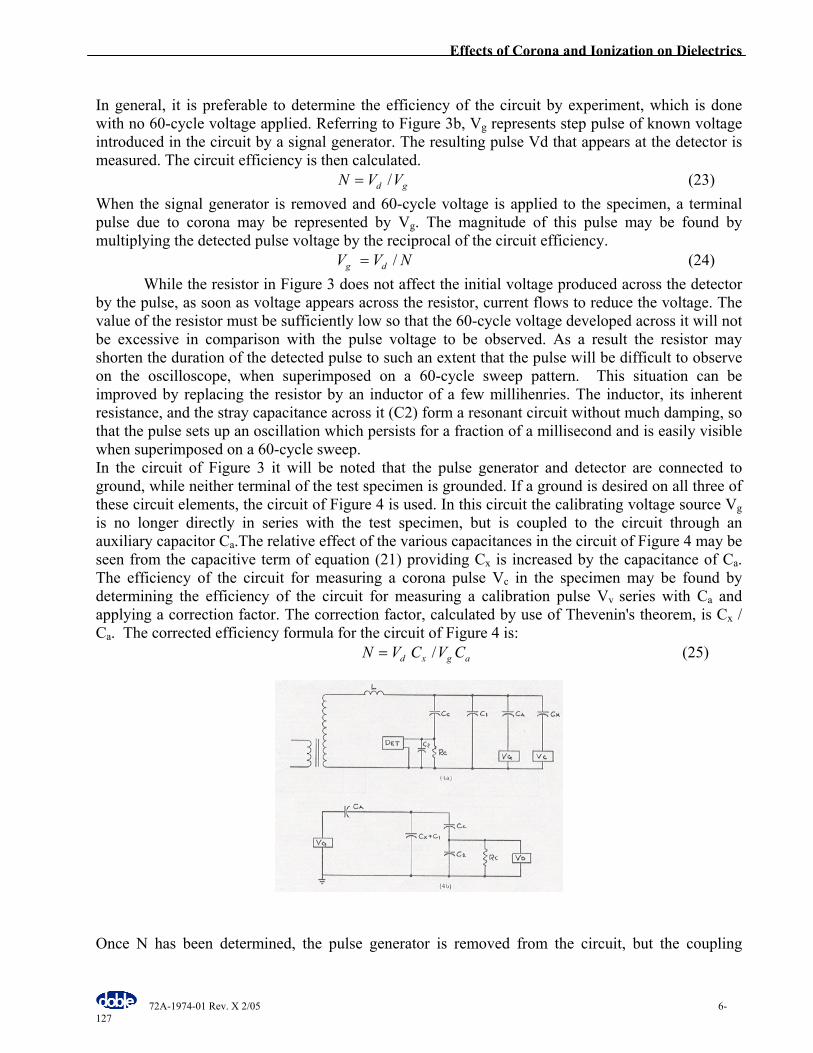
Effects of Corona and Ionization on Dielectrics
72A-1974-01 Rev. X 2/05 6-127
In general, it is preferable to determine the efficiency of the circuit by experiment, which is done with no 60-cycle voltage applied. Referring to Figure 3b, Vg represents step pulse of known voltage introduced in the circuit by a signal generator. The resulting pulse Vd that appears at the detector is measured. The circuit efficiency is then calculated.
gd VVN /= (23) When the signal generator is removed and 60-cycle voltage is applied to the specimen, a terminal pulse due to corona may be represented by Vg. The magnitude of this pulse may be found by multiplying the detected pulse voltage by the reciprocal of the circuit efficiency.
NVV dg /= (24) While the resistor in Figure 3 does not affect the initial voltage produced across the detector by the pulse, as soon as voltage appears across the resistor, current flows to reduce the voltage. The value of the resistor must be sufficiently low so that the 60-cycle voltage developed across it will not be excessive in comparison with the pulse voltage to be observed. As a result the resistor may shorten the duration of the detected pulse to such an extent that the pulse will be difficult to observe on the oscilloscope, when superimposed on a 60-cycle sweep pattern. This situation can be improved by replacing the resistor by an inductor of a few millihenries. The inductor, its inherent resistance, and the stray capacitance across it (C2) form a resonant circuit without much damping, so that the pulse sets up an oscillation which persists for a fraction of a millisecond and is easily visible when superimposed on a 60-cycle sweep. In the circuit of Figure 3 it will be noted that the pulse generator and detector are connected to ground, while neither terminal of the test specimen is grounded. If a ground is desired on all three of these circuit elements, the circuit of Figure 4 is used. In this circuit the calibrating voltage source Vg is no longer directly in series with the test specimen, but is coupled to the circuit through an auxiliary capacitor Ca.The relative effect of the various capacitances in the circuit of Figure 4 may be seen from the capacitive term of equation (21) providing Cx is increased by the capacitance of Ca. The efficiency of the circuit for measuring a corona pulse Vc in the specimen may be found by determining the efficiency of the circuit for measuring a calibration pulse Vv series with Ca and applying a correction factor. The correction factor, calculated by use of Thevenin's theorem, is Cx / Ca. The corrected efficiency formula for the circuit of Figure 4 is:
agxd CVCVN /= (25)
Once N has been determined, the pulse generator is removed from the circuit, but the coupling
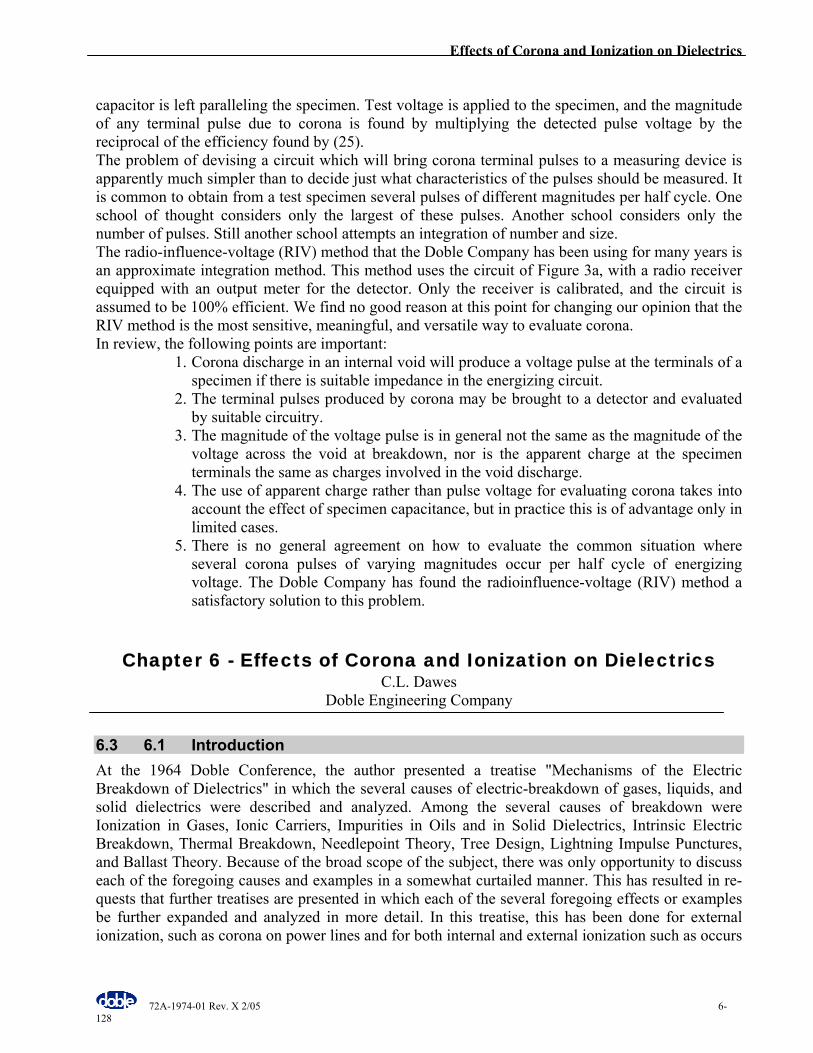
Effects of Corona and Ionization on Dielectrics
72A-1974-01 Rev. X 2/05 6-128
capacitor is left paralleling the specimen. Test voltage is applied to the specimen, and the magnitude of any terminal pulse due to corona is found by multiplying the detected pulse voltage by the reciprocal of the efficiency found by (25). The problem of devising a circuit which will bring corona terminal pulses to a measuring device is apparently much simpler than to decide just what characteristics of the pulses should be measured. It is common to obtain from a test specimen several pulses of different magnitudes per half cycle. One school of thought considers only the largest of these pulses. Another school considers only the number of pulses. Still another school attempts an integration of number and size. The radio-influence-voltage (RIV) method that the Doble Company has been using for many years is an approximate integration method. This method uses the circuit of Figure 3a, with a radio receiver equipped with an output meter for the detector. Only the receiver is calibrated, and the circuit is assumed to be 100% efficient. We find no good reason at this point for changing our opinion that the RIV method is the most sensitive, meaningful, and versatile way to evaluate corona. In review, the following points are important:
1. Corona discharge in an internal void will produce a voltage pulse at the terminals of a specimen if there is suitable impedance in the energizing circuit.
2. The terminal pulses produced by corona may be brought to a detector and evaluated by suitable circuitry.
3. The magnitude of the voltage pulse is in general not the same as the magnitude of the voltage across the void at breakdown, nor is the apparent charge at the specimen terminals the same as charges involved in the void discharge.
4. The use of apparent charge rather than pulse voltage for evaluating corona takes into account the effect of specimen capacitance, but in practice this is of advantage only in limited cases.
5. There is no general agreement on how to evaluate the common situation where several corona pulses of varying magnitudes occur per half cycle of energizing voltage. The Doble Company has found the radioinfluence-voltage (RIV) method a satisfactory solution to this problem.
Chapter 6 - Effects of Corona and Ionization on Dielectrics C.L. Dawes
Doble Engineering Company
6.3 6.1 Introduction At the 1964 Doble Conference, the author presented a treatise "Mechanisms of the Electric Breakdown of Dielectrics" in which the several causes of electric-breakdown of gases, liquids, and solid dielectrics were described and analyzed. Among the several causes of breakdown were Ionization in Gases, Ionic Carriers, Impurities in Oils and in Solid Dielectrics, Intrinsic Electric Breakdown, Thermal Breakdown, Needlepoint Theory, Tree Design, Lightning Impulse Punctures, and Ballast Theory. Because of the broad scope of the subject, there was only opportunity to discuss each of the foregoing causes and examples in a somewhat curtailed manner. This has resulted in re-quests that further treatises are presented in which each of the several foregoing effects or examples be further expanded and analyzed in more detail. In this treatise, this has been done for external ionization, such as corona on power lines and for both internal and external ionization such as occurs
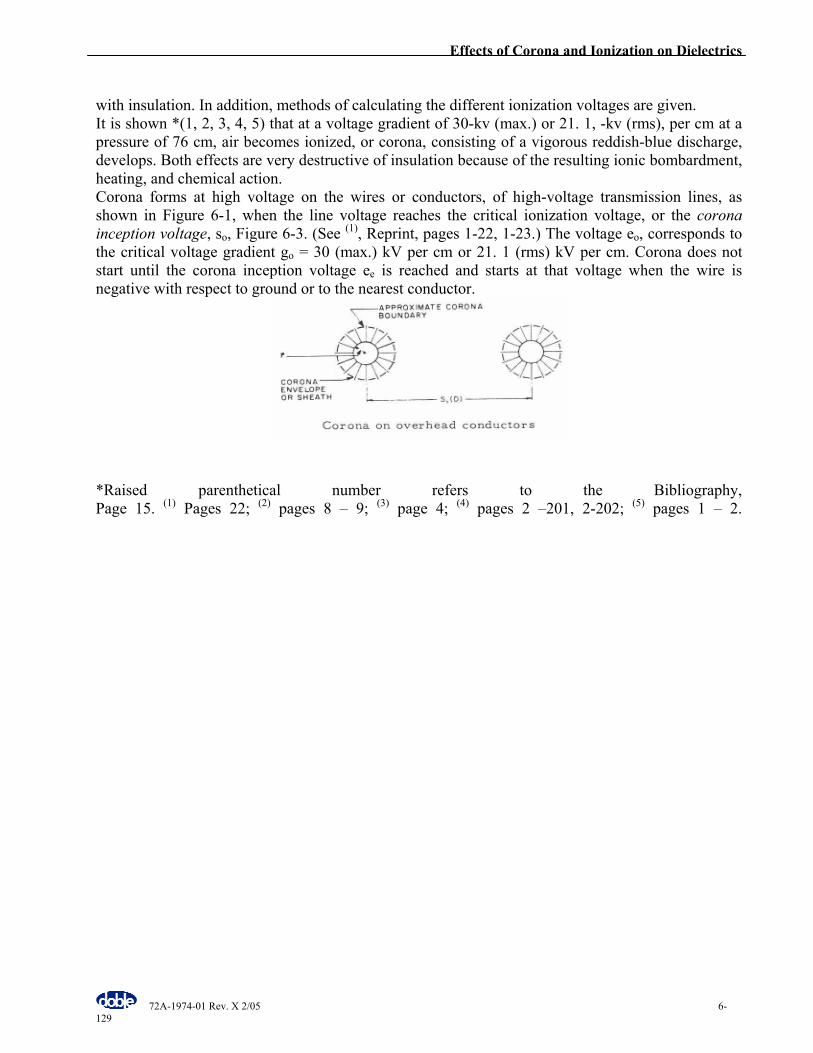
Effects of Corona and Ionization on Dielectrics
72A-1974-01 Rev. X 2/05 6-129
with insulation. In addition, methods of calculating the different ionization voltages are given. It is shown *(1, 2, 3, 4, 5) that at a voltage gradient of 30-kv (max.) or 21. 1, -kv (rms), per cm at a pressure of 76 cm, air becomes ionized, or corona, consisting of a vigorous reddish-blue discharge, develops. Both effects are very destructive of insulation because of the resulting ionic bombardment, heating, and chemical action. Corona forms at high voltage on the wires or conductors, of high-voltage transmission lines, as shown in Figure 6-1, when the line voltage reaches the critical ionization voltage, or the corona inception voltage, so, Figure 6-3. (See (1), Reprint, pages 1-22, 1-23.) The voltage eo, corresponds to the critical voltage gradient go = 30 (max.) kV per cm or 21. 1 (rms) kV per cm. Corona does not start until the corona inception voltage ee is reached and starts at that voltage when the wire is negative with respect to ground or to the nearest conductor.
*Raised parenthetical number refers to the Bibliography, Page 15. (1) Pages 22; (2) pages 8 – 9; (3) page 4; (4) pages 2 –201, 2-202; (5) pages 1 – 2.
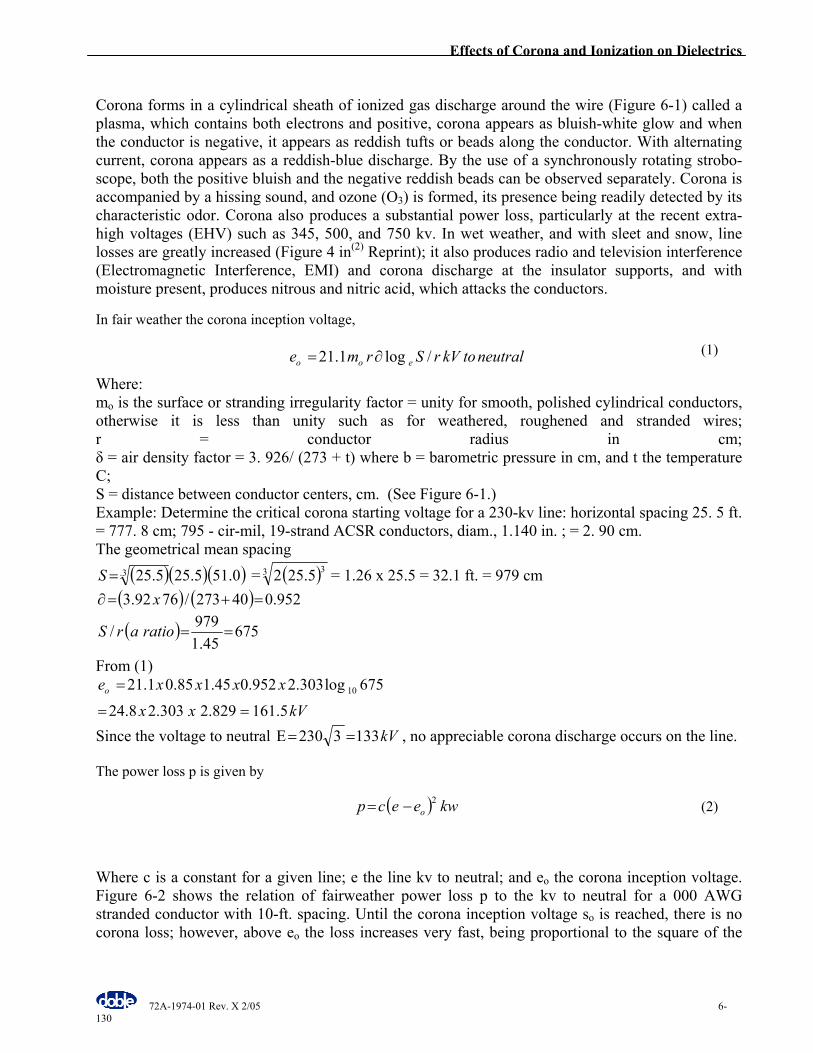
Effects of Corona and Ionization on Dielectrics
72A-1974-01 Rev. X 2/05 6-130
Corona forms in a cylindrical sheath of ionized gas discharge around the wire (Figure 6-1) called a plasma, which contains both electrons and positive, corona appears as bluish-white glow and when the conductor is negative, it appears as reddish tufts or beads along the conductor. With alternating current, corona appears as a reddish-blue discharge. By the use of a synchronously rotating strobo-scope, both the positive bluish and the negative reddish beads can be observed separately. Corona is accompanied by a hissing sound, and ozone (O3) is formed, its presence being readily detected by its characteristic odor. Corona also produces a substantial power loss, particularly at the recent extra-high voltages (EHV) such as 345, 500, and 750 kv. In wet weather, and with sleet and snow, line losses are greatly increased (Figure 4 in(2) Reprint); it also produces radio and television interference (Electromagnetic Interference, EMI) and corona discharge at the insulator supports, and with moisture present, produces nitrous and nitric acid, which attacks the conductors.
In fair weather the corona inception voltage,
neutraltokVrSrme eoo /log1.21 ∂= (1)
Where: mo is the surface or stranding irregularity factor = unity for smooth, polished cylindrical conductors, otherwise it is less than unity such as for weathered, roughened and stranded wires; r = conductor radius in cm; δ = air density factor = 3. 926/ (273 + t) where b = barometric pressure in cm, and t the temperature C; S = distance between conductor centers, cm. (See Figure 6-1.) Example: Determine the critical corona starting voltage for a 230-kv line: horizontal spacing 25. 5 ft. = 777. 8 cm; 795 - cir-mil, 19-strand ACSR conductors, diam., 1.140 in. ; = 2. 90 cm. The geometrical mean spacing
( )( )( )0.515.255.253.=S = ( )3 35.252 = 1.26 x 25.5 = 32.1 ft. = 979 cm ( ) ( ) 952.040273/7692.3 =+=∂ x
( ) 67545.1
979/ ==ratioarS
From (1)
kVxx
xxxxeo
5.161829.2303.28.24
675log303.2952.045.185.01.21 10
==
=
Since the voltage to neutral kV1333230 ==Ε , no appreciable corona discharge occurs on the line.
The power loss p is given by
( ) kweecp o2−= (2)
Where c is a constant for a given line; e the line kv to neutral; and eo the corona inception voltage. Figure 6-2 shows the relation of fairweather power loss p to the kv to neutral for a 000 AWG stranded conductor with 10-ft. spacing. Until the corona inception voltage so is reached, there is no corona loss; however, above eo the loss increases very fast, being proportional to the square of the
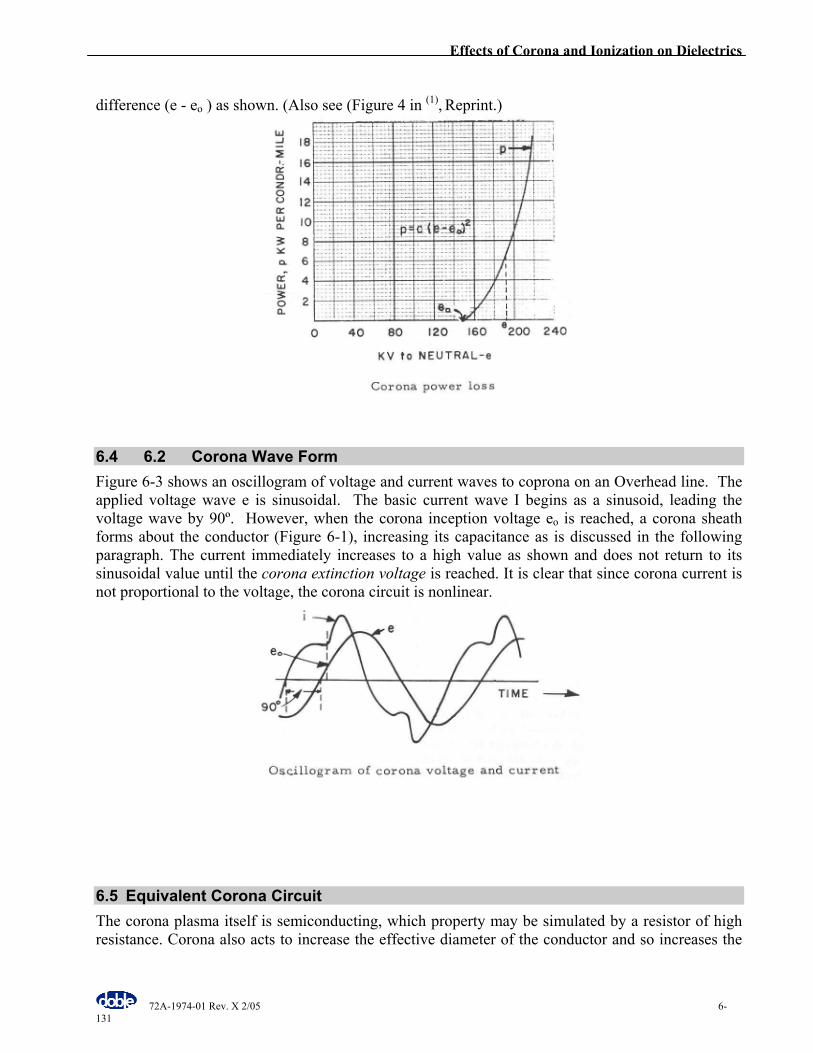
Effects of Corona and Ionization on Dielectrics
72A-1974-01 Rev. X 2/05 6-131
difference (e - eo ) as shown. (Also see (Figure 4 in (1), Reprint.)
6.4 6.2 Corona Wave Form Figure 6-3 shows an oscillogram of voltage and current waves to coprona on an Overhead line. The applied voltage wave e is sinusoidal. The basic current wave I begins as a sinusoid, leading the voltage wave by 90º. However, when the corona inception voltage eo is reached, a corona sheath forms about the conductor (Figure 6-1), increasing its capacitance as is discussed in the following paragraph. The current immediately increases to a high value as shown and does not return to its sinusoidal value until the corona extinction voltage is reached. It is clear that since corona current is not proportional to the voltage, the corona circuit is nonlinear.
6.5 Equivalent Corona Circuit The corona plasma itself is semiconducting, which property may be simulated by a resistor of high resistance. Corona also acts to increase the effective diameter of the conductor and so increases the
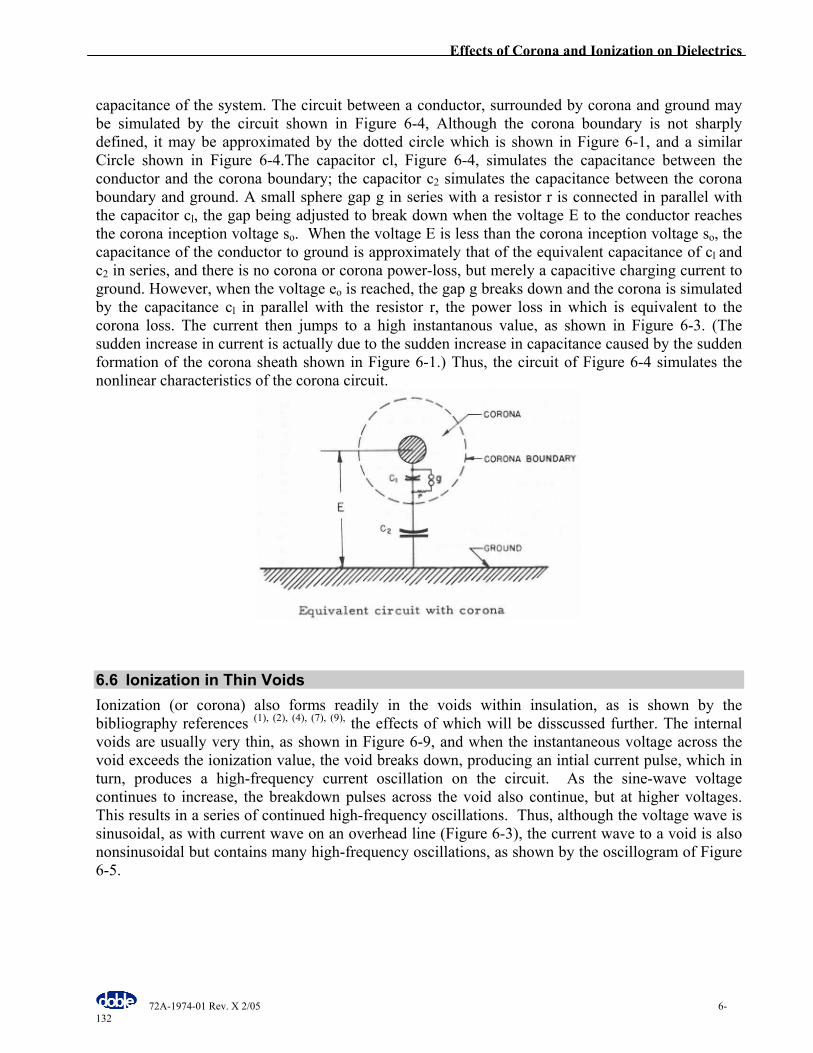
Effects of Corona and Ionization on Dielectrics
72A-1974-01 Rev. X 2/05 6-132
capacitance of the system. The circuit between a conductor, surrounded by corona and ground may be simulated by the circuit shown in Figure 6-4, Although the corona boundary is not sharply defined, it may be approximated by the dotted circle which is shown in Figure 6-1, and a similar Circle shown in Figure 6-4.The capacitor cl, Figure 6-4, simulates the capacitance between the conductor and the corona boundary; the capacitor c2 simulates the capacitance between the corona boundary and ground. A small sphere gap g in series with a resistor r is connected in parallel with the capacitor cl, the gap being adjusted to break down when the voltage E to the conductor reaches the corona inception voltage so. When the voltage E is less than the corona inception voltage so, the capacitance of the conductor to ground is approximately that of the equivalent capacitance of cl and c2 in series, and there is no corona or corona power-loss, but merely a capacitive charging current to ground. However, when the voltage eo is reached, the gap g breaks down and the corona is simulated by the capacitance cl in parallel with the resistor r, the power loss in which is equivalent to the corona loss. The current then jumps to a high instantanous value, as shown in Figure 6-3. (The sudden increase in current is actually due to the sudden increase in capacitance caused by the sudden formation of the corona sheath shown in Figure 6-1.) Thus, the circuit of Figure 6-4 simulates the nonlinear characteristics of the corona circuit.
6.6 Ionization in Thin Voids Ionization (or corona) also forms readily in the voids within insulation, as is shown by the bibliography references (1), (2), (4), (7), (9), the effects of which will be disscussed further. The internal voids are usually very thin, as shown in Figure 6-9, and when the instantaneous voltage across the void exceeds the ionization value, the void breaks down, producing an intial current pulse, which in turn, produces a high-frequency current oscillation on the circuit. As the sine-wave voltage continues to increase, the breakdown pulses across the void also continue, but at higher voltages. This results in a series of continued high-frequency oscillations. Thus, although the voltage wave is sinusoidal, as with current wave on an overhead line (Figure 6-3), the current wave to a void is also nonsinusoidal but contains many high-frequency oscillations, as shown by the oscillogram of Figure 6-5.
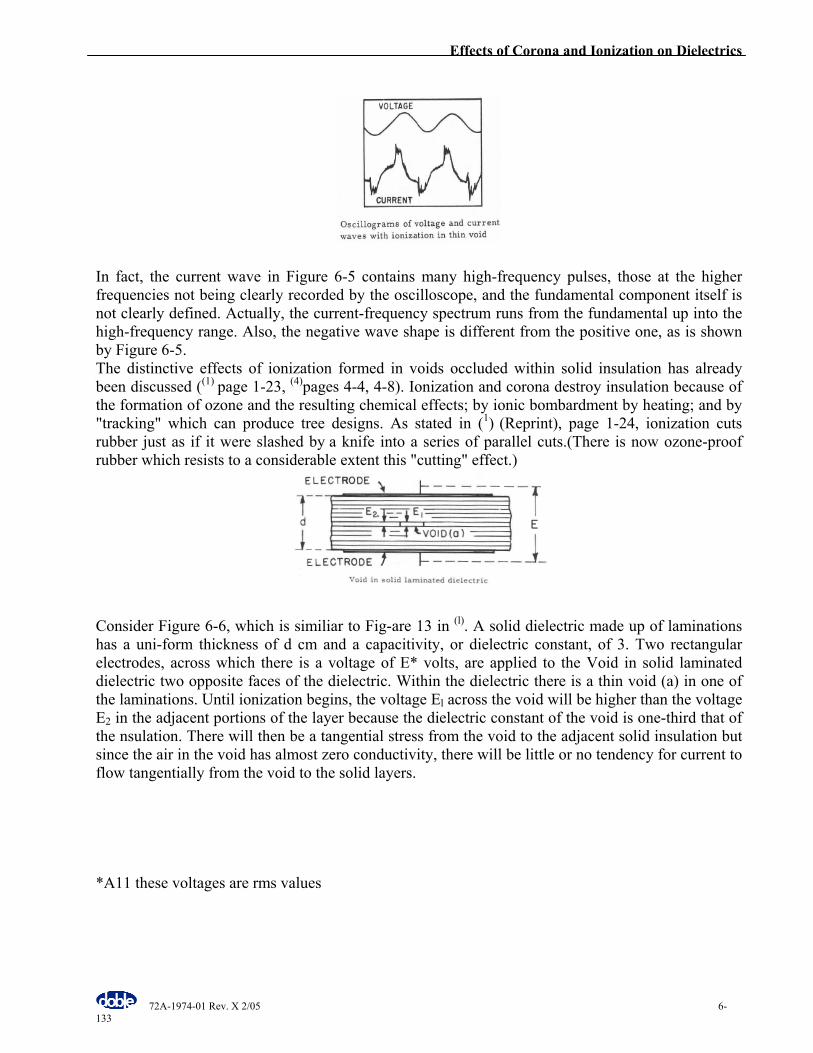
Effects of Corona and Ionization on Dielectrics
72A-1974-01 Rev. X 2/05 6-133
In fact, the current wave in Figure 6-5 contains many high-frequency pulses, those at the higher frequencies not being clearly recorded by the oscilloscope, and the fundamental component itself is not clearly defined. Actually, the current-frequency spectrum runs from the fundamental up into the high-frequency range. Also, the negative wave shape is different from the positive one, as is shown by Figure 6-5. The distinctive effects of ionization formed in voids occluded within solid insulation has already been discussed ((1) page 1-23, (4)pages 4-4, 4-8). Ionization and corona destroy insulation because of the formation of ozone and the resulting chemical effects; by ionic bombardment by heating; and by "tracking" which can produce tree designs. As stated in (1) (Reprint), page 1-24, ionization cuts rubber just as if it were slashed by a knife into a series of parallel cuts.(There is now ozone-proof rubber which resists to a considerable extent this "cutting" effect.)
Consider Figure 6-6, which is similiar to Fig-are 13 in (l). A solid dielectric made up of laminations has a uni-form thickness of d cm and a capacitivity, or dielectric constant, of 3. Two rectangular electrodes, across which there is a voltage of E* volts, are applied to the Void in solid laminated dielectric two opposite faces of the dielectric. Within the dielectric there is a thin void (a) in one of the laminations. Until ionization begins, the voltage El across the void will be higher than the voltage E2 in the adjacent portions of the layer because the dielectric constant of the void is one-third that of the nsulation. There will then be a tangential stress from the void to the adjacent solid insulation but since the air in the void has almost zero conductivity, there will be little or no tendency for current to flow tangentially from the void to the solid layers. *A11 these voltages are rms values
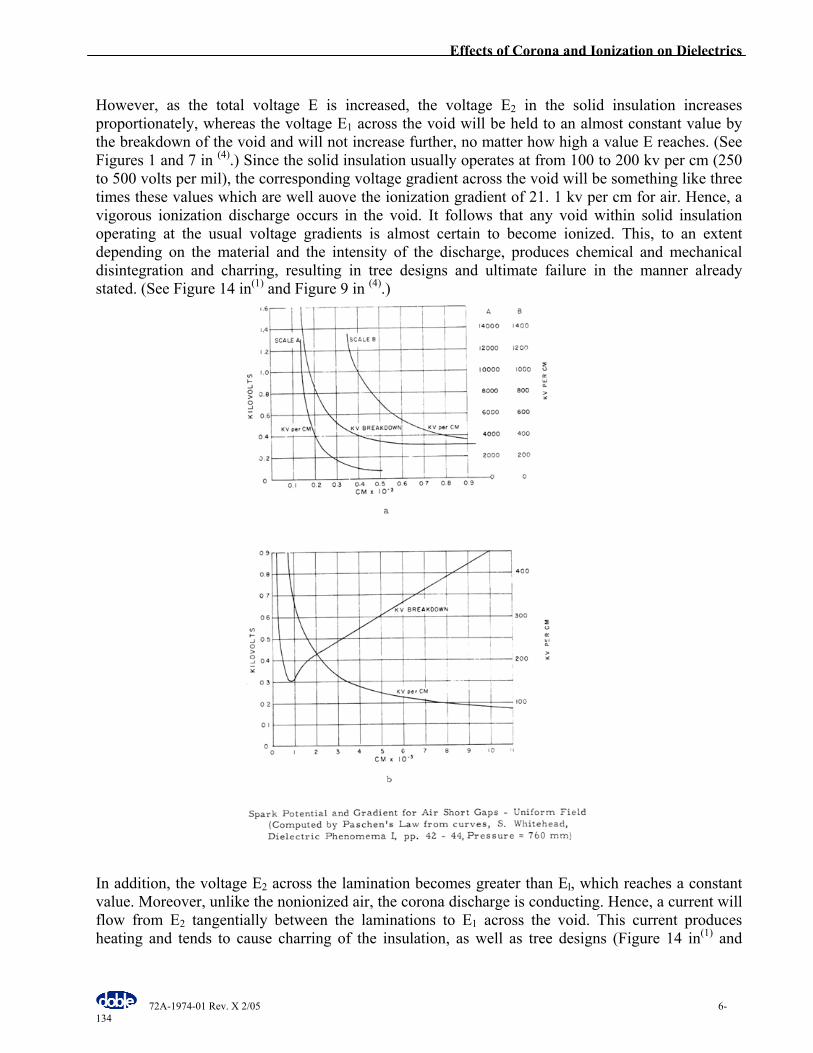
Effects of Corona and Ionization on Dielectrics
72A-1974-01 Rev. X 2/05 6-134
However, as the total voltage E is increased, the voltage E2 in the solid insulation increases proportionately, whereas the voltage E1 across the void will be held to an almost constant value by the breakdown of the void and will not increase further, no matter how high a value E reaches. (See Figures 1 and 7 in (4).) Since the solid insulation usually operates at from 100 to 200 kv per cm (250 to 500 volts per mil), the corresponding voltage gradient across the void will be something like three times these values which are well auove the ionization gradient of 21. 1 kv per cm for air. Hence, a vigorous ionization discharge occurs in the void. It follows that any void within solid insulation operating at the usual voltage gradients is almost certain to become ionized. This, to an extent depending on the material and the intensity of the discharge, produces chemical and mechanical disintegration and charring, resulting in tree designs and ultimate failure in the manner already stated. (See Figure 14 in(1) and Figure 9 in (4).)
In addition, the voltage E2 across the lamination becomes greater than El, which reaches a constant value. Moreover, unlike the nonionized air, the corona discharge is conducting. Hence, a current will flow from E2 tangentially between the laminations to E1 across the void. This current produces heating and tends to cause charring of the insulation, as well as tree designs (Figure 14 in(1) and
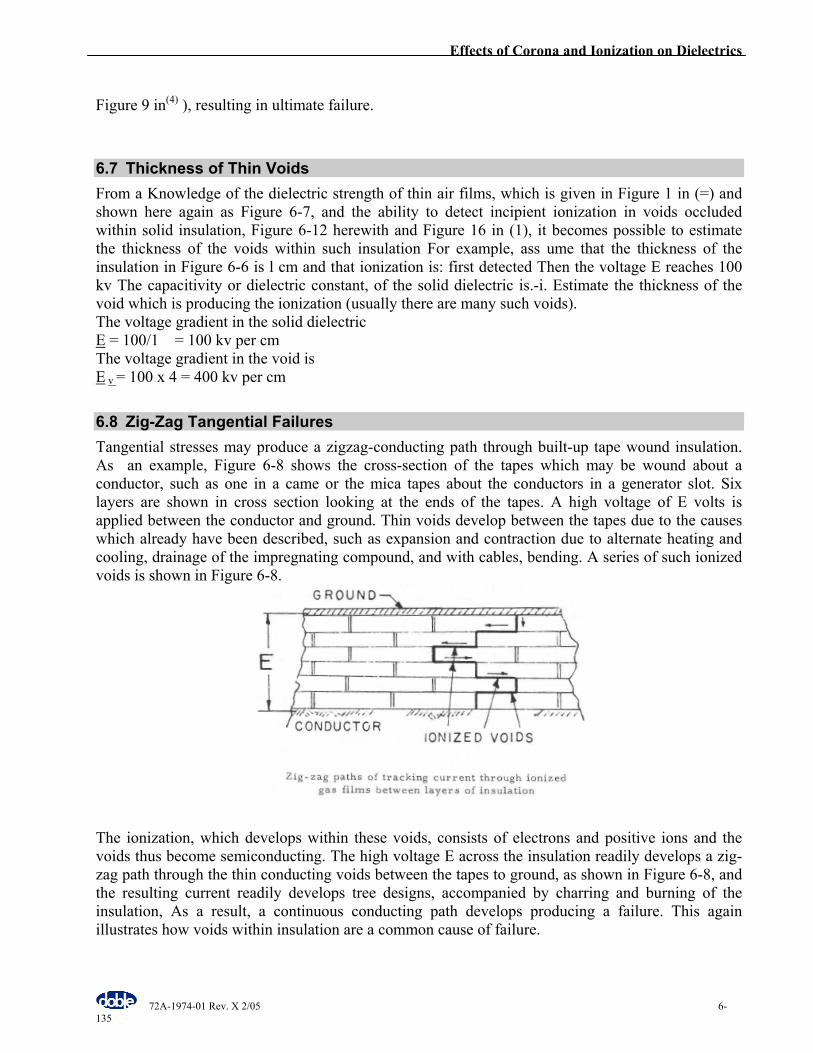
Effects of Corona and Ionization on Dielectrics
72A-1974-01 Rev. X 2/05 6-135
Figure 9 in(4) ), resulting in ultimate failure.
6.7 Thickness of Thin Voids From a Knowledge of the dielectric strength of thin air films, which is given in Figure 1 in (=) and shown here again as Figure 6-7, and the ability to detect incipient ionization in voids occluded within solid insulation, Figure 6-12 herewith and Figure 16 in (1), it becomes possible to estimate the thickness of the voids within such insulation For example, ass ume that the thickness of the insulation in Figure 6-6 is l cm and that ionization is: first detected Then the voltage E reaches 100 kv The capacitivity or dielectric constant, of the solid dielectric is.-i. Estimate the thickness of the void which is producing the ionization (usually there are many such voids). The voltage gradient in the solid dielectric E = 100/1 = 100 kv per cm The voltage gradient in the void is E v = 100 x 4 = 400 kv per cm
6.8 Zig-Zag Tangential Failures Tangential stresses may produce a zigzag-conducting path through built-up tape wound insulation. As an example, Figure 6-8 shows the cross-section of the tapes which may be wound about a conductor, such as one in a came or the mica tapes about the conductors in a generator slot. Six layers are shown in cross section looking at the ends of the tapes. A high voltage of E volts is applied between the conductor and ground. Thin voids develop between the tapes due to the causes which already have been described, such as expansion and contraction due to alternate heating and cooling, drainage of the impregnating compound, and with cables, bending. A series of such ionized voids is shown in Figure 6-8.
The ionization, which develops within these voids, consists of electrons and positive ions and the voids thus become semiconducting. The high voltage E across the insulation readily develops a zig-zag path through the thin conducting voids between the tapes to ground, as shown in Figure 6-8, and the resulting current readily develops tree designs, accompanied by charring and burning of the insulation, As a result, a continuous conducting path develops producing a failure. This again illustrates how voids within insulation are a common cause of failure.
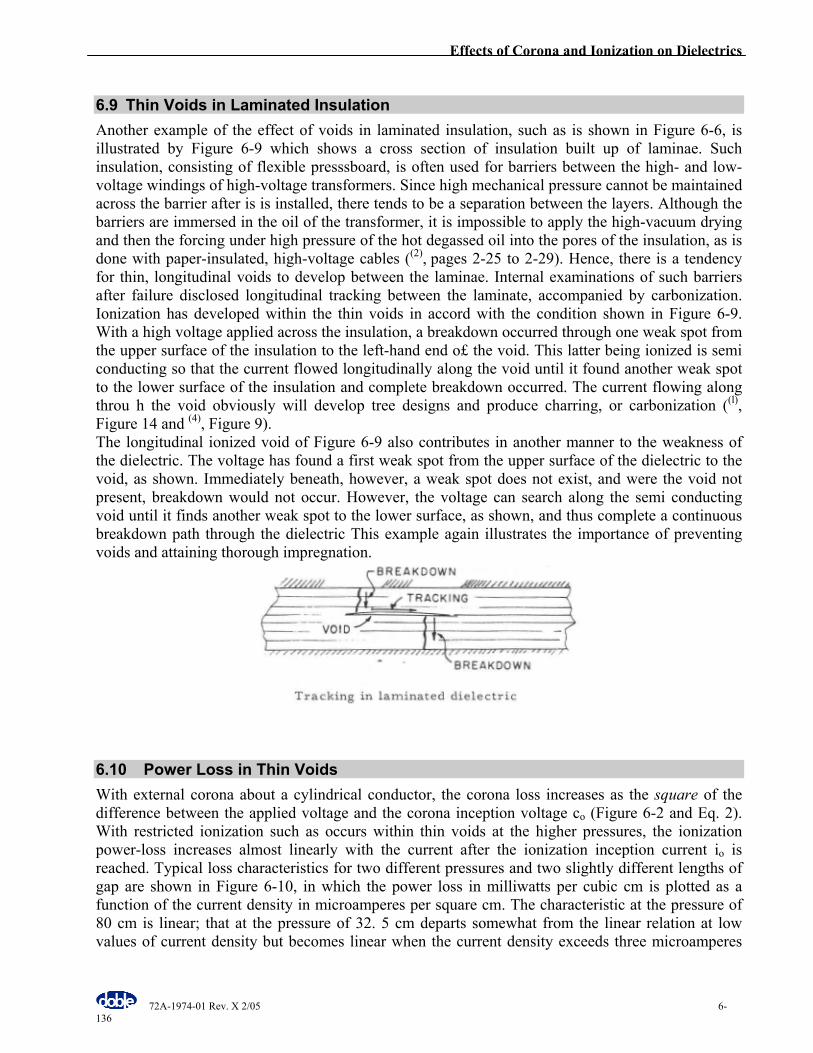
Effects of Corona and Ionization on Dielectrics
72A-1974-01 Rev. X 2/05 6-136
6.9 Thin Voids in Laminated Insulation Another example of the effect of voids in laminated insulation, such as is shown in Figure 6-6, is illustrated by Figure 6-9 which shows a cross section of insulation built up of laminae. Such insulation, consisting of flexible presssboard, is often used for barriers between the high- and low-voltage windings of high-voltage transformers. Since high mechanical pressure cannot be maintained across the barrier after is is installed, there tends to be a separation between the layers. Although the barriers are immersed in the oil of the transformer, it is impossible to apply the high-vacuum drying and then the forcing under high pressure of the hot degassed oil into the pores of the insulation, as is done with paper-insulated, high-voltage cables ((2), pages 2-25 to 2-29). Hence, there is a tendency for thin, longitudinal voids to develop between the laminae. Internal examinations of such barriers after failure disclosed longitudinal tracking between the laminate, accompanied by carbonization. Ionization has developed within the thin voids in accord with the condition shown in Figure 6-9. With a high voltage applied across the insulation, a breakdown occurred through one weak spot from the upper surface of the insulation to the left-hand end o£ the void. This latter being ionized is semi conducting so that the current flowed longitudinally along the void until it found another weak spot to the lower surface of the insulation and complete breakdown occurred. The current flowing along throu h the void obviously will develop tree designs and produce charring, or carbonization ((l), Figure 14 and (4), Figure 9). The longitudinal ionized void of Figure 6-9 also contributes in another manner to the weakness of the dielectric. The voltage has found a first weak spot from the upper surface of the dielectric to the void, as shown. Immediately beneath, however, a weak spot does not exist, and were the void not present, breakdown would not occur. However, the voltage can search along the semi conducting void until it finds another weak spot to the lower surface, as shown, and thus complete a continuous breakdown path through the dielectric This example again illustrates the importance of preventing voids and attaining thorough impregnation.
6.10 Power Loss in Thin Voids With external corona about a cylindrical conductor, the corona loss increases as the square of the difference between the applied voltage and the corona inception voltage co (Figure 6-2 and Eq. 2). With restricted ionization such as occurs within thin voids at the higher pressures, the ionization power-loss increases almost linearly with the current after the ionization inception current io is reached. Typical loss characteristics for two different pressures and two slightly different lengths of gap are shown in Figure 6-10, in which the power loss in milliwatts per cubic cm is plotted as a function of the current density in microamperes per square cm. The characteristic at the pressure of 80 cm is linear; that at the pressure of 32. 5 cm departs somewhat from the linear relation at low values of current density but becomes linear when the current density exceeds three microamperes
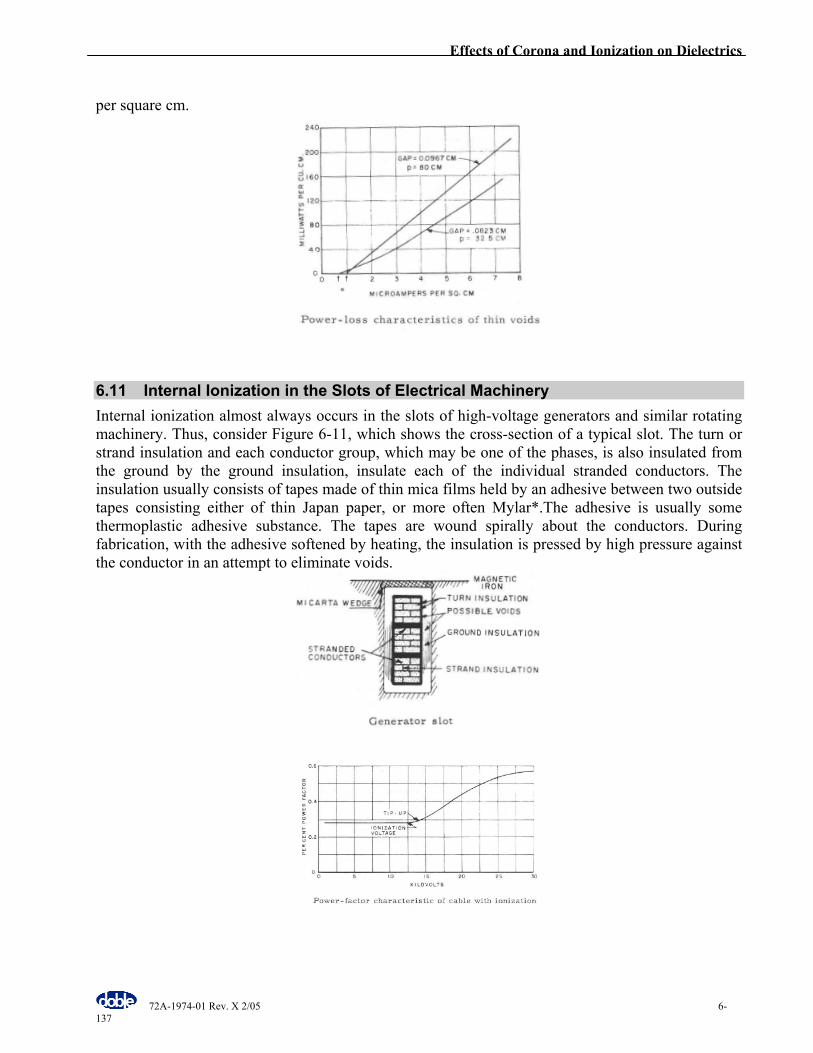
Effects of Corona and Ionization on Dielectrics
72A-1974-01 Rev. X 2/05 6-137
per square cm.
6.11 Internal Ionization in the Slots of Electrical Machinery Internal ionization almost always occurs in the slots of high-voltage generators and similar rotating machinery. Thus, consider Figure 6-11, which shows the cross-section of a typical slot. The turn or strand insulation and each conductor group, which may be one of the phases, is also insulated from the ground by the ground insulation, insulate each of the individual stranded conductors. The insulation usually consists of tapes made of thin mica films held by an adhesive between two outside tapes consisting either of thin Japan paper, or more often Mylar*.The adhesive is usually some thermoplastic adhesive substance. The tapes are wound spirally about the conductors. During fabrication, with the adhesive softened by heating, the insulation is pressed by high pressure against the conductor in an attempt to eliminate voids.
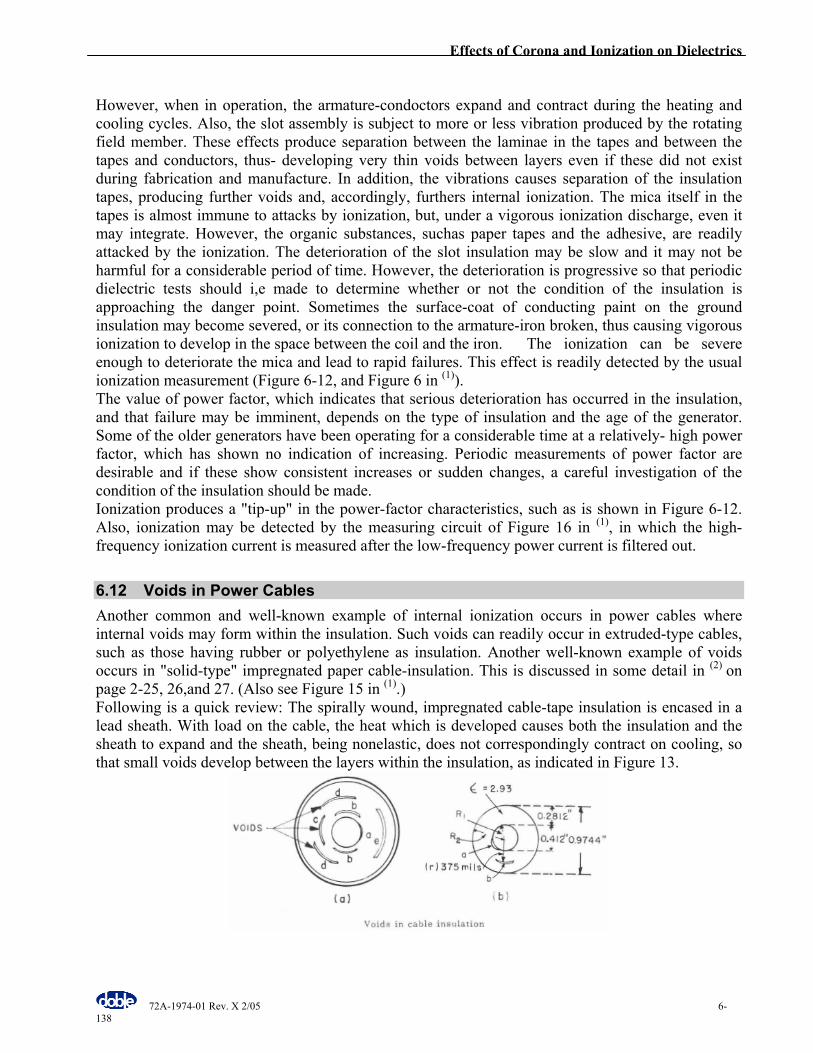
Effects of Corona and Ionization on Dielectrics
72A-1974-01 Rev. X 2/05 6-138
However, when in operation, the armature-condoctors expand and contract during the heating and cooling cycles. Also, the slot assembly is subject to more or less vibration produced by the rotating field member. These effects produce separation between the laminae in the tapes and between the tapes and conductors, thus- developing very thin voids between layers even if these did not exist during fabrication and manufacture. In addition, the vibrations causes separation of the insulation tapes, producing further voids and, accordingly, furthers internal ionization. The mica itself in the tapes is almost immune to attacks by ionization, but, under a vigorous ionization discharge, even it may integrate. However, the organic substances, suchas paper tapes and the adhesive, are readily attacked by the ionization. The deterioration of the slot insulation may be slow and it may not be harmful for a considerable period of time. However, the deterioration is progressive so that periodic dielectric tests should i,e made to determine whether or not the condition of the insulation is approaching the danger point. Sometimes the surface-coat of conducting paint on the ground insulation may become severed, or its connection to the armature-iron broken, thus causing vigorous ionization to develop in the space between the coil and the iron. The ionization can be severe enough to deteriorate the mica and lead to rapid failures. This effect is readily detected by the usual ionization measurement (Figure 6-12, and Figure 6 in (1)). The value of power factor, which indicates that serious deterioration has occurred in the insulation, and that failure may be imminent, depends on the type of insulation and the age of the generator. Some of the older generators have been operating for a considerable time at a relatively- high power factor, which has shown no indication of increasing. Periodic measurements of power factor are desirable and if these show consistent increases or sudden changes, a careful investigation of the condition of the insulation should be made. Ionization produces a "tip-up" in the power-factor characteristics, such as is shown in Figure 6-12. Also, ionization may be detected by the measuring circuit of Figure 16 in (1), in which the high-frequency ionization current is measured after the low-frequency power current is filtered out.
6.12 Voids in Power Cables Another common and well-known example of internal ionization occurs in power cables where internal voids may form within the insulation. Such voids can readily occur in extruded-type cables, such as those having rubber or polyethylene as insulation. Another well-known example of voids occurs in "solid-type" impregnated paper cable-insulation. This is discussed in some detail in (2) on page 2-25, 26,and 27. (Also see Figure 15 in (1).) Following is a quick review: The spirally wound, impregnated cable-tape insulation is encased in a lead sheath. With load on the cable, the heat which is developed causes both the insulation and the sheath to expand and the sheath, being nonelastic, does not correspondingly contract on cooling, so that small voids develop between the layers within the insulation, as indicated in Figure 13.
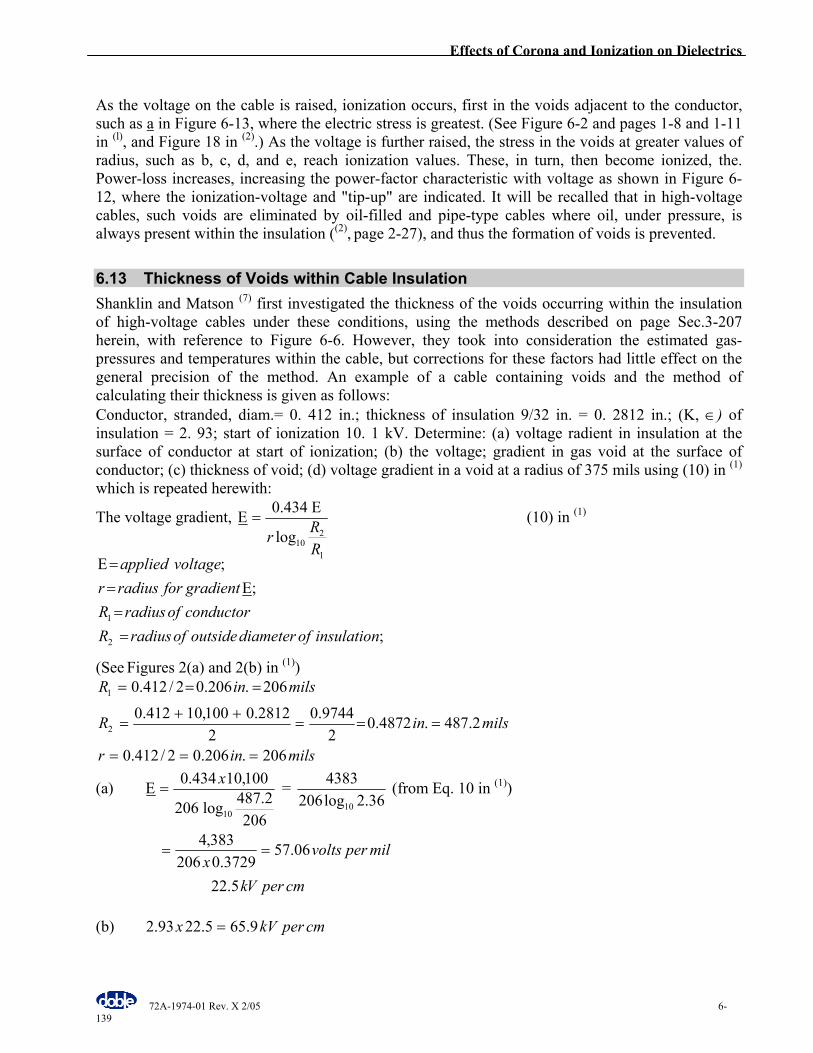
Effects of Corona and Ionization on Dielectrics
72A-1974-01 Rev. X 2/05 6-139
As the voltage on the cable is raised, ionization occurs, first in the voids adjacent to the conductor, such as a in Figure 6-13, where the electric stress is greatest. (See Figure 6-2 and pages 1-8 and 1-11 in (l), and Figure 18 in (2).) As the voltage is further raised, the stress in the voids at greater values of radius, such as b, c, d, and e, reach ionization values. These, in turn, then become ionized, the. Power-loss increases, increasing the power-factor characteristic with voltage as shown in Figure 6-12, where the ionization-voltage and "tip-up" are indicated. It will be recalled that in high-voltage cables, such voids are eliminated by oil-filled and pipe-type cables where oil, under pressure, is always present within the insulation ((2), page 2-27), and thus the formation of voids is prevented.
6.13 Thickness of Voids within Cable Insulation Shanklin and Matson (7) first investigated the thickness of the voids occurring within the insulation of high-voltage cables under these conditions, using the methods described on page Sec.3-207 herein, with reference to Figure 6-6. However, they took into consideration the estimated gas-pressures and temperatures within the cable, but corrections for these factors had little effect on the general precision of the method. An example of a cable containing voids and the method of calculating their thickness is given as follows: Conductor, stranded, diam.= 0. 412 in.; thickness of insulation 9/32 in. = 0. 2812 in.; (K, ∈) of insulation = 2. 93; start of ionization 10. 1 kV. Determine: (a) voltage radient in insulation at the surface of conductor at start of ionization; (b) the voltage; gradient in gas void at the surface of conductor; (c) thickness of void; (d) voltage gradient in a void at a radius of 375 mils using (10) in (1)
which is repeated herewith:
The voltage gradient,
1
210log
434.0
RRr
Ε=Ε (10) in (1)
;
;;
2
1
insulationofdiameteroutsideofradiusRconductorofradiusRgradientforradiusr
voltageapplied
==
Ε==Ε
(See Figures 2(a) and 2(b) in (1))
milsinr
milsinR
milsinR
206.206.02/412.0
2.487.4872.02
9744.02
2812.0100,10412.0
206.206.02/412.0
2
1
===
===++
=
===
(a)
2062.487log206
100,10434.0
10
x=Ε =
36.2log2064383
10
(from Eq. 10 in (1))
cmperVk
milpervoltsx
5.22
06.573729.0206
383,4==
(b) cmperkVx 9.655.2293.2 =
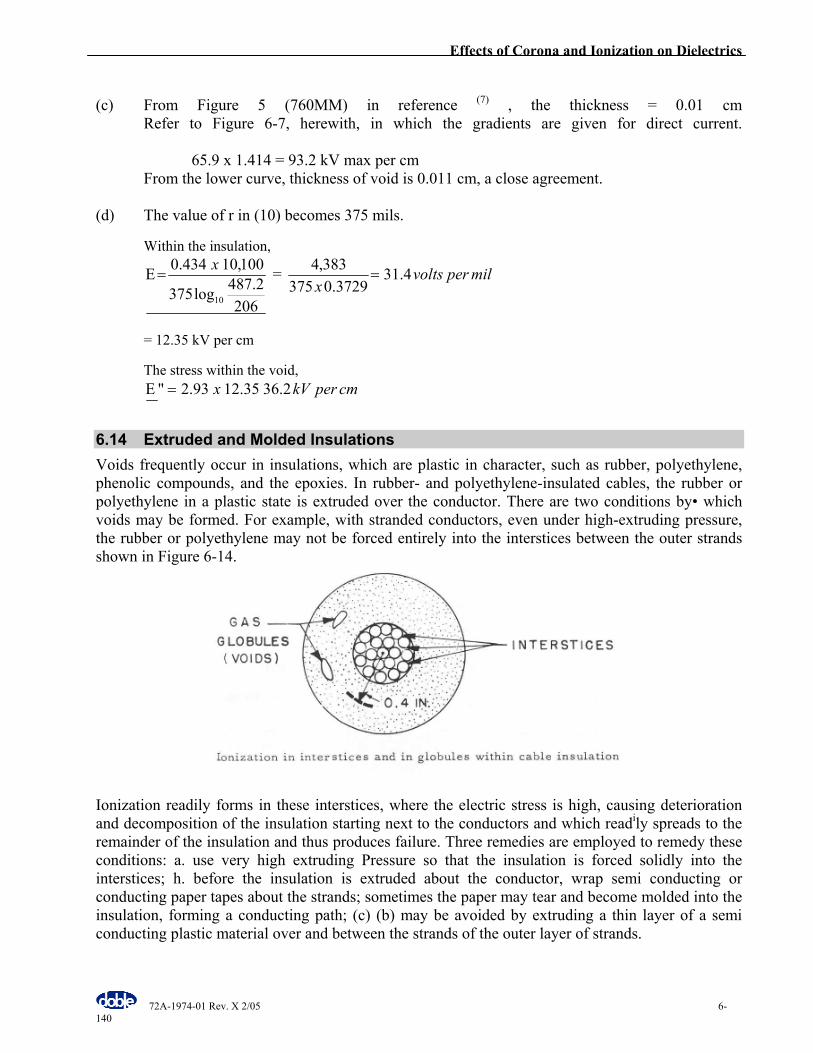
Effects of Corona and Ionization on Dielectrics
72A-1974-01 Rev. X 2/05 6-140
(c) From Figure 5 (760MM) in reference (7) , the thickness = 0.01 cm Refer to Figure 6-7, herewith, in which the gradients are given for direct current. 65.9 x 1.414 = 93.2 kV max per cm From the lower curve, thickness of void is 0.011 cm, a close agreement. (d) The value of r in (10) becomes 375 mils.
Within the insulation,
2062.487log375
100,10434.0
10
x=Ε = milpervolts
x4.31
3729.0375383,4
=
= 12.35 kV per cm
The stress within the void, cmperkVx 2.3635.1293.2" =Ε
6.14 Extruded and Molded Insulations Voids frequently occur in insulations, which are plastic in character, such as rubber, polyethylene, phenolic compounds, and the epoxies. In rubber- and polyethylene-insulated cables, the rubber or polyethylene in a plastic state is extruded over the conductor. There are two conditions by• which voids may be formed. For example, with stranded conductors, even under high-extruding pressure, the rubber or polyethylene may not be forced entirely into the interstices between the outer strands shown in Figure 6-14.
Ionization readily forms in these interstices, where the electric stress is high, causing deterioration and decomposition of the insulation starting next to the conductors and which readily spreads to the remainder of the insulation and thus produces failure. Three remedies are employed to remedy these conditions: a. use very high extruding Pressure so that the insulation is forced solidly into the interstices; h. before the insulation is extruded about the conductor, wrap semi conducting or conducting paper tapes about the strands; sometimes the paper may tear and become molded into the insulation, forming a conducting path; (c) (b) may be avoided by extruding a thin layer of a semi conducting plastic material over and between the strands of the outer layer of strands.
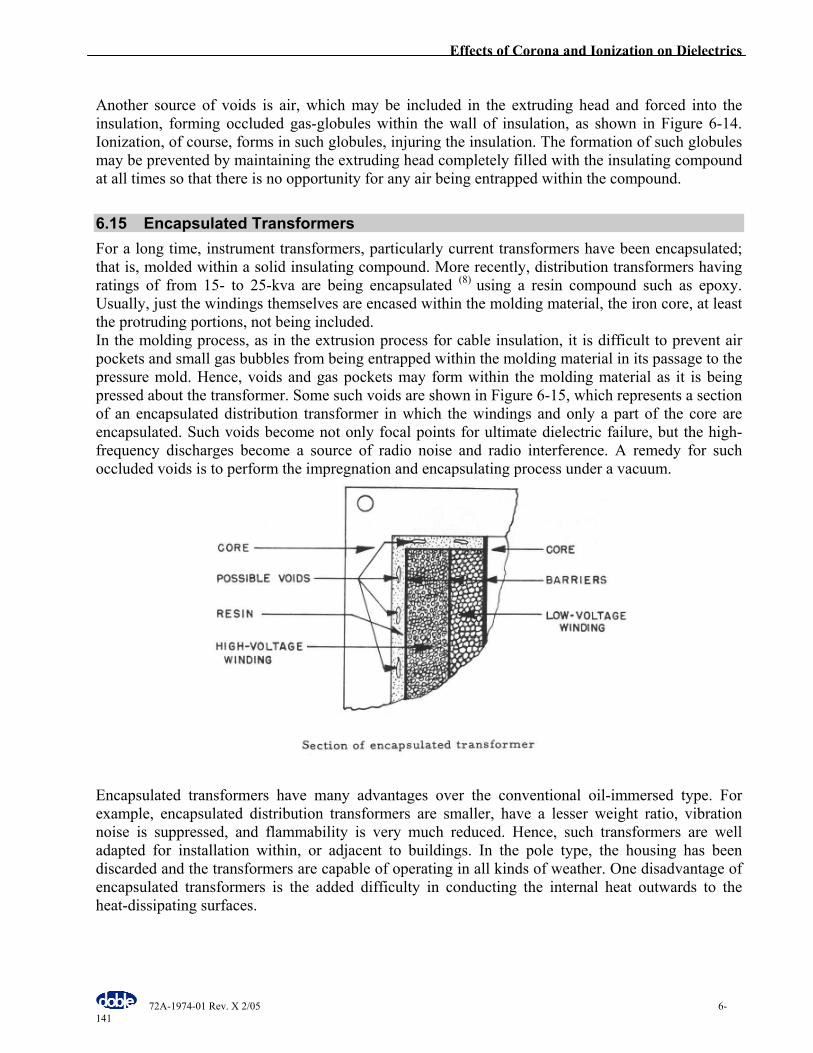
Effects of Corona and Ionization on Dielectrics
72A-1974-01 Rev. X 2/05 6-141
Another source of voids is air, which may be included in the extruding head and forced into the insulation, forming occluded gas-globules within the wall of insulation, as shown in Figure 6-14. Ionization, of course, forms in such globules, injuring the insulation. The formation of such globules may be prevented by maintaining the extruding head completely filled with the insulating compound at all times so that there is no opportunity for any air being entrapped within the compound.
6.15 Encapsulated Transformers For a long time, instrument transformers, particularly current transformers have been encapsulated; that is, molded within a solid insulating compound. More recently, distribution transformers having ratings of from 15- to 25-kva are being encapsulated (8) using a resin compound such as epoxy. Usually, just the windings themselves are encased within the molding material, the iron core, at least the protruding portions, not being included. In the molding process, as in the extrusion process for cable insulation, it is difficult to prevent air pockets and small gas bubbles from being entrapped within the molding material in its passage to the pressure mold. Hence, voids and gas pockets may form within the molding material as it is being pressed about the transformer. Some such voids are shown in Figure 6-15, which represents a section of an encapsulated distribution transformer in which the windings and only a part of the core are encapsulated. Such voids become not only focal points for ultimate dielectric failure, but the high-frequency discharges become a source of radio noise and radio interference. A remedy for such occluded voids is to perform the impregnation and encapsulating process under a vacuum.
Encapsulated transformers have many advantages over the conventional oil-immersed type. For example, encapsulated distribution transformers are smaller, have a lesser weight ratio, vibration noise is suppressed, and flammability is very much reduced. Hence, such transformers are well adapted for installation within, or adjacent to buildings. In the pole type, the housing has been discarded and the transformers are capable of operating in all kinds of weather. One disadvantage of encapsulated transformers is the added difficulty in conducting the internal heat outwards to the heat-dissipating surfaces.
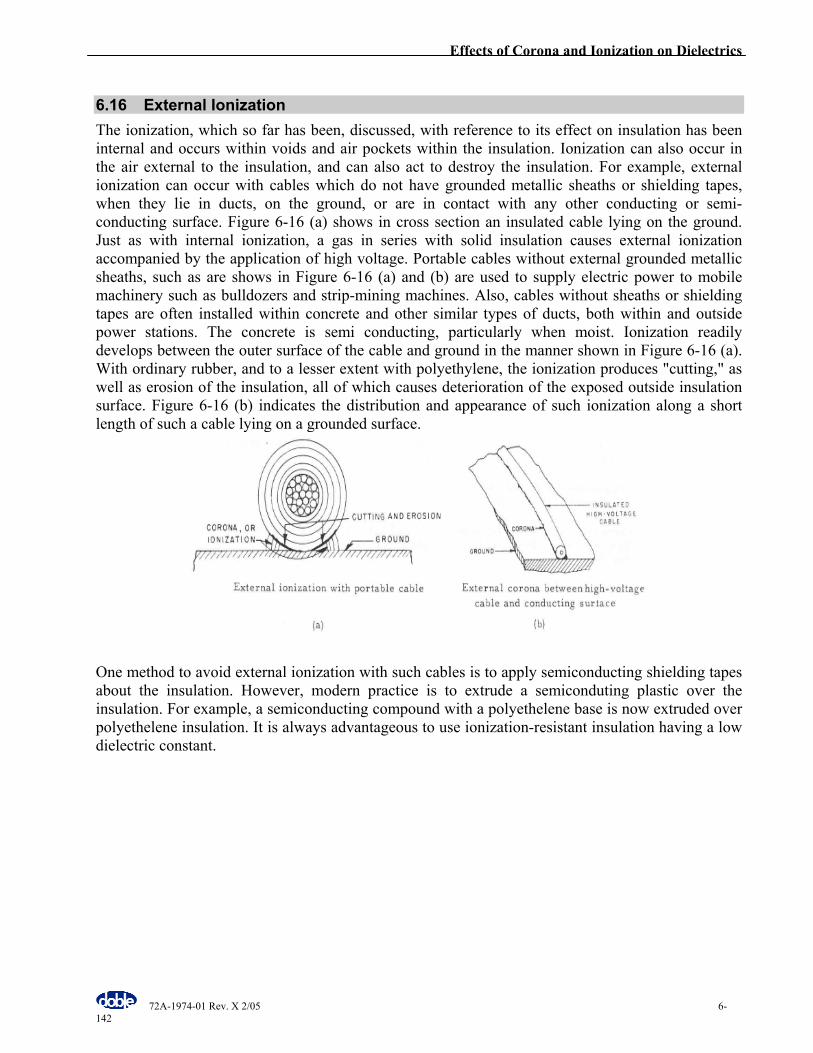
Effects of Corona and Ionization on Dielectrics
72A-1974-01 Rev. X 2/05 6-142
6.16 External Ionization The ionization, which so far has been, discussed, with reference to its effect on insulation has been internal and occurs within voids and air pockets within the insulation. Ionization can also occur in the air external to the insulation, and can also act to destroy the insulation. For example, external ionization can occur with cables which do not have grounded metallic sheaths or shielding tapes, when they lie in ducts, on the ground, or are in contact with any other conducting or semi-conducting surface. Figure 6-16 (a) shows in cross section an insulated cable lying on the ground. Just as with internal ionization, a gas in series with solid insulation causes external ionization accompanied by the application of high voltage. Portable cables without external grounded metallic sheaths, such as are shows in Figure 6-16 (a) and (b) are used to supply electric power to mobile machinery such as bulldozers and strip-mining machines. Also, cables without sheaths or shielding tapes are often installed within concrete and other similar types of ducts, both within and outside power stations. The concrete is semi conducting, particularly when moist. Ionization readily develops between the outer surface of the cable and ground in the manner shown in Figure 6-16 (a). With ordinary rubber, and to a lesser extent with polyethylene, the ionization produces "cutting," as well as erosion of the insulation, all of which causes deterioration of the exposed outside insulation surface. Figure 6-16 (b) indicates the distribution and appearance of such ionization along a short length of such a cable lying on a grounded surface.
One method to avoid external ionization with such cables is to apply semiconducting shielding tapes about the insulation. However, modern practice is to extrude a semiconduting plastic over the insulation. For example, a semiconducting compound with a polyethelene base is now extruded over polyethelene insulation. It is always advantageous to use ionization-resistant insulation having a low dielectric constant.
72A-1974-01 Rev. B 2/05 6-143
6.17 Bibliography The author wishes to appreciation to E.H. Povey and A.L. Rickley, of the Doble Engineering Company for their suggestions in the preparation of this paper. 1. Dielectric Theory and Practice - C. L. Dawes and E. H, Povey, Presented at the 1962 Doble
Conference, 1962 Minutes, Sec, 1A-301. 2. Various Types. and Applications of Electrical Insulation - C. L. Dawes, Presented at the 1963
Doble Conference, 1963 Minutes, Sec. 2-401, 3. Discussion of the Deterioration of Insulation and Its Detection - E. H. Povey. Presented at the
1964 Doble Conference. 4. Mechanism of the Electric Breakdown of Dielectrics - C. L. Dawes. Presented at the 1964
Doble Conference, 1964 Minutes, Sec. 2-201. 5. Corona Pulses and Their Measurement - E. H, Povey. Presented at the 1964 Doble
Conference, 1964 Minutes, Sec. 3-101. 6. Dielectric Phenomena in High-Voltage Engineering (a book) - F. W. Peek, McGrawHill
Book Company. 7. Ionization of Occluded Gases in High-Tension Insulation - G. B. Shanklin and J. J. Matson.
Trans. AIEE, 1919 (Part I), Page 489. 8. Encapsulated Distribution Transformers - E. L, Raab.1963 Doble Conference, 1963 Minutes,
Sec. 6-1201. 9. Characteristics of Restricted Ionization and Its Relation to Voids in Insulating Materials - C.
L. Dawes and P. H, Humphries, Trans. AIEE, 1940 (Vol. 59), Page 701.
Effects of Corona and Ionization of Dielectrics
72A-1974-01 Rev. B 2/05 6-144
6.1 Introduction .................................................................................................................................... 6-128 6.2 Corona Wave Form ........................................................................................................................ 6-131 6.3 Equivalent Corona Circuit .............................................................................................................. 6-131 6.4 Ionization in Thin Voids................................................................................................................. 6-132 6.5 Thickness of Thin Voids ................................................................................................................ 6-135 6.6 Zig-Zag Tangential Failures ........................................................................................................... 6-135 6.7 Thin Voids in Laminated Insulation............................................................................................... 6-136 6.8 Power Loss in Thin Voids .............................................................................................................. 6-136 6.9 Internal Ionization in the Slots of Electrical Machinery................................................................. 6-137 6.10 Voids in Power Cables ................................................................................................................. 6-138 6.11 Thickness of Voids within Cable Insulation................................................................................. 6-139 6.12 Extruded and Molded Insulations................................................................................................. 6-140 6.13 Encapsulated Transformers .......................................................................................................... 6-141 6.14 External Ionization ....................................................................................................................... 6-142 6.15 Bibliography................................................................................................................................. 6-143
Effects of Corona and Ionization of Dielectrics
72A-1974-01 Rev. B 2/05 6-145
Chapter 7 - Capacitance Concepts E.H. Povey
Doble Engineering Company An insulation system has much in common with a capacitor. Two electrodes separated by a dielectric form a capacitor. Two conductors separated by insulating material form an insulating system. Since conductors are forms of electrodes and since insulating materials are dielectrics, we see that an insulating system is a form of capacitor. A capacitor, however, is designed specifically to have capacitance, while the capacitance of an insulation system is incidental. In some cases capacitance is put to good use in an insulation system as a method of controlling voltage gradients. In other cases capacitance is detrimental. The transmission of power by EHV cable is limited in distance because the capacitance of such cable requires excessive charging currents. To describe how a capacitor acts in an electric circuit, we must first recall that an electric current is a flow of electrons. A voltage source is like an electron pump, and when such a source is connected across the electrodes of a capacitor, it draws electrons from one electrode and transfers them to the other, so that one electrode has a deficit of electrons and the other has a surplus. The surplus electrons would like to get back to fill the deficit, but they cannot flow against the voltage source. Neither can they flow directly between the electrodes, since the dielectric prohibits such flow. The unbalance in electron supply results in the establishment of an electric field between the electrodes, and the energy required to establish the field is stored in the field. An electron may be considered a particle of negative charge. When the electrons in a capacitor are displaced from their normal positions by a voltage source, the capacitor is said to be charged. If the voltage source is removed, and no conducting path is provided for the electrons to return to their original positions, the capacitor remains charged at the voltage of the source. It would hold this charge forever if the dielectric were perfect, but the charge gradually- leaks off under normal conditions. The number of displaced electrons measures the charge, and the unit of charge is the coulomb. It takes about 6. 28 x 1018 electrons to make up a coulomb. The relation be-tween the charge Q (in coulombs), the capacitance C (in farads), the potential difference V (in volts), and the stored energy W (in joules) are given by the following simple formulas:
Q = CV (1) and W = V2C/2 (2) The concept of an electric field may be described by a simple illustration. If one electrode of a charged capacitor is at a potential of ten volts in respect to the other, there should be some imaginary surface about half way in-between the electrodes, which has a potential of five volts at all, points. The imaginary surface can be considered as conducting, but since it is everywhere at the same potential, no current flows in it. In a two dimensional drawing such as Figure 7-1’s, this surface is represented by the broken line marked 5 volts. Other lines can be drawn representing other equipotential surfaces.
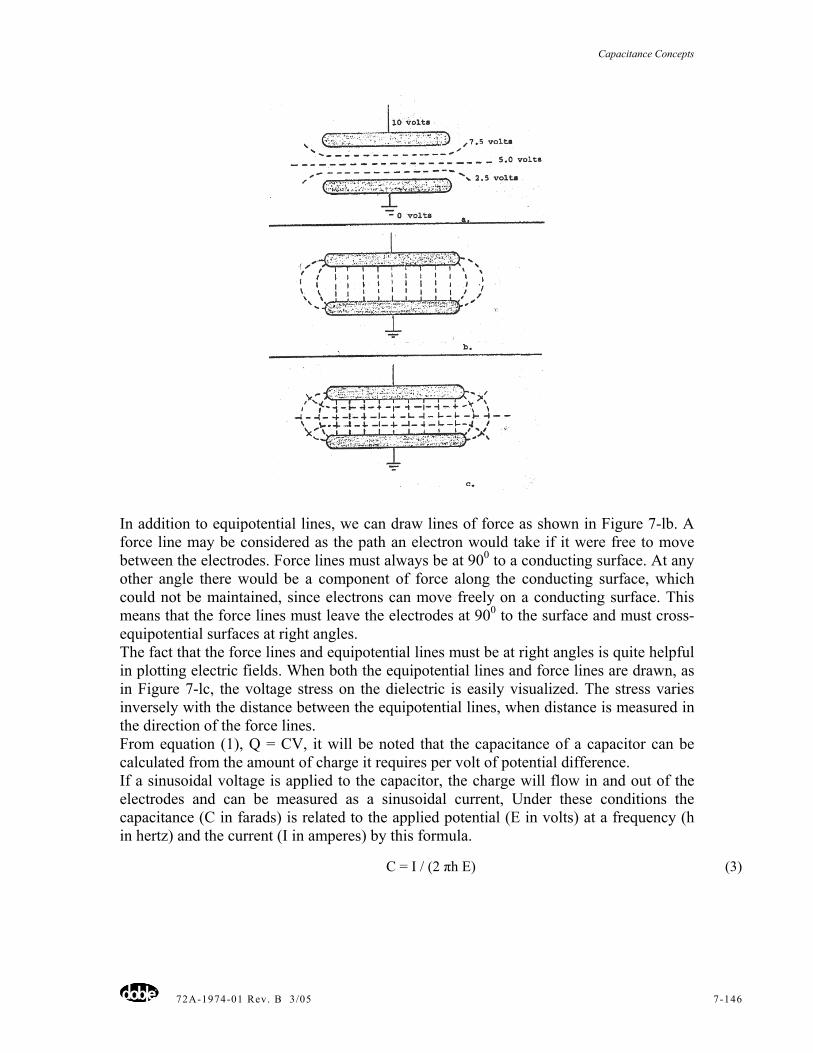
Capacitance Concepts
72A-1974-01 Rev. B 3/05 7-146
In addition to equipotential lines, we can draw lines of force as shown in Figure 7-lb. A force line may be considered as the path an electron would take if it were free to move between the electrodes. Force lines must always be at 900 to a conducting surface. At any other angle there would be a component of force along the conducting surface, which could not be maintained, since electrons can move freely on a conducting surface. This means that the force lines must leave the electrodes at 900 to the surface and must cross-equipotential surfaces at right angles. The fact that the force lines and equipotential lines must be at right angles is quite helpful in plotting electric fields. When both the equipotential lines and force lines are drawn, as in Figure 7-lc, the voltage stress on the dielectric is easily visualized. The stress varies inversely with the distance between the equipotential lines, when distance is measured in the direction of the force lines. From equation (1), Q = CV, it will be noted that the capacitance of a capacitor can be calculated from the amount of charge it requires per volt of potential difference. If a sinusoidal voltage is applied to the capacitor, the charge will flow in and out of the electrodes and can be measured as a sinusoidal current, Under these conditions the capacitance (C in farads) is related to the applied potential (E in volts) at a frequency (h in hertz) and the current (I in amperes) by this formula.
C = I / (2 πh E) (3)
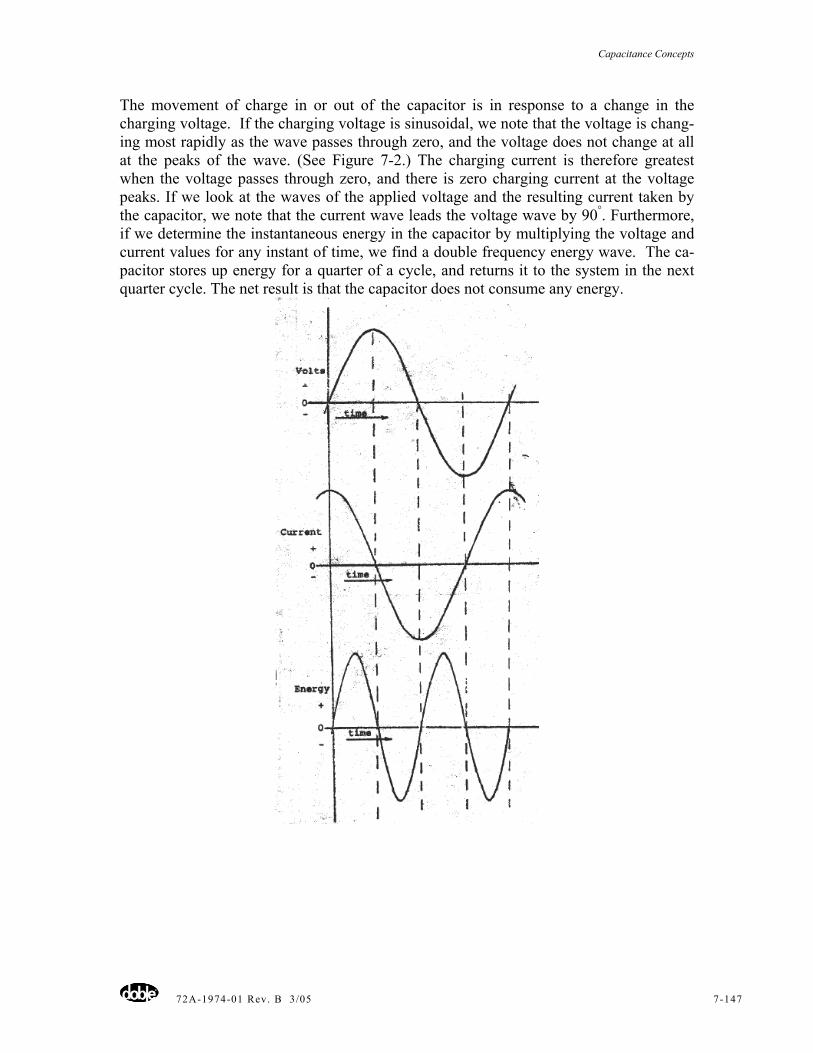
Capacitance Concepts
72A-1974-01 Rev. B 3/05 7-147
The movement of charge in or out of the capacitor is in response to a change in the charging voltage. If the charging voltage is sinusoidal, we note that the voltage is chang-ing most rapidly as the wave passes through zero, and the voltage does not change at all at the peaks of the wave. (See Figure 7-2.) The charging current is therefore greatest when the voltage passes through zero, and there is zero charging current at the voltage peaks. If we look at the waves of the applied voltage and the resulting current taken by the capacitor, we note that the current wave leads the voltage wave by 90°. Furthermore, if we determine the instantaneous energy in the capacitor by multiplying the voltage and current values for any instant of time, we find a double frequency energy wave. The ca-pacitor stores up energy for a quarter of a cycle, and returns it to the system in the next quarter cycle. The net result is that the capacitor does not consume any energy.
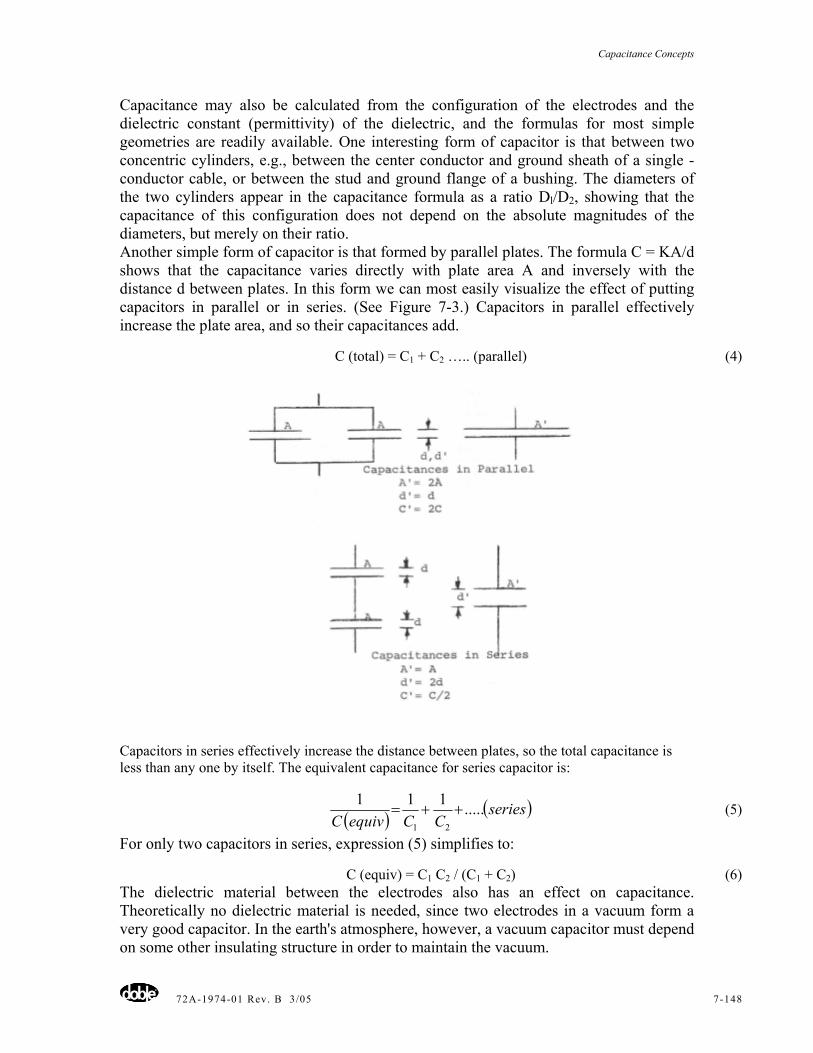
Capacitance Concepts
72A-1974-01 Rev. B 3/05 7-148
Capacitance may also be calculated from the configuration of the electrodes and the dielectric constant (permittivity) of the dielectric, and the formulas for most simple geometries are readily available. One interesting form of capacitor is that between two concentric cylinders, e.g., between the center conductor and ground sheath of a single -conductor cable, or between the stud and ground flange of a bushing. The diameters of the two cylinders appear in the capacitance formula as a ratio Dl/D2, showing that the capacitance of this configuration does not depend on the absolute magnitudes of the diameters, but merely on their ratio. Another simple form of capacitor is that formed by parallel plates. The formula C = KA/d shows that the capacitance varies directly with plate area A and inversely with the distance d between plates. In this form we can most easily visualize the effect of putting capacitors in parallel or in series. (See Figure 7-3.) Capacitors in parallel effectively increase the plate area, and so their capacitances add.
C (total) = C1 + C2 ….. (parallel) (4)
Capacitors in series effectively increase the distance between plates, so the total capacitance is less than any one by itself. The equivalent capacitance for series capacitor is:
( ) ( )seriesCCequivC
.....11121
++= (5)
For only two capacitors in series, expression (5) simplifies to:
C (equiv) = C1 C2 / (C1 + C2) (6) The dielectric material between the electrodes also has an effect on capacitance. Theoretically no dielectric material is needed, since two electrodes in a vacuum form a very good capacitor. In the earth's atmosphere, however, a vacuum capacitor must depend on some other insulating structure in order to maintain the vacuum.
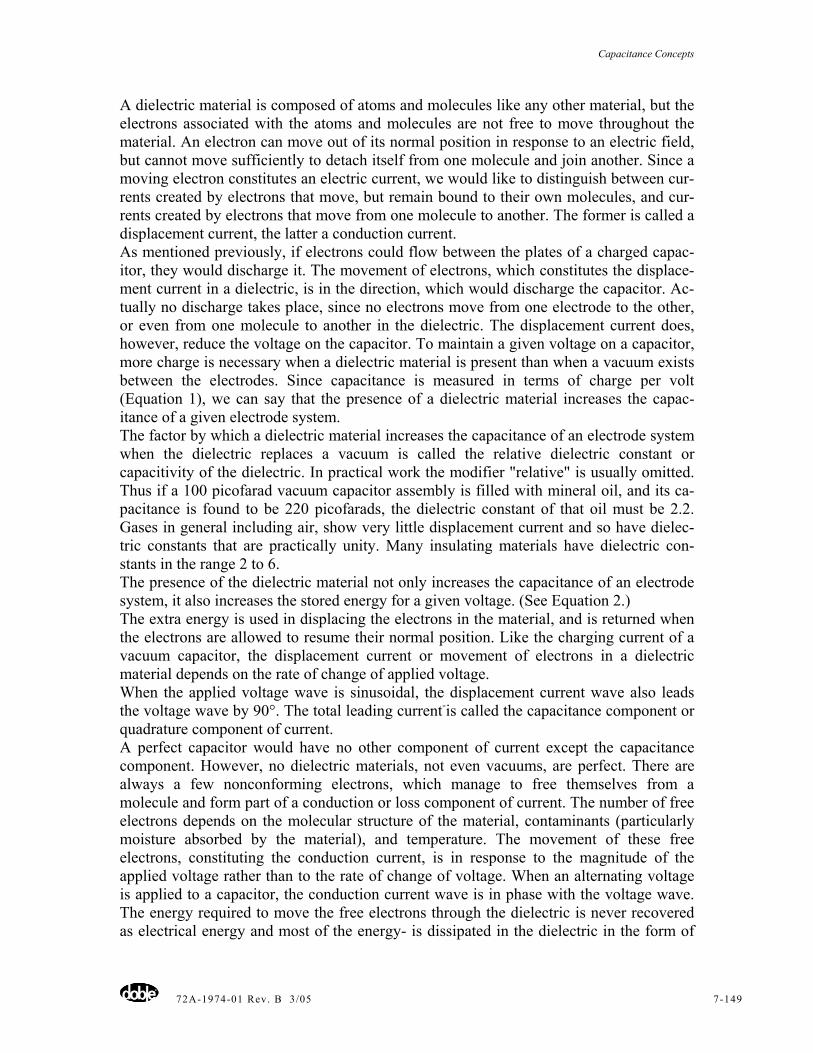
Capacitance Concepts
72A-1974-01 Rev. B 3/05 7-149
A dielectric material is composed of atoms and molecules like any other material, but the electrons associated with the atoms and molecules are not free to move throughout the material. An electron can move out of its normal position in response to an electric field, but cannot move sufficiently to detach itself from one molecule and join another. Since a moving electron constitutes an electric current, we would like to distinguish between cur-rents created by electrons that move, but remain bound to their own molecules, and cur-rents created by electrons that move from one molecule to another. The former is called a displacement current, the latter a conduction current. As mentioned previously, if electrons could flow between the plates of a charged capac-itor, they would discharge it. The movement of electrons, which constitutes the displace-ment current in a dielectric, is in the direction, which would discharge the capacitor. Ac-tually no discharge takes place, since no electrons move from one electrode to the other, or even from one molecule to another in the dielectric. The displacement current does, however, reduce the voltage on the capacitor. To maintain a given voltage on a capacitor, more charge is necessary when a dielectric material is present than when a vacuum exists between the electrodes. Since capacitance is measured in terms of charge per volt (Equation 1), we can say that the presence of a dielectric material increases the capac-itance of a given electrode system. The factor by which a dielectric material increases the capacitance of an electrode system when the dielectric replaces a vacuum is called the relative dielectric constant or capacitivity of the dielectric. In practical work the modifier "relative" is usually omitted. Thus if a 100 picofarad vacuum capacitor assembly is filled with mineral oil, and its ca-pacitance is found to be 220 picofarads, the dielectric constant of that oil must be 2.2. Gases in general including air, show very little displacement current and so have dielec-tric constants that are practically unity. Many insulating materials have dielectric con-stants in the range 2 to 6. The presence of the dielectric material not only increases the capacitance of an electrode system, it also increases the stored energy for a given voltage. (See Equation 2.) The extra energy is used in displacing the electrons in the material, and is returned when the electrons are allowed to resume their normal position. Like the charging current of a vacuum capacitor, the displacement current or movement of electrons in a dielectric material depends on the rate of change of applied voltage. When the applied voltage wave is sinusoidal, the displacement current wave also leads the voltage wave by 90°. The total leading current-is called the capacitance component or quadrature component of current. A perfect capacitor would have no other component of current except the capacitance component. However, no dielectric materials, not even vacuums, are perfect. There are always a few nonconforming electrons, which manage to free themselves from a molecule and form part of a conduction or loss component of current. The number of free electrons depends on the molecular structure of the material, contaminants (particularly moisture absorbed by the material), and temperature. The movement of these free electrons, constituting the conduction current, is in response to the magnitude of the applied voltage rather than to the rate of change of voltage. When an alternating voltage is applied to a capacitor, the conduction current wave is in phase with the voltage wave. The energy required to move the free electrons through the dielectric is never recovered as electrical energy and most of the energy- is dissipated in the dielectric in the form of
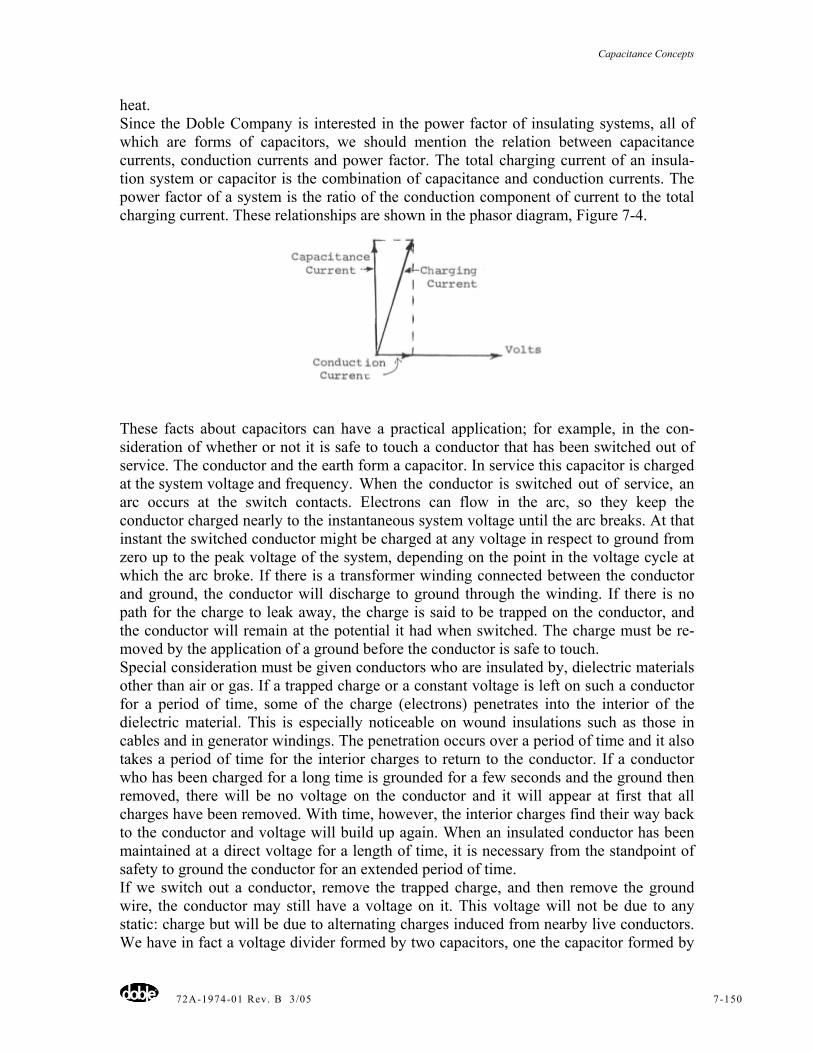
Capacitance Concepts
72A-1974-01 Rev. B 3/05 7-150
heat. Since the Doble Company is interested in the power factor of insulating systems, all of which are forms of capacitors, we should mention the relation between capacitance currents, conduction currents and power factor. The total charging current of an insula-tion system or capacitor is the combination of capacitance and conduction currents. The power factor of a system is the ratio of the conduction component of current to the total charging current. These relationships are shown in the phasor diagram, Figure 7-4.
These facts about capacitors can have a practical application; for example, in the con-sideration of whether or not it is safe to touch a conductor that has been switched out of service. The conductor and the earth form a capacitor. In service this capacitor is charged at the system voltage and frequency. When the conductor is switched out of service, an arc occurs at the switch contacts. Electrons can flow in the arc, so they keep the conductor charged nearly to the instantaneous system voltage until the arc breaks. At that instant the switched conductor might be charged at any voltage in respect to ground from zero up to the peak voltage of the system, depending on the point in the voltage cycle at which the arc broke. If there is a transformer winding connected between the conductor and ground, the conductor will discharge to ground through the winding. If there is no path for the charge to leak away, the charge is said to be trapped on the conductor, and the conductor will remain at the potential it had when switched. The charge must be re-moved by the application of a ground before the conductor is safe to touch. Special consideration must be given conductors who are insulated by, dielectric materials other than air or gas. If a trapped charge or a constant voltage is left on such a conductor for a period of time, some of the charge (electrons) penetrates into the interior of the dielectric material. This is especially noticeable on wound insulations such as those in cables and in generator windings. The penetration occurs over a period of time and it also takes a period of time for the interior charges to return to the conductor. If a conductor who has been charged for a long time is grounded for a few seconds and the ground then removed, there will be no voltage on the conductor and it will appear at first that all charges have been removed. With time, however, the interior charges find their way back to the conductor and voltage will build up again. When an insulated conductor has been maintained at a direct voltage for a length of time, it is necessary from the standpoint of safety to ground the conductor for an extended period of time. If we switch out a conductor, remove the trapped charge, and then remove the ground wire, the conductor may still have a voltage on it. This voltage will not be due to any static: charge but will be due to alternating charges induced from nearby live conductors. We have in fact a voltage divider formed by two capacitors, one the capacitor formed by
Capacitance Concepts
72A-1974-01 Rev. B 3/05 7-151
the switched conductor and ground, and the other formed by the switched conductor and the live circuit. The voltage thus induced on the switched conductor can be quite dangerous. One particularly bad situation occurs on a double-circuit tower line where one circuit remains alive and the other circuit is switched out. In such cases the capacitances involved are large, so that the witched circuit, as well as being at a high-induced voltage, can have considerable stored energy.
The Effects of Temperature on Insulation Losses
72A-1974-01 Rev. B 3/05 8-152
Chapter 8 - The Effects of Temperature on Insulation Losses C.L. Dawes
Doble Engineering Company
8.1 Introduction In past conferences, the author has presented papers describing the several factors, which affect the electrical characteristics of gaseous, liquid, and solid insulation. Among these was temperature, which has important effects on the resistivity, powerloss, capacitivity, power-factor, deterioration, and failure of liquid and solid insulation. In planning the paper for this year, it was suggested that the effects of temperature on resistivity, losses, and power factor be analyzed, with particular reference to basic molecular structure. These effects have already been discussed in earlier papers in a more or less general way, (References (1), (2), (3) *), but in this paper more detailed analyses will be given and they will be related to the actual performance of insulation in service. It is well known that temperature has pronounced effects on resistivity, both of conductors and insulators, and it will be shown that these effects are due to the changes in the atomic and molecular phenomena in the insulation which occur when the temperature changes. Any analysis of current-flow through either electric conductors or through insulation is based on the fact that all electric conduction is the physical transport of charged particles through the volume of the material. Before studying insulation, it is important to know why electricity flows so readily through conductors, whereas insulation tends to prevent the flow of electricity.
8.2 Electric Conductors Electric conductors are almost always metallic. All materials consist of molecules which, in turn, consist of atoms. The atom consists of a positive nucleus called a proton, about which electrons rotate in orbits at different radii from the nucleus. (In copper there are 29 orbital electrons.) The positive charge on the nucleus is equal to the total negative charges of the electrons so that, normally, the atom is neutral electrically. The nucleus being positive and the electrons being negative charges, the electrons are held in their orbits by the resulting electrostatic force and this force tends to prevent their escape. In the metals, the electrons in the outermost orbits, called valence or conduction electrons, are held somewhat loosely by the nucleus and are more or less free to move from atom to atom. The radii of the electrons are small compared with the space between the molecules so that the electrons are quite free to pass through the volume of the metal. Hence, because of the large number of free electrons available to act as carriers and the ease with which they can pass through the volume of the metal, a relatively small difference of potential can produce a relatively large electron stream. Since the electrons are carriers of electric charges, a relatively large current, therefore, results from a small difference of potential. * Raised parenthetical numbers refer to Bibliography references, Page Sec. 3-220.
The Effects of Temperature on Insulation Losses
72A-1974-01 Rev. B 3/05 8-153
The principal obstacles to the movement of the electrons are the atoms and molecules of the metal, which lie in their paths and with which they collide, and they also collide with the other electrons. The flow of electrons is from the negative to the positive pole of the applied potential, which is opposite the conventional direction of current. If the potential difference is increased, although the number of free electrons may not have changed, their velocities are increased proportionately, resulting in a larger current and thus explaining Ohm's law. An increase of temperature is synonymous with an increase in the thermal agitation of all the electrons, thus increasing the probability of collision with the charge-carrying electrons. This increases the number of electron collisions and hence the resistance to the electron flows. The effect of thermal agitation is practically- proportional to the absolute temperature, which accounts for the well-known positive temperature coefficient of resistance of conductors. Also, the collisions of the charge-carrying electrons with other electrons and with the atoms of the metal develop heat, just as occurs with the usual mechanical collisions. This accounts for the heating of electrical conductors by current. The increase of resistance with temperature is just the opposite of what we would prefer, since for a given current the resistance loss is increased, further increasing the temperature, all of which reduces the current-carrying capacity (ampacity) of the conductor.
8.3 Insulators In contrast to the conductors who carry current readily, the insulators tend to prevent current flow. Unlike conductors, in insulating substances there are very few free electrons, a large proportion of the electrons being tightly bound to their atomic nucleii from which they are not readily detached. There is also a tendency for the nonconductors, or insulators, to occur among elements having an electron deficiency. Hence, when a potential difference is applied to an insulator, because of the lack of electron-carriers, the current is relatively small, and with some insulators, is almost nonexistent. The movement of charge in or out of the capacitor is in response to a change in the charging voltage. If the charging voltage is sinusoidal, we note that the voltage is changing most rapidly as the wave passes through zero, and the voltage does not change at all at the peaks of the wave. (See Figure 8-2.) The charging current is therefore greatest when the voltage passes through zero, and there is zero charging current at the voltage peaks. If we look at the waves of the applied voltage and the resulting current taken by the capacitor, we note that the current wave leads the voltage wave by 90°. Furthermore, if we determine the instantaneous energy in the capacitor by multiplying the voltage and current values for any instant of time, we find a double frequency energy wave. The capacitor stores up energy for a quarter of a cycle, and returns it to the system in the next quarter cycle. The net result is that the capacitor does not consume any energy.
8.3.1 Nonlinearity of Resistivity at Constant Temperature It has been shown that with conductors at constant temperature, the current is proportional to the voltage; that is, such conductors have linear resistivity characteristics. On the other hand, with insulators at constant temperature, the current is not proportional to the voltage so that their resistivity characteristic is nonlinear, it being often said that insulation "does not follow Ohm's law". It is now possible to account for this characteristic. When a voltage is applied to an insulator, there is first a transient displacement current id (Figure 8-5 in Reference (1 )) followed ultimately by the conduction current ig. This
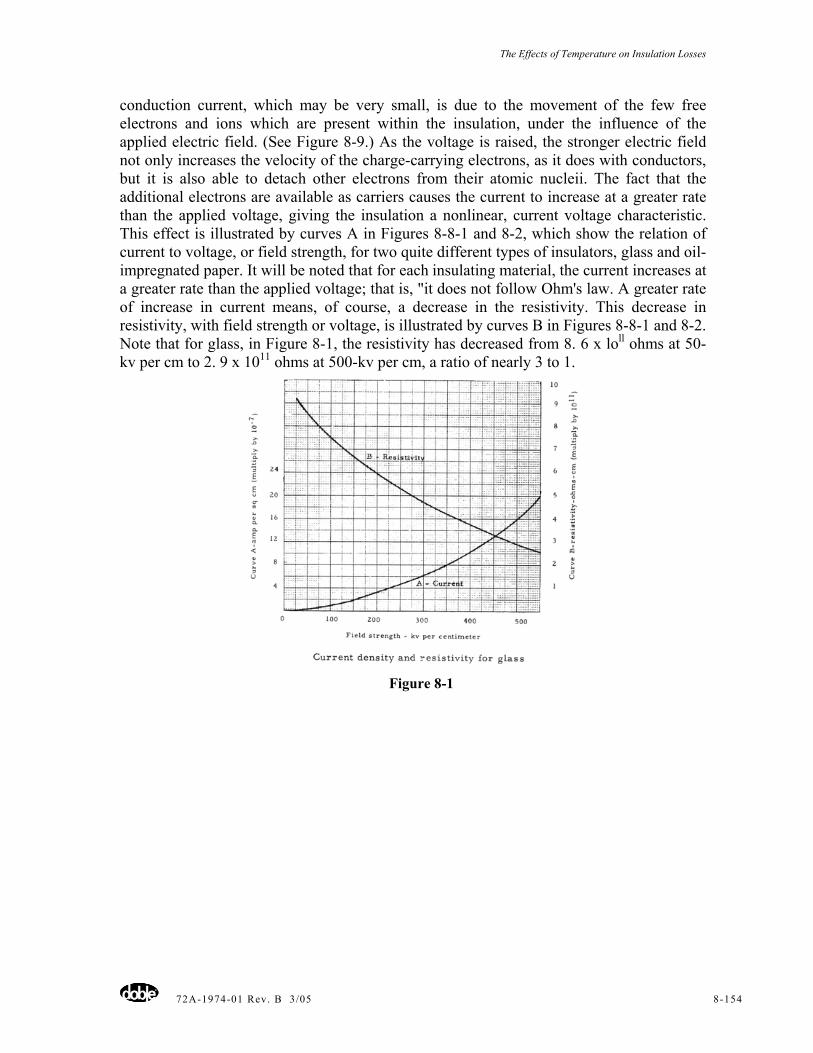
The Effects of Temperature on Insulation Losses
72A-1974-01 Rev. B 3/05 8-154
conduction current, which may be very small, is due to the movement of the few free electrons and ions which are present within the insulation, under the influence of the applied electric field. (See Figure 8-9.) As the voltage is raised, the stronger electric field not only increases the velocity of the charge-carrying electrons, as it does with conductors, but it is also able to detach other electrons from their atomic nucleii. The fact that the additional electrons are available as carriers causes the current to increase at a greater rate than the applied voltage, giving the insulation a nonlinear, current voltage characteristic. This effect is illustrated by curves A in Figures 8-8-1 and 8-2, which show the relation of current to voltage, or field strength, for two quite different types of insulators, glass and oil-impregnated paper. It will be noted that for each insulating material, the current increases at a greater rate than the applied voltage; that is, "it does not follow Ohm's law. A greater rate of increase in current means, of course, a decrease in the resistivity. This decrease in resistivity, with field strength or voltage, is illustrated by curves B in Figures 8-8-1 and 8-2. Note that for glass, in Figure 8-1, the resistivity has decreased from 8. 6 x loll ohms at 50-kv per cm to 2. 9 x 10¹¹ ohms at 500-kv per cm, a ratio of nearly 3 to 1.
Figure 8-1
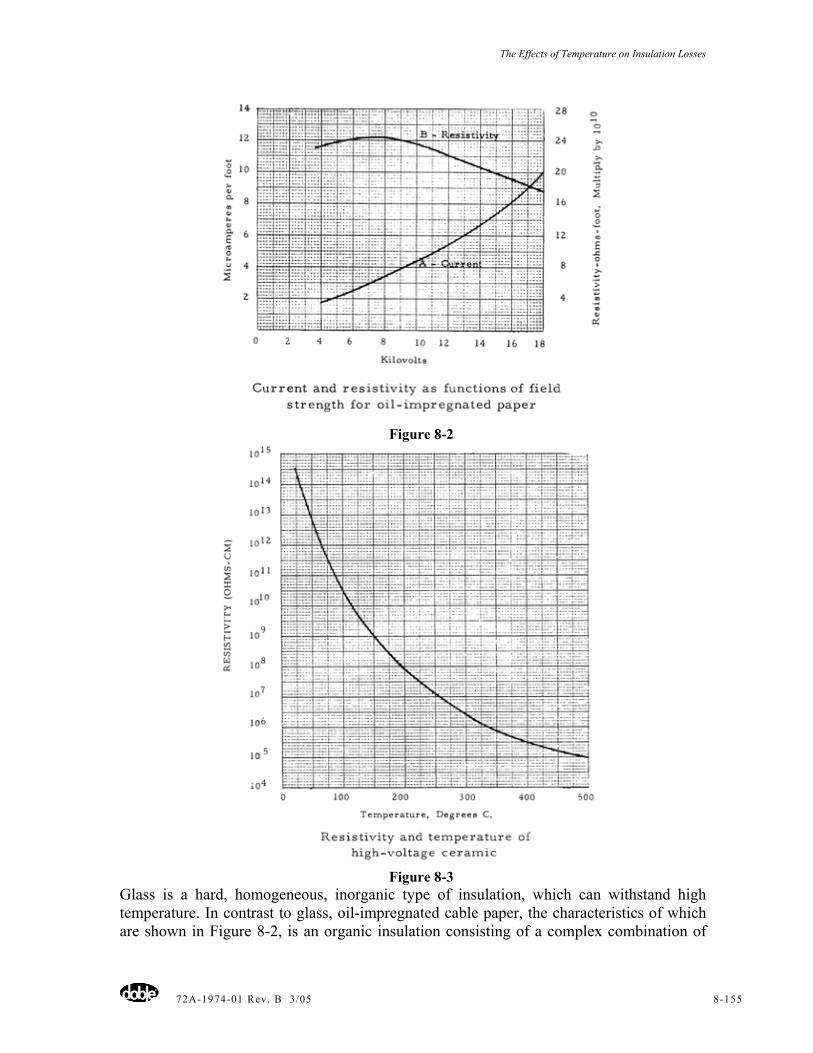
The Effects of Temperature on Insulation Losses
72A-1974-01 Rev. B 3/05 8-155
Figure 8-2
Figure 8-3
Glass is a hard, homogeneous, inorganic type of insulation, which can withstand high temperature. In contrast to glass, oil-impregnated cable paper, the characteristics of which are shown in Figure 8-2, is an organic insulation consisting of a complex combination of
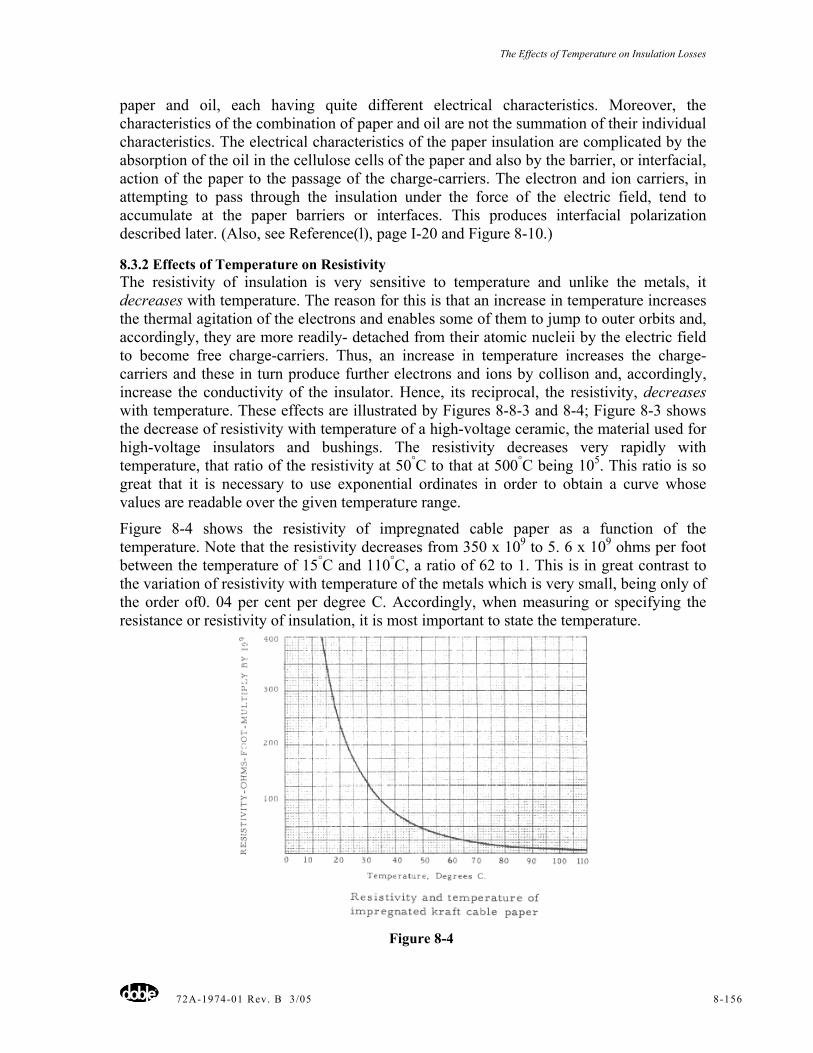
The Effects of Temperature on Insulation Losses
72A-1974-01 Rev. B 3/05 8-156
paper and oil, each having quite different electrical characteristics. Moreover, the characteristics of the combination of paper and oil are not the summation of their individual characteristics. The electrical characteristics of the paper insulation are complicated by the absorption of the oil in the cellulose cells of the paper and also by the barrier, or interfacial, action of the paper to the passage of the charge-carriers. The electron and ion carriers, in attempting to pass through the insulation under the force of the electric field, tend to accumulate at the paper barriers or interfaces. This produces interfacial polarization described later. (Also, see Reference(l), page I-20 and Figure 8-10.)
8.3.2 Effects of Temperature on Resistivity The resistivity of insulation is very sensitive to temperature and unlike the metals, it decreases with temperature. The reason for this is that an increase in temperature increases the thermal agitation of the electrons and enables some of them to jump to outer orbits and, accordingly, they are more readily- detached from their atomic nucleii by the electric field to become free charge-carriers. Thus, an increase in temperature increases the charge-carriers and these in turn produce further electrons and ions by collison and, accordingly, increase the conductivity of the insulator. Hence, its reciprocal, the resistivity, decreases with temperature. These effects are illustrated by Figures 8-8-3 and 8-4; Figure 8-3 shows the decrease of resistivity with temperature of a high-voltage ceramic, the material used for high-voltage insulators and bushings. The resistivity decreases very rapidly with temperature, that ratio of the resistivity at 50°C to that at 500°C being 105. This ratio is so great that it is necessary to use exponential ordinates in order to obtain a curve whose values are readable over the given temperature range.
Figure 8-4 shows the resistivity of impregnated cable paper as a function of the temperature. Note that the resistivity decreases from 350 x 109 to 5. 6 x 10⁹ ohms per foot between the temperature of 15°C and 110°C, a ratio of 62 to 1. This is in great contrast to the variation of resistivity with temperature of the metals which is very small, being only of the order of0. 04 per cent per degree C. Accordingly, when measuring or specifying the resistance or resistivity of insulation, it is most important to state the temperature.
Figure 8-4
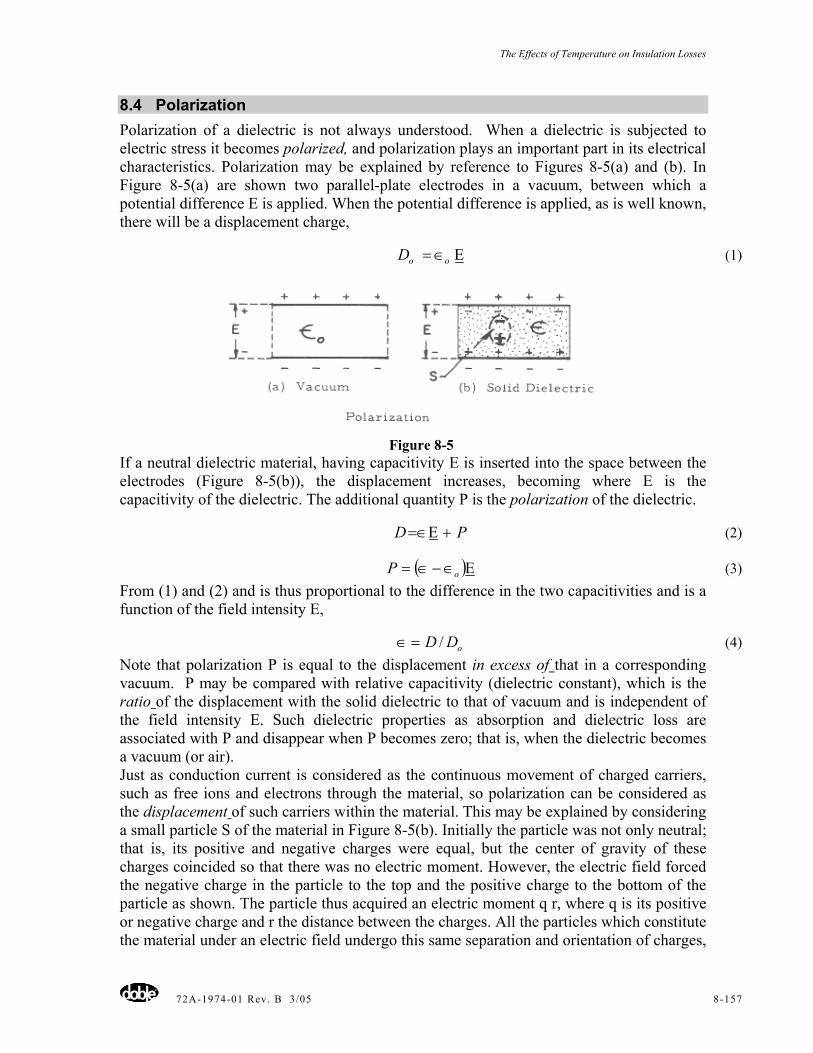
The Effects of Temperature on Insulation Losses
72A-1974-01 Rev. B 3/05 8-157
8.4 Polarization Polarization of a dielectric is not always understood. When a dielectric is subjected to electric stress it becomes polarized, and polarization plays an important part in its electrical characteristics. Polarization may be explained by reference to Figures 8-5(a) and (b). In Figure 8-5(a) are shown two parallel-plate electrodes in a vacuum, between which a potential difference E is applied. When the potential difference is applied, as is well known, there will be a displacement charge,
Ε∈= ooD (1)
Figure 8-5
If a neutral dielectric material, having capacitivity E is inserted into the space between the electrodes (Figure 8-5(b)), the displacement increases, becoming where E is the capacitivity of the dielectric. The additional quantity P is the polarization of the dielectric.
PD +Ε∈= (2)
( )Ε∈−∈= oP (3) From (1) and (2) and is thus proportional to the difference in the two capacitivities and is a function of the field intensity E,
oDD /=∈ (4) Note that polarization P is equal to the displacement in excess of that in a corresponding vacuum. P may be compared with relative capacitivity (dielectric constant), which is the ratio of the displacement with the solid dielectric to that of vacuum and is independent of the field intensity E. Such dielectric properties as absorption and dielectric loss are associated with P and disappear when P becomes zero; that is, when the dielectric becomes a vacuum (or air). Just as conduction current is considered as the continuous movement of charged carriers, such as free ions and electrons through the material, so polarization can be considered as the displacement of such carriers within the material. This may be explained by considering a small particle S of the material in Figure 8-5(b). Initially the particle was not only neutral; that is, its positive and negative charges were equal, but the center of gravity of these charges coincided so that there was no electric moment. However, the electric field forced the negative charge in the particle to the top and the positive charge to the bottom of the particle as shown. The particle thus acquired an electric moment q r, where q is its positive or negative charge and r the distance between the charges. All the particles which constitute the material under an electric field undergo this same separation and orientation of charges,
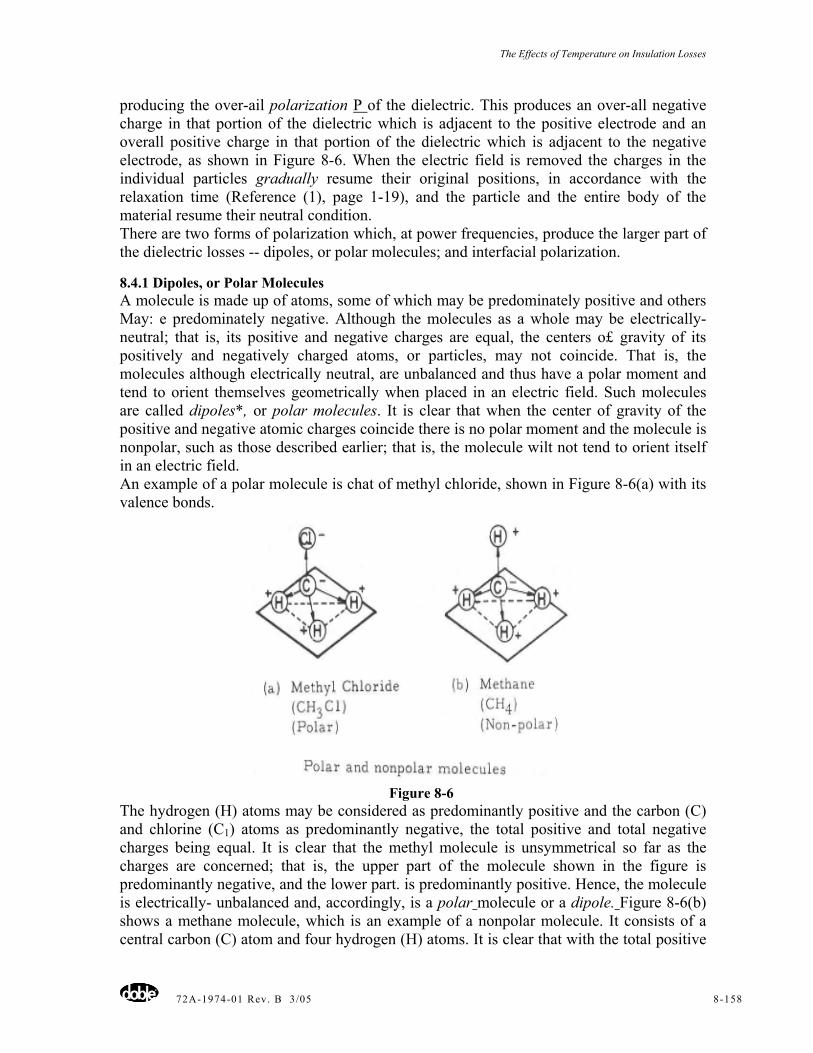
The Effects of Temperature on Insulation Losses
72A-1974-01 Rev. B 3/05 8-158
producing the over-ail polarization P of the dielectric. This produces an over-all negative charge in that portion of the dielectric which is adjacent to the positive electrode and an overall positive charge in that portion of the dielectric which is adjacent to the negative electrode, as shown in Figure 8-6. When the electric field is removed the charges in the individual particles gradually resume their original positions, in accordance with the relaxation time (Reference (1), page 1-19), and the particle and the entire body of the material resume their neutral condition. There are two forms of polarization which, at power frequencies, produce the larger part of the dielectric losses -- dipoles, or polar molecules; and interfacial polarization.
8.4.1 Dipoles, or Polar Molecules A molecule is made up of atoms, some of which may be predominately positive and others May: e predominately negative. Although the molecules as a whole may be electrically- neutral; that is, its positive and negative charges are equal, the centers o£ gravity of its positively and negatively charged atoms, or particles, may not coincide. That is, the molecules although electrically neutral, are unbalanced and thus have a polar moment and tend to orient themselves geometrically when placed in an electric field. Such molecules are called dipoles*, or polar molecules. It is clear that when the center of gravity of the positive and negative atomic charges coincide there is no polar moment and the molecule is nonpolar, such as those described earlier; that is, the molecule wilt not tend to orient itself in an electric field. An example of a polar molecule is chat of methyl chloride, shown in Figure 8-6(a) with its valence bonds.
Figure 8-6
The hydrogen (H) atoms may be considered as predominantly positive and the carbon (C) and chlorine (C1) atoms as predominantly negative, the total positive and total negative charges being equal. It is clear that the methyl molecule is unsymmetrical so far as the charges are concerned; that is, the upper part of the molecule shown in the figure is predominantly negative, and the lower part. is predominantly positive. Hence, the molecule is electrically- unbalanced and, accordingly, is a polar molecule or a dipole. Figure 8-6(b) shows a methane molecule, which is an example of a nonpolar molecule. It consists of a central carbon (C) atom and four hydrogen (H) atoms. It is clear that with the total positive
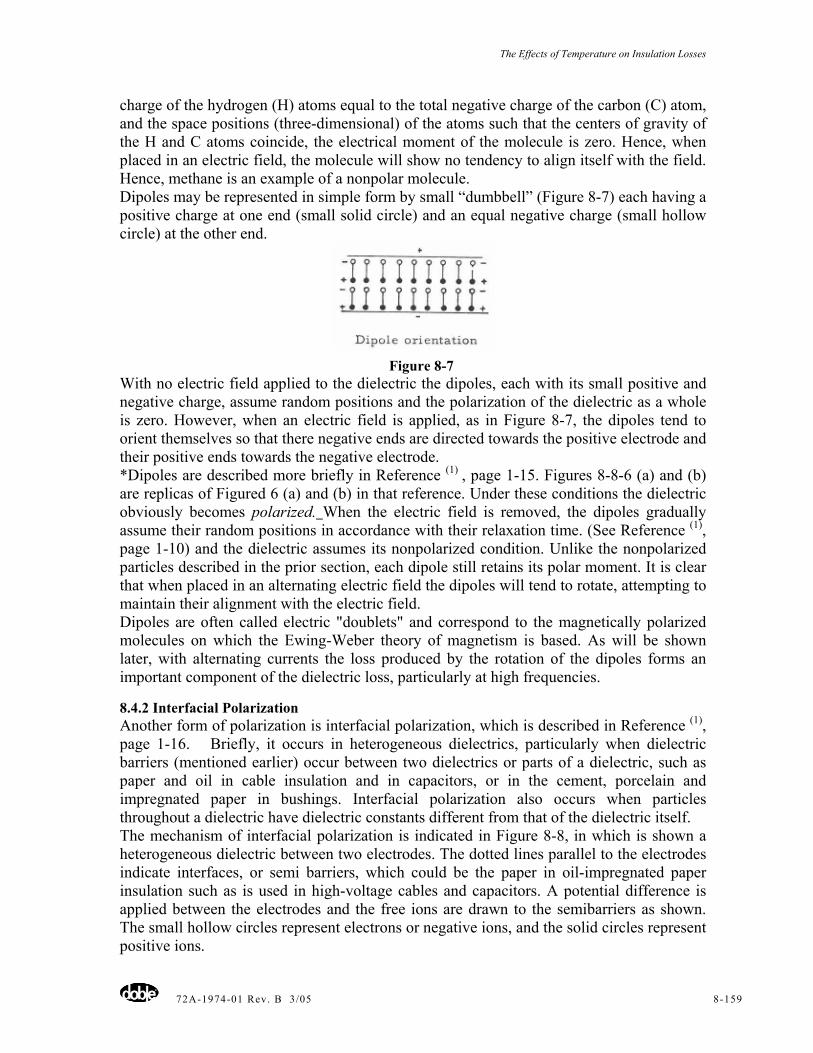
The Effects of Temperature on Insulation Losses
72A-1974-01 Rev. B 3/05 8-159
charge of the hydrogen (H) atoms equal to the total negative charge of the carbon (C) atom, and the space positions (three-dimensional) of the atoms such that the centers of gravity of the H and C atoms coincide, the electrical moment of the molecule is zero. Hence, when placed in an electric field, the molecule will show no tendency to align itself with the field. Hence, methane is an example of a nonpolar molecule. Dipoles may be represented in simple form by small “dumbbell” (Figure 8-7) each having a positive charge at one end (small solid circle) and an equal negative charge (small hollow circle) at the other end.
Figure 8-7
With no electric field applied to the dielectric the dipoles, each with its small positive and negative charge, assume random positions and the polarization of the dielectric as a whole is zero. However, when an electric field is applied, as in Figure 8-7, the dipoles tend to orient themselves so that there negative ends are directed towards the positive electrode and their positive ends towards the negative electrode. *Dipoles are described more briefly in Reference (1) , page 1-15. Figures 8-8-6 (a) and (b) are replicas of Figured 6 (a) and (b) in that reference. Under these conditions the dielectric obviously becomes polarized. When the electric field is removed, the dipoles gradually assume their random positions in accordance with their relaxation time. (See Reference (1), page 1-10) and the dielectric assumes its nonpolarized condition. Unlike the nonpolarized particles described in the prior section, each dipole still retains its polar moment. It is clear that when placed in an alternating electric field the dipoles will tend to rotate, attempting to maintain their alignment with the electric field. Dipoles are often called electric "doublets" and correspond to the magnetically polarized molecules on which the Ewing-Weber theory of magnetism is based. As will be shown later, with alternating currents the loss produced by the rotation of the dipoles forms an important component of the dielectric loss, particularly at high frequencies.
8.4.2 Interfacial Polarization Another form of polarization is interfacial polarization, which is described in Reference (1), page 1-16. Briefly, it occurs in heterogeneous dielectrics, particularly when dielectric barriers (mentioned earlier) occur between two dielectrics or parts of a dielectric, such as paper and oil in cable insulation and in capacitors, or in the cement, porcelain and impregnated paper in bushings. Interfacial polarization also occurs when particles throughout a dielectric have dielectric constants different from that of the dielectric itself. The mechanism of interfacial polarization is indicated in Figure 8-8, in which is shown a heterogeneous dielectric between two electrodes. The dotted lines parallel to the electrodes indicate interfaces, or semi barriers, which could be the paper in oil-impregnated paper insulation such as is used in high-voltage cables and capacitors. A potential difference is applied between the electrodes and the free ions are drawn to the semibarriers as shown. The small hollow circles represent electrons or negative ions, and the solid circles represent positive ions.
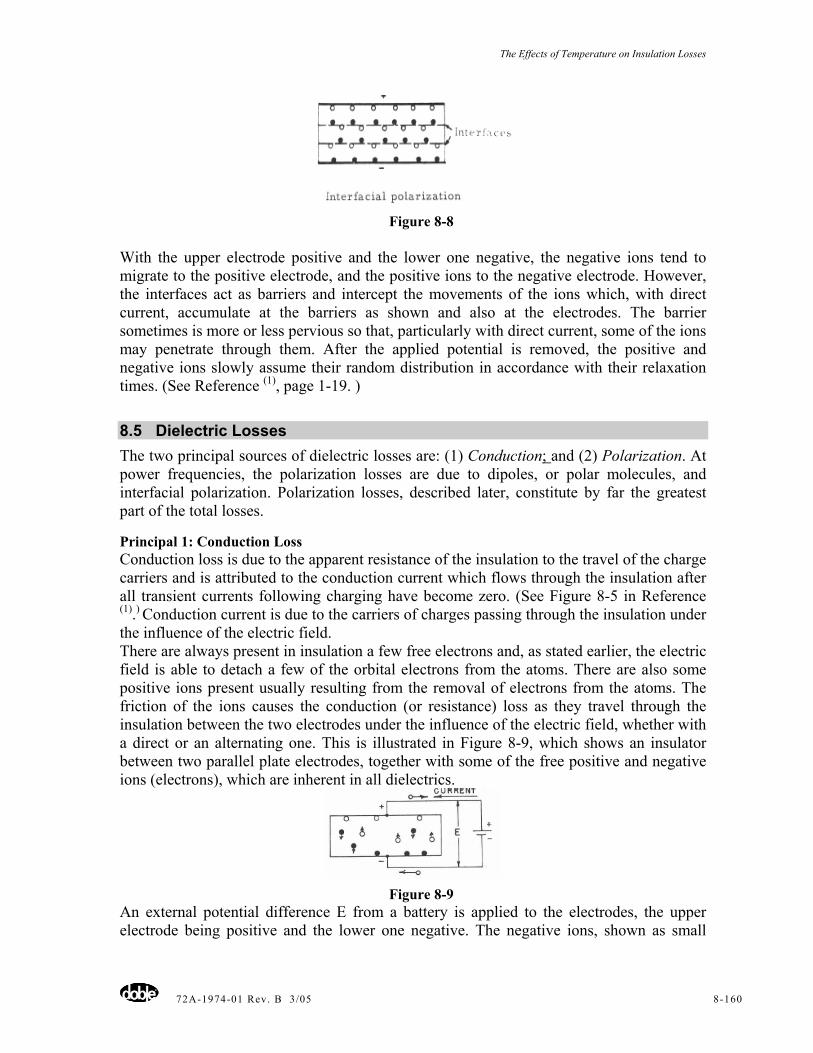
The Effects of Temperature on Insulation Losses
72A-1974-01 Rev. B 3/05 8-160
Figure 8-8
With the upper electrode positive and the lower one negative, the negative ions tend to migrate to the positive electrode, and the positive ions to the negative electrode. However, the interfaces act as barriers and intercept the movements of the ions which, with direct current, accumulate at the barriers as shown and also at the electrodes. The barrier sometimes is more or less pervious so that, particularly with direct current, some of the ions may penetrate through them. After the applied potential is removed, the positive and negative ions slowly assume their random distribution in accordance with their relaxation times. (See Reference (1), page 1-19. )
8.5 Dielectric Losses The two principal sources of dielectric losses are: (1) Conduction; and (2) Polarization. At power frequencies, the polarization losses are due to dipoles, or polar molecules, and interfacial polarization. Polarization losses, described later, constitute by far the greatest part of the total losses.
Principal 1: Conduction Loss Conduction loss is due to the apparent resistance of the insulation to the travel of the charge carriers and is attributed to the conduction current which flows through the insulation after all transient currents following charging have become zero. (See Figure 8-5 in Reference (1).) Conduction current is due to the carriers of charges passing through the insulation under the influence of the electric field. There are always present in insulation a few free electrons and, as stated earlier, the electric field is able to detach a few of the orbital electrons from the atoms. There are also some positive ions present usually resulting from the removal of electrons from the atoms. The friction of the ions causes the conduction (or resistance) loss as they travel through the insulation between the two electrodes under the influence of the electric field, whether with a direct or an alternating one. This is illustrated in Figure 8-9, which shows an insulator between two parallel plate electrodes, together with some of the free positive and negative ions (electrons), which are inherent in all dielectrics.
Figure 8-9
An external potential difference E from a battery is applied to the electrodes, the upper electrode being positive and the lower one negative. The negative ions, shown as small
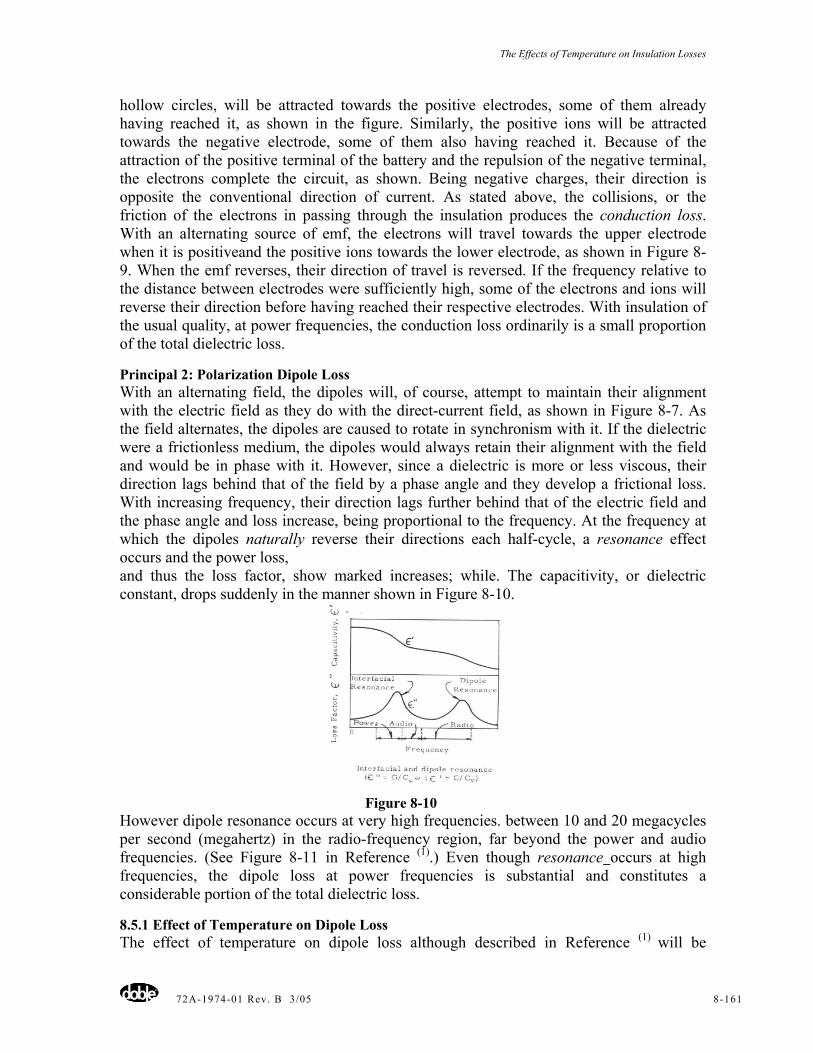
The Effects of Temperature on Insulation Losses
72A-1974-01 Rev. B 3/05 8-161
hollow circles, will be attracted towards the positive electrodes, some of them already having reached it, as shown in the figure. Similarly, the positive ions will be attracted towards the negative electrode, some of them also having reached it. Because of the attraction of the positive terminal of the battery and the repulsion of the negative terminal, the electrons complete the circuit, as shown. Being negative charges, their direction is opposite the conventional direction of current. As stated above, the collisions, or the friction of the electrons in passing through the insulation produces the conduction loss. With an alternating source of emf, the electrons will travel towards the upper electrode when it is positiveand the positive ions towards the lower electrode, as shown in Figure 8-9. When the emf reverses, their direction of travel is reversed. If the frequency relative to the distance between electrodes were sufficiently high, some of the electrons and ions will reverse their direction before having reached their respective electrodes. With insulation of the usual quality, at power frequencies, the conduction loss ordinarily is a small proportion of the total dielectric loss.
Principal 2: Polarization Dipole Loss With an alternating field, the dipoles will, of course, attempt to maintain their alignment with the electric field as they do with the direct-current field, as shown in Figure 8-7. As the field alternates, the dipoles are caused to rotate in synchronism with it. If the dielectric were a frictionless medium, the dipoles would always retain their alignment with the field and would be in phase with it. However, since a dielectric is more or less viscous, their direction lags behind that of the field by a phase angle and they develop a frictional loss. With increasing frequency, their direction lags further behind that of the electric field and the phase angle and loss increase, being proportional to the frequency. At the frequency at which the dipoles naturally reverse their directions each half-cycle, a resonance effect occurs and the power loss, and thus the loss factor, show marked increases; while. The capacitivity, or dielectric constant, drops suddenly in the manner shown in Figure 8-10.
Figure 8-10
However dipole resonance occurs at very high frequencies. between 10 and 20 megacycles per second (megahertz) in the radio-frequency region, far beyond the power and audio frequencies. (See Figure 8-11 in Reference (1).) Even though resonance occurs at high frequencies, the dipole loss at power frequencies is substantial and constitutes a considerable portion of the total dielectric loss.
8.5.1 Effect of Temperature on Dipole Loss The effect of temperature on dipole loss although described in Reference (1) will be
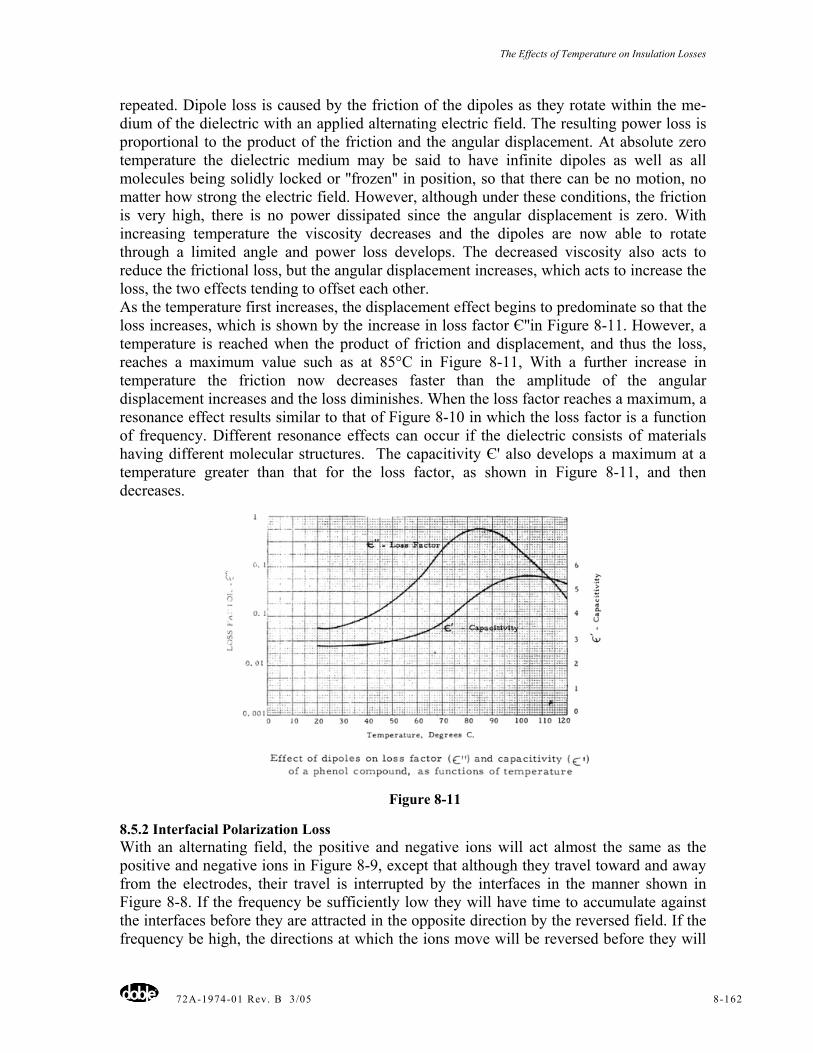
The Effects of Temperature on Insulation Losses
72A-1974-01 Rev. B 3/05 8-162
repeated. Dipole loss is caused by the friction of the dipoles as they rotate within the me-dium of the dielectric with an applied alternating electric field. The resulting power loss is proportional to the product of the friction and the angular displacement. At absolute zero temperature the dielectric medium may be said to have infinite dipoles as well as all molecules being solidly locked or ''frozen'' in position, so that there can be no motion, no matter how strong the electric field. However, although under these conditions, the friction is very high, there is no power dissipated since the angular displacement is zero. With increasing temperature the viscosity decreases and the dipoles are now able to rotate through a limited angle and power loss develops. The decreased viscosity also acts to reduce the frictional loss, but the angular displacement increases, which acts to increase the loss, the two effects tending to offset each other. As the temperature first increases, the displacement effect begins to predominate so that the loss increases, which is shown by the increase in loss factor Є''in Figure 8-11. However, a temperature is reached when the product of friction and displacement, and thus the loss, reaches a maximum value such as at 85°C in Figure 8-11, With a further increase in temperature the friction now decreases faster than the amplitude of the angular displacement increases and the loss diminishes. When the loss factor reaches a maximum, a resonance effect results similar to that of Figure 8-10 in which the loss factor is a function of frequency. Different resonance effects can occur if the dielectric consists of materials having different molecular structures. The capacitivity Є' also develops a maximum at a temperature greater than that for the loss factor, as shown in Figure 8-11, and then decreases.
Figure 8-11
8.5.2 Interfacial Polarization Loss With an alternating field, the positive and negative ions will act almost the same as the positive and negative ions in Figure 8-9, except that although they travel toward and away from the electrodes, their travel is interrupted by the interfaces in the manner shown in Figure 8-8. If the frequency be sufficiently low they will have time to accumulate against the interfaces before they are attracted in the opposite direction by the reversed field. If the frequency be high, the directions at which the ions move will be reversed before they will
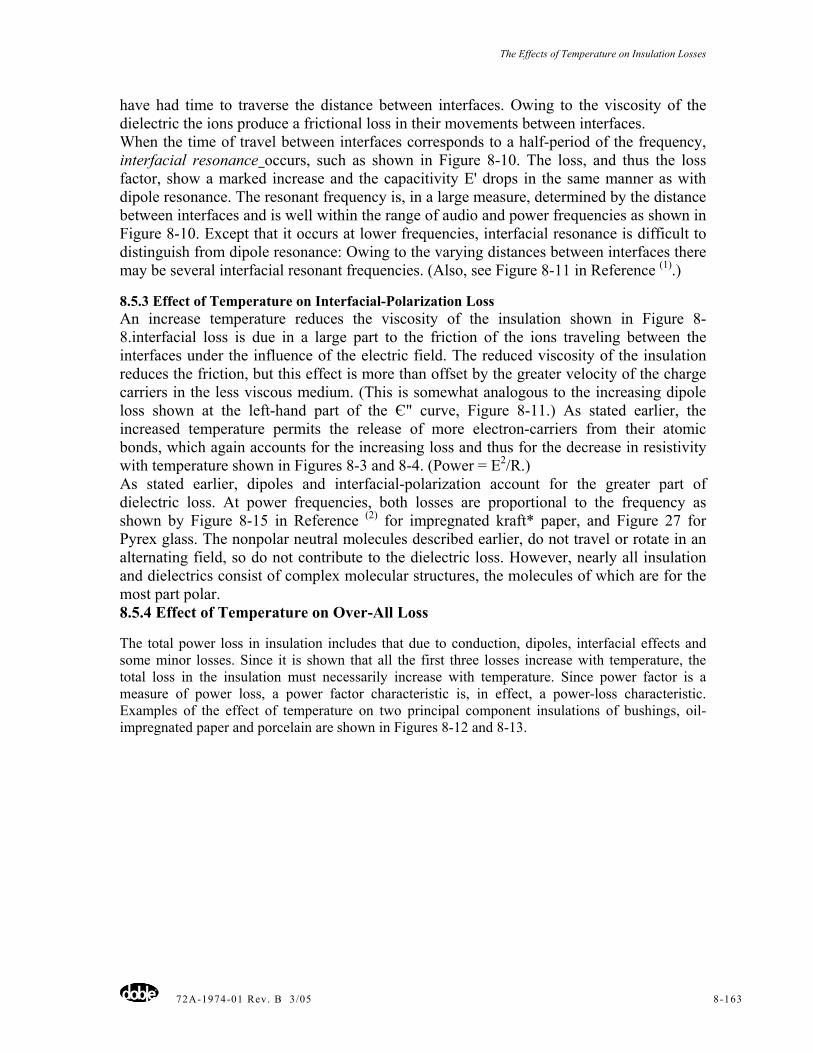
The Effects of Temperature on Insulation Losses
72A-1974-01 Rev. B 3/05 8-163
have had time to traverse the distance between interfaces. Owing to the viscosity of the dielectric the ions produce a frictional loss in their movements between interfaces. When the time of travel between interfaces corresponds to a half-period of the frequency, interfacial resonance occurs, such as shown in Figure 8-10. The loss, and thus the loss factor, show a marked increase and the capacitivity E' drops in the same manner as with dipole resonance. The resonant frequency is, in a large measure, determined by the distance between interfaces and is well within the range of audio and power frequencies as shown in Figure 8-10. Except that it occurs at lower frequencies, interfacial resonance is difficult to distinguish from dipole resonance: Owing to the varying distances between interfaces there may be several interfacial resonant frequencies. (Also, see Figure 8-11 in Reference (1).)
8.5.3 Effect of Temperature on Interfacial-Polarization Loss An increase temperature reduces the viscosity of the insulation shown in Figure 8-8.interfacial loss is due in a large part to the friction of the ions traveling between the interfaces under the influence of the electric field. The reduced viscosity of the insulation reduces the friction, but this effect is more than offset by the greater velocity of the charge carriers in the less viscous medium. (This is somewhat analogous to the increasing dipole loss shown at the left-hand part of the Є" curve, Figure 8-11.) As stated earlier, the increased temperature permits the release of more electron-carriers from their atomic bonds, which again accounts for the increasing loss and thus for the decrease in resistivity with temperature shown in Figures 8-3 and 8-4. (Power = E2/R.) As stated earlier, dipoles and interfacial-polarization account for the greater part of dielectric loss. At power frequencies, both losses are proportional to the frequency as shown by Figure 8-15 in Reference (2) for impregnated kraft* paper, and Figure 27 for Pyrex glass. The nonpolar neutral molecules described earlier, do not travel or rotate in an alternating field, so do not contribute to the dielectric loss. However, nearly all insulation and dielectrics consist of complex molecular structures, the molecules of which are for the most part polar. 8.5.4 Effect of Temperature on Over-All Loss
The total power loss in insulation includes that due to conduction, dipoles, interfacial effects and some minor losses. Since it is shown that all the first three losses increase with temperature, the total loss in the insulation must necessarily increase with temperature. Since power factor is a measure of power loss, a power factor characteristic is, in effect, a power-loss characteristic. Examples of the effect of temperature on two principal component insulations of bushings, oil-impregnated paper and porcelain are shown in Figures 8-12 and 8-13.
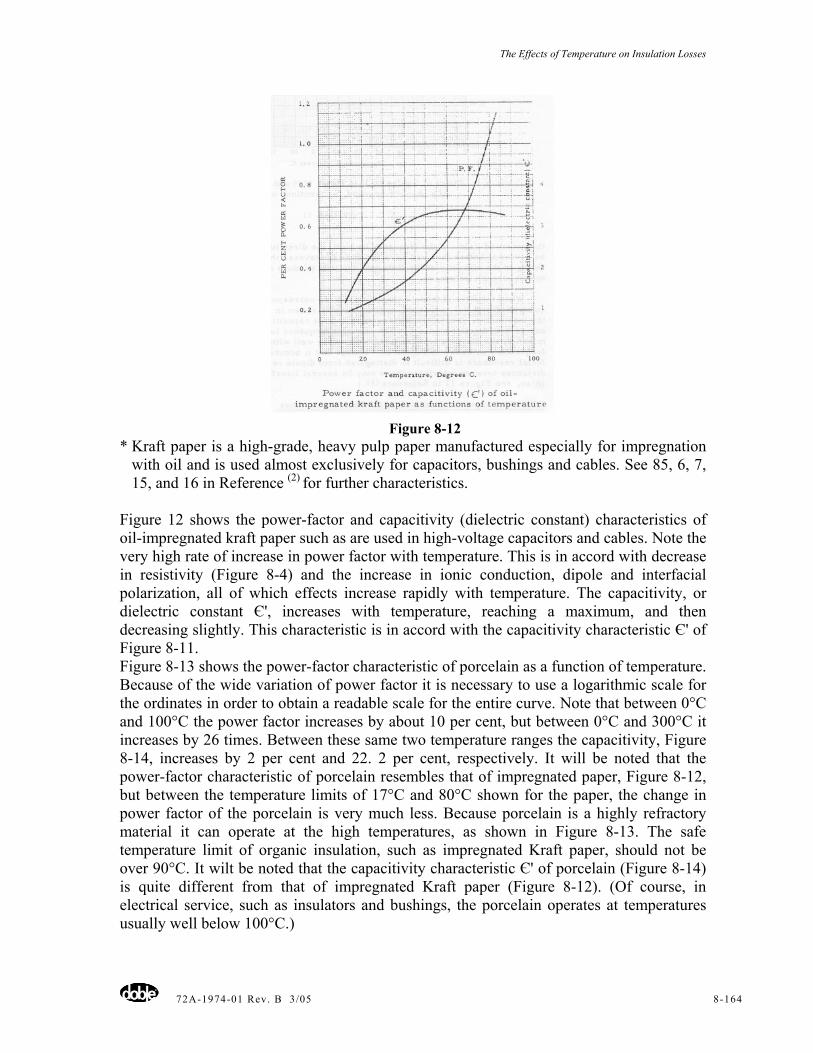
The Effects of Temperature on Insulation Losses
72A-1974-01 Rev. B 3/05 8-164
Figure 8-12
* Kraft paper is a high-grade, heavy pulp paper manufactured especially for impregnation with oil and is used almost exclusively for capacitors, bushings and cables. See 85, 6, 7, 15, and 16 in Reference (2) for further characteristics.
Figure 12 shows the power-factor and capacitivity (dielectric constant) characteristics of oil-impregnated kraft paper such as are used in high-voltage capacitors and cables. Note the very high rate of increase in power factor with temperature. This is in accord with decrease in resistivity (Figure 8-4) and the increase in ionic conduction, dipole and interfacial polarization, all of which effects increase rapidly with temperature. The capacitivity, or dielectric constant Є', increases with temperature, reaching a maximum, and then decreasing slightly. This characteristic is in accord with the capacitivity characteristic Є' of Figure 8-11. Figure 8-13 shows the power-factor characteristic of porcelain as a function of temperature. Because of the wide variation of power factor it is necessary to use a logarithmic scale for the ordinates in order to obtain a readable scale for the entire curve. Note that between 0°C and 100°C the power factor increases by about 10 per cent, but between 0°C and 300°C it increases by 26 times. Between these same two temperature ranges the capacitivity, Figure 8-14, increases by 2 per cent and 22. 2 per cent, respectively. It will be noted that the power-factor characteristic of porcelain resembles that of impregnated paper, Figure 8-12, but between the temperature limits of 17°C and 80°C shown for the paper, the change in power factor of the porcelain is very much less. Because porcelain is a highly refractory material it can operate at the high temperatures, as shown in Figure 8-13. The safe temperature limit of organic insulation, such as impregnated Kraft paper, should not be over 90°C. It wilt be noted that the capacitivity characteristic Є' of porcelain (Figure 8-14) is quite different from that of impregnated Kraft paper (Figure 8-12). (Of course, in electrical service, such as insulators and bushings, the porcelain operates at temperatures usually well below 100°C.)
The Effects of Temperature on Insulation Losses
72A-1974-01 Rev. B 3/05 8-165
Figure 8-13 Figure 8-14
The general character of the power-factor curves of Figures 8-12 and 8-13 are in accord with the effects of temperature shown earlier on the basic elements of insulation; that is, on the electrons, ions, dipoles and interfacial action. Thus, an increase in temperature produces conditions that cause the charge-carriers to develop greater, tosses, and these are reflected in an increase of the over-all power factor of the insulation shown in Figures 8-12 and 13.
8.5.4 Thermal Instability Since heating reduces the resistivity of insulation (Figures 8-3 and 8-4), the leakage current increases with temperature. This leakage current further increases the heating of the insulation, reducing still more the resistivity. At the higher voltages, particularly, a condition of instability may develop, in which the cumulative heating due to the combined effects of the leakage current and the dielectric loss are greater than the heat-dissipating capability of the insulation. A runaway condition then develops the temperature of the insulation then becoming so high that complete failure occurs. This instability effect is illustrated by Figure 8-17 in Reference (3), which analyzes in some detail the instability characteristics of varnished cambric.
8.6 Deterioration and Temperature As is well known, excessive temperatures produce rapid physical deterioration, chemical decomposition, and ultimately destruction of organic insulation. Even at moderately high temperatures well below the disintegration temperature and often below the recommended
The Effects of Temperature on Insulation Losses
72A-1974-01 Rev. B 3/05 8-166
operating temperature, organic insulations dry out, become brittle, crack, and even at low voltages, failures and short circuits occur. An excessive temperature are sometimes produced by unfavorable ambient conditions, as in the case of wires near a furnace or in a boiler room, or wire and cables in close proximity to steam pipes. However, usually the high temperatures are produced within the insulation itself by overloaded electrical conductors or by high dielectric loss, sometimes by a combination of the two. Heating loosens or severs the linkage bonds within the organic molecules, thus releasing more electrons, hence more carriers, and so increases the conductivity and hence the power loss. This is followed by chemical disintegration and carbonization of the insulation, and the resulting short-circuit currents destroy the insulation completely.
8.7 Power Losses in Bushings The sources of losses in organic and inorganic insulating materials, such as are used for high-voltage insulations have been related to their molecular and ionic structure and to the effects of temperature. It is shown that increasing temperature increases the conduction losses and the other alternating-current losses, all due in a large measure to the greater number of electrons and ions which the higher temperatures release and make available as carriers, The insulating materials whose characteristics have been analyzed consist of organic material such as kraft paper impregnated with oil, and inorganic materials such as porcelain and similar ceramics. Bushings, which, of course, form an important element of high-voltage insulation, may consist of porcelain alone, but usually they are a combination of organic materials, such as oil- and resin-impregnated paper within an oil-filled porcelain enclosure. The insulation of the bushing is thus a complex series-parallel arrangement of these two types of insulation. Accordingly, the power-factor characteristics of bushings will be a composite of those of these two types of insulation although, of course, it is not possible to determine accurately the quantitive effect of each. The power-factor - temperature curves used as test limits for General Electric bushing types with a brief statement descriptive of the constituent types of insulation of each are shown in Figure 8-15. It will be noted that the characteristics of the Type L and Type F.
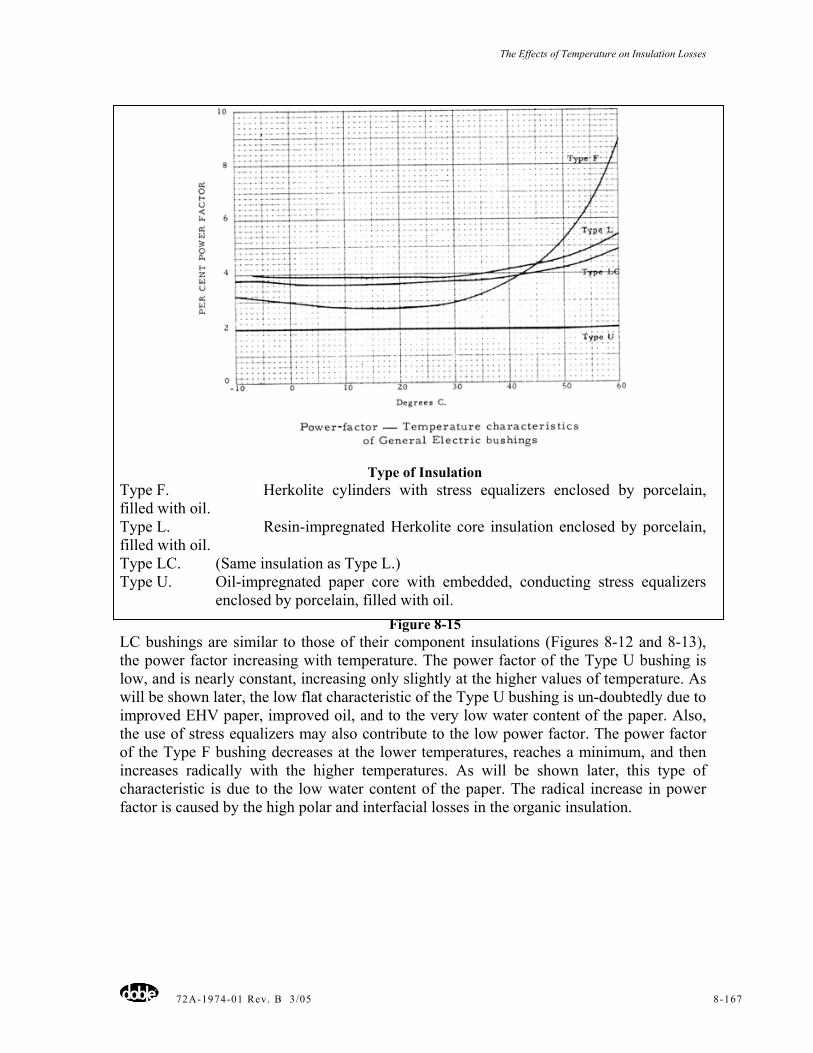
The Effects of Temperature on Insulation Losses
72A-1974-01 Rev. B 3/05 8-167
Type of Insulation Type F. Herkolite cylinders with stress equalizers enclosed by porcelain, filled with oil. Type L. Resin-impregnated Herkolite core insulation enclosed by porcelain, filled with oil. Type LC. (Same insulation as Type L.) Type U. Oil-impregnated paper core with embedded, conducting stress equalizers
enclosed by porcelain, filled with oil. Figure 8-15
LC bushings are similar to those of their component insulations (Figures 8-12 and 8-13), the power factor increasing with temperature. The power factor of the Type U bushing is low, and is nearly constant, increasing only slightly at the higher values of temperature. As will be shown later, the low flat characteristic of the Type U bushing is un-doubtedly due to improved EHV paper, improved oil, and to the very low water content of the paper. Also, the use of stress equalizers may also contribute to the low power factor. The power factor of the Type F bushing decreases at the lower temperatures, reaches a minimum, and then increases radically with the higher temperatures. As will be shown later, this type of characteristic is due to the low water content of the paper. The radical increase in power factor is caused by the high polar and interfacial losses in the organic insulation.
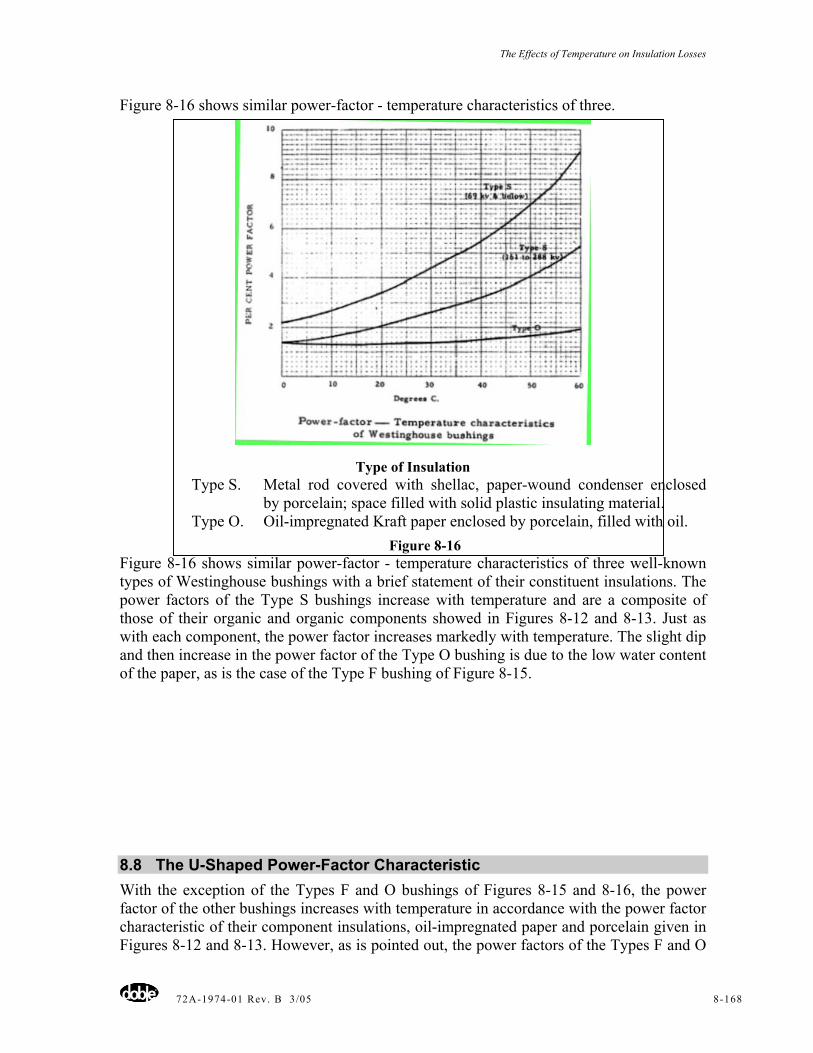
The Effects of Temperature on Insulation Losses
72A-1974-01 Rev. B 3/05 8-168
Figure 8-16 shows similar power-factor - temperature characteristics of three.
Type of Insulation Type S. Metal rod covered with shellac, paper-wound condenser enclosed
by porcelain; space filled with solid plastic insulating material. Type O. Oil-impregnated Kraft paper enclosed by porcelain, filled with oil.
Figure 8-16 Figure 8-16 shows similar power-factor - temperature characteristics of three well-known types of Westinghouse bushings with a brief statement of their constituent insulations. The power factors of the Type S bushings increase with temperature and are a composite of those of their organic and organic components showed in Figures 8-12 and 8-13. Just as with each component, the power factor increases markedly with temperature. The slight dip and then increase in the power factor of the Type O bushing is due to the low water content of the paper, as is the case of the Type F bushing of Figure 8-15.
8.8 The U-Shaped Power-Factor Characteristic With the exception of the Types F and O bushings of Figures 8-15 and 8-16, the power factor of the other bushings increases with temperature in accordance with the power factor characteristic of their component insulations, oil-impregnated paper and porcelain given in Figures 8-12 and 8-13. However, as is pointed out, the power factors of the Types F and O
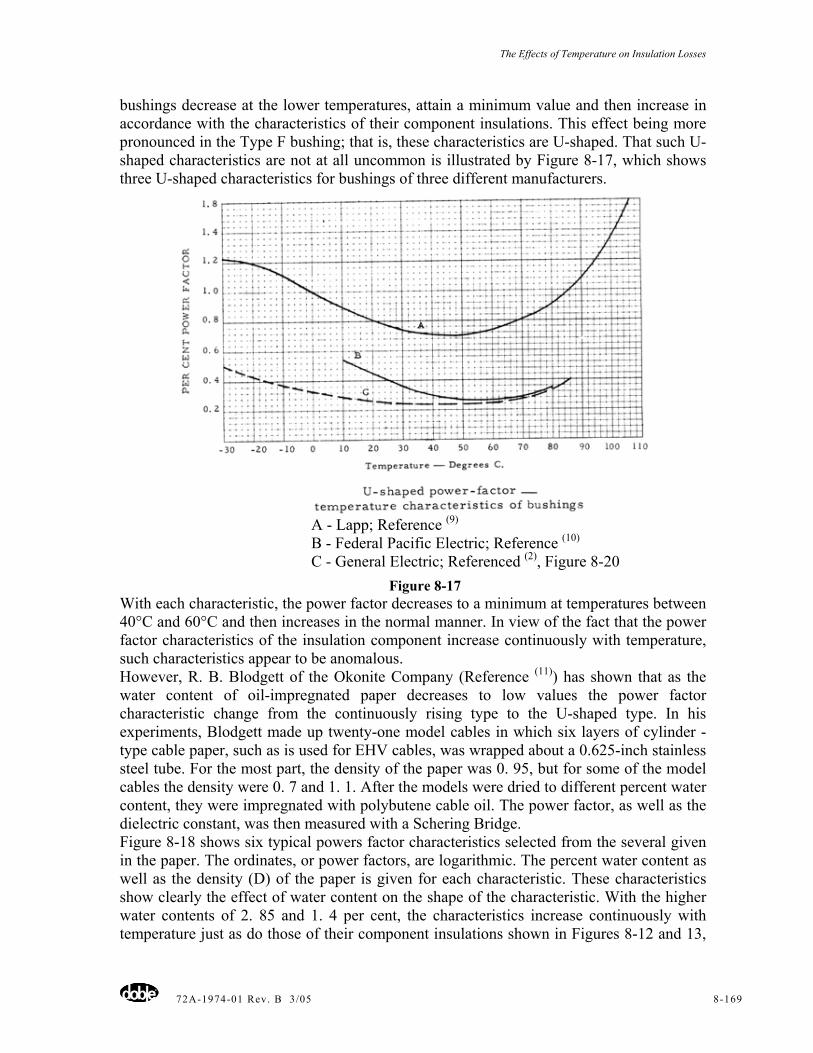
The Effects of Temperature on Insulation Losses
72A-1974-01 Rev. B 3/05 8-169
bushings decrease at the lower temperatures, attain a minimum value and then increase in accordance with the characteristics of their component insulations. This effect being more pronounced in the Type F bushing; that is, these characteristics are U-shaped. That such U-shaped characteristics are not at all uncommon is illustrated by Figure 8-17, which shows three U-shaped characteristics for bushings of three different manufacturers.
A - Lapp; Reference (9)
B - Federal Pacific Electric; Reference (10) C - General Electric; Referenced (2), Figure 8-20
Figure 8-17 With each characteristic, the power factor decreases to a minimum at temperatures between 40°C and 60°C and then increases in the normal manner. In view of the fact that the power factor characteristics of the insulation component increase continuously with temperature, such characteristics appear to be anomalous. However, R. B. Blodgett of the Okonite Company (Reference (11)) has shown that as the water content of oil-impregnated paper decreases to low values the power factor characteristic change from the continuously rising type to the U-shaped type. In his experiments, Blodgett made up twenty-one model cables in which six layers of cylinder -type cable paper, such as is used for EHV cables, was wrapped about a 0.625-inch stainless steel tube. For the most part, the density of the paper was 0. 95, but for some of the model cables the density were 0. 7 and 1. 1. After the models were dried to different percent water content, they were impregnated with polybutene cable oil. The power factor, as well as the dielectric constant, was then measured with a Schering Bridge. Figure 8-18 shows six typical powers factor characteristics selected from the several given in the paper. The ordinates, or power factors, are logarithmic. The percent water content as well as the density (D) of the paper is given for each characteristic. These characteristics show clearly the effect of water content on the shape of the characteristic. With the higher water contents of 2. 85 and 1. 4 per cent, the characteristics increase continuously with temperature just as do those of their component insulations shown in Figures 8-12 and 13,
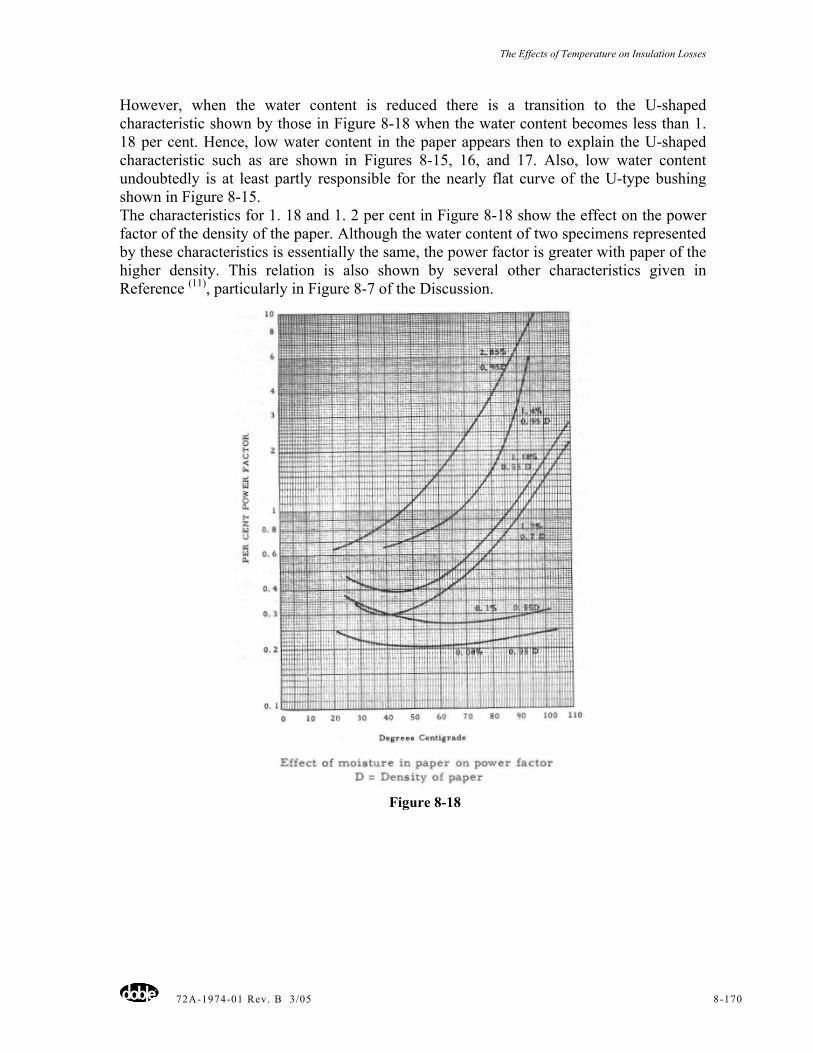
The Effects of Temperature on Insulation Losses
72A-1974-01 Rev. B 3/05 8-170
However, when the water content is reduced there is a transition to the U-shaped characteristic shown by those in Figure 8-18 when the water content becomes less than 1. 18 per cent. Hence, low water content in the paper appears then to explain the U-shaped characteristic such as are shown in Figures 8-15, 16, and 17. Also, low water content undoubtedly is at least partly responsible for the nearly flat curve of the U-type bushing shown in Figure 8-15. The characteristics for 1. 18 and 1. 2 per cent in Figure 8-18 show the effect on the power factor of the density of the paper. Although the water content of two specimens represented by these characteristics is essentially the same, the power factor is greater with paper of the higher density. This relation is also shown by several other characteristics given in Reference (11), particularly in Figure 8-7 of the Discussion.
Figure 8-18
The Effects of Temperature on Insulation Losses
72A-1974-01 Rev. B 3/05 8-171
Because of the complexity of the impregnated paper insulation, consisting of the paper itself with its cellular structure, in combination with an absorbed oil having its own molecular structure and also water absorbed in the cellulose of the paper, it is not simple to analyze the effects of temperature on the charge-carriers that account for the power factor. However, one possible explanation is that at the lower temperature the cellulose cells release fewer charge carriers; as the temperature increases at some intermediate temperature more electron charge carriers begin to be released with rising temperature, increasing the power loss in the manner described earlier. (It should also be noted that the loss factor of the phenol compound shown in Figure 8-11 decreases when the temperature becomes greater than 80°C.)
8.9 Table of Multipliers for Converting Power Factors to 20°C Temperature Inasmuch as the power factor of some bushings varies with temperature, the variation being quite marked in the older ones, in testing it is important to know whether a power factor above normal is due to deterioration, or whether it is due to a high operating temperature. Thus, to determine whether or not deterioration exists it is necessary to know the power-factor-temperature characteristic of each type of bushing. It has become the practice to use such characteristics to convert test results to a standard temperature of 20°C. The procedure is described in a paper by A. L. Rickley and R. E. Clark (Reference (7)). From test experience and a large amount of test data, the well-known Table of Multipliers for converting power factors at test temperatures to power factors at 20°C for different types of bushings, as well as transformer insulation has been prepared. This, of course, recognizes the effects of temperature, simplifies the correction procedure, and makes a standard com-parison at the single temperature of 20°C possible. In this paper it is attempted to show that the behavior of high-voltage insulations with temperature is closely related to the behavior of the molecules, ions and electrons under the effects of temperature. An excellent example of favorable ionic and electronic behavior is oil-impregnated paper insulation. There is no organic insulating material, which can even approach this material in high dielectric strength or in reliability for high-voltage operation. There are several reasons for this. The interfacial or barrier action of the paper layer prevents the free movement of the carrier ions between the electrodes and thus reduces the incipient paths of dielectric breakdown. The chance that any single defect in any individual paper layer lining up with a similar one in other layers is remote. Before applying the liquid impregnant the paper can be subjected to high vacuum removing nearly all gases and moisture, and the oil, with all gas and moisture removed under high vacuum, is then applied and maintained under pressure so that there is almost no opportunity for the formation of voids and the resulting ionization to occur. (See last year's paper (Reference (5), ''Effect of Corona and Ionization on Dielectrics".) For example, reference is made to a high-molecular type of polyethylene. The advances, not only in the foregoing types of insulation but also in polymer insulation such as polyethylene, particularly the high-molecular type, have been greatly accelerated by knowledge of their molecular structures, including the atom and its associated electrons, and their behavior in electric fields. As has been briefly discussed in earlier papers, temperature has an important effect on the breakdown or failure of insulations. Again, this is closely related to the behavior of their ions and their molecules under the influence of temperature and electric stress. Obviously, space does not permit its inclusion in this paper, but it is planned to devote a future paper to
The Effects of Temperature on Insulation Losses
72A-1974-01 Rev. B 3/05 8-172
it. The author is indebted to his associates at the Doble Engineering Company who made valuable suggestions and supplied some of the material for this paper.
The Effects of Temperature on Insulation Losses
72A-1974-01 Rev. B 3/05 8-173
Bibliography 1. Dielectric Theory and Practice – C. L. Dawes and E. H. Povey. Summary. Minutes
of the Twenty-Ninth Annual Conference of Doble Clients, 1962 Sec. 1A-301. 2. Various Types and Applications of Electrical Insulator – C. L. Dawes and E. H.
Povey Summary. Minutes of the Thirtieth Annual Conference of Doble Clients, 1963, 2-401.
3. Mechanisms of the Electric breakdown of Dielectric - C. L. Dawes. Minutes of the Thirty-First Annual Conference of Doble Clients, 1964, Sec 2-201.
4. Dielectric Materials and Applications (a book) - Arthur Von Hippel, Technology Press of M.I.T. and John Wiley & Sons.
Direct-Current Testing of Insulation and High Voltage Direct-Current Withstand Testing
72A-1974-01 Rev. B 3/05 9-174
Chapter 9 - DC Testing of Insulation and High Voltage DC Withstand Testing
C.L. Dawes Doble Engineering Company
9.1 Introduction Although direct current testing of insulation has long been common, it has recently assumed much greater importance and interest, particularly at high voltages, because of the recent rapid developments in high-voltage direct-current transmission and the necessary equipment and accessories, including cables. Although direct-current tests describe only limited properties of the insulation, the information, which they give, when combined with that from other tests, may add much to the knowledge of the state of the insulation system. When a high-potential test must be applied to a test specimen of high capacitance, even though this specimen is to operate in an alternating-current system, a direct-current test voltage is often used because the size of the test equipment can be small. With an alternating voltage the test specimen is charged first in one polarity and then in the other at the frequency of the test voltage. With a direct-current voltage the test specimen is only charged once, and the power requirement can be made small by regulating the rate-of-rise of the test voltage. As is well known, when a direct-current voltage is first applied to insulation, the current first undergoes a transient condition before reaching the steady leakage-current value. On short-circuit a transient current of opposite polarity discharges the insulation. Although these conditions are well known and have been presented at an earlier Conference (l)*, a review may well serve as background in the actual applications of direct-current testing to electrical apparatus, particularly at high voltage. All electrical insulation systems have capacitance and that of cables and large generators is considerable. When a direct-current voltage is suddenly applied to electrical insulation, the initial instantaneous current reaches a very high value and almost instantaneously drops to a moderate value, which decreases with time, ultimately reaching a constant value. This is illustrated in Figure 9-1, in which the total current, i, may be considered as consisting of four components. One component, id, which charges the geometrical capacitance and is called the displacement current, reaches a very high instantaneous value and drops to zero almost instantly. This component, which accounts for the initial high value of the instantaneous current, may be represented by the equation for charging a capacitance Co through resistance RV,
( ) ampREi ov CRtvd
// −∈= (1)
Where E is the applied voltage; t the time in seconds; C the Napierian logarithmic base, and Rv the resistance of the voltage supply circuit. A second component, ir, of the total current i is called the polarization or reversible absorption current and is due to the polarization and absorption (4) in the insulation. * Raised parenthetical numbers refer to the References, Page 16. For further discussions, see References (2) and (3).
Direct-Current Testing of Insulation and High Voltage Direct-Current Withstand Testing
72A-1974-01 Rev. B 3/05 9-175
Both of these effects are discussed in(1) and (4). The equation for this curve is,
at
or ECi−∈= (2)
or
nbt
or ECi−
= (3)
In which a, b, n are Constants. A third component of the total current, i, is iir, called the irreversible charging current and it appears to follow the same equation as that of the reversible charging current, ir. Its magnitude is much less and its time-integral represents the charge given to the dielectric, which is not recoverable. Its mechanism and laws are not completely understood but at high voltages it probably includes ionization currents. A further component of current, ic, is the conduction current. It is the steady current which remains after the three transient currents id, ir, and ii, have become zero, and it is due to the resistance Re of the insulation (Rc=E/ic). However, this resistance differs somewhat from that of the metals. In the metals there is a large number of valence or charge-carrying electrons that are more or less free to move between the atoms when a potential difference is applied and a small potential difference can produce a relatively large current. (See Reference (4).) Resistance is due largely to the collisions of these electrons with the atoms and other electrons of the metal. With the insulators there is an electron deficiency and the electrons are tightly bound to their atomic nucleii. Hence it requires a relatively large potential difference to detach such electrons from their atomic nucleii to become charge carriers. Insulation resistance, Rv, is largely due to the collision of these charged carriers with other molecules as they move through the insulation under the influence of the electric field, and such collisions cause a loss of energy which becomes apparent as heat and accounts for the do insulation loss. (See Figure 9-9 in Reference (4).) The resistance Rv varies with both the voltage and temperature. The variation with voltage is due to the fact that an increased electric field detaches more charge-carrying electrons from their atomic nucleii, as well as increasing the velocities of the charge carriers. Also, when the insulation contains moisture, which is almost always present, even if to a very small degree, a decrease in resistivity with an. increase in voltage or field intensity is attributed to "electric endosmose", an effect discovered by Evershed (6), which is discussed later. Because the resistance of a given insulation varies with the voltage, or in other words the conduction current, ic, is not proportional to the voltage, it is often stated that ''insulation does not follow Ohm's law''. Actually, Ohm's law, which states that the current is equal to E/R, is fundamental and therefore is inviolable. As long as the resistance is constant, the current is proportional to the voltage. However, since the resistance of insulation varies; that is, it is nonlinear, the current in it is not proportional to the voltage. The measured resistance is that for one particular value of current. For this reason is is often called the inferred conduction current, and accordingly, insulation circuits are nonlinear. Unlike the metallic conductors, the resistivity of insulators not only decreases with increase in temperature, but the variations with temperature are extremely large, as shown by Figures 2 and 5 in this paper and by Figures 3 and 4 in Reference (4).
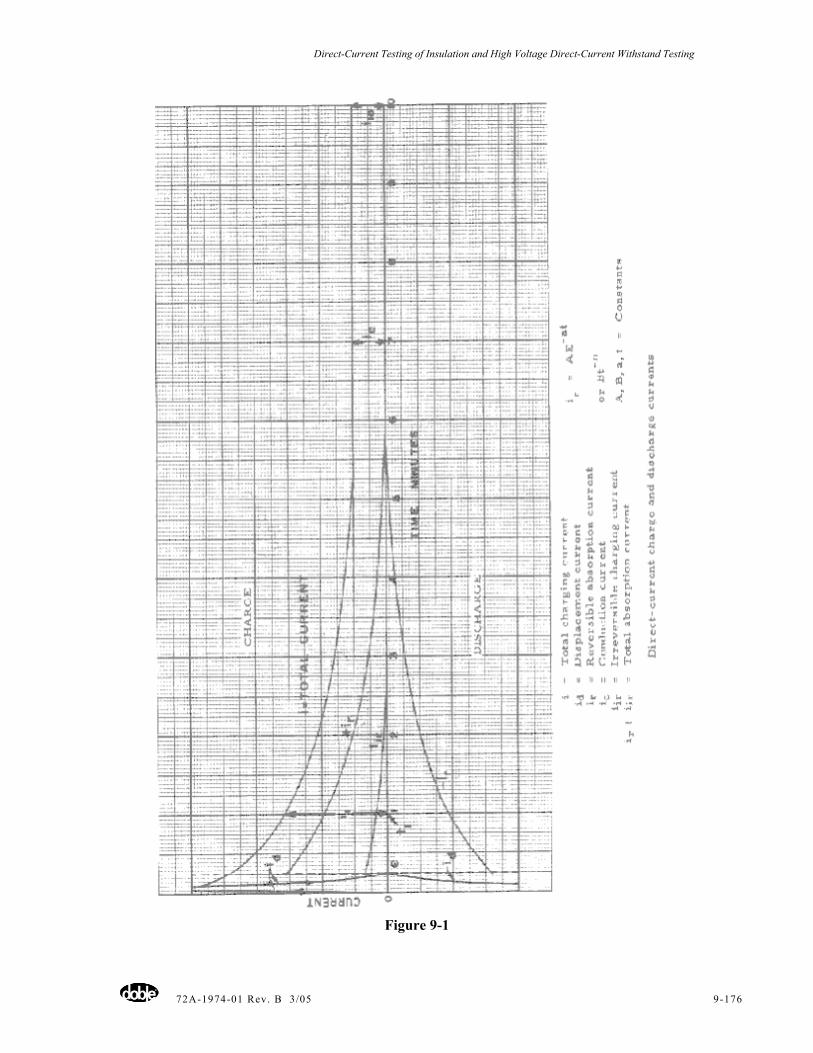
Direct-Current Testing of Insulation and High Voltage Direct-Current Withstand Testing
72A-1974-01 Rev. B 3/05 9-176
Figure 9-1
Direct-Current Testing of Insulation and High Voltage Direct-Current Withstand Testing
72A-1974-01 Rev. B 3/05 9-177
9.2 Discharge In Figure 9-1 also are shown the conditions when an electrified dielectric is short-cir-cuited. The current - id is the negative displacement current, which discharges the charge stored in the geometric capacitance of the system, and is a negative replica of - id. It begins with a high negative value and reaches zero in almost zero time. The current - ir is a mirror of the reversible charging current, + ir, and its time integral represents the charge due to absorption and polarization, which is recovered. In practice, it’s more convenient to obtain the reversible charging current characteristic during discharge rather than on charge where the time required establishing test voltage might affect the result. The Principle of Superposition states that the change in current produced by a given change in voltage depends only on that voltage. Since, electrically, most insulators are nonlinear; this principle must take this factor into account. The variation in transient currents id, ir, and is with time, and accordingly the total Figure 9-1, differ greatly among insulators. With high-grade insulators, such as quartz, glass and mica, not only the displacement current id, but the transient currents ir and iir reach their zero value almost instantly so that they can only be measured by some high-speed oscillographic means. Accordingly, the current i reach the conduction value is almost instantly. On the other hand, with insulators of a viscous nature, such as oil- and petrolatum-impregnated papers, it may take many minutes, and sometimes hours, for the current i to reach the conductive value ic.
9.3 Insulation Resistance Insulation resistance (Rc) is the term generally used to describe the quotient of the applied voltage E and the current i; that is, Rc = E/i. However, since i varies with time, the value of the insulation resistance depends on the time that i is measured. Actually, it would be correct to wait until i reached the conductive or constant value is and use this value. However, this may become inconvenient because of the time involved. With dry generator windings it may require a day or more before the current i reaches the constant value ic. In order to simplify and standardize insulation-resistance measurements, it has been agreed to use the value of resistance measured after one-minute electrification; that is, the value of i at time tl, Figure 9-1.
9.4 Polarization Index The short time of one minute for making the measurement may be misleading since it ignores the general character of the current-time curve. Hence, a quantity often used to express the general form of the current-time curve i is the polarization index, which is the ratio of the current at one minute (il) to that at ten minutes (i10), Figure 9-1; that is, it is equal to il/i10. Conversely, the polarization index can also be stated as the ratio of insulation resistance at the ten-minute value to that at the one-minute value. From the charge and discharge characteristics of Figure 9-1 it is possible to determine many of the properties of insulation, the methods of which are beyond the scope of this paper. For example, it is possible to calculate the ac characteristics of the insulation at any desired frequency, such as capacitance, effective resistance, power loss and power factor (Reference (5)).
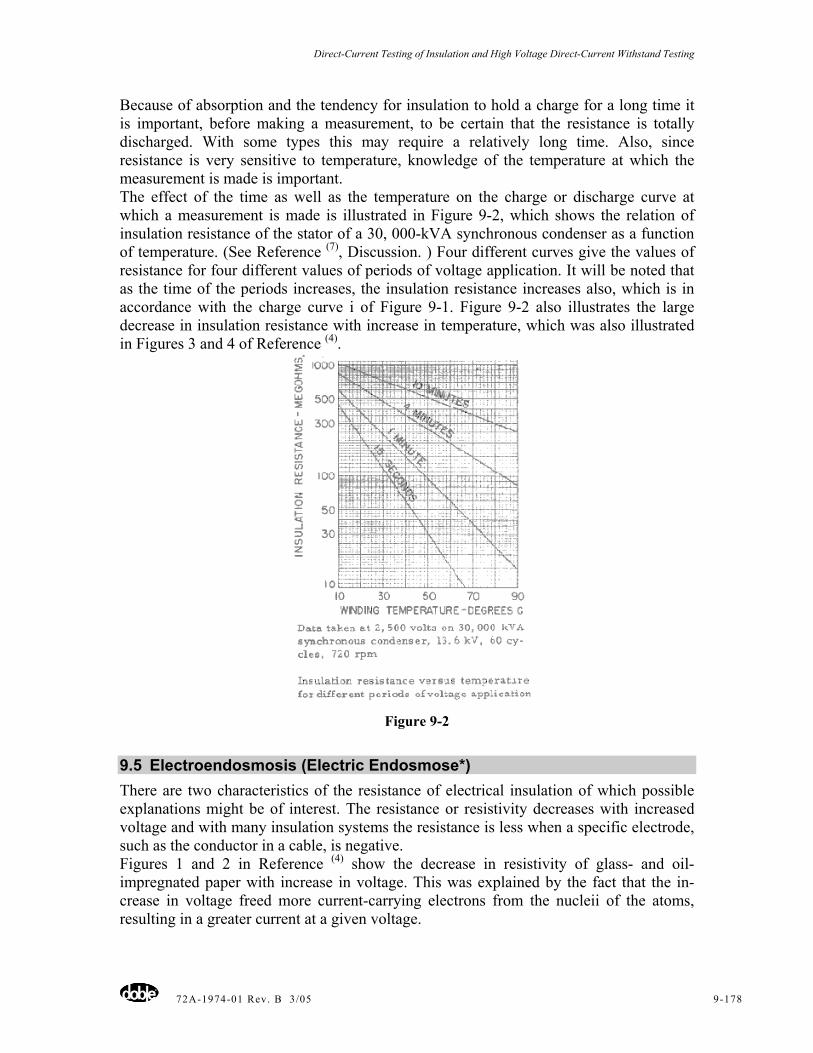
Direct-Current Testing of Insulation and High Voltage Direct-Current Withstand Testing
72A-1974-01 Rev. B 3/05 9-178
Because of absorption and the tendency for insulation to hold a charge for a long time it is important, before making a measurement, to be certain that the resistance is totally discharged. With some types this may require a relatively long time. Also, since resistance is very sensitive to temperature, knowledge of the temperature at which the measurement is made is important. The effect of the time as well as the temperature on the charge or discharge curve at which a measurement is made is illustrated in Figure 9-2, which shows the relation of insulation resistance of the stator of a 30, 000-kVA synchronous condenser as a function of temperature. (See Reference (7), Discussion. ) Four different curves give the values of resistance for four different values of periods of voltage application. It will be noted that as the time of the periods increases, the insulation resistance increases also, which is in accordance with the charge curve i of Figure 9-1. Figure 9-2 also illustrates the large decrease in insulation resistance with increase in temperature, which was also illustrated in Figures 3 and 4 of Reference (4).
Figure 9-2
9.5 Electroendosmosis (Electric Endosmose*) There are two characteristics of the resistance of electrical insulation of which possible explanations might be of interest. The resistance or resistivity decreases with increased voltage and with many insulation systems the resistance is less when a specific electrode, such as the conductor in a cable, is negative. Figures 1 and 2 in Reference (4) show the decrease in resistivity of glass- and oil-impregnated paper with increase in voltage. This was explained by the fact that the in-crease in voltage freed more current-carrying electrons from the nucleii of the atoms, resulting in a greater current at a given voltage.
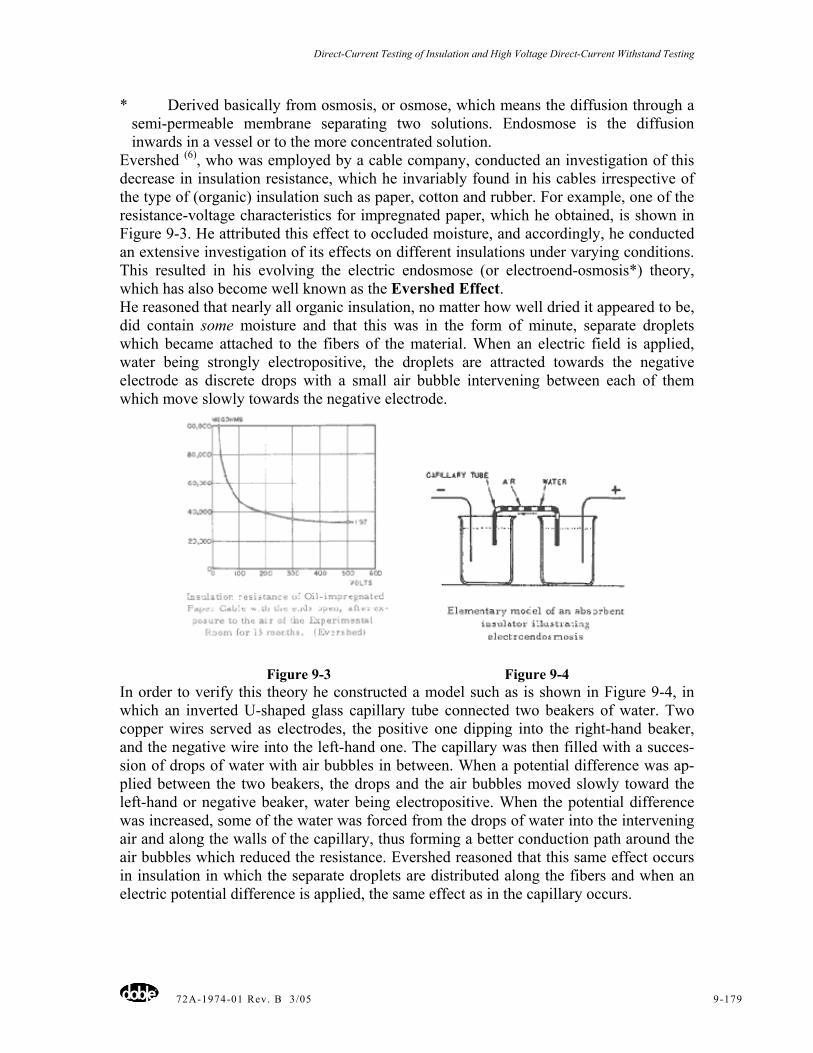
Direct-Current Testing of Insulation and High Voltage Direct-Current Withstand Testing
72A-1974-01 Rev. B 3/05 9-179
* Derived basically from osmosis, or osmose, which means the diffusion through a semi-permeable membrane separating two solutions. Endosmose is the diffusion inwards in a vessel or to the more concentrated solution.
Evershed (6), who was employed by a cable company, conducted an investigation of this decrease in insulation resistance, which he invariably found in his cables irrespective of the type of (organic) insulation such as paper, cotton and rubber. For example, one of the resistance-voltage characteristics for impregnated paper, which he obtained, is shown in Figure 9-3. He attributed this effect to occluded moisture, and accordingly, he conducted an extensive investigation of its effects on different insulations under varying conditions. This resulted in his evolving the electric endosmose (or electroend-osmosis*) theory, which has also become well known as the Evershed Effect. He reasoned that nearly all organic insulation, no matter how well dried it appeared to be, did contain some moisture and that this was in the form of minute, separate droplets which became attached to the fibers of the material. When an electric field is applied, water being strongly electropositive, the droplets are attracted towards the negative electrode as discrete drops with a small air bubble intervening between each of them which move slowly towards the negative electrode.
Figure 9-3 Figure 9-4 In order to verify this theory he constructed a model such as is shown in Figure 9-4, in which an inverted U-shaped glass capillary tube connected two beakers of water. Two copper wires served as electrodes, the positive one dipping into the right-hand beaker, and the negative wire into the left-hand one. The capillary was then filled with a succes-sion of drops of water with air bubbles in between. When a potential difference was ap-plied between the two beakers, the drops and the air bubbles moved slowly toward the left-hand or negative beaker, water being electropositive. When the potential difference was increased, some of the water was forced from the drops of water into the intervening air and along the walls of the capillary, thus forming a better conduction path around the air bubbles which reduced the resistance. Evershed reasoned that this same effect occurs in insulation in which the separate droplets are distributed along the fibers and when an electric potential difference is applied, the same effect as in the capillary occurs.
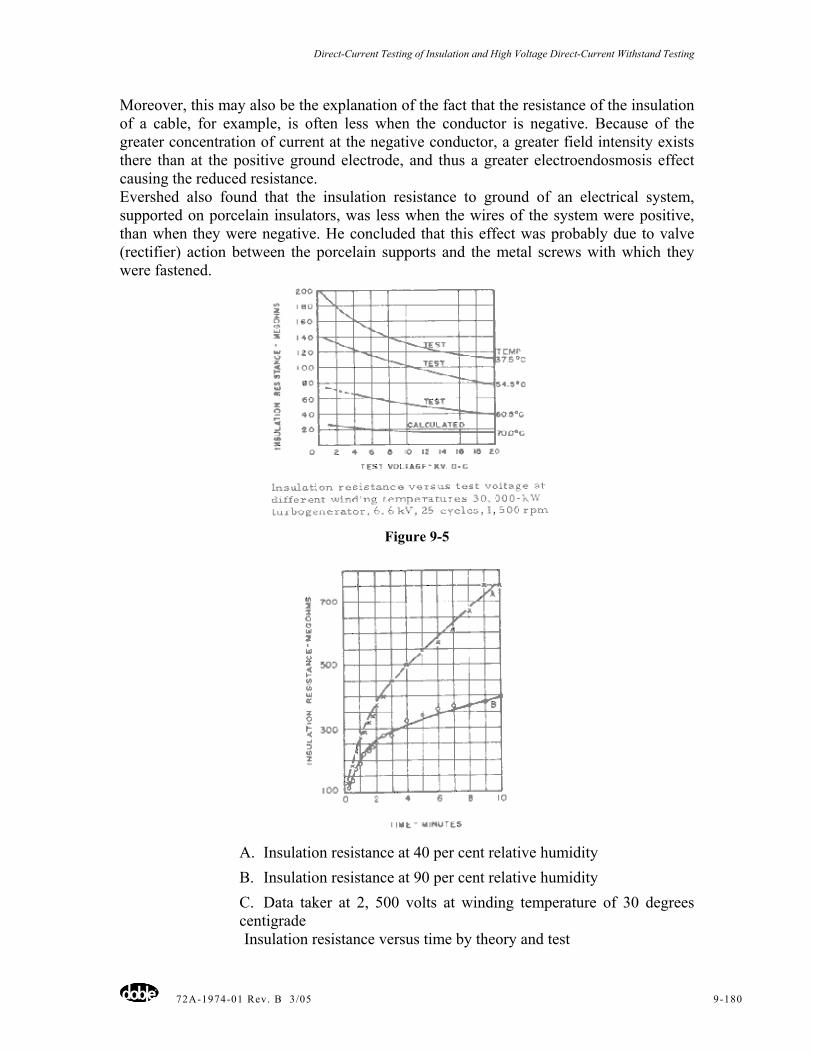
Direct-Current Testing of Insulation and High Voltage Direct-Current Withstand Testing
72A-1974-01 Rev. B 3/05 9-180
Moreover, this may also be the explanation of the fact that the resistance of the insulation of a cable, for example, is often less when the conductor is negative. Because of the greater concentration of current at the negative conductor, a greater field intensity exists there than at the positive ground electrode, and thus a greater electroendosmosis effect causing the reduced resistance. Evershed also found that the insulation resistance to ground of an electrical system, supported on porcelain insulators, was less when the wires of the system were positive, than when they were negative. He concluded that this effect was probably due to valve (rectifier) action between the porcelain supports and the metal screws with which they were fastened.
Figure 9-5
A. Insulation resistance at 40 per cent relative humidity B. Insulation resistance at 90 per cent relative humidity C. Data taker at 2, 500 volts at winding temperature of 30 degrees centigrade Insulation resistance versus time by theory and test
Direct-Current Testing of Insulation and High Voltage Direct-Current Withstand Testing
72A-1974-01 Rev. B 3/05 9-181
Figure 9-6 Figure 9-6 gives the insulation resistance of the stator winding of the 30,000-kW syn-chronous generator of Figure 9-5 as functions of the time of electrification. Two different characteristics are shown: (A) at 40 per cent relative humidity, and (B) at 90 percent relative humidity. These characteristics illustrate two of the insulation-resistance principles, which have already been analyzed:
(A) The insulation resistance increases with the time of electrification, or the time at which the measurement is made.
(B) The insulation resistance decreases with increase in relative humidity; also this substantiates the work of Evershed who early found that insulation resistance decreases with increase in relative humidity.
9.6 DC Charge and Discharge Characteristics with Reversed Polarity of Large Turbo-Generators
In order to compare the direct-current charge and discharge characteristics of the winding insulation of actual large turbogenerators with the general characteristics as shown in Figure 9-1, insulation tests were conducted on two such generators. One test was made on the stator of a 12,500-KVA, 13.2-kV, 1,800-rpm turbogenerator and the other on two phase of a 173-MVA, 16 kV and 3,600-rpm turbogenerator. In each case charge and discharge characters were obtained, and also, the tests were conducted with reversed polarity to determine if polarity made a difference in the measured insulation resistance.
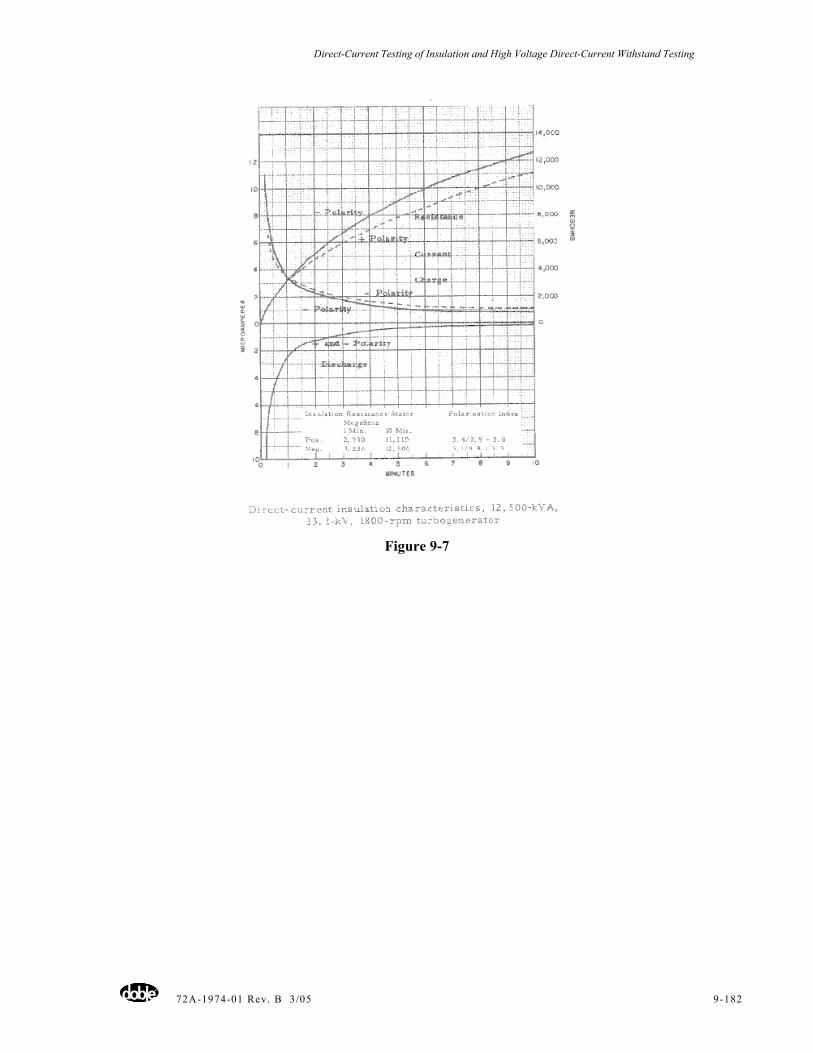
Direct-Current Testing of Insulation and High Voltage Direct-Current Withstand Testing
72A-1974-01 Rev. B 3/05 9-182
Figure 9-7
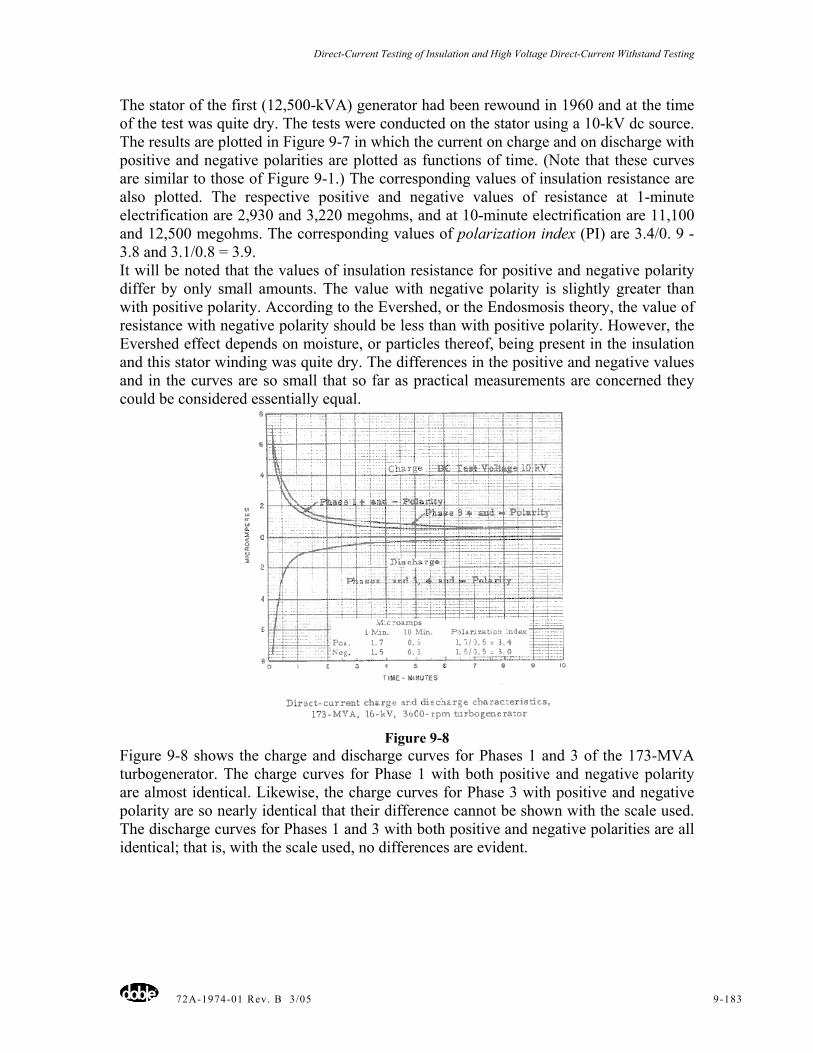
Direct-Current Testing of Insulation and High Voltage Direct-Current Withstand Testing
72A-1974-01 Rev. B 3/05 9-183
The stator of the first (12,500-kVA) generator had been rewound in 1960 and at the time of the test was quite dry. The tests were conducted on the stator using a 10-kV dc source. The results are plotted in Figure 9-7 in which the current on charge and on discharge with positive and negative polarities are plotted as functions of time. (Note that these curves are similar to those of Figure 9-1.) The corresponding values of insulation resistance are also plotted. The respective positive and negative values of resistance at 1-minute electrification are 2,930 and 3,220 megohms, and at 10-minute electrification are 11,100 and 12,500 megohms. The corresponding values of polarization index (PI) are 3.4/0. 9 - 3.8 and 3.1/0.8 = 3.9. It will be noted that the values of insulation resistance for positive and negative polarity differ by only small amounts. The value with negative polarity is slightly greater than with positive polarity. According to the Evershed, or the Endosmosis theory, the value of resistance with negative polarity should be less than with positive polarity. However, the Evershed effect depends on moisture, or particles thereof, being present in the insulation and this stator winding was quite dry. The differences in the positive and negative values and in the curves are so small that so far as practical measurements are concerned they could be considered essentially equal.
Figure 9-8
Figure 9-8 shows the charge and discharge curves for Phases 1 and 3 of the 173-MVA turbogenerator. The charge curves for Phase 1 with both positive and negative polarity are almost identical. Likewise, the charge curves for Phase 3 with positive and negative polarity are so nearly identical that their difference cannot be shown with the scale used. The discharge curves for Phases 1 and 3 with both positive and negative polarities are all identical; that is, with the scale used, no differences are evident.
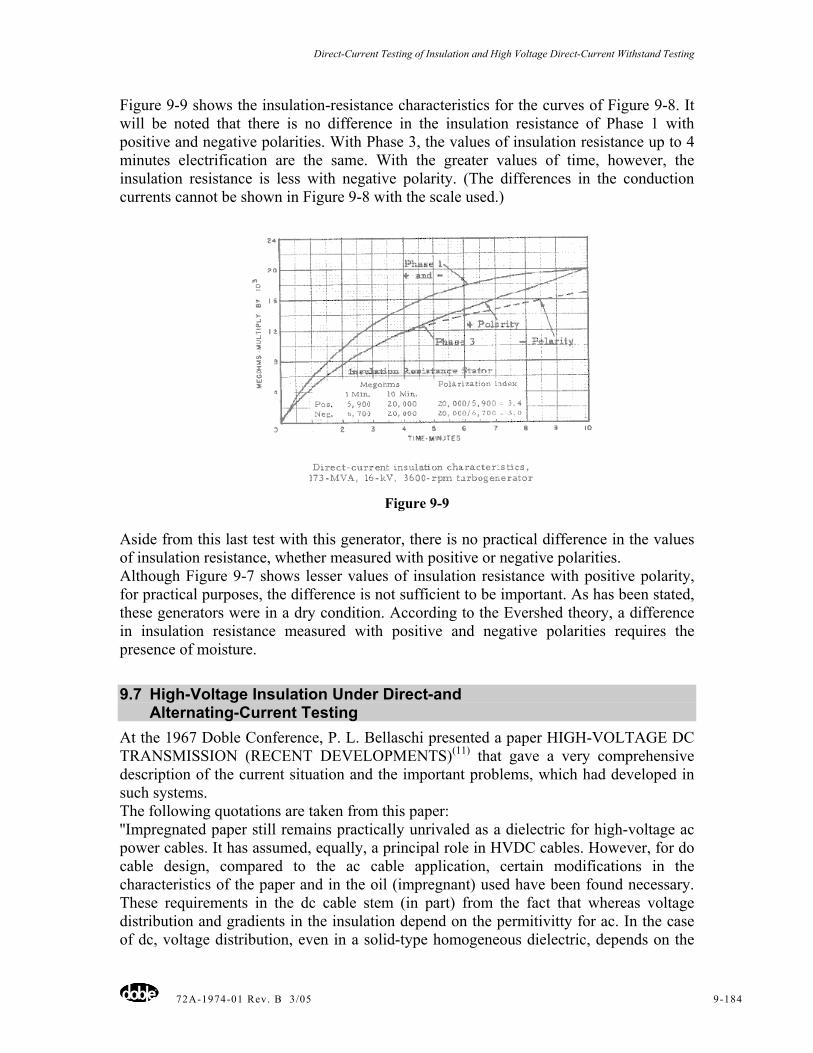
Direct-Current Testing of Insulation and High Voltage Direct-Current Withstand Testing
72A-1974-01 Rev. B 3/05 9-184
Figure 9-9 shows the insulation-resistance characteristics for the curves of Figure 9-8. It will be noted that there is no difference in the insulation resistance of Phase 1 with positive and negative polarities. With Phase 3, the values of insulation resistance up to 4 minutes electrification are the same. With the greater values of time, however, the insulation resistance is less with negative polarity. (The differences in the conduction currents cannot be shown in Figure 9-8 with the scale used.)
Figure 9-9 Aside from this last test with this generator, there is no practical difference in the values of insulation resistance, whether measured with positive or negative polarities. Although Figure 9-7 shows lesser values of insulation resistance with positive polarity, for practical purposes, the difference is not sufficient to be important. As has been stated, these generators were in a dry condition. According to the Evershed theory, a difference in insulation resistance measured with positive and negative polarities requires the presence of moisture.
9.7 High-Voltage Insulation Under Direct-and Alternating-Current Testing
At the 1967 Doble Conference, P. L. Bellaschi presented a paper HIGH-VOLTAGE DC TRANSMISSION (RECENT DEVELOPMENTS)(11) that gave a very comprehensive description of the current situation and the important problems, which had developed in such systems. The following quotations are taken from this paper: ''Impregnated paper still remains practically unrivaled as a dielectric for high-voltage ac power cables. It has assumed, equally, a principal role in HVDC cables. However, for do cable design, compared to the ac cable application, certain modifications in the characteristics of the paper and in the oil (impregnant) used have been found necessary. These requirements in the dc cable stem (in part) from the fact that whereas voltage distribution and gradients in the insulation depend on the permitivitty for ac. In the case of dc, voltage distribution, even in a solid-type homogeneous dielectric, depends on the
Direct-Current Testing of Insulation and High Voltage Direct-Current Withstand Testing
72A-1974-01 Rev. B 3/05 9-185
resistivity of the dielectric which to complicate matters, is temperature dependent and may be affected also by the voltage gradient. In all practical ac cable designs, the voltage gradient in the insulation at the conductor invariably is greater than at the sheath or ground end... "If a dc cable is not carrying load and is in thermal equilibrium with its surroundings, the stress distribution across the dielectric would be approximately similar to the ac case, " However, when the cable is loaded, a temperature gradient is established in the dielectric. The stress distribution, which depends on the temperature sensitive resistivity of the dielectric, then becomes more uniform. Experience has shown that "....for the same conductor cross-section (diameter) and volume of dielectric (thickness of insulation), the voltage rating for a high-voltage do cable can be 2 to 2 1/2 times the voltage rating for an ac cable.... ''At present there are no industry standards, generally recognized, for high-voltage do power equipment. In view of this, there is a need at this time for a critical evaluation of the dielectric test requirements for HVDC terminal equipment, especially for converter transformers because of their primary importance. ''A converter transformer is more complex than the ordinary high-voltage power transformer and in more than one way the design requirements for the windings and the insulation are more exacting. For example, a converter transformer, in addition to an voltage in the primary winding and in the secondary or valve winding, is subjected also to high-voltage dc across the major insulation and from terminals (bushings) to ground of the secondary or valve winding... In regard to polarity, there are strong indications that for oil-immersed insulation, do tests of positive polarity* are the more severe.'' The recent rapid developments in high-voltage direct-current transmission have also made it desirable to obtain data on the direct-current withstand voltages on equipment and accessories which are associated with the transmission system, such, for example, as the converter transformer, reactors, cables and bushings. It is also advantageous to compare the alternating, with the direct current withstand voltage on the same equipment. The high-voltage tests which follow give quantitative values of the electric stresses and the withstand voltages which occur in the types of high-voltage equipment cited by Dr. Bellaschi (ll).
9.8 Transformer Oil With nearly all high-voltage equipment, the insulation most frequently used, besides resin-bonded paper, is mineral oil and Kraft paper impregnated with mineral oil. Although mineral oil plays such an important part in the insulation of do high-voltage equipment, there is little in the literature relating to its behavior in high-voltage dc fields, To obtain more information, E. B. Ganger (8) of the Brown Boveri Company of Switzerland conducted a number of breakdown tests with both do and ac voltages, using two simple electrode arrangements. Unlike solid insulation such as is used in cables, insulators and bushings, these tests showed that the dc withstand voltages were less than those with ac. Two types of electrode arrangements were used. One arrangement, shown in Figure 9-10, consisted of a 15-mm diameter rod, hemispherically shaped at its active end, and a fiat plate. The other arrangement consisted of two flat plates with rounded edges, producing a uniform electric field as shown by Figure 9-11.
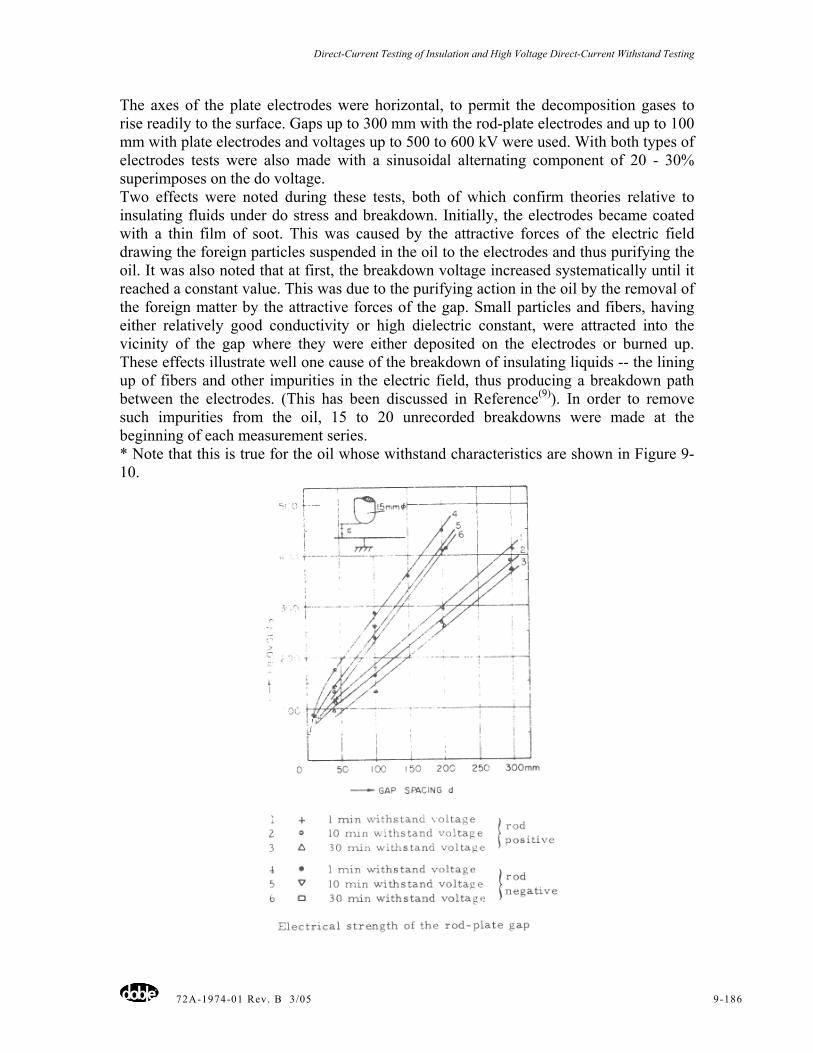
Direct-Current Testing of Insulation and High Voltage Direct-Current Withstand Testing
72A-1974-01 Rev. B 3/05 9-186
The axes of the plate electrodes were horizontal, to permit the decomposition gases to rise readily to the surface. Gaps up to 300 mm with the rod-plate electrodes and up to 100 mm with plate electrodes and voltages up to 500 to 600 kV were used. With both types of electrodes tests were also made with a sinusoidal alternating component of 20 - 30% superimposes on the do voltage. Two effects were noted during these tests, both of which confirm theories relative to insulating fluids under do stress and breakdown. Initially, the electrodes became coated with a thin film of soot. This was caused by the attractive forces of the electric field drawing the foreign particles suspended in the oil to the electrodes and thus purifying the oil. It was also noted that at first, the breakdown voltage increased systematically until it reached a constant value. This was due to the purifying action in the oil by the removal of the foreign matter by the attractive forces of the gap. Small particles and fibers, having either relatively good conductivity or high dielectric constant, were attracted into the vicinity of the gap where they were either deposited on the electrodes or burned up. These effects illustrate well one cause of the breakdown of insulating liquids -- the lining up of fibers and other impurities in the electric field, thus producing a breakdown path between the electrodes. (This has been discussed in Reference(9)). In order to remove such impurities from the oil, 15 to 20 unrecorded breakdowns were made at the beginning of each measurement series. * Note that this is true for the oil whose withstand characteristics are shown in Figure 9-10.
Direct-Current Testing of Insulation and High Voltage Direct-Current Withstand Testing
72A-1974-01 Rev. B 3/05 9-187
Figure 9-10 Figure 9-10 shows the withstanding of kV as functions of gap spacing for the rod-plate electrodes with the rod both positive and negative. With both series of tests, individual tests were made with one-minute, ten-minute and thirty-minute withstand voltages. The tests showed that: • The withstand kV with the rod negative is very much
greater than with the rod positive; • The withstand kV was highest with the shortest values of
time; (this would be expected since the greater length of time gives the electric stress more opportunity to build up a breakdown path between electrodes). The relation of the withstand kV to the gap spacing is practically proportionate (Figure 9-10) and is almost linear: the breakdown behavior with the superposed ac component was identical with that of the dc voltage if the peak value of the combined voltage was taken.
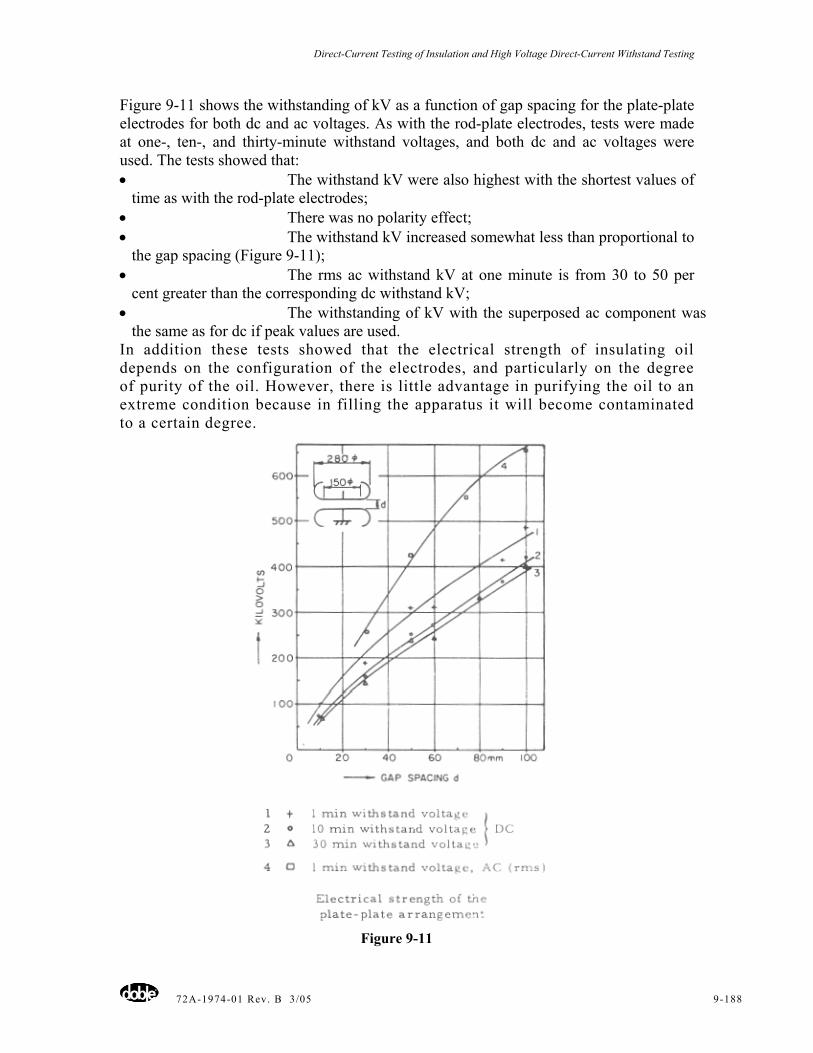
Direct-Current Testing of Insulation and High Voltage Direct-Current Withstand Testing
72A-1974-01 Rev. B 3/05 9-188
Figure 9-11 shows the withstanding of kV as a function of gap spacing for the plate-plate electrodes for both dc and ac voltages. As with the rod-plate electrodes, tests were made at one-, ten-, and thirty-minute withstand voltages, and both dc and ac voltages were used. The tests showed that: • The withstand kV were also highest with the shortest values of
time as with the rod-plate electrodes; • There was no polarity effect; • The withstand kV increased somewhat less than proportional to
the gap spacing (Figure 9-11); • The rms ac withstand kV at one minute is from 30 to 50 per
cent greater than the corresponding dc withstand kV; • The withstanding of kV with the superposed ac component was
the same as for dc if peak values are used. In addition these tests showed that the electrical strength of insulating oil depends on the configuration of the electrodes, and particularly on the degree of purity of the oil. However, there is little advantage in purifying the oil to an extreme condition because in filling the apparatus it will become contaminated to a certain degree.
Figure 9-11
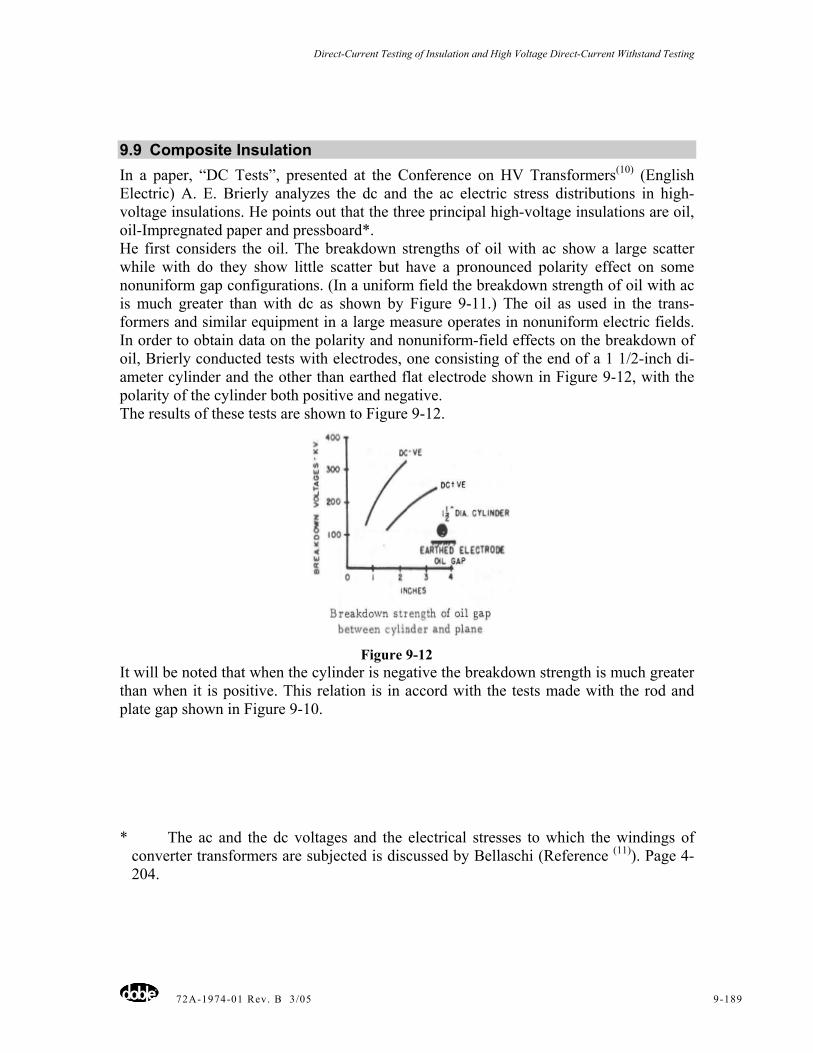
Direct-Current Testing of Insulation and High Voltage Direct-Current Withstand Testing
72A-1974-01 Rev. B 3/05 9-189
9.9 Composite Insulation In a paper, “DC Tests”, presented at the Conference on HV Transformers(10) (English Electric) A. E. Brierly analyzes the dc and the ac electric stress distributions in high-voltage insulations. He points out that the three principal high-voltage insulations are oil, oil-Impregnated paper and pressboard*. He first considers the oil. The breakdown strengths of oil with ac show a large scatter while with do they show little scatter but have a pronounced polarity effect on some nonuniform gap configurations. (In a uniform field the breakdown strength of oil with ac is much greater than with dc as shown by Figure 9-11.) The oil as used in the trans-formers and similar equipment in a large measure operates in nonuniform electric fields. In order to obtain data on the polarity and nonuniform-field effects on the breakdown of oil, Brierly conducted tests with electrodes, one consisting of the end of a 1 1/2-inch di-ameter cylinder and the other than earthed flat electrode shown in Figure 9-12, with the polarity of the cylinder both positive and negative. The results of these tests are shown to Figure 9-12.
Figure 9-12
It will be noted that when the cylinder is negative the breakdown strength is much greater than when it is positive. This relation is in accord with the tests made with the rod and plate gap shown in Figure 9-10. * The ac and the dc voltages and the electrical stresses to which the windings of
converter transformers are subjected is discussed by Bellaschi (Reference (11)). Page 4-204.
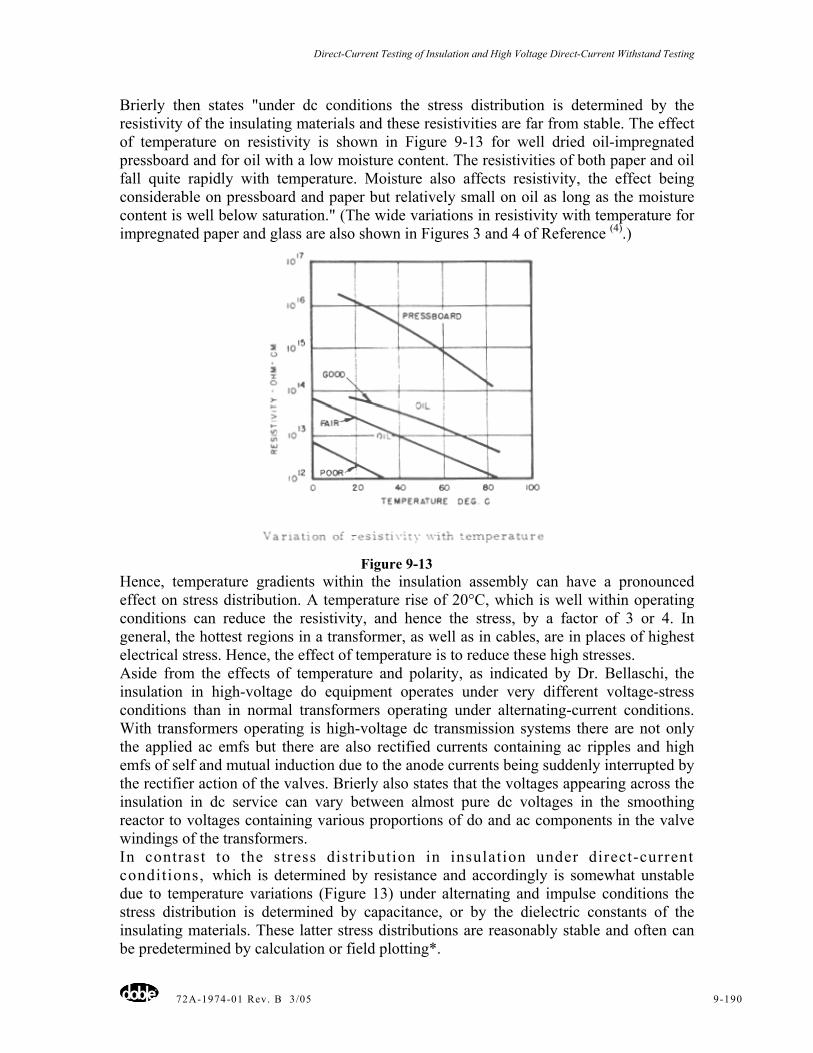
Direct-Current Testing of Insulation and High Voltage Direct-Current Withstand Testing
72A-1974-01 Rev. B 3/05 9-190
Brierly then states "under dc conditions the stress distribution is determined by the resistivity of the insulating materials and these resistivities are far from stable. The effect of temperature on resistivity is shown in Figure 9-13 for well dried oil-impregnated pressboard and for oil with a low moisture content. The resistivities of both paper and oil fall quite rapidly with temperature. Moisture also affects resistivity, the effect being considerable on pressboard and paper but relatively small on oil as long as the moisture content is well below saturation." (The wide variations in resistivity with temperature for impregnated paper and glass are also shown in Figures 3 and 4 of Reference (4).)
Figure 9-13
Hence, temperature gradients within the insulation assembly can have a pronounced effect on stress distribution. A temperature rise of 20°C, which is well within operating conditions can reduce the resistivity, and hence the stress, by a factor of 3 or 4. In general, the hottest regions in a transformer, as well as in cables, are in places of highest electrical stress. Hence, the effect of temperature is to reduce these high stresses. Aside from the effects of temperature and polarity, as indicated by Dr. Bellaschi, the insulation in high-voltage do equipment operates under very different voltage-stress conditions than in normal transformers operating under alternating-current conditions. With transformers operating is high-voltage dc transmission systems there are not only the applied ac emfs but there are also rectified currents containing ac ripples and high emfs of self and mutual induction due to the anode currents being suddenly interrupted by the rectifier action of the valves. Brierly also states that the voltages appearing across the insulation in dc service can vary between almost pure dc voltages in the smoothing reactor to voltages containing various proportions of do and ac components in the valve windings of the transformers. In contrast to the stress distribution in insulation under direct-current conditions, which is determined by resistance and accordingly is somewhat unstable due to temperature variations (Figure 13) under alternating and impulse conditions the stress distribution is determined by capacitance, or by the dielectric constants of the insulating materials. These latter stress distributions are reasonably stable and often can be predetermined by calculation or field plotting*.
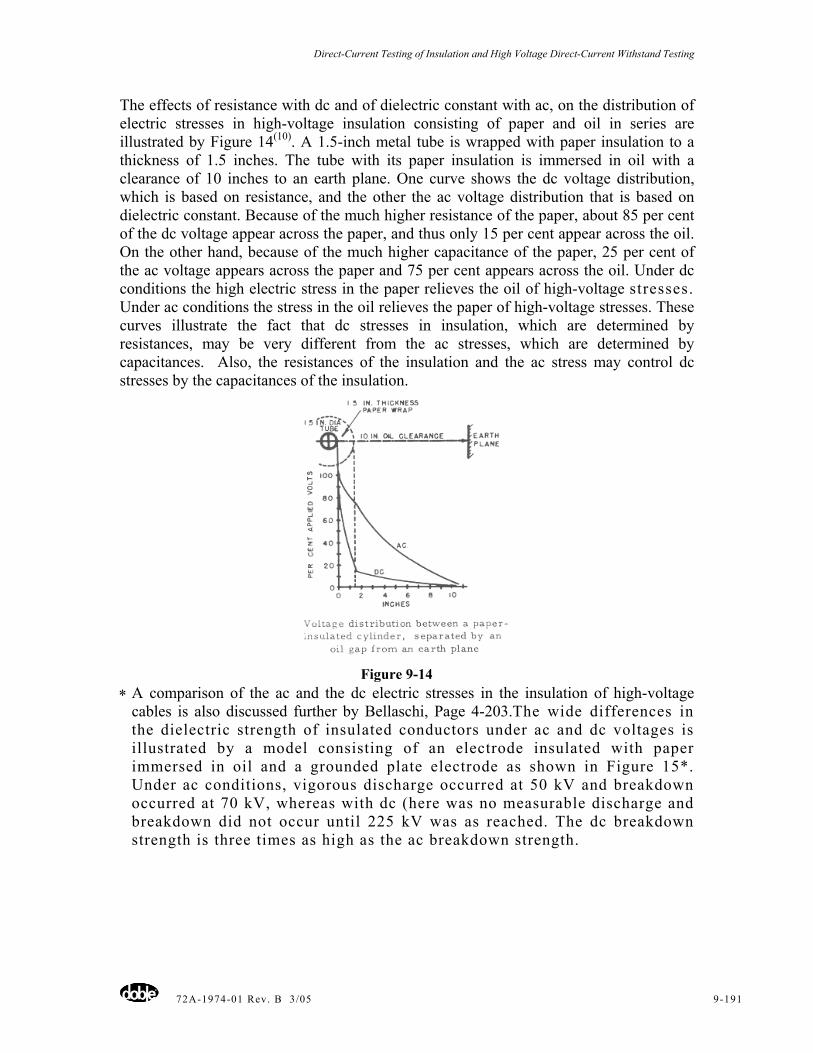
Direct-Current Testing of Insulation and High Voltage Direct-Current Withstand Testing
72A-1974-01 Rev. B 3/05 9-191
The effects of resistance with dc and of dielectric constant with ac, on the distribution of electric stresses in high-voltage insulation consisting of paper and oil in series are illustrated by Figure 14(10). A 1.5-inch metal tube is wrapped with paper insulation to a thickness of 1.5 inches. The tube with its paper insulation is immersed in oil with a clearance of 10 inches to an earth plane. One curve shows the dc voltage distribution, which is based on resistance, and the other the ac voltage distribution that is based on dielectric constant. Because of the much higher resistance of the paper, about 85 per cent of the dc voltage appear across the paper, and thus only 15 per cent appear across the oil. On the other hand, because of the much higher capacitance of the paper, 25 per cent of the ac voltage appears across the paper and 75 per cent appears across the oil. Under dc conditions the high electric stress in the paper relieves the oil of high-voltage stresses. Under ac conditions the stress in the oil relieves the paper of high-voltage stresses. These curves illustrate the fact that dc stresses in insulation, which are determined by resistances, may be very different from the ac stresses, which are determined by capacitances. Also, the resistances of the insulation and the ac stress may control dc stresses by the capacitances of the insulation.
Figure 9-14
∗ A comparison of the ac and the dc electric stresses in the insulation of high-voltage cables is also discussed further by Bellaschi, Page 4-203.The wide differences in the dielectric strength of insulated conductors under ac and dc voltages is illustrated by a model consisting of an electrode insulated with paper immersed in oil and a grounded plate electrode as shown in Figure 15*. Under ac conditions, vigorous discharge occurred at 50 kV and breakdown occurred at 70 kV, whereas with dc (here was no measurable discharge and breakdown did not occur until 225 kV was as reached. The dc breakdown strength is three times as high as the ac breakdown strength.
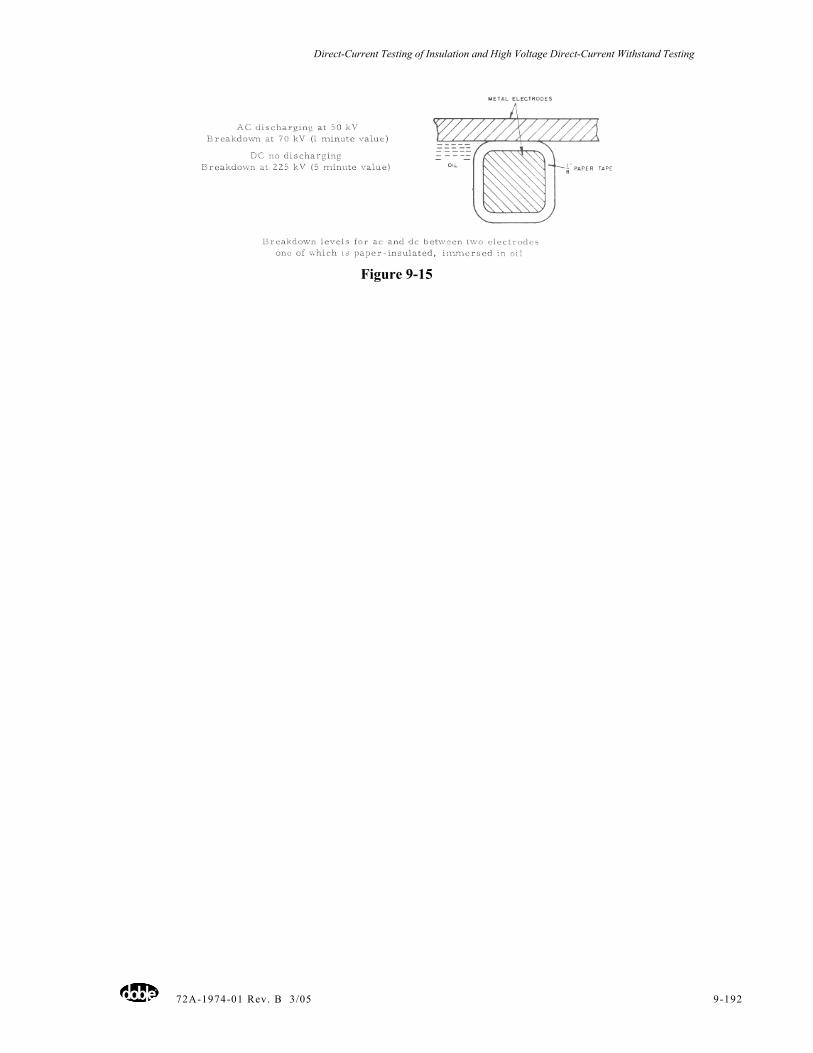
Direct-Current Testing of Insulation and High Voltage Direct-Current Withstand Testing
72A-1974-01 Rev. B 3/05 9-192
Figure 9-15
Direct-Current Testing of Insulation and High Voltage Direct-Current Withstand Testing
72A-1974-01 Rev. B 3/05 9-193
The conclusions, which may be decided from these tests, are: The behavior of transformer insulation under dc stress is very different from its behavior under ac stress; high-voltage ac voltage tests on valve windings may not be significant. In a dielectric system, including oil paper and oil in series: • with dc a very large portion of the voltage appears across the
paper, whereas with ac, the major portion of the voltage appears across the oil;corona discharge is mainly dependent on the ac component of voltage and is little influenced by the dc component;
• an ac over voltage test should be related to the ac component of the operating voltage; a dc over voltage test should be related to the dc component of the operating voltage.
9.10 References 1. “Dielectric Theory and Practice", C. L. Dawes and E. H. Povey, Minutes of the Twenty-
Ninth Annual Conference of Doble Clients, 1962. 2. “Recommended Guide for Making Dielectric Measurements in the Field", AIEE No. 62,
April 1958. 3. “Lectures on Dielectric Theory and Insulation" (a book), J. B. Whitehead, McGraw-Hill
Book Company. 4. “The Effects of Temperature on Insulation Losses", C. L. Dawes, Minutes of the Thirty-
Fourth Annual International Conference of Doble Clients, 1967, Sec. 3-201. 5. “Behavior of Dielectrics", R. R. Benedict, Trans. AIEE 1930, Page 739. 6. “The Characteristics of Insulation Resistance", S. Evershed, Journal of the I. E. E. No. 52
(1914), Page 512. 7. “Field Testing of Generator Insulation", Trans. AIEE 1941 (60), Page 1003, Discussion, Page 1314. 8. “The Breakdown Voltage of Oil Gaps with high DC Voltage", E. B. Ganger, IEEE
Transactions Paper presented at the IEEE Winter Power Meeting - New York City - January, 1968.
9. "Mechanisms of the Electric Breakdown of Dielectrics", C. L. Dawes, Minutes of the Thirty-First Annual Conference of Doble Clients, 1964, Sec. 2-201.
10. “DC Tests", A. E. Brierly, Presented at a Conference on HV Transformers (English Electric), 1968.
11. “High-Voltage DC Transmission (Recent Developments)", P. L. Bellaschi, Minutes of the Thirty-Fourth Annual International Conference of Doble Clients, 1967, Sec. 4-201.
∗ These are the conditions in which exist in the converters and reactors which form a part of the present high voltage dc transmission developments as stated in the paper by Bellaschi.
Induced Voltage on De-Energized Lins and Equipmente
72A-1974-01 Rev. B 3/05 10-194
Chapter 10 - Induced Voltage on De-Energized Lines and Equipment
C.L. Dawes Doble Engineering Company
10.1 Introduction This paper was suggested by a client to extend the content further of a report written for internal use having the foregoing title. The introduction in this report is a most ap-propriate background for this paper. "The voltages and currents which can be found on de-energized Substation equipment and lines has been under study for some time by labo-ratory and field personnel............. The safety rules and working procedures are intended to eliminate voltages, which could lead to fatalities, and to minimize voltages, which could produce annoying shocks as involuntary movements which might they constitute a hazard. " "The introduction of EHV (Extra High Voltage) transmission into the grid has stimulated activity on the problem. The problem is not, however, one associated only with EHV. 500 kV has increased the awareness of the situation because technological improvements in equipment (limiting PCB switching surges for example) and more detailed knowledge of insulation requirements have permitted a design with energized equipment physically closer to grounded surfaces. In practice, capacitive and inductive coupling exist together and the resulting induced voltages and/or currents are a combination of both. On transmission lines, the capacitive coupling will produce the highest voltages while the inductive coupling will produce the highest currents. " This Client also suggested that a paper on this subject be presented at the Doble Con-ference developing further basic information but to "keep the theory fairly simple, but people should be warned of the potential hazard involved in a growing and highly complex transmission network. " In preparing this paper, the author has always kept in mind the statements contained in the introduction to the report. He has attempted to "keep the theory simple". Accordingly, a few basic formulas have been derived from which electric and electromagnetic induced voltages can be calculated and have been applied to simple units of typical transmission systems and it will be evident that they can well be applied to the components of the more complex systems. Also, methods are indicated which can extend the basic formulas to the more complex poly phase systems. Although a de-energized power line may be completely disconnected from any source of power and insulated, if it parallels an energized line or any portion thereof, or if it passes through an electric field, voltages are induced in such a line and usually they are large enough to be very dangerous. In addition the de-energized line is inductively coupled magnetically to the energized lines and under certain grounding conditions, dangerously high-induced voltages may also come from this source. Although usually lower in magnitude than the
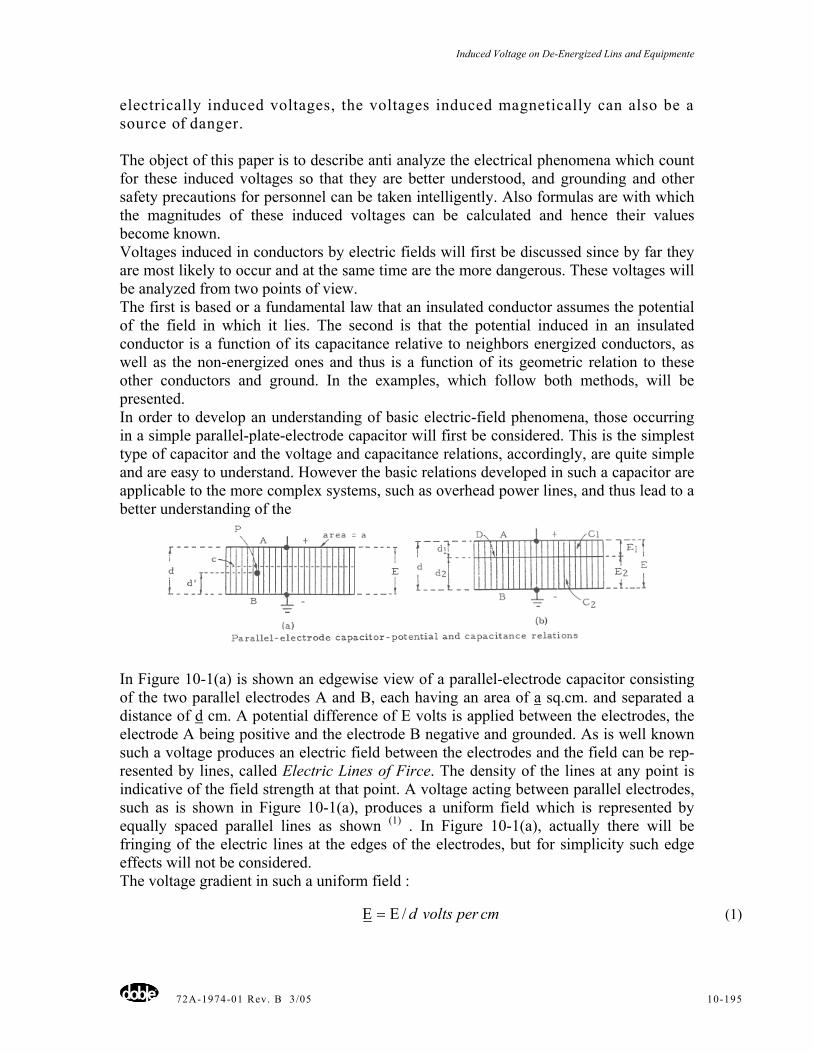
Induced Voltage on De-Energized Lins and Equipmente
72A-1974-01 Rev. B 3/05 10-195
electrically induced voltages, the voltages induced magnetically can also be a source of danger. The object of this paper is to describe anti analyze the electrical phenomena which count for these induced voltages so that they are better understood, and grounding and other safety precautions for personnel can be taken intelligently. Also formulas are with which the magnitudes of these induced voltages can be calculated and hence their values become known. Voltages induced in conductors by electric fields will first be discussed since by far they are most likely to occur and at the same time are the more dangerous. These voltages will be analyzed from two points of view. The first is based or a fundamental law that an insulated conductor assumes the potential of the field in which it lies. The second is that the potential induced in an insulated conductor is a function of its capacitance relative to neighbors energized conductors, as well as the non-energized ones and thus is a function of its geometric relation to these other conductors and ground. In the examples, which follow both methods, will be presented. In order to develop an understanding of basic electric-field phenomena, those occurring in a simple parallel-plate-electrode capacitor will first be considered. This is the simplest type of capacitor and the voltage and capacitance relations, accordingly, are quite simple and are easy to understand. However the basic relations developed in such a capacitor are applicable to the more complex systems, such as overhead power lines, and thus lead to a better understanding of the
In Figure 10-1(a) is shown an edgewise view of a parallel-electrode capacitor consisting of the two parallel electrodes A and B, each having an area of a sq.cm. and separated a distance of d cm. A potential difference of E volts is applied between the electrodes, the electrode A being positive and the electrode B negative and grounded. As is well known such a voltage produces an electric field between the electrodes and the field can be rep-resented by lines, called Electric Lines of Firce. The density of the lines at any point is indicative of the field strength at that point. A voltage acting between parallel electrodes, such as is shown in Figure 10-1(a), produces a uniform field which is represented by equally spaced parallel lines as shown (1) . In Figure 10-1(a), actually there will be fringing of the electric lines at the edges of the electrodes, but for simplicity such edge effects will not be considered. The voltage gradient in such a uniform field :
cmpervoltsd/Ε=Ε (1)
Induced Voltage on De-Energized Lins and Equipmente
72A-1974-01 Rev. B 3/05 10-196
(1) Raised parenthetical numbers refer to the reference, page 3-120. (See Reference (1), particularly pages I through 6 for properties of the parallel-electrode capacitor.) In such a field the potential at any point is proportional to the distance from one of the electrodes. Since electrode B is grounded its potential is zero and the potential at any point in the electric field,
'kdp =Ε (2)
Where k is a constant and d' the distance of point P from the grounded electrode. The capacitance where є is the capacitivity, or dielectric constant, of the insulating medium and a the area of the electrodes in sq. cm.and d the distance between electrodes. For example,
fxdaC µ
π 5104∈
= (3)
in Figure 10-1(a), assumes that the dielectric is air (є = 1), a = 400 sq. cm., d = 2 cm. and a potential difference E = 10,000 volts is applied between the electrodes A and B. Electrode B is of course at zero, or ground potential.
Substi tut ing the potential Ea of electrode A for Ep in equation (2),
10,000 = k (2) from which (4)
K = 5000
The capacitance from (3),
( )fx
xC
µπ
4
5
10592.1
1024
400
−=
=
Figure 10-l (b) shows an edgewise view of a thin flat metallic plate, D, placed between the two electrodes A and B of Figure 10-1(a), parallel to them, spaced 1.2 cm. from elec-trode B and thus 0.8 cm from electrode A. This plate will then assume the potential of the field in which it lies and thus does not disturb the uniformity of the field.
voltsxED 000,62.1000,5 ==
It is a well-known law of electrostatics that the potential of each of the capacitors in series is inversely as their capacitance. If Cl is the capacitance of the capacitor formed by electrode A and plate D and El its voltage; and likewise if C2 is the capacitance of the capacitor formed by plate D and electrode B, and E2 its voltage, it follows:
1
2
2
1
CC
EE
= (5)
From which, since E1 + E2 = E,
21
21 CC
CEE+
= (6)
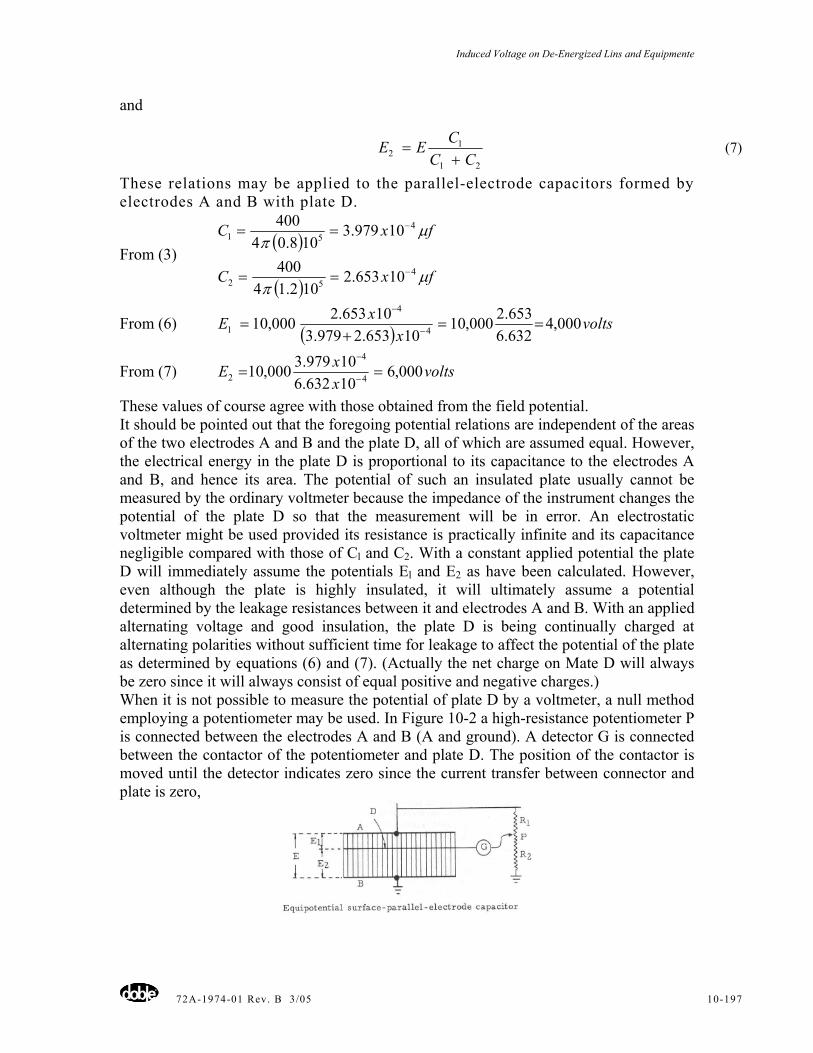
Induced Voltage on De-Energized Lins and Equipmente
72A-1974-01 Rev. B 3/05 10-197
and
21
12 CC
CEE+
= (7)
These relations may be applied to the parallel-electrode capacitors formed by electrodes A and B with plate D.
From (3) ( )
( ) fxC
fxC
µπ
µπ
452
451
10653.2102.14
400
10979.3108.04
400
−
−
==
==
From (6) ( ) voltsx
xE 000,4632.6653.2000,10
10653.2979.310653.2000,10 4
4
1 ==+
= −
−
From (7) voltsxxE 000,610632.610979.3000,10 4
4
2 == −
−
These values of course agree with those obtained from the field potential. It should be pointed out that the foregoing potential relations are independent of the areas of the two electrodes A and B and the plate D, all of which are assumed equal. However, the electrical energy in the plate D is proportional to its capacitance to the electrodes A and B, and hence its area. The potential of such an insulated plate usually cannot be measured by the ordinary voltmeter because the impedance of the instrument changes the potential of the plate D so that the measurement will be in error. An electrostatic voltmeter might be used provided its resistance is practically infinite and its capacitance negligible compared with those of Cl and C2. With a constant applied potential the plate D will immediately assume the potentials El and E2 as have been calculated. However, even although the plate is highly insulated, it will ultimately assume a potential determined by the leakage resistances between it and electrodes A and B. With an applied alternating voltage and good insulation, the plate D is being continually charged at alternating polarities without sufficient time for leakage to affect the potential of the plate as determined by equations (6) and (7). (Actually the net charge on Mate D will always be zero since it will always consist of equal positive and negative charges.) When it is not possible to measure the potential of plate D by a voltmeter, a null method employing a potentiometer may be used. In Figure 10-2 a high-resistance potentiometer P is connected between the electrodes A and B (A and ground). A detector G is connected between the contactor of the potentiometer and plate D. The position of the contactor is moved until the detector indicates zero since the current transfer between connector and plate is zero,
Induced Voltage on De-Energized Lins and Equipmente
72A-1974-01 Rev. B 3/05 10-198
Where R1 and R2 are the resistances of the two segments of the potentiometer.
2
1
2
1
RR
EE
= (8)
10.2 Equipotential Surface As its name implies, an equipotential surface is one in which every point is at the same potential. Such a surface is always perpendicular to the electric lines. It may be an imaginary surface of zero thickness such as shown in an edgewise view, c shown dotted in Figure 10-1(a), or it may also consist of a very thin sheet of insulating material or of a very thin sheet of conducting material occupying the same position as that of the imaginary surface such as that indicated by c in Figure 10-l(a). However, any sheet of conducting material placed in an electric field must become an equipotential surface because of its conductance. If its position coincides with any imaginary equipotential surface such as is shown in Figure 10-l(a), the field will not be disturbed. However, if its position is other than that of an imaginary equipotential surface, it will change the field configuration. Note that the electric lines will enter and leave an equipotential surface perpendicular to it. It follows that the thin conducting electrode D of Figure 10-1(b) coincides with an imag-inary equipotential surface, so that its presence does not in any way disturb the uniform electric field. Electric fields and equipotential surfaces exist in all electrical apparatus and systems but they assume greatest importance in the design and study of high-voltage systems. (See Figure 10-5.) Also, the electric fields, which occur in such systems, obviously are far more complex than those for the parallel-electrode capacitor shown in Figures 1 and 2. Although the parallel-electrode capacitor is simple and accordingly the voltage and capacitance relations are also simple, they are illustrative of the relations which exist in the more complex electric fields such as occur with overhead power lines.
10.3 Overhead Power Lines The formulas and their derivations giving the capacitance, and inductance of overhead power lines are well known and are readily found in textbooks, handbooks and technical articles (2). For example, Figure 10-3(a) shows in cross-section the two conductors A and B of an overhead single-phase power line, spaced D feet between centers and each conductor have a radius of r feet. The general nature of the electric field between the conductors is indicated by the electric lines.
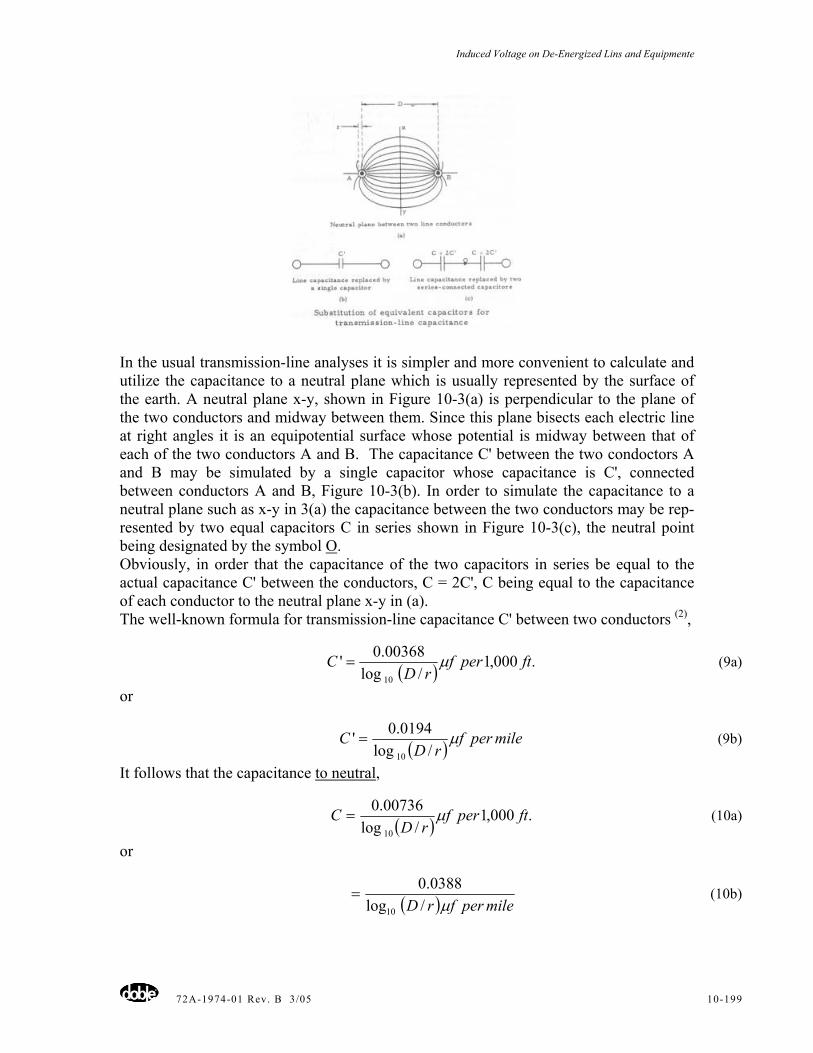
Induced Voltage on De-Energized Lins and Equipmente
72A-1974-01 Rev. B 3/05 10-199
In the usual transmission-line analyses it is simpler and more convenient to calculate and utilize the capacitance to a neutral plane which is usually represented by the surface of the earth. A neutral plane x-y, shown in Figure 10-3(a) is perpendicular to the plane of the two conductors and midway between them. Since this plane bisects each electric line at right angles it is an equipotential surface whose potential is midway between that of each of the two conductors A and B. The capacitance C' between the two condoctors A and B may be simulated by a single capacitor whose capacitance is C', connected between conductors A and B, Figure 10-3(b). In order to simulate the capacitance to a neutral plane such as x-y in 3(a) the capacitance between the two conductors may be rep-resented by two equal capacitors C in series shown in Figure 10-3(c), the neutral point being designated by the symbol O. Obviously, in order that the capacitance of the two capacitors in series be equal to the actual capacitance C' between the conductors, C = 2C', C being equal to the capacitance of each conductor to the neutral plane x-y in (a). The well-known formula for transmission-line capacitance C' between two conductors (2),
( ) .000,1/log
00368.0'10
ftperfrD
C µ= (9a)
or
( ) mileperfrD
C µ/log
0194.0'10
= (9b)
It follows that the capacitance to neutral,
( ) .000,1/log
00736.0
10
ftperfrD
C µ= (10a)
or
( ) mileperfrD µ/log0388.0
10
= (10b)
Induced Voltage on De-Energized Lins and Equipmente
72A-1974-01 Rev. B 3/05 10-200
10.4 Method of Images The earth is important, electrically, in the operation of power transmission systems, since it forms the equivalent of a surface of zero potential and nearly all potentials in the transmission system are referred to earth, or ground, potential. From the point of view of capacitance the earth is usually considered an infinite plane of zero resistivity. However, when the earth is dry or rocky the equivalent electrical surface may be some few feet below- the physical surface. When necessary, correction may be made for this factor (6) and it is also possible to make the earth's surface an equivalent conducting plane by the installation of a counterpoise ,a low-resistance conductor buried just beneath the earth's surface and connected to the tower footings. However, in most capacitance calculations the actual earth's surface can be used without appreciable error as an infinite conducting plane, and, when necessary, corrections can be made.
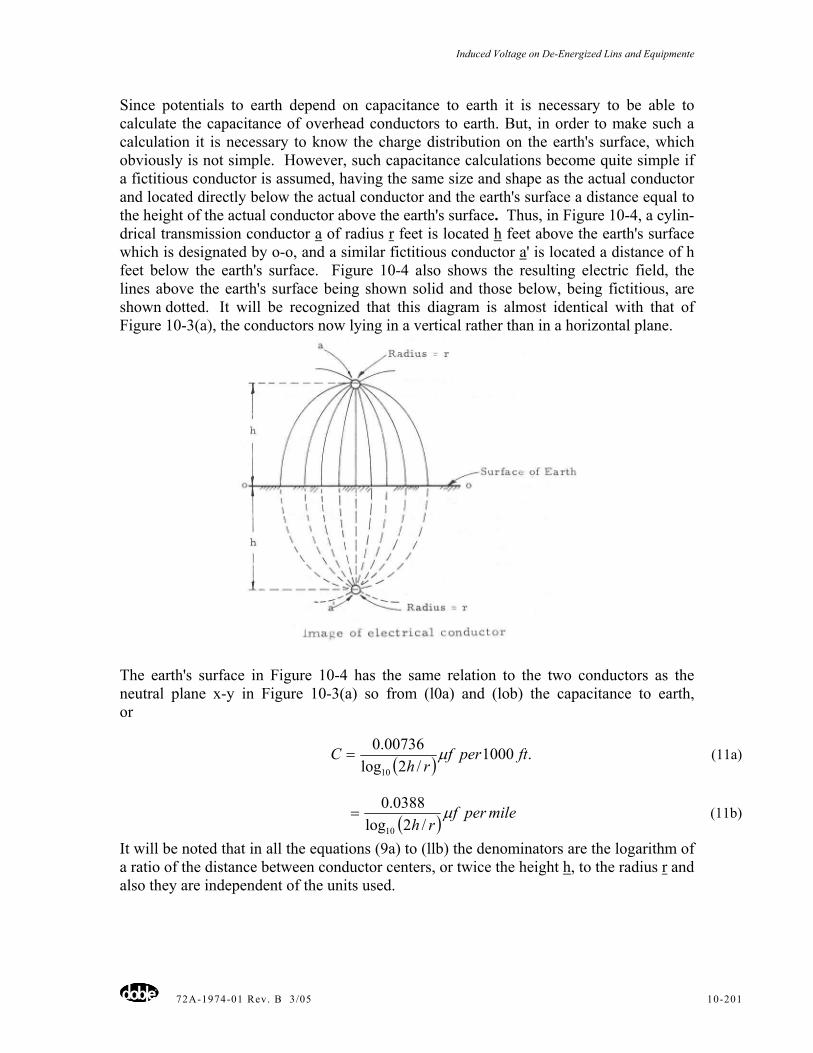
Induced Voltage on De-Energized Lins and Equipmente
72A-1974-01 Rev. B 3/05 10-201
Since potentials to earth depend on capacitance to earth it is necessary to be able to calculate the capacitance of overhead conductors to earth. But, in order to make such a calculation it is necessary to know the charge distribution on the earth's surface, which obviously is not simple. However, such capacitance calculations become quite simple if a fictitious conductor is assumed, having the same size and shape as the actual conductor and located directly below the actual conductor and the earth's surface a distance equal to the height of the actual conductor above the earth's surface. Thus, in Figure 10-4, a cylin-drical transmission conductor a of radius r feet is located h feet above the earth's surface which is designated by o-o, and a similar fictitious conductor a' is located a distance of h feet below the earth's surface. Figure 10-4 also shows the resulting electric field, the lines above the earth's surface being shown solid and those below, being fictitious, are shown dotted. It will be recognized that this diagram is almost identical with that of Figure 10-3(a), the conductors now lying in a vertical rather than in a horizontal plane.
The earth's surface in Figure 10-4 has the same relation to the two conductors as the neutral plane x-y in Figure 10-3(a) so from (l0a) and (lob) the capacitance to earth, or
( ) .1000/2log
00736.010
ftperfrh
C µ= (11a)
( ) mileperfrh
µ/2log
0388.0
10
= (11b)
It will be noted that in all the equations (9a) to (llb) the denominators are the logarithm of a ratio of the distance between conductor centers, or twice the height h, to the radius r and also they are independent of the units used.
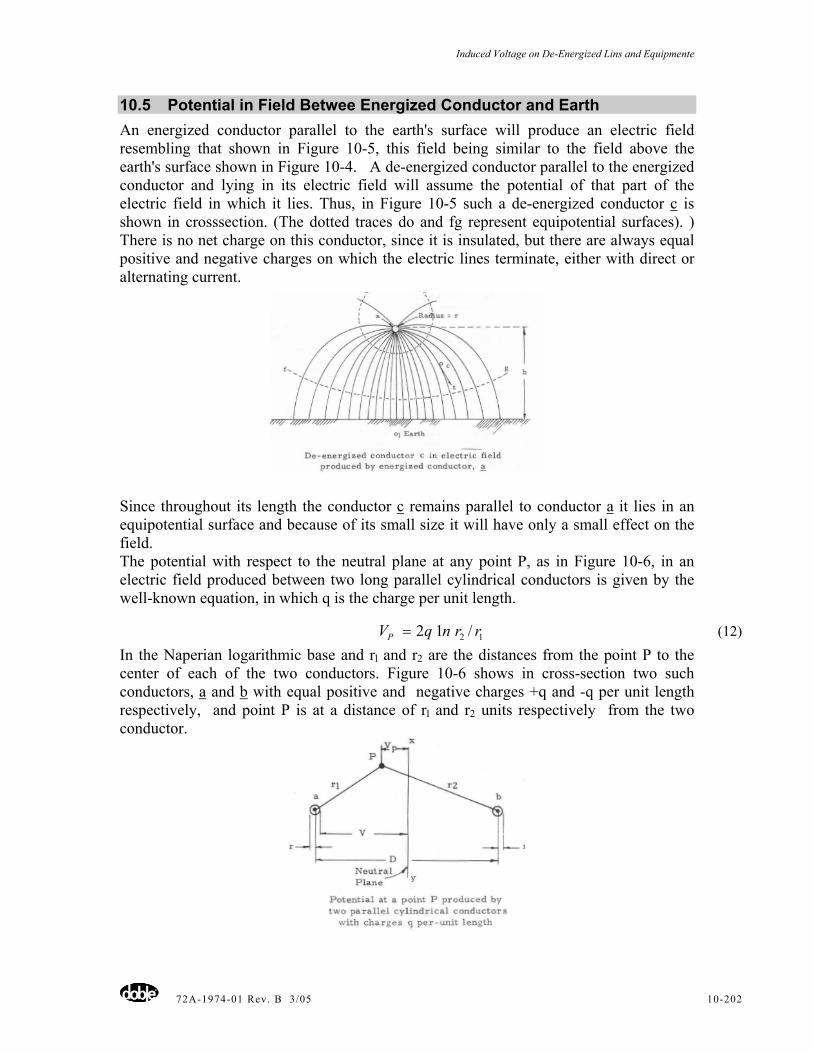
Induced Voltage on De-Energized Lins and Equipmente
72A-1974-01 Rev. B 3/05 10-202
10.5 Potential in Field Betwee Energized Conductor and Earth An energized conductor parallel to the earth's surface will produce an electric field resembling that shown in Figure 10-5, this field being similar to the field above the earth's surface shown in Figure 10-4. A de-energized conductor parallel to the energized conductor and lying in its electric field will assume the potential of that part of the electric field in which it lies. Thus, in Figure 10-5 such a de-energized conductor c is shown in crosssection. (The dotted traces do and fg represent equipotential surfaces). ) There is no net charge on this conductor, since it is insulated, but there are always equal positive and negative charges on which the electric lines terminate, either with direct or alternating current.
Since throughout its length the conductor c remains parallel to conductor a it lies in an equipotential surface and because of its small size it will have only a small effect on the field. The potential with respect to the neutral plane at any point P, as in Figure 10-6, in an electric field produced between two long parallel cylindrical conductors is given by the well-known equation, in which q is the charge per unit length.
12 /12 rrnqVP = (12)
In the Naperian logarithmic base and rl and r2 are the distances from the point P to the center of each of the two conductors. Figure 10-6 shows in cross-section two such conductors, a and b with equal positive and negative charges +q and -q per unit length respectively, and point P is at a distance of rl and r2 units respectively from the two conductor.
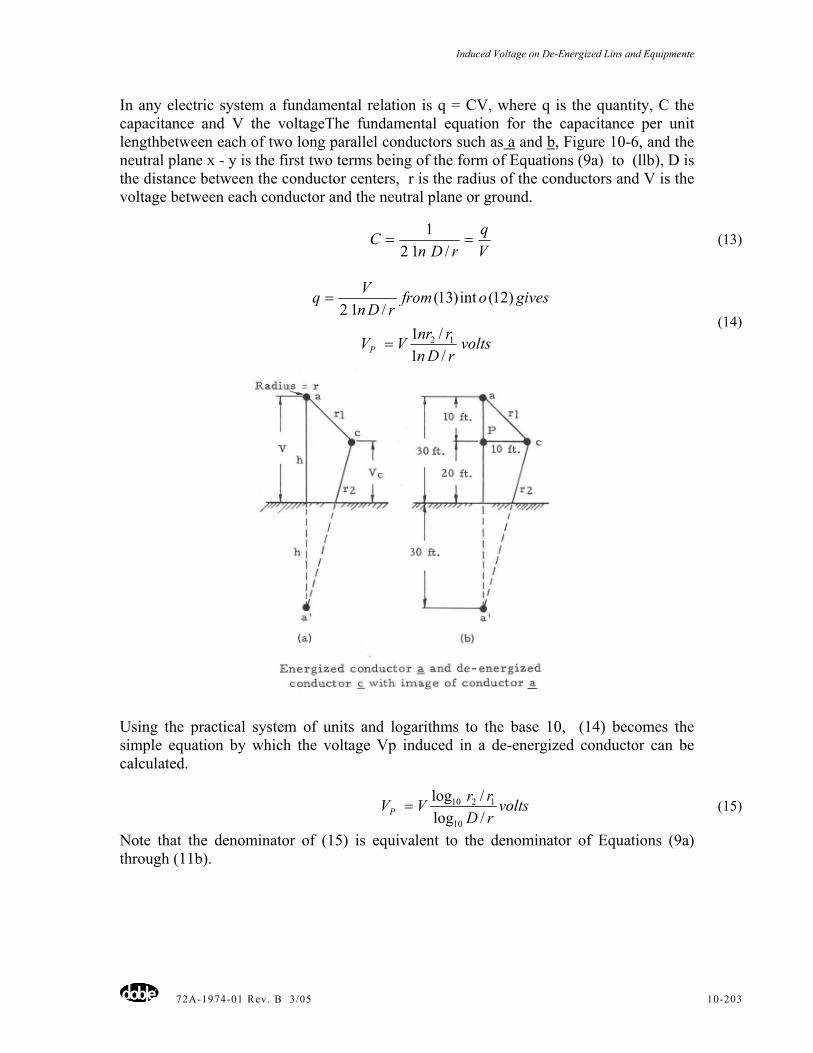
Induced Voltage on De-Energized Lins and Equipmente
72A-1974-01 Rev. B 3/05 10-203
In any electric system a fundamental relation is q = CV, where q is the quantity, C the capacitance and V the voltageThe fundamental equation for the capacitance per unit lengthbetween each of two long parallel conductors such as a and b, Figure 10-6, and the neutral plane x - y is the first two terms being of the form of Equations (9a) to (llb), D is the distance between the conductor centers, r is the radius of the conductors and V is the voltage between each conductor and the neutral plane or ground.
Vq
rDnC ==
/121
(13)
volts
rDnrnrVV
givesofromrDn
Vq
P /1/1
)12(int)13(/12
12=
= (14)
Using the practical system of units and logarithms to the base 10, (14) becomes the simple equation by which the voltage Vp induced in a de-energized conductor can be calculated.
voltsrDrrVVP /log
/log10
1210= (15)
Note that the denominator of (15) is equivalent to the denominator of Equations (9a) through (11b).
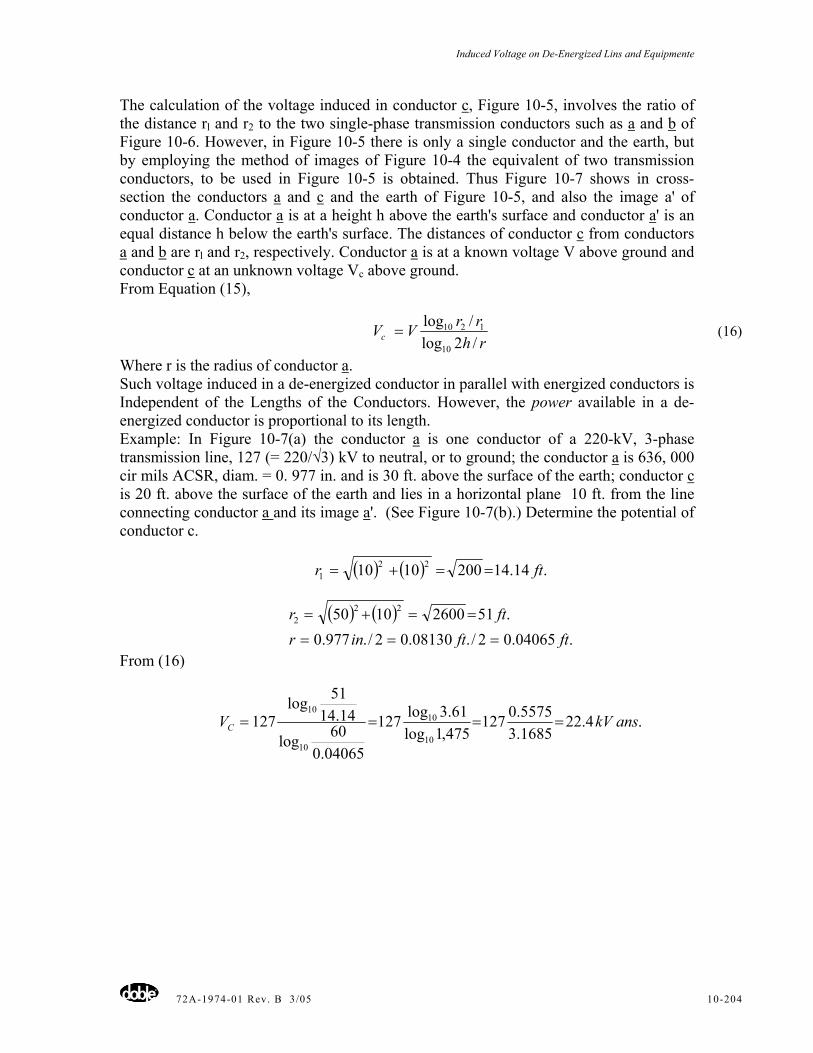
Induced Voltage on De-Energized Lins and Equipmente
72A-1974-01 Rev. B 3/05 10-204
The calculation of the voltage induced in conductor c, Figure 10-5, involves the ratio of the distance rl and r2 to the two single-phase transmission conductors such as a and b of Figure 10-6. However, in Figure 10-5 there is only a single conductor and the earth, but by employing the method of images of Figure 10-4 the equivalent of two transmission conductors, to be used in Figure 10-5 is obtained. Thus Figure 10-7 shows in cross-section the conductors a and c and the earth of Figure 10-5, and also the image a' of conductor a. Conductor a is at a height h above the earth's surface and conductor a' is an equal distance h below the earth's surface. The distances of conductor c from conductors a and b are rl and r2, respectively. Conductor a is at a known voltage V above ground and conductor c at an unknown voltage Vc above ground. From Equation (15),
rhrrVVc /2log
/log10
1210= (16)
Where r is the radius of conductor a. Such voltage induced in a de-energized conductor in parallel with energized conductors is Independent of the Lengths of the Conductors. However, the power available in a de-energized conductor is proportional to its length. Example: In Figure 10-7(a) the conductor a is one conductor of a 220-kV, 3-phase transmission line, 127 (= 220/√3) kV to neutral, or to ground; the conductor a is 636, 000 cir mils ACSR, diam. = 0. 977 in. and is 30 ft. above the surface of the earth; conductor c is 20 ft. above the surface of the earth and lies in a horizontal plane 10 ft. from the line connecting conductor a and its image a'. (See Figure 10-7(b).) Determine the potential of conductor c.
( ) ( ) .14.142001010 221 ftr ==+=
( ) ( ).04065.02/.08130.02/.977.0
.5126001050 222
ftftinrftr
===
==+=
From (16)
.4.221685.35575.0127
475,1log61.3log127
04065.060log
14.1451log
12710
10
10
10anskVVC ====
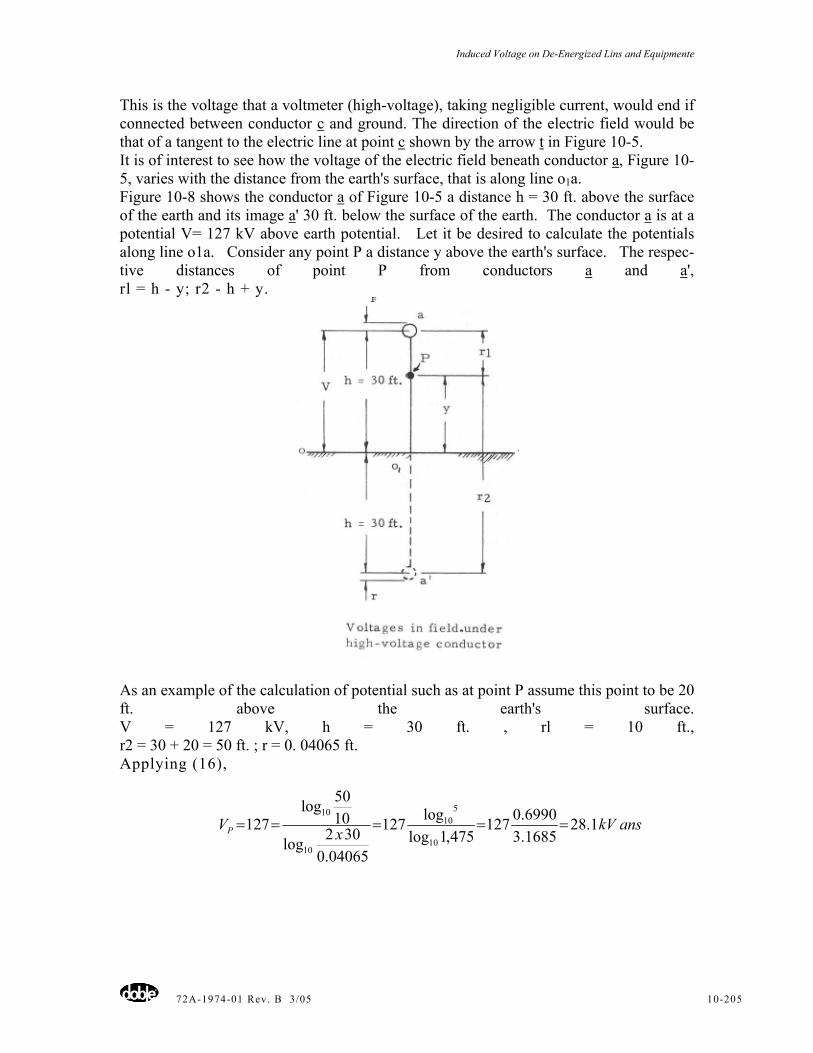
Induced Voltage on De-Energized Lins and Equipmente
72A-1974-01 Rev. B 3/05 10-205
This is the voltage that a voltmeter (high-voltage), taking negligible current, would end if connected between conductor c and ground. The direction of the electric field would be that of a tangent to the electric line at point c shown by the arrow t in Figure 10-5. It is of interest to see how the voltage of the electric field beneath conductor a, Figure 10-5, varies with the distance from the earth's surface, that is along line o1a. Figure 10-8 shows the conductor a of Figure 10-5 a distance h = 30 ft. above the surface of the earth and its image a' 30 ft. below the surface of the earth. The conductor a is at a potential V= 127 kV above earth potential. Let it be desired to calculate the potentials along line o1a. Consider any point P a distance y above the earth's surface. The respec-tive distances of point P from conductors a and a', rl = h - y; r2 - h + y.
As an example of the calculation of potential such as at point P assume this point to be 20 ft. above the earth's surface. V = 127 kV, h = 30 ft. , rl = 10 ft., r2 = 30 + 20 = 50 ft. ; r = 0. 04065 ft. Applying (16),
anskVxVP 1.281685.36990.0127
475,1loglog127
04065.0302log
1050log
12710
510
10
10=====
Induced Voltage on De-Energized Lins and Equipmente
72A-1974-01 Rev. B 3/05 10-206
Applying (16) for other points along line ola the corresponding potentials are calculated and are plotted in Figure 10-9 as a function of distance y from the earth's surface, or Point ol. Note that the potential increases very slowly up to 27 feet and then begins to rise very rapidly as the conductor surface is approached. For example, the potential rises from about 70 kV at 29 feet to the full 127 kV in a distance of only one foot from the conductor. This is illustrated graphically in the concentration of the electric lines near the conductor shown in Figure 10-5 as well as in Figure 10-4. Note that the potential of the field at a distance of 6 feet above the earth's surface, the approximate height of a man's head, is 6 kV. With a modern 500-kV line and assuming a height h of 40 feet, allowing for sagging, the corresponding voltage would be approximately 16 kV and at 750 kV, 24 kV.
If a person standing beneath such lines is insulated from ground, as by rubber-sole shoes, or if standing on an insulated platform, as in Figure 10-12, almost certainly he would feel the ''static'' corresponding to these high electric field potentials. If not insulated from ground, the relatively low impedance of his body in series with the very high capacitive reactance between him and the overhead line would quite likely limit the current through his body to ground to a safe value. However, any position on the ground under a high-voltage Power line is a potential danger hazard and should be avoided whenever possible. (Also, see Figures 12 and 13.)
10.6 Field Produced by Three-Phase Line In the analyses of electrical systems a most useful method is the Superposition Theorem that in effect states that the total electrical resultant occurring at any one point is the summation of the individual electrical effects acting independently at that point. This theorem is readily applied to the electric field produced by the several over-head energized conductors. Since three-phase systems are the most common their combined effect at any point will be considered. Figure 10-10(a) shows the three 3-phase overhead energized conductors a, b and c lying in a horizontal plane a distance h above the earth's
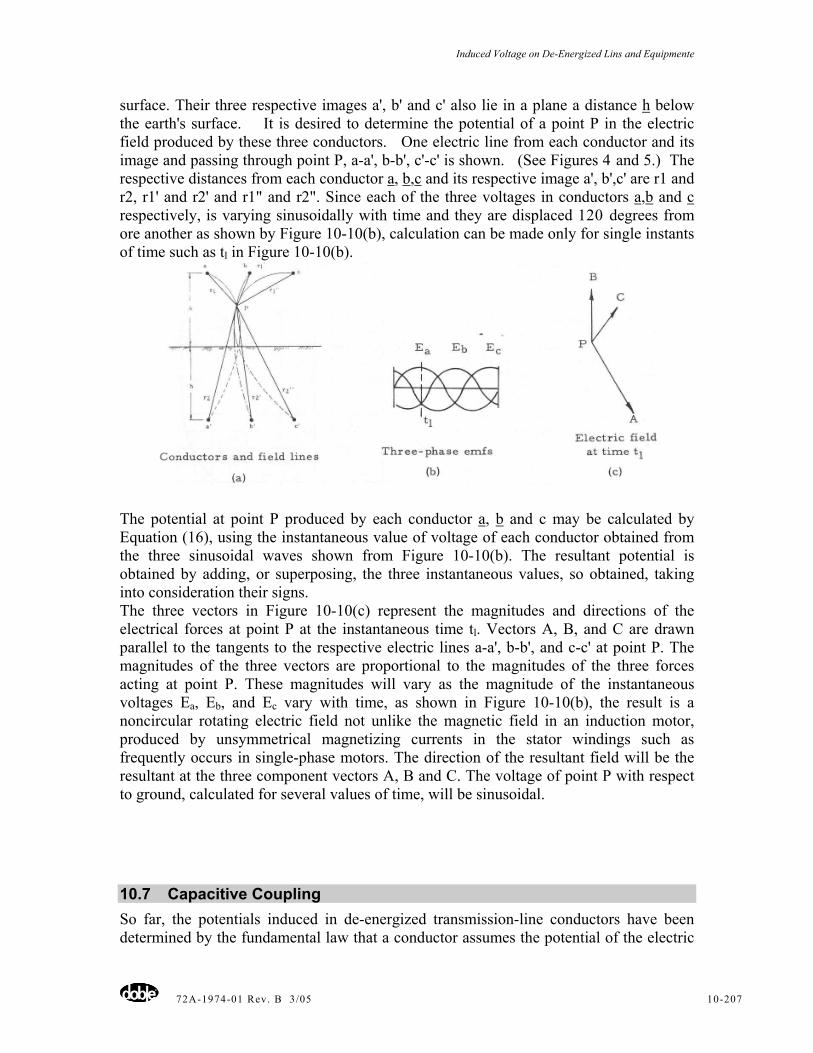
Induced Voltage on De-Energized Lins and Equipmente
72A-1974-01 Rev. B 3/05 10-207
surface. Their three respective images a', b' and c' also lie in a plane a distance h below the earth's surface. It is desired to determine the potential of a point P in the electric field produced by these three conductors. One electric line from each conductor and its image and passing through point P, a-a', b-b', c'-c' is shown. (See Figures 4 and 5.) The respective distances from each conductor a, b,c and its respective image a', b',c' are r1 and r2, r1' and r2' and r1" and r2". Since each of the three voltages in conductors a,b and c respectively, is varying sinusoidally with time and they are displaced 120 degrees from ore another as shown by Figure 10-10(b), calculation can be made only for single instants of time such as tl in Figure 10-10(b).
The potential at point P produced by each conductor a, b and c may be calculated by Equation (16), using the instantaneous value of voltage of each conductor obtained from the three sinusoidal waves shown from Figure 10-10(b). The resultant potential is obtained by adding, or superposing, the three instantaneous values, so obtained, taking into consideration their signs. The three vectors in Figure 10-10(c) represent the magnitudes and directions of the electrical forces at point P at the instantaneous time tl. Vectors A, B, and C are drawn parallel to the tangents to the respective electric lines a-a', b-b', and c-c' at point P. The magnitudes of the three vectors are proportional to the magnitudes of the three forces acting at point P. These magnitudes will vary as the magnitude of the instantaneous voltages Ea, Eb, and Ec vary with time, as shown in Figure 10-10(b), the result is a noncircular rotating electric field not unlike the magnetic field in an induction motor, produced by unsymmetrical magnetizing currents in the stator windings such as frequently occurs in single-phase motors. The direction of the resultant field will be the resultant at the three component vectors A, B and C. The voltage of point P with respect to ground, calculated for several values of time, will be sinusoidal.
10.7 Capacitive Coupling So far, the potentials induced in de-energized transmission-line conductors have been determined by the fundamental law that a conductor assumes the potential of the electric
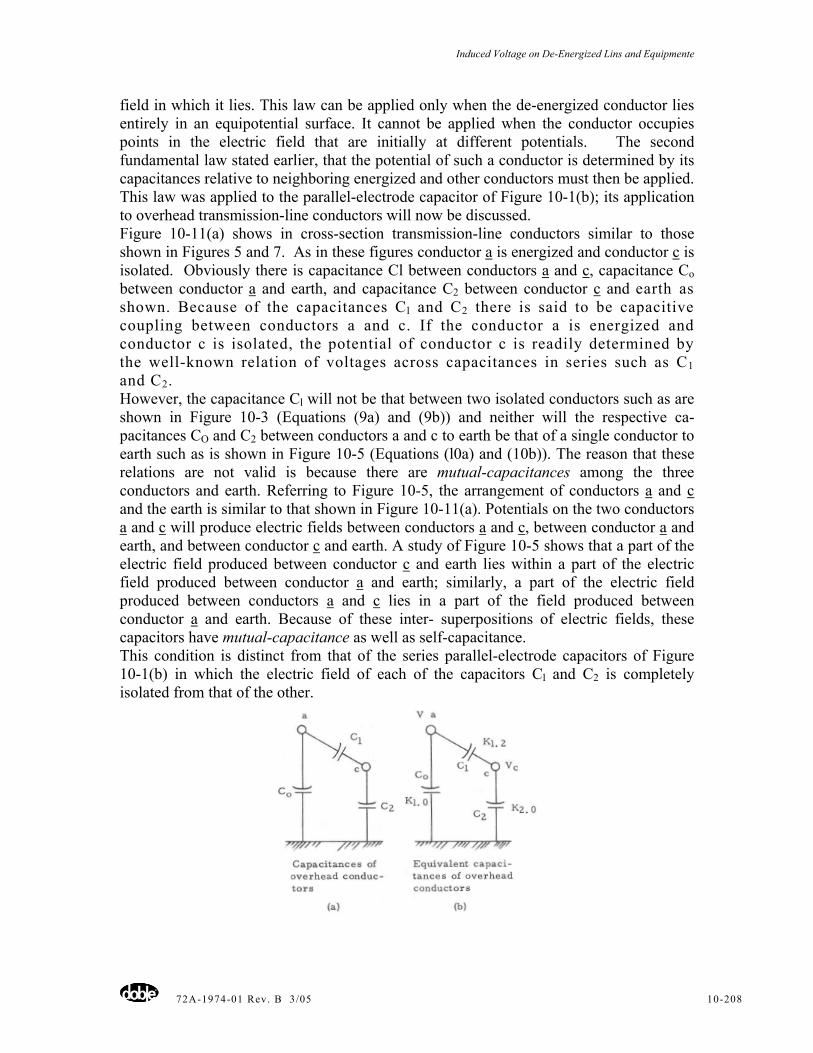
Induced Voltage on De-Energized Lins and Equipmente
72A-1974-01 Rev. B 3/05 10-208
field in which it lies. This law can be applied only when the de-energized conductor lies entirely in an equipotential surface. It cannot be applied when the conductor occupies points in the electric field that are initially at different potentials. The second fundamental law stated earlier, that the potential of such a conductor is determined by its capacitances relative to neighboring energized and other conductors must then be applied. This law was applied to the parallel-electrode capacitor of Figure 10-1(b); its application to overhead transmission-line conductors will now be discussed. Figure 10-11(a) shows in cross-section transmission-line conductors similar to those shown in Figures 5 and 7. As in these figures conductor a is energized and conductor c is isolated. Obviously there is capacitance Cl between conductors a and c, capacitance Co between conductor a and earth, and capacitance C2 between conductor c and earth as shown. Because of the capacitances Cl and C2 there is said to be capacitive coupling between conductors a and c. If the conductor a is energized and conductor c is isolated, the potential of conductor c is readily determined by the well-known relation of voltages across capacitances in series such as C1 and C2. However, the capacitance Cl will not be that between two isolated conductors such as are shown in Figure 10-3 (Equations (9a) and (9b)) and neither will the respective ca-pacitances CO and C2 between conductors a and c to earth be that of a single conductor to earth such as is shown in Figure 10-5 (Equations (l0a) and (10b)). The reason that these relations are not valid is because there are mutual-capacitances among the three conductors and earth. Referring to Figure 10-5, the arrangement of conductors a and c and the earth is similar to that shown in Figure 10-11(a). Potentials on the two conductors a and c will produce electric fields between conductors a and c, between conductor a and earth, and between conductor c and earth. A study of Figure 10-5 shows that a part of the electric field produced between conductor c and earth lies within a part of the electric field produced between conductor a and earth; similarly, a part of the electric field produced between conductors a and c lies in a part of the field produced between conductor a and earth. Because of these inter- superpositions of electric fields, these capacitors have mutual-capacitance as well as self-capacitance. This condition is distinct from that of the series parallel-electrode capacitors of Figure 10-1(b) in which the electric field of each of the capacitors Cl and C2 is completely isolated from that of the other.
Induced Voltage on De-Energized Lins and Equipmente
72A-1974-01 Rev. B 3/05 10-209
The calculation of the capacitance of such a system must take into consideration the mutual- capacitances as well as the self -capacitances. This involves the application of the Maxwell capacitance coefficients*. Figure 10-11(b) shows the conductors a and c and the earth of Figure 10-ll(a) including the three capacitors Co, C2, and Cl espectively between conductor a and earth, conductor c and earth, and between conductors a and c. These respective equivalent capacitances are designated by the Maxwell capacitance coefficients K1.0, K2.0, and Kl.2 which, in turn, are derived from the Maxwell self and mutual-capacitance coefficients of the system of overhead conductors and earth. The capacitance K1.2 is the capacitive coupling between conductors a and c. The capacitance Kl.2 is proportional to the lengths of the conductors so that it follows that capacitance coupling is also proportional to the length of the conductors. Likewise, the capacitances Kl.0 and K2.0 are proportional to the lengths of the conductors. However, the fact that the potential of the isolated conductor relative to earth potential is proportional to the ratio Kl.2/(Kl.2 + K2.0), all of which terms are proportional to the length of conductor, again confirms the fact that the potential of the isolated conductor is Independent of Length. *The Maxwell capacitance coefficients are discussed completely in References (3) and (4). In the Minutes of the Fourth Annual Conference of Doble Clients, page 31, 1937, Dr. R.H. Marvin also shows the application of these coefficients to the mutual capacitances among transformer windings and ground. These coefficients also are commonly used with multi-conductor underground cable where obviously mutual-capacitance exists. With cables, capacitance measurements usually can be made without much difficulty and from the values so obtained the several coefficients are readily calculated. With overhead power lines usually there are at least three power conductors, one or more ground wires, and the earth. Calculations of self--and mutual-capacitance coefficients of such multi-conductor systems obviously involve the solution of several simultaneous equations, which clearly is beyond the scope of this paper. Moreover, because of their exposure to outside inductive influences it is quite difficult to measure the capacitances of overhead power lines, particularly long ones. However, the author, using the foregoing Maxwell capacitance coefficients has calculated the values of K1.0, K2.0, and K1.2 per 1,000 feet of the system of Figure 10-11 with the conductor spacings as shown in Figure 10-7. The values are as follows:
fKfKfK µµµ 6Ι=== 00044.0;002087.0;00195.0 2.10.20.1
voltsKK
KVVC0.22.1
2.1
+= (17)
Where V is the potential of conductor a. For example, with V = 127 kV,
kVVC 4.22002087.0000446.0
000446.0127 =+
=
Which agrees with the value calculated by Equation (16), Page 3-110. The fact that in Equation (17) each of the two quantities K1.2 and K2.0 is proportional to the length of conductors again is proof that the induced voltage in the isolated conductor is independent of length.
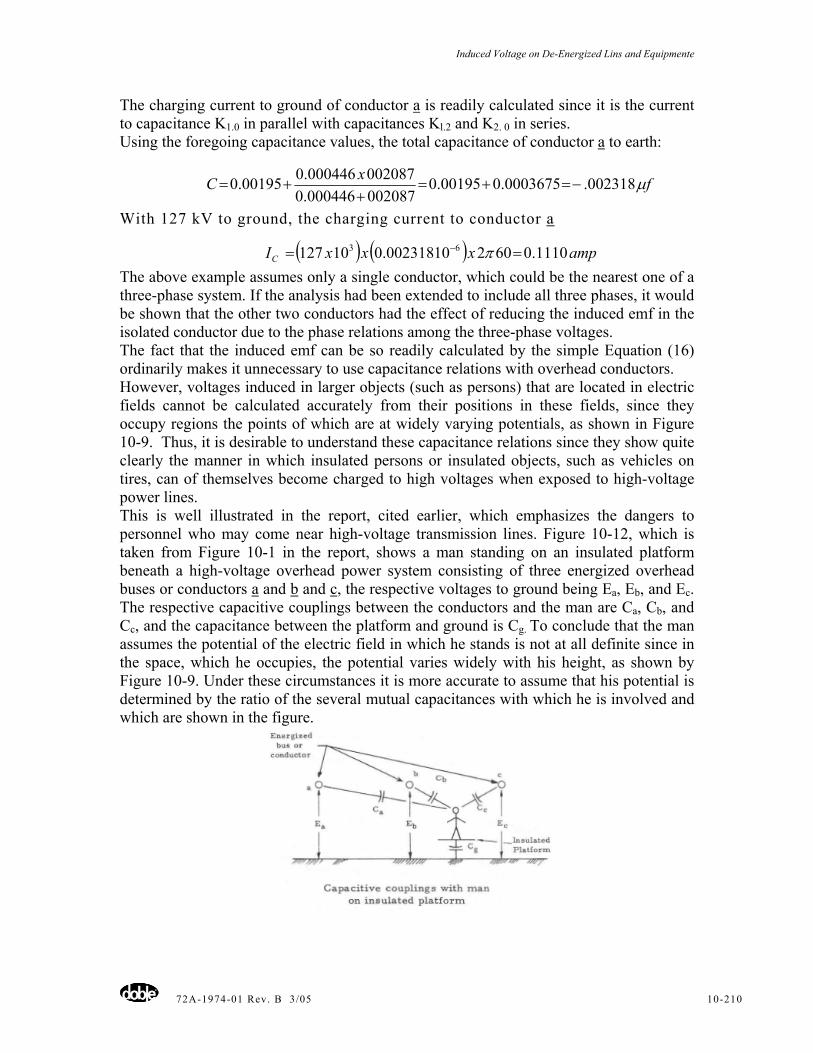
Induced Voltage on De-Energized Lins and Equipmente
72A-1974-01 Rev. B 3/05 10-210
The charging current to ground of conductor a is readily calculated since it is the current to capacitance K1.0 in parallel with capacitances Kl.2 and K2. 0 in series. Using the foregoing capacitance values, the total capacitance of conductor a to earth:
fxC µ002318.0003675.000195.0002087000446.0002087000446.000195.0 −=+=
++=
With 127 kV to ground, the charging current to conductor a
( ) ( ) ampxxxIC 1110.060210002318.010127 63 == − π
The above example assumes only a single conductor, which could be the nearest one of a three-phase system. If the analysis had been extended to include all three phases, it would be shown that the other two conductors had the effect of reducing the induced emf in the isolated conductor due to the phase relations among the three-phase voltages. The fact that the induced emf can be so readily calculated by the simple Equation (16) ordinarily makes it unnecessary to use capacitance relations with overhead conductors. However, voltages induced in larger objects (such as persons) that are located in electric fields cannot be calculated accurately from their positions in these fields, since they occupy regions the points of which are at widely varying potentials, as shown in Figure 10-9. Thus, it is desirable to understand these capacitance relations since they show quite clearly the manner in which insulated persons or insulated objects, such as vehicles on tires, can of themselves become charged to high voltages when exposed to high-voltage power lines. This is well illustrated in the report, cited earlier, which emphasizes the dangers to personnel who may come near high-voltage transmission lines. Figure 10-12, which is taken from Figure 10-1 in the report, shows a man standing on an insulated platform beneath a high-voltage overhead power system consisting of three energized overhead buses or conductors a and b and c, the respective voltages to ground being Ea, Eb, and Ec. The respective capacitive couplings between the conductors and the man are Ca, Cb, and Cc, and the capacitance between the platform and ground is Cg. To conclude that the man assumes the potential of the electric field in which he stands is not at all definite since in the space, which he occupies, the potential varies widely with his height, as shown by Figure 10-9. Under these circumstances it is more accurate to assume that his potential is determined by the ratio of the several mutual capacitances with which he is involved and which are shown in the figure.
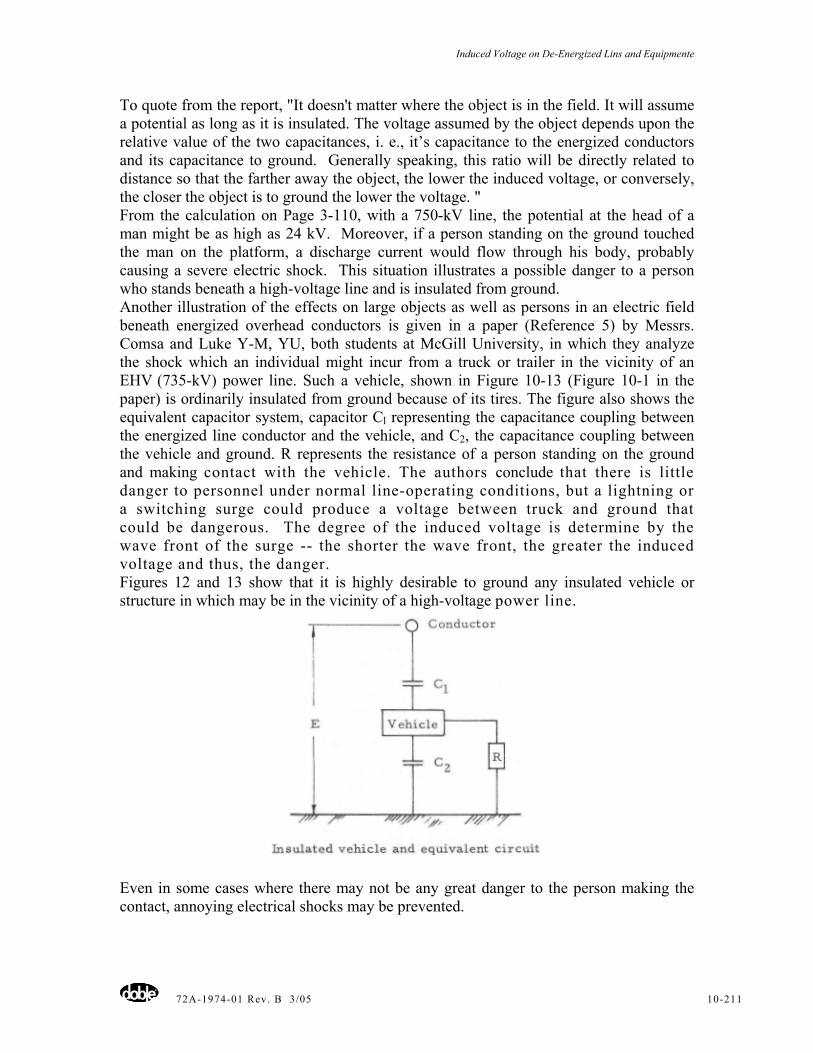
Induced Voltage on De-Energized Lins and Equipmente
72A-1974-01 Rev. B 3/05 10-211
To quote from the report, "It doesn't matter where the object is in the field. It will assume a potential as long as it is insulated. The voltage assumed by the object depends upon the relative value of the two capacitances, i. e., it’s capacitance to the energized conductors and its capacitance to ground. Generally speaking, this ratio will be directly related to distance so that the farther away the object, the lower the induced voltage, or conversely, the closer the object is to ground the lower the voltage. " From the calculation on Page 3-110, with a 750-kV line, the potential at the head of a man might be as high as 24 kV. Moreover, if a person standing on the ground touched the man on the platform, a discharge current would flow through his body, probably causing a severe electric shock. This situation illustrates a possible danger to a person who stands beneath a high-voltage line and is insulated from ground. Another illustration of the effects on large objects as well as persons in an electric field beneath energized overhead conductors is given in a paper (Reference 5) by Messrs. Comsa and Luke Y-M, YU, both students at McGill University, in which they analyze the shock which an individual might incur from a truck or trailer in the vicinity of an EHV (735-kV) power line. Such a vehicle, shown in Figure 10-13 (Figure 10-1 in the paper) is ordinarily insulated from ground because of its tires. The figure also shows the equivalent capacitor system, capacitor Cl representing the capacitance coupling between the energized line conductor and the vehicle, and C2, the capacitance coupling between the vehicle and ground. R represents the resistance of a person standing on the ground and making contact with the vehicle. The authors conclude that there is little danger to personnel under normal line-operating conditions, but a lightning or a switching surge could produce a voltage between truck and ground that could be dangerous. The degree of the induced voltage is determine by the wave front of the surge -- the shorter the wave front, the greater the induced voltage and thus, the danger. Figures 12 and 13 show that it is highly desirable to ground any insulated vehicle or structure in which may be in the vicinity of a high-voltage power line.
Even in some cases where there may not be any great danger to the person making the contact, annoying electrical shocks may be prevented.
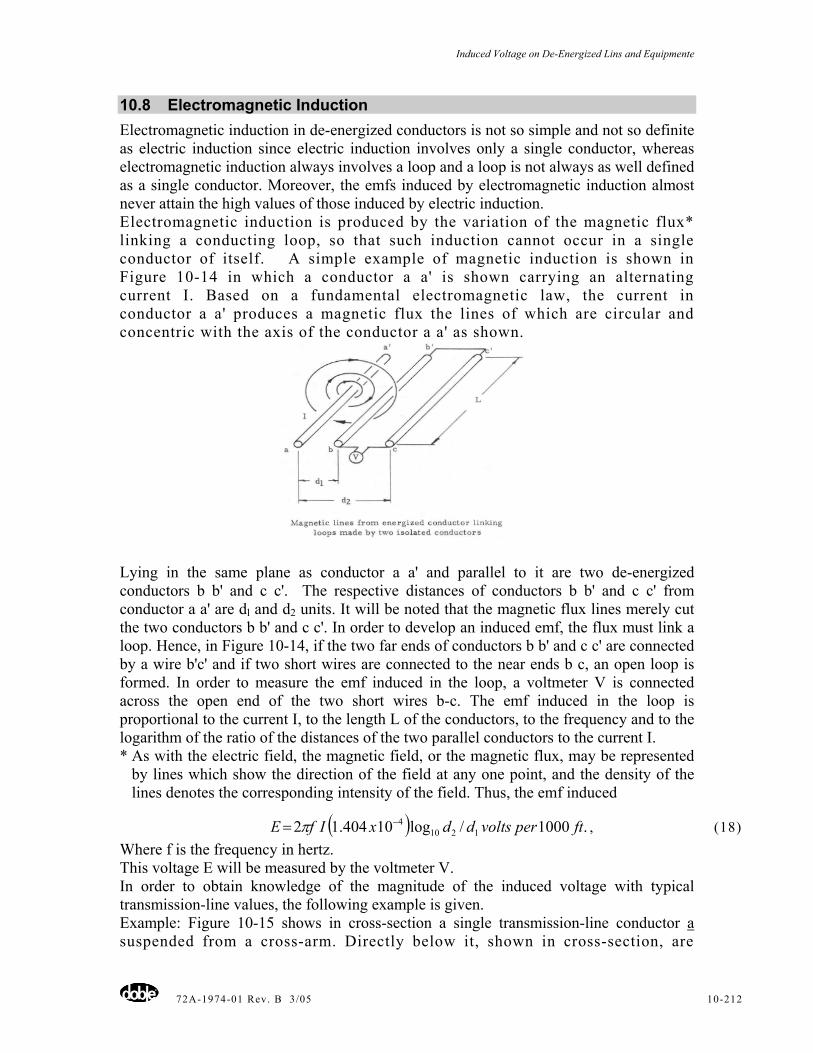
Induced Voltage on De-Energized Lins and Equipmente
72A-1974-01 Rev. B 3/05 10-212
10.8 Electromagnetic Induction Electromagnetic induction in de-energized conductors is not so simple and not so definite as electric induction since electric induction involves only a single conductor, whereas electromagnetic induction always involves a loop and a loop is not always as well defined as a single conductor. Moreover, the emfs induced by electromagnetic induction almost never attain the high values of those induced by electric induction. Electromagnetic induction is produced by the variation of the magnetic flux* linking a conducting loop, so that such induction cannot occur in a single conductor of itself. A simple example of magnetic induction is shown in Figure 10-14 in which a conductor a a' is shown carrying an alternating current I. Based on a fundamental electromagnetic law, the current in conductor a a' produces a magnetic flux the lines of which are circular and concentric with the axis of the conductor a a' as shown.
Lying in the same plane as conductor a a' and parallel to it are two de-energized conductors b b' and c c'. The respective distances of conductors b b' and c c' from conductor a a' are dl and d2 units. It will be noted that the magnetic flux lines merely cut the two conductors b b' and c c'. In order to develop an induced emf, the flux must link a loop. Hence, in Figure 10-14, if the two far ends of conductors b b' and c c' are connected by a wire b'c' and if two short wires are connected to the near ends b c, an open loop is formed. In order to measure the emf induced in the loop, a voltmeter V is connected across the open end of the two short wires b-c. The emf induced in the loop is proportional to the current I, to the length L of the conductors, to the frequency and to the logarithm of the ratio of the distances of the two parallel conductors to the current I. * As with the electric field, the magnetic field, or the magnetic flux, may be represented
by lines which show the direction of the field at any one point, and the density of the lines denotes the corresponding intensity of the field. Thus, the emf induced
( ) .1000/log10404.12 12104 ftpervoltsddxIfE −= π , (18)
Where f is the frequency in hertz. This voltage E will be measured by the voltmeter V. In order to obtain knowledge of the magnitude of the induced voltage with typical transmission-line values, the following example is given. Example: Figure 10-15 shows in cross-section a single transmission-line conductor a suspended from a cross-arm. Directly below it, shown in cross-section, are
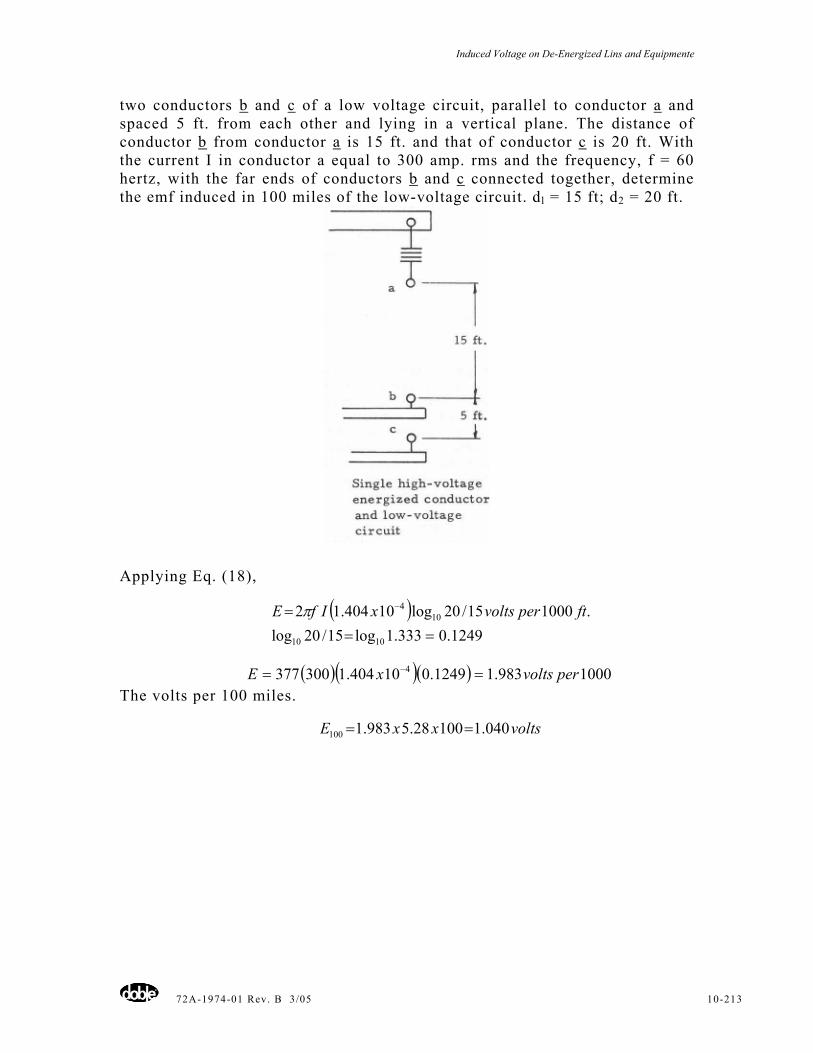
Induced Voltage on De-Energized Lins and Equipmente
72A-1974-01 Rev. B 3/05 10-213
two conductors b and c of a low voltage circuit, parallel to conductor a and spaced 5 ft. from each other and lying in a vertical plane. The distance of conductor b from conductor a is 15 ft. and that of conductor c is 20 ft. With the current I in conductor a equal to 300 amp. rms and the frequency, f = 60 hertz, with the far ends of conductors b and c connected together, determine the emf induced in 100 miles of the low-voltage circuit. dl = 15 ft; d2 = 20 ft.
Applying Eq. (18),
( )
1249.0333.1log15/20log.100015/20log10404.12
1010
104
=== − ftpervoltsxIfE π
( )( )( ) 1000983.11249.010404.1300377 4 pervoltsxE == − The volts per 100 miles.
voltsxxE 040.110028.5983.1100 ==
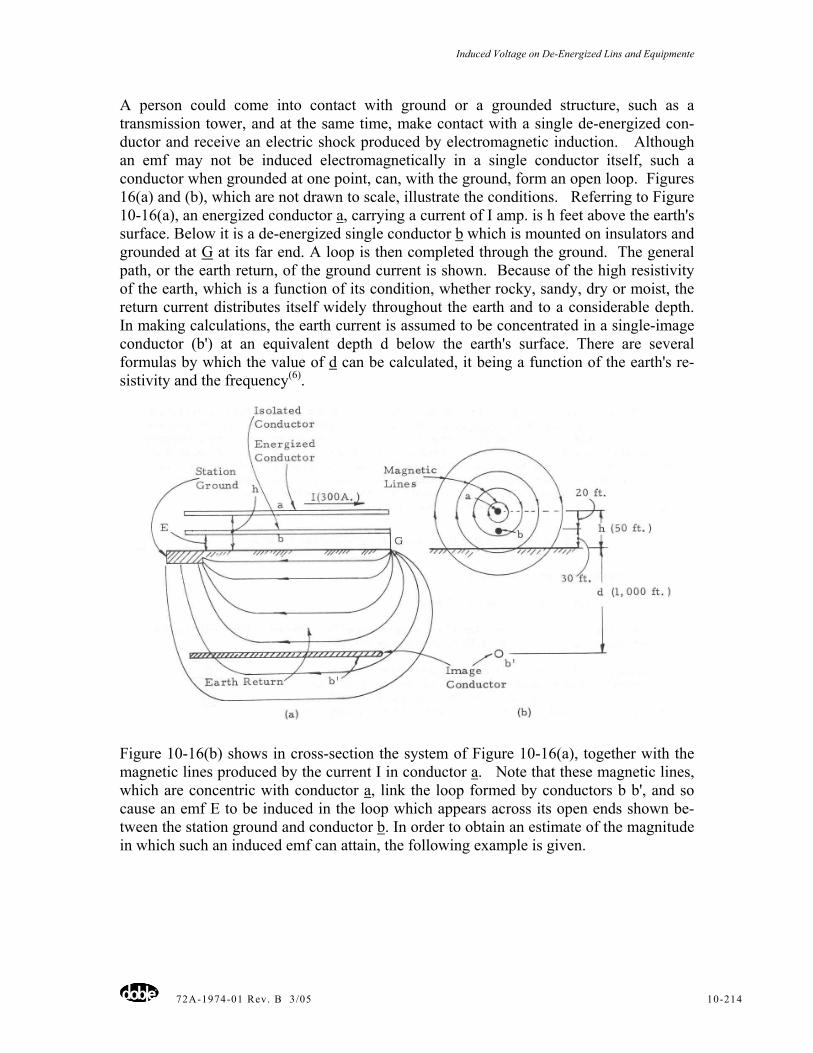
Induced Voltage on De-Energized Lins and Equipmente
72A-1974-01 Rev. B 3/05 10-214
A person could come into contact with ground or a grounded structure, such as a transmission tower, and at the same time, make contact with a single de-energized con-ductor and receive an electric shock produced by electromagnetic induction. Although an emf may not be induced electromagnetically in a single conductor itself, such a conductor when grounded at one point, can, with the ground, form an open loop. Figures 16(a) and (b), which are not drawn to scale, illustrate the conditions. Referring to Figure 10-16(a), an energized conductor a, carrying a current of I amp. is h feet above the earth's surface. Below it is a de-energized single conductor b which is mounted on insulators and grounded at G at its far end. A loop is then completed through the ground. The general path, or the earth return, of the ground current is shown. Because of the high resistivity of the earth, which is a function of its condition, whether rocky, sandy, dry or moist, the return current distributes itself widely throughout the earth and to a considerable depth. In making calculations, the earth current is assumed to be concentrated in a single-image conductor (b') at an equivalent depth d below the earth's surface. There are several formulas by which the value of d can be calculated, it being a function of the earth's re-sistivity and the frequency(6).
Figure 10-16(b) shows in cross-section the system of Figure 10-16(a), together with the magnetic lines produced by the current I in conductor a. Note that these magnetic lines, which are concentric with conductor a, link the loop formed by conductors b b', and so cause an emf E to be induced in the loop which appears across its open ends shown be-tween the station ground and conductor b. In order to obtain an estimate of the magnitude in which such an induced emf can attain, the following example is given.
Induced Voltage on De-Energized Lins and Equipmente
72A-1974-01 Rev. B 3/05 10-215
Example: In Figures 16(a) and (b), the energized conductor a is 50 ft. above the earth's surface and carries a current I = 300 amp. and the frequency is 60 hertz. Twenty feet below conductor a, there is a de-energized single conductor b on insulators and grounded at its far end at G, 50 miles distant. Without knowing the ground conditions, the depth d of the image conductor b can be assumed to be 1,000 ft., a typical value. (Being a logarithm function, the depth d is not critical.) Applying Equation (18) in which dl =20 ft. and d2= 1050 ft.
( )( )
720.15.52log20/1050log.100020/1050log10404.1300602
1010
104
=== − ftpervoltsxE π
( )( )( )
AnsmilespervoltsxxEftpervoltsxE
.50210,75028.54.27.10004.27720.110404.1300602
50
4
==== −π
The induced emf in each of the foregoing examples is of course dangerous, particularly if good contact is made. Hence, the two conductors of Figure 10-15 should be short-circuited and grounded and the conductor of Figure 10-16 also solidly grounded at the point where a person may come in contact with it. As a matter of fact, in order to obtain protection from electric induction, these conductors would necessarily be grounded anyway. It should be pointed out that the foregoing conditions assumed for electromagnetic induction are optimum for producing a high value of induced voltage. Referring to Fig-ures 14 and 15 only, the effect of the induction produced by a single energized conductor is considered. Ordinarily, there would be the return energized conductor, or conductors, spaced only a short distance from conductor a and which carry current or currents of opposite sign from that in a. They would of course act to induce emfs of opposite sign and thus reduce materially the emfs induced by the single conductor. Moreover, a low-voltage, two-wire circuit on a tower line, such as is shown in Figure 10-15, almost certainly would be transposed several times in a 100-mile line and hence the electro-magnetic induction practically eliminated. Also, with the system shown in Figure 10-16, the currents in the return energized conductors would act in opposition to the current in conductor a and thus reduce materially the emf induced in the loop formed by conductor b and the ground return.
Induced Voltage on De-Energized Lins and Equipmente
72A-1974-01 Rev. B 3/05 10-216
10.9 References 1. ''Dielectric Theory and Practice'' C. L. Dawes and E. H. Povey. Presented at the
Thirty-First Annual Conference of Doble Clients, 1964. 2.A Course in Electrical Engineering, (a book), C. L. Dawes, McGraw-Hill Book
Company, Vol. I, Direct Currents, Chapters VII, VIII, IX, X, Vol. II, Alternating Currents, Chapter XIII.
3.A Treatise on the Theory of Alternating Currents, Alexander Russell, Cambridge University Press, Volume I, (a book).
4.Einfuhrung in die theoretische Elektrotechnik, (a book), K. Kupfmuller, Julius Springer, Berlin.
5.Transient Electrostatic Induction by EHV Transmission Lines, R. P. Comsa and Luke Y-M. Yu, Transactions Paper No. 69 TP, presented at the IEEE Power Meeting, New York, January, 1969.
6.Symmetrical Components, (a book), C. F. Wagner and R. D. Evans, McGraw-Hill Book Company.
Lightning
72A-1974-01 Rev. B 3/05 11-217
Chapter 11 - Lightning C.L. Dawes
Doble Engineering Company
11.1 Introduction The physical manifestations of lightning have, of course, existed from the remotest times. As early as 23 A. D. Pliney the Elder recorded: ‘‘Of thunderbolts themselves several variations are recorded--- Those with a dry flash do not cause fire but an explosion. The smoky ones do not burn but blacken.'' From that time until 1740 and 1750 when Benjamin Franklin in his historic experiment succeeded in identifying lightning with the static electricity known at that time, was any attempt made to determine the nature of lightning. Although in comparatively recent times the general physical phenomena of lightning were generally understood, little more was learned until the beginnings of the 1920's when longer and higher-voltage transmission lines more exposed to lightning were built and the need for their protection and a prevention of outages became acute. This spurred a program of intensive investigations of lightning phenomena almost entirely by the manufacturers and the utilities, and simultaneously, special instruments capable of measuring and recording the electrical characteristics of lightning strokes were developed. The information obtained from these investigations has made it possible to design lines and apparatus much less vulnerable to lightning strokes, and to provide greater protection for them.
11.2 Origin of Lightning and it’s Formation in the Clouds *(I) To (8) It is generally agreed that lightning is due to the accumulation of electric charges in the clouds that have been carried up by prevailing atmospheric conditions, but the detailed mechanisms of the formation of all such lightning charges are still controversial. Space will permit only general explanations, which include portions, at least, of the many proposed theories. There are always present in the atmosphere a large numbers of ions, some being positive and some negative, the numbers ranging from 1,000 to 10,000 per cubic centimeter. The negative ions, or electrons, are by far the more numerous. Many of these ions attach themselves to particles of dust and to the drops of water vapor, which are always present in the atmosphere. In fair weather the drops of moisture are drawn upwards by the action of the sun to form clouds and they carry up with them the attached electrons. The drops of moisture combine in the clouds to form much larger drops. Since the charges dwell on the surfaces of the drops, when the drops combine, the densities of surface charge become greater and greater, raising the voltage gradient. When the gradient becomes sufficiently great, it produces the electric breakdown of the air, which forms into the lightning strokes to earth. As is shown later, the preponderance of lightning strokes are negative showing that the accumulation of electrons in the clouds greatly exceeds that of the positive ions. The clouds and the earth thus form in effect a giant parallel-electrode capacitor, shown in Figure 11-1A, in which the clouds are
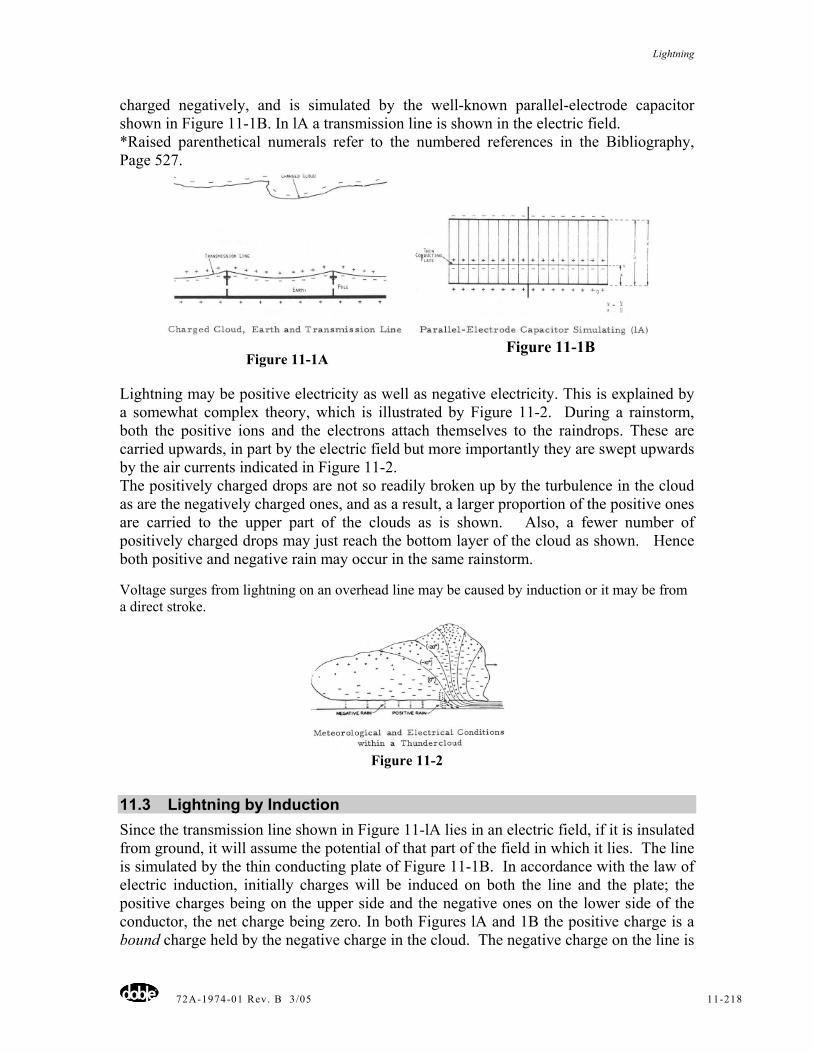
Lightning
72A-1974-01 Rev. B 3/05 11-218
charged negatively, and is simulated by the well-known parallel-electrode capacitor shown in Figure 11-1B. In lA a transmission line is shown in the electric field. *Raised parenthetical numerals refer to the numbered references in the Bibliography, Page 527.
Figure 11-1A Figure 11-1B
Lightning may be positive electricity as well as negative electricity. This is explained by a somewhat complex theory, which is illustrated by Figure 11-2. During a rainstorm, both the positive ions and the electrons attach themselves to the raindrops. These are carried upwards, in part by the electric field but more importantly they are swept upwards by the air currents indicated in Figure 11-2. The positively charged drops are not so readily broken up by the turbulence in the cloud as are the negatively charged ones, and as a result, a larger proportion of the positive ones are carried to the upper part of the clouds as is shown. Also, a fewer number of positively charged drops may just reach the bottom layer of the cloud as shown. Hence both positive and negative rain may occur in the same rainstorm.
Voltage surges from lightning on an overhead line may be caused by induction or it may be from a direct stroke.
Figure 11-2
11.3 Lightning by Induction Since the transmission line shown in Figure 11-lA lies in an electric field, if it is insulated from ground, it will assume the potential of that part of the field in which it lies. The line is simulated by the thin conducting plate of Figure 11-1B. In accordance with the law of electric induction, initially charges will be induced on both the line and the plate; the positive charges being on the upper side and the negative ones on the lower side of the conductor, the net charge being zero. In both Figures lA and 1B the positive charge is a bound charge held by the negative charge in the cloud. The negative charge on the line is
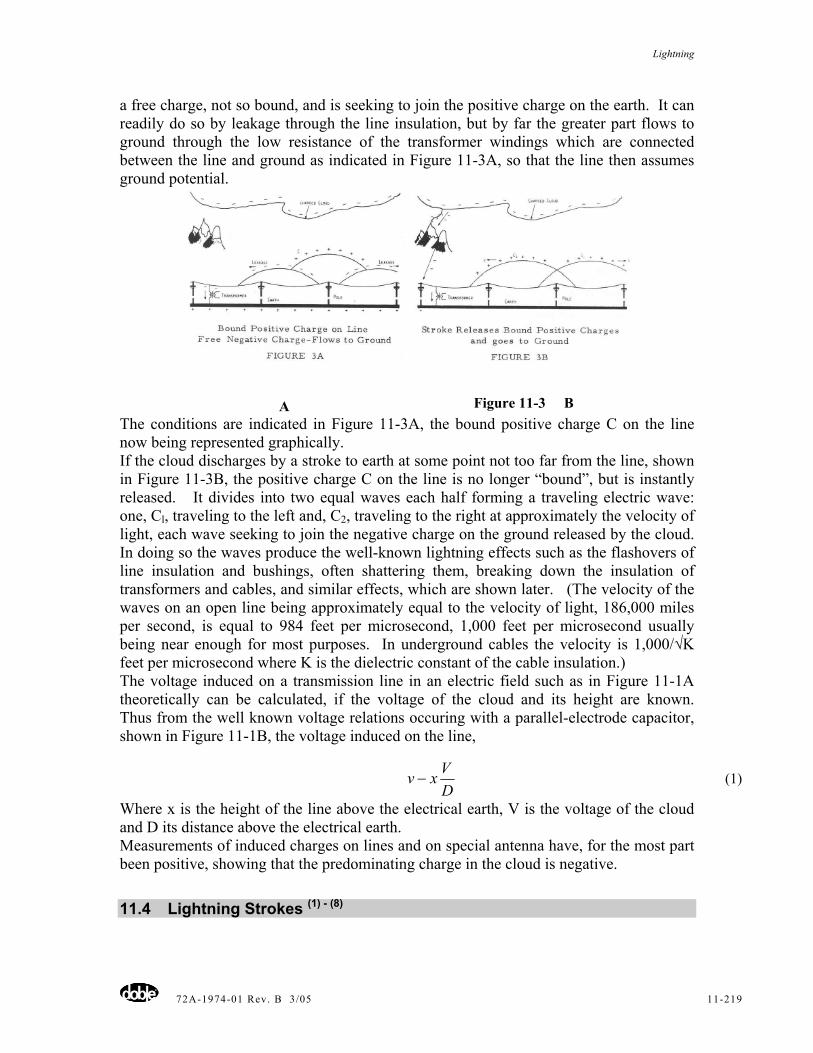
Lightning
72A-1974-01 Rev. B 3/05 11-219
a free charge, not so bound, and is seeking to join the positive charge on the earth. It can readily do so by leakage through the line insulation, but by far the greater part flows to ground through the low resistance of the transformer windings which are connected between the line and ground as indicated in Figure 11-3A, so that the line then assumes ground potential.
A Figure 11-3 B
The conditions are indicated in Figure 11-3A, the bound positive charge C on the line now being represented graphically. If the cloud discharges by a stroke to earth at some point not too far from the line, shown in Figure 11-3B, the positive charge C on the line is no longer “bound”, but is instantly released. It divides into two equal waves each half forming a traveling electric wave: one, Cl, traveling to the left and, C2, traveling to the right at approximately the velocity of light, each wave seeking to join the negative charge on the ground released by the cloud. In doing so the waves produce the well-known lightning effects such as the flashovers of line insulation and bushings, often shattering them, breaking down the insulation of transformers and cables, and similar effects, which are shown later. (The velocity of the waves on an open line being approximately equal to the velocity of light, 186,000 miles per second, is equal to 984 feet per microsecond, 1,000 feet per microsecond usually being near enough for most purposes. In underground cables the velocity is 1,000/√K feet per microsecond where K is the dielectric constant of the cable insulation.) The voltage induced on a transmission line in an electric field such as in Figure 11-1A theoretically can be calculated, if the voltage of the cloud and its height are known. Thus from the well known voltage relations occuring with a parallel-electrode capacitor, shown in Figure 11-1B, the voltage induced on the line,
DVxv − (1)
Where x is the height of the line above the electrical earth, V is the voltage of the cloud and D its distance above the electrical earth. Measurements of induced charges on lines and on special antenna have, for the most part been positive, showing that the predominating charge in the cloud is negative.
11.4 Lightning Strokes (1) - (8)
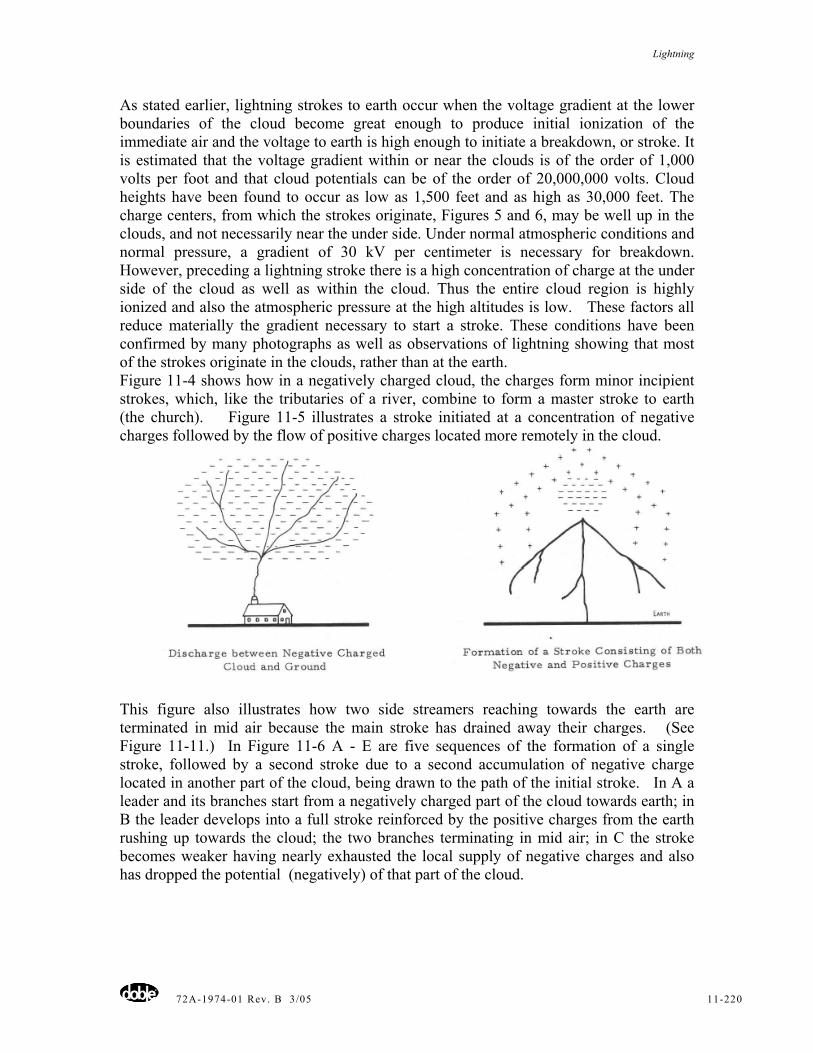
Lightning
72A-1974-01 Rev. B 3/05 11-220
As stated earlier, lightning strokes to earth occur when the voltage gradient at the lower boundaries of the cloud become great enough to produce initial ionization of the immediate air and the voltage to earth is high enough to initiate a breakdown, or stroke. It is estimated that the voltage gradient within or near the clouds is of the order of 1,000 volts per foot and that cloud potentials can be of the order of 20,000,000 volts. Cloud heights have been found to occur as low as 1,500 feet and as high as 30,000 feet. The charge centers, from which the strokes originate, Figures 5 and 6, may be well up in the clouds, and not necessarily near the under side. Under normal atmospheric conditions and normal pressure, a gradient of 30 kV per centimeter is necessary for breakdown. However, preceding a lightning stroke there is a high concentration of charge at the under side of the cloud as well as within the cloud. Thus the entire cloud region is highly ionized and also the atmospheric pressure at the high altitudes is low. These factors all reduce materially the gradient necessary to start a stroke. These conditions have been confirmed by many photographs as well as observations of lightning showing that most of the strokes originate in the clouds, rather than at the earth. Figure 11-4 shows how in a negatively charged cloud, the charges form minor incipient strokes, which, like the tributaries of a river, combine to form a master stroke to earth (the church). Figure 11-5 illustrates a stroke initiated at a concentration of negative charges followed by the flow of positive charges located more remotely in the cloud.
This figure also illustrates how two side streamers reaching towards the earth are terminated in mid air because the main stroke has drained away their charges. (See Figure 11-11.) In Figure 11-6 A - E are five sequences of the formation of a single stroke, followed by a second stroke due to a second accumulation of negative charge located in another part of the cloud, being drawn to the path of the initial stroke. In A a leader and its branches start from a negatively charged part of the cloud towards earth; in B the leader develops into a full stroke reinforced by the positive charges from the earth rushing up towards the cloud; the two branches terminating in mid air; in C the stroke becomes weaker having nearly exhausted the local supply of negative charges and also has dropped the potential (negatively) of that part of the cloud.
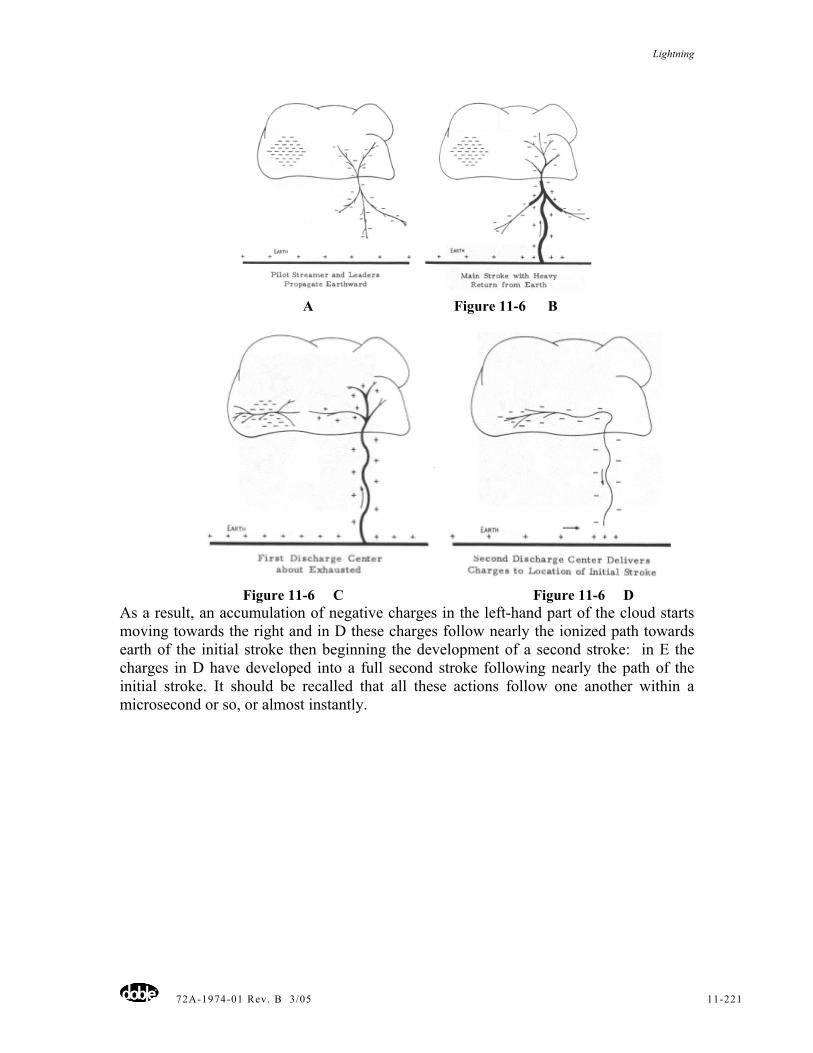
Lightning
72A-1974-01 Rev. B 3/05 11-221
A Figure 11-6 B
Figure 11-6 C Figure 11-6 D
As a result, an accumulation of negative charges in the left-hand part of the cloud starts moving towards the right and in D these charges follow nearly the ionized path towards earth of the initial stroke then beginning the development of a second stroke: in E the charges in D have developed into a full second stroke following nearly the path of the initial stroke. It should be recalled that all these actions follow one another within a microsecond or so, or almost instantly.
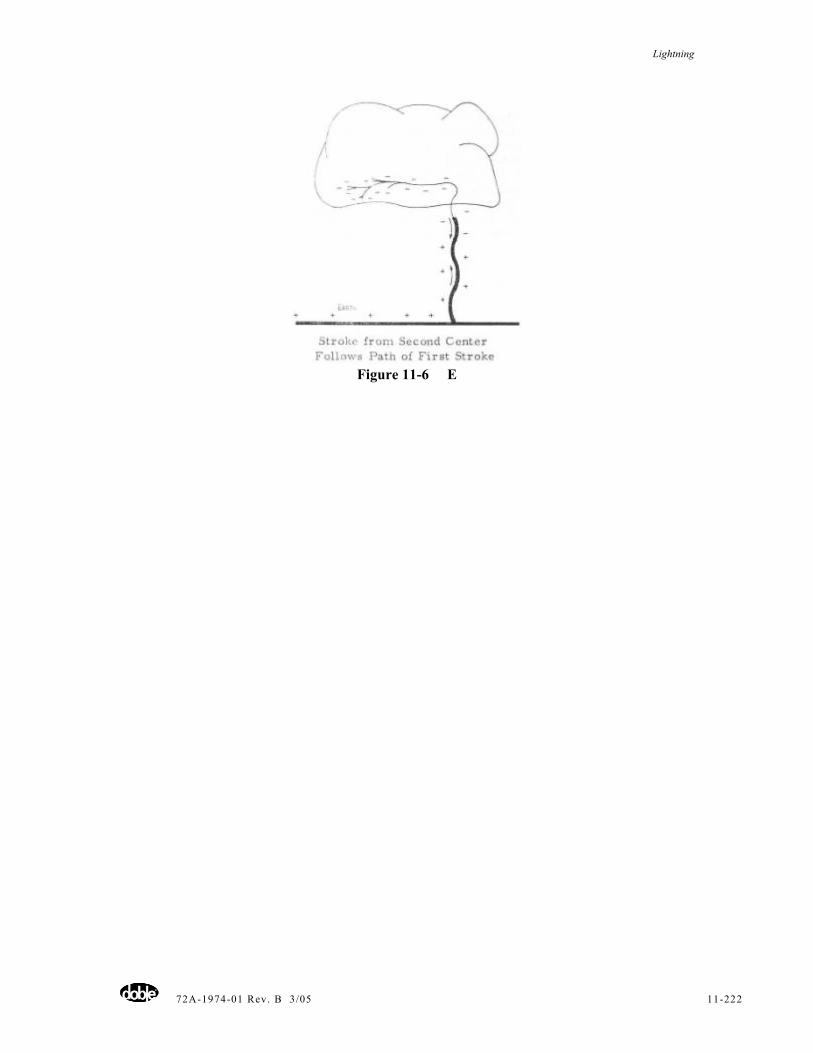
Lightning
72A-1974-01 Rev. B 3/05 11-222
Figure 11-6 E
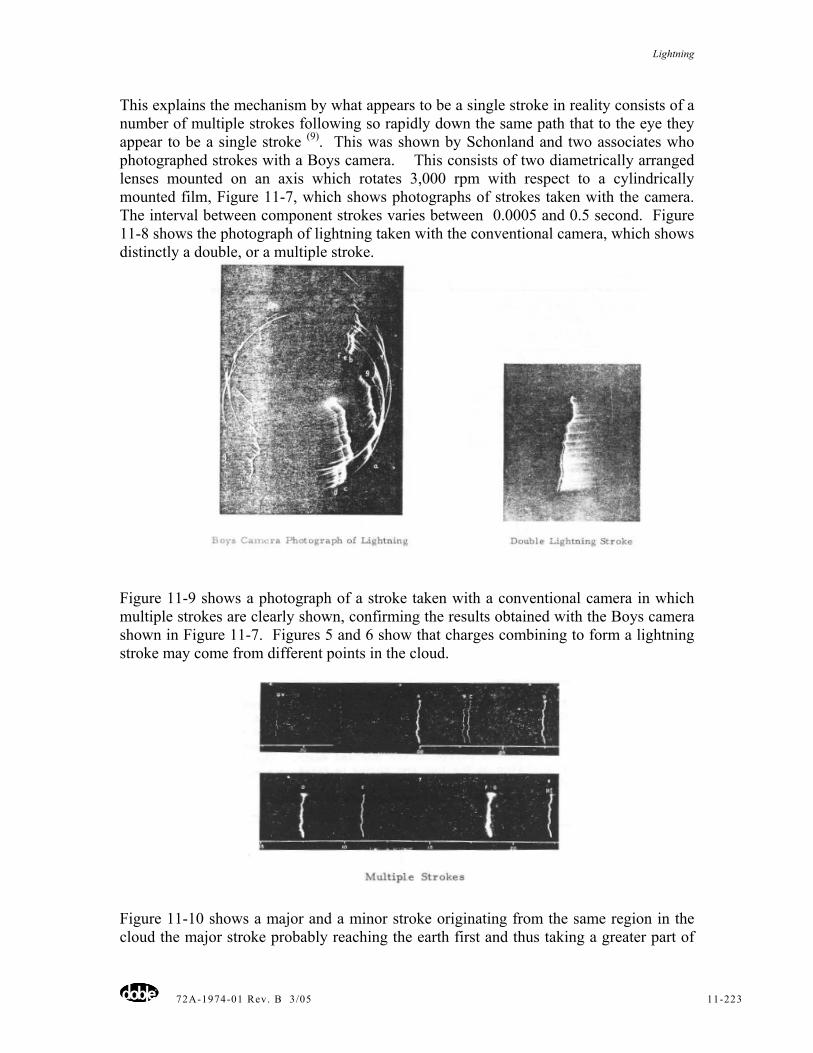
Lightning
72A-1974-01 Rev. B 3/05 11-223
This explains the mechanism by what appears to be a single stroke in reality consists of a number of multiple strokes following so rapidly down the same path that to the eye they appear to be a single stroke (9). This was shown by Schonland and two associates who photographed strokes with a Boys camera. This consists of two diametrically arranged lenses mounted on an axis which rotates 3,000 rpm with respect to a cylindrically mounted film, Figure 11-7, which shows photographs of strokes taken with the camera. The interval between component strokes varies between 0.0005 and 0.5 second. Figure 11-8 shows the photograph of lightning taken with the conventional camera, which shows distinctly a double, or a multiple stroke.
Figure 11-9 shows a photograph of a stroke taken with a conventional camera in which multiple strokes are clearly shown, confirming the results obtained with the Boys camera shown in Figure 11-7. Figures 5 and 6 show that charges combining to form a lightning stroke may come from different points in the cloud.
Figure 11-10 shows a major and a minor stroke originating from the same region in the cloud the major stroke probably reaching the earth first and thus taking a greater part of
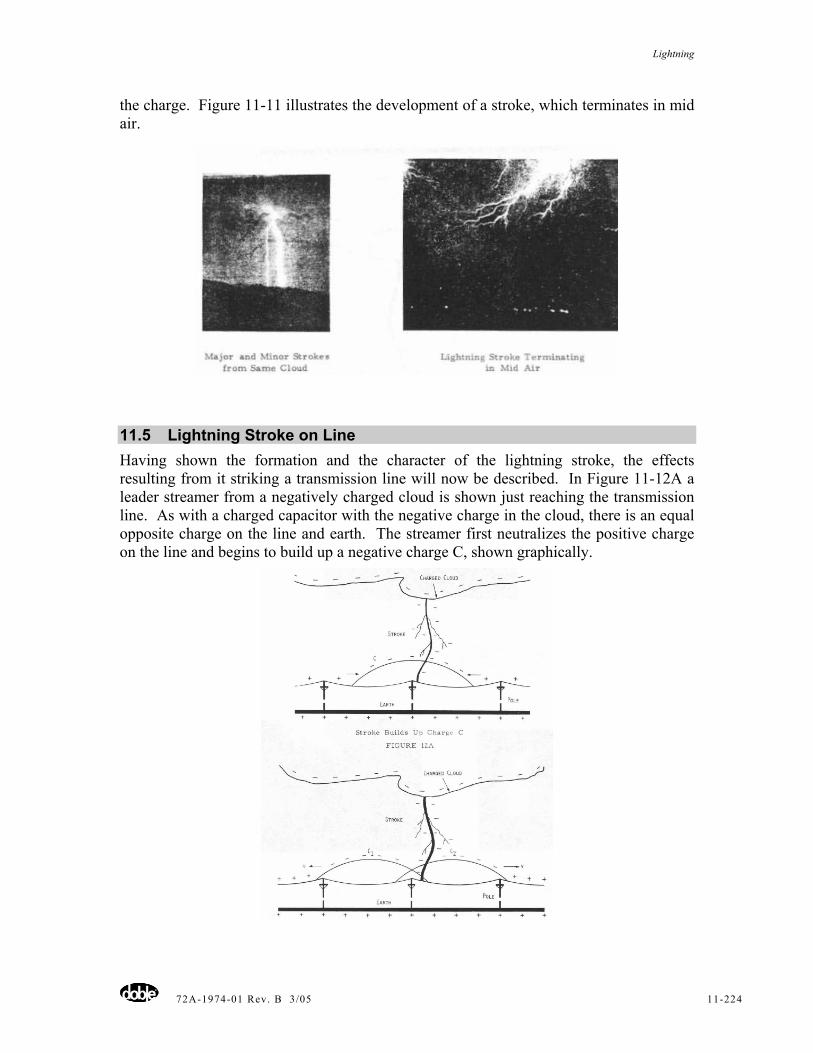
Lightning
72A-1974-01 Rev. B 3/05 11-224
the charge. Figure 11-11 illustrates the development of a stroke, which terminates in mid air.
11.5 Lightning Stroke on Line Having shown the formation and the character of the lightning stroke, the effects resulting from it striking a transmission line will now be described. In Figure 11-12A a leader streamer from a negatively charged cloud is shown just reaching the transmission line. As with a charged capacitor with the negative charge in the cloud, there is an equal opposite charge on the line and earth. The streamer first neutralizes the positive charge on the line and begins to build up a negative charge C, shown graphically.
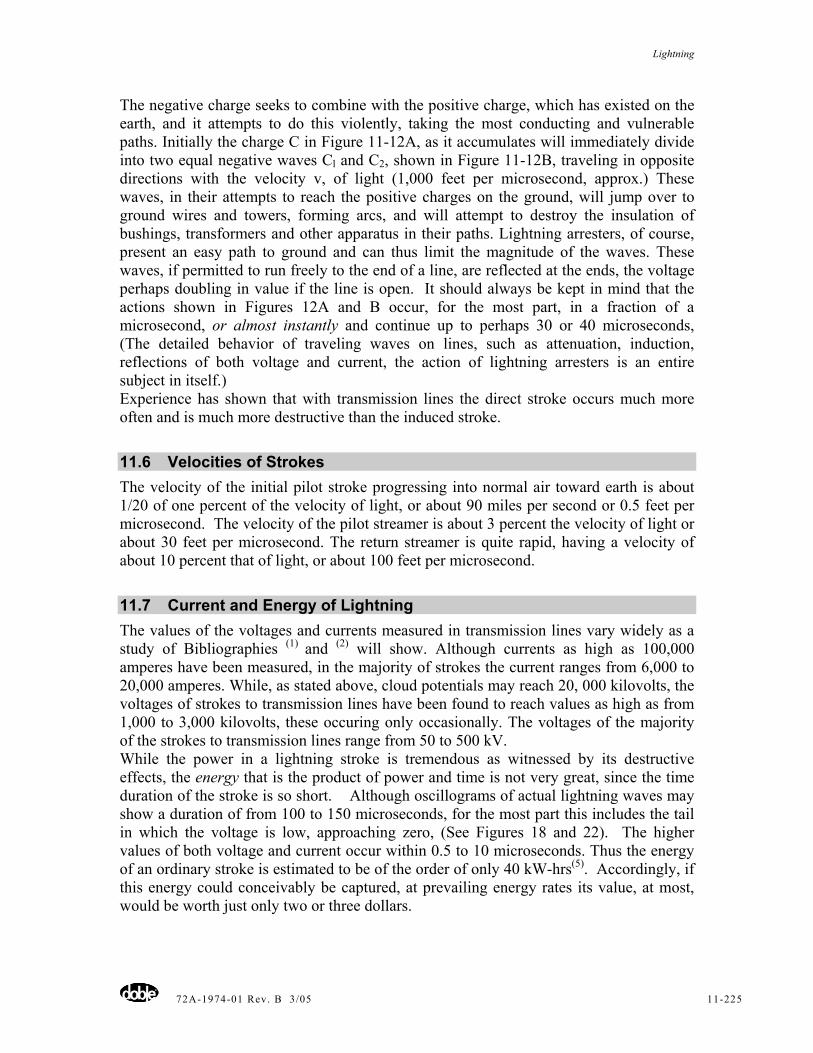
Lightning
72A-1974-01 Rev. B 3/05 11-225
The negative charge seeks to combine with the positive charge, which has existed on the earth, and it attempts to do this violently, taking the most conducting and vulnerable paths. Initially the charge C in Figure 11-12A, as it accumulates will immediately divide into two equal negative waves Cl and C2, shown in Figure 11-12B, traveling in opposite directions with the velocity v, of light (1,000 feet per microsecond, approx.) These waves, in their attempts to reach the positive charges on the ground, will jump over to ground wires and towers, forming arcs, and will attempt to destroy the insulation of bushings, transformers and other apparatus in their paths. Lightning arresters, of course, present an easy path to ground and can thus limit the magnitude of the waves. These waves, if permitted to run freely to the end of a line, are reflected at the ends, the voltage perhaps doubling in value if the line is open. It should always be kept in mind that the actions shown in Figures 12A and B occur, for the most part, in a fraction of a microsecond, or almost instantly and continue up to perhaps 30 or 40 microseconds, (The detailed behavior of traveling waves on lines, such as attenuation, induction, reflections of both voltage and current, the action of lightning arresters is an entire subject in itself.) Experience has shown that with transmission lines the direct stroke occurs much more often and is much more destructive than the induced stroke.
11.6 Velocities of Strokes The velocity of the initial pilot stroke progressing into normal air toward earth is about 1/20 of one percent of the velocity of light, or about 90 miles per second or 0.5 feet per microsecond. The velocity of the pilot streamer is about 3 percent the velocity of light or about 30 feet per microsecond. The return streamer is quite rapid, having a velocity of about 10 percent that of light, or about 100 feet per microsecond.
11.7 Current and Energy of Lightning The values of the voltages and currents measured in transmission lines vary widely as a study of Bibliographies (1) and (2) will show. Although currents as high as 100,000 amperes have been measured, in the majority of strokes the current ranges from 6,000 to 20,000 amperes. While, as stated above, cloud potentials may reach 20, 000 kilovolts, the voltages of strokes to transmission lines have been found to reach values as high as from 1,000 to 3,000 kilovolts, these occuring only occasionally. The voltages of the majority of the strokes to transmission lines range from 50 to 500 kV. While the power in a lightning stroke is tremendous as witnessed by its destructive effects, the energy that is the product of power and time is not very great, since the time duration of the stroke is so short. Although oscillograms of actual lightning waves may show a duration of from 100 to 150 microseconds, for the most part this includes the tail in which the voltage is low, approaching zero, (See Figures 18 and 22). The higher values of both voltage and current occur within 0.5 to 10 microseconds. Thus the energy of an ordinary stroke is estimated to be of the order of only 40 kW-hrs(5). Accordingly, if this energy could conceivably be captured, at prevailing energy rates its value, at most, would be worth just only two or three dollars.
Lightning
72A-1974-01 Rev. B 3/05 11-226
On the other hand, although the amount of energy is moderate it is released in the order of a very few microseconds, and the fact that power is energy divided by time, accounts for the very great power of a lightning stroke.
11.8 Measuring Lightning As is stated earlier, little was known about lightning until it became possible to measure it. The importance of measurement is well illustrated by a quotation from Lord Kelvin made in 1883:
“I often say that when you can measure what you are speaking about and can express it in numbers, you know something about it; but when you cannot mea-sure it, when you cannot express it in numbers, your knowledge is of a meager and unsatisfactory kind; it may be the beginning of knowledge but you have scarcely in your thoughts advanced to the stage of science whatever the matter may be”.
The importance of knowing the characteristics and magnitude of lightning strokes had long been realized, but it was not until later developments, particularly in electronic techniques and high-sensitivity cathode-ray oscillographs, that such measurements became practicable. The difficulty in measuring lightning strokes is quite apparent. Lightning consists of very high voltages and currents and thus is not adapted to the usual measuring devices and besides it is most dangerous. As is well known a stroke is most destructive of any apparatus or equipment, which it encounters, it is almost instantaneous in its inception and the time o£ its duration is so short that recording is most difficult. Also it occurs infrequently and when it will occur and where it is going to strike are unpredictable. The duration of a stroke is only of the order of microseconds, making the oscillographic recording time so short that earlier photographic films were not sufficiently sensitive to permit photographing the cathode-ray screen from outside. Thus it became necessary that the cathode-ray beam strike the film directly, and accordingly required that the film be inserted directly within the vacuum tube, and then evacuating, which of course is inconvenient (this is the principle of the Dufour oscillograph *). In order to measure lightning strokes, the cathode-ray oscillograph then must either be ready to record at the instant that the lightning disturbance occurs, usually unexpectedly, but at other times the film must be protected from the cathode beam as otherwise it would be blackened by the radiation. Two methods were employed. In one method, the cathode ray is kept established for some time before the impulse is expected but is prevented from striking the film by a blocking target. In an alternative method, the cathode ray does not exist until it is activated by the incoming impulse. *This type of oscillograph was developed by A. Dufour in France in 1914.
11.9 Nonrinder-Relay Oscillograph The Norinder-Relay Oscillograph developed by Ernst Harold Norinder *(10) operates on the principle of the established cathode ray and blocking target. A diagram of the oscillograph is shown in Figure 11-13. The cathode emits an electron beam, the
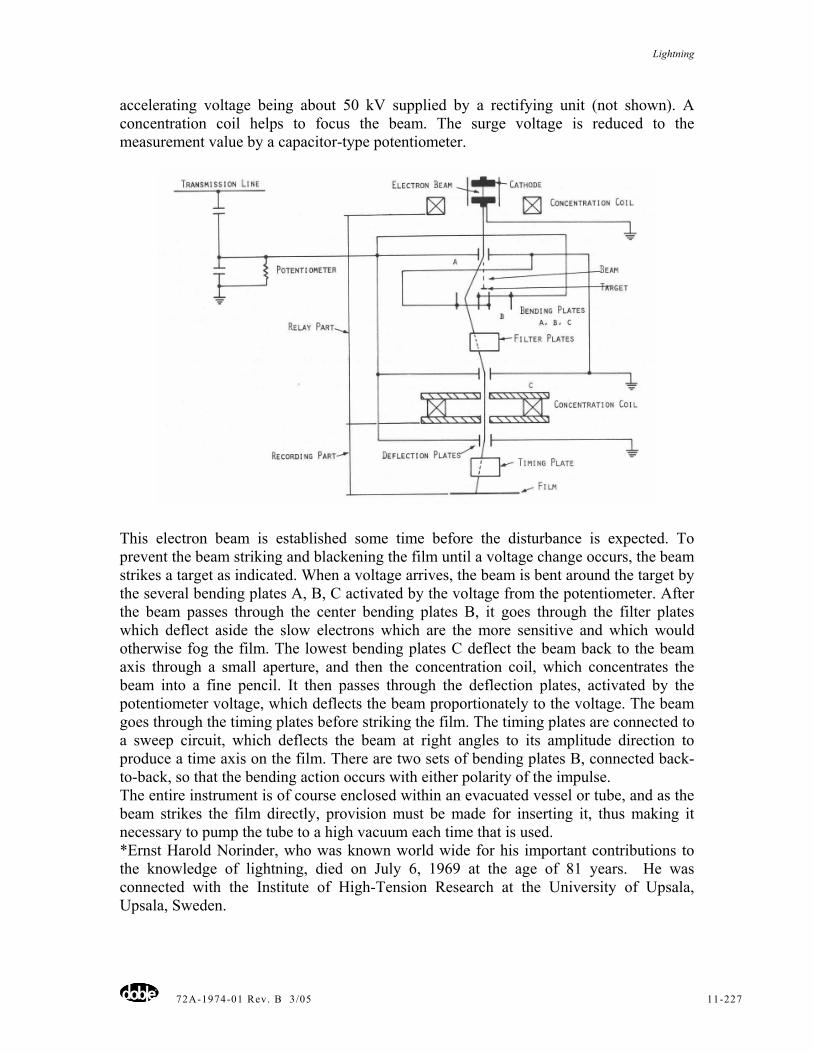
Lightning
72A-1974-01 Rev. B 3/05 11-227
accelerating voltage being about 50 kV supplied by a rectifying unit (not shown). A concentration coil helps to focus the beam. The surge voltage is reduced to the measurement value by a capacitor-type potentiometer.
This electron beam is established some time before the disturbance is expected. To prevent the beam striking and blackening the film until a voltage change occurs, the beam strikes a target as indicated. When a voltage arrives, the beam is bent around the target by the several bending plates A, B, C activated by the voltage from the potentiometer. After the beam passes through the center bending plates B, it goes through the filter plates which deflect aside the slow electrons which are the more sensitive and which would otherwise fog the film. The lowest bending plates C deflect the beam back to the beam axis through a small aperture, and then the concentration coil, which concentrates the beam into a fine pencil. It then passes through the deflection plates, activated by the potentiometer voltage, which deflects the beam proportionately to the voltage. The beam goes through the timing plates before striking the film. The timing plates are connected to a sweep circuit, which deflects the beam at right angles to its amplitude direction to produce a time axis on the film. There are two sets of bending plates B, connected back-to-back, so that the bending action occurs with either polarity of the impulse. The entire instrument is of course enclosed within an evacuated vessel or tube, and as the beam strikes the film directly, provision must be made for inserting it, thus making it necessary to pump the tube to a high vacuum each time that is used. *Ernst Harold Norinder, who was known world wide for his important contributions to the knowledge of lightning, died on July 6, 1969 at the age of 81 years. He was connected with the Institute of High-Tension Research at the University of Upsala, Upsala, Sweden.
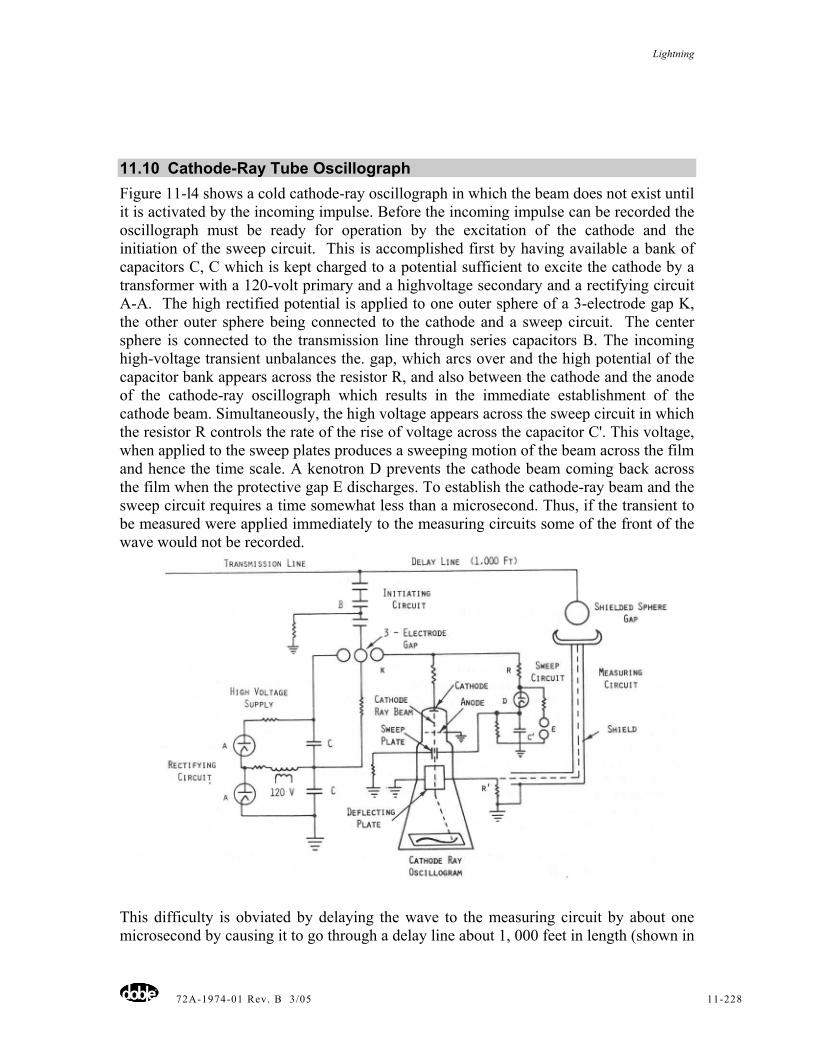
Lightning
72A-1974-01 Rev. B 3/05 11-228
11.10 Cathode-Ray Tube Oscillograph Figure 11-l4 shows a cold cathode-ray oscillograph in which the beam does not exist until it is activated by the incoming impulse. Before the incoming impulse can be recorded the oscillograph must be ready for operation by the excitation of the cathode and the initiation of the sweep circuit. This is accomplished first by having available a bank of capacitors C, C which is kept charged to a potential sufficient to excite the cathode by a transformer with a 120-volt primary and a highvoltage secondary and a rectifying circuit A-A. The high rectified potential is applied to one outer sphere of a 3-electrode gap K, the other outer sphere being connected to the cathode and a sweep circuit. The center sphere is connected to the transmission line through series capacitors B. The incoming high-voltage transient unbalances the. gap, which arcs over and the high potential of the capacitor bank appears across the resistor R, and also between the cathode and the anode of the cathode-ray oscillograph which results in the immediate establishment of the cathode beam. Simultaneously, the high voltage appears across the sweep circuit in which the resistor R controls the rate of the rise of voltage across the capacitor C'. This voltage, when applied to the sweep plates produces a sweeping motion of the beam across the film and hence the time scale. A kenotron D prevents the cathode beam coming back across the film when the protective gap E discharges. To establish the cathode-ray beam and the sweep circuit requires a time somewhat less than a microsecond. Thus, if the transient to be measured were applied immediately to the measuring circuits some of the front of the wave would not be recorded.
This difficulty is obviated by delaying the wave to the measuring circuit by about one microsecond by causing it to go through a delay line about 1, 000 feet in length (shown in
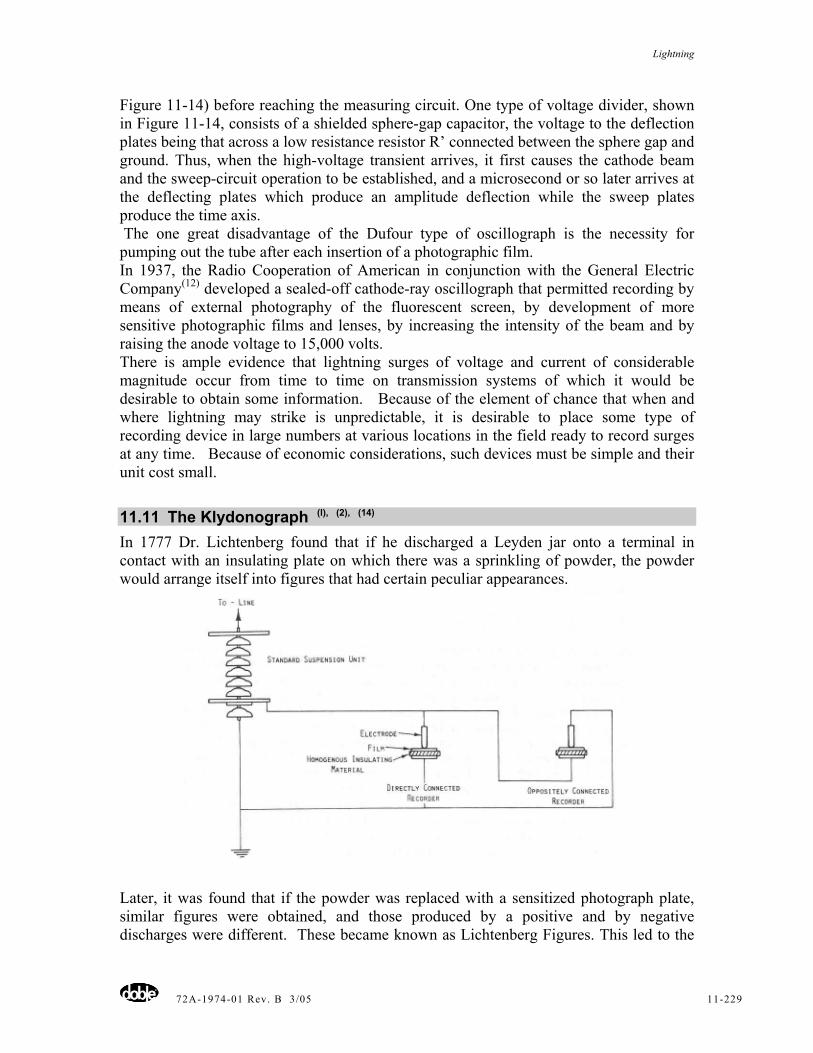
Lightning
72A-1974-01 Rev. B 3/05 11-229
Figure 11-14) before reaching the measuring circuit. One type of voltage divider, shown in Figure 11-14, consists of a shielded sphere-gap capacitor, the voltage to the deflection plates being that across a low resistance resistor R’ connected between the sphere gap and ground. Thus, when the high-voltage transient arrives, it first causes the cathode beam and the sweep-circuit operation to be established, and a microsecond or so later arrives at the deflecting plates which produce an amplitude deflection while the sweep plates produce the time axis. The one great disadvantage of the Dufour type of oscillograph is the necessity for pumping out the tube after each insertion of a photographic film. In 1937, the Radio Cooperation of American in conjunction with the General Electric Company(12) developed a sealed-off cathode-ray oscillograph that permitted recording by means of external photography of the fluorescent screen, by development of more sensitive photographic films and lenses, by increasing the intensity of the beam and by raising the anode voltage to 15,000 volts. There is ample evidence that lightning surges of voltage and current of considerable magnitude occur from time to time on transmission systems of which it would be desirable to obtain some information. Because of the element of chance that when and where lightning may strike is unpredictable, it is desirable to place some type of recording device in large numbers at various locations in the field ready to record surges at any time. Because of economic considerations, such devices must be simple and their unit cost small.
11.11 The Klydonograph (l), (2), (14) In 1777 Dr. Lichtenberg found that if he discharged a Leyden jar onto a terminal in contact with an insulating plate on which there was a sprinkling of powder, the powder would arrange itself into figures that had certain peculiar appearances.
Later, it was found that if the powder was replaced with a sensitized photograph plate, similar figures were obtained, and those produced by a positive and by negative discharges were different. These became known as Lichtenberg Figures. This led to the
Lightning
72A-1974-01 Rev. B 3/05 11-230
development of the Klydonograph. As shown in Figure 11-15, it consists of a rounded electrode bearing on the emulsion side of a photographic film on an insulating plate backed by a plate electrode. Two such devices are shown connected in reverse so that they both positive and negative surges are recorded. The voltage to the instrument is obtained from a capacitor divider, usually consisting of string insulator discs as shown. The minimum voltage that can be recorded is 2 kV and the maximum about 18 kV. It is found that the greatest distance from the center of the figure to its outer edge is a function of the voltage.
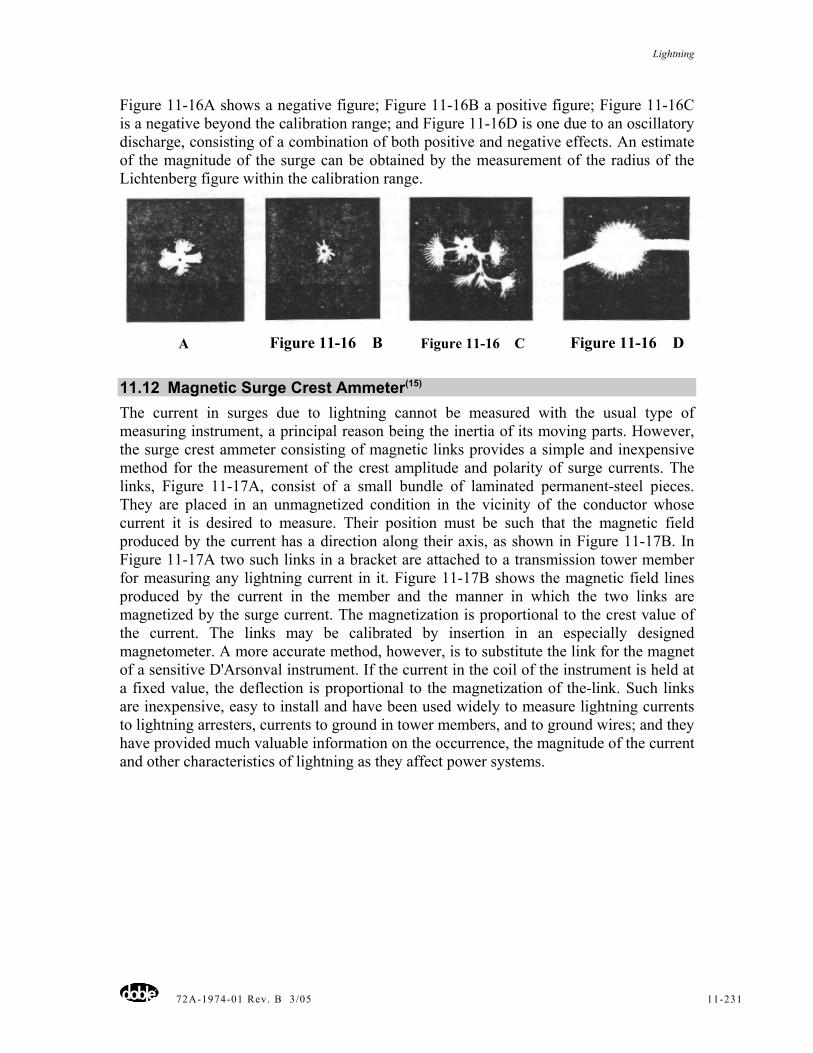
Lightning
72A-1974-01 Rev. B 3/05 11-231
Figure 11-16A shows a negative figure; Figure 11-16B a positive figure; Figure 11-16C is a negative beyond the calibration range; and Figure 11-16D is one due to an oscillatory discharge, consisting of a combination of both positive and negative effects. An estimate of the magnitude of the surge can be obtained by the measurement of the radius of the Lichtenberg figure within the calibration range.
A Figure 11-16 B Figure 11-16 C Figure 11-16 D
11.12 Magnetic Surge Crest Ammeter(15) The current in surges due to lightning cannot be measured with the usual type of measuring instrument, a principal reason being the inertia of its moving parts. However, the surge crest ammeter consisting of magnetic links provides a simple and inexpensive method for the measurement of the crest amplitude and polarity of surge currents. The links, Figure 11-17A, consist of a small bundle of laminated permanent-steel pieces. They are placed in an unmagnetized condition in the vicinity of the conductor whose current it is desired to measure. Their position must be such that the magnetic field produced by the current has a direction along their axis, as shown in Figure 11-17B. In Figure 11-17A two such links in a bracket are attached to a transmission tower member for measuring any lightning current in it. Figure 11-17B shows the magnetic field lines produced by the current in the member and the manner in which the two links are magnetized by the surge current. The magnetization is proportional to the crest value of the current. The links may be calibrated by insertion in an especially designed magnetometer. A more accurate method, however, is to substitute the link for the magnet of a sensitive D'Arsonval instrument. If the current in the coil of the instrument is held at a fixed value, the deflection is proportional to the magnetization of the-link. Such links are inexpensive, easy to install and have been used widely to measure lightning currents to lightning arresters, currents to ground in tower members, and to ground wires; and they have provided much valuable information on the occurrence, the magnitude of the current and other characteristics of lightning as they affect power systems.
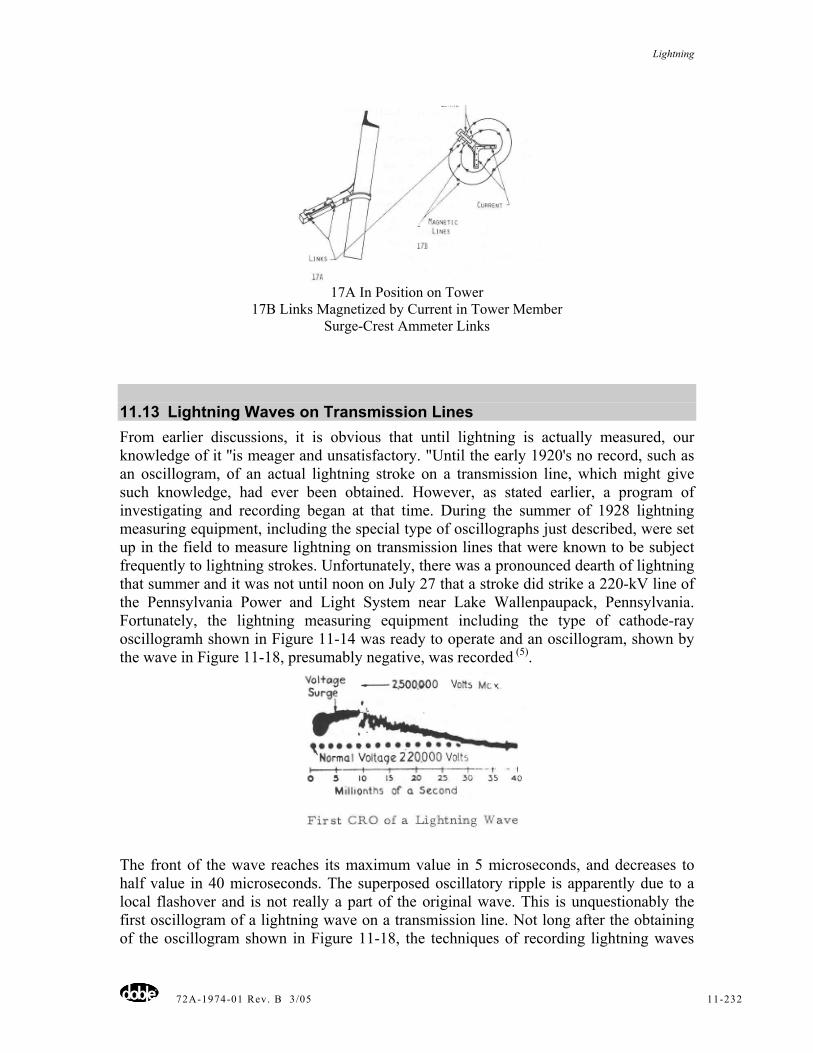
Lightning
72A-1974-01 Rev. B 3/05 11-232
17A In Position on Tower
17B Links Magnetized by Current in Tower Member Surge-Crest Ammeter Links
11.13 Lightning Waves on Transmission Lines From earlier discussions, it is obvious that until lightning is actually measured, our knowledge of it ''is meager and unsatisfactory. "Until the early 1920's no record, such as an oscillogram, of an actual lightning stroke on a transmission line, which might give such knowledge, had ever been obtained. However, as stated earlier, a program of investigating and recording began at that time. During the summer of 1928 lightning measuring equipment, including the special type of oscillographs just described, were set up in the field to measure lightning on transmission lines that were known to be subject frequently to lightning strokes. Unfortunately, there was a pronounced dearth of lightning that summer and it was not until noon on July 27 that a stroke did strike a 220-kV line of the Pennsylvania Power and Light System near Lake Wallenpaupack, Pennsylvania. Fortunately, the lightning measuring equipment including the type of cathode-ray oscillogramh shown in Figure 11-14 was ready to operate and an oscillogram, shown by the wave in Figure 11-18, presumably negative, was recorded (5).
The front of the wave reaches its maximum value in 5 microseconds, and decreases to half value in 40 microseconds. The superposed oscillatory ripple is apparently due to a local flashover and is not really a part of the original wave. This is unquestionably the first oscillogram of a lightning wave on a transmission line. Not long after the obtaining of the oscillogram shown in Figure 11-18, the techniques of recording lightning waves
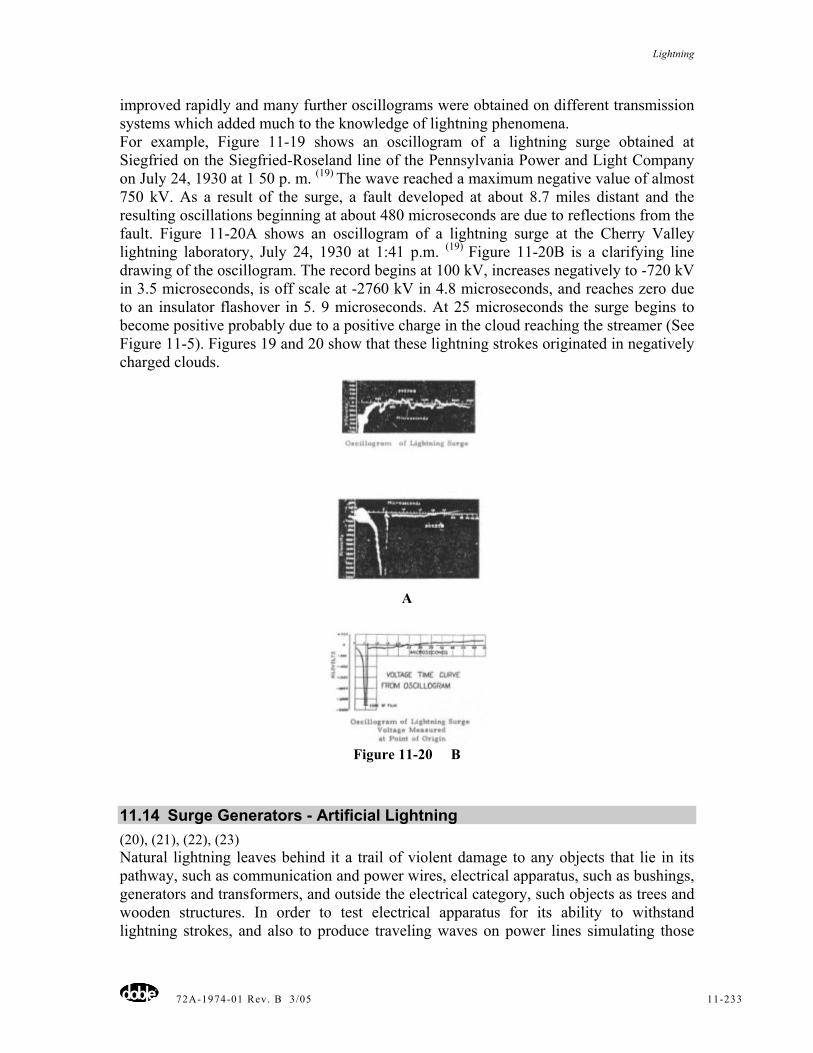
Lightning
72A-1974-01 Rev. B 3/05 11-233
improved rapidly and many further oscillograms were obtained on different transmission systems which added much to the knowledge of lightning phenomena. For example, Figure 11-19 shows an oscillogram of a lightning surge obtained at Siegfried on the Siegfried-Roseland line of the Pennsylvania Power and Light Company on July 24, 1930 at 1 50 p. m. (19) The wave reached a maximum negative value of almost 750 kV. As a result of the surge, a fault developed at about 8.7 miles distant and the resulting oscillations beginning at about 480 microseconds are due to reflections from the fault. Figure 11-20A shows an oscillogram of a lightning surge at the Cherry Valley lightning laboratory, July 24, 1930 at 1:41 p.m. (19) Figure 11-20B is a clarifying line drawing of the oscillogram. The record begins at 100 kV, increases negatively to -720 kV in 3.5 microseconds, is off scale at -2760 kV in 4.8 microseconds, and reaches zero due to an insulator flashover in 5. 9 microseconds. At 25 microseconds the surge begins to become positive probably due to a positive charge in the cloud reaching the streamer (See Figure 11-5). Figures 19 and 20 show that these lightning strokes originated in negatively charged clouds.
A
Figure 11-20 B
11.14 Surge Generators - Artificial Lightning (20), (21), (22), (23) Natural lightning leaves behind it a trail of violent damage to any objects that lie in its pathway, such as communication and power wires, electrical apparatus, such as bushings, generators and transformers, and outside the electrical category, such objects as trees and wooden structures. In order to test electrical apparatus for its ability to withstand lightning strokes, and also to produce traveling waves on power lines simulating those
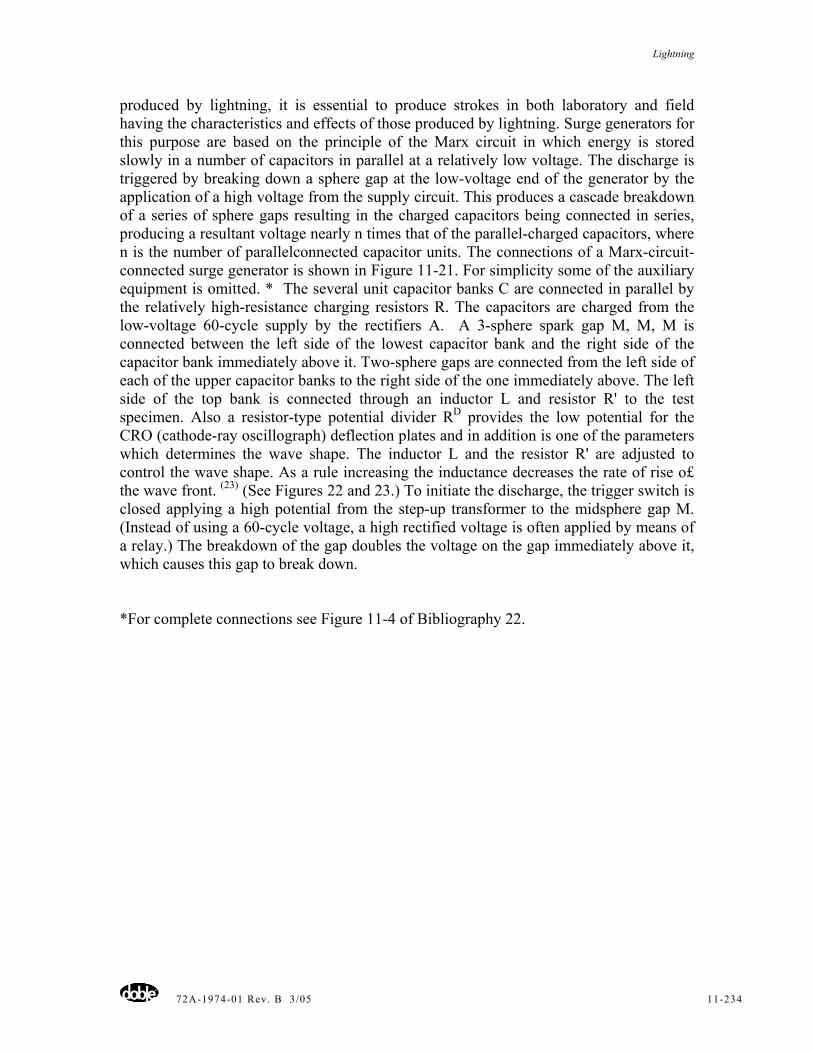
Lightning
72A-1974-01 Rev. B 3/05 11-234
produced by lightning, it is essential to produce strokes in both laboratory and field having the characteristics and effects of those produced by lightning. Surge generators for this purpose are based on the principle of the Marx circuit in which energy is stored slowly in a number of capacitors in parallel at a relatively low voltage. The discharge is triggered by breaking down a sphere gap at the low-voltage end of the generator by the application of a high voltage from the supply circuit. This produces a cascade breakdown of a series of sphere gaps resulting in the charged capacitors being connected in series, producing a resultant voltage nearly n times that of the parallel-charged capacitors, where n is the number of parallelconnected capacitor units. The connections of a Marx-circuit-connected surge generator is shown in Figure 11-21. For simplicity some of the auxiliary equipment is omitted. * The several unit capacitor banks C are connected in parallel by the relatively high-resistance charging resistors R. The capacitors are charged from the low-voltage 60-cycle supply by the rectifiers A. A 3-sphere spark gap M, M, M is connected between the left side of the lowest capacitor bank and the right side of the capacitor bank immediately above it. Two-sphere gaps are connected from the left side of each of the upper capacitor banks to the right side of the one immediately above. The left side of the top bank is connected through an inductor L and resistor R' to the test specimen. Also a resistor-type potential divider RD provides the low potential for the CRO (cathode-ray oscillograph) deflection plates and in addition is one of the parameters which determines the wave shape. The inductor L and the resistor R' are adjusted to control the wave shape. As a rule increasing the inductance decreases the rate of rise o£ the wave front. (23) (See Figures 22 and 23.) To initiate the discharge, the trigger switch is closed applying a high potential from the step-up transformer to the midsphere gap M. (Instead of using a 60-cycle voltage, a high rectified voltage is often applied by means of a relay.) The breakdown of the gap doubles the voltage on the gap immediately above it, which causes this gap to break down. *For complete connections see Figure 11-4 of Bibliography 22.
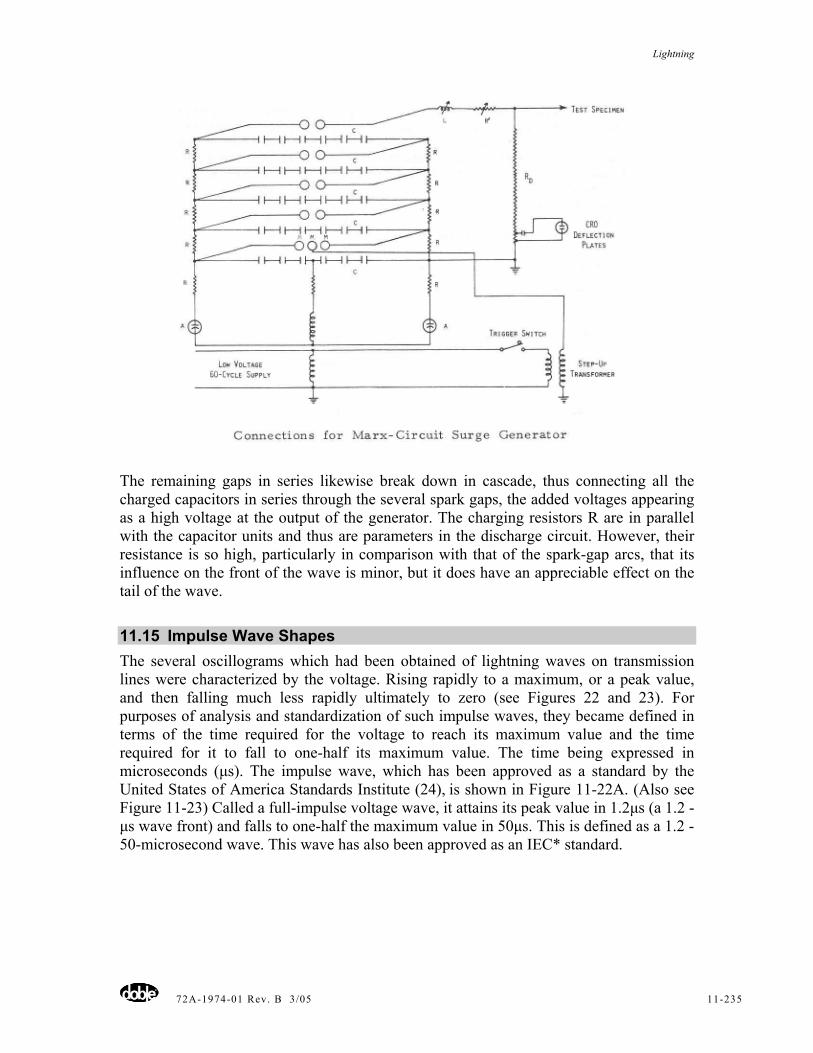
Lightning
72A-1974-01 Rev. B 3/05 11-235
The remaining gaps in series likewise break down in cascade, thus connecting all the charged capacitors in series through the several spark gaps, the added voltages appearing as a high voltage at the output of the generator. The charging resistors R are in parallel with the capacitor units and thus are parameters in the discharge circuit. However, their resistance is so high, particularly in comparison with that of the spark-gap arcs, that its influence on the front of the wave is minor, but it does have an appreciable effect on the tail of the wave.
11.15 Impulse Wave Shapes The several oscillograms which had been obtained of lightning waves on transmission lines were characterized by the voltage. Rising rapidly to a maximum, or a peak value, and then falling much less rapidly ultimately to zero (see Figures 22 and 23). For purposes of analysis and standardization of such impulse waves, they became defined in terms of the time required for the voltage to reach its maximum value and the time required for it to fall to one-half its maximum value. The time being expressed in microseconds (µs). The impulse wave, which has been approved as a standard by the United States of America Standards Institute (24), is shown in Figure 11-22A. (Also see Figure 11-23) Called a full-impulse voltage wave, it attains its peak value in 1.2µs (a 1.2 - µs wave front) and falls to one-half the maximum value in 50µs. This is defined as a 1.2 - 50-microsecond wave. This wave has also been approved as an IEC* standard.
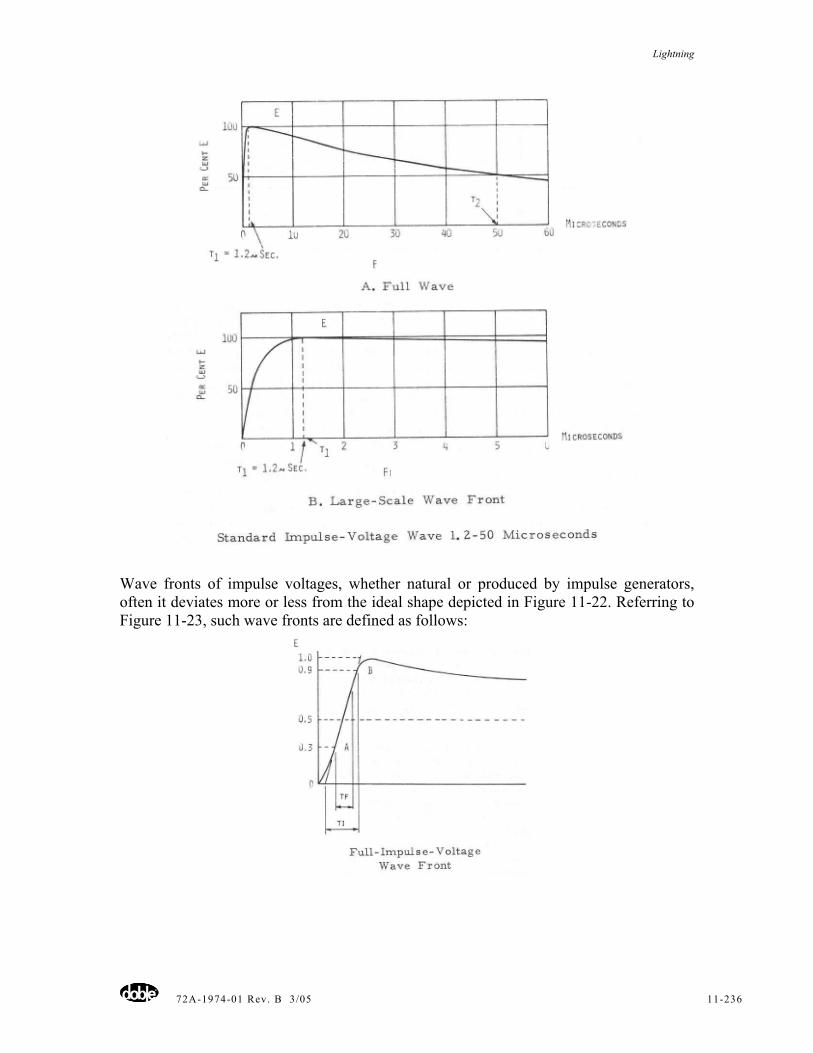
Lightning
72A-1974-01 Rev. B 3/05 11-236
Wave fronts of impulse voltages, whether natural or produced by impulse generators, often it deviates more or less from the ideal shape depicted in Figure 11-22. Referring to Figure 11-23, such wave fronts are defined as follows:
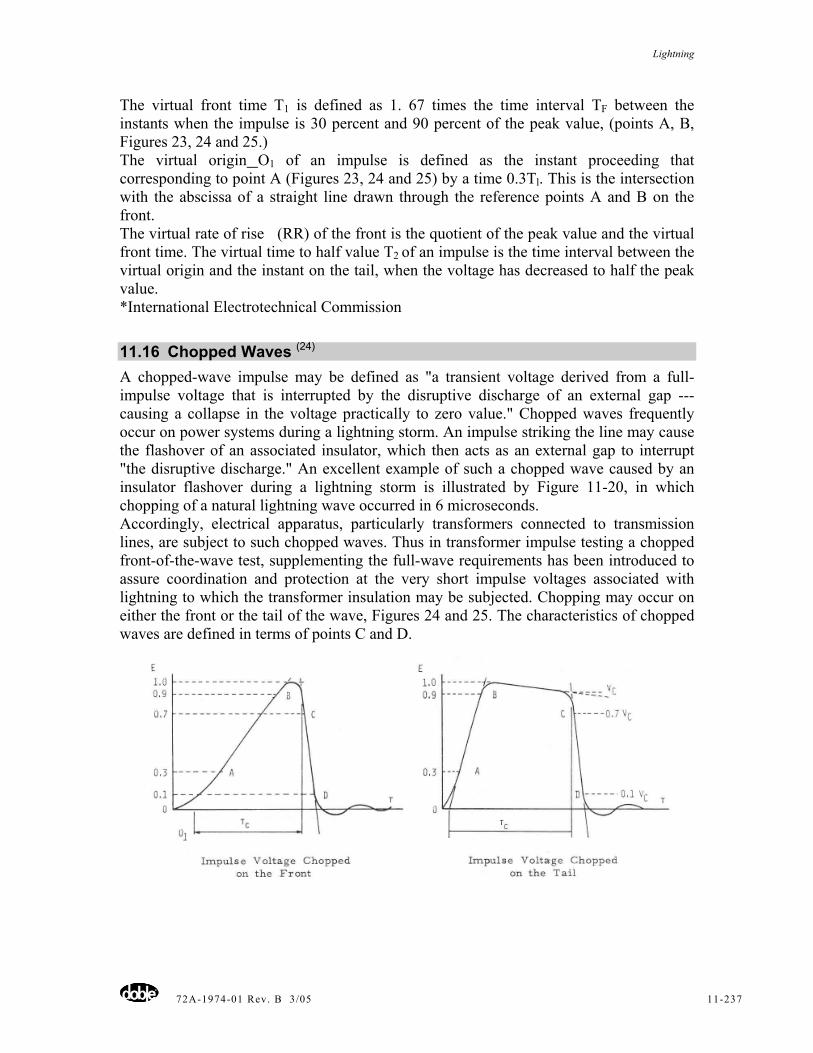
Lightning
72A-1974-01 Rev. B 3/05 11-237
The virtual front time T1 is defined as 1. 67 times the time interval TF between the instants when the impulse is 30 percent and 90 percent of the peak value, (points A, B, Figures 23, 24 and 25.) The virtual origin O1 of an impulse is defined as the instant proceeding that corresponding to point A (Figures 23, 24 and 25) by a time 0.3Tl. This is the intersection with the abscissa of a straight line drawn through the reference points A and B on the front. The virtual rate of rise (RR) of the front is the quotient of the peak value and the virtual front time. The virtual time to half value T2 of an impulse is the time interval between the virtual origin and the instant on the tail, when the voltage has decreased to half the peak value. *International Electrotechnical Commission
11.16 Chopped Waves (24)
A chopped-wave impulse may be defined as "a transient voltage derived from a full-impulse voltage that is interrupted by the disruptive discharge of an external gap --- causing a collapse in the voltage practically to zero value." Chopped waves frequently occur on power systems during a lightning storm. An impulse striking the line may cause the flashover of an associated insulator, which then acts as an external gap to interrupt "the disruptive discharge." An excellent example of such a chopped wave caused by an insulator flashover during a lightning storm is illustrated by Figure 11-20, in which chopping of a natural lightning wave occurred in 6 microseconds. Accordingly, electrical apparatus, particularly transformers connected to transmission lines, are subject to such chopped waves. Thus in transformer impulse testing a chopped front-of-the-wave test, supplementing the full-wave requirements has been introduced to assure coordination and protection at the very short impulse voltages associated with lightning to which the transformer insulation may be subjected. Chopping may occur on either the front or the tail of the wave, Figures 24 and 25. The characteristics of chopped waves are defined in terms of points C and D.
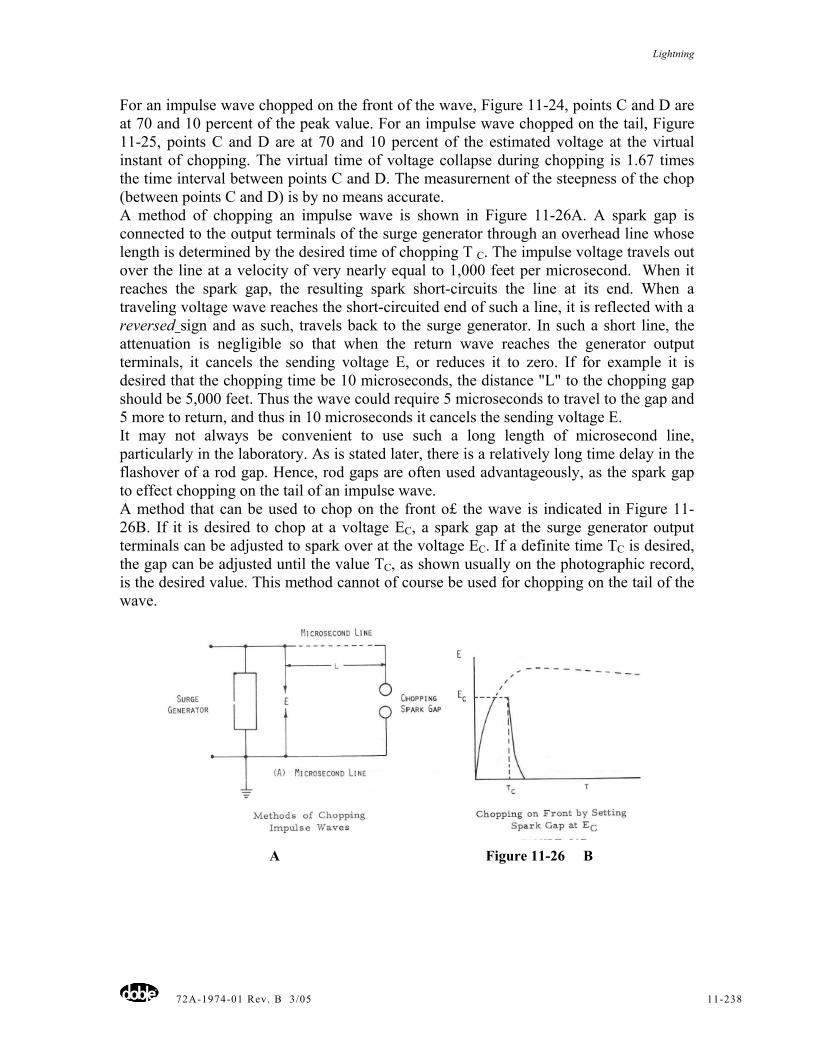
Lightning
72A-1974-01 Rev. B 3/05 11-238
For an impulse wave chopped on the front of the wave, Figure 11-24, points C and D are at 70 and 10 percent of the peak value. For an impulse wave chopped on the tail, Figure 11-25, points C and D are at 70 and 10 percent of the estimated voltage at the virtual instant of chopping. The virtual time of voltage collapse during chopping is 1.67 times the time interval between points C and D. The measurernent of the steepness of the chop (between points C and D) is by no means accurate. A method of chopping an impulse wave is shown in Figure 11-26A. A spark gap is connected to the output terminals of the surge generator through an overhead line whose length is determined by the desired time of chopping T C. The impulse voltage travels out over the line at a velocity of very nearly equal to 1,000 feet per microsecond. When it reaches the spark gap, the resulting spark short-circuits the line at its end. When a traveling voltage wave reaches the short-circuited end of such a line, it is reflected with a reversed sign and as such, travels back to the surge generator. In such a short line, the attenuation is negligible so that when the return wave reaches the generator output terminals, it cancels the sending voltage E, or reduces it to zero. If for example it is desired that the chopping time be 10 microseconds, the distance "L" to the chopping gap should be 5,000 feet. Thus the wave could require 5 microseconds to travel to the gap and 5 more to return, and thus in 10 microseconds it cancels the sending voltage E. It may not always be convenient to use such a long length of microsecond line, particularly in the laboratory. As is stated later, there is a relatively long time delay in the flashover of a rod gap. Hence, rod gaps are often used advantageously, as the spark gap to effect chopping on the tail of an impulse wave. A method that can be used to chop on the front o£ the wave is indicated in Figure 11-26B. If it is desired to chop at a voltage EC, a spark gap at the surge generator output terminals can be adjusted to spark over at the voltage EC. If a definite time TC is desired, the gap can be adjusted until the value TC, as shown usually on the photographic record, is the desired value. This method cannot of course be used for chopping on the tail of the wave.
A Figure 11-26 B
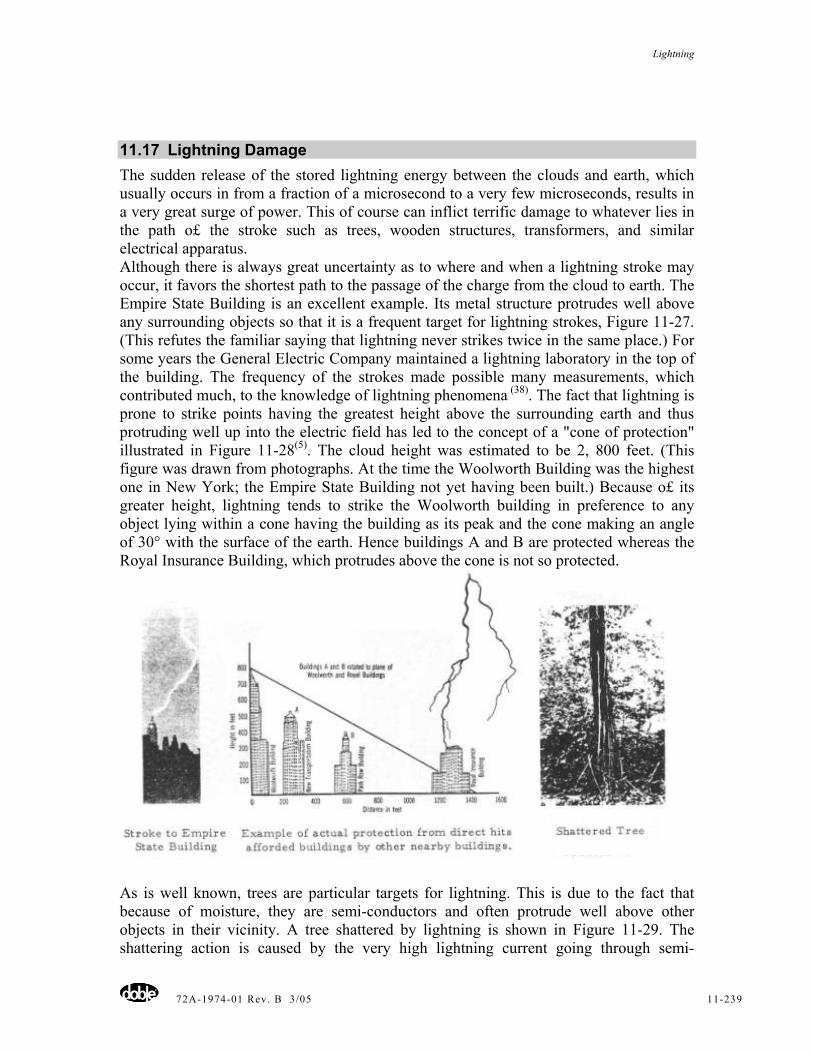
Lightning
72A-1974-01 Rev. B 3/05 11-239
11.17 Lightning Damage The sudden release of the stored lightning energy between the clouds and earth, which usually occurs in from a fraction of a microsecond to a very few microseconds, results in a very great surge of power. This of course can inflict terrific damage to whatever lies in the path o£ the stroke such as trees, wooden structures, transformers, and similar electrical apparatus. Although there is always great uncertainty as to where and when a lightning stroke may occur, it favors the shortest path to the passage of the charge from the cloud to earth. The Empire State Building is an excellent example. Its metal structure protrudes well above any surrounding objects so that it is a frequent target for lightning strokes, Figure 11-27. (This refutes the familiar saying that lightning never strikes twice in the same place.) For some years the General Electric Company maintained a lightning laboratory in the top of the building. The frequency of the strokes made possible many measurements, which contributed much, to the knowledge of lightning phenomena (38). The fact that lightning is prone to strike points having the greatest height above the surrounding earth and thus protruding well up into the electric field has led to the concept of a "cone of protection" illustrated in Figure 11-28(5). The cloud height was estimated to be 2, 800 feet. (This figure was drawn from photographs. At the time the Woolworth Building was the highest one in New York; the Empire State Building not yet having been built.) Because o£ its greater height, lightning tends to strike the Woolworth building in preference to any object lying within a cone having the building as its peak and the cone making an angle of 30° with the surface of the earth. Hence buildings A and B are protected whereas the Royal Insurance Building, which protrudes above the cone is not so protected.
As is well known, trees are particular targets for lightning. This is due to the fact that because of moisture, they are semi-conductors and often protrude well above other objects in their vicinity. A tree shattered by lightning is shown in Figure 11-29. The shattering action is caused by the very high lightning current going through semi-
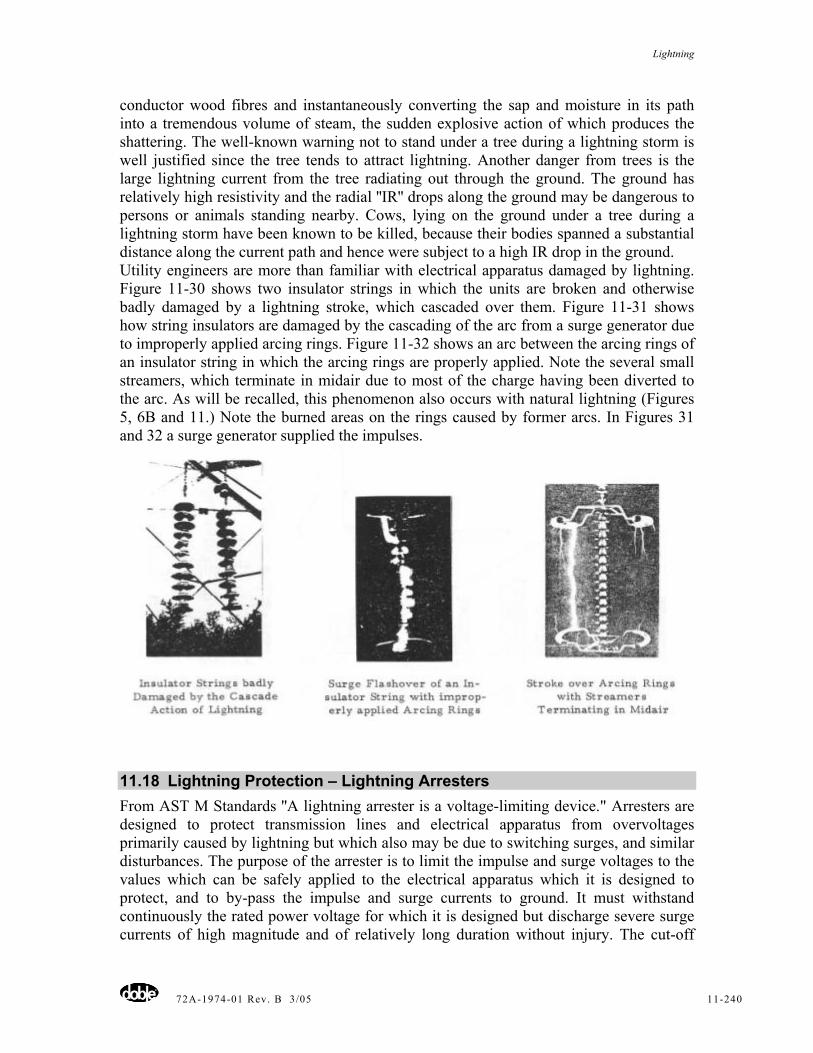
Lightning
72A-1974-01 Rev. B 3/05 11-240
conductor wood fibres and instantaneously converting the sap and moisture in its path into a tremendous volume of steam, the sudden explosive action of which produces the shattering. The well-known warning not to stand under a tree during a lightning storm is well justified since the tree tends to attract lightning. Another danger from trees is the large lightning current from the tree radiating out through the ground. The ground has relatively high resistivity and the radial ''IR'' drops along the ground may be dangerous to persons or animals standing nearby. Cows, lying on the ground under a tree during a lightning storm have been known to be killed, because their bodies spanned a substantial distance along the current path and hence were subject to a high IR drop in the ground. Utility engineers are more than familiar with electrical apparatus damaged by lightning. Figure 11-30 shows two insulator strings in which the units are broken and otherwise badly damaged by a lightning stroke, which cascaded over them. Figure 11-31 shows how string insulators are damaged by the cascading of the arc from a surge generator due to improperly applied arcing rings. Figure 11-32 shows an arc between the arcing rings of an insulator string in which the arcing rings are properly applied. Note the several small streamers, which terminate in midair due to most of the charge having been diverted to the arc. As will be recalled, this phenomenon also occurs with natural lightning (Figures 5, 6B and 11.) Note the burned areas on the rings caused by former arcs. In Figures 31 and 32 a surge generator supplied the impulses.
11.18 Lightning Protection – Lightning Arresters From AST M Standards ''A lightning arrester is a voltage-limiting device." Arresters are designed to protect transmission lines and electrical apparatus from overvoltages primarily caused by lightning but which also may be due to switching surges, and similar disturbances. The purpose of the arrester is to limit the impulse and surge voltages to the values which can be safely applied to the electrical apparatus which it is designed to protect, and to by-pass the impulse and surge currents to ground. It must withstand continuously the rated power voltage for which it is designed but discharge severe surge currents of high magnitude and of relatively long duration without injury. The cut-off
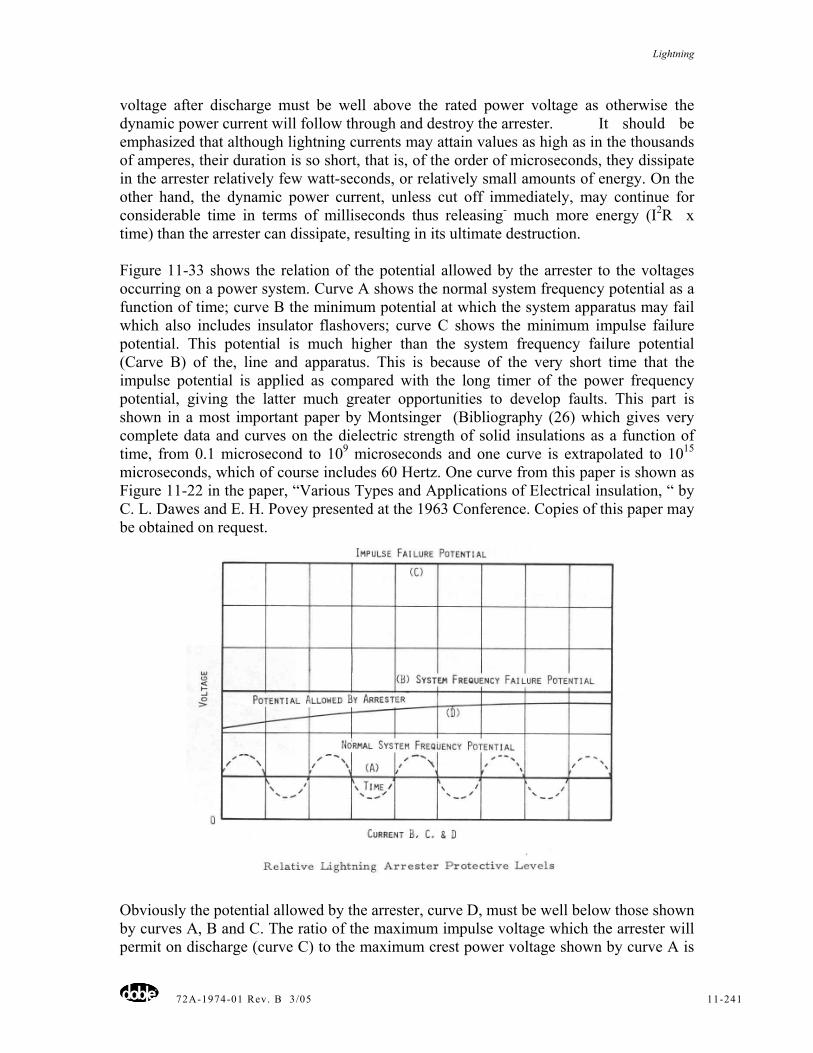
Lightning
72A-1974-01 Rev. B 3/05 11-241
voltage after discharge must be well above the rated power voltage as otherwise the dynamic power current will follow through and destroy the arrester. It should be emphasized that although lightning currents may attain values as high as in the thousands of amperes, their duration is so short, that is, of the order of microseconds, they dissipate in the arrester relatively few watt-seconds, or relatively small amounts of energy. On the other hand, the dynamic power current, unless cut off immediately, may continue for considerable time in terms of milliseconds thus releasing- much more energy (I2R x time) than the arrester can dissipate, resulting in its ultimate destruction. Figure 11-33 shows the relation of the potential allowed by the arrester to the voltages occurring on a power system. Curve A shows the normal system frequency potential as a function of time; curve B the minimum potential at which the system apparatus may fail which also includes insulator flashovers; curve C shows the minimum impulse failure potential. This potential is much higher than the system frequency failure potential (Carve B) of the, line and apparatus. This is because of the very short time that the impulse potential is applied as compared with the long timer of the power frequency potential, giving the latter much greater opportunities to develop faults. This part is shown in a most important paper by Montsinger (Bibliography (26) which gives very complete data and curves on the dielectric strength of solid insulations as a function of time, from 0.1 microsecond to 109 microseconds and one curve is extrapolated to 1015 microseconds, which of course includes 60 Hertz. One curve from this paper is shown as Figure 11-22 in the paper, “Various Types and Applications of Electrical insulation, “ by C. L. Dawes and E. H. Povey presented at the 1963 Conference. Copies of this paper may be obtained on request.
Obviously the potential allowed by the arrester, curve D, must be well below those shown by curves A, B and C. The ratio of the maximum impulse voltage which the arrester will permit on discharge (curve C) to the maximum crest power voltage shown by curve A is
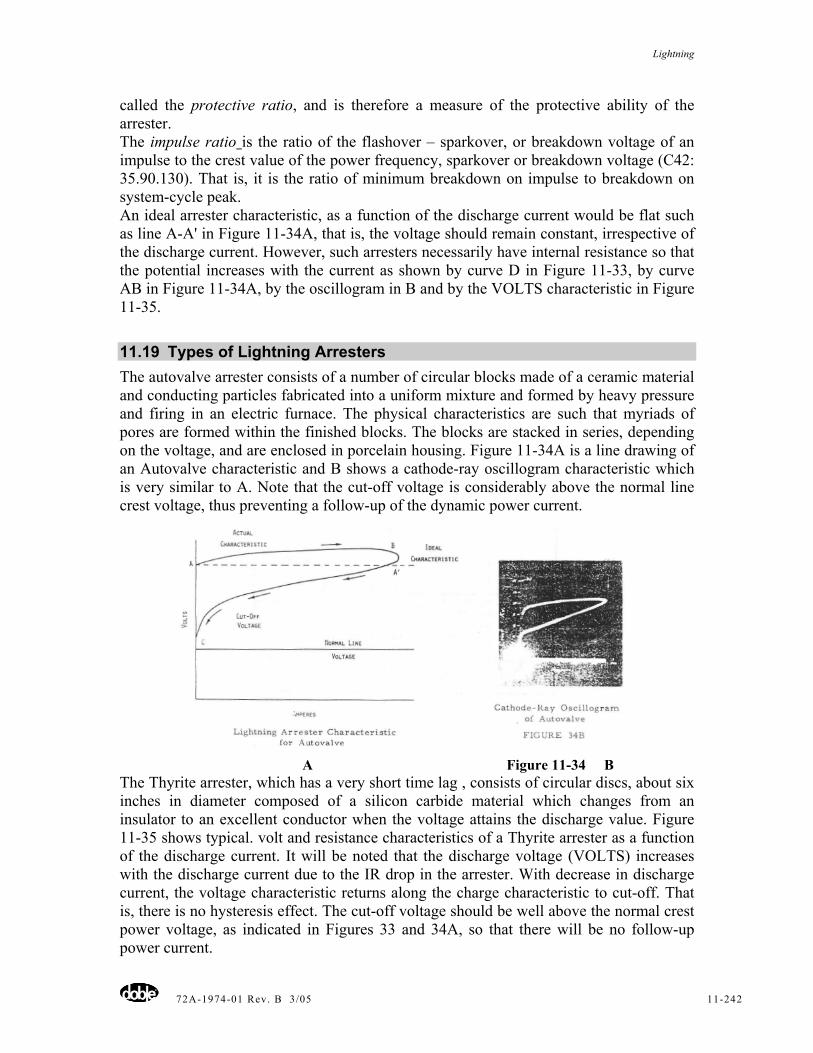
Lightning
72A-1974-01 Rev. B 3/05 11-242
called the protective ratio, and is therefore a measure of the protective ability of the arrester. The impulse ratio is the ratio of the flashover – sparkover, or breakdown voltage of an impulse to the crest value of the power frequency, sparkover or breakdown voltage (C42: 35.90.130). That is, it is the ratio of minimum breakdown on impulse to breakdown on system-cycle peak. An ideal arrester characteristic, as a function of the discharge current would be flat such as line A-A' in Figure 11-34A, that is, the voltage should remain constant, irrespective of the discharge current. However, such arresters necessarily have internal resistance so that the potential increases with the current as shown by curve D in Figure 11-33, by curve AB in Figure 11-34A, by the oscillogram in B and by the VOLTS characteristic in Figure 11-35.
11.19 Types of Lightning Arresters The autovalve arrester consists of a number of circular blocks made of a ceramic material and conducting particles fabricated into a uniform mixture and formed by heavy pressure and firing in an electric furnace. The physical characteristics are such that myriads of pores are formed within the finished blocks. The blocks are stacked in series, depending on the voltage, and are enclosed in porcelain housing. Figure 11-34A is a line drawing of an Autovalve characteristic and B shows a cathode-ray oscillogram characteristic which is very similar to A. Note that the cut-off voltage is considerably above the normal line crest voltage, thus preventing a follow-up of the dynamic power current.
A Figure 11-34 B
The Thyrite arrester, which has a very short time lag , consists of circular discs, about six inches in diameter composed of a silicon carbide material which changes from an insulator to an excellent conductor when the voltage attains the discharge value. Figure 11-35 shows typical. volt and resistance characteristics of a Thyrite arrester as a function of the discharge current. It will be noted that the discharge voltage (VOLTS) increases with the discharge current due to the IR drop in the arrester. With decrease in discharge current, the voltage characteristic returns along the charge characteristic to cut-off. That is, there is no hysteresis effect. The cut-off voltage should be well above the normal crest power voltage, as indicated in Figures 33 and 34A, so that there will be no follow-up power current.
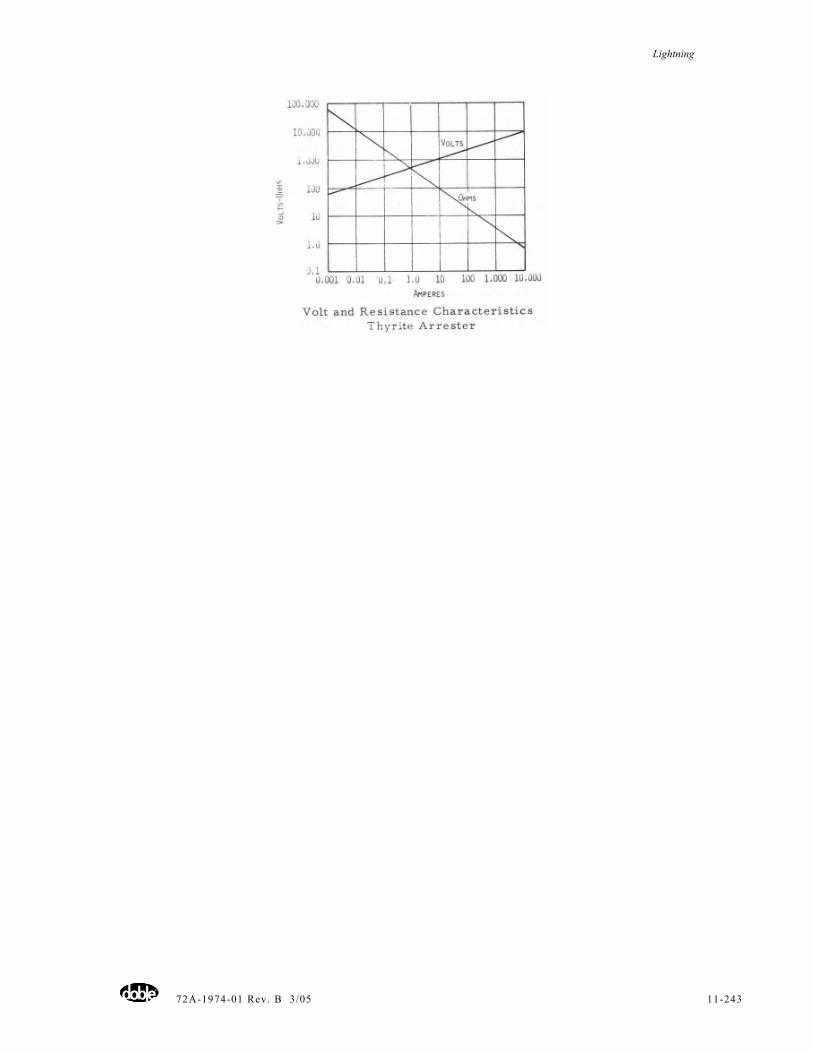
Lightning
72A-1974-01 Rev. B 3/05 11-243
Lightning
72A-1974-01 Rev. B 3/05 11-244
With both the Autovalve and Thyrite arresters there are ball gaps or other types of gaps in series so that there is no current to the arrester under normal system conditions. The gap lengths are adjusted in accordance with the system voltage. When a surge or overvoltage occurs the gap, or gaps, break down permitting the surge current to flow to ground through the arrester. Protector tubes (1) (38) consist of micarta and fiber tubes with ferrules on each end. An arcing horn is mounted on the top ferrule and the tube is mounted so that the horn is just below a line conductor. The lower ferrule is grounded, usually to a tower member. When a surge occurs the discharge or arc raises the pressure within the tube which tends to suppress the arc. However, the predominant effect in suppressing the arc is the fact that the heat drives gases from the organic materials forming the tube, which intermingle with the ionized gases forming the arc and thus de-ionizes them and destroys their conductance. Because it is simple and inexpensive and easy to install it is used to prevent flashover of line insulators, disconnect switches and bus insulators. It is not considered adequate for protection of transformers and other large equipment. Rod Gaps(1) (31) consist of 0.5-inch square-cornered square-cut rods coaxially spaced and overhanging their supports at least one-half the gap spacing. The gap is simple and rugged but it does not fulfill the requirements of a true protective device in that it does not valve off the power voltage after it once has flashed over by a surge. Hence, it is necessary to de-energize the circuit each time that the gap operates. Since at short time lags, its voltage cut-off exceeds that of the voltage of the insulation that it is designed to protect, a relatively short gap setting is necessary for steep wave fronts. Hence, there is a tendency to flash over with surges of long time lag such as those due to minor lightning strokes and switching surges. However, it is simple and inexpensive and hence, is widely used for the protection of such apparatus as insulators and bushings and it is used particularly for back-up protection. As stated earlier, because of its time lag it can be used advantageously for chopping impulses on the tail of the wave.
11.20 Insulation Coordination Except under certain special conditions, overvoltages caused by faults or switching surges do not cause damage to equipment insulation although they may be detrimental to protective devices. The overvoltages most troublesome to manufacturers and operators of electrical power equipment are those resulting from lightning surges. Insulation coordination is the correlation of the discharge characteristics of protective devices and the insulation levels of all apparatus in a station or a substation so that surges entering a station will be conducted to ground before flashing over or puncturing the insulation. A prime objective of insulation coordination is to be certain that some parts of a station or its equipment are not over-insulated and others not under-insulated. In 1930 the NEMA-NELA Joint Committee on Insulation was formed to study the problem and after ten years of study and collection of data, the committee, now modified and known as the Joint AIEE-EEI-NEMA Committee on insulation Coordination, in 1941 issued a report specifying basic impulse levels for the different voltage classifications. The procedure is to establish a definite common insulation level known as the Basic Insulation Level (BIL) and bring all protection to this level, to quote, ''Apparatus insulation as demonstrated by suitable tests shall be equal to greater than the basic insulation level”. Also there has been a continual study to establish an economic margin between the impulse breakdown of the
Lightning
72A-1974-01 Rev. B 3/05 11-245
equipment insulation and the discharge voltage characteristics of the protective devices. Since transformers primarily are subjected to lightning and other impulse voltages, a table has been approved as a standard for transformer testing (34). Later data on this subject are given in Table I of the paper by Dr. Bellaschi prepared for this meeting, ''Recent Developments in Standards affecting Future Procurement, Testing and Maintenance of Power Transformers, " Section 6-1002.
11.21 Summary The subject of lightning, particularly as it is associated with electrical power systems, is a very broad one as may be readily seen by the large amount of study that has been given it and by the extremely large number of publications and references which relate to it. This paper is designed to present a general survey of the subject from the origin of lightning by small ions combining to form electric charges in the clouds, to its effects on the operation of electric power systems. The clouds and the earth constitute a huge capacitor, and lightning strokes are the discharge of this capacitor to earth. The stored energy in the capacitor system is released very suddenly, developing huge amounts of power that become manifest on power systems, requiring protective apparatus to prevent or to minimize any destructive effects which might occur. Apparatus has been developed that measures and records lightning strokes on transmission lines and from which the wave shapes the magnitude of the strokes and the reflections of the waves become known. This knowledge has made it possible to design transmission systems, electrical apparatus, and protective devices so that flashover, insulation failures, and power outages have been reduced to relatively low values. Also surge generators – to simulate lightning strokes accurately – have been developed. Such generators are used advantageously to test electrical apparatus under lightning conditions, and test standards involving wave shape, insulation coordination, and Basic Insulation Levels have resulted. The behaviour of traveling lightning waves on transmission lines, their effects on the lines themselves, the apparatus, the protective devices and the effects of ground wires, static wires and counterpoises is a subject which could well follow this presentation.
Lightning
72A-1974-01 Rev. B 3/05 11-246
11.22 Bibliography 1. Electrical Transmission and Distribution Reference Book, Westinghouse electrical and
Manufacturing Company. 2. AIEE Reference Lighting Book 1918-1935. 3. Some Thundercloud Problems C. T. R. Wilson, Journal Franklin Institute Volume 208,
1929, page 1. 4. The Mechanism of Thunder Storms, Sir George Simpson, Proceedings, Royal Society,
Series A. Volume 114, 1927, page 376. 5. Dielectric Phenomena in High Voltage Engineering (a book), F. W. Peek, McGraw-Hill
Book Company. 6. Progressive Lightning, B. F. J. Schonland and H. Collens. Proceedings of the Royal
Society, Series A. Volume 143, 1934, page 654. 7. Theory of Lightning, I. C. L. Fortescue, Trans. AIEF, Reference Lightning Book, page
317. II Protection of Lines Against Lightning page 321. 8. Lightning – Its Behaviour, C. L. Fortescue, Elect. Journal, Vol. 27, Feb. 1930. page
95. 9. Multiple Lightning Strokes, K. B. McEachron, Trans. AIEE, Vol. 53, 1934, page
1633, part II, vol.57, 1938, page 510. 10. A cathode-Ray Oscillograph with Norinder Relay, O. Ackerman, Trans. AIEE. Vol. 49,
1930. page 467. 11. Cathode-Ray Study of Artificial Lightning Surges on the Turners Falls Transmission
Line, K. B. McEachron, Trans. AIEE vol. 48. 1929, page 953. 12. New High-Speed Oscillograph, H. P. Kuchni and S. Ramo, Trans. AIEE, Vol. 56,
1937, page 721. 13. Measurement of High Surge Voltages, P. L. Bellaschi. Trans. AIEE, Vol. 52, 1933,
page 544. 14. Klydonograph and Its Application to Surge Investigations, J. H. Cox and J. W. Legg.
Trans. AIEE, Vol. 44. 1925, page 857. 15. The Surge Crest Ammeter, C. M. Foust and H. P. Kuchni, General Electric Review,
Vol. 35, 1932, page 644. 16. Investigations on 220-kV Lines, Electrical World, August 11, 1928. 17. Progress in Lightning Research in the Field and in the Laboratory, F. W. Peek, Jr.,
Trans. AIEE, Vol. 48. 1929, page 436. 18. Cathode-Ray Oscillographs and their Uses, E. S. Lee, General Electric Review, Vol.
31, 1928, page 404. 19. Lightning investigation on the 220-kV System of the Pennsylvania Power and Light
company, Edgar bell and A. L. Price, Trans. AIEE, Vol. 50. 1931, page 1101. 20. Lightning Stroke Generators, P. L. Bellaschi, Electric Journal, June, 1935. 21. Characteristics of Surge Generators for Transformer Testing, P. L. Bellaschi, Trans.
AIEE, Vol. 51,1932, page 936. 22. Impulse Testing Techniques C. F. Foust, H. P. Kuehni and N. Rohats, General
Electric Review, July 1932. 23. Impulse Generator Circuit Formulas, J. L. Thomason, Trans. AIEE. Vol. 53, 1934,
page 169.
Lightning
72A-1974-01 Rev. B 3/05 11-247
24. USA and IEEE Standard Techniques for Dielectric Tests, July 12, 1968. 25. Development of the New Autovalve Arrester, Joseph Slepian, Trans. AIEE, vol. 49,
1930, page 404 (see page 257.) 26. Breakdown Curve for Solid Insulation, V. M. Montsinger. Trans . AIEE, Vol. 54, 1935,
page 1300. 27. 1922 Developments in Autovalve Lightning Arresters, A. L. Atherton, Trans. AIEE,
Vol. 42, 1923, page 179. 28. Thyrite – A New Material for Lightning Arresters. Karl D. McEachron, General
Electric Review, Vol. 33, Feb. 1930, page 92. 29. Expulsion Protective Gaps on 132-kv Lines, Philip Sporn and I. W. Gross. Trans.
AIEE, Vol. 54,1935, page 66. 30. Impulse and 60-cycle Strength of Air (RodGapa), P. L. Bellaschi and W. L. Teague,
Trans. AIEE, Vol. 53, 1934, page 1638. 31. Characteristics of Short Rod Gaps, P. L. Bellaschi and W. L. Teague, AIEE.
Lightning Reference book page 1459. 32. Selection of Insulation Levels and Tests for Economy and Reliability, P. L.
Bellaschi, Minute of the 19th Annual Conference of Doble Clients, 1952, Section 6-401.
33. Impulse Testing of Transformers, P. L. Bellaschi, Minutes of the Twenty Sixth Annual Conference of Doble Clients, 1959, Section 6-1801.
34. Impulse Testing (Recent Developments). P. L. Bellaschi, Minutes of the Thirty-First Annual Conference of Doble Clients, 1964, Section 6-1301.
35. A Triggered Chopping Gap for use in Transformer Testing, T. M. Parnell, Trans. IEEE (Power Appartus), 1968, page 1885.
36. Impulse Flashover Characteristics of 345-kv Transmission Towers, H. R. Armstrong, Trans.IEEE (Power Appartus),1966, page 666.
37. Impulse Tests of Allegheny 500-kv Tower Insulation System, W. C. Guykeretal, Trans. IEEE, 1966, page 614.
38. Lightning to the Empire State Building, K. B. McEachron Trans. AIEE, Vol. 60, 1941, page 885.
Ferroresonance
72A-1974-01 Rev. B 3/05 12-248
Chapter 12 - Ferroresonance C.L. Dawes
Doble Engineering Company
12.1 Introduction The term FERRORESONANCE implies a resonant condition in an alternating current ircuit containing, capacitance and inductance in which the magnetic field of the inductor consists of an iron core. Because of the saturation of the iron core, the inductance varies widely with the current so that the circuit behaves quite differently from the usual linear resonant circuit. In electric power systems the combination of the highly inductive windings of transformers and reactors, with the inherent capacitances of the transmission system, can readily produce a ferroresonant condition. For example, for some time, it has been observed that in three-phase power systems, which of course involve transformers, high voltages have immediately followed the blowing of a fuse, the nonsimultaneous opening and closing of switch contacts or the breaking of line conductors. These high voltages often have caused damage to equipment connected to the system. Also, abnormal voltages have occurred on potential transformers with the opening or the closing of one of the two blades of their disconnecting switch. Field observations have also noted actual reversals of voltage and also the reversal of the direction of rotation of motors under these conditions. The writer, as a consultant, at one time was called on the telephone on Monday morning by an engineer of a power company and asked if he could explain the fact that on the preceding Sunday morning, one transformer of a delta-connected 15-kV bank started running so hot that it was necessary to remove it from the system, Later tests showed nothing wrong with the transformer, and when connected to another 15-kV power source, it operated continuously at normal temperature. The foregoing abnormally high voltages, overheating and accompanying phenomena are caused by a circuit condition in which the highly inductive transformer primary winding has inadvertently become connected in series with the system capacitance, forming a ferroresonant circuit which is conducive to the development of high voltages. At the present time the use of higher transmission voltages and the trend toward placing more and more distribution systems under ground, have been to increase the number of occasions in which high ferroresonance voltages have occurred. For example, relatively high voltages have even been experienced on consumers' residential service upon the blowing of a primary sectionalizing fuse. This all has stimulated interest in ferroresonance, its causes and the measures which can be taken either to prevent or to mitigate it. Ferroresonance will be better understood from the properties of a simple alternating-current circuit consisting of resistance, inductance and capacitance in series, which is elementary to all electrical-engineering studies.
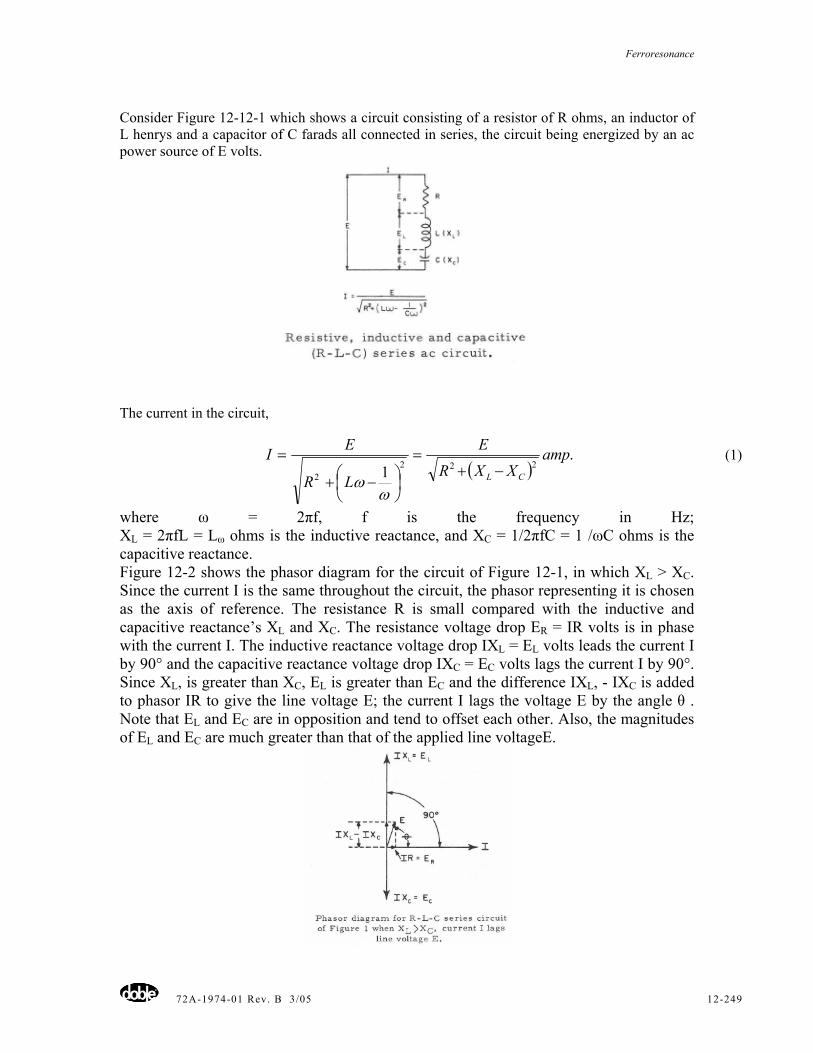
Ferroresonance
72A-1974-01 Rev. B 3/05 12-249
Consider Figure 12-12-1 which shows a circuit consisting of a resistor of R ohms, an inductor of L henrys and a capacitor of C farads all connected in series, the circuit being energized by an ac power source of E volts.
The current in the circuit,
( )
.1 222
2
ampXXR
E
LR
EICL −+
=
⎟⎠⎞
⎜⎝⎛ −+
=
ωω
(1)
where ω = 2πf, f is the frequency in Hz; XL = 2πfL = Lω ohms is the inductive reactance, and XC = 1/2πfC = 1 /ωC ohms is the capacitive reactance. Figure 12-2 shows the phasor diagram for the circuit of Figure 12-1, in which XL > XC. Since the current I is the same throughout the circuit, the phasor representing it is chosen as the axis of reference. The resistance R is small compared with the inductive and capacitive reactance’s XL and XC. The resistance voltage drop ER = IR volts is in phase with the current I. The inductive reactance voltage drop IXL = EL volts leads the current I by 90° and the capacitive reactance voltage drop IXC = EC volts lags the current I by 90°. Since XL, is greater than XC, EL is greater than EC and the difference IXL, - IXC is added to phasor IR to give the line voltage E; the current I lags the voltage E by the angle θ . Note that EL and EC are in opposition and tend to offset each other. Also, the magnitudes of EL and EC are much greater than that of the applied line voltageE.
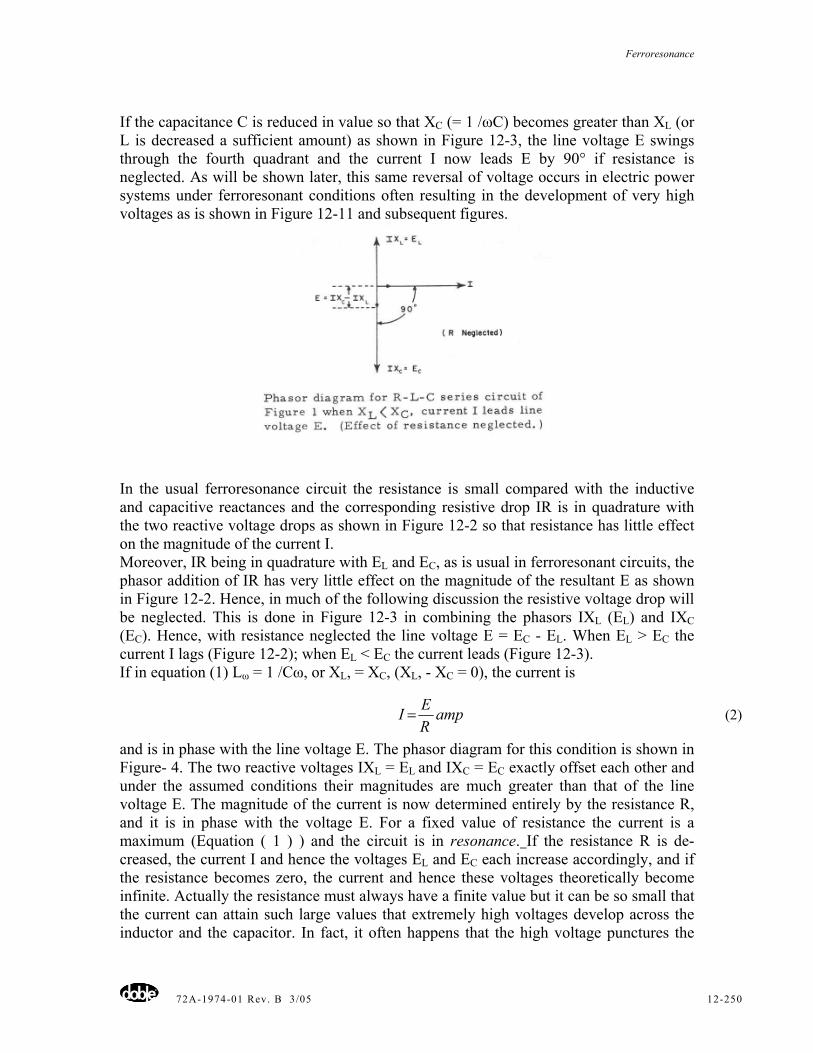
Ferroresonance
72A-1974-01 Rev. B 3/05 12-250
If the capacitance C is reduced in value so that XC (= 1 /ωC) becomes greater than XL (or L is decreased a sufficient amount) as shown in Figure 12-3, the line voltage E swings through the fourth quadrant and the current I now leads E by 90° if resistance is neglected. As will be shown later, this same reversal of voltage occurs in electric power systems under ferroresonant conditions often resulting in the development of very high voltages as is shown in Figure 12-11 and subsequent figures.
In the usual ferroresonance circuit the resistance is small compared with the inductive and capacitive reactances and the corresponding resistive drop IR is in quadrature with the two reactive voltage drops as shown in Figure 12-2 so that resistance has little effect on the magnitude of the current I. Moreover, IR being in quadrature with EL and EC, as is usual in ferroresonant circuits, the phasor addition of IR has very little effect on the magnitude of the resultant E as shown in Figure 12-2. Hence, in much of the following discussion the resistive voltage drop will be neglected. This is done in Figure 12-3 in combining the phasors IXL (EL) and IXC (EC). Hence, with resistance neglected the line voltage E = EC - EL. When EL > EC the current I lags (Figure 12-2); when EL < EC the current leads (Figure 12-3). If in equation (1) Lω = 1 /Cω, or XL, = XC, (XL, - XC = 0), the current is
ampREI = (2)
and is in phase with the line voltage E. The phasor diagram for this condition is shown in Figure- 4. The two reactive voltages IXL = EL and IXC = EC exactly offset each other and under the assumed conditions their magnitudes are much greater than that of the line voltage E. The magnitude of the current is now determined entirely by the resistance R, and it is in phase with the voltage E. For a fixed value of resistance the current is a maximum (Equation ( 1 ) ) and the circuit is in resonance. If the resistance R is de-creased, the current I and hence the voltages EL and EC each increase accordingly, and if the resistance becomes zero, the current and hence these voltages theoretically become infinite. Actually the resistance must always have a finite value but it can be so small that the current can attain such large values that extremely high voltages develop across the inductor and the capacitor. In fact, it often happens that the high voltage punctures the
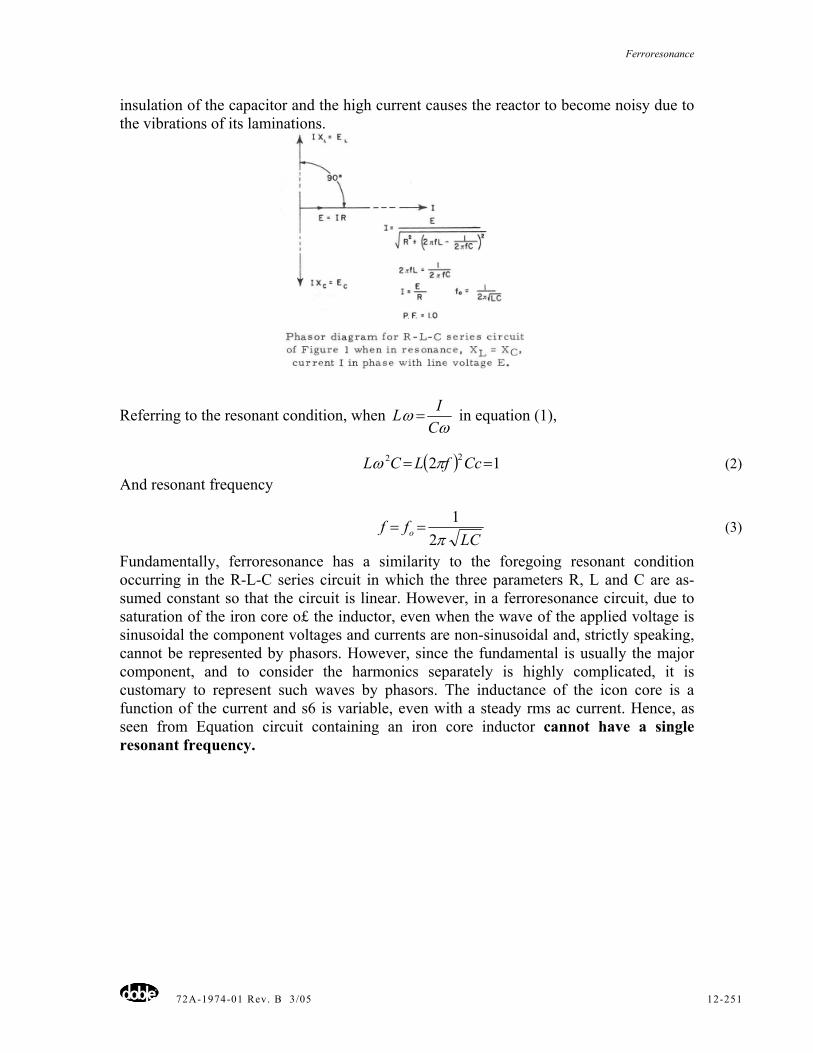
Ferroresonance
72A-1974-01 Rev. B 3/05 12-251
insulation of the capacitor and the high current causes the reactor to become noisy due to the vibrations of its laminations.
Referring to the resonant condition, when ω
ωC
IL = in equation (1),
( ) 12 22 == CcfLCL πω (2) And resonant frequency
LC
ff o π21
== (3)
Fundamentally, ferroresonance has a similarity to the foregoing resonant condition occurring in the R-L-C series circuit in which the three parameters R, L and C are as-sumed constant so that the circuit is linear. However, in a ferroresonance circuit, due to saturation of the iron core o£ the inductor, even when the wave of the applied voltage is sinusoidal the component voltages and currents are non-sinusoidal and, strictly speaking, cannot be represented by phasors. However, since the fundamental is usually the major component, and to consider the harmonics separately is highly complicated, it is customary to represent such waves by phasors. The inductance of the icon core is a function of the current and s6 is variable, even with a steady rms ac current. Hence, as seen from Equation circuit containing an iron core inductor cannot have a single resonant frequency.
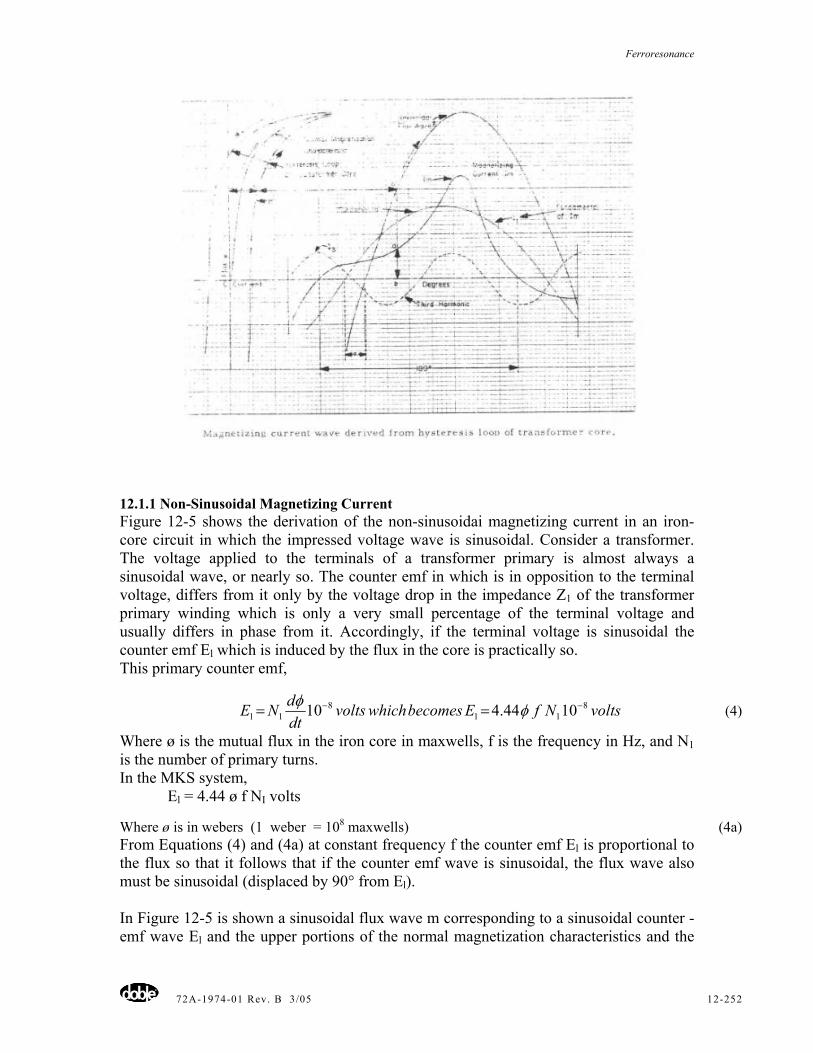
Ferroresonance
72A-1974-01 Rev. B 3/05 12-252
12.1.1 Non-Sinusoidal Magnetizing Current Figure 12-5 shows the derivation of the non-sinusoidai magnetizing current in an iron-core circuit in which the impressed voltage wave is sinusoidal. Consider a transformer. The voltage applied to the terminals of a transformer primary is almost always a sinusoidal wave, or nearly so. The counter emf in which is in opposition to the terminal voltage, differs from it only by the voltage drop in the impedance Z1 of the transformer primary winding which is only a very small percentage of the terminal voltage and usually differs in phase from it. Accordingly, if the terminal voltage is sinusoidal the counter emf El which is induced by the flux in the core is practically so. This primary counter emf,
voltsNfEbecomeswhichvoltsdtdNE 8
118
11 1044.410 −− == φφ (4)
Where ø is the mutual flux in the iron core in maxwells, f is the frequency in Hz, and N1 is the number of primary turns. In the MKS system,
El = 4.44 ø f NI volts
Where ø is in webers (1 weber = 108 maxwells) (4a) From Equations (4) and (4a) at constant frequency f the counter emf El is proportional to the flux so that it follows that if the counter emf wave is sinusoidal, the flux wave also must be sinusoidal (displaced by 90° from El). In Figure 12-5 is shown a sinusoidal flux wave m corresponding to a sinusoidal counter -emf wave El and the upper portions of the normal magnetization characteristics and the
Ferroresonance
72A-1974-01 Rev. B 3/05 12-253
hystersis loop H for a transformer core. Since the reluctance of the magnetic core is highly non-linear, as illustrated by the hysteresis loop the flux and the magnetizing current wave cannot be proportional to each other. Figure 12-5 shows the method of deriving the magnetizing current wave from the hysteresis loop. Consider the value a' of the flux on the rising portion of the sinusoidal flux wave. The corresponding flux value on the hysteresis loop is a and the current to produce this flux is ab. This value an of the current becomes an ordinate at the abscissa corresponding to the point a' on the sinusoidal flux wave ø. By proceeding in this manner for different values of flux given by the flux wave ø a complete magnetizing-current wave Im is obtained. Obviously, this wave is far from sinusoidal and a high peak occurs at the maximum value of the sinusoidal flux wave ø. That is, because of the highly saturated condition of the transformer iron at this point a very much larger number of ampereturns, and hence a much greater value of magnetizing current are necessary to produce a given value of flux. Obviously, the current wave Im is far from sinusoidal and accordingly must contain harmonics, that is, currents having frequencies that are integer multiple of the funds-mental frequency. When the positive and negative portions of the wave are similar, the frequencies of the harmonics are only odd multiples of the fundamental frequency. As is well known any repetitive non-sinusoidal wave may be analyzed into its fundamental component (if present) and the sinusoidal harmonics at the higher frequencies, which are, present. The current wave Im of Figure 12-5 contains a pronounced third harmonic, a fifth harmonic of lesser amplitude and some higher odd harmonics which dirrlinish in ampli-tude as their frequency increases. For simplicity only the fundamental component I1 and the third harmonic 13 are shown. The hysteresis loss is accounted for by the angle α be-tween the flux wave ø and the fundamental component I1, the loss being proportional to sin α. The exciting current or the total no-load current is the sum of the magnetizing cur-rent and the eddy-current-loss current (not shown).
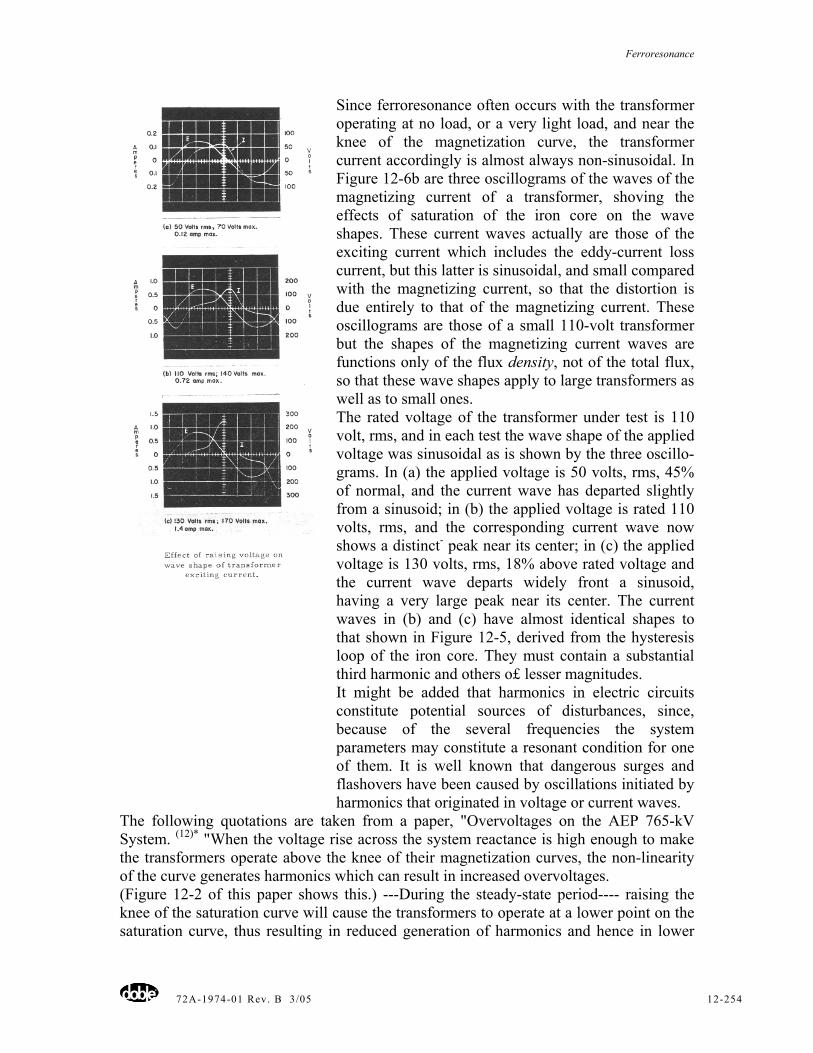
Ferroresonance
72A-1974-01 Rev. B 3/05 12-254
Since ferroresonance often occurs with the transformer operating at no load, or a very light load, and near the knee of the magnetization curve, the transformer current accordingly is almost always non-sinusoidal. In Figure 12-6b are three oscillograms of the waves of the magnetizing current of a transformer, shoving the effects of saturation of the iron core on the wave shapes. These current waves actually are those of the exciting current which includes the eddy-current loss current, but this latter is sinusoidal, and small compared with the magnetizing current, so that the distortion is due entirely to that of the magnetizing current. These oscillograms are those of a small 110-volt transformer but the shapes of the magnetizing current waves are functions only of the flux density, not of the total flux, so that these wave shapes apply to large transformers as well as to small ones. The rated voltage of the transformer under test is 110 volt, rms, and in each test the wave shape of the applied voltage was sinusoidal as is shown by the three oscillo-grams. In (a) the applied voltage is 50 volts, rms, 45% of normal, and the current wave has departed slightly from a sinusoid; in (b) the applied voltage is rated 110 volts, rms, and the corresponding current wave now shows a distinct- peak near its center; in (c) the applied voltage is 130 volts, rms, 18% above rated voltage and the current wave departs widely front a sinusoid, having a very large peak near its center. The current waves in (b) and (c) have almost identical shapes to that shown in Figure 12-5, derived from the hysteresis loop of the iron core. They must contain a substantial third harmonic and others o£ lesser magnitudes. It might be added that harmonics in electric circuits constitute potential sources of disturbances, since, because of the several frequencies the system parameters may constitute a resonant condition for one of them. It is well known that dangerous surges and flashovers have been caused by oscillations initiated by harmonics that originated in voltage or current waves.
The following quotations are taken from a paper, "Overvoltages on the AEP 765-kV System. (12)* "When the voltage rise across the system reactance is high enough to make the transformers operate above the knee of their magnetization curves, the non-linearity of the curve generates harmonics which can result in increased overvoltages. (Figure 12-2 of this paper shows this.) ---During the steady-state period---- raising the knee of the saturation curve will cause the transformers to operate at a lower point on the saturation curve, thus resulting in reduced generation of harmonics and hence in lower
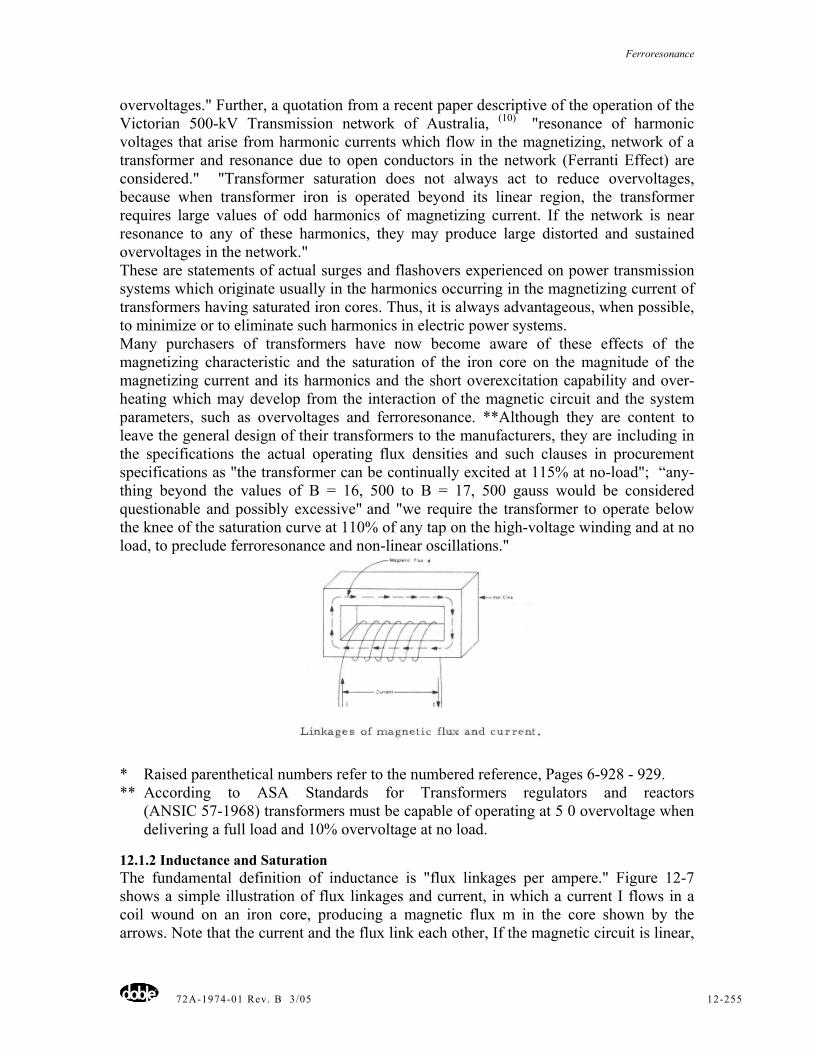
Ferroresonance
72A-1974-01 Rev. B 3/05 12-255
overvoltages." Further, a quotation from a recent paper descriptive of the operation of the Victorian 500-kV Transmission network of Australia, (10) "resonance of harmonic voltages that arise from harmonic currents which flow in the magnetizing, network of a transformer and resonance due to open conductors in the network (Ferranti Effect) are considered." "Transformer saturation does not always act to reduce overvoltages, because when transformer iron is operated beyond its linear region, the transformer requires large values of odd harmonics of magnetizing current. If the network is near resonance to any of these harmonics, they may produce large distorted and sustained overvoltages in the network." These are statements of actual surges and flashovers experienced on power transmission systems which originate usually in the harmonics occurring in the magnetizing current of transformers having saturated iron cores. Thus, it is always advantageous, when possible, to minimize or to eliminate such harmonics in electric power systems. Many purchasers of transformers have now become aware of these effects of the magnetizing characteristic and the saturation of the iron core on the magnitude of the magnetizing current and its harmonics and the short overexcitation capability and over-heating which may develop from the interaction of the magnetic circuit and the system parameters, such as overvoltages and ferroresonance. **Although they are content to leave the general design of their transformers to the manufacturers, they are including in the specifications the actual operating flux densities and such clauses in procurement specifications as "the transformer can be continually excited at 115% at no-load"; “any-thing beyond the values of B = 16, 500 to B = 17, 500 gauss would be considered questionable and possibly excessive" and "we require the transformer to operate below the knee of the saturation curve at 110% of any tap on the high-voltage winding and at no load, to preclude ferroresonance and non-linear oscillations."
* Raised parenthetical numbers refer to the numbered reference, Pages 6-928 - 929. ** According to ASA Standards for Transformers regulators and reactors
(ANSIC 57-1968) transformers must be capable of operating at 5 0 overvoltage when delivering a full load and 10% overvoltage at no load.
12.1.2 Inductance and Saturation The fundamental definition of inductance is "flux linkages per ampere." Figure 12-7 shows a simple illustration of flux linkages and current, in which a current I flows in a coil wound on an iron core, producing a magnetic flux m in the core shown by the arrows. Note that the current and the flux link each other, If the magnetic circuit is linear,
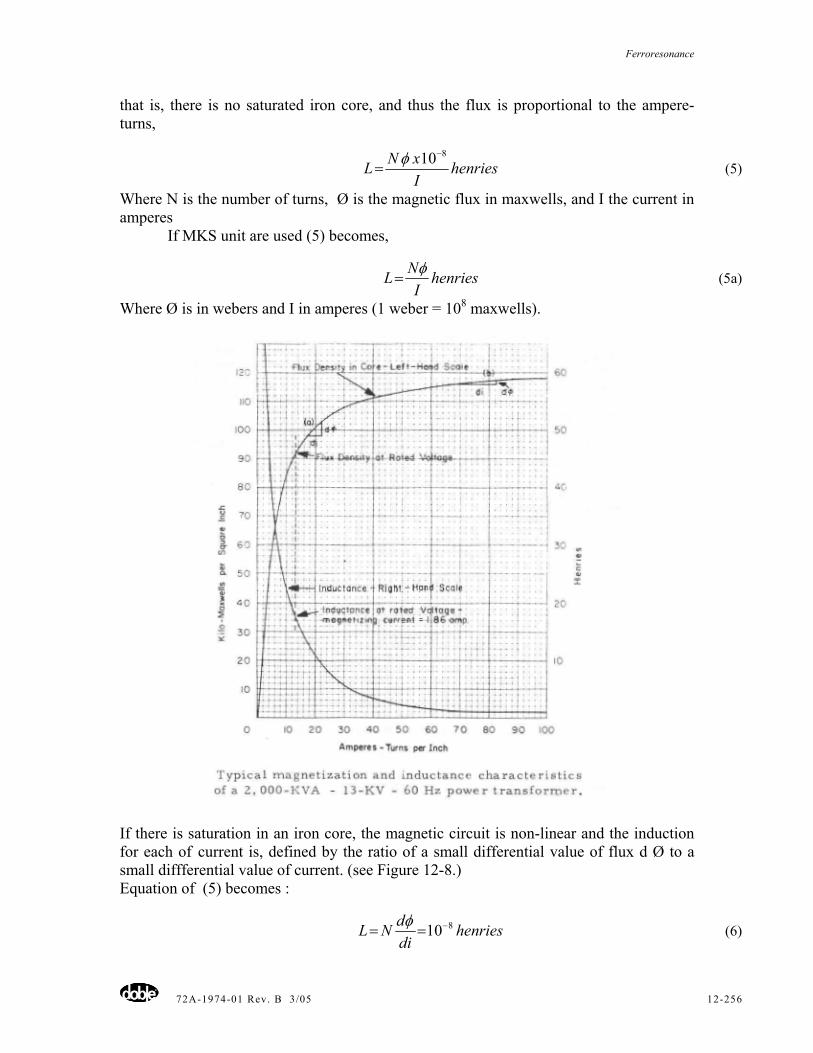
Ferroresonance
72A-1974-01 Rev. B 3/05 12-256
that is, there is no saturated iron core, and thus the flux is proportional to the ampere-turns,
henriesIxNL
810−
=φ
(5)
Where N is the number of turns, Ø is the magnetic flux in maxwells, and I the current in amperes
If MKS unit are used (5) becomes,
henriesI
NL φ= (5a)
Where Ø is in webers and I in amperes (1 weber = 108 maxwells).
If there is saturation in an iron core, the magnetic circuit is non-linear and the induction for each of current is, defined by the ratio of a small differential value of flux d Ø to a small diffferential value of current. (see Figure 12-8.) Equation of (5) becomes :
henriesdidNL 810−==φ
(6)
Ferroresonance
72A-1974-01 Rev. B 3/05 12-257
This relation is illustrated in Figure 12-8, which shows a typical normal magnetization curve for transformer steel. (Actually, the transformer core operates over a hysteresis loop; the upper part of which is shown in Figure 12-5.) The flux density and the magnetizing current (1.86 amp.) at rated voltage (13 kV) are indicated. The inductance of the core L is computed from different values of dØ/di at different points such as a and b obtained along the flux-density characteristics, and is plotted as a function of the ampere-turns per inch. The inductance varies greatly from a value of 60 henries at low saturation to 1 henry at high saturation, a ratio of 60:1. This can be readily understood by noting, as at b and beyond the value of the differential flux dØ is very small, very near zero, making dØ/di also very small. This very wide variation of inductance L with the current makes mathematical calculations difficult. It is stated earlier that in electric power systems the combination of the highly inductive windings of transformers with the inherent capacitances of the transmission system can produce a ferroresonant condition. As will be shown later, this ferroresonant condition almost always occurs when transformer primaries become connected, usually inad-vertently, in series with the capacitance to ground of the transmission conductors, thus forming a ferroresonant circuit such as is shown in Figure 12-9. Such ferroresonant cir-cuits have a similarity to the R-L-C circuit of Figure 12-1 in that they involve resistance inductance and capacitance in series. However, in power systems, the reactor is usually the primary of a large power transformer or a shunt reactor, the resistances of which in ferroresonant circuits, are almost always negligible compared with their inductive and capacitive reactances. As will be shown later, conditions often develop in which these inductive reactances become connected in series with a line or a cable capacitance and a situation for resonance develops. When such resonance occurs, voltages and currents can build up to abnormal and even damaging values. Although this resonant condition is analogous to that in the linear ac series circuit of Figure 12-1, it is not so clear cut in that it usually does not have a specific resonant frequency (fo = 1/2π√LC) because of the widely varying inductance of the reactor, shown in Figure 12-8, due to saturation of the iron core of the reactor. Although very high voltages can develop, fortunately, they are limited by saturation from obtaining the very high (theoretically infinite) values possible in the linear circuits. (See Figures 12 and 17.) Also the voltage (as related to the current) can readily change from lead to lag and vice versa, as shown for the linear circuit in Figures 2 and 3, with a change in circuit conditions. Mathematical calculations of currents and voltages and other electrical quantities in ferroresonant circuits, as is done with linear circuits, are quite unsatisfactory because the non-sinusoidal wave forms, Figures 5 and 6, cannot be represented by phasors and also because the inductance varies widely with the value of the current, Figure 12-8, even during each half-cycle. For these reasons it has been found that actual circuit values may differ radically from values calculated mathematically. Far more consistent results as well as a better understanding of circuit operations can usually be obtained by the use of graphical methods.
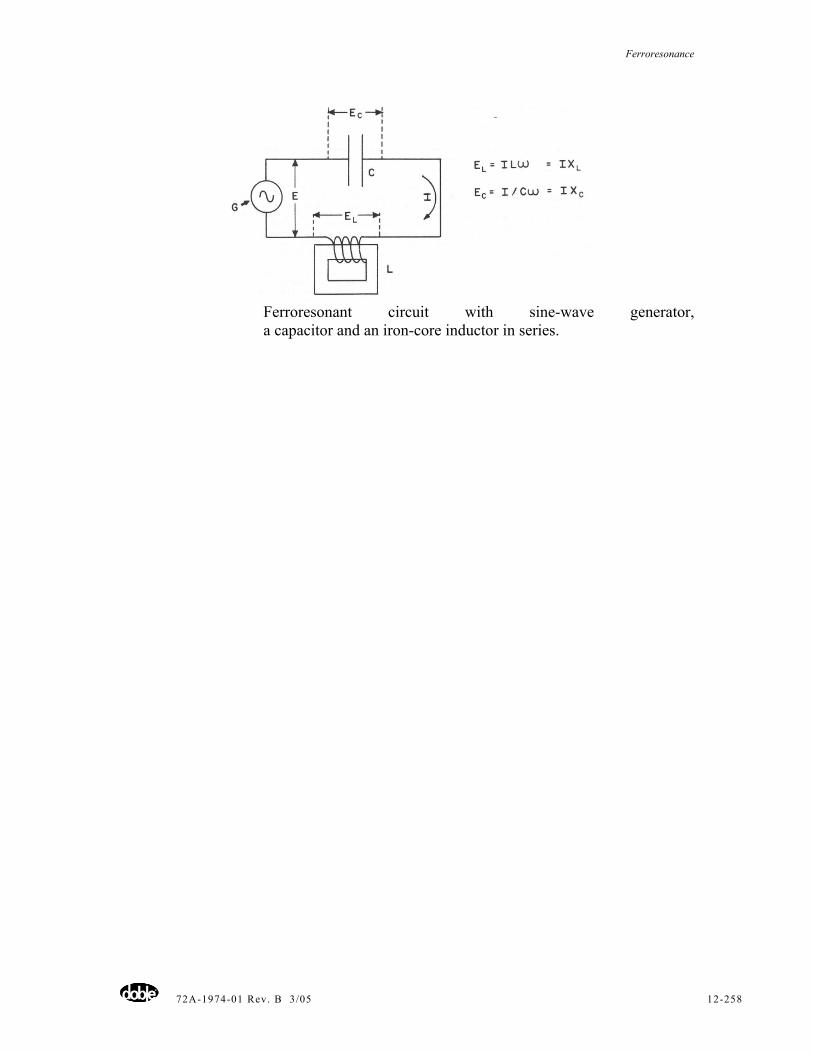
Ferroresonance
72A-1974-01 Rev. B 3/05 12-258
Ferroresonant circuit with sine-wave generator, a capacitor and an iron-core inductor in series.
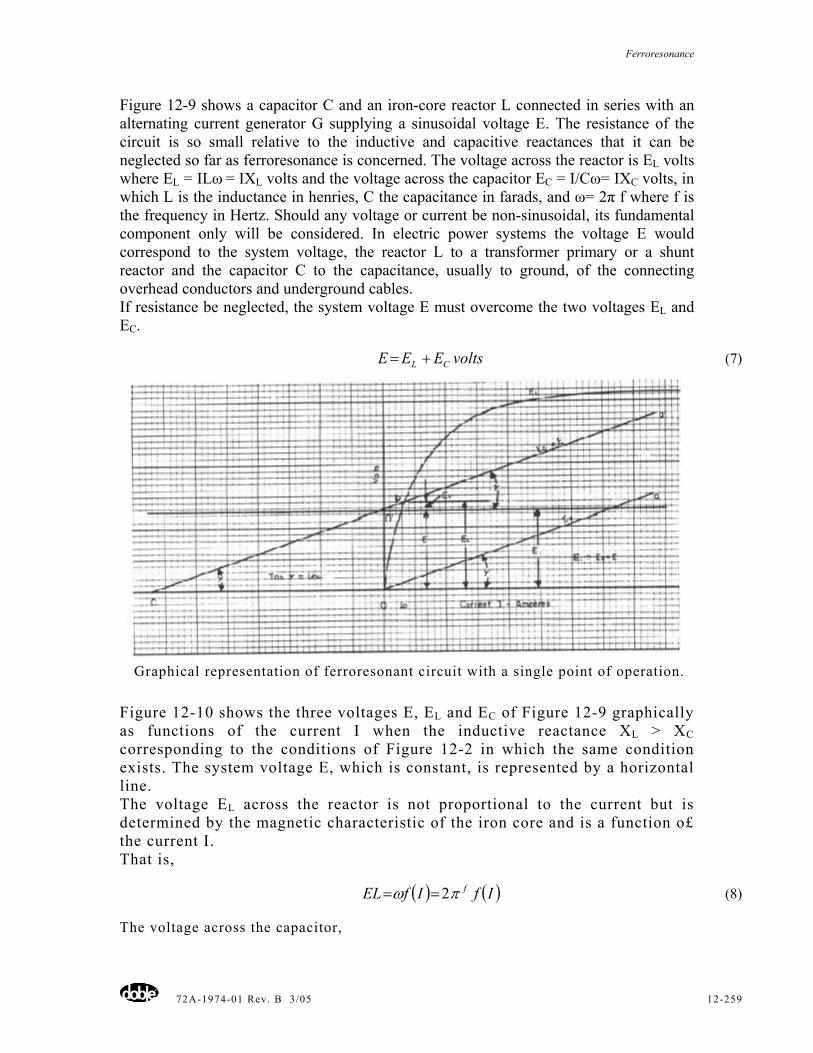
Ferroresonance
72A-1974-01 Rev. B 3/05 12-259
Figure 12-9 shows a capacitor C and an iron-core reactor L connected in series with an alternating current generator G supplying a sinusoidal voltage E. The resistance of the circuit is so small relative to the inductive and capacitive reactances that it can be neglected so far as ferroresonance is concerned. The voltage across the reactor is EL volts where EL = ILω = IXL volts and the voltage across the capacitor EC = I/Cω= IXC volts, in which L is the inductance in henries, C the capacitance in farads, and ω= 2π f where f is the frequency in Hertz. Should any voltage or current be non-sinusoidal, its fundamental component only will be considered. In electric power systems the voltage E would correspond to the system voltage, the reactor L to a transformer primary or a shunt reactor and the capacitor C to the capacitance, usually to ground, of the connecting overhead conductors and underground cables. If resistance be neglected, the system voltage E must overcome the two voltages EL and EC.
voltsEEE CL += (7)
Graphical representation of ferroresonant circuit with a single point of operation.
Figure 12-10 shows the three voltages E, EL and EC of Figure 12-9 graphically as functions of the current I when the inductive reactance XL > XC corresponding to the conditions of Figure 12-2 in which the same condition exists. The system voltage E, which is constant, is represented by a horizontal line. The voltage EL across the reactor is not proportional to the current but is determined by the magnetic characteristic of the iron core and is a function o£ the current I. That is,
( ) ( )IfIfEL fπω 2== (8)
The voltage across the capacitor,
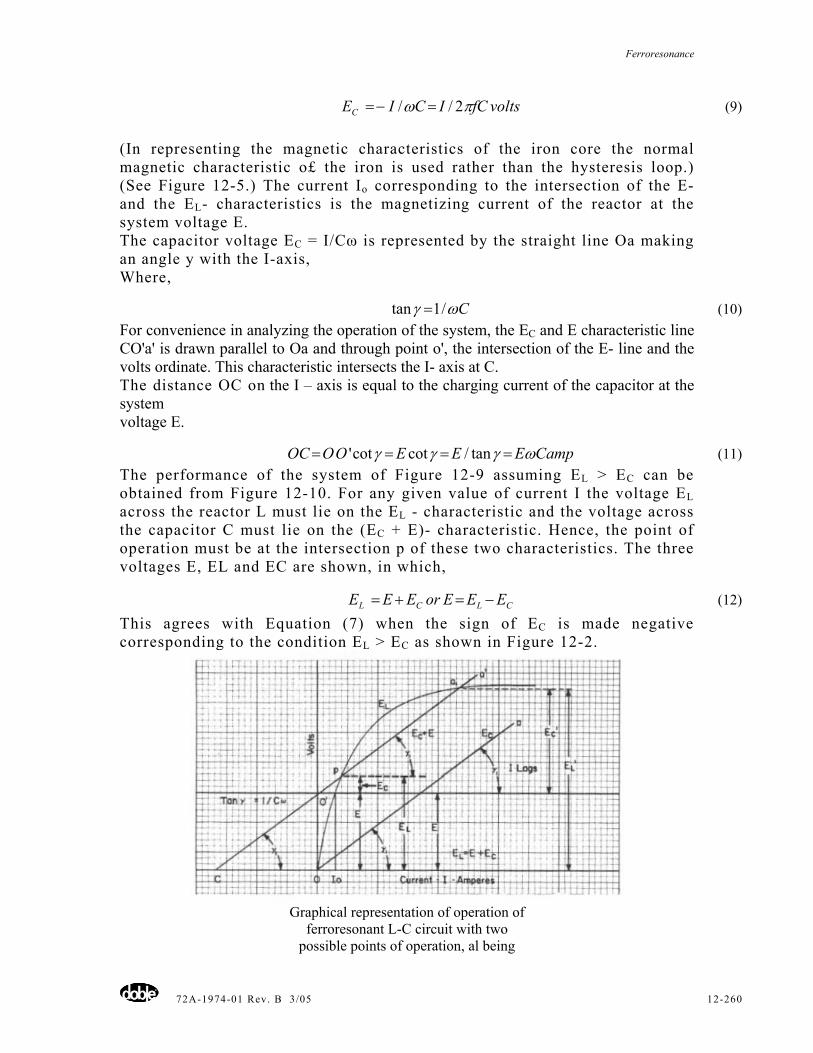
Ferroresonance
72A-1974-01 Rev. B 3/05 12-260
voltsfCICIEC πω 2// =−= (9)
(In representing the magnetic characteristics of the iron core the normal magnetic characteristic o£ the iron is used rather than the hysteresis loop.) (See Figure 12-5.) The current Io corresponding to the intersection of the E- and the EL- characteristics is the magnetizing current of the reactor at the system voltage E. The capacitor voltage EC = I/Cω is represented by the straight line Oa making an angle y with the I-axis, Where,
Cωγ /1tan = (10) For convenience in analyzing the operation of the system, the EC and E characteristic line CO'a' is drawn parallel to Oa and through point o', the intersection of the E- line and the volts ordinate. This characteristic intersects the I- axis at C. The distance OC on the I – axis is equal to the charging current of the capacitor at the system voltage E.
ampCEEEOOOC ωγγγ ==== tan/cotcot' (11) The performance of the system of Figure 12-9 assuming EL > EC can be obtained from Figure 12-10. For any given value of current I the voltage EL across the reactor L must lie on the EL - characteristic and the voltage across the capacitor C must lie on the (EC + E)- characteristic. Hence, the point of operation must be at the intersection p of these two characteristics. The three voltages E, EL and EC are shown, in which,
CLCL EEEorEEE −=+= (12)
This agrees with Equation (7) when the sign of EC is made negative corresponding to the condition EL > EC as shown in Figure 12-2.
Graphical representation of operation of
ferroresonant L-C circuit with two possible points of operation, al being
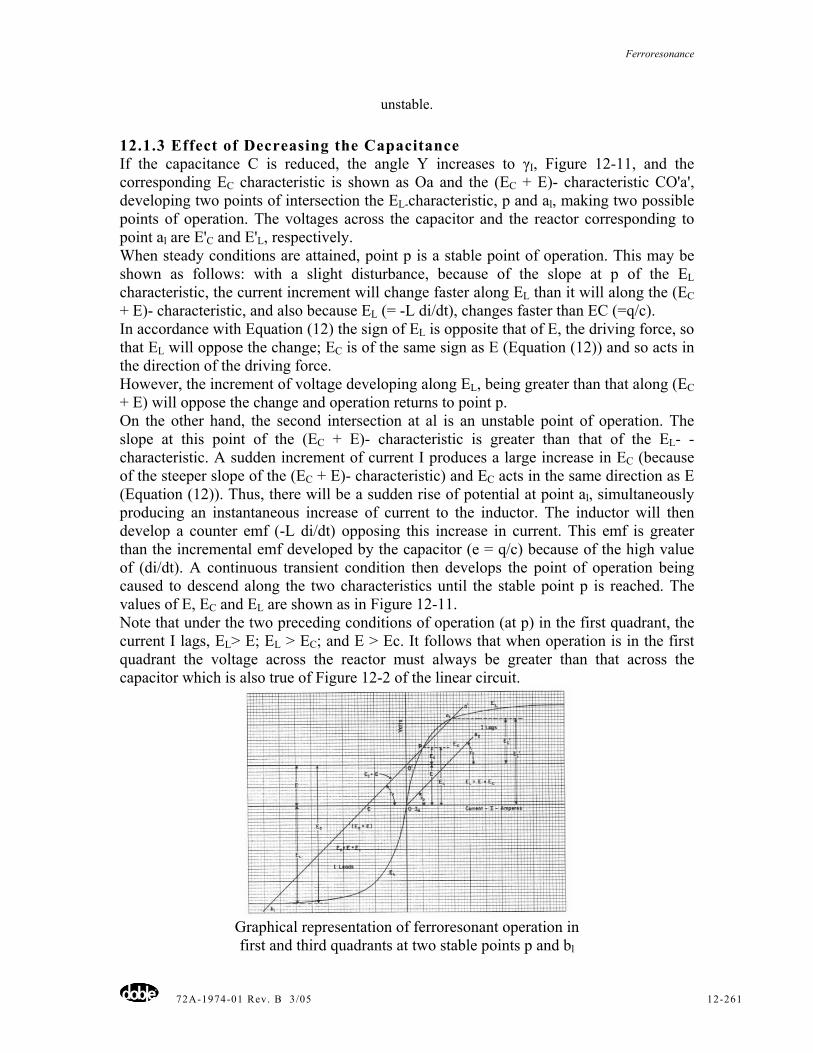
Ferroresonance
72A-1974-01 Rev. B 3/05 12-261
unstable.
12.1.3 Effect of Decreasing the Capacitance If the capacitance C is reduced, the angle Y increases to γI, Figure 12-11, and the corresponding EC characteristic is shown as Oa and the (EC + E)- characteristic CO'a', developing two points of intersection the EL-characteristic, p and al, making two possible points of operation. The voltages across the capacitor and the reactor corresponding to point al are E'C and E'L, respectively. When steady conditions are attained, point p is a stable point of operation. This may be shown as follows: with a slight disturbance, because of the slope at p of the EL characteristic, the current increment will change faster along EL than it will along the (EC + E)- characteristic, and also because EL (= -L di/dt), changes faster than EC (=q/c). In accordance with Equation (12) the sign of EL is opposite that of E, the driving force, so that EL will oppose the change; EC is of the same sign as E (Equation (12)) and so acts in the direction of the driving force. However, the increment of voltage developing along EL, being greater than that along (EC + E) will oppose the change and operation returns to point p. On the other hand, the second intersection at al is an unstable point of operation. The slope at this point of the (EC + E)- characteristic is greater than that of the EL- -characteristic. A sudden increment of current I produces a large increase in EC (because of the steeper slope of the (EC + E)- characteristic) and EC acts in the same direction as E (Equation (12)). Thus, there will be a sudden rise of potential at point al, simultaneously producing an instantaneous increase of current to the inductor. The inductor will then develop a counter emf (-L di/dt) opposing this increase in current. This emf is greater than the incremental emf developed by the capacitor (e = q/c) because of the high value of (di/dt). A continuous transient condition then develops the point of operation being caused to descend along the two characteristics until the stable point p is reached. The values of E, EC and EL are shown as in Figure 12-11. Note that under the two preceding conditions of operation (at p) in the first quadrant, the current I lags, EL> E; EL > EC; and E > Ec. It follows that when operation is in the first quadrant the voltage across the reactor must always be greater than that across the capacitor which is also true of Figure 12-2 of the linear circuit.
Graphical representation of ferroresonant operation in first and third quadrants at two stable points p and bl
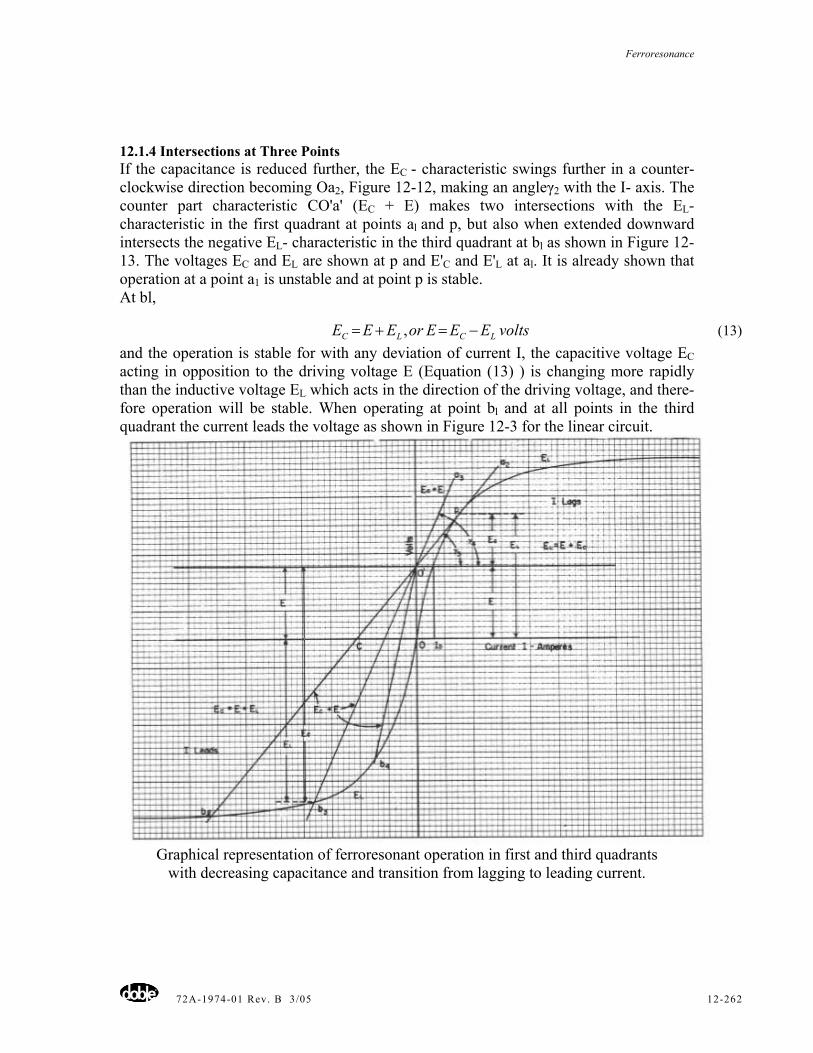
Ferroresonance
72A-1974-01 Rev. B 3/05 12-262
12.1.4 Intersections at Three Points If the capacitance is reduced further, the EC - characteristic swings further in a counter-clockwise direction becoming Oa2, Figure 12-12, making an angleγ2 with the I- axis. The counter part characteristic CO'a' (EC + E) makes two intersections with the EL- characteristic in the first quadrant at points al and p, but also when extended downward intersects the negative EL- characteristic in the third quadrant at bl as shown in Figure 12-13. The voltages EC and EL are shown at p and E'C and E'L at al. It is already shown that operation at a point a1 is unstable and at point p is stable. At bl,
voltsEEEorEEE LCLC −=+= , (13) and the operation is stable for with any deviation of current I, the capacitive voltage EC acting in opposition to the driving voltage E (Equation (13) ) is changing more rapidly than the inductive voltage EL which acts in the direction of the driving voltage, and there-fore operation will be stable. When operating at point bl and at all points in the third quadrant the current leads the voltage as shown in Figure 12-3 for the linear circuit.
Graphical representation of ferroresonant operation in first and third quadrants
with decreasing capacitance and transition from lagging to leading current.
Ferroresonance
72A-1974-01 Rev. B 3/05 12-263
Let the capacitance C be further reduced until the (EC + E)- characteristic, still swinging counter- clockwise, becomes b2CO'a2, Figure 12-13, tangent to the EL- characteristic at point p, and makes an angle γ 3 with the I-axis and intersects the negative EL- -characteristic at b2. This position of the (EC + E)- characteristic is critical in that it corresponds to the smallest value of capacitance with which the system will operate in the first quadrant and thus with lagging current. As is already shown at the two points p and b2 operation is stable. With further decrease in capacitance C the (EC + E)- characteristic becomes b3 O' a3 making an angle γ4 with the I-axis and it loses all contact with the EL- characteristic in the first quadrant and operation in this quadrant with lagging current is no longer possible. Operation then occurs at the intersection b3 with the negative portion of the EL- characteristic in the third quadrant as shown in Figure 12-13, The three voltages, E, EL, and EC, at b2, are shown. Note that as the (EC + E)- characteristic swings from its position in Figure 12-11 at angle γ to its tangent position in Figure 12-13 at γ3, both EL and EC have increased radically and have reached, or nearly reached, their maximum possible values. The values of E, EL and EC corresponding to b3 are shown. Note that they have diminished somewhat in their values corresponding to bI in Figure 12-12 and b2 in Figure 12-13. A further decrease in capacitance would give an (EC + E)- characteristic b4 O'a3 and the voltages EL and EC now begin to decrease rapidly with small decreases in capacitance. This transition from lagging to leading current corresponds to the transition in the linear circuit which occurred from Figure 12-2 to Figure 12-3. Figures 11, 12 and 13 show how changes in the capacitance can change the magnitudes and the phase of the voltages appearing across the reactor and the capacitor, which in a power system would correspond to a transformer primary or a shunt reactor, and to the capacitance represented by overhead transmission lines and underground cables. For example, in Figures 10 and 11, the voltage EL is only slightly greater than the system voltage E and the capacitor voltage EC is a small fraction thereof. In Figure 12-12 these two voltages have increased moderately in the first quadrant, EC still remaining a fraction of E, but in the third quadrant EL is much greater than its value in the first quadrant, and EC very many times its corresponding value. Also Figures 12 and 13 show that the voltages developed across the reactor (or transformer) and across the capacitor can be two or three times the values of the system voltage E, accounting for the overheating of transformers and for abnormal voltages which have occurred on transmission and distri-bution systems. The damage to a transformer produced by overheating caused by overvoltage is well documented in a paper(7) by N. D. Coughlin of the Northern States Power Company. A transformer was subjected to high overvoltages during the starting-up period which caused severe overheating and the, transformer failed the following day. In a paper(8) by A. H. Locke of the Oklahoma Gas and Electric Company, a transformer was also sub-jected to overvoltages during the starting-up period resulting in charring of the insulation. A discussion of the Locke paper by P. L. Bellaschi(9) is given on Page Sec. 6-501A of the 1968 Doble Minutes.
Ferroresonance
72A-1974-01 Rev. B 3/05 12-264
Under the conditions shown in Figures 12 and 13, two states of operation are possible, one at p in the first quadrant with lagging current and the other at bl, b2, b3 or b4 in the third quadrant with leading current. The question naturally arises as to what determines the point of operation such,for example p in the first quadrant or at such other points as bl or b2 in the third. It is all a matter of chance, the point of operation being determined by the phase of the voltage at the instant that the circuit is switched on. This accounts, at least in part, for the oc-currence of abnormally high voltages which have occurred immediately following the closing of a switch, which by chance, may correspond to operation in the third quadrant. Also transition from the relatively lower voltage occurring in the first quadrant can also be caused by changes in capacitance in the transmission system produced by the switching off of external lines or circuits. Since power transformers as a rule operate not far below the knee of the magnetization characteristics of the transformer core, a relatively small increase in the voltage, and hence the flux produces a tremendous increase in the magnetizing current as a study of the EL, characteristics shows. This not only produces a large I2R loss in the primary winding but also a large core loss. Experience has shown that ferroresonance has frequently become manifest by the overheating of transformers operating at a very light load or at no load. Also ferroresonance may make itself known by the very loud power frequency noise from the vibrations of the core laminations caused by the very high values of magnetizing currents.
12.1.5 Effect of Raising the System Voltage Figure 12-14 shows a system operating at voltage El with the magnetization characteristic EL and the capacitance characteristic (El + EC) apl O' Cal making an angle γ with the I-axis and intersecting the positive ELcharacteristic at points a' and pl and intersecting the negative characteristic at pl'. Operation at a' is unstable; assume operation is at point pl which is stable and being in the first quadrant, the current lags. If the system voltage is raised to E2 volts, the (El + EC)- characteristic is raised proportionately parallel to itself to (E2 + EC) still making an angle γ with the I-axis and becoming al O"C' a2. The EL characteristic will remain unchanged since the value of magnetic flux, and hence EL, will be still the same for each value of current. The new (E2 + EC)- characteristic no longer intersects the EL- characteristic in the first quadrant (see Figure 12-13), but intersects its negative counterpart at point p2 in the third quadrant. Hence, operation at relatively low values of EL and EC with lagging current suddenly becomes operation at very much higher values of these same voltages and with leading current. This condition can readily occur in practice, since it is already shown that with an initial operation at a point such as pl, a reduction in capacitance can raise the system voltage E (Figure 12-13). This has the cumulative effect in creating a disturbance by causing the change from a relatively low voltage with lagging current to high voltages with leading current.
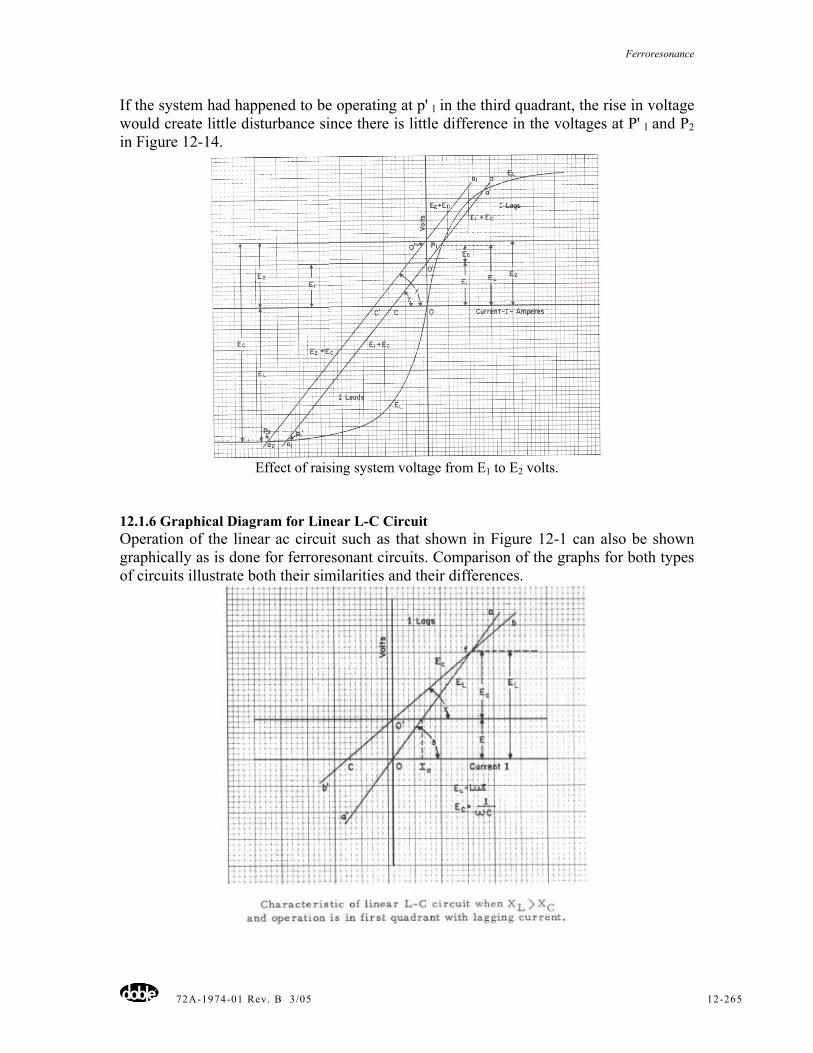
Ferroresonance
72A-1974-01 Rev. B 3/05 12-265
If the system had happened to be operating at p' l in the third quadrant, the rise in voltage would create little disturbance since there is little difference in the voltages at P' l and P2 in Figure 12-14.
Effect of raising system voltage from E1 to E2 volts.
12.1.6 Graphical Diagram for Linear L-C Circuit Operation of the linear ac circuit such as that shown in Figure 12-1 can also be shown graphically as is done for ferroresonant circuits. Comparison of the graphs for both types of circuits illustrate both their similarities and their differences.
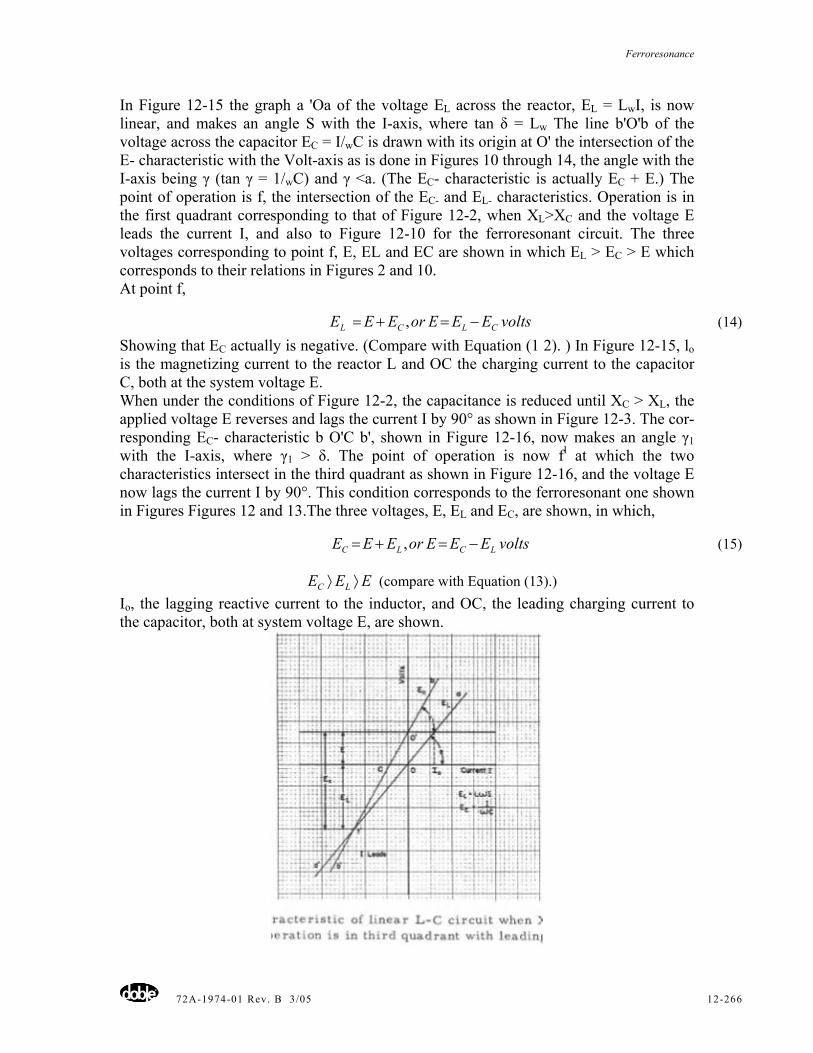
Ferroresonance
72A-1974-01 Rev. B 3/05 12-266
In Figure 12-15 the graph a 'Oa of the voltage EL across the reactor, EL = LwI, is now linear, and makes an angle S with the I-axis, where tan δ = Lw The line b'O'b of the voltage across the capacitor EC = I/wC is drawn with its origin at O' the intersection of the E- characteristic with the Volt-axis as is done in Figures 10 through 14, the angle with the I-axis being γ (tan γ = 1/wC) and γ <a. (The EC- characteristic is actually EC + E.) The point of operation is f, the intersection of the EC- and EL- characteristics. Operation is in the first quadrant corresponding to that of Figure 12-2, when XL>XC and the voltage E leads the current I, and also to Figure 12-10 for the ferroresonant circuit. The three voltages corresponding to point f, E, EL and EC are shown in which EL > EC > E which corresponds to their relations in Figures 2 and 10. At point f,
voltsEEEorEEE CLCL −=+= , (14)
Showing that EC actually is negative. (Compare with Equation (1 2). ) In Figure 12-15, lo is the magnetizing current to the reactor L and OC the charging current to the capacitor C, both at the system voltage E. When under the conditions of Figure 12-2, the capacitance is reduced until XC > XL, the applied voltage E reverses and lags the current I by 90° as shown in Figure 12-3. The cor-responding EC- characteristic b O'C b', shown in Figure 12-16, now makes an angle γ1 with the I-axis, where γ1 > δ. The point of operation is now fl at which the two characteristics intersect in the third quadrant as shown in Figure 12-16, and the voltage E now lags the current I by 90°. This condition corresponds to the ferroresonant one shown in Figures Figures 12 and 13.The three voltages, E, EL and EC, are shown, in which,
voltsEEEorEEE LCLC −=+= , (15)
EEE LC ⟩⟩ (compare with Equation (13).) Io, the lagging reactive current to the inductor, and OC, the leading charging current to the capacitor, both at system voltage E, are shown.
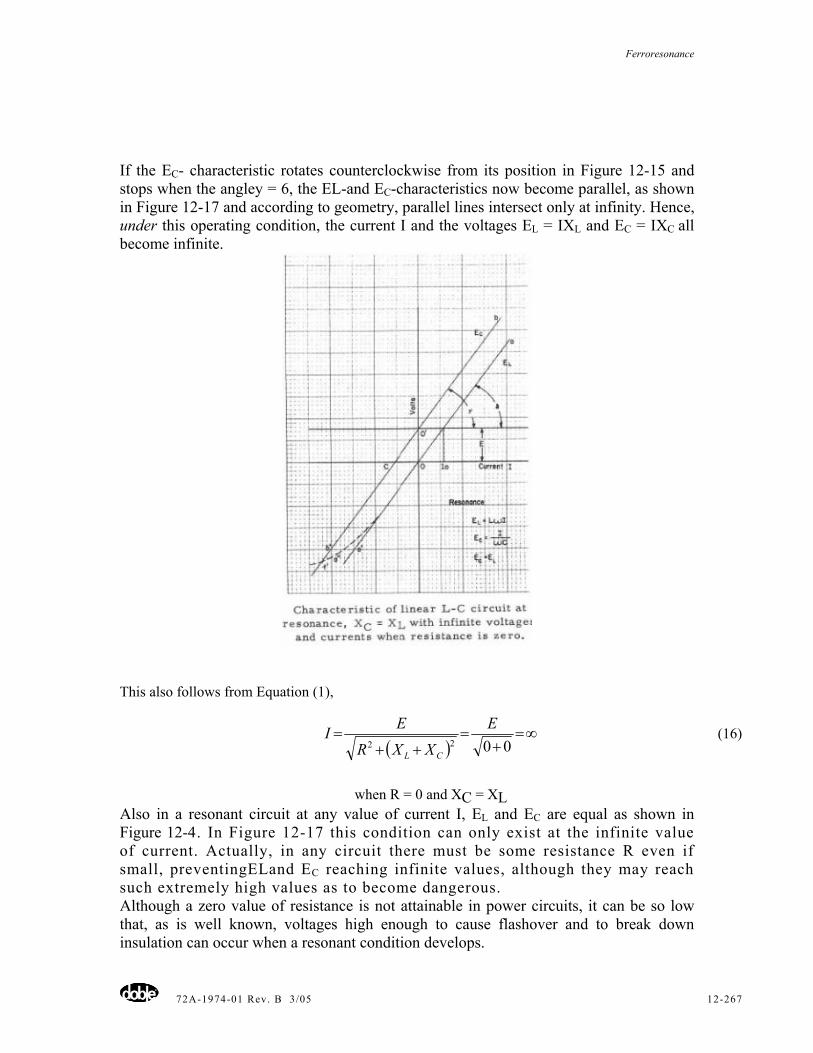
Ferroresonance
72A-1974-01 Rev. B 3/05 12-267
If the EC- characteristic rotates counterclockwise from its position in Figure 12-15 and stops when the angley = 6, the EL-and EC-characteristics now become parallel, as shown in Figure 12-17 and according to geometry, parallel lines intersect only at infinity. Hence, under this operating condition, the current I and the voltages EL = IXL and EC = IXC all become infinite.
This also follows from Equation (1),
( )
∞=+
=++
=0022
E
XXR
EICL
(16)
when R = 0 and XC = XL Also in a resonant circuit at any value of current I, EL and EC are equal as shown in Figure 12-4. In Figure 12-17 this condition can only exist at the infinite value of current. Actually, in any circuit there must be some resistance R even if small, preventingELand EC reaching infinite values, although they may reach such extremely high values as to become dangerous. Although a zero value of resistance is not attainable in power circuits, it can be so low that, as is well known, voltages high enough to cause flashover and to break down insulation can occur when a resonant condition develops.
Ferroresonance
72A-1974-01 Rev. B 3/05 12-268
Fortunately, with ferroresonance, although abnormally high values of EL and EC can develop as is shown by Figures 10 to 14, they cannot even approach the infinite values cited for the linear circuits since their magnitudes are determined by the intersection of the Ec- characteristic with the EL- characteristic, and as may be seen in the foregoing figures, such voltages are limited by the saturation of the reactor core as shown by the EL- characteristic. This is illustrated in Figure 12-17 in which the EL- characteristic, rather than being linear, is indicated as becoming saturated by the dotted line a'' in the third quadrant. The EC- characteristic can then intersect the EL- characteristic at point f' which then becomes an operating point at a finite voltage. This same saturation, however, accounts for the overheating of transformers at no load or light load. Beyond the knee of the magnetization characteristic, the terminal voltage can be raised substantially either by ferroresonance or by other causes, such as generator over voltages. Beyond the knee, the magnetization characteristic becomes almost flat. Then, any substantial increase in voltage, which may be caused by Ferro resonance or generator over voltage, can produce tremendous values of magnetizing current, sufficient to cause the overheating which has accompanied ferroresonance, as well as noisy operation.
12.1.7 Ferroresonance and Power-System Connections Ferroresonance usually does not occur in a power system operating under normal operating conditions. As has already been shown, it is created in an especially tuned circuit resulting from the interaction of inductance and capacitance. The inductance is usually the primary of a transformer, or a shunt reactor; the reactance of each varies widely with the magnitude of the current and with a steady current it varies widely during each half-cycle. The capacitance is that of the transmission conductors usually to ground, which may be overhead lines or cables or the two in combination. For a given length of line the capacitance of cables is much greater than that of overhead lines so that cables are much more conducive to ferroresonance. Ferroresonance requires an initiating surge such as a severe disturbance that could be caused by the closing or opening of a switch or a circuit breaker, the non-simultaneous closing or opening of the contacts of a switch or of a circuit breaker, the blowing of afuse, or the breaking of a line conductor. Closing or opening the contacts of a line-dis-connecting switch one at a time is a usual cause of ferroresonance. Another common cause occurs when transformers are energized on the point of the voltage wave at which the initial current is in opposition to the residual flux in the core. As is well known, this produces a large transient inrush of magnetizing current. Ferroresonance may occur as a short-time transient or it may be continous, depending on circuit conditions. The chance of its occurring increases with the voltage and also with the capacitance. Since distribution systems usually involve large amounts of cable, ferroresonance is more likely to occur in them rather than in overhead transmission systems.
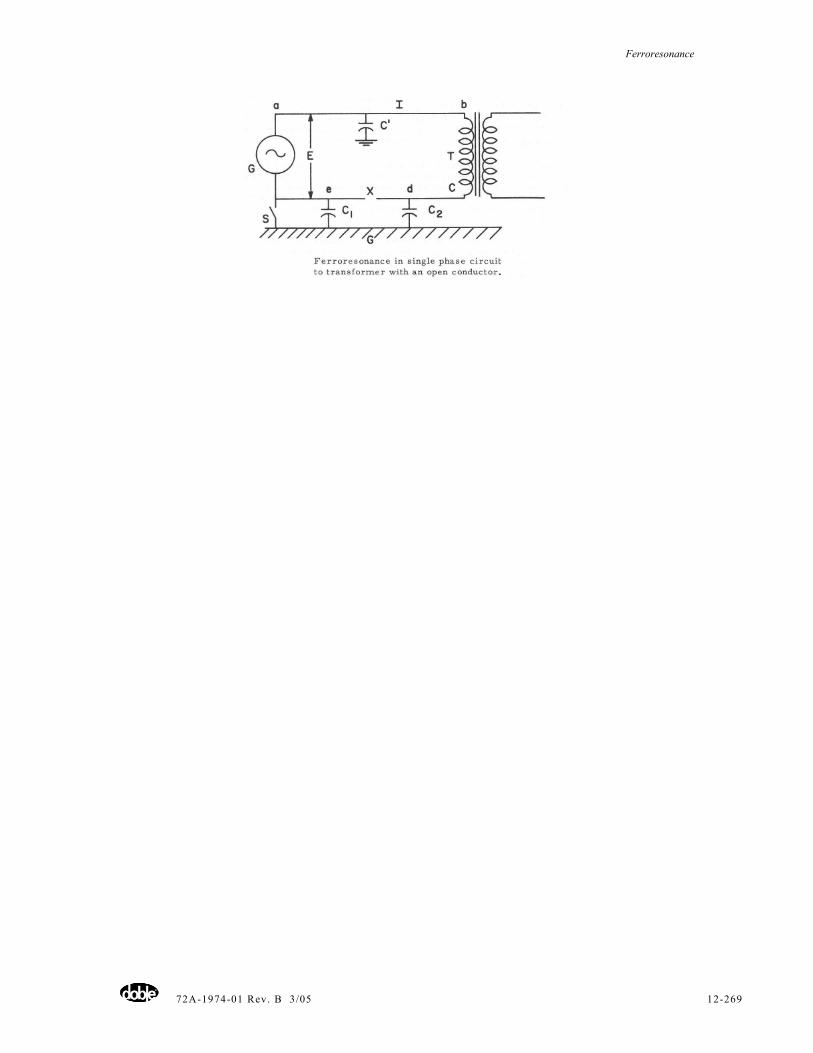
Ferroresonance
72A-1974-01 Rev. B 3/05 12-269
Ferroresonance
72A-1974-01 Rev. B 3/05 12-270
12.1.8 Ferroresonant Circuits in Power Systems Figure 12-18 illustrates the effect in a single-phase system of a transmission conductor becoming open as by breaking or by the opening of a switch or a fuse. The generator G supplies power at voltage E through a single-phase transmission line to the primary of transformer T having a reactance XL ohms. The upper conductor has a capacitance of C' farads to ground and the lower conductor is open at point X. The two sections of the lower conductor have respective capacitances of C1 and C2 farads to ground. There is a grounding switch S at the lower generator terminal. First consider the condition when the switch S is open. The path of the magnetizing current from the generator is a-b through the primary to C to d, through C2 to ground G, through Cl to e and then to the lower terminal of the generator. Thus the inductive reactance of the transformer primary and the capacitive reactances Cl and C2 are all in series, a circuit similar to that of Figure 12-9, thus providing a condition for ferroresonance. The current to ground through capacitance C' returns to the generator through capacitance Cl, and has no effect on the ferroresonant circuit. With the grounding switch S closed, the magnetizing current when it reaches point C goes to ground through C2 and returns to the generator through switch S.This again provides a ferroresonant condition as before, except that the series capacitive reactance is now that of capacitor C2 alone rather than that of C1 and C2 in series. Also the current to ground through C' returns directly back to the generator through switch S and so does not affect the ferroresonant circuit. Since the capacitances G1 and C2 (as well as C' are proportional to their respective length of the transmission line, the ferroresonant effects depend on the length of line as well as on the inductive reactance of the transformer primary. In low and medium voltage systems potential transformers are commonly connected to the bus bars or other power sources by a disconnecting switch (usually operated with a pole) and it has frequently been noticed that at times an unusually high voltage appears at the open terminal of the transformer or at the switch during the closing or the opening of one of its poles. This is a ferroresonant effect resulting from the disturbance created either by the sudden rush of magnetizing current or its sudden interruption. In Figure 12-19 is shown a diagram of a potential transformer connected to a voltage source of E volts, by two disconnecting switchblades, the left-hand one being closed and the right-hand one open. There is capacitance Cl between the transformer lead and ground at the right-hand bushing and a capacitance C2 in parallel between the winding and ground. The capacitive circuit is completed by the capacitance C' between the lower line conductor and ground, this capacitance being much greater than Cl and C2.It is common practice to connect or disconnect a potential transformer by opening or closing the switch blades one at a time. The current flowing to the transformer through the one closed switch blade encounters the inductance of the winding which, in effect is in sereies with parallel capacitances C1 and C2 to ground the inductive – capacity circuit is completed back to the lower line by the capacitance C1 to ground.
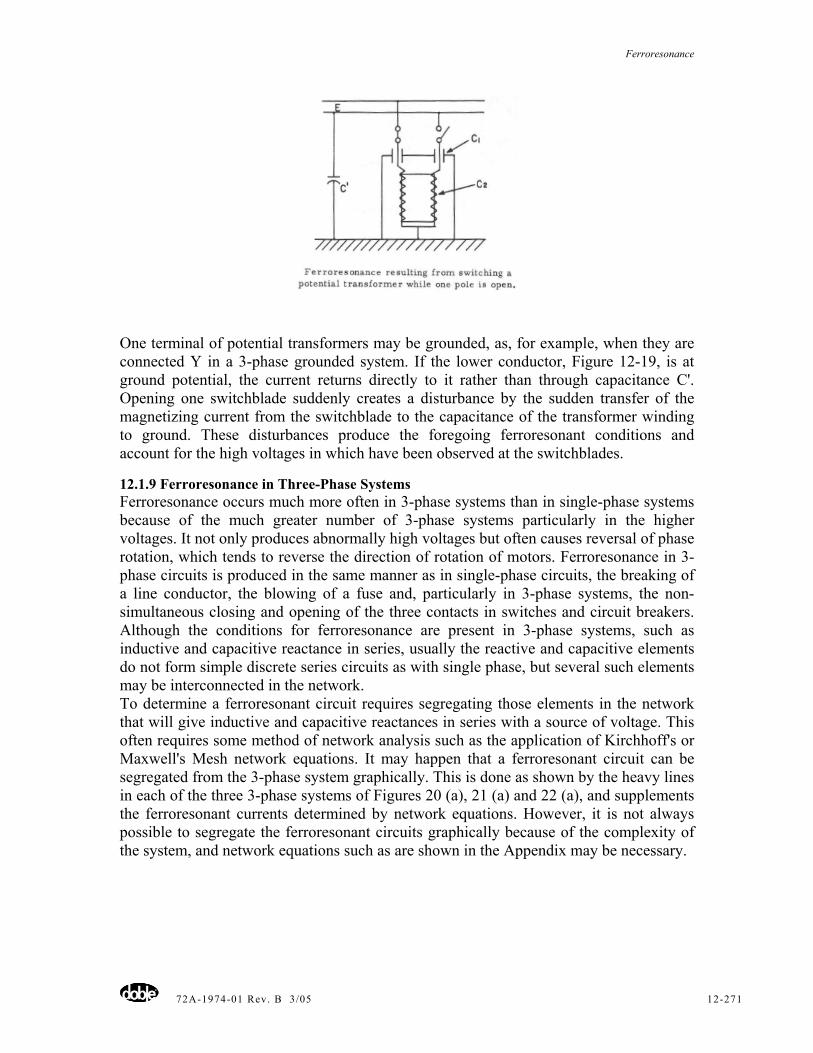
Ferroresonance
72A-1974-01 Rev. B 3/05 12-271
One terminal of potential transformers may be grounded, as, for example, when they are connected Y in a 3-phase grounded system. If the lower conductor, Figure 12-19, is at ground potential, the current returns directly to it rather than through capacitance C'. Opening one switchblade suddenly creates a disturbance by the sudden transfer of the magnetizing current from the switchblade to the capacitance of the transformer winding to ground. These disturbances produce the foregoing ferroresonant conditions and account for the high voltages in which have been observed at the switchblades.
12.1.9 Ferroresonance in Three-Phase Systems Ferroresonance occurs much more often in 3-phase systems than in single-phase systems because of the much greater number of 3-phase systems particularly in the higher voltages. It not only produces abnormally high voltages but often causes reversal of phase rotation, which tends to reverse the direction of rotation of motors. Ferroresonance in 3-phase circuits is produced in the same manner as in single-phase circuits, the breaking of a line conductor, the blowing of a fuse and, particularly in 3-phase systems, the non-simultaneous closing and opening of the three contacts in switches and circuit breakers. Although the conditions for ferroresonance are present in 3-phase systems, such as inductive and capacitive reactance in series, usually the reactive and capacitive elements do not form simple discrete series circuits as with single phase, but several such elements may be interconnected in the network. To determine a ferroresonant circuit requires segregating those elements in the network that will give inductive and capacitive reactances in series with a source of voltage. This often requires some method of network analysis such as the application of Kirchhoff's or Maxwell's Mesh network equations. It may happen that a ferroresonant circuit can be segregated from the 3-phase system graphically. This is done as shown by the heavy lines in each of the three 3-phase systems of Figures 20 (a), 21 (a) and 22 (a), and supplements the ferroresonant currents determined by network equations. However, it is not always possible to segregate the ferroresonant circuits graphically because of the complexity of the system, and network equations such as are shown in the Appendix may be necessary.
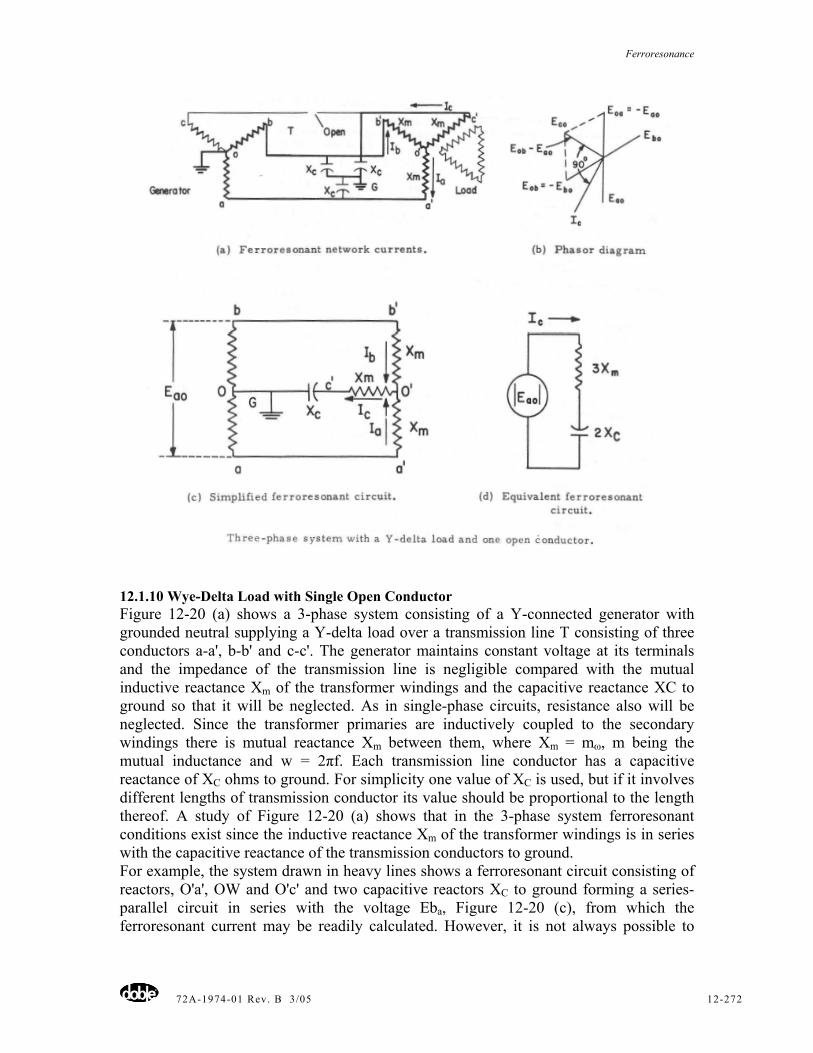
Ferroresonance
72A-1974-01 Rev. B 3/05 12-272
12.1.10 Wye-Delta Load with Single Open Conductor Figure 12-20 (a) shows a 3-phase system consisting of a Y-connected generator with grounded neutral supplying a Y-delta load over a transmission line T consisting of three conductors a-a', b-b' and c-c'. The generator maintains constant voltage at its terminals and the impedance of the transmission line is negligible compared with the mutual inductive reactance Xm of the transformer windings and the capacitive reactance XC to ground so that it will be neglected. As in single-phase circuits, resistance also will be neglected. Since the transformer primaries are inductively coupled to the secondary windings there is mutual reactance Xm between them, where Xm = mω, m being the mutual inductance and w = 2πf. Each transmission line conductor has a capacitive reactance of XC ohms to ground. For simplicity one value of XC is used, but if it involves different lengths of transmission conductor its value should be proportional to the length thereof. A study of Figure 12-20 (a) shows that in the 3-phase system ferroresonant conditions exist since the inductive reactance Xm of the transformer windings is in series with the capacitive reactance of the transmission conductors to ground. For example, the system drawn in heavy lines shows a ferroresonant circuit consisting of reactors, O'a', OW and O'c' and two capacitive reactors XC to ground forming a series-parallel circuit in series with the voltage Eba, Figure 12-20 (c), from which the ferroresonant current may be readily calculated. However, it is not always possible to
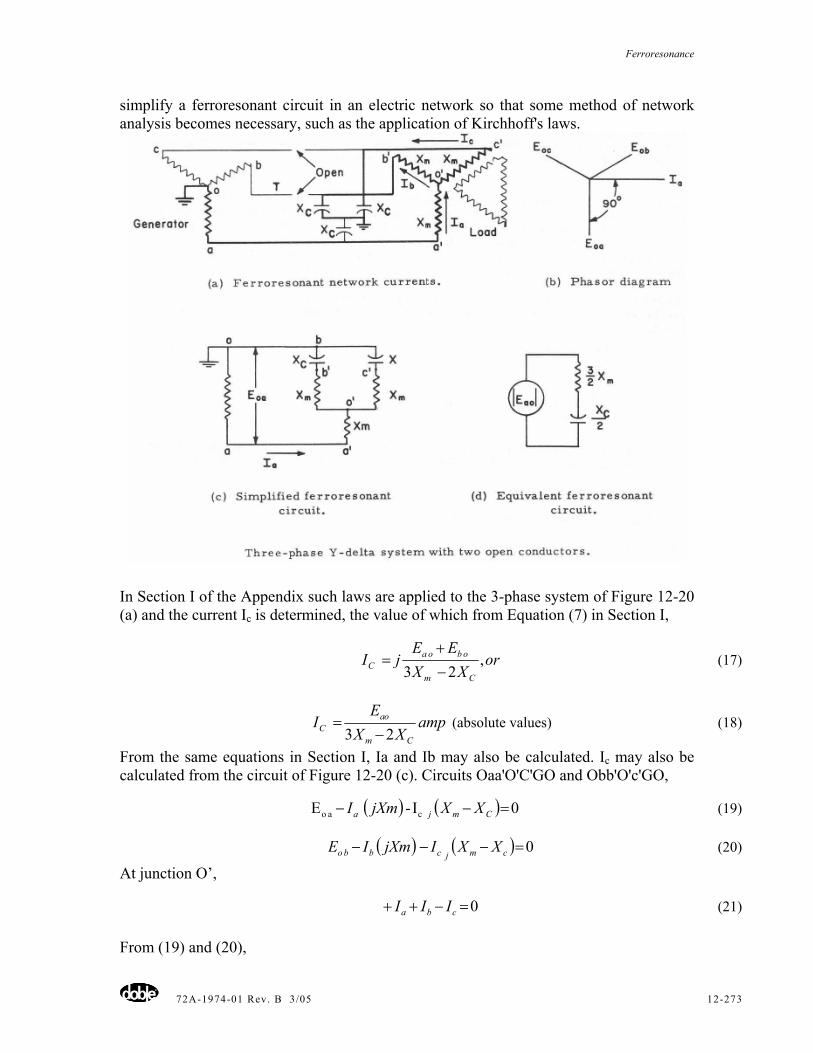
Ferroresonance
72A-1974-01 Rev. B 3/05 12-273
simplify a ferroresonant circuit in an electric network so that some method of network analysis becomes necessary, such as the application of Kirchhoff's laws.
In Section I of the Appendix such laws are applied to the 3-phase system of Figure 12-20 (a) and the current Ic is determined, the value of which from Equation (7) in Section I,
orXX
EEjI
Cm
oboaC ,
23 −+
= (17)
ampXX
EI
Cm
oaC 23 −
= (absolute values) (18)
From the same equations in Section I, Ia and Ib may also be calculated. Ic may also be calculated from the circuit of Figure 12-20 (c). Circuits Oaa'O'C'GO and Obb'O'c'GO,
( ) ( ) 0I- E ca o =−− Cmja XXjXmI (19)
( ) ( ) 0=−−− cmjcbbo XXIjXmIE (20)
At junction O’,
0=−++ cba III (21) From (19) and (20),
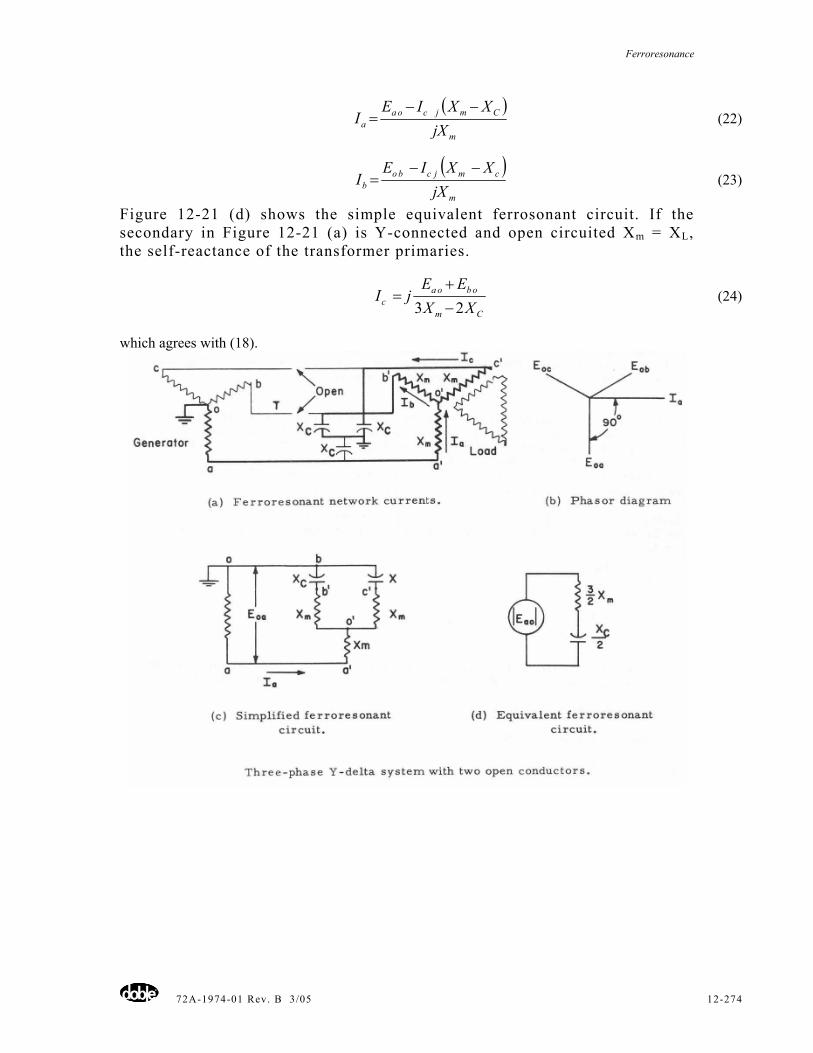
Ferroresonance
72A-1974-01 Rev. B 3/05 12-274
( )
m
Cmjcoaa jX
XXIEI
−−= (22)
( )
m
cmjcbob jX
XXIEI
−−= (23)
Figure 12-21 (d) shows the simple equivalent ferrosonant circuit. If the secondary in Figure 12-21 (a) is Y-connected and open circuited Xm = XL, the self-reactance of the transformer primaries.
Cm
oboac XX
EEjI
23 −+
= (24)
which agrees with (18).
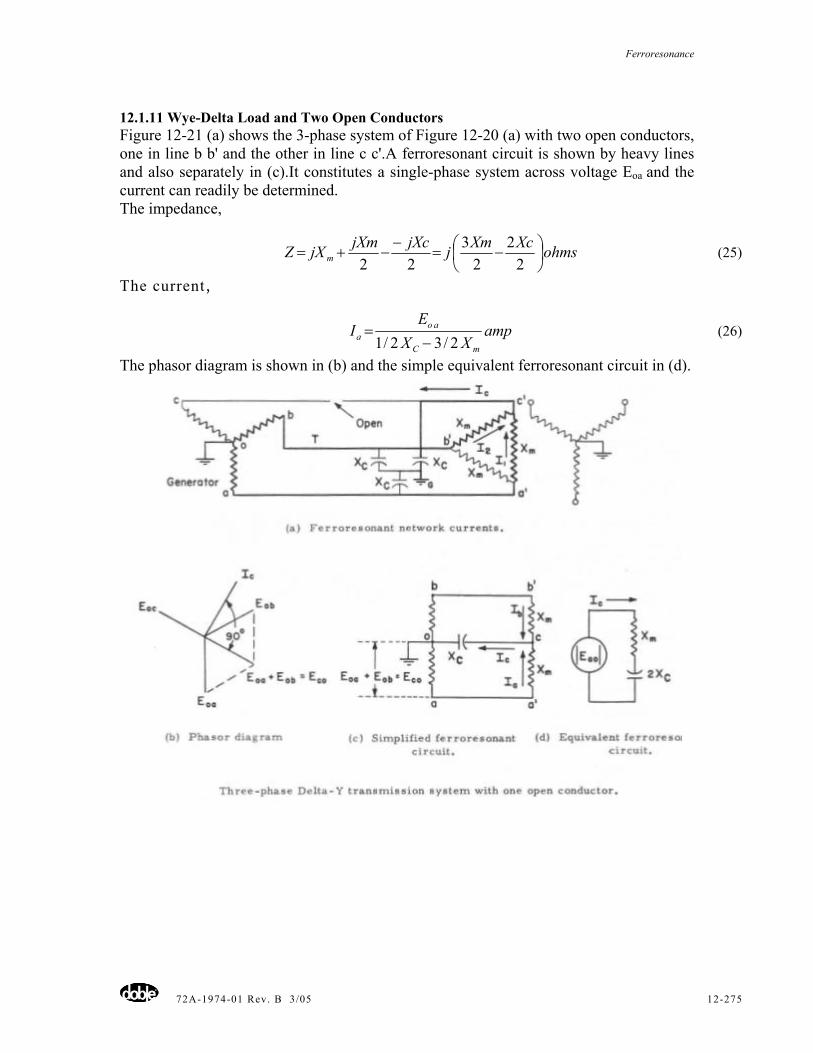
Ferroresonance
72A-1974-01 Rev. B 3/05 12-275
12.1.11 Wye-Delta Load and Two Open Conductors Figure 12-21 (a) shows the 3-phase system of Figure 12-20 (a) with two open conductors, one in line b b' and the other in line c c'.A ferroresonant circuit is shown by heavy lines and also separately in (c).It constitutes a single-phase system across voltage Eoa and the current can readily be determined. The impedance,
ohmsXcXmjjXcjXmjXZ m ⎟⎠⎞
⎜⎝⎛ −=
−−+=
22
23
22 (25)
The current,
ampXX
EI
mC
aoa 2/32/1 −
= (26)
The phasor diagram is shown in (b) and the simple equivalent ferroresonant circuit in (d).
Ferroresonance
72A-1974-01 Rev. B 3/05 12-276
12.1.12 Delta-Wye Load with One Open Conductor Figure 12-22 (a) shows the 3-phase system of Figure 12-20 (a) with one open conductor cc' with a delta-Y load. The ferroresonant system is shown in heavy lines, and separately in (c). The ferroresonant current Ic is derived by network equations in Appendix III and is given by Equation (8),
ampXX
EIor
XXEE
jImC
ocC
mC
booac −
=−+
=22
(absolute value) (27)
Ic may also be derived from Figure 12-22 (c). Circuits oaa'co, and obb'co,
( ) ( ) 0=−−− CCmaoa jXIjXIE (28)
( ) ( ) 0=−−− CCmbba jXIjXIE (29)
At junction c,
0=−++ cba III (30) Determining Ia from (28) and Ib from (29) and substituting in (30), Ic as given in (27) is obtained. Currents Ia and Ib may also be calculated from equations (28) and (29) and those in Appendix III.
12.1.13 Ferroresonance in Power Systems Basically ferroresonance occurs in power systems when the primaries of transformers, usually inadvertently, become connected in series with the capacitance to ground of the connecting transmission - line conductors, producing a resonant condition. Oscillographic records of ferroresonant oscillations obtained on analogue systems show a very irregular current wave containing several higher harmonics, rather than a smooth sine wave. (This is due to the variation of inductance L with current (Figure 12-5), the resonant frequency fo = 1/2 π√LC (Equation 3)) the variation of ''L" with the current accounts for the several harmonics.
12.1.14 Methods to Prevent or to Minimize Ferroresonance. 1. Ground load transformers when possible. 2. Avoid single-pole closing of disconnects - use gang-operated ones. 3. Prevent non-simultaneous opening and closing of circuit-breaker contacts. 4. Employ relaying responses to broken conductors. 5. Prompt detection of blown fuses, as, for example, those with potential transformers. 6. Detection of ferroresonance by sustained excessive noise or overheating at light load
of potential and power transformers. 7. A resistance load of from 5 to 10 percent may damp but usually will not completely
suppress ferroresonance.
Ferroresonance
72A-1974-01 Rev. B 3/05 12-277
12.1.15 Overvoltages and Oscillations There are but limited quantitative data or recordings of disturbances and oscillations occurring in power systems, caused by ferroresonance. This is understandable since such disturbances are often short-time transients, which occur at random at unexpected times and at locations in which are not known in advance. Hence, it is usually impracticable to install instrumentation especially to record such phenomena. The writer did learn, however, of recordings of overvoltages being made in a substation of a western utility following the blow-up of a transformer in one of their main stations which was followed by the opening of a tie- line. The chart at the substation showed that the voltage on the 230-kV bus went up to approximately 266 kV for a period of from 10 to 12 minutes with a swing from 214.2 to 268, 3 kV. During this same period the voltage on the 115-kV bus went to 130 kV. The voltage on the 230-kV bus thus increased 16 percent and that on the 115-kV bus 15 percent. The sustained overvoltages following a shock to the system caused by the transformer blow-up and the opening of the tie line is characteristic of the effects known to be associated with ferroresonance. A comprehensive investigation of ferroresonance on power systems is usually im-practicable. It would be difficult to isolate any significant part of such a system and its components for any considerable length of time just for experimentation and to simulate the conditions in which produce ferroresonance. Accordingly, ferroresonant investigations are commonly conducted on models simulating the parameters of the actual power system such as system analogues, transient network analyzers (TNA) (GE), electronic differential analizers (EDA), the ANACOM (Westinghouse) and similar apparatus. Even under these conditions the following quotation is pertinent: "It should be realized that the possibilities of ferroresonance in a circuit cannot be produced with great accuracy because of non-sinusoidal waves and widely variable reactance with current." Descriptions and the results of many such investigations may be found in the several References, Pages 6-928 and 6-929. Ferroresonant voltages are commonly shown as functions of the ratio of the capacitive reactance to ground XC to the inductive reactance XL, or Xm of the transformer winding.
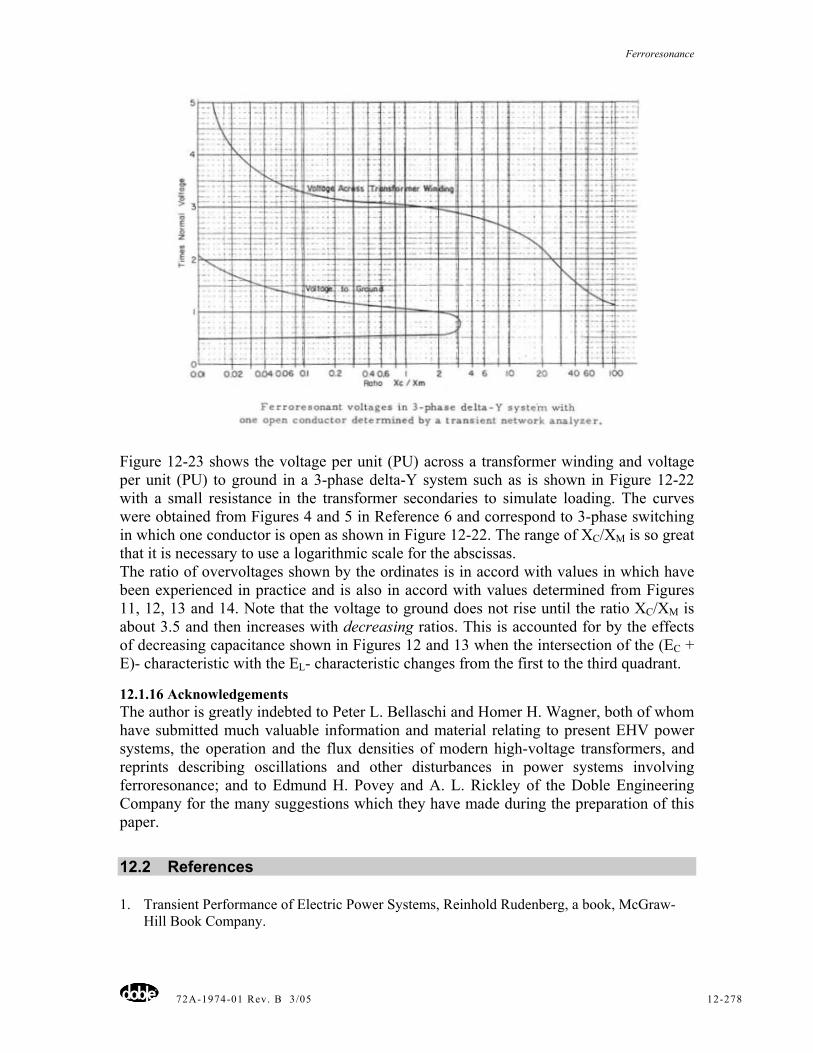
Ferroresonance
72A-1974-01 Rev. B 3/05 12-278
Figure 12-23 shows the voltage per unit (PU) across a transformer winding and voltage per unit (PU) to ground in a 3-phase delta-Y system such as is shown in Figure 12-22 with a small resistance in the transformer secondaries to simulate loading. The curves were obtained from Figures 4 and 5 in Reference 6 and correspond to 3-phase switching in which one conductor is open as shown in Figure 12-22. The range of XC/XM is so great that it is necessary to use a logarithmic scale for the abscissas. The ratio of overvoltages shown by the ordinates is in accord with values in which have been experienced in practice and is also in accord with values determined from Figures 11, 12, 13 and 14. Note that the voltage to ground does not rise until the ratio XC/XM is about 3.5 and then increases with decreasing ratios. This is accounted for by the effects of decreasing capacitance shown in Figures 12 and 13 when the intersection of the (EC + E)- characteristic with the EL- characteristic changes from the first to the third quadrant.
12.1.16 Acknowledgements The author is greatly indebted to Peter L. Bellaschi and Homer H. Wagner, both of whom have submitted much valuable information and material relating to present EHV power systems, the operation and the flux densities of modern high-voltage transformers, and reprints describing oscillations and other disturbances in power systems involving ferroresonance; and to Edmund H. Povey and A. L. Rickley of the Doble Engineering Company for the many suggestions which they have made during the preparation of this paper.
12.2 References
1. Transient Performance of Electric Power Systems, Reinhold Rudenberg, a book, McGraw-Hill Book Company.
Ferroresonance
72A-1974-01 Rev. B 3/05 12-279
2. Critical Conditions in Ferroresonance, P. H. Odessey and Ernst Weber, Trans. AIEE, 1938 (Vol. 17), Page 444.
3. Abnormal Voltage Conditions in Three-Phase Systems, Edith Clarke, H. A. Peterson, P. H. Light, Trans. AIEE, 1941 (Vol. 60), Page 329.
4. ''Abnormal Voltage Conditions Produced by Open Conductors on 3-Phase Circuits Using Shunt Capacitors," P. E. Hendrickson, I. B. Johnson, N. R. Schultz, Trans. IEEE, 1953 (Vol. 72), Page 1183.
5. "Ferroresonance during Single-Phase Switching of Three-Phase Distribution Banks," R. H. Hopkinson, Trans. IEEE, 1965 (Vol. 84), Page 289.
6. "Ferroresonance Over voltage Control Based on TNA (Transient Network Analyzer) Tests on Three-Phase Delta-Wye Transformer Banks," Ralph H. Hopkinson, Trans. IEEE, 1967 (Vol. 86), Page 1258.
7. Failure of a Transformer from Overexcitation, M. D. Coughlin, (Northern States Power Company), Minutes of the Thirty-fifth Annual International Conference of Doble Clients, i?67, Page 6-501.
8. Overexcitation of a Large Generator Transformer, A. H. Locke (Oklahoma Gas and Electric Company): Minutes of the Thirty-sixth Annual International Conference of Doble Clients, 1968, Page 6-501.
9. Discussion of the A. H. Locke Paper, P. L. Bellaschi, loco cit, Page 6-501A.
10. "Dynamic Overvoltages in the Victorian 500-kV Transmission Network," D. C. Smitb and I. P.Bates, March 1968, Page 147, Electrical Engineering Trans. Institute of Electrical Engineers, Australia.
11. Analyzing and Understanding Ferroresonance on Distribution Systems, A. L. Kilgour, J. H. Harlow, and A. G. Phadke, Transmission and Distribution, June 1968.
12. Overvoltages on the AEP 765-kV System, Arthur Hauspurg, Gregory S. Vassell, Gerald 1. Stillman, Joel H. Charkow, and Jorn C. Haahr, Trans. IEEE, 1969 (Vol. 88), Page 1329.
13. Dynamic Overvoltages and Ferroresonance Found in Switching Surge Studies for Iran 400-kV System, A. Clerici and C. H. Didriksen, Jr., Paper No. 142-PWR, Presented at the IEEE Winter Meeting, 1971.
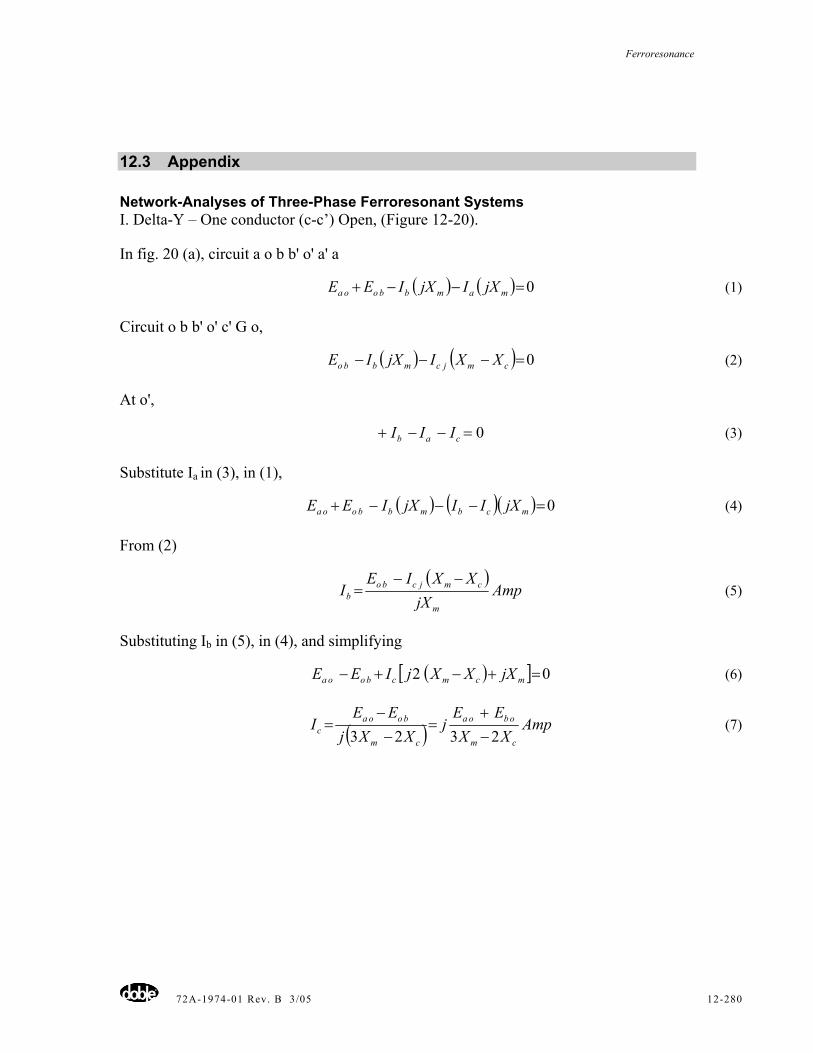
Ferroresonance
72A-1974-01 Rev. B 3/05 12-280
12.3 Appendix
Network-Analyses of Three-Phase Ferroresonant Systems I. Delta-Y – One conductor (c-c’) Open, (Figure 12-20).
In fig. 20 (a), circuit a o b b' o' a' a
( ) ( ) 0=−−+ mambbooa jXIjXIEE (1)
Circuit o b b' o' c' G o,
( ) ( ) 0=−−− cmjcmbbo XXIjXIE (2)
At o',
0=−−+ cab III (3)
Substitute Ia in (3), in (1),
( ) ( )( ) 0=−−−+ mcbmbbooa jXIIjXIEE (4)
From (2)
( )
AmpjX
XXIEI
m
cmjcbob
−−= (5)
Substituting Ib in (5), in (4), and simplifying
( )[ ] 02 =+−+− mcmcbooa jXXXjIEE (6)
( ) AmpXX
EEj
XXjEE
Icm
oboa
cm
booac 2323 −
+=
−−
= (7)
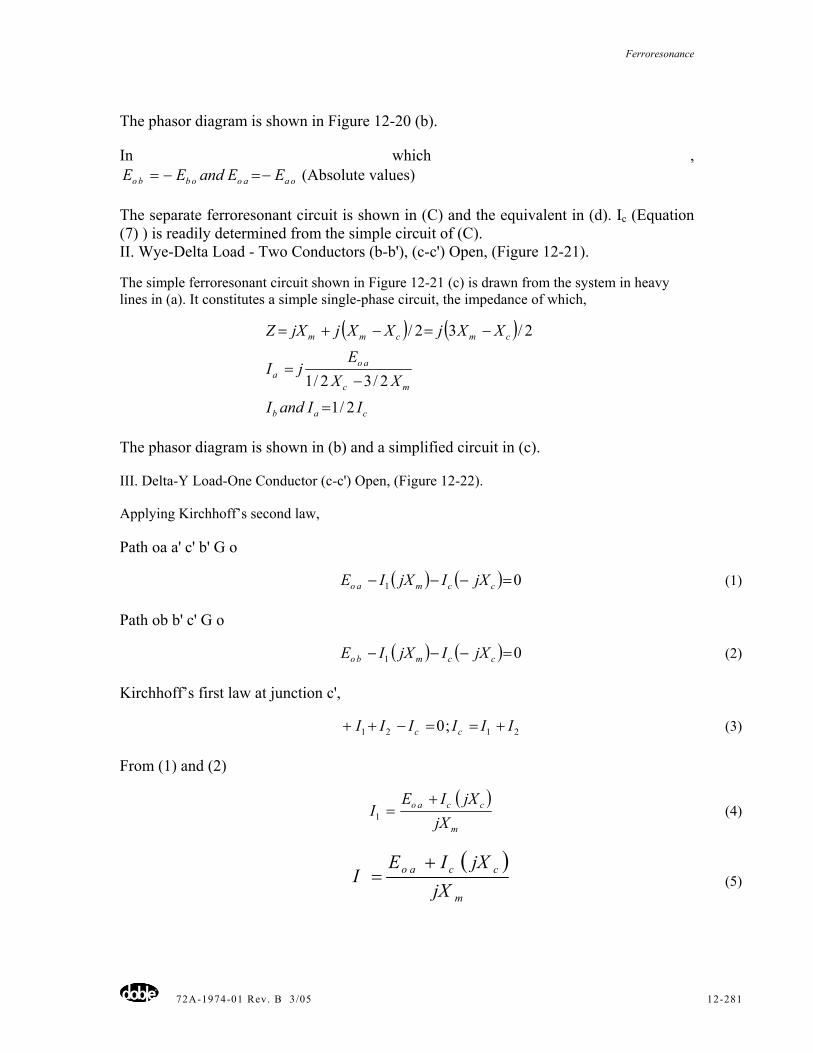
Ferroresonance
72A-1974-01 Rev. B 3/05 12-281
The phasor diagram is shown in Figure 12-20 (b).
In which , oaaoobbo EEandEE −=−= (Absolute values)
The separate ferroresonant circuit is shown in (C) and the equivalent in (d). Ic (Equation (7) ) is readily determined from the simple circuit of (C). II. Wye-Delta Load - Two Conductors (b-b'), (c-c') Open, (Figure 12-21).
The simple ferroresonant circuit shown in Figure 12-21 (c) is drawn from the system in heavy lines in (a). It constitutes a simple single-phase circuit, the impedance of which,
( ) ( )
cab
mc
aoa
cmcmm
IIandI
XXE
jI
XXjXXjjXZ
2/1
2/32/1
2/32/
=
−=
−=−+=
The phasor diagram is shown in (b) and a simplified circuit in (c).
III. Delta-Y Load-One Conductor (c-c') Open, (Figure 12-22).
Applying Kirchhoff’s second law,
Path oa a' c' b' G o
( ) ( ) 01 =−−− ccmao jXIjXIE (1)
Path ob b' c' G o
( ) ( ) 01 =−−− ccmbo jXIjXIE (2)
Kirchhoff’s first law at junction c',
2121 ;0 IIIIII cc +==−++ (3)
From (1) and (2)
( )
m
ccao
jXjXIE
I+
=1 (4)
( )
m
ccao
jXjXIE
I+
= (5)
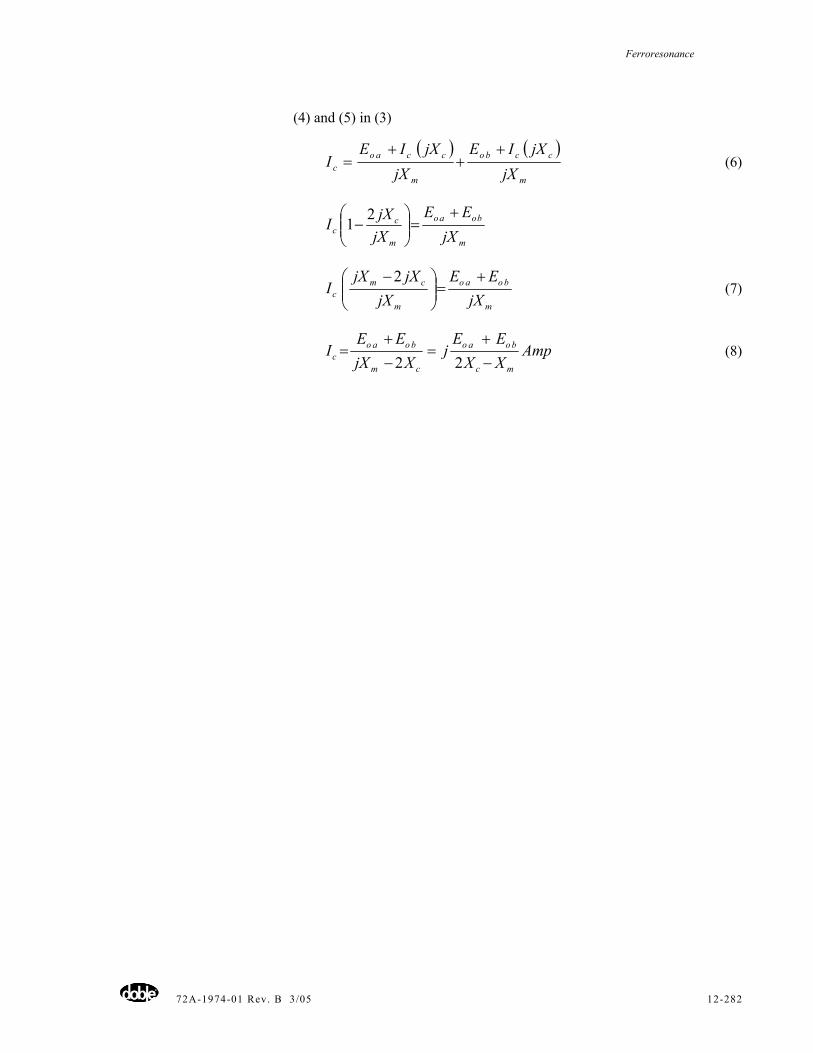
Ferroresonance
72A-1974-01 Rev. B 3/05 12-282
(4) and (5) in (3)
( ) ( )
m
ccbo
m
ccaoc jX
jXIEjX
jXIEI
++
+= (6)
m
boao
m
cc jX
EEjXjXI
+=⎟⎟
⎠
⎞⎜⎜⎝
⎛−
21
m
boao
m
cmc jX
EEjX
jXjXI
+=⎟⎟
⎠
⎞⎜⎜⎝
⎛ −2 (7)
AmpXXEE
jXjX
EEI
mc
boao
cm
boaoc −
+=
−+
=22
(8)
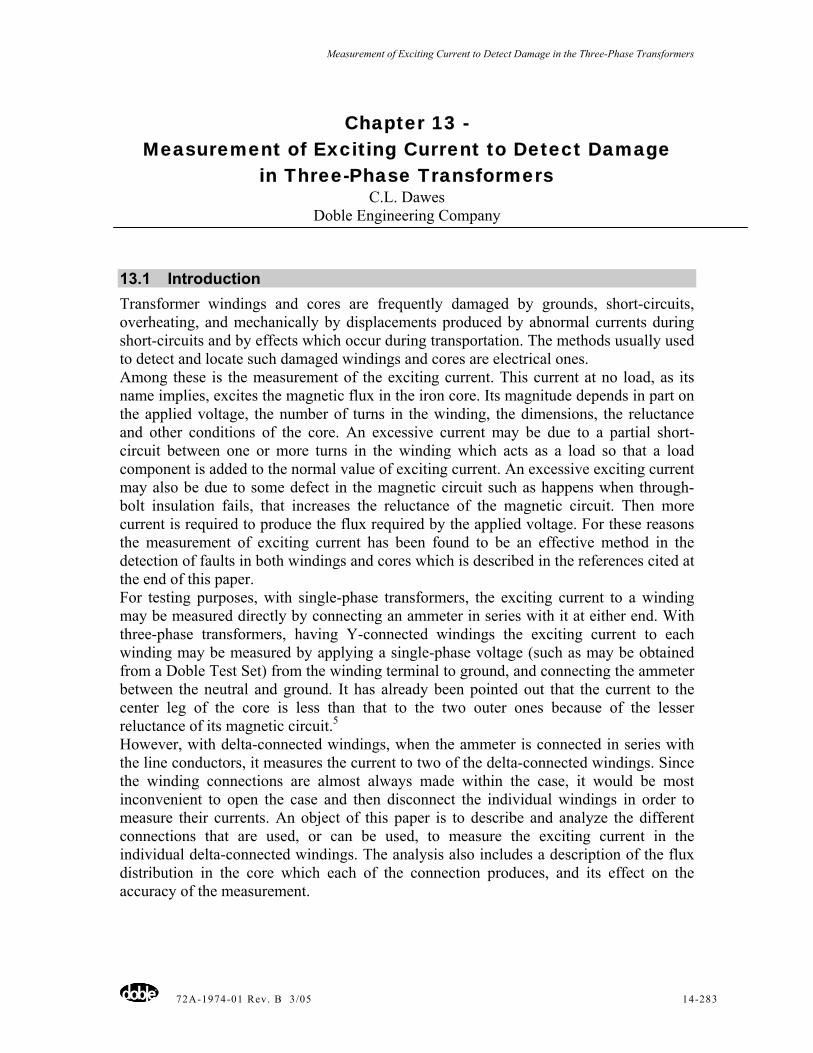
Measurement of Exciting Current to Detect Damage in the Three-Phase Transformers
72A-1974-01 Rev. B 3/05 14-283
Chapter 13 - Measurement of Exciting Current to Detect Damage
in Three-Phase Transformers C.L. Dawes
Doble Engineering Company
13.1 Introduction Transformer windings and cores are frequently damaged by grounds, short-circuits, overheating, and mechanically by displacements produced by abnormal currents during short-circuits and by effects which occur during transportation. The methods usually used to detect and locate such damaged windings and cores are electrical ones. Among these is the measurement of the exciting current. This current at no load, as its name implies, excites the magnetic flux in the iron core. Its magnitude depends in part on the applied voltage, the number of turns in the winding, the dimensions, the reluctance and other conditions of the core. An excessive current may be due to a partial short-circuit between one or more turns in the winding which acts as a load so that a load component is added to the normal value of exciting current. An excessive exciting current may also be due to some defect in the magnetic circuit such as happens when through-bolt insulation fails, that increases the reluctance of the magnetic circuit. Then more current is required to produce the flux required by the applied voltage. For these reasons the measurement of exciting current has been found to be an effective method in the detection of faults in both windings and cores which is described in the references cited at the end of this paper. For testing purposes, with single-phase transformers, the exciting current to a winding may be measured directly by connecting an ammeter in series with it at either end. With three-phase transformers, having Y-connected windings the exciting current to each winding may be measured by applying a single-phase voltage (such as may be obtained from a Doble Test Set) from the winding terminal to ground, and connecting the ammeter between the neutral and ground. It has already been pointed out that the current to the center leg of the core is less than that to the two outer ones because of the lesser reluctance of its magnetic circuit.5
However, with delta-connected windings, when the ammeter is connected in series with the line conductors, it measures the current to two of the delta-connected windings. Since the winding connections are almost always made within the case, it would be most inconvenient to open the case and then disconnect the individual windings in order to measure their currents. An object of this paper is to describe and analyze the different connections that are used, or can be used, to measure the exciting current in the individual delta-connected windings. The analysis also includes a description of the flux distribution in the core which each of the connection produces, and its effect on the accuracy of the measurement.
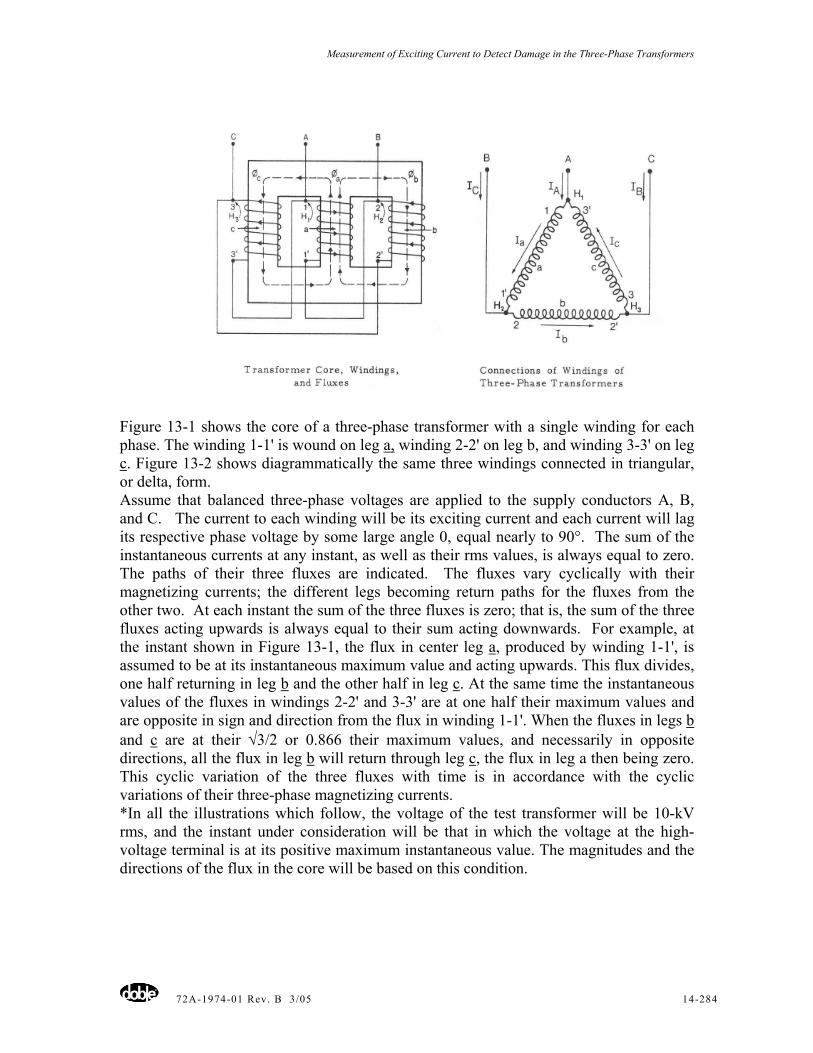
Measurement of Exciting Current to Detect Damage in the Three-Phase Transformers
72A-1974-01 Rev. B 3/05 14-284
Figure 13-1 shows the core of a three-phase transformer with a single winding for each phase. The winding 1-1' is wound on leg a, winding 2-2' on leg b, and winding 3-3' on leg c. Figure 13-2 shows diagrammatically the same three windings connected in triangular, or delta, form. Assume that balanced three-phase voltages are applied to the supply conductors A, B, and C. The current to each winding will be its exciting current and each current will lag its respective phase voltage by some large angle 0, equal nearly to 90°. The sum of the instantaneous currents at any instant, as well as their rms values, is always equal to zero. The paths of their three fluxes are indicated. The fluxes vary cyclically with their magnetizing currents; the different legs becoming return paths for the fluxes from the other two. At each instant the sum of the three fluxes is zero; that is, the sum of the three fluxes acting upwards is always equal to their sum acting downwards. For example, at the instant shown in Figure 13-1, the flux in center leg a, produced by winding 1-1', is assumed to be at its instantaneous maximum value and acting upwards. This flux divides, one half returning in leg b and the other half in leg c. At the same time the instantaneous values of the fluxes in windings 2-2' and 3-3' are at one half their maximum values and are opposite in sign and direction from the flux in winding 1-1'. When the fluxes in legs b and c are at their √3/2 or 0.866 their maximum values, and necessarily in opposite directions, all the flux in leg b will return through leg c, the flux in leg a then being zero. This cyclic variation of the three fluxes with time is in accordance with the cyclic variations of their three-phase magnetizing currents. *In all the illustrations which follow, the voltage of the test transformer will be 10-kV rms, and the instant under consideration will be that in which the voltage at the high-voltage terminal is at its positive maximum instantaneous value. The magnitudes and the directions of the flux in the core will be based on this condition.
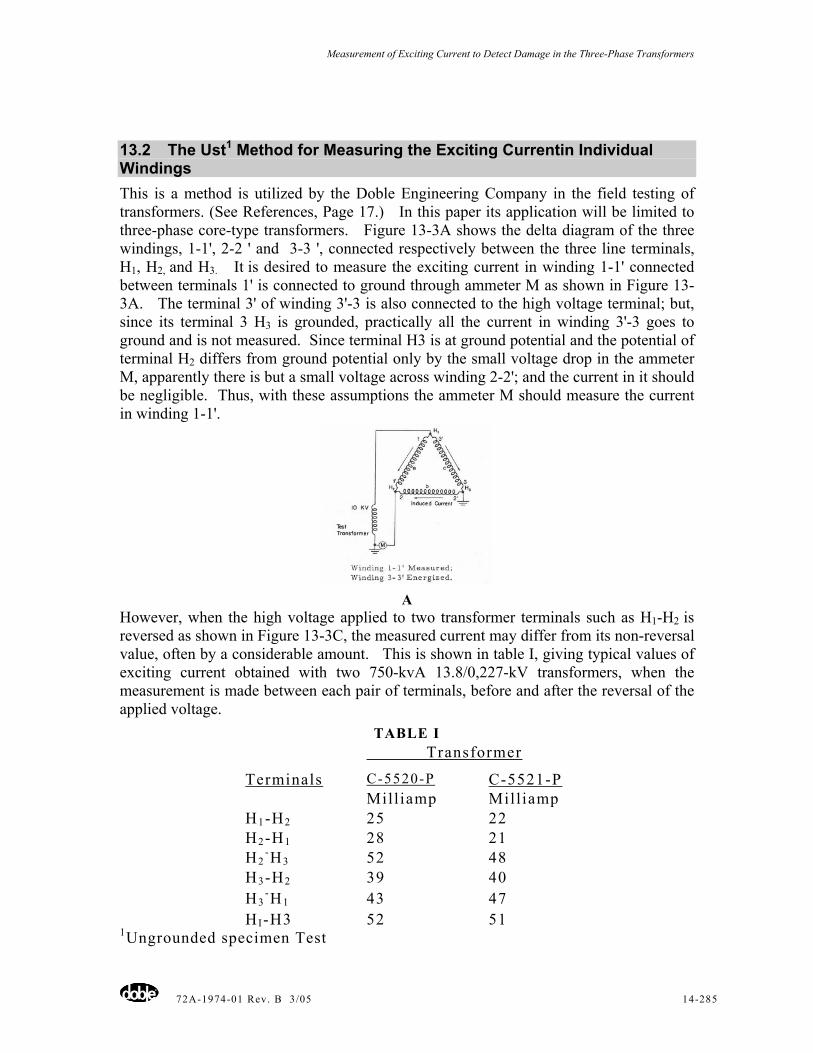
Measurement of Exciting Current to Detect Damage in the Three-Phase Transformers
72A-1974-01 Rev. B 3/05 14-285
13.2 The Ust1 Method for Measuring the Exciting Currentin Individual Windings This is a method is utilized by the Doble Engineering Company in the field testing of transformers. (See References, Page 17.) In this paper its application will be limited to three-phase core-type transformers. Figure 13-3A shows the delta diagram of the three windings, 1-1', 2-2 ' and 3-3 ', connected respectively between the three line terminals, H1, H2, and H3. It is desired to measure the exciting current in winding 1-1' connected between terminals 1' is connected to ground through ammeter M as shown in Figure 13-3A. The terminal 3' of winding 3'-3 is also connected to the high voltage terminal; but, since its terminal 3 H3 is grounded, practically all the current in winding 3'-3 goes to ground and is not measured. Since terminal H3 is at ground potential and the potential of terminal H2 differs from ground potential only by the small voltage drop in the ammeter M, apparently there is but a small voltage across winding 2-2'; and the current in it should be negligible. Thus, with these assumptions the ammeter M should measure the current in winding 1-1'.
A
However, when the high voltage applied to two transformer terminals such as H1-H2 is reversed as shown in Figure 13-3C, the measured current may differ from its non-reversal value, often by a considerable amount. This is shown in table I, giving typical values of exciting current obtained with two 750-kvA 13.8/0,227-kV transformers, when the measurement is made between each pair of terminals, before and after the reversal of the applied voltage.
TABLE I Transformer
Terminals C-5520-P C-5521-P Mill iamp Mill iampH1-H2 25 22 H2-H1 28 21 H2
-H3 52 48 H3-H2 39 40 H3
-H1 43 47 HI-H3 52 51
1Ungrounded specimen Test
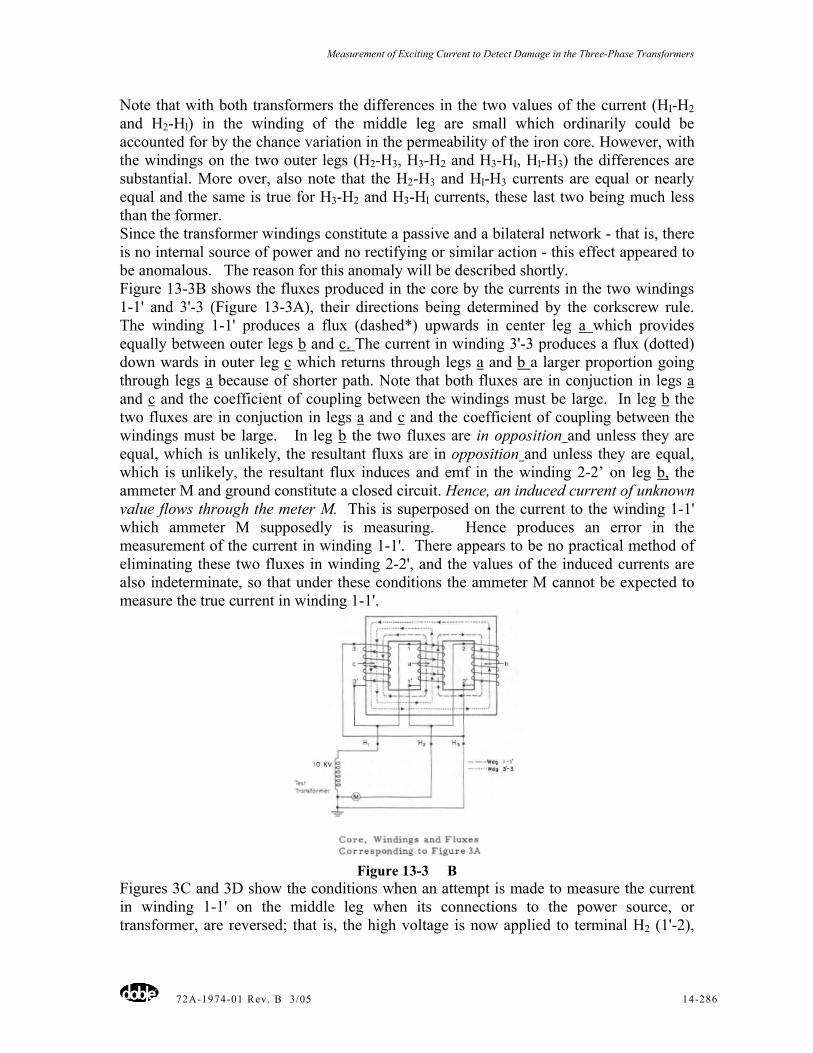
Measurement of Exciting Current to Detect Damage in the Three-Phase Transformers
72A-1974-01 Rev. B 3/05 14-286
Note that with both transformers the differences in the two values of the current (HI-H2 and H2-Hl) in the winding of the middle leg are small which ordinarily could be accounted for by the chance variation in the permeability of the iron core. However, with the windings on the two outer legs (H2-H3, H3-H2 and H3-HI, Hl-H3) the differences are substantial. More over, also note that the H2-H3 and Hl-H3 currents are equal or nearly equal and the same is true for H3-H2 and H3-Hl currents, these last two being much less than the former. Since the transformer windings constitute a passive and a bilateral network - that is, there is no internal source of power and no rectifying or similar action - this effect appeared to be anomalous. The reason for this anomaly will be described shortly. Figure 13-3B shows the fluxes produced in the core by the currents in the two windings 1-1' and 3'-3 (Figure 13-3A), their directions being determined by the corkscrew rule. The winding 1-1' produces a flux (dashed*) upwards in center leg a which provides equally between outer legs b and c. The current in winding 3'-3 produces a flux (dotted) down wards in outer leg c which returns through legs a and b a larger proportion going through legs a because of shorter path. Note that both fluxes are in conjuction in legs a and c and the coefficient of coupling between the windings must be large. In leg b the two fluxes are in conjuction in legs a and c and the coefficient of coupling between the windings must be large. In leg b the two fluxes are in opposition and unless they are equal, which is unlikely, the resultant fluxs are in opposition and unless they are equal, which is unlikely, the resultant flux induces and emf in the winding 2-2’ on leg b, the ammeter M and ground constitute a closed circuit. Hence, an induced current of unknown value flows through the meter M. This is superposed on the current to the winding 1-1' which ammeter M supposedly is measuring. Hence produces an error in the measurement of the current in winding 1-1'. There appears to be no practical method of eliminating these two fluxes in winding 2-2', and the values of the induced currents are also indeterminate, so that under these conditions the ammeter M cannot be expected to measure the true current in winding 1-1'.
Figure 13-3 B
Figures 3C and 3D show the conditions when an attempt is made to measure the current in winding 1-1' on the middle leg when its connections to the power source, or transformer, are reversed; that is, the high voltage is now applied to terminal H2 (1'-2),
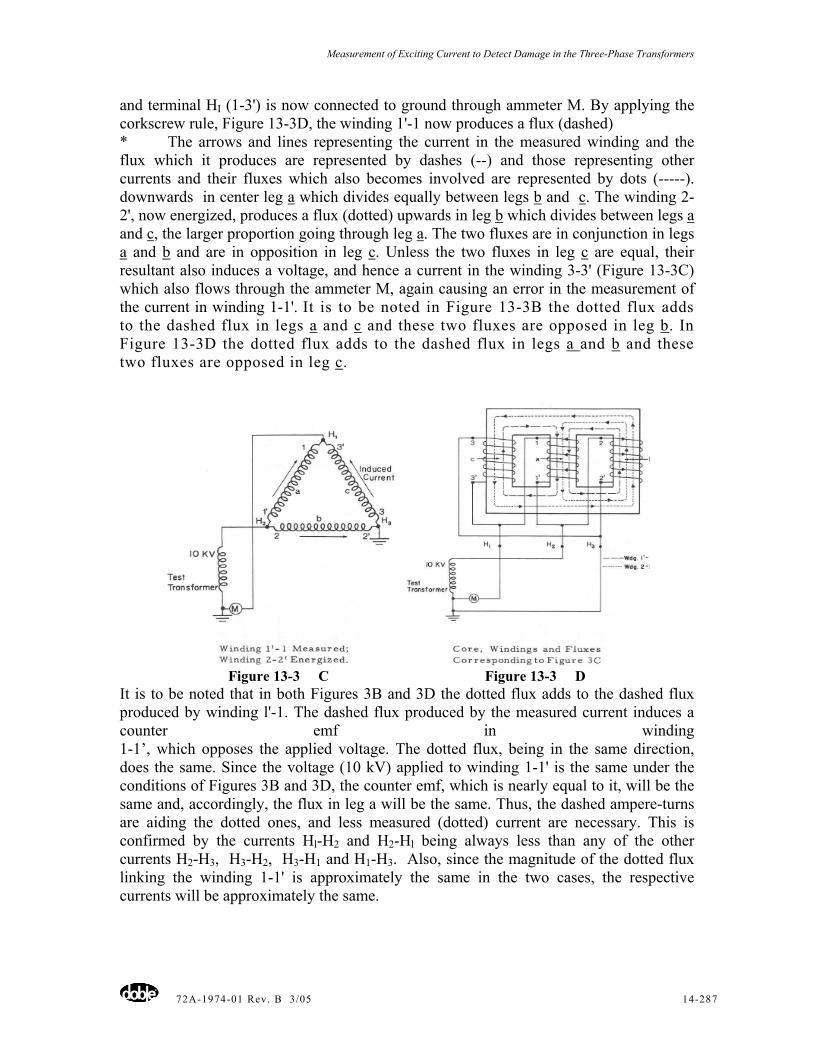
Measurement of Exciting Current to Detect Damage in the Three-Phase Transformers
72A-1974-01 Rev. B 3/05 14-287
and terminal HI (1-3') is now connected to ground through ammeter M. By applying the corkscrew rule, Figure 13-3D, the winding 1'-1 now produces a flux (dashed) * The arrows and lines representing the current in the measured winding and the flux which it produces are represented by dashes (--) and those representing other currents and their fluxes which also becomes involved are represented by dots (-----). downwards in center leg a which divides equally between legs b and c. The winding 2-2', now energized, produces a flux (dotted) upwards in leg b which divides between legs a and c, the larger proportion going through leg a. The two fluxes are in conjunction in legs a and b and are in opposition in leg c. Unless the two fluxes in leg c are equal, their resultant also induces a voltage, and hence a current in the winding 3-3' (Figure 13-3C) which also flows through the ammeter M, again causing an error in the measurement of the current in winding 1-1'. It is to be noted in Figure 13-3B the dotted flux adds to the dashed flux in legs a and c and these two fluxes are opposed in leg b. In Figure 13-3D the dotted flux adds to the dashed flux in legs a and b and these two fluxes are opposed in leg c.
Figure 13-3 C Figure 13-3 D
It is to be noted that in both Figures 3B and 3D the dotted flux adds to the dashed flux produced by winding l'-1. The dashed flux produced by the measured current induces a counter emf in winding 1-1’, which opposes the applied voltage. The dotted flux, being in the same direction, does the same. Since the voltage (10 kV) applied to winding 1-1' is the same under the conditions of Figures 3B and 3D, the counter emf, which is nearly equal to it, will be the same and, accordingly, the flux in leg a will be the same. Thus, the dashed ampere-turns are aiding the dotted ones, and less measured (dotted) current are necessary. This is confirmed by the currents Hl-H2 and H2-Hl being always less than any of the other currents H2-H3, H3-H2, H3-H1 and H1-H3. Also, since the magnitude of the dotted flux linking the winding 1-1' is approximately the same in the two cases, the respective currents will be approximately the same.
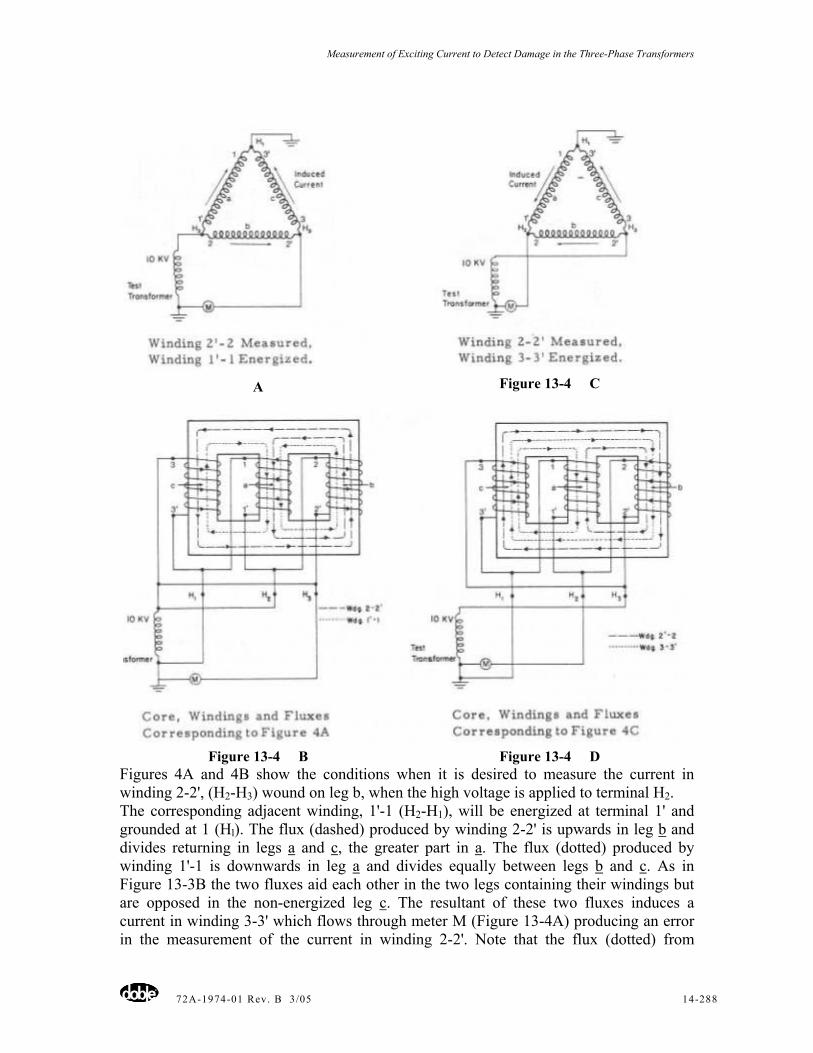
Measurement of Exciting Current to Detect Damage in the Three-Phase Transformers
72A-1974-01 Rev. B 3/05 14-288
A Figure 13-4 C
Figure 13-4 B Figure 13-4 D Figures 4A and 4B show the conditions when it is desired to measure the current in winding 2-2', (H2-H3) wound on leg b, when the high voltage is applied to terminal H2. The corresponding adjacent winding, 1'-1 (H2-H1), will be energized at terminal 1' and grounded at 1 (Hl). The flux (dashed) produced by winding 2-2' is upwards in leg b and divides returning in legs a and c, the greater part in a. The flux (dotted) produced by winding 1'-1 is downwards in leg a and divides equally between legs b and c. As in Figure 13-3B the two fluxes aid each other in the two legs containing their windings but are opposed in the non-energized leg c. The resultant of these two fluxes induces a current in winding 3-3' which flows through meter M (Figure 13-4A) producing an error in the measurement of the current in winding 2-2'. Note that the flux (dotted) from
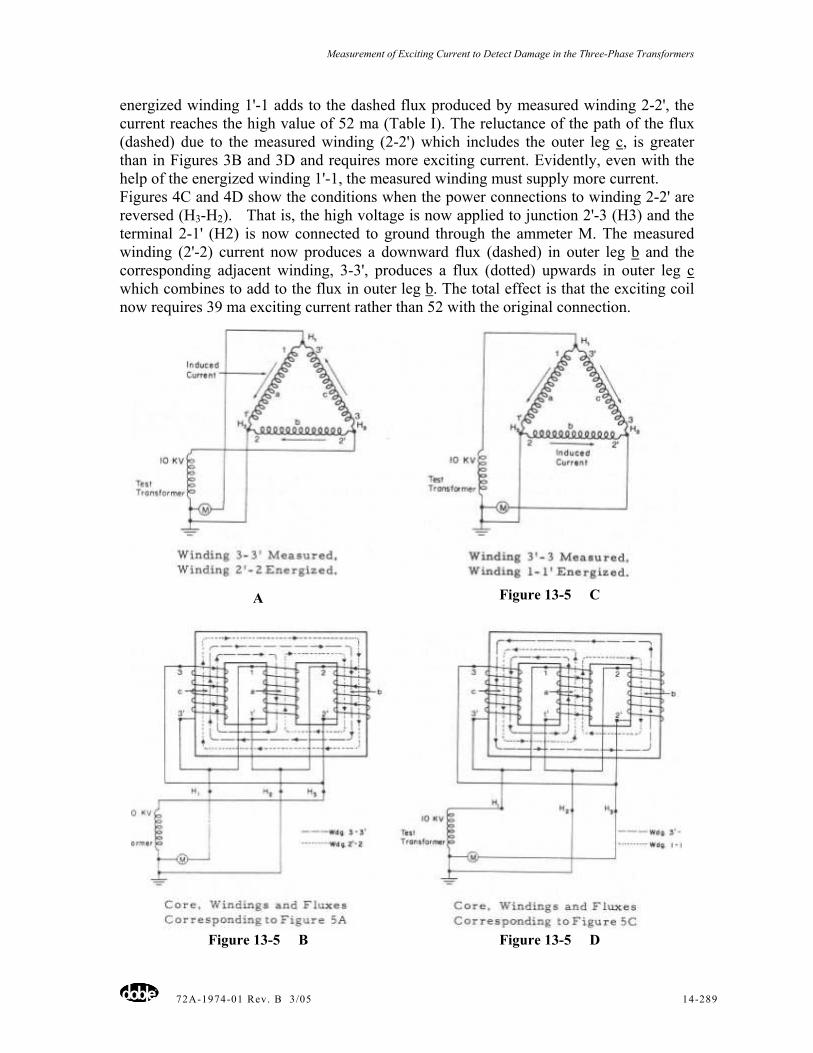
Measurement of Exciting Current to Detect Damage in the Three-Phase Transformers
72A-1974-01 Rev. B 3/05 14-289
energized winding 1'-1 adds to the dashed flux produced by measured winding 2-2', the current reaches the high value of 52 ma (Table I). The reluctance of the path of the flux (dashed) due to the measured winding (2-2') which includes the outer leg c, is greater than in Figures 3B and 3D and requires more exciting current. Evidently, even with the help of the energized winding 1'-1, the measured winding must supply more current. Figures 4C and 4D show the conditions when the power connections to winding 2-2' are reversed (H3-H2). That is, the high voltage is now applied to junction 2'-3 (H3) and the terminal 2-1' (H2) is now connected to ground through the ammeter M. The measured winding (2'-2) current now produces a downward flux (dashed) in outer leg b and the corresponding adjacent winding, 3-3', produces a flux (dotted) upwards in outer leg c which combines to add to the flux in outer leg b. The total effect is that the exciting coil now requires 39 ma exciting current rather than 52 with the original connection.
A Figure 13-5 C
Figure 13-5 B Figure 13-5 D
Measurement of Exciting Current to Detect Damage in the Three-Phase Transformers
72A-1974-01 Rev. B 3/05 14-290
The resultant flux in leg a, induces a voltage in winding 1-1' (Figure 13-4C), which produces a current in ammeter M causing error. Figures 5A, 5B, 5C, and 5D show the conditions corresponding to the measurement of the current in the winding 3-3' (H3-HI), first with the terminal 3 at the high voltage and then with the reversal of the applied voltage, terminal 3' (HI) now being at the high voltage. Referring to Figure 13-5A, the adjacent winding 2'-2 is also energized, its current going to ground at terminal H2. In Figure 13-5B the flux (dashed) produced by winding 3-3' in leg c is upwards returning through legs a and b, the former being the shorter path. The adjacent energized winding 2'-2 produces a flux (dotted) downwards in leg b, returning through legs a and c, the path with the former being the shorter. The two opposed return fluxes in leg a induce a current in winding 1-1' which flows to ground through the ammeter M (Figure 13-5A) and produces an error in its reading of the current in winding 3-3'. The current corresponding to the foregoing condition (HI-H3) is 43 ma as shown in Table I. Figures 5C and 5D show the conditions when the connections to winding 3-3' are re-versed, terminal 3' (Hl) now being at the high voltage. The winding produces a flux (dashed) in leg c downwards which returns through legs a and b. The energized adjacent winding 1-1' produces a flux (dotted) upwards in leg a, dividing equally to return through legs b and c. This flux acts in conjunction in leg c with the flux produced by winding 3'-3, and in opposition in leg b. The resultant flux in leg b induces a current in winding 2-2' which flows through ammeter M (Figure 13-5C) to produce an error in the measurement of the current in winding 3-3'. Thus, with the connections shown in Figures 3A to 5D, the general pattern of cur-rents and fluxes is the same. That is, the flux produced by the measured winding and that produced by the adjacent energized winding are in conjunction on their two core legs and are in opposition on the third leg on which the non-energized winding is wound. The resultant of these last two fluxes induces a current in the third non-energized winding which is superposed on the current being measured by ammeter M, accounting for the variation in current with reversal of the connections to the high-voltage source. The cause of this error was not understood until the analysis involving the flux produced by each winding and their paths in the transformer core became known. With this knowledge there appears to be no simple method of eliminating it. The foregoing analysis has been applied quantitatively to Transformer C-5520-P (Table I), but is also applicable to Transformer C-5521-P with different values of exciting current, the proportionate relation of the currents being nearly the same. It is to be noted that the exciting current to the center leg a is always very much less than to the two outer legs and, further, it changes very little with reversals. The differences in the exciting currents in the two outer legs (b and c) are very large. Further, current HZ-H3 is equal to current HI-H3 and H3-H2 is nearly equal to H3-HI (for Transformer C-5520-P). These relations are nearly the same for Trans-former C-5521-P. From the foregoing analyses, it is apparent that the values of current depend on the interrelations of the fluxes, which link the three windings.
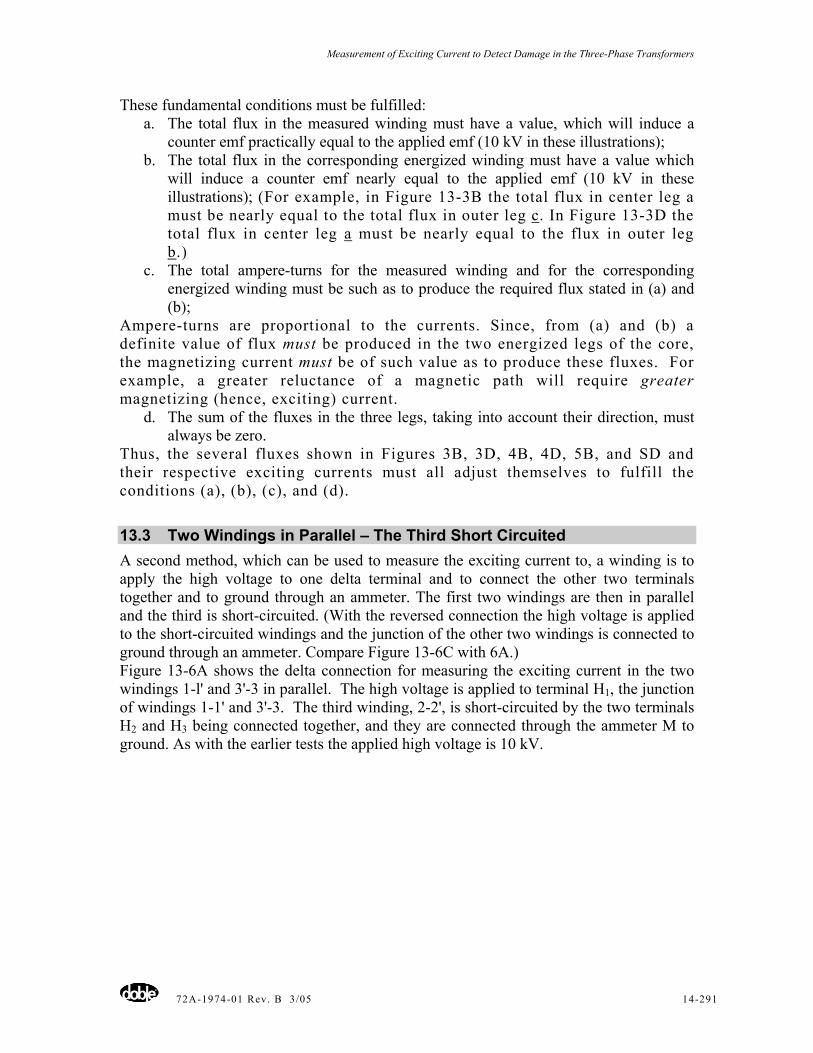
Measurement of Exciting Current to Detect Damage in the Three-Phase Transformers
72A-1974-01 Rev. B 3/05 14-291
These fundamental conditions must be fulfilled: a. The total flux in the measured winding must have a value, which will induce a
counter emf practically equal to the applied emf (10 kV in these illustrations); b. The total flux in the corresponding energized winding must have a value which
will induce a counter emf nearly equal to the applied emf (10 kV in these illustrations); (For example, in Figure 13-3B the total flux in center leg a must be nearly equal to the total flux in outer leg c. In Figure 13-3D the total flux in center leg a must be nearly equal to the flux in outer leg b.)
c. The total ampere-turns for the measured winding and for the corresponding energized winding must be such as to produce the required flux stated in (a) and (b);
Ampere-turns are proportional to the currents. Since, from (a) and (b) a definite value of flux must be produced in the two energized legs of the core, the magnetizing current must be of such value as to produce these fluxes. For example, a greater reluctance of a magnetic path will require greater magnetizing (hence, exciting) current.
d. The sum of the fluxes in the three legs, taking into account their direction, must always be zero.
Thus, the several fluxes shown in Figures 3B, 3D, 4B, 4D, 5B, and SD and their respective exciting currents must all adjust themselves to fulfill the conditions (a), (b), (c), and (d).
13.3 Two Windings in Parallel – The Third Short Circuited A second method, which can be used to measure the exciting current to, a winding is to apply the high voltage to one delta terminal and to connect the other two terminals together and to ground through an ammeter. The first two windings are then in parallel and the third is short-circuited. (With the reversed connection the high voltage is applied to the short-circuited windings and the junction of the other two windings is connected to ground through an ammeter. Compare Figure 13-6C with 6A.) Figure 13-6A shows the delta connection for measuring the exciting current in the two windings 1-l' and 3'-3 in parallel. The high voltage is applied to terminal H1, the junction of windings 1-1' and 3'-3. The third winding, 2-2', is short-circuited by the two terminals H2 and H3 being connected together, and they are connected through the ammeter M to ground. As with the earlier tests the applied high voltage is 10 kV.
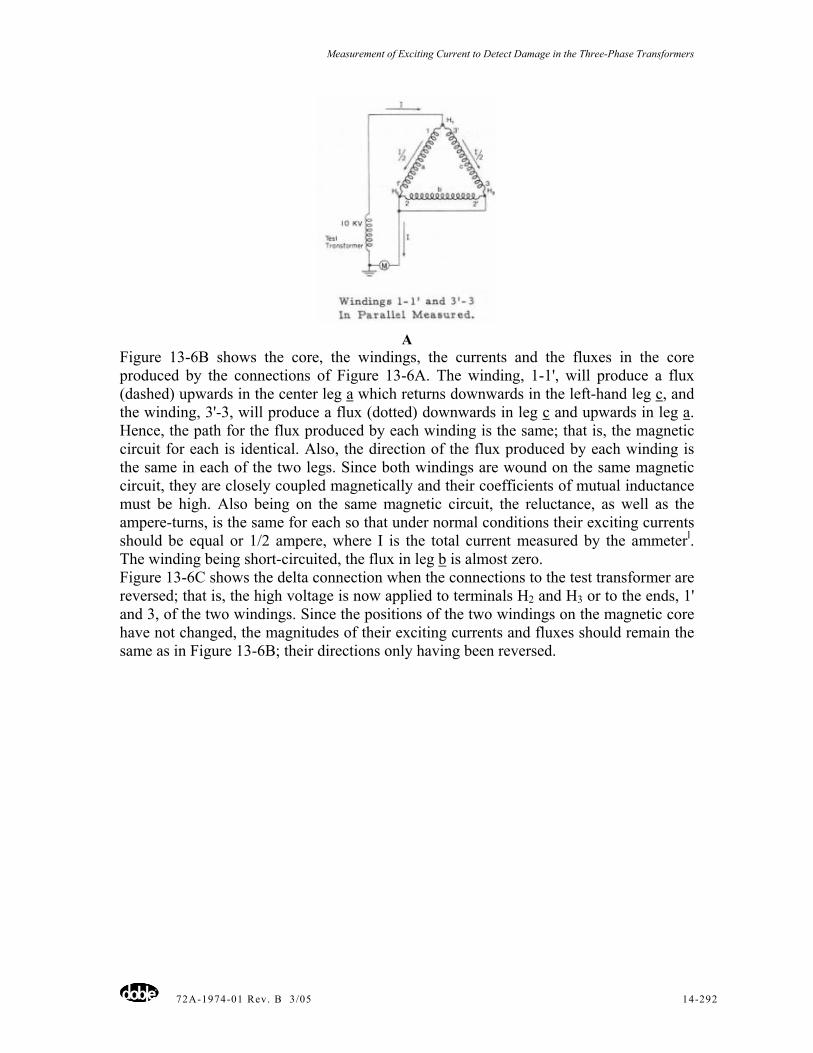
Measurement of Exciting Current to Detect Damage in the Three-Phase Transformers
72A-1974-01 Rev. B 3/05 14-292
A
Figure 13-6B shows the core, the windings, the currents and the fluxes in the core produced by the connections of Figure 13-6A. The winding, 1-1', will produce a flux (dashed) upwards in the center leg a which returns downwards in the left-hand leg c, and the winding, 3'-3, will produce a flux (dotted) downwards in leg c and upwards in leg a. Hence, the path for the flux produced by each winding is the same; that is, the magnetic circuit for each is identical. Also, the direction of the flux produced by each winding is the same in each of the two legs. Since both windings are wound on the same magnetic circuit, they are closely coupled magnetically and their coefficients of mutual inductance must be high. Also being on the same magnetic circuit, the reluctance, as well as the ampere-turns, is the same for each so that under normal conditions their exciting currents should be equal or 1/2 ampere, where I is the total current measured by the ammeterl. The winding being short-circuited, the flux in leg b is almost zero. Figure 13-6C shows the delta connection when the connections to the test transformer are reversed; that is, the high voltage is now applied to terminals H2 and H3 or to the ends, 1' and 3, of the two windings. Since the positions of the two windings on the magnetic core have not changed, the magnitudes of their exciting currents and fluxes should remain the same as in Figure 13-6B; their directions only having been reversed.
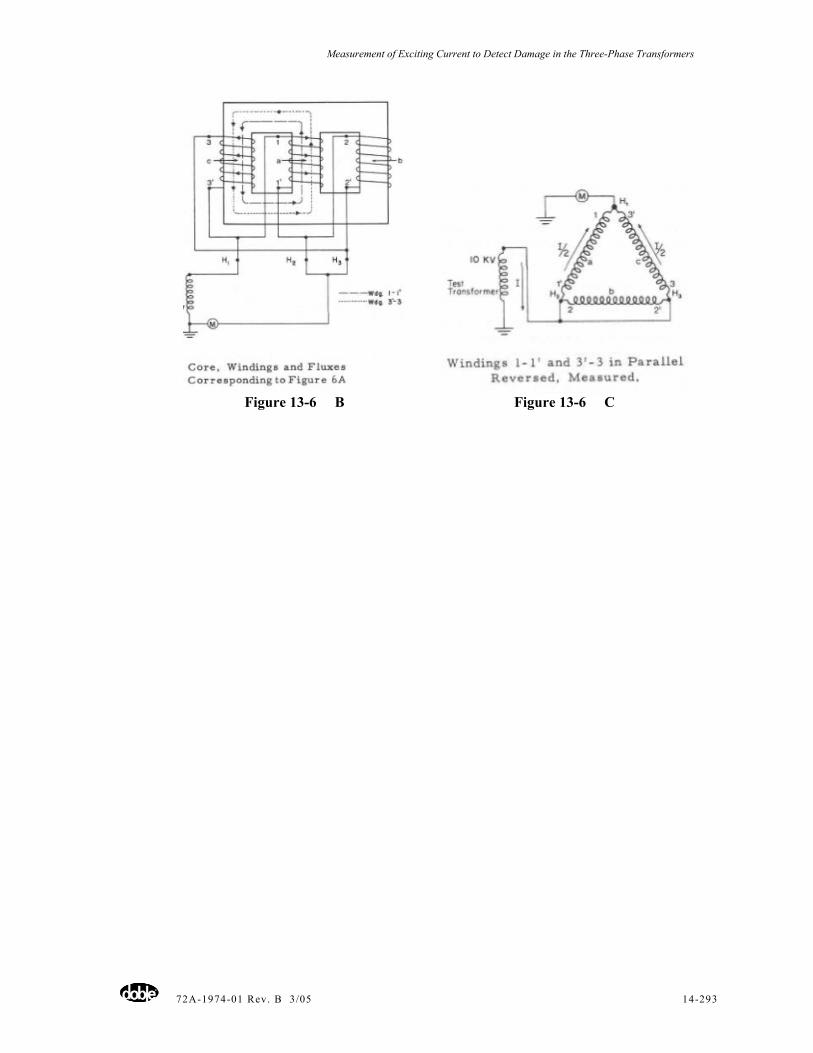
Measurement of Exciting Current to Detect Damage in the Three-Phase Transformers
72A-1974-01 Rev. B 3/05 14-293
Figure 13-6 B Figure 13-6 C
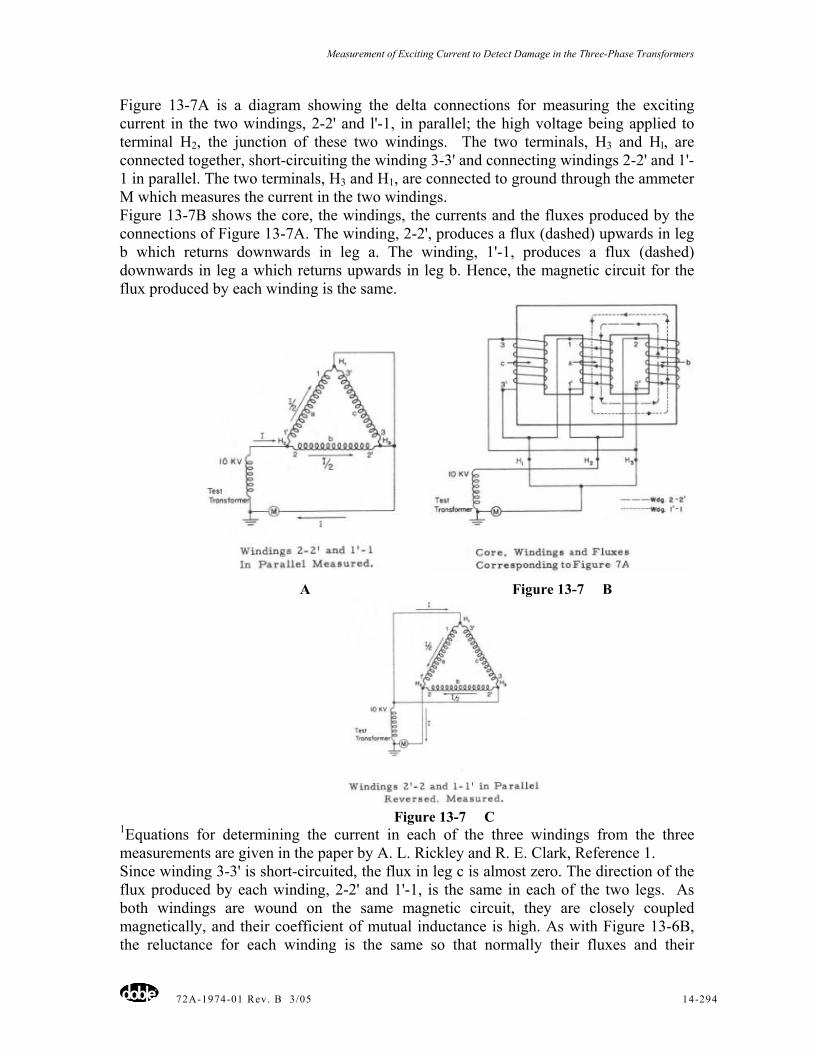
Measurement of Exciting Current to Detect Damage in the Three-Phase Transformers
72A-1974-01 Rev. B 3/05 14-294
Figure 13-7A is a diagram showing the delta connections for measuring the exciting current in the two windings, 2-2' and l'-1, in parallel; the high voltage being applied to terminal H2, the junction of these two windings. The two terminals, H3 and Hl, are connected together, short-circuiting the winding 3-3' and connecting windings 2-2' and 1'-1 in parallel. The two terminals, H3 and H1, are connected to ground through the ammeter M which measures the current in the two windings. Figure 13-7B shows the core, the windings, the currents and the fluxes produced by the connections of Figure 13-7A. The winding, 2-2', produces a flux (dashed) upwards in leg b which returns downwards in leg a. The winding, 1'-1, produces a flux (dashed) downwards in leg a which returns upwards in leg b. Hence, the magnetic circuit for the flux produced by each winding is the same.
A Figure 13-7 B
Figure 13-7 C
1Equations for determining the current in each of the three windings from the three measurements are given in the paper by A. L. Rickley and R. E. Clark, Reference 1. Since winding 3-3' is short-circuited, the flux in leg c is almost zero. The direction of the flux produced by each winding, 2-2' and 1'-1, is the same in each of the two legs. As both windings are wound on the same magnetic circuit, they are closely coupled magnetically, and their coefficient of mutual inductance is high. As with Figure 13-6B, the reluctance for each winding is the same so that normally their fluxes and their
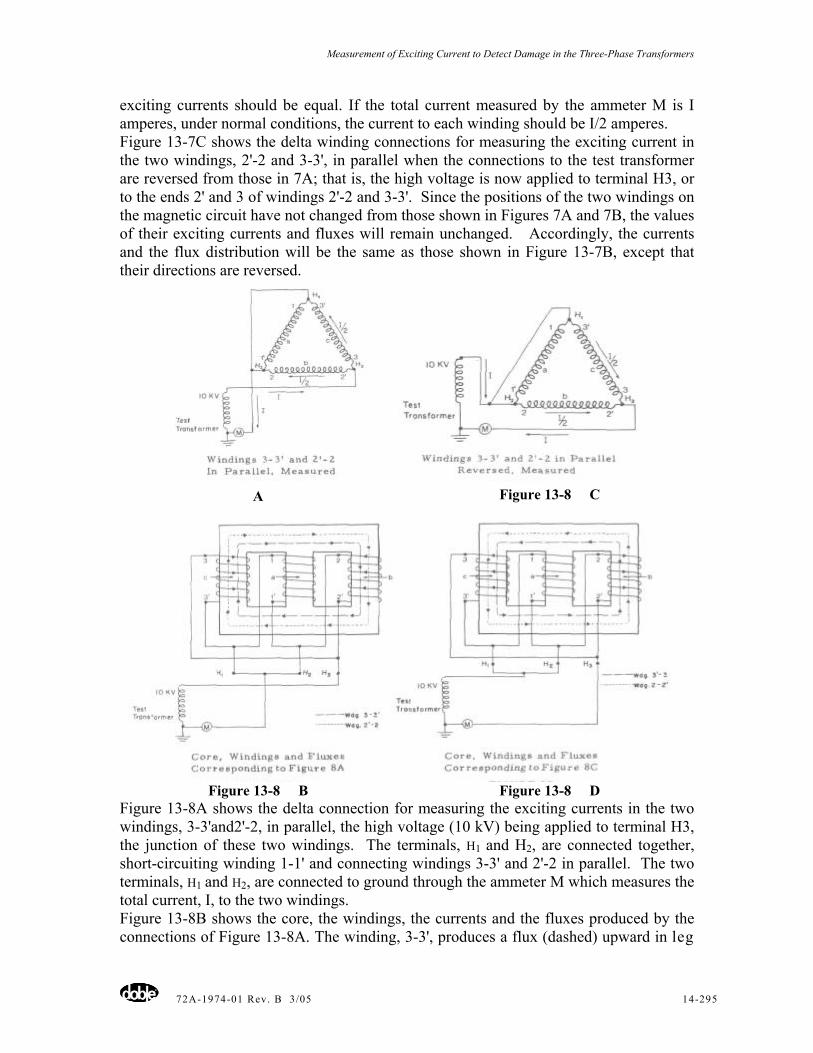
Measurement of Exciting Current to Detect Damage in the Three-Phase Transformers
72A-1974-01 Rev. B 3/05 14-295
exciting currents should be equal. If the total current measured by the ammeter M is I amperes, under normal conditions, the current to each winding should be I/2 amperes. Figure 13-7C shows the delta winding connections for measuring the exciting current in the two windings, 2'-2 and 3-3', in parallel when the connections to the test transformer are reversed from those in 7A; that is, the high voltage is now applied to terminal H3, or to the ends 2' and 3 of windings 2'-2 and 3-3'. Since the positions of the two windings on the magnetic circuit have not changed from those shown in Figures 7A and 7B, the values of their exciting currents and fluxes will remain unchanged. Accordingly, the currents and the flux distribution will be the same as those shown in Figure 13-7B, except that their directions are reversed.
A Figure 13-8 C
Figure 13-8 B Figure 13-8 D
Figure 13-8A shows the delta connection for measuring the exciting currents in the two windings, 3-3'and2'-2, in parallel, the high voltage (10 kV) being applied to terminal H3, the junction of these two windings. The terminals, H1 and H2, are connected together, short-circuiting winding 1-1' and connecting windings 3-3' and 2'-2 in parallel. The two terminals, H1 and H2, are connected to ground through the ammeter M which measures the total current, I, to the two windings. Figure 13-8B shows the core, the windings, the currents and the fluxes produced by the connections of Figure 13-8A. The winding, 3-3', produces a flux (dashed) upward in leg
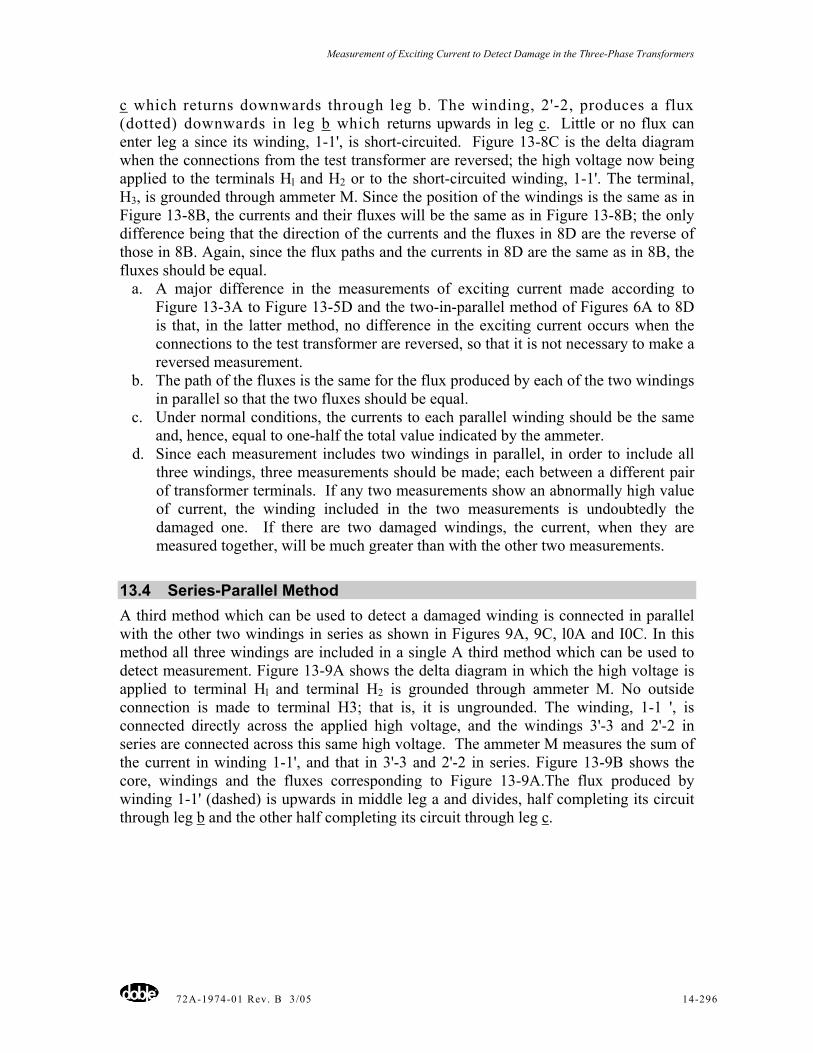
Measurement of Exciting Current to Detect Damage in the Three-Phase Transformers
72A-1974-01 Rev. B 3/05 14-296
c which returns downwards through leg b. The winding, 2'-2, produces a flux (dotted) downwards in leg b which returns upwards in leg c. Little or no flux can enter leg a since its winding, 1-1', is short-circuited. Figure 13-8C is the delta diagram when the connections from the test transformer are reversed; the high voltage now being applied to the terminals Hl and H2 or to the short-circuited winding, 1-1'. The terminal, H3, is grounded through ammeter M. Since the position of the windings is the same as in Figure 13-8B, the currents and their fluxes will be the same as in Figure 13-8B; the only difference being that the direction of the currents and the fluxes in 8D are the reverse of those in 8B. Again, since the flux paths and the currents in 8D are the same as in 8B, the fluxes should be equal.
a. A major difference in the measurements of exciting current made according to Figure 13-3A to Figure 13-5D and the two-in-parallel method of Figures 6A to 8D is that, in the latter method, no difference in the exciting current occurs when the connections to the test transformer are reversed, so that it is not necessary to make a reversed measurement.
b. The path of the fluxes is the same for the flux produced by each of the two windings in parallel so that the two fluxes should be equal.
c. Under normal conditions, the currents to each parallel winding should be the same and, hence, equal to one-half the total value indicated by the ammeter.
d. Since each measurement includes two windings in parallel, in order to include all three windings, three measurements should be made; each between a different pair of transformer terminals. If any two measurements show an abnormally high value of current, the winding included in the two measurements is undoubtedly the damaged one. If there are two damaged windings, the current, when they are measured together, will be much greater than with the other two measurements.
13.4 Series-Parallel Method A third method which can be used to detect a damaged winding is connected in parallel with the other two windings in series as shown in Figures 9A, 9C, l0A and I0C. In this method all three windings are included in a single A third method which can be used to detect measurement. Figure 13-9A shows the delta diagram in which the high voltage is applied to terminal Hl and terminal H2 is grounded through ammeter M. No outside connection is made to terminal H3; that is, it is ungrounded. The winding, 1-1 ', is connected directly across the applied high voltage, and the windings 3'-3 and 2'-2 in series are connected across this same high voltage. The ammeter M measures the sum of the current in winding 1-1', and that in 3'-3 and 2'-2 in series. Figure 13-9B shows the core, windings and the fluxes corresponding to Figure 13-9A.The flux produced by winding 1-1' (dashed) is upwards in middle leg a and divides, half completing its circuit through leg b and the other half completing its circuit through leg c.
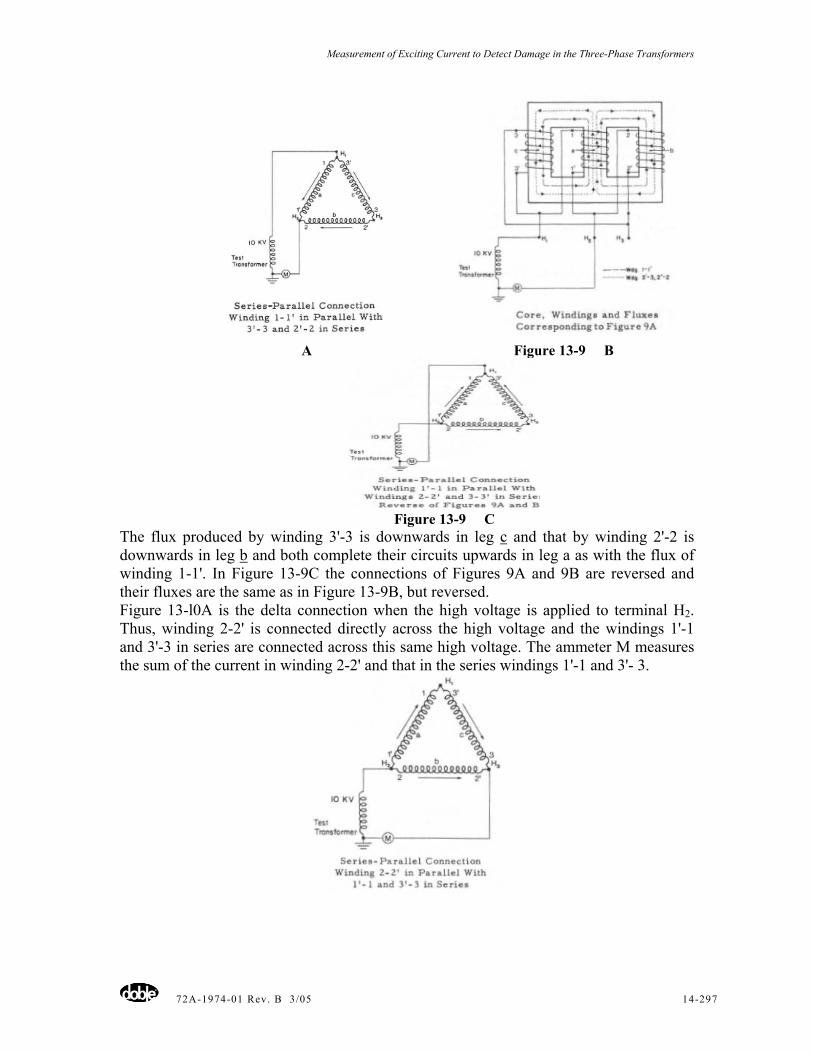
Measurement of Exciting Current to Detect Damage in the Three-Phase Transformers
72A-1974-01 Rev. B 3/05 14-297
A Figure 13-9 B
Figure 13-9 C
The flux produced by winding 3'-3 is downwards in leg c and that by winding 2'-2 is downwards in leg b and both complete their circuits upwards in leg a as with the flux of winding 1-1'. In Figure 13-9C the connections of Figures 9A and 9B are reversed and their fluxes are the same as in Figure 13-9B, but reversed. Figure 13-l0A is the delta connection when the high voltage is applied to terminal H2. Thus, winding 2-2' is connected directly across the high voltage and the windings 1'-1 and 3'-3 in series are connected across this same high voltage. The ammeter M measures the sum of the current in winding 2-2' and that in the series windings 1'-1 and 3'- 3.
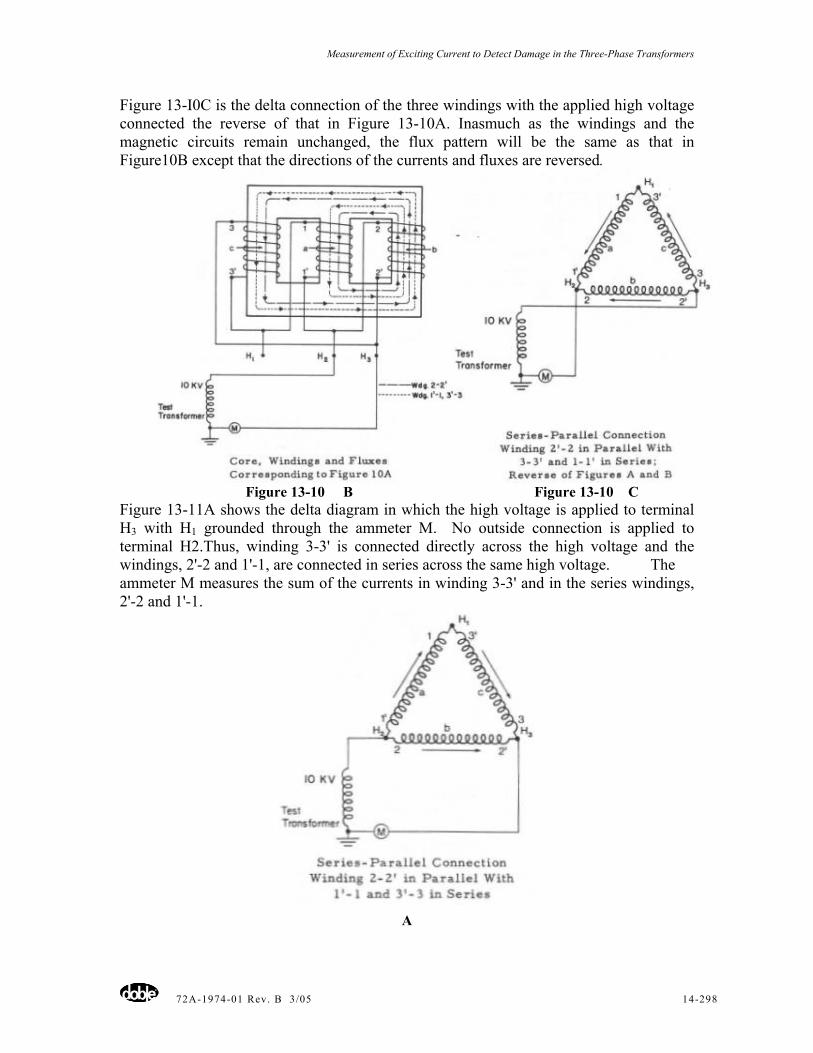
Measurement of Exciting Current to Detect Damage in the Three-Phase Transformers
72A-1974-01 Rev. B 3/05 14-298
Figure 13-I0C is the delta connection of the three windings with the applied high voltage connected the reverse of that in Figure 13-10A. Inasmuch as the windings and the magnetic circuits remain unchanged, the flux pattern will be the same as that in Figure10B except that the directions of the currents and fluxes are reversed.
Figure 13-10 B Figure 13-10 C
Figure 13-11A shows the delta diagram in which the high voltage is applied to terminal H3 with H1 grounded through the ammeter M. No outside connection is applied to terminal H2.Thus, winding 3-3' is connected directly across the high voltage and the windings, 2'-2 and 1'-1, are connected in series across the same high voltage. The ammeter M measures the sum of the currents in winding 3-3' and in the series windings, 2'-2 and 1'-1.
A
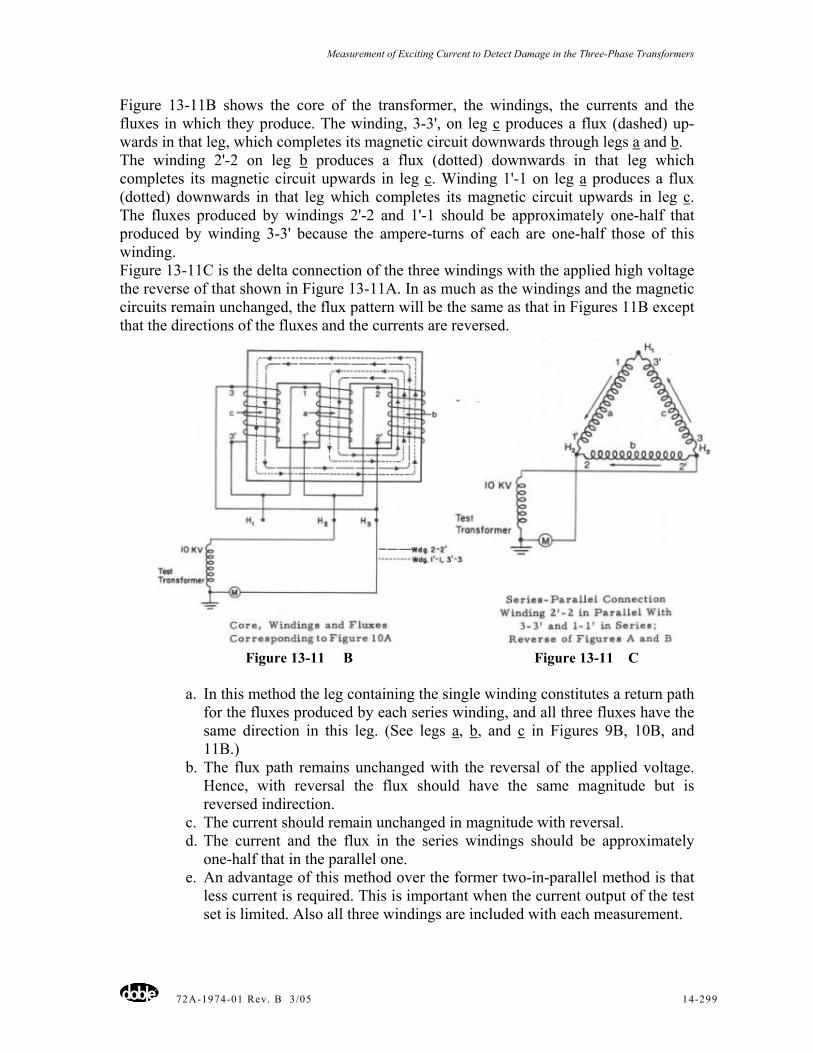
Measurement of Exciting Current to Detect Damage in the Three-Phase Transformers
72A-1974-01 Rev. B 3/05 14-299
Figure 13-11B shows the core of the transformer, the windings, the currents and the fluxes in which they produce. The winding, 3-3', on leg c produces a flux (dashed) up-wards in that leg, which completes its magnetic circuit downwards through legs a and b. The winding 2'-2 on leg b produces a flux (dotted) downwards in that leg which completes its magnetic circuit upwards in leg c. Winding 1'-1 on leg a produces a flux (dotted) downwards in that leg which completes its magnetic circuit upwards in leg c. The fluxes produced by windings 2'-2 and 1'-1 should be approximately one-half that produced by winding 3-3' because the ampere-turns of each are one-half those of this winding. Figure 13-11C is the delta connection of the three windings with the applied high voltage the reverse of that shown in Figure 13-11A. In as much as the windings and the magnetic circuits remain unchanged, the flux pattern will be the same as that in Figures 11B except that the directions of the fluxes and the currents are reversed.
Figure 13-11 B Figure 13-11 C
a. In this method the leg containing the single winding constitutes a return path
for the fluxes produced by each series winding, and all three fluxes have the same direction in this leg. (See legs a, b, and c in Figures 9B, 10B, and 11B.)
b. The flux path remains unchanged with the reversal of the applied voltage. Hence, with reversal the flux should have the same magnitude but is reversed indirection.
c. The current should remain unchanged in magnitude with reversal. d. The current and the flux in the series windings should be approximately
one-half that in the parallel one. e. An advantage of this method over the former two-in-parallel method is that
less current is required. This is important when the current output of the test set is limited. Also all three windings are included with each measurement.
Measurement of Exciting Current to Detect Damage in the Three-Phase Transformers
72A-1974-01 Rev. B 3/05 14-300
The detection of a damaged winding by this method can undoubtedly be accomplished by making three measurements of the exciting current, as with the former two methods; that is, between each pair of terminals. The exciting current in the single parallel winding is approximately twice that in the series windings. Hence, an increase in its value caused by a damaged winding or core would produce a much greater increase in the total current, or the ammeter reading, than a similar increase in one of the series windings. Hence, if in the three measurements of exciting current the current with one pair of terminals is greater than with the other two, it is almost certain that the damaged winding is the parallel one involved with this higher value of current. In order to evaluate their capabilities, considerably more field experience with each of the three methods is desirable.
The author wishes to express his appreciation of the assistance given him in the preparation of this paper by A. L. Rickley, E. H. Povey and R. E. Clark of the Doble Engineering Company.
13.5 References 1. "Transformer Exciting Current Measured with Doble Equipment (A Progress Report),"
A, L. Rickley and R. E. Clark, Minutes of the Thirty-Fourth Annual International Conference of Doble Clients, 1967, Sec. 6-901. (Method, Connections and Equations for Winding Currents)
2. "Detection of Transformer Fault Using Exciting Current Test, " R. I. Tudor, Minutes of the Thirty-Fifth International Conference of Doble Clients, 1968, Sec.6-401. (Doble and Transformer Turn Ratio Tests on Three 3-Phase Transformers. Winding damaged by lightning detected and repaired.)
3. "Transformer Exciting Current Measured with Doble Equipment (A Progress Report)," A. L. Rickley and R. E. Clark, Minutes of the Thirty-Fifth Annual International Conference of Doble Clients, 1968, Sec. 6-1001. (Significance of Exciting Current, Magnitude, Phasor Diagram, Considerable Field Data, and Recommendations, )
4. "Transformer Exciting Current Measured with Doble Equipment (A Progress Report)," A. L. Rickley and R. E. Clark, Minutes of the Thirty-Sixth Annual International Conference of Doble Clients, 1969, Sec. 6-501.
(Test Procedure, Diagrams, Test-Voltage Recommendations, Much Field Data, and Report of Fault Detection in 5, 000 kVA, 115/44-kV Auto Transformer.)
5. "Transformer Exciting Current Measured with Doble Equipment (A Progress Report)," A. L. Rickley and R. E. Clark, Minutes of the Thirty-Seventh Annual International Conference of Doble Clients, 1970, Sec. 6-1501.
(Examples of Fault Detection and the Effects of Residual Magnetism.)
Measurement of Exciting Current to Detect Damage in the Three-Phase Transformers
72A-1974-01 Rev. B 3/05 14-301
6. "Transformer Exciting Current Measured with Doble Equipment (A Progress Report)," A. L. Rickley and R. E. Clark, Minutes of the Thirty-Eighth Annual International Conference of Doble Clients, 1971, Sec. 6-1001. (Detailed Test Recommendations, Effects of Residual Magnetism, Demagnetization, Field Experience - Moisture, Shipping Damage, Under load Tap Changers.)
7. "Transformer Exciting Current Measured with Doble Equipment (A Progress Report)," A, L. Rickley and R. E. Clark, Minutes of the Thirty-Ninth Annual International Conference of Doble Clients, 1972, Sec. 6-401.
(Effects of Short-Circuit from Shipping Damage, Under load Tap Changers, Lightning Damage, Connections for Damage Location.)
8. "Displaced and Damaged Transformer Coils and Their Detection, " C. L. Dawes, Minutes of the Thirty-Ninth Annual International Conference of Doble Clients, 1972, Sec. 6-1001.
(Description and Analysis of the Several Methods of Detecting and Diagnosing Damages in Transformer Windings with Examples together with 37 References.)
72A-1974-01 Rev. B 3/05 14-302
Chapter 14 – Displaced and Damaged Transformer Coils and Their Detection
C.L. Dawes Doble Engineering Company
14.1 Introduction In the last few years the number of power transformer failures resulting from short circuits has escalated at such an alarming rate that it has become of great concern to both the power companies and the manufacturers. Most of the failures are not concerned with direct thermal damage of the insulation but rather mechanical failures resulting from the tremendous electromagnetic forces produced by the short circuit currents, and the inability of the transformer structure to withstand such forces. The magnitude of these forces is better understood when it is realized that they are proportional to the winding current squared. For example, a current twenty times normal current will produce a force (20)2 or 400 times that at the normal value of current. The recent increased prevalence of such large short-circuit currents may be attributed to a combination of several factors: the great increase in power-system and transformer power capabilities, sustained voltage because of improved regulation, reduced internal transformer impedance due to decreased insulation levels and lower system BIL's, increased use of winding taps, and the repeated shocks produced by the action of reclosing circuit breakers. The following quotations, which are typical of numerous others appearing in recent publications, present the situation as reviewed by the industry: "The high rate of failure of power transformers resulting from short-circuits experienced during the past three or four years has become a matter of wide interest and concern. In this connection, for example, a recent industry report (EEI Electrical Systems and Equipment Committee) states that 62 percent of the total failures of power transformers reported by utilities in this group in 1966 - 1967 resulted from through faults. "(1)*
"BPA, like other utilities, has become very concerned because of several in-service failures on our system of units obviously having insufficient mechanical strength.we have initiated several steps. The most pressing of these is the development of a diagnostic test tool which will reliably indicate whether a transformer's windings have undergone a harmful physical change following an in-service, or test, short-circuit. "(3)
This all has resulted in the initiation of a comprehensive program by the industry directed to the overall problems of power-transformer mechanical strength, revision of present transformer short-circuit-current standards, the development of an industry code for short-circuit testing of transformers, and the study and development of diagnostic methods of detecting displaced and damaged transformer windings.
*Raised parenthetical numbers refer to the numbered reference, Pages 22 to 24.
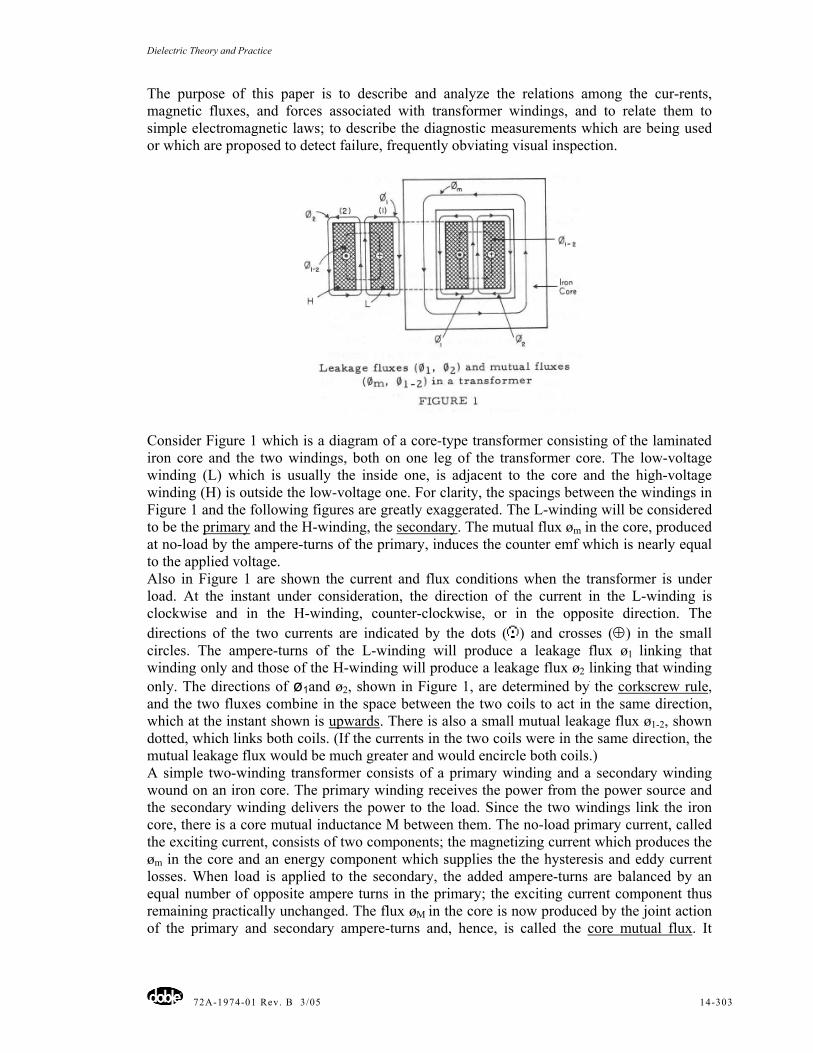
Dielectric Theory and Practice
72A-1974-01 Rev. B 3/05 14-303
The purpose of this paper is to describe and analyze the relations among the cur-rents, magnetic fluxes, and forces associated with transformer windings, and to relate them to simple electromagnetic laws; to describe the diagnostic measurements which are being used or which are proposed to detect failure, frequently obviating visual inspection.
Consider Figure 1 which is a diagram of a core-type transformer consisting of the laminated iron core and the two windings, both on one leg of the transformer core. The low-voltage winding (L) which is usually the inside one, is adjacent to the core and the high-voltage winding (H) is outside the low-voltage one. For clarity, the spacings between the windings in Figure 1 and the following figures are greatly exaggerated. The L-winding will be considered to be the primary and the H-winding, the secondary. The mutual flux øm in the core, produced at no-load by the ampere-turns of the primary, induces the counter emf which is nearly equal to the applied voltage. Also in Figure 1 are shown the current and flux conditions when the transformer is under load. At the instant under consideration, the direction of the current in the L-winding is clockwise and in the H-winding, counter-clockwise, or in the opposite direction. The directions of the two currents are indicated by the dots ( ) and crosses (⊕) in the small circles. The ampere-turns of the L-winding will produce a leakage flux ø1 linking that winding only and those of the H-winding will produce a leakage flux ø2 linking that winding only. The directions of ø1and ø2, shown in Figure 1, are determined by the corkscrew rule, and the two fluxes combine in the space between the two coils to act in the same direction, which at the instant shown is upwards. There is also a small mutual leakage flux ø1-2, shown dotted, which links both coils. (If the currents in the two coils were in the same direction, the mutual leakage flux would be much greater and would encircle both coils.) A simple two-winding transformer consists of a primary winding and a secondary winding wound on an iron core. The primary winding receives the power from the power source and the secondary winding delivers the power to the load. Since the two windings link the iron core, there is a core mutual inductance M between them. The no-load primary current, called the exciting current, consists of two components; the magnetizing current which produces the øm in the core and an energy component which supplies the the hysteresis and eddy current losses. When load is applied to the secondary, the added ampere-turns are balanced by an equal number of opposite ampere turns in the primary; the exciting current component thus remaining practically unchanged. The flux øM in the core is now produced by the joint action of the primary and secondary ampere-turns and, hence, is called the core mutual flux. It
Dielectric Theory and Practice
72A-1974-01 Rev. B 3/05 14-304
remains practically constant under all conditions of load.(It may decrease from one to five percent because of the primary impedance voltage drop.) However, the total primary ampere-turns produce a primary leakage flux which links the primary only, and the secondary ampere-turns produce a secondary leakage flux which links the secondary only.Because of these relations among ampere-turns and fluxes, in the usual analysis of power-transformer operation, the effects of the core mutual inductance are replaced by those of the mutual core flux ¢m and the magnetizing current. It is clear that the smaller the spacing between primary and secondary windings, the smaller the leakage fluxes.These leakage fluxes produce the reactance drop in their respective windings. The flux φ1 produces a reactance drop in the L-winding.
I1 X1 = I1 L1ωvolts (1)where Il is the primary current, LI the leakage self-inductance of this winding, and ω = 2πf, where f is the frequency in Hz. Similarly, the fluxφ2, produces a reactance drop,
I1 X2 = I2 L2ω volts (2)where I2 is the secondary current and L2 the leakage self-inductance of this winding. In the usual analysis of the performance of transformers, reference is made to only one of the windings. For example, the total reactance may be referred to the low side,
X01=X1+X2(N1/N2)2 ohms (3)and when referred to the high side,
X02=X2+X1(N1/N2)2 ohms (4)where N1 and N2 are the respective number of turns in each winding. Also,
2
1
2
01
02
NN
⎟⎠⎞
⎜⎝⎛=
ΧΧ (5)
X01 and X02 are called respectively the equivalent reactance of the transformer with reference to the side under consideration. In measuring Xl and X2 by the usual short-circuit test, the mutual inductance φ1-2 is included. The total reactance voltage drop referred to the low or the high sides are respectively,
I1X01 and I2X02 volts (6)There are also the equivalent resistances referred to the primary and the secondary, thus,
R01=R1+R2 (N1/N2)2 ohms, (7)and,
R02=R 2+R1 (N2/N1)2 ohms, (8)where Rl and R2 are the respective effective resistances of the two windings. The respective impedance drops are,
IZI 01011 = 201
201 XR + volts: (9)
I02ZI 022 = 202
202 XR + volts: (10)
where Z01 and Z02 are the equivalent impedances, each referred to its respective side. Each equation gives the same percent impedance drop. From the foregoing values of reactance, resistance and impedance, the performance of the transformer can be calculated by the well-known methods, and these values are used in the construction of the well-known phasor diagrams. These reactances and impedances practically determine the short-circuit currents in the transformer and, thus, the electromagnetic forces which produce mechanical displacement and distortions of the windings.
Dielectric Theory and Practice
72A-1974-01 Rev. B 3/05 14-305
Distribution transformers and transformers for the lower voltages have relatively low values of impedance because of the desirability of close regulation. More over, fortunately, at the lower voltages the lesser insulation required permits closer spacing between primary and secondary windings and, hence, lesser leakage flux and reactance (Figures 1, 7 and 8(a)).The internal impedance of such transformers varies from 1-1 /2 to 3 to 4 percent.In the high-voltage and EHV transformers, the larger amount of insulation requires greater spacing between the windings and, hence, the leakage flux and reactance are much greater. The internal impedance of this class may vary from 6 to 18 percent. * Since such transformers are usually the main units in large power systems, where the voltage is regulated, transformer voltage regulation is not so important. Also, the greater the internal impedance, the less the short-circuit current and disturbance to the system, as well as the forces acting on the transformer windings. If the high-side voltage, El, of a transformer is sustained and the percent impedance is I0%, the short-circuit current may be determined as follows:
.E10.0ZI1 101= (11)where I1 is the rated, or normal, primary current. On short circuit, the current
.ampZ/EI 011S = (12)Substituting Z0l from (I1) into (12),
( )I10
IE10.0
/EIS 11
11 =⎟⎟
⎠
⎞⎜⎜⎝
⎛= (13)
With 5 percent impedance drop, the short-circuit current would be 20 and the forces on the windings would be 400 times their value at rated current. *Recently, Japan has been installing in a new substation in Osaka three 100-MVA, 154/22-kV transformers having an impedance of 26 percent; the first units with a value this high. The three transformers are to operate in parallel and the high impedance is necessary to limit the short-circuit currents.
14.2 Electromechanical Forces Acting On Transformer Windings The analysis and determination of the mechanical forces produced by currents which displace and distort transformer coils and windings are greatly facilitated by the application of two simple laws of the magnetic circuit and of electromagnetism.
Law 1. The magnetic circuit tends to conform itself so that the magnetic flux is a maximum. (This is simply illustrated by the pulling of an iron armature to either a permanent or an electromagnet. The magnetic flux is increased as the armature approaches the magnet and is a maximum when it makes contact. ) Law 2. Currents in the same direction attract one another and currents in opposite directions repel one another.
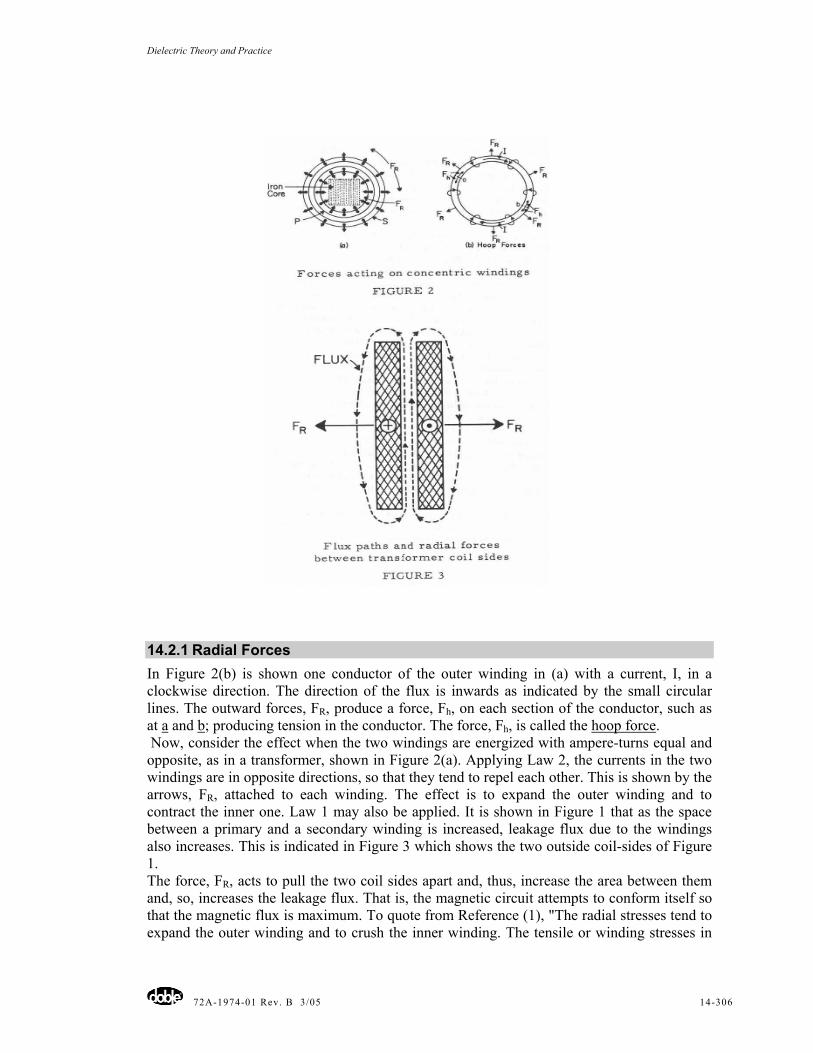
Dielectric Theory and Practice
72A-1974-01 Rev. B 3/05 14-306
14.2.1 Radial Forces In Figure 2(b) is shown one conductor of the outer winding in (a) with a current, I, in a clockwise direction. The direction of the flux is inwards as indicated by the small circular lines. The outward forces, FR, produce a force, Fh, on each section of the conductor, such as at a and b; producing tension in the conductor. The force, Fh, is called the hoop force. Now, consider the effect when the two windings are energized with ampere-turns equal and opposite, as in a transformer, shown in Figure 2(a). Applying Law 2, the currents in the two windings are in opposite directions, so that they tend to repel each other. This is shown by the arrows, FR, attached to each winding. The effect is to expand the outer winding and to contract the inner one. Law 1 may also be applied. It is shown in Figure 1 that as the space between a primary and a secondary winding is increased, leakage flux due to the windings also increases. This is indicated in Figure 3 which shows the two outside coil-sides of Figure 1. The force, FR, acts to pull the two coil sides apart and, thus, increase the area between them and, so, increases the leakage flux. That is, the magnetic circuit attempts to conform itself so that the magnetic flux is maximum. To quote from Reference (1), "The radial stresses tend to expand the outer winding and to crush the inner winding. The tensile or winding stresses in
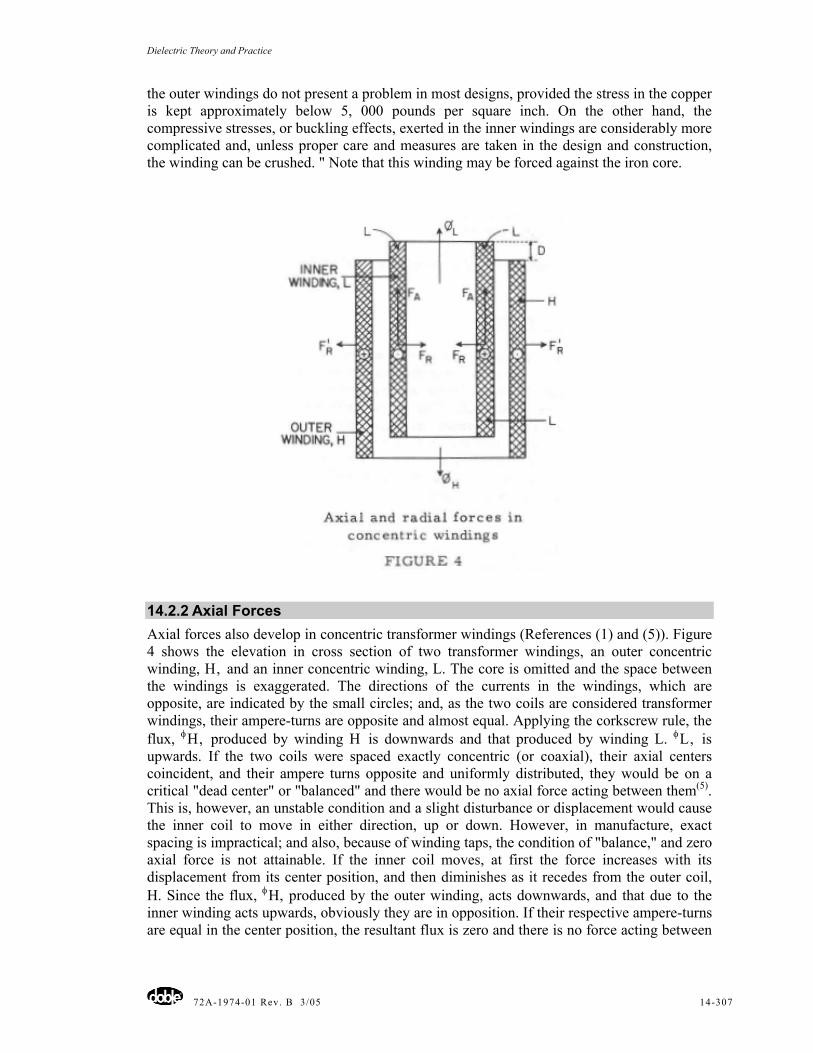
Dielectric Theory and Practice
72A-1974-01 Rev. B 3/05 14-307
the outer windings do not present a problem in most designs, provided the stress in the copper is kept approximately below 5, 000 pounds per square inch. On the other hand, the compressive stresses, or buckling effects, exerted in the inner windings are considerably more complicated and, unless proper care and measures are taken in the design and construction, the winding can be crushed. " Note that this winding may be forced against the iron core.
14.2.2 Axial Forces Axial forces also develop in concentric transformer windings (References (1) and (5)). Figure 4 shows the elevation in cross section of two transformer windings, an outer concentric winding, H, and an inner concentric winding, L. The core is omitted and the space between the windings is exaggerated. The directions of the currents in the windings, which are opposite, are indicated by the small circles; and, as the two coils are considered transformer windings, their ampere-turns are opposite and almost equal. Applying the corkscrew rule, the flux, φH, produced by winding H is downwards and that produced by winding L. φL, is upwards. If the two coils were spaced exactly concentric (or coaxial), their axial centers coincident, and their ampere turns opposite and uniformly distributed, they would be on a critical "dead center" or "balanced" and there would be no axial force acting between them(5). This is, however, an unstable condition and a slight disturbance or displacement would cause the inner coil to move in either direction, up or down. However, in manufacture, exact spacing is impractical; and also, because of winding taps, the condition of "balance," and zero axial force is not attainable. If the inner coil moves, at first the force increases with its displacement from its center position, and then diminishes as it recedes from the outer coil, H. Since the flux, φH, produced by the outer winding, acts downwards, and that due to the inner winding acts upwards, obviously they are in opposition. If their respective ampere-turns are equal in the center position, the resultant flux is zero and there is no force acting between
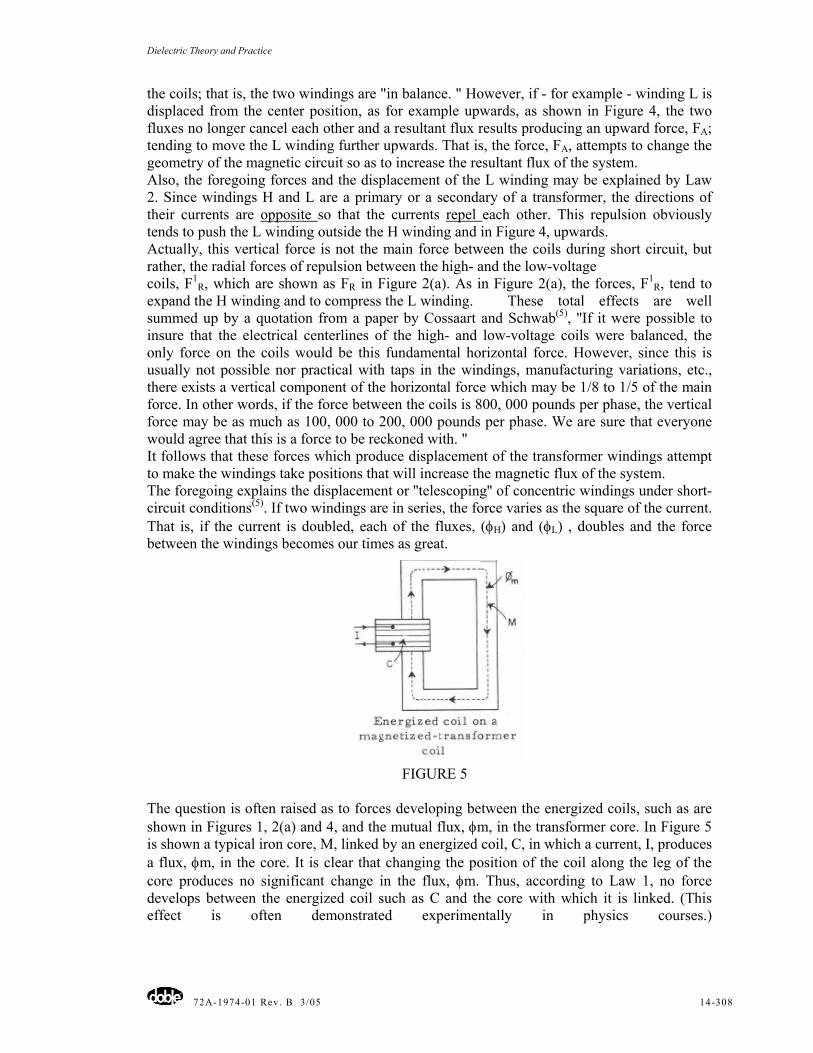
Dielectric Theory and Practice
72A-1974-01 Rev. B 3/05 14-308
the coils; that is, the two windings are "in balance. " However, if - for example - winding L is displaced from the center position, as for example upwards, as shown in Figure 4, the two fluxes no longer cancel each other and a resultant flux results producing an upward force, FA; tending to move the L winding further upwards. That is, the force, FA, attempts to change the geometry of the magnetic circuit so as to increase the resultant flux of the system. Also, the foregoing forces and the displacement of the L winding may be explained by Law 2. Since windings H and L are a primary or a secondary of a transformer, the directions of their currents are opposite so that the currents repel each other. This repulsion obviously tends to push the L winding outside the H winding and in Figure 4, upwards. Actually, this vertical force is not the main force between the coils during short circuit, but rather, the radial forces of repulsion between the high- and the low-voltage coils, F1
R, which are shown as FR in Figure 2(a). As in Figure 2(a), the forces, F1R, tend to
expand the H winding and to compress the L winding. These total effects are well summed up by a quotation from a paper by Cossaart and Schwab(5), ''If it were possible to insure that the electrical centerlines of the high- and low-voltage coils were balanced, the only force on the coils would be this fundamental horizontal force. However, since this is usually not possible nor practical with taps in the windings, manufacturing variations, etc., there exists a vertical component of the horizontal force which may be 1/8 to 1/5 of the main force. In other words, if the force between the coils is 800, 000 pounds per phase, the vertical force may be as much as 100, 000 to 200, 000 pounds per phase. We are sure that everyone would agree that this is a force to be reckoned with. " It follows that these forces which produce displacement of the transformer windings attempt to make the windings take positions that will increase the magnetic flux of the system. The foregoing explains the displacement or ''telescoping'' of concentric windings under short-circuit conditions(5). If two windings are in series, the force varies as the square of the current. That is, if the current is doubled, each of the fluxes, (φH) and (φL) , doubles and the force between the windings becomes our times as great.
FIGURE 5
The question is often raised as to forces developing between the energized coils, such as are shown in Figures 1, 2(a) and 4, and the mutual flux, φm, in the transformer core. In Figure 5 is shown a typical iron core, M, linked by an energized coil, C, in which a current, I, produces a flux, φm, in the core. It is clear that changing the position of the coil along the leg of the core produces no significant change in the flux, φm. Thus, according to Law 1, no force develops between the energized coil such as C and the core with which it is linked. (This effect is often demonstrated experimentally in physics courses.)
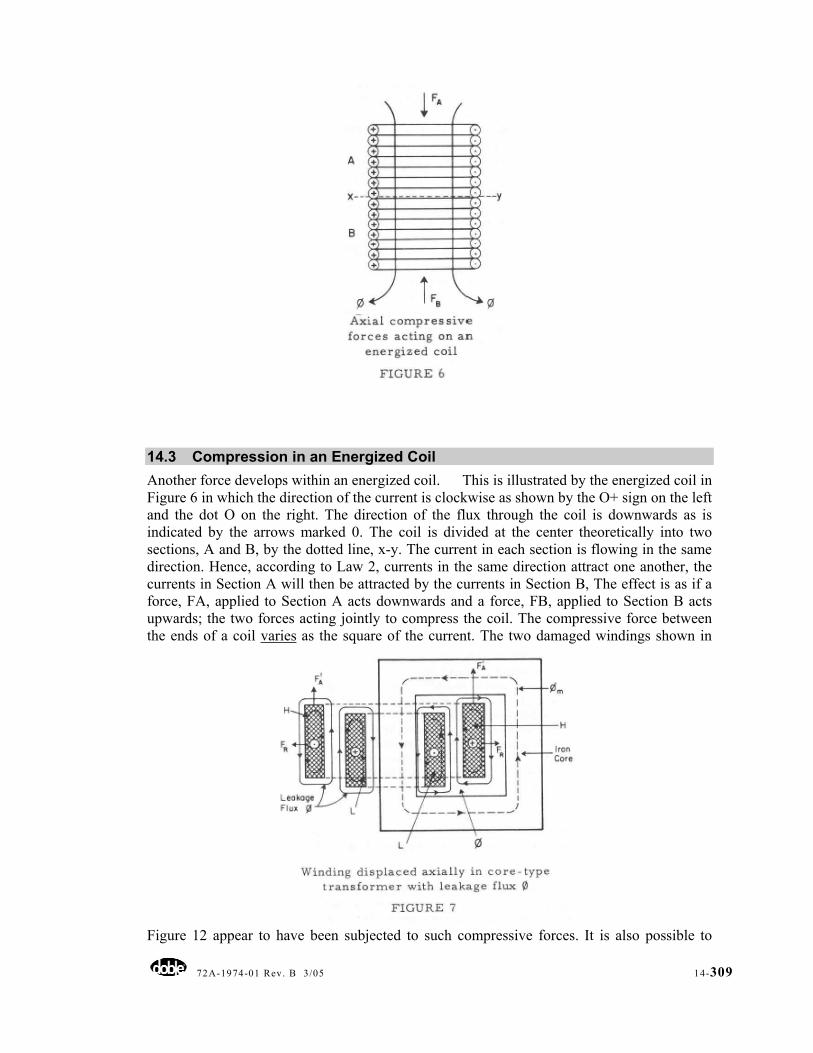
72A-1974-01 Rev. B 3/05 14-309
14.3 Compression in an Energized Coil Another force develops within an energized coil. This is illustrated by the energized coil in Figure 6 in which the direction of the current is clockwise as shown by the O+ sign on the left and the dot O on the right. The direction of the flux through the coil is downwards as is indicated by the arrows marked 0. The coil is divided at the center theoretically into two sections, A and B, by the dotted line, x-y. The current in each section is flowing in the same direction. Hence, according to Law 2, currents in the same direction attract one another, the currents in Section A will then be attracted by the currents in Section B, The effect is as if a force, FA, applied to Section A acts downwards and a force, FB, applied to Section B acts upwards; the two forces acting jointly to compress the coil. The compressive force between the ends of a coil varies as the square of the current. The two damaged windings shown in
Figure 12 appear to have been subjected to such compressive forces. It is also possible to
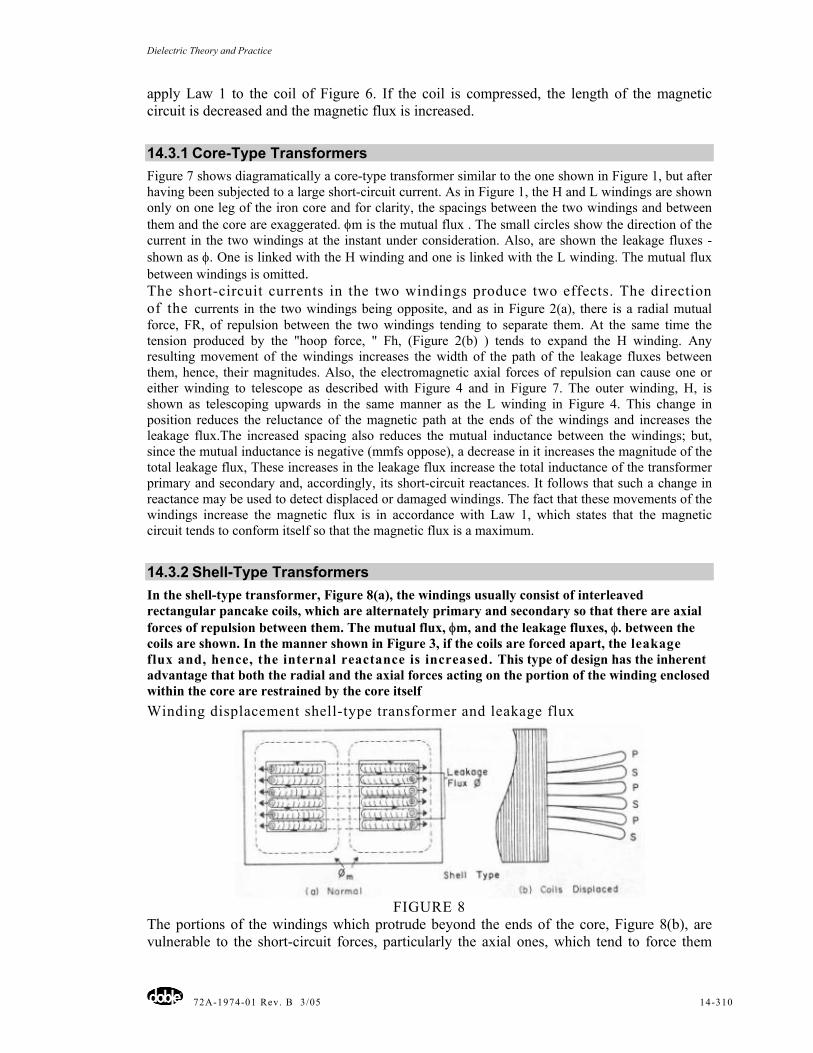
Dielectric Theory and Practice
72A-1974-01 Rev. B 3/05 14-310
apply Law 1 to the coil of Figure 6. If the coil is compressed, the length of the magnetic circuit is decreased and the magnetic flux is increased.
14.3.1 Core-Type Transformers Figure 7 shows diagramatically a core-type transformer similar to the one shown in Figure 1, but after having been subjected to a large short-circuit current. As in Figure 1, the H and L windings are shown only on one leg of the iron core and for clarity, the spacings between the two windings and between them and the core are exaggerated. φm is the mutual flux . The small circles show the direction of the current in the two windings at the instant under consideration. Also, are shown the leakage fluxes - shown as φ. One is linked with the H winding and one is linked with the L winding. The mutual flux between windings is omitted. The short-circuit currents in the two windings produce two effects. The direction of the currents in the two windings being opposite, and as in Figure 2(a), there is a radial mutual force, FR, of repulsion between the two windings tending to separate them. At the same time the tension produced by the "hoop force, " Fh, (Figure 2(b) ) tends to expand the H winding. Any resulting movement of the windings increases the width of the path of the leakage fluxes between them, hence, their magnitudes. Also, the electromagnetic axial forces of repulsion can cause one or either winding to telescope as described with Figure 4 and in Figure 7. The outer winding, H, is shown as telescoping upwards in the same manner as the L winding in Figure 4. This change in position reduces the reluctance of the magnetic path at the ends of the windings and increases the leakage flux.The increased spacing also reduces the mutual inductance between the windings; but, since the mutual inductance is negative (mmfs oppose), a decrease in it increases the magnitude of the total leakage flux, These increases in the leakage flux increase the total inductance of the transformer primary and secondary and, accordingly, its short-circuit reactances. It follows that such a change in reactance may be used to detect displaced or damaged windings. The fact that these movements of the windings increase the magnetic flux is in accordance with Law 1, which states that the magnetic circuit tends to conform itself so that the magnetic flux is a maximum.
14.3.2 Shell-Type Transformers In the shell-type transformer, Figure 8(a), the windings usually consist of interleaved rectangular pancake coils, which are alternately primary and secondary so that there are axial forces of repulsion between them. The mutual flux, φm, and the leakage fluxes, φ. between the coils are shown. In the manner shown in Figure 3, if the coils are forced apart, the leakage flux and, hence, the internal reactance is increased. This type of design has the inherent advantage that both the radial and the axial forces acting on the portion of the winding enclosed within the core are restrained by the core itself Winding displacement shell-type transformer and leakage flux
FIGURE 8 The portions of the windings which protrude beyond the ends of the core, Figure 8(b), are vulnerable to the short-circuit forces, particularly the axial ones, which tend to force them
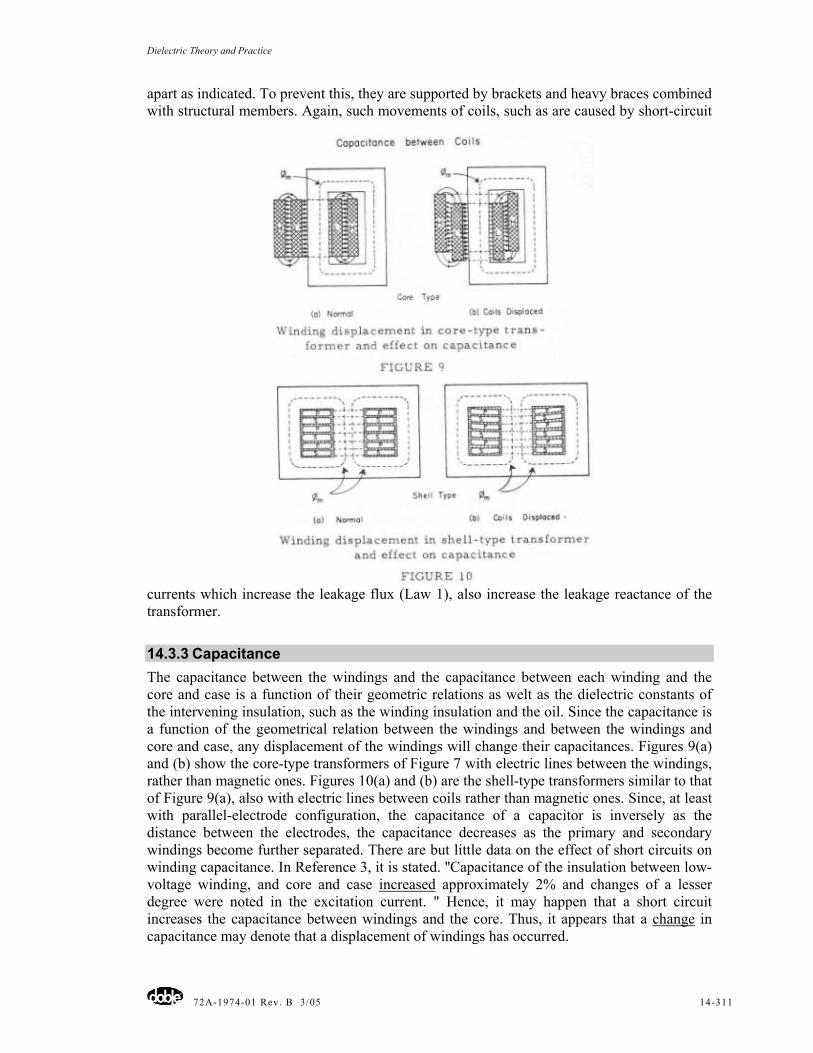
Dielectric Theory and Practice
72A-1974-01 Rev. B 3/05 14-311
apart as indicated. To prevent this, they are supported by brackets and heavy braces combined with structural members. Again, such movements of coils, such as are caused by short-circuit
currents which increase the leakage flux (Law 1), also increase the leakage reactance of the transformer.
14.3.3 Capacitance The capacitance between the windings and the capacitance between each winding and the core and case is a function of their geometric relations as welt as the dielectric constants of the intervening insulation, such as the winding insulation and the oil. Since the capacitance is a function of the geometrical relation between the windings and between the windings and core and case, any displacement of the windings will change their capacitances. Figures 9(a) and (b) show the core-type transformers of Figure 7 with electric lines between the windings, rather than magnetic ones. Figures 10(a) and (b) are the shell-type transformers similar to that of Figure 9(a), also with electric lines between coils rather than magnetic ones. Since, at least with parallel-electrode configuration, the capacitance of a capacitor is inversely as the distance between the electrodes, the capacitance decreases as the primary and secondary windings become further separated. There are but little data on the effect of short circuits on winding capacitance. In Reference 3, it is stated. ''Capacitance of the insulation between low-voltage winding, and core and case increased approximately 2% and changes of a lesser degree were noted in the excitation current. " Hence, it may happen that a short circuit increases the capacitance between windings and the core. Thus, it appears that a change in capacitance may denote that a displacement of windings has occurred.
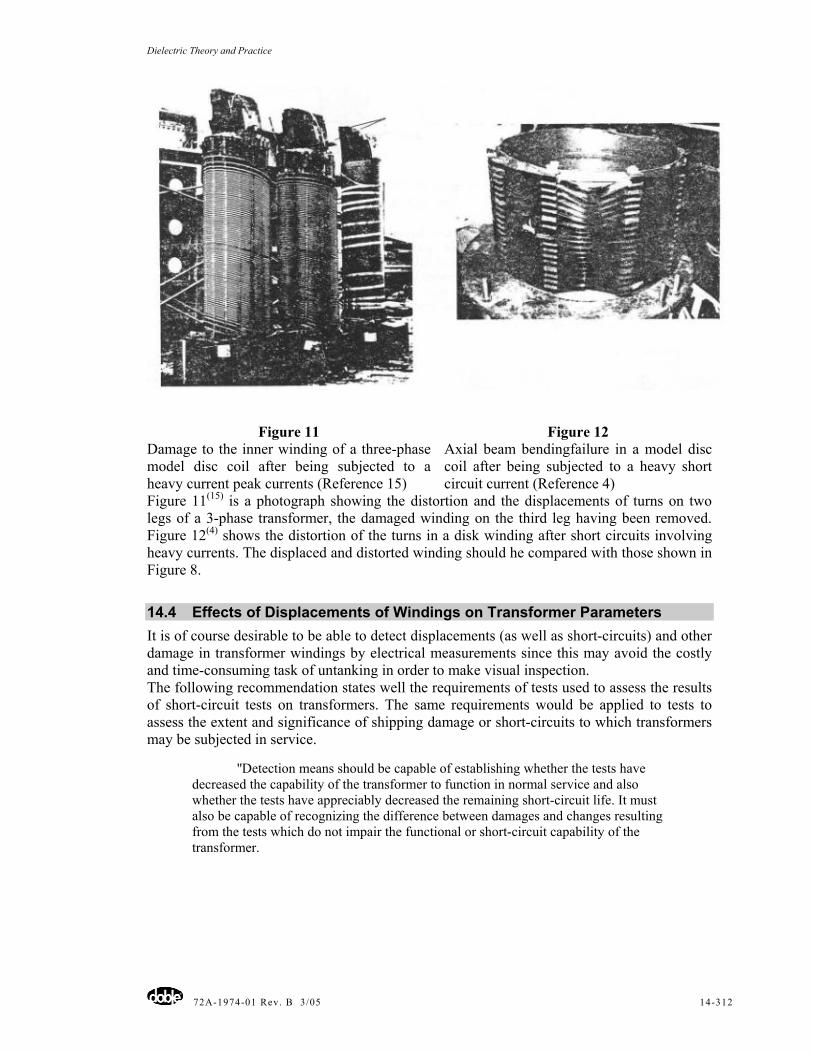
Dielectric Theory and Practice
72A-1974-01 Rev. B 3/05 14-312
Figure 11(15) is a photograph showing the distortion and the displacements of turns on two legs of a 3-phase transformer, the damaged winding on the third leg having been removed. Figure 12(4) shows the distortion of the turns in a disk winding after short circuits involving heavy currents. The displaced and distorted winding should he compared with those shown in Figure 8.
14.4 Effects of Displacements of Windings on Transformer Parameters It is of course desirable to be able to detect displacements (as well as short-circuits) and other damage in transformer windings by electrical measurements since this may avoid the costly and time-consuming task of untanking in order to make visual inspection. The following recommendation states well the requirements of tests used to assess the results of short-circuit tests on transformers. The same requirements would be applied to tests to assess the extent and significance of shipping damage or short-circuits to which transformers may be subjected in service.
''Detection means should be capable of establishing whether the tests have decreased the capability of the transformer to function in normal service and also whether the tests have appreciably decreased the remaining short-circuit life. It must also be capable of recognizing the difference between damages and changes resulting from the tests which do not impair the functional or short-circuit capability of the transformer.
Figure 11 Damage to the inner winding of a three-phase model disc coil after being subjected to a heavy current peak currents (Reference 15)
Figure 12 Axial beam bendingfailure in a model disc coil after being subjected to a heavy short circuit current (Reference 4)
Dielectric Theory and Practice
72A-1974-01 Rev. B 3/05 14-313
14.5 Diagnostic Methods for Damage Detection Below are given the different diagnostic methods that are either in use or are being tried or are being proposed. A brief description of each method is given, together with its limitations and examples of damage which have been successfully detected.
1. Change in exciting current (References 21 - 25). 2. Ratio and polarity test. 3. Change in effective resistance 4. Change in watts and power factor of windings (Reference 25). 5. Change in mutual inductance (or reactance) between windings. 6. Change in short-circuit impedance. 7. Change in capacitance (Reference 3). 8. Impulse Tests, including low-voltage impulse (LVI) (References 26 - 33). 9. Resonance at high frequencies (References 34 - 37).
A most helpful contribution to the detection of winding damage is given in a paper by R. I. Tudor(25). Three identical 5, 000 kVA, 69 kV to 2, 400/4, 160 Y 3-phase transformers were tested; and, in addition to the exciting current, the watts loss and the power factor of the windings, as well as that of the insulation, were measured. The results of the tests are given in Table I. The respective numbers of the transformers were 2714 - (172-173-174), given at the column headings.The connections for the first three tests are given in Figure A and those for the second three tests are given in Figure B. Also, from the data, the effective resistance, Re = (P/I2) (105), was computed. Because the pattern of the exciting current of No. 173 did not fit that of the other two windings, the transformer was untanked and a turn-to-turn short circuit was found in the Hl-H3 winding. After repair, a new series of the same tests was made, the results of which are also given in Table I. The pattern of the exciting current as well as that of the other quantities row became similar to those of the other two transformers. For example, before repair, the values of watts and effective resistance. Re, were abnormal, but after repair, became normal. Also, after repairs, the power factor of the insulation became about 55°%o and 40% of their values before repairs. Further, it will be noted that when either terminal, H1 or H3, is energized, winding Hl - H3 becomes a predominant parameter in the measuring circuit. Also, under these conditions, before repairs have been made, the greatest discrepancies occur between the value of exciting current, watts, etc. for transformer 2, 714, 173, and their normal values for the other transformers. Accordingly, this indicated that the short circuit must have occurred in the H1 -
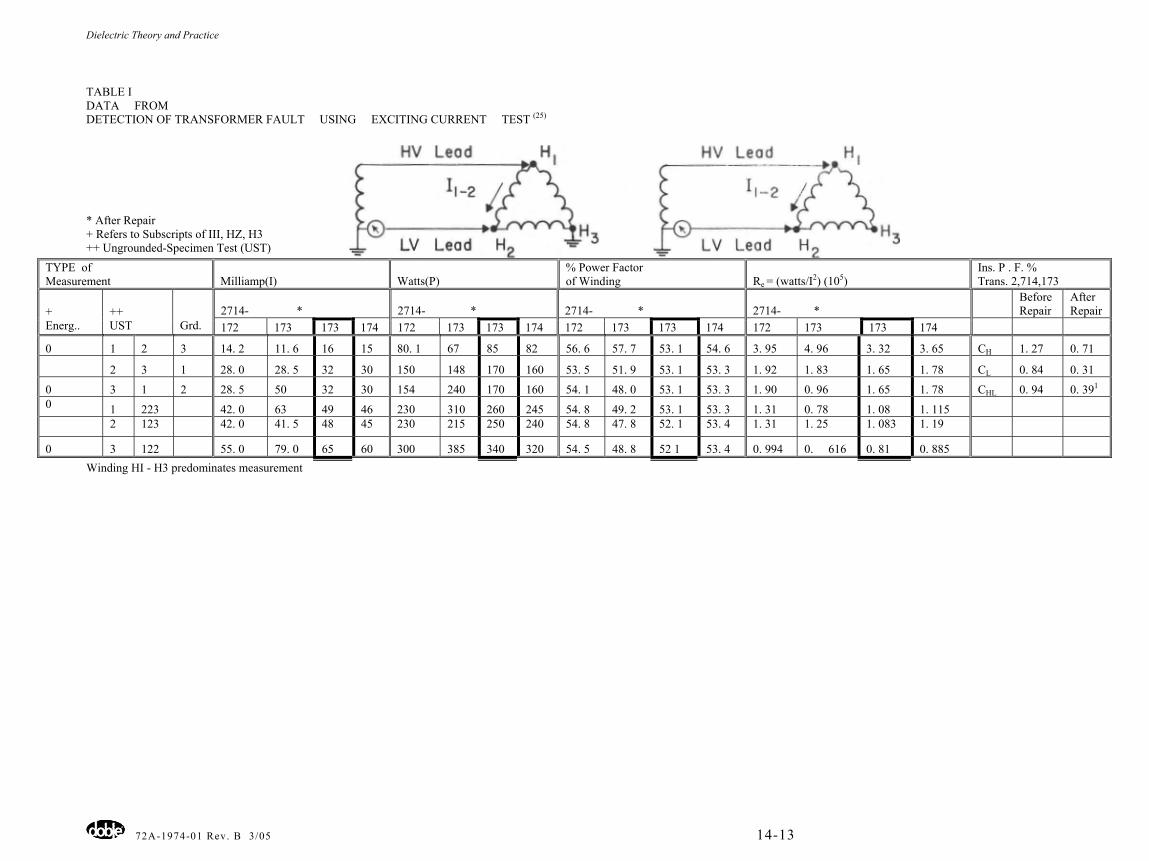
Dielectric Theory and Practice
72A-1974-01 Rev. B 3/05 14-13
TABLE I DATA FROM DETECTION OF TRANSFORMER FAULT USING EXCITING CURRENT TEST (25) * After Repair + Refers to Subscripts of III, HZ, H3 ++ Ungrounded-Specimen Test (UST)
Winding HI - H3 predominates measurement
TYPE of Measurement Milliamp(I) Watts(P)
% Power Factor of Winding Re = (watts/I2) (105)
Ins. P . F. % Trans. 2,714,173
2714- * 2714- * 2714- * 2714- * BeforeRepair
After Repair +
Energ.. ++ UST Grd. 172 173 173 174 172 173 173 174 172 173 173 174 172 173 173 174
0 1 2 3 14. 2 11. 6 16 15 80. 1 67 85 82 56. 6 57. 7 53. 1 54. 6 3. 95 4. 96 3. 32 3. 65 CH 1. 27 0. 71
2 3 1 28. 0 28. 5 32 30 150 148 170 160 53. 5 51. 9 53. 1 53. 3 1. 92 1. 83 1. 65 1. 78 CL 0. 84 0. 31
0 3 1 2 28. 5 50 32 30 154 240 170 160 54. 1 48. 0 53. 1 53. 3 1. 90 0. 96 1. 65 1. 78 CHL 0. 94 0. 391 0 1 223 42. 0 63 49 46 230 310 260 245 54. 8 49. 2 53. 1 53. 3 1. 31 0. 78 1. 08 1. 115 2 123 42. 0 41. 5 48 45 230 215 250 240 54. 8 47. 8 52. 1 53. 4 1. 31 1. 25 1. 083 1. 19
0 3 122 55. 0 79. 0 65 60 300 385 340 320 54. 5 48. 8 52 1 53. 4 0. 994 0. 616 0. 81 0. 885
Dielectric Theory and Practice
72A-1974-01 Rev. B 3/05 8-21
H3 winding, which, as stated above, proved to be the case. Although these tests had detected a short-circuited turn rather than coil displacement, they do show the effectiveness of the different measured quantities in detecting an abnormality in transformer windings. 1. Exciting (Excitation) Current. The exciting current constitutes from 1/2 to 3 percent of the normal rated current of a transformer. The test comprises the simple measurement of the no-load current of a transformer. For purposes of comparison the current is frequently adjusted to some standard value of voltage. such as 10 kV. An unusually high value or a significant increase from its normal value will often result from damage and other abnormalities in the windings. For example, short-circuited turns in the excitation winding will reduce the impedance and increase the current, power and power factors. A short circuit in a winding other than the one to which the voltage is applied acts the same as any secondary winding and reflects as an extra load on the primary and, accordingly, produces an increase in the exciting current. In a three-phase transformer bank or in three-phase transformers, the pattern of the exciting current of one transformer may be compared with those of the other transformers as was done in connection with Table I. The fact that the pattern of the exciting current in Transformer 2. 714. 173 differed from the others resulted in the discovery of a short circuited turn. A change in the exciting current detected an attempt of a low-voltage winding to telescope following a lightning storm(23). Also. the clamping and the blocking of the winding were damaged and a shifting of the turns of the winding occurred. In another instance, the value of exciting current detected impact damage to a transformer during shipment(24). When the exciting current is only a small fraction, from 1-1/2 to 3 percent of the rated transformer current, and its magnitude is limited to 200 ma ac with Doble -type MH Set, its value may be affected by the residual magnetism remaining in the transformer core. This effect is described and discussed in Reference (23). In making this test one should be certain that any residual magnetism has not introduced error into the measurement. It is well known that the exciting current for the winding on the middle leg of a 3-phase transformer is much less than that for the other two windings(21), due to the fact that the reluctance of the magnetic circuit for the winding on the middle leg is less than that for the other two windings. The conclusion of R. I. Tudor(25) is that the exciting current test is of value with three-phase transformers and is performed routinely when a standard Doble test is made. (At a symposium on transformer short circuit strength at the Winter Power Meeting, 1970, the Bonneville Power Administration recommended that for evaluation purposes the excitation current shall not be changed more than 4%. ) 2.Ratio and Polarity Test. This is usually a part of a routine transformer test and it is particularly significant when searching or diagnosing for damage or displacement of windings. Unless an open or short circuit is involved, a greater displacement would have little effect on the ratio and none on the polarity. 3. Effective Resistance. If the resistance of a passive electric circuit is measured with alternating current, it is found to be greater than when measured with direct current. If the circuit includes a coil energizing an iron core, the discrepancy becomes very much greater. With alternating current, there is skin effect in which included emfs within the conductor force the current to the outside, thus, reducing the effective area of the conductor and, hence, increasing its resistance. With an iron core, there are eddy-current and hysteresis losses. These have the effect of increasing the ac resistance. This greater resistance occurring with alternating current is called the effective resistance. The power loss,
,wattsRIP e2= (14)
Where I is the current. The effectiveresistance, .ohmsI/PR 2
e = (15)
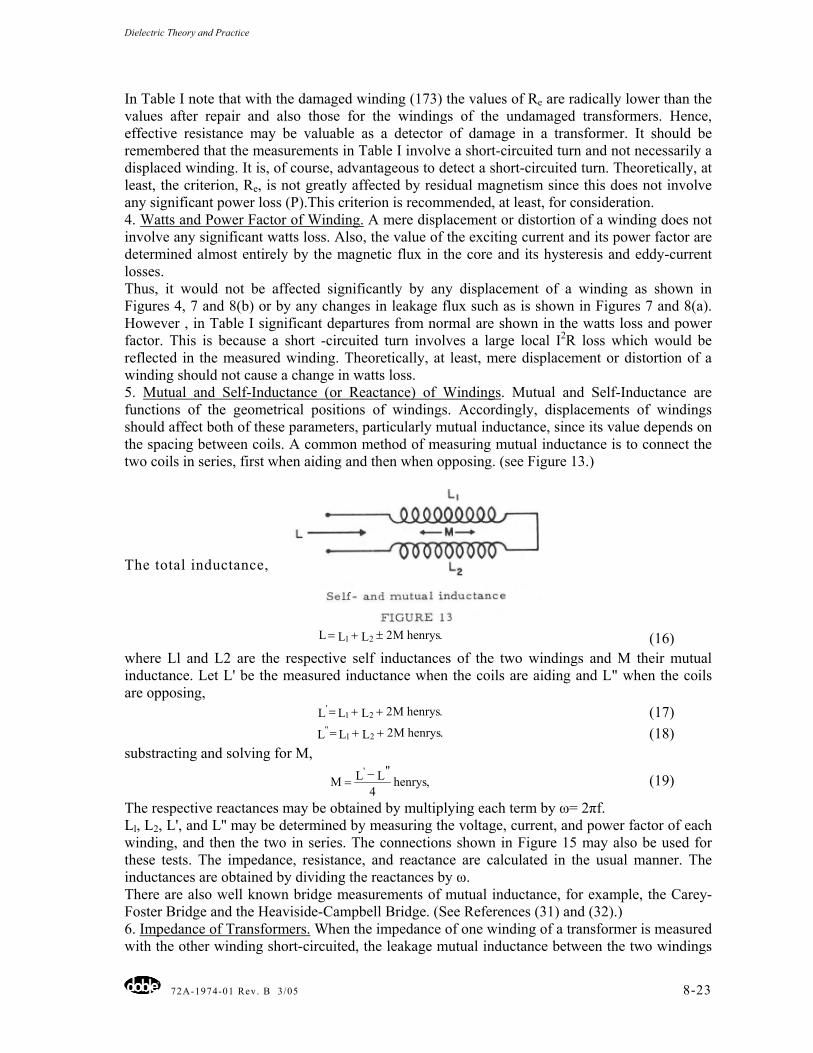
Dielectric Theory and Practice
72A-1974-01 Rev. B 3/05 8-23
In Table I note that with the damaged winding (173) the values of Re are radically lower than the values after repair and also those for the windings of the undamaged transformers. Hence, effective resistance may be valuable as a detector of damage in a transformer. It should be remembered that the measurements in Table I involve a short-circuited turn and not necessarily a displaced winding. It is, of course, advantageous to detect a short-circuited turn. Theoretically, at least, the criterion, Re, is not greatly affected by residual magnetism since this does not involve any significant power loss (P).This criterion is recommended, at least, for consideration. 4. Watts and Power Factor of Winding. A mere displacement or distortion of a winding does not involve any significant watts loss. Also, the value of the exciting current and its power factor are determined almost entirely by the magnetic flux in the core and its hysteresis and eddy-current losses. Thus, it would not be affected significantly by any displacement of a winding as shown in Figures 4, 7 and 8(b) or by any changes in leakage flux such as is shown in Figures 7 and 8(a). However , in Table I significant departures from normal are shown in the watts loss and power factor. This is because a short -circuited turn involves a large local I2R loss which would be reflected in the measured winding. Theoretically, at least, mere displacement or distortion of a winding should not cause a change in watts loss. 5. Mutual and Self-Inductance (or Reactance) of Windings. Mutual and Self-Inductance are functions of the geometrical positions of windings. Accordingly, displacements of windings should affect both of these parameters, particularly mutual inductance, since its value depends on the spacing between coils. A common method of measuring mutual inductance is to connect the two coils in series, first when aiding and then when opposing. (see Figure 13.) The total inductance,
.henrysM2LLL 21 ±+= (16)where Ll and L2 are the respective self inductances of the two windings and M their mutual inductance. Let L' be the measured inductance when the coils are aiding and L" when the coils are opposing,
.henrysM2LLL 21' ++= (17)
.henrysM2LLL 21" ++= (18)
substracting and solving for M,
,henrys4
L"LM' −
= (19)
The respective reactances may be obtained by multiplying each term by ω= 2πf. Ll, L2, L', and L'' may be determined by measuring the voltage, current, and power factor of each winding, and then the two in series. The connections shown in Figure 15 may also be used for these tests. The impedance, resistance, and reactance are calculated in the usual manner. The inductances are obtained by dividing the reactances by ω. There are also well known bridge measurements of mutual inductance, for example, the Carey-Foster Bridge and the Heaviside-Campbell Bridge. (See References (31) and (32).) 6. Impedance of Transformers. When the impedance of one winding of a transformer is measured with the other winding short-circuited, the leakage mutual inductance between the two windings
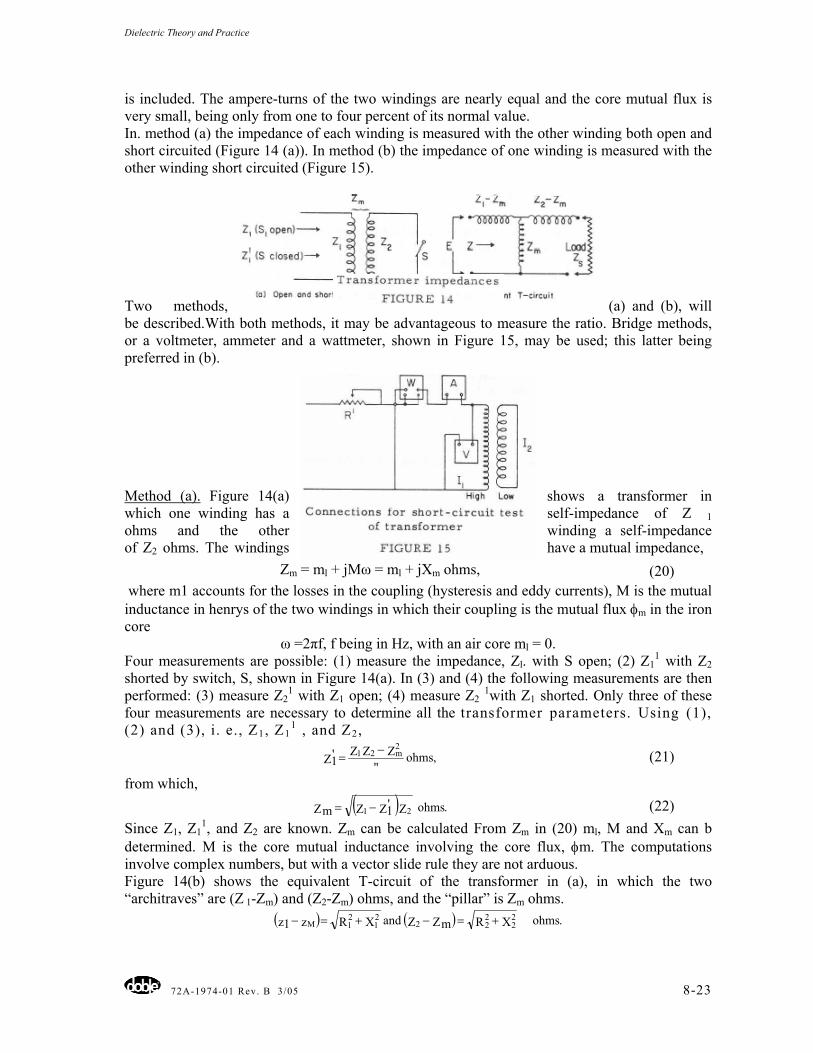
Dielectric Theory and Practice
72A-1974-01 Rev. B 3/05 8-23
is included. The ampere-turns of the two windings are nearly equal and the core mutual flux is very small, being only from one to four percent of its normal value. In. method (a) the impedance of each winding is measured with the other winding both open and short circuited (Figure 14 (a)). In method (b) the impedance of one winding is measured with the other winding short circuited (Figure 15). Two methods, (a) and (b), will be described.With both methods, it may be advantageous to measure the ratio. Bridge methods, or a voltmeter, ammeter and a wattmeter, shown in Figure 15, may be used; this latter being preferred in (b).
Method (a). Figure 14(a) shows a transformer in which one winding has a self-impedance of Z 1 ohms and the other winding a self-impedance of Z2 ohms. The windings have a mutual impedance,
Zm = ml + jMω = ml + jXm ohms, (20) where m1 accounts for the losses in the coupling (hysteresis and eddy currents), M is the mutual inductance in henrys of the two windings in which their coupling is the mutual flux φm in the iron core
ω =2πf, f being in Hz, with an air core ml = 0. Four measurements are possible: (1) measure the impedance, Zl. with S open; (2) Z1
1 with Z2 shorted by switch, S, shown in Figure 14(a). In (3) and (4) the following measurements are then performed: (3) measure Z2
1 with Z1 open; (4) measure Z2 1with Z1 shorted. Only three of these four measurements are necessary to determine all the transformer parameters. Using (1), (2) and (3), i. e., Z1, Z1
1 , and Z2,
,ohms"
ZZZZ'12m21 −
= (21)
from which, )( .ohmsZZ'1ZZm 21 −= (22)
Since Z1, Z11, and Z2 are known. Zm can be calculated From Zm in (20) ml, M and Xm can b
determined. M is the core mutual inductance involving the core flux, φm. The computations involve complex numbers, but with a vector slide rule they are not arduous. Figure 14(b) shows the equivalent T-circuit of the transformer in (a), in which the two “architraves” are (Z 1-Zm) and (Z2-Zm) ohms, and the “pillar” is Zm ohms.
( ) ( ) .ohmsXRZmZandXRzz1 22
222
21
21M +=−+=−
Dielectric Theory and Practice
72A-1974-01 Rev. B 3/05 8-23
where Rl and R2 are the respective effective resistances of the two windings and Xl and X2 their leakage reactance. Since R1 and R2 can be measured, the primary and secondary leakage reactances, X1 and X2, can then be readily calculated. The equivalent reactance referred to either winding is obtained with either equation (3) or (4). With a load, Zs, applied to the secondary from (21), the impedance at the primary terminals, Method (b). This method is the one usually employed in testing power transformers. On Pages 3 and 4 the equivalent resistance, reactance and impedance of a transformer are described and defined. These quantities can be determined by a simple short-circuit test which is the same as that used for determining either Z1 or Z2 in Method (a).
( ).ohms
z
z zzszZs
2ms2
2
1
+
−+= (23)
The impedance of one winding is measured with the other short circuited. The short-circuit impedance drop is from 2 to 10 percent of rated voltage, so that the winding on which the measurement is made is that in which its impedance drop is most convenient relative to the available voltage supply. For example, consider a 40 MVA, 230/66 kV transformer with 5 percent impedance. The test would be made on the low voltage winding. The short-circuit voltage,
.volts300,3000,6605.0E8 =×= This would be adapted to a 2, 300 volt supply, although adequate values could probably be obtained with a voltage as low as 220 volts. The connections for making the test are shown in Figure 15. A series resistor st h as R' is usually necessary to control the current. The equivalent short-circuit impedance referred to the primary, (See Equations (1) to (10).),
.ohmsI/Vz 101 = (24)ZOl is equivalent to Z1
1 in Method (a). The corresponding equivalent resistance,
.ohmI/PR 2101 = (25)
where P is the power measured by wattmeter, W. The corresponding equivalent leakage reactance,
.ohmsRzx 201
20101 −= (26)
X 0l includes the primary leakage reactance, X1. The secondary leakage reactance X2, referred to the primary, X2 = (N2/Nl)2X1 and the mutual leakage inductance also are included. (Pages 3 and 4) In this method the individual reactance of each winding and the mutual leakage inductance or reactance cannot be determined as in Method (a). X01 and X02 include the leakage reactance of each winding as well as their mutual leakage reactance. When the leakage reactance of one winding is required, it is usually sufficiently accurate to employ one-half its respective equivalent reactance, i. e. X01/2
. It is shown in Figures 7 and 8 that. any displacement between the primary and secondary windings changes the leakage flux and, in the same proportion, the leakage reactance, which then can be criterion of displacement or distortion. Since mutual inductance depends on the spacing between the windings, it should be a more sensitive criterion than equivalent reactance (X01 or X02). It is a component of X01 (or X02), probably a small one, so that a given change in its value will produce a much smaller proportionate one in the total value of XOl or X02. The several quantities, Z0l. R0l. X01, etc. , are used in calculating the transformer performance such as regulation, power factor, efficiency, short-circuit current, etc. They are also used in the construction of the well known transformer phasor diagram.
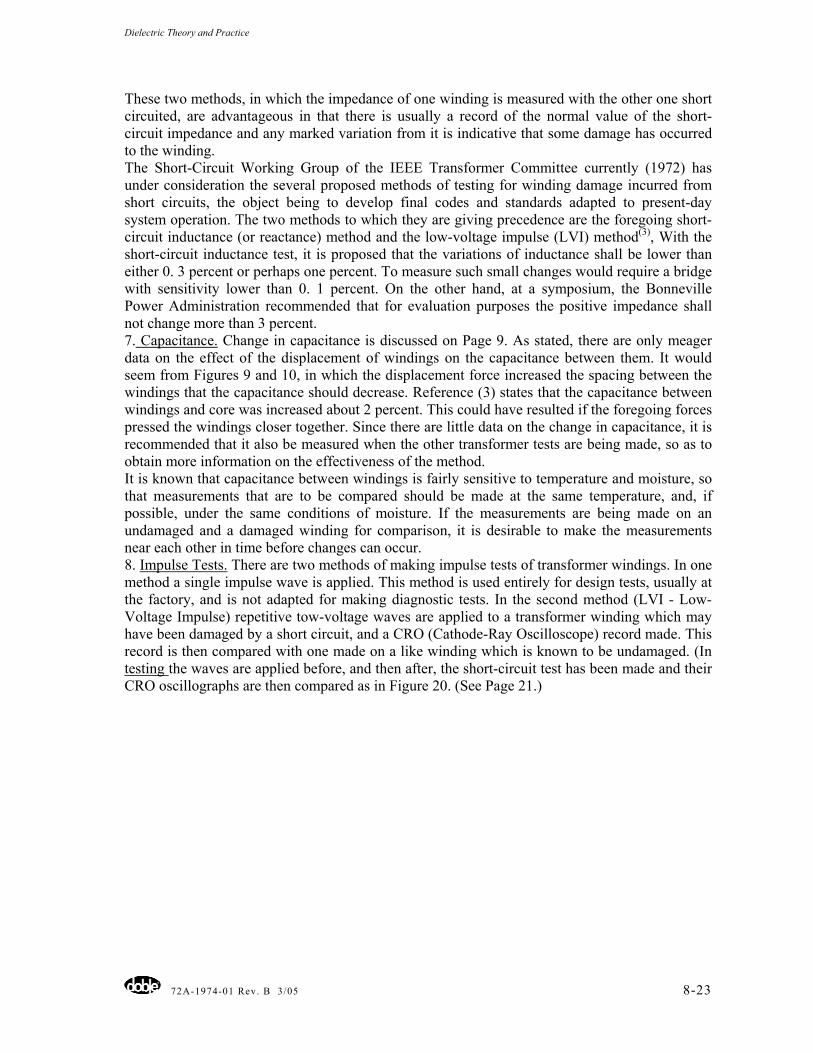
Dielectric Theory and Practice
72A-1974-01 Rev. B 3/05 8-23
These two methods, in which the impedance of one winding is measured with the other one short circuited, are advantageous in that there is usually a record of the normal value of the short-circuit impedance and any marked variation from it is indicative that some damage has occurred to the winding. The Short-Circuit Working Group of the IEEE Transformer Committee currently (1972) has under consideration the several proposed methods of testing for winding damage incurred from short circuits, the object being to develop final codes and standards adapted to present-day system operation. The two methods to which they are giving precedence are the foregoing short-circuit inductance (or reactance) method and the low-voltage impulse (LVI) method(3), With the short-circuit inductance test, it is proposed that the variations of inductance shall be lower than either 0. 3 percent or perhaps one percent. To measure such small changes would require a bridge with sensitivity lower than 0. 1 percent. On the other hand, at a symposium, the Bonneville Power Administration recommended that for evaluation purposes the positive impedance shall not change more than 3 percent. 7. Capacitance. Change in capacitance is discussed on Page 9. As stated, there are only meager data on the effect of the displacement of windings on the capacitance between them. It would seem from Figures 9 and 10, in which the displacement force increased the spacing between the windings that the capacitance should decrease. Reference (3) states that the capacitance between windings and core was increased about 2 percent. This could have resulted if the foregoing forces pressed the windings closer together. Since there are little data on the change in capacitance, it is recommended that it also be measured when the other transformer tests are being made, so as to obtain more information on the effectiveness of the method. It is known that capacitance between windings is fairly sensitive to temperature and moisture, so that measurements that are to be compared should be made at the same temperature, and, if possible, under the same conditions of moisture. If the measurements are being made on an undamaged and a damaged winding for comparison, it is desirable to make the measurements near each other in time before changes can occur. 8. Impulse Tests. There are two methods of making impulse tests of transformer windings. In one method a single impulse wave is applied. This method is used entirely for design tests, usually at the factory, and is not adapted for making diagnostic tests. In the second method (LVI - Low-Voltage Impulse) repetitive tow-voltage waves are applied to a transformer winding which may have been damaged by a short circuit, and a CRO (Cathode-Ray Oscilloscope) record made. This record is then compared with one made on a like winding which is known to be undamaged. (In testing the waves are applied before, and then after, the short-circuit test has been made and their CRO oscillographs are then compared as in Figure 20. (See Page 21.)
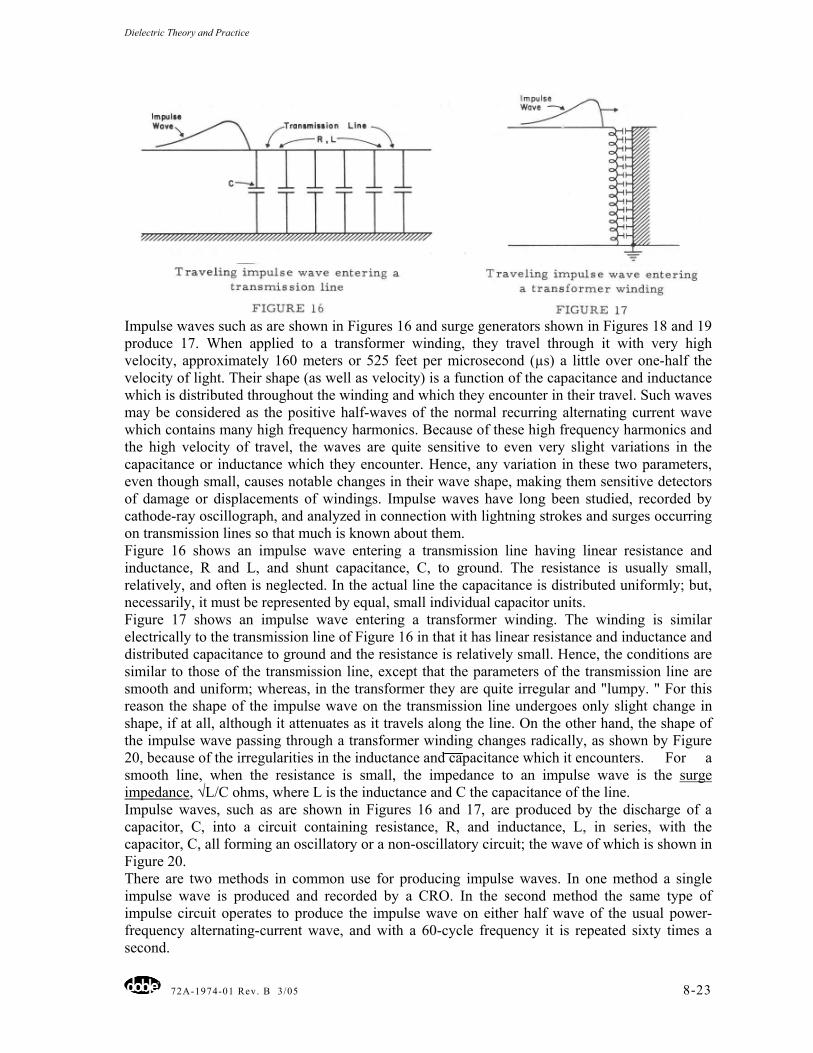
Dielectric Theory and Practice
72A-1974-01 Rev. B 3/05 8-23
Impulse waves such as are shown in Figures 16 and surge generators shown in Figures 18 and 19 produce 17. When applied to a transformer winding, they travel through it with very high velocity, approximately 160 meters or 525 feet per microsecond (µs) a little over one-half the velocity of light. Their shape (as well as velocity) is a function of the capacitance and inductance which is distributed throughout the winding and which they encounter in their travel. Such waves may be considered as the positive half-waves of the normal recurring alternating current wave which contains many high frequency harmonics. Because of these high frequency harmonics and the high velocity of travel, the waves are quite sensitive to even very slight variations in the capacitance or inductance which they encounter. Hence, any variation in these two parameters, even though small, causes notable changes in their wave shape, making them sensitive detectors of damage or displacements of windings. Impulse waves have long been studied, recorded by cathode-ray oscillograph, and analyzed in connection with lightning strokes and surges occurring on transmission lines so that much is known about them. Figure 16 shows an impulse wave entering a transmission line having linear resistance and inductance, R and L, and shunt capacitance, C, to ground. The resistance is usually small, relatively, and often is neglected. In the actual line the capacitance is distributed uniformly; but, necessarily, it must be represented by equal, small individual capacitor units. Figure 17 shows an impulse wave entering a transformer winding. The winding is similar electrically to the transmission line of Figure 16 in that it has linear resistance and inductance and distributed capacitance to ground and the resistance is relatively small. Hence, the conditions are similar to those of the transmission line, except that the parameters of the transmission line are smooth and uniform; whereas, in the transformer they are quite irregular and "lumpy. " For this reason the shape of the impulse wave on the transmission line undergoes only slight change in shape, if at all, although it attenuates as it travels along the line. On the other hand, the shape of the impulse wave passing through a transformer winding changes radically, as shown by Figure 20, because of the irregularities in the inductance and capacitance which it encounters. For a smooth line, when the resistance is small, the impedance to an impulse wave is the surge impedance, √L/C ohms, where L is the inductance and C the capacitance of the line. Impulse waves, such as are shown in Figures 16 and 17, are produced by the discharge of a capacitor, C, into a circuit containing resistance, R, and inductance, L, in series, with the capacitor, C, all forming an oscillatory or a non-oscillatory circuit; the wave of which is shown in Figure 20. There are two methods in common use for producing impulse waves. In one method a single impulse wave is produced and recorded by a CRO. In the second method the same type of impulse circuit operates to produce the impulse wave on either half wave of the usual power-frequency alternating-current wave, and with a 60-cycle frequency it is repeated sixty times a second.
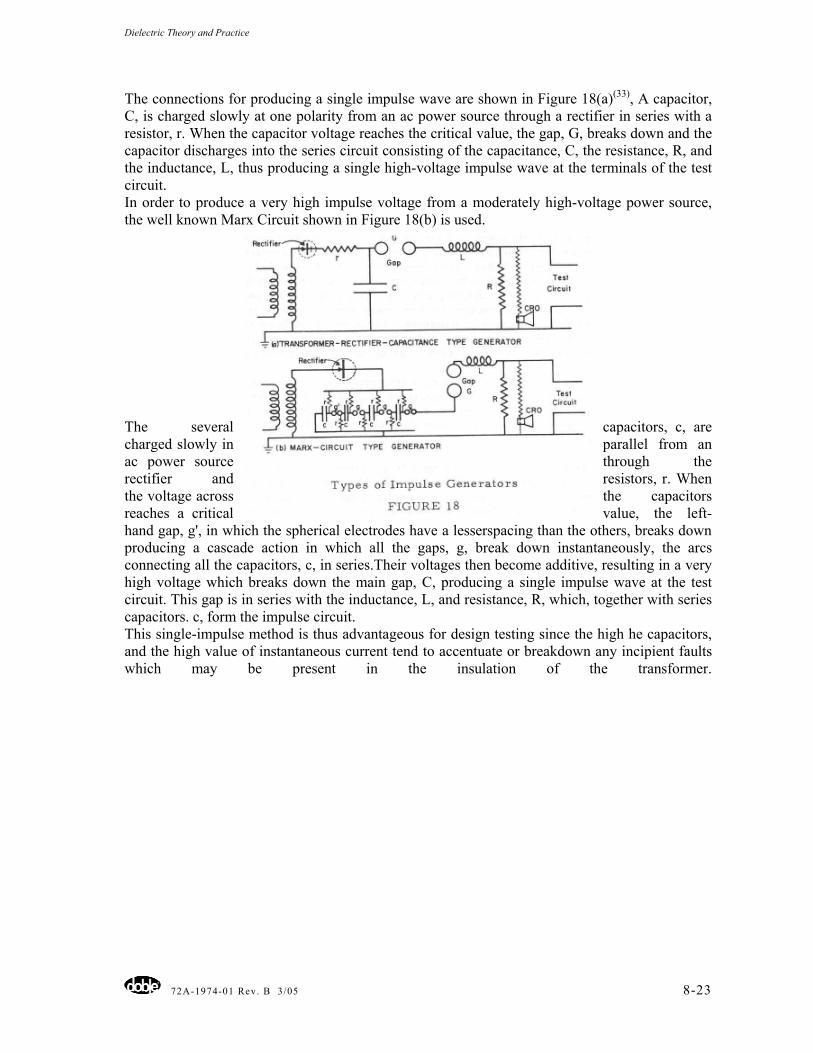
Dielectric Theory and Practice
72A-1974-01 Rev. B 3/05 8-23
The connections for producing a single impulse wave are shown in Figure 18(a)(33), A capacitor, C, is charged slowly at one polarity from an ac power source through a rectifier in series with a resistor, r. When the capacitor voltage reaches the critical value, the gap, G, breaks down and the capacitor discharges into the series circuit consisting of the capacitance, C, the resistance, R, and the inductance, L, thus producing a single high-voltage impulse wave at the terminals of the test circuit. In order to produce a very high impulse voltage from a moderately high-voltage power source, the well known Marx Circuit shown in Figure 18(b) is used. The several capacitors, c, are charged slowly in parallel from an ac power source through the rectifier and resistors, r. When the voltage across the capacitors reaches a critical value, the left-hand gap, g', in which the spherical electrodes have a lesserspacing than the others, breaks down producing a cascade action in which all the gaps, g, break down instantaneously, the arcs connecting all the capacitors, c, in series.Their voltages then become additive, resulting in a very high voltage which breaks down the main gap, C, producing a single impulse wave at the test circuit. This gap is in series with the inductance, L, and resistance, R, which, together with series capacitors. c, form the impulse circuit. This single-impulse method is thus advantageous for design testing since the high he capacitors, and the high value of instantaneous current tend to accentuate or breakdown any incipient faults which may be present in the insulation of the transformer.
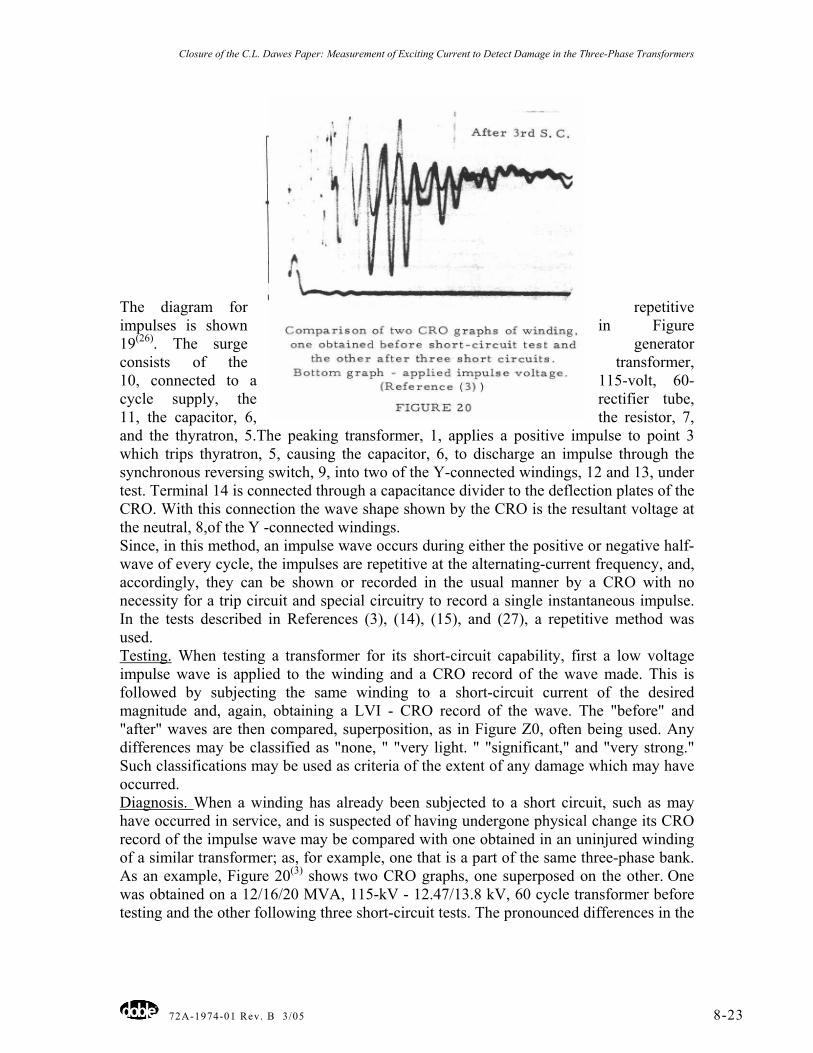
Closure of the C.L. Dawes Paper: Measurement of Exciting Current to Detect Damage in the Three-Phase Transformers
72A-1974-01 Rev. B 3/05 8-23
The diagram for repetitive impulses is shown in Figure 19(26). The surge generator consists of the transformer, 10, connected to a 115-volt, 60-cycle supply, the rectifier tube, 11, the capacitor, 6, the resistor, 7, and the thyratron, 5.The peaking transformer, 1, applies a positive impulse to point 3 which trips thyratron, 5, causing the capacitor, 6, to discharge an impulse through the synchronous reversing switch, 9, into two of the Y-connected windings, 12 and 13, under test. Terminal 14 is connected through a capacitance divider to the deflection plates of the CRO. With this connection the wave shape shown by the CRO is the resultant voltage at the neutral, 8,of the Y -connected windings. Since, in this method, an impulse wave occurs during either the positive or negative half-wave of every cycle, the impulses are repetitive at the alternating-current frequency, and, accordingly, they can be shown or recorded in the usual manner by a CRO with no necessity for a trip circuit and special circuitry to record a single instantaneous impulse. In the tests described in References (3), (14), (15), and (27), a repetitive method was used. Testing. When testing a transformer for its short-circuit capability, first a low voltage impulse wave is applied to the winding and a CRO record of the wave made. This is followed by subjecting the same winding to a short-circuit current of the desired magnitude and, again, obtaining a LVI - CRO record of the wave. The "before" and "after" waves are then compared, superposition, as in Figure Z0, often being used. Any differences may be classified as "none, " "very light. " "significant," and "very strong." Such classifications may be used as criteria of the extent of any damage which may have occurred. Diagnosis. When a winding has already been subjected to a short circuit, such as may have occurred in service, and is suspected of having undergone physical change its CRO record of the impulse wave may be compared with one obtained in an uninjured winding of a similar transformer; as, for example, one that is a part of the same three-phase bank. As an example, Figure 20(3) shows two CRO graphs, one superposed on the other. One was obtained on a 12/16/20 MVA, 115-kV - 12.47/13.8 kV, 60 cycle transformer before testing and the other following three short-circuit tests. The pronounced differences in the
Closure of the C.L. Dawes Paper: Measurement of Exciting Current to Detect Damage in the Three-Phase Transformers
72A-1974-01 Rev. B 3/05 8-23
two graphs showed conclusively that the position of the winding had changed. The bottom graph is that of the applied impulse voltage. 9. Resonance at High Frequencies. Resonance in a winding occurring at high frequency has been suggested for the detection displaced windings. Transformer windings
naturally have inductance and, as is shown in Figure 17, there is capacitance distributed between these windings and ground, as well as between the windings themselves. Also, when inductance and capacitance are present in electrical circuits and systems, there are potential resonant conditions. With the usual simple circuit with resistance inductance and capacitance, there is but a single resonant frequency which is apparent when one tunes a radio set. However, with a complex distribution of inductance and capacitance, several resonant frequencies can occur.This is shown in References (34) and (37) in which are given the several natural frequencies occurring in different types of windings. The preponderance occurs between 10 and 100 kilohertz, but under some conditions there are isolated cases where the frequency is much higher. Since short-circuit currents can alter the physical position of the coils and windings, it also causes changes in their inductance and capacitance, as is already shown. Since the resonant frequency, fo =1 /(2 π √LC), it will also be changed. Hence, a change in the resonant frequency of an undamaged coil after it has been subjected to a large short-circuit current is indicative of displacement or damage and, thus, is a possible diagnostic method. Aside from a change in the frequency, a damaged coil may produce a change in wave shape, as with the low-voltage impulse test. In making the test, a high-power tuneable oscillator would be necessary. A suggested procedure is to apply variable high frequencies to an undamaged winding and determine its resonant frequency or frequencies. This test could then be repeated on the winding after a short circuit test to note any change in the resonant frequency or frequencies. The records show that so far this method has had little actual application. However, H. C. Barnes of the American Electric Power Service Company, when speaking before a symposium of international power engineers in Sweden, August 1971, stated the following:
"Investigation of the transformer failures revealed that their resonant frequency decreases as voltage increases. Resonant frequencies of 4 kHz and 8 kHz obtain for 765-kV transformers of two suppliers, as compared to 20 kHz or more at 345 kV. These lower frequencies appear to approximate those of waves generated by line-to-ground faults. Such faults may therefore trigger resonance, generating excessive internal voltages. Computations and actual current-injection tests both show that these internal voltages can attain levels up to 16 times normal between connection studs of the tap-changer, which is where the flashovers have occurred. " "Tests on 765 kV Line Enhance Outlook for UHV" - (Electrical World, September 1, 1971, Page 39).
Hence, it appears that natural frequencies for power transformers are in the kilocycle range, and specifically, in this instance, from 4 to 8 kHz for 765-kV transformers and 20 kHz or more for 345-kV transformers and are a possible diagnostic means for the detection of faulty windings. (Also see References (34) and (37) for natural frequencies of transformers.) Acknowledgements. The author is greatly indebted to Peter L. Bellaschi for keeping him informed of the most recent experiences with short circuits in the different power systems and also of the recommendations for short-circuit, testing and standards which are being
Closure of the C.L. Dawes Paper: Measurement of Exciting Current to Detect Damage in the Three-Phase Transformers
72A-1974-01 Rev. B 3/05 8-23
developed by transformer and related committees; and to Edmund H. Povey and Anthony L. Rickley for the constructive suggestions which they made during the preparation of this paper.
REFERENCES 1. Short-Circuit Capability and Testing of Power Transformers, " P. L. Bellaschi,
Minutes of the Thirty-Sixth Annual International Conference of Doble Clients, 1969, Sec. 6-101.
2 Power Transformer Failure Due to Short Circuit," A. H. Locke, loc. cit (1), Sec. 6-201.
3. Experience with Low Voltage Impulse Testing of Power Transformers, " E. 7. Rogers, D. A. Gillies and L. E. Humbard, Minutes of the Thirty-Sixth Annual International Conference of Doble Clients, 1969, Sec. 6-301.
4. Power Transformer Short-Circuit Strength, " W. J. McNutt, Minutes of the Thirty Eighth Annual International Conference of Doble Clients. 1971, Sec. 6-601.
5. Designing Transformers to Withstand Short Circuits, " R. J. Cossaart and R. L. Schwab, Minutes of the Thirty-Fifth Annual International Conference of Doble Clients, 1968, Sec. 6-601.
6. Power Transformer Thru-Fault Failures - No Short-Cut Solutions in Sight," J. A. Markes, Electric Light and Power, April 1971, Page 58.
7. Power Transformer Short-Circuit Strength-Requirements, Design and Demonstra-tion," W. J. McNutt, W. M. Johnson, R. A•. Nelson, R. E. Ayers, Trans. IEEE 1970 (Vol. 89), Page 1955.
8. High Power Systems - Utility Viewpoint of Recent and Future Fault Duty Requirements," J. Agosta and P. J. Bingen, Presented at IEEE Summer Meeting, Portland, Oregon, July 18 - 23, 1971.
9. The Short-Circuit Strength of the Inner Windings of Transformers Against Radial Forces,'' R. Boersma and J. Wildeboer, CIGRE 1962, Vol. 11, Paper 147.
10. Mechanical Forces in Interleaved Rectangular Pancake Transformer Coils," R. L. Bean and E. C. Wentz, Trans. AIEE 1954, (Vol. 73) (111 -B), Page 962.
11. Transformer Engineering, " Blume, (a book) Camilli, Boyajian & Montsinger, John Wiley & Sons.
12. A, Course in Electrical Engineering," (a book) Chester L. Dawes, Vol. II, Alternating Currents, 4th Edition, McGraw-Hill Book Company.
13. Transformer Short Circuit Standards and Tests," W. F. True and R. B. Pherson, Minutes of the Thirty-Eighth Annual International Conference of Doble Clients, 1971, Sec. 6-501.
14. Short-Circuit Testing of Transformers," C. E. M. de Kuijper, CIGRE 1968, Vol. I 12-01, Appendix 2, Page 11.
15. Short-Circuit Testing of Power Transformers and the Detection and Location of Damage, " M. Waters, J. C. Farr, A. Stalewski, J. D. Whitaker, CIGRE 1968, Vol. I 12-05.
16. Short-Circuit Testing of Distribution Transformers, " M. F. Beavers, C. M. Adams, I. E. Holcomb, Trans., AIEE 1962, (Vol. 81), Page 667.
17. Transformer Windings - Mechanical Strength Under Short-Circuit Currents Testing Procedure,'' Kurya, Trans., IEEE, 1969 (Vol. 88), Page 222.
Closure of the C.L. Dawes Paper: Measurement of Exciting Current to Detect Damage in the Three-Phase Transformers
72A-1974-01 Rev. B 3/05 8-23
18. Short Circuit Strength," J. T. Wilkins, High Voltage Transformer Conference, October 1964, "English Electric" Proceedings of Stafford, England.
19. The Short-Circuit Strength of Transformers, " Malcolm Waters (a book), MacDonald & Company, Ltd., London.
20. Transformer Exciting Current Measured with Doble Equipment," A. L. Rickley and R. E. Clark, Minutes of the Thirty-Fourth Annual International Conference of Doble Clients, 1967, Sec. 6-1001.
21. Transformer Exciting Current Measured with Doble Equipment (A Progress Report)," A. L. Rickley and R. E. Clark, Minutes of the Thirty-Fifth Annual International Conference of Doble Clients, 1968, Sec. 6-1001, Page 6-1003.
22. Transformer Exciting Current Measured with Doble Equipment (A Progress Re-port)," A. L. Rickley and R. E. Clark, Minutes of the Thirty-Sixth Annual International Conference of Doble Clients, 1969. Sec. 6-501.
23. Transformer Exciting Current Measured with Doble Equipment (A Progress Re-port),"A. L. Rickley and R. E. Clark, Minutes of the Thirty-Seventh Annual International Conference of Doble Clients, 1970, Sec. 6-1501.
24. Transformer Exciting Current Measured with Doble Equipment (A Progress Re-port)," A. L. Rickley and R. E. Clark. Minutes of the Thirty-Eighth Annual International Conference of Doble Clients, 1971, Sec. 6-1001, Page 6-1006.
25. Detection of Transformer Fault Using Exciting Current Test, " R. I. Tudor, Min-utes of the Thirty-Sixth Annual International Conference of Doble Clients, 1969,Sec. 6-401.
26. Insulation Testing of Electric Windings, "C. M. Foust and N. Rohats, Trans. AIEE 1943, (Vol. 62), Page 203.
27. Detecting Transformer Winding Damage by the Low Voltage Impulse Method, " M. Lech and L. Tyminski, Electrical Review, November 18, 1966.
28. Traveling Waves on Transmission Systems," (a book), L. V. Bewley, John Wiley and Sons, New York, 1933.
29. Transient Performance of Electric Power Systems," (a book), Reinhold Rudenberg, McGraw-Hill Book Company, (see pages 101-104).
30. Performances of Traveling Waves in Coils and Windings, " Reinhold Rudenberg, Trans. AIEE 1940, Vol. 59, Page 1031.
31. Applied Electrical Measurements, "(a book); I. F, Kinnard, John Wiley & Sons. 32.
32. Electrical Measurements;' (a book), Forest K. Harris, John Wiley & Sons. 33. Lightning, " C. L. Dawes, Minutes of the Thirty-Seventh Annual International
Conference of Doble Clients, 1970, Sec. 3-501. 34. Natural Frequencies of Coils and Windings Determined by Equivalent Circuit, "P.
A. Abetti and F, J. Maginniss, Trans. AIEE 1953, Page 495. 35. Fundamental Oscillations of Coils and Windings," P. A. Abetti and F. J.
Maginniss, Trans. AIEE 1954, (Vol. 73) Part III A, Page 1. 36. Oscillations of Coupled Windings," P. A. Abetti, G. E. Adams and F. J.
Maginniss, Trans. AIEE 1955 (Vol. 74) Part III, Page 12. 37. Transformer Windings - three phase, Natural Frequencies and Transient Voltages
from Equivalent Circuit Models, " B. I. Gururaj, Trans. IEEE 1968 (Vol. 88), Page 1.
Corona Discharge in Generator Slots and its Measurement
72A-1974-01 Rev. B 3/05 15-326
Chapter 15 - Corona Discharge in Generator Slots and its Measurement
C.L. Dawes and E.H. Povey Doble Engineering Company
15.1 Summary The object of this paper is to present a general description and an analysis of the corona discharge which occurs in the slot insulation of alternating-current generators. It is known that ionization is caused by the breakup of the molecules of a gas into positive ions and electrons when the gas is subjected to a high voltage electric field. A particular aspect of ionization is "restricted ionization," which occurs when the discharge is confined within the voids and thin gas spaces of the insulation. An example is the composite mica insulation used for the conductors of generator armatures or stators. Since ionization attacks the insulation, methods of detection and measurement are described as an important part of a maintenance program to anticipate possible failures. One criterion of the condition of the insulation is the power-factor tip-up characteristic, which is indicative of the general condition of an entire phase winding. An electromagnetic probe tuned to the high-frequency components of the discharge, which localizes the measurement to the slot being measured, measures the corona discharge in the individual slot. Since the slot conductors at the line end of the winding while in service have been subjected to the maximum winding voltage, their insulation has suffered the greatest corona damage; while those at the neutral end have been exposed to almost zero voltage, so that the insulation has suffered almost no damage. Yet, when the entire winding is at test voltage, the corona-discharge measurements, for the most part, are greater for the neutral-end conductors than for the line-end ones. This fact has cast some doubt on the reliability of the method in the diagnosis of the condition of the slot insulation and in any recommendations as to further measurements and their interpretation.
15.2 Ionization of a Gas When a gas, such as air between flat metallic electrodes, is subjected to a sufficiently high voltage stress it "breaks down," its molecules becoming separated initially into the heavier positive ions and the very light negative electrons1 z. The protons, or positive ions, are attracted to the negative electrode and the electrons to the positive electrode (Figure 16-1). In the electric field, the protons and electrons obtain high velocities, and collide with the nonionized molecules; these collisions knock the orbiting electrons away from a positive nucleus, thereby creating more and more free positive ions and electrons. This action called "ionization by collision" is cumulative and, by far, produces most of the ionization. With alternating voltage, the direction of the velocities of the ions and electrons reverses each half-cycle; and, unless restrained by some type of series impedance, ionization will develop almost instantly into an electric arc, which becomes the well known destructive short-circuit. If a sheet of insulating material-such as glass,
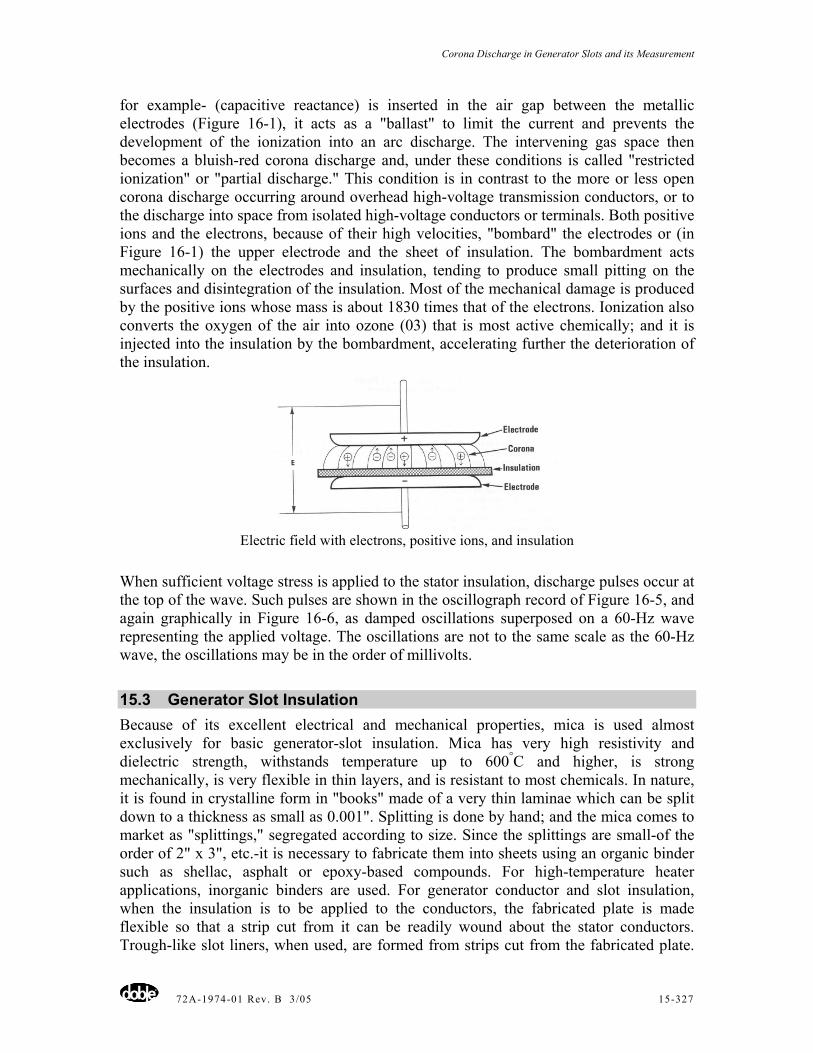
Corona Discharge in Generator Slots and its Measurement
72A-1974-01 Rev. B 3/05 15-327
for example- (capacitive reactance) is inserted in the air gap between the metallic electrodes (Figure 16-1), it acts as a "ballast" to limit the current and prevents the development of the ionization into an arc discharge. The intervening gas space then becomes a bluish-red corona discharge and, under these conditions is called "restricted ionization" or "partial discharge." This condition is in contrast to the more or less open corona discharge occurring around overhead high-voltage transmission conductors, or to the discharge into space from isolated high-voltage conductors or terminals. Both positive ions and the electrons, because of their high velocities, "bombard" the electrodes or (in Figure 16-1) the upper electrode and the sheet of insulation. The bombardment acts mechanically on the electrodes and insulation, tending to produce small pitting on the surfaces and disintegration of the insulation. Most of the mechanical damage is produced by the positive ions whose mass is about 1830 times that of the electrons. Ionization also converts the oxygen of the air into ozone (03) that is most active chemically; and it is injected into the insulation by the bombardment, accelerating further the deterioration of the insulation.
Electric field with electrons, positive ions, and insulation
When sufficient voltage stress is applied to the stator insulation, discharge pulses occur at the top of the wave. Such pulses are shown in the oscillograph record of Figure 16-5, and again graphically in Figure 16-6, as damped oscillations superposed on a 60-Hz wave representing the applied voltage. The oscillations are not to the same scale as the 60-Hz wave, the oscillations may be in the order of millivolts.
15.3 Generator Slot Insulation Because of its excellent electrical and mechanical properties, mica is used almost exclusively for basic generator-slot insulation. Mica has very high resistivity and dielectric strength, withstands temperature up to 600°C and higher, is strong mechanically, is very flexible in thin layers, and is resistant to most chemicals. In nature, it is found in crystalline form in "books" made of a very thin laminae which can be split down to a thickness as small as 0.001". Splitting is done by hand; and the mica comes to market as "splittings," segregated according to size. Since the splittings are small-of the order of 2" x 3", etc.-it is necessary to fabricate them into sheets using an organic binder such as shellac, asphalt or epoxy-based compounds. For high-temperature heater applications, inorganic binders are used. For generator conductor and slot insulation, when the insulation is to be applied to the conductors, the fabricated plate is made flexible so that a strip cut from it can be readily wound about the stator conductors. Trough-like slot liners, when used, are formed from strips cut from the fabricated plate.
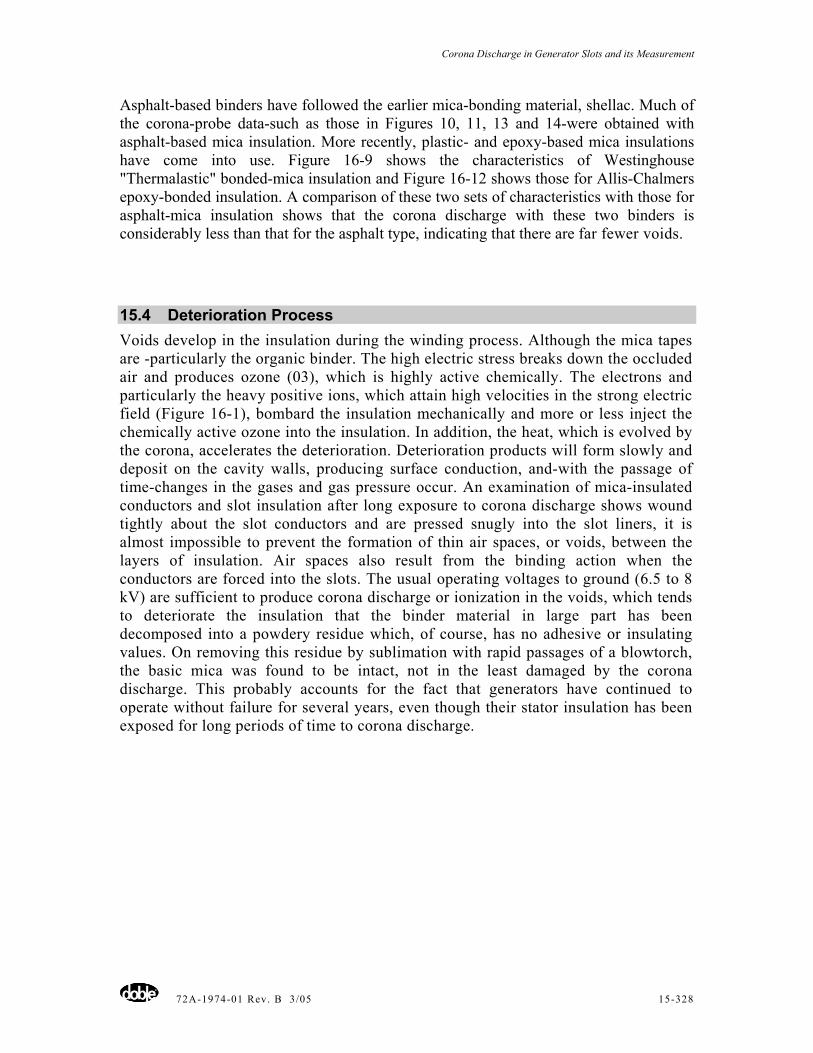
Corona Discharge in Generator Slots and its Measurement
72A-1974-01 Rev. B 3/05 15-328
Asphalt-based binders have followed the earlier mica-bonding material, shellac. Much of the corona-probe data-such as those in Figures 10, 11, 13 and 14-were obtained with asphalt-based mica insulation. More recently, plastic- and epoxy-based mica insulations have come into use. Figure 16-9 shows the characteristics of Westinghouse "Thermalastic" bonded-mica insulation and Figure 16-12 shows those for Allis-Chalmers epoxy-bonded insulation. A comparison of these two sets of characteristics with those for asphalt-mica insulation shows that the corona discharge with these two binders is considerably less than that for the asphalt type, indicating that there are far fewer voids.
15.4 Deterioration Process Voids develop in the insulation during the winding process. Although the mica tapes are -particularly the organic binder. The high electric stress breaks down the occluded air and produces ozone (03), which is highly active chemically. The electrons and particularly the heavy positive ions, which attain high velocities in the strong electric field (Figure 16-1), bombard the insulation mechanically and more or less inject the chemically active ozone into the insulation. In addition, the heat, which is evolved by the corona, accelerates the deterioration. Deterioration products will form slowly and deposit on the cavity walls, producing surface conduction, and-with the passage of time-changes in the gases and gas pressure occur. An examination of mica-insulated conductors and slot insulation after long exposure to corona discharge shows wound tightly about the slot conductors and are pressed snugly into the slot liners, it is almost impossible to prevent the formation of thin air spaces, or voids, between the layers of insulation. Air spaces also result from the binding action when the conductors are forced into the slots. The usual operating voltages to ground (6.5 to 8 kV) are sufficient to produce corona discharge or ionization in the voids, which tends to deteriorate the insulation that the binder material in large part has been decomposed into a powdery residue which, of course, has no adhesive or insulating values. On removing this residue by sublimation with rapid passages of a blowtorch, the basic mica was found to be intact, not in the least damaged by the corona discharge. This probably accounts for the fact that generators have continued to operate without failure for several years, even though their stator insulation has been exposed for long periods of time to corona discharge.
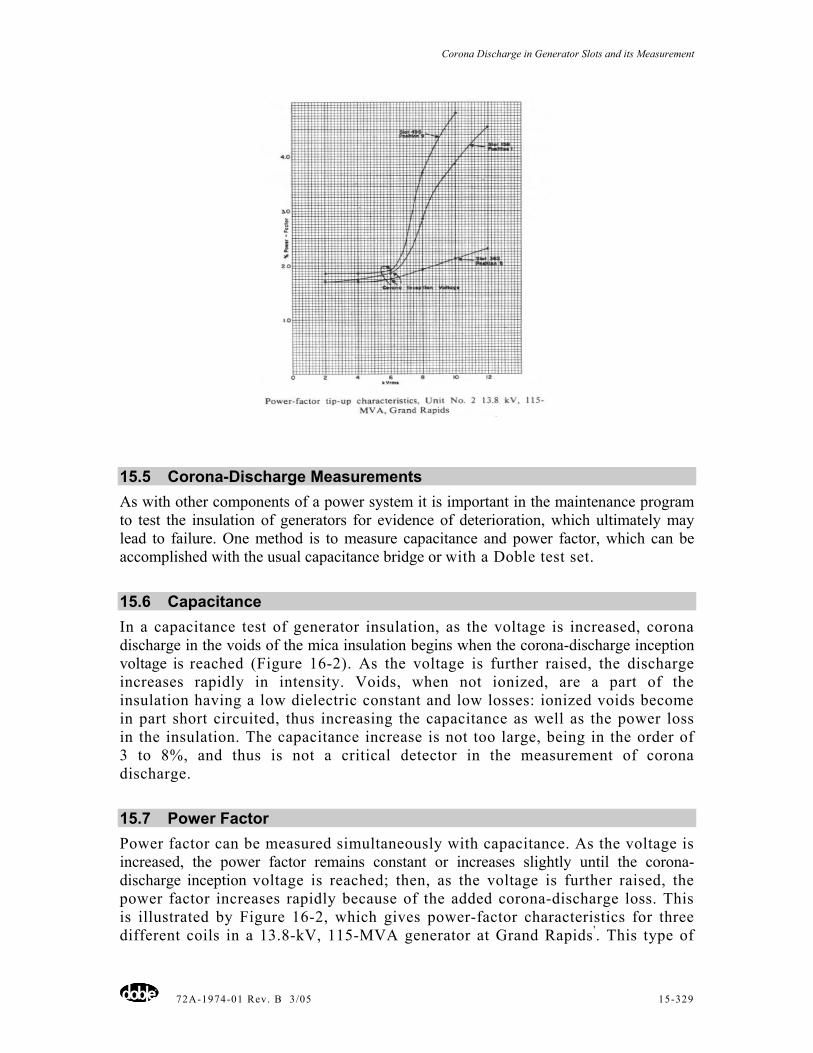
Corona Discharge in Generator Slots and its Measurement
72A-1974-01 Rev. B 3/05 15-329
15.5 Corona-Discharge Measurements As with other components of a power system it is important in the maintenance program to test the insulation of generators for evidence of deterioration, which ultimately may lead to failure. One method is to measure capacitance and power factor, which can be accomplished with the usual capacitance bridge or with a Doble test set.
15.6 Capacitance In a capacitance test of generator insulation, as the voltage is increased, corona discharge in the voids of the mica insulation begins when the corona-discharge inception voltage is reached (Figure 16-2). As the voltage is further raised, the discharge increases rapidly in intensity. Voids, when not ionized, are a part of the insulation having a low dielectric constant and low losses: ionized voids become in part short circuited, thus increasing the capacitance as well as the power loss in the insulation. The capacitance increase is not too large, being in the order of 3 to 8%, and thus is not a critical detector in the measurement of corona discharge.
15.7 Power Factor Power factor can be measured simultaneously with capacitance. As the voltage is increased, the power factor remains constant or increases slightly until the corona-discharge inception voltage is reached; then, as the voltage is further raised, the power factor increases rapidly because of the added corona-discharge loss. This is illustrated by Figure 16-2, which gives power-factor characteristics for three different coils in a 13.8-kV, 115-MVA generator at Grand Rapids'. This type of
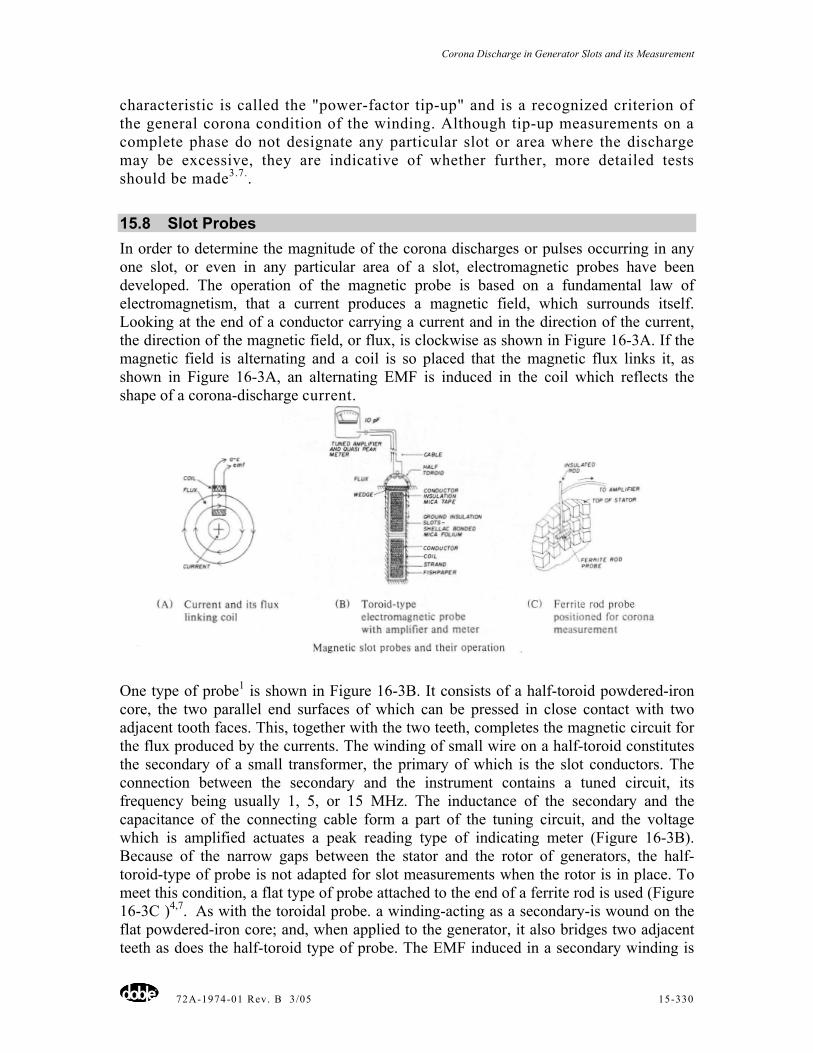
Corona Discharge in Generator Slots and its Measurement
72A-1974-01 Rev. B 3/05 15-330
characteristic is called the "power-factor tip-up" and is a recognized criterion of the general corona condition of the winding. Although tip-up measurements on a complete phase do not designate any particular slot or area where the discharge may be excessive, they are indicative of whether further, more detailed tests should be made3.7..
15.8 Slot Probes In order to determine the magnitude of the corona discharges or pulses occurring in any one slot, or even in any particular area of a slot, electromagnetic probes have been developed. The operation of the magnetic probe is based on a fundamental law of electromagnetism, that a current produces a magnetic field, which surrounds itself. Looking at the end of a conductor carrying a current and in the direction of the current, the direction of the magnetic field, or flux, is clockwise as shown in Figure 16-3A. If the magnetic field is alternating and a coil is so placed that the magnetic flux links it, as shown in Figure 16-3A, an alternating EMF is induced in the coil which reflects the shape of a corona-discharge current.
One type of probe1 is shown in Figure 16-3B. It consists of a half-toroid powdered-iron core, the two parallel end surfaces of which can be pressed in close contact with two adjacent tooth faces. This, together with the two teeth, completes the magnetic circuit for the flux produced by the currents. The winding of small wire on a half-toroid constitutes the secondary of a small transformer, the primary of which is the slot conductors. The connection between the secondary and the instrument contains a tuned circuit, its frequency being usually 1, 5, or 15 MHz. The inductance of the secondary and the capacitance of the connecting cable form a part of the tuning circuit, and the voltage which is amplified actuates a peak reading type of indicating meter (Figure 16-3B). Because of the narrow gaps between the stator and the rotor of generators, the half-toroid-type of probe is not adapted for slot measurements when the rotor is in place. To meet this condition, a flat type of probe attached to the end of a ferrite rod is used (Figure 16-3C )4,7. As with the toroidal probe. a winding-acting as a secondary-is wound on the flat powdered-iron core; and, when applied to the generator, it also bridges two adjacent teeth as does the half-toroid type of probe. The EMF induced in a secondary winding is
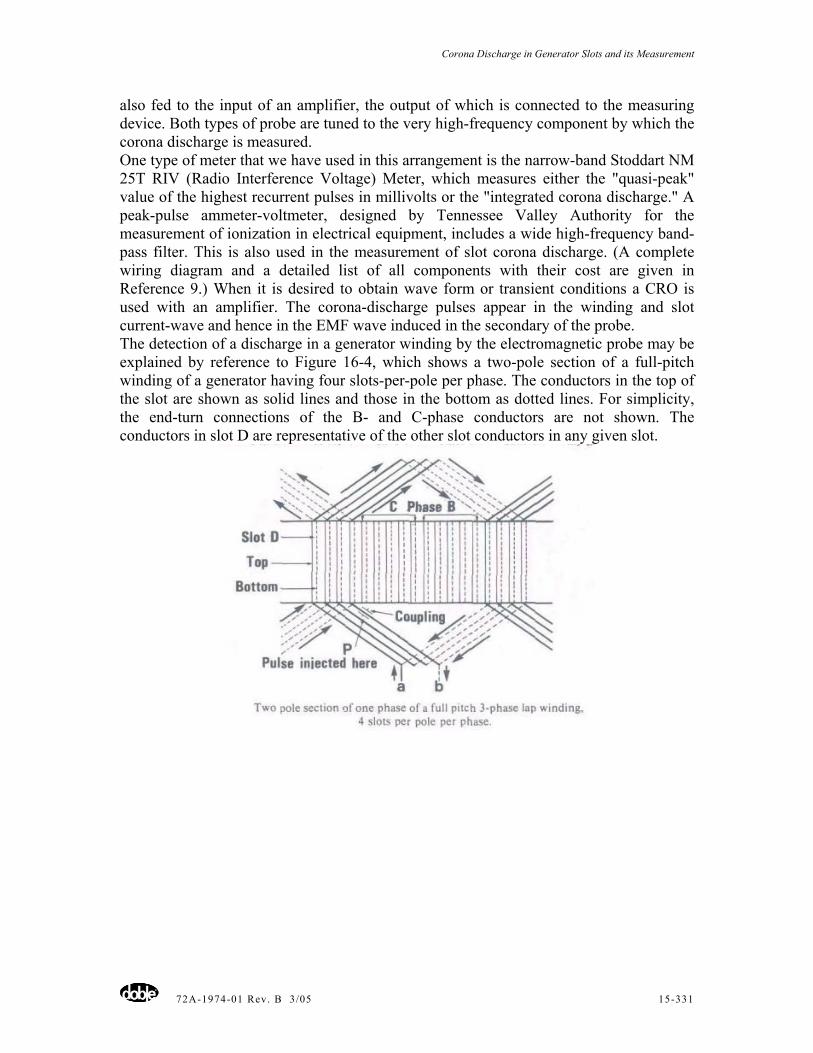
Corona Discharge in Generator Slots and its Measurement
72A-1974-01 Rev. B 3/05 15-331
also fed to the input of an amplifier, the output of which is connected to the measuring device. Both types of probe are tuned to the very high-frequency component by which the corona discharge is measured. One type of meter that we have used in this arrangement is the narrow-band Stoddart NM 25T RIV (Radio Interference Voltage) Meter, which measures either the "quasi-peak" value of the highest recurrent pulses in millivolts or the "integrated corona discharge." A peak-pulse ammeter-voltmeter, designed by Tennessee Valley Authority for the measurement of ionization in electrical equipment, includes a wide high-frequency band-pass filter. This is also used in the measurement of slot corona discharge. (A complete wiring diagram and a detailed list of all components with their cost are given in Reference 9.) When it is desired to obtain wave form or transient conditions a CRO is used with an amplifier. The corona-discharge pulses appear in the winding and slot current-wave and hence in the EMF wave induced in the secondary of the probe. The detection of a discharge in a generator winding by the electromagnetic probe may be explained by reference to Figure 16-4, which shows a two-pole section of a full-pitch winding of a generator having four slots-per-pole per phase. The conductors in the top of the slot are shown as solid lines and those in the bottom as dotted lines. For simplicity, the end-turn connections of the B- and C-phase conductors are not shown. The conductors in slot D are representative of the other slot conductors in any given slot.
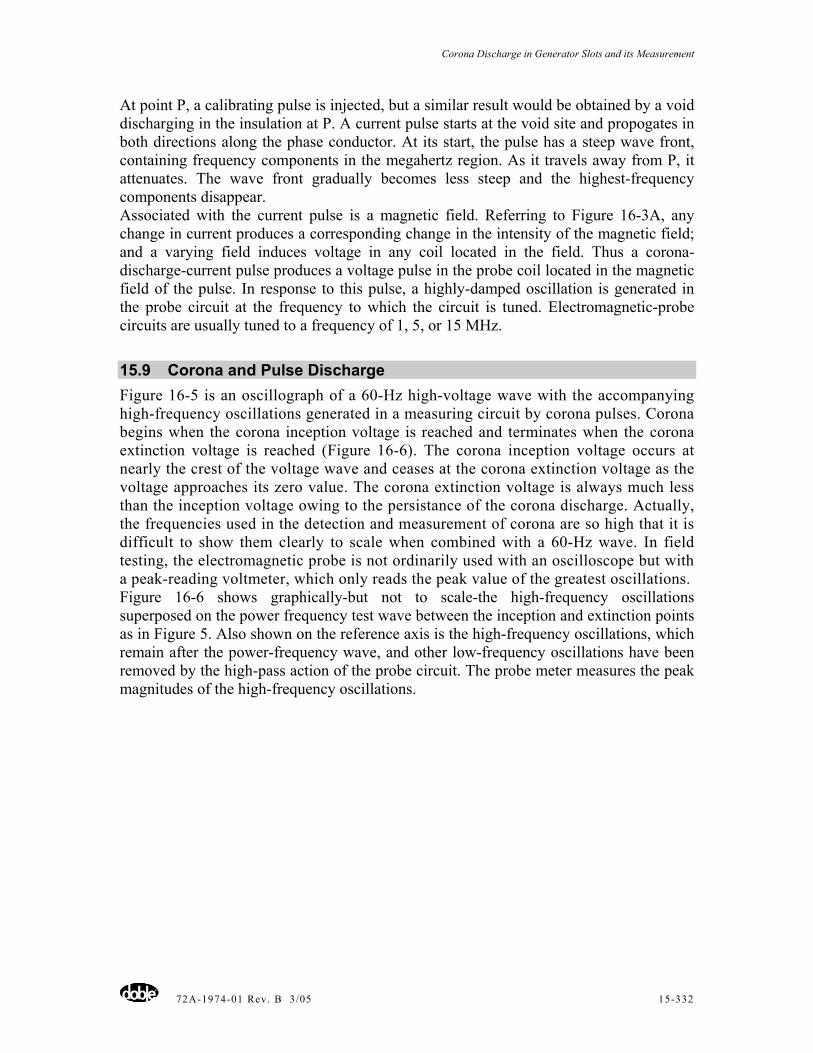
Corona Discharge in Generator Slots and its Measurement
72A-1974-01 Rev. B 3/05 15-332
At point P, a calibrating pulse is injected, but a similar result would be obtained by a void discharging in the insulation at P. A current pulse starts at the void site and propogates in both directions along the phase conductor. At its start, the pulse has a steep wave front, containing frequency components in the megahertz region. As it travels away from P, it attenuates. The wave front gradually becomes less steep and the highest-frequency components disappear. Associated with the current pulse is a magnetic field. Referring to Figure 16-3A, any change in current produces a corresponding change in the intensity of the magnetic field; and a varying field induces voltage in any coil located in the field. Thus a corona-discharge-current pulse produces a voltage pulse in the probe coil located in the magnetic field of the pulse. In response to this pulse, a highly-damped oscillation is generated in the probe circuit at the frequency to which the circuit is tuned. Electromagnetic-probe circuits are usually tuned to a frequency of 1, 5, or 15 MHz.
15.9 Corona and Pulse Discharge Figure 16-5 is an oscillograph of a 60-Hz high-voltage wave with the accompanying high-frequency oscillations generated in a measuring circuit by corona pulses. Corona begins when the corona inception voltage is reached and terminates when the corona extinction voltage is reached (Figure 16-6). The corona inception voltage occurs at nearly the crest of the voltage wave and ceases at the corona extinction voltage as the voltage approaches its zero value. The corona extinction voltage is always much less than the inception voltage owing to the persistance of the corona discharge. Actually, the frequencies used in the detection and measurement of corona are so high that it is difficult to show them clearly to scale when combined with a 60-Hz wave. In field testing, the electromagnetic probe is not ordinarily used with an oscilloscope but with a peak-reading voltmeter, which only reads the peak value of the greatest oscillations. Figure 16-6 shows graphically-but not to scale-the high-frequency oscillations superposed on the power frequency test wave between the inception and extinction points as in Figure 5. Also shown on the reference axis is the high-frequency oscillations, which remain after the power-frequency wave, and other low-frequency oscillations have been removed by the high-pass action of the probe circuit. The probe meter measures the peak magnitudes of the high-frequency oscillations.
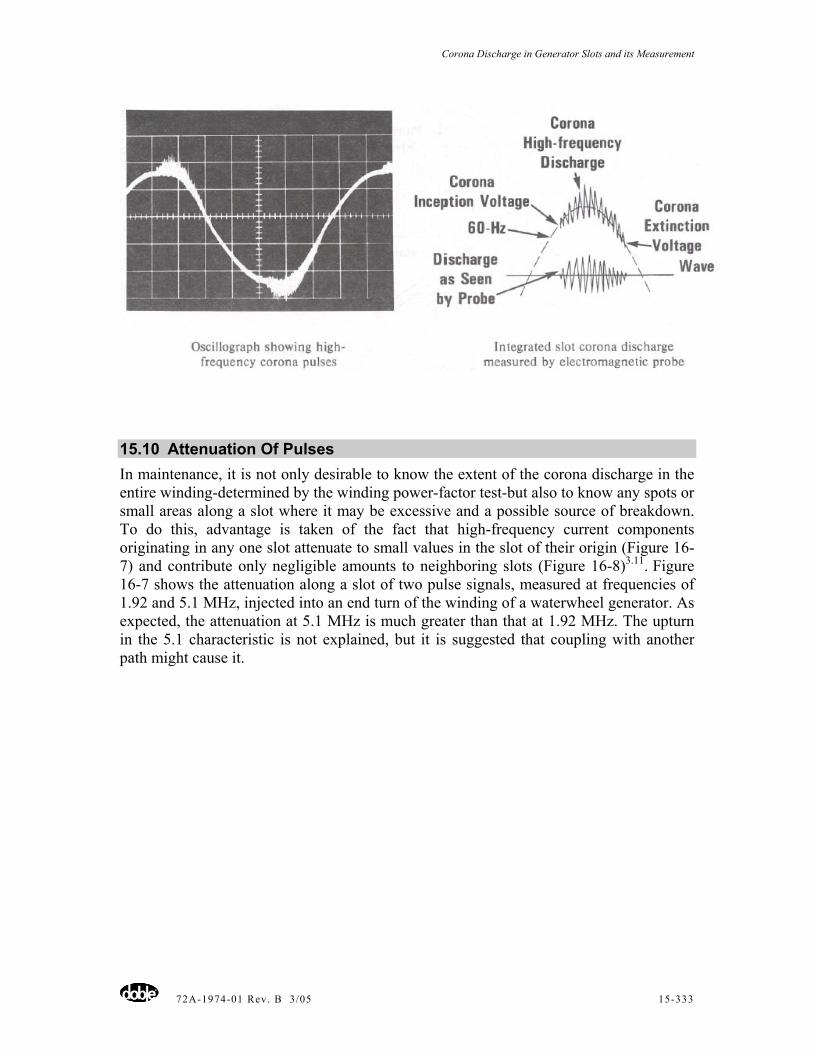
Corona Discharge in Generator Slots and its Measurement
72A-1974-01 Rev. B 3/05 15-333
15.10 Attenuation Of Pulses In maintenance, it is not only desirable to know the extent of the corona discharge in the entire winding-determined by the winding power-factor test-but also to know any spots or small areas along a slot where it may be excessive and a possible source of breakdown. To do this, advantage is taken of the fact that high-frequency current components originating in any one slot attenuate to small values in the slot of their origin (Figure 16-7) and contribute only negligible amounts to neighboring slots (Figure 16-8)3.11. Figure 16-7 shows the attenuation along a slot of two pulse signals, measured at frequencies of 1.92 and 5.1 MHz, injected into an end turn of the winding of a waterwheel generator. As expected, the attenuation at 5.1 MHz is much greater than that at 1.92 MHz. The upturn in the 5.1 characteristic is not explained, but it is suggested that coupling with another path might cause it.
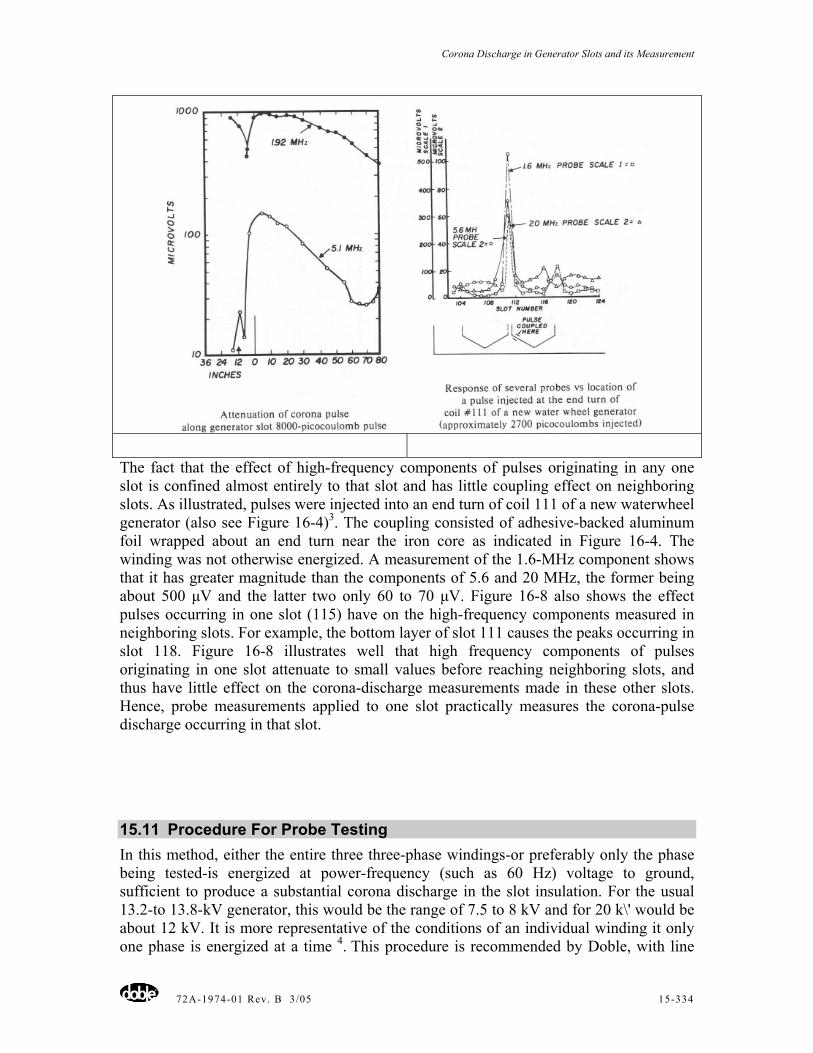
Corona Discharge in Generator Slots and its Measurement
72A-1974-01 Rev. B 3/05 15-334
The fact that the effect of high-frequency components of pulses originating in any one slot is confined almost entirely to that slot and has little coupling effect on neighboring slots. As illustrated, pulses were injected into an end turn of coil 111 of a new waterwheel generator (also see Figure 16-4)3. The coupling consisted of adhesive-backed aluminum foil wrapped about an end turn near the iron core as indicated in Figure 16-4. The winding was not otherwise energized. A measurement of the 1.6-MHz component shows that it has greater magnitude than the components of 5.6 and 20 MHz, the former being about 500 µV and the latter two only 60 to 70 µV. Figure 16-8 also shows the effect pulses occurring in one slot (115) have on the high-frequency components measured in neighboring slots. For example, the bottom layer of slot 111 causes the peaks occurring in slot 118. Figure 16-8 illustrates well that high frequency components of pulses originating in one slot attenuate to small values before reaching neighboring slots, and thus have little effect on the corona-discharge measurements made in these other slots. Hence, probe measurements applied to one slot practically measures the corona-pulse discharge occurring in that slot.
15.11 Procedure For Probe Testing In this method, either the entire three three-phase windings-or preferably only the phase being tested-is energized at power-frequency (such as 60 Hz) voltage to ground, sufficient to produce a substantial corona discharge in the slot insulation. For the usual 13.2-to 13.8-kV generator, this would be the range of 7.5 to 8 kV and for 20 k\' would be about 12 kV. It is more representative of the conditions of an individual winding it only one phase is energized at a time 4. This procedure is recommended by Doble, with line
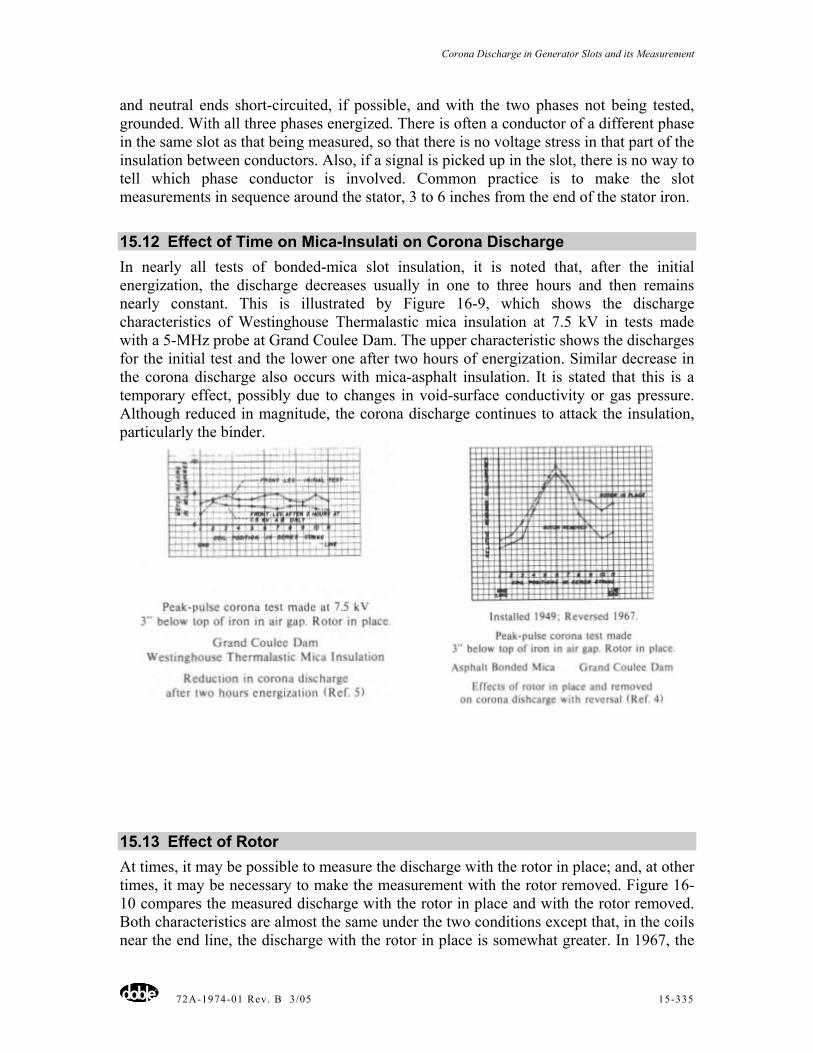
Corona Discharge in Generator Slots and its Measurement
72A-1974-01 Rev. B 3/05 15-335
and neutral ends short-circuited, if possible, and with the two phases not being tested, grounded. With all three phases energized. There is often a conductor of a different phase in the same slot as that being measured, so that there is no voltage stress in that part of the insulation between conductors. Also, if a signal is picked up in the slot, there is no way to tell which phase conductor is involved. Common practice is to make the slot measurements in sequence around the stator, 3 to 6 inches from the end of the stator iron.
15.12 Effect of Time on Mica-Insulati on Corona Discharge In nearly all tests of bonded-mica slot insulation, it is noted that, after the initial energization, the discharge decreases usually in one to three hours and then remains nearly constant. This is illustrated by Figure 16-9, which shows the discharge characteristics of Westinghouse Thermalastic mica insulation at 7.5 kV in tests made with a 5-MHz probe at Grand Coulee Dam. The upper characteristic shows the discharges for the initial test and the lower one after two hours of energization. Similar decrease in the corona discharge also occurs with mica-asphalt insulation. It is stated that this is a temporary effect, possibly due to changes in void-surface conductivity or gas pressure. Although reduced in magnitude, the corona discharge continues to attack the insulation, particularly the binder.
15.13 Effect of Rotor At times, it may be possible to measure the discharge with the rotor in place; and, at other times, it may be necessary to make the measurement with the rotor removed. Figure 16-10 compares the measured discharge with the rotor in place and with the rotor removed. Both characteristics are almost the same under the two conditions except that, in the coils near the end line, the discharge with the rotor in place is somewhat greater. In 1967, the
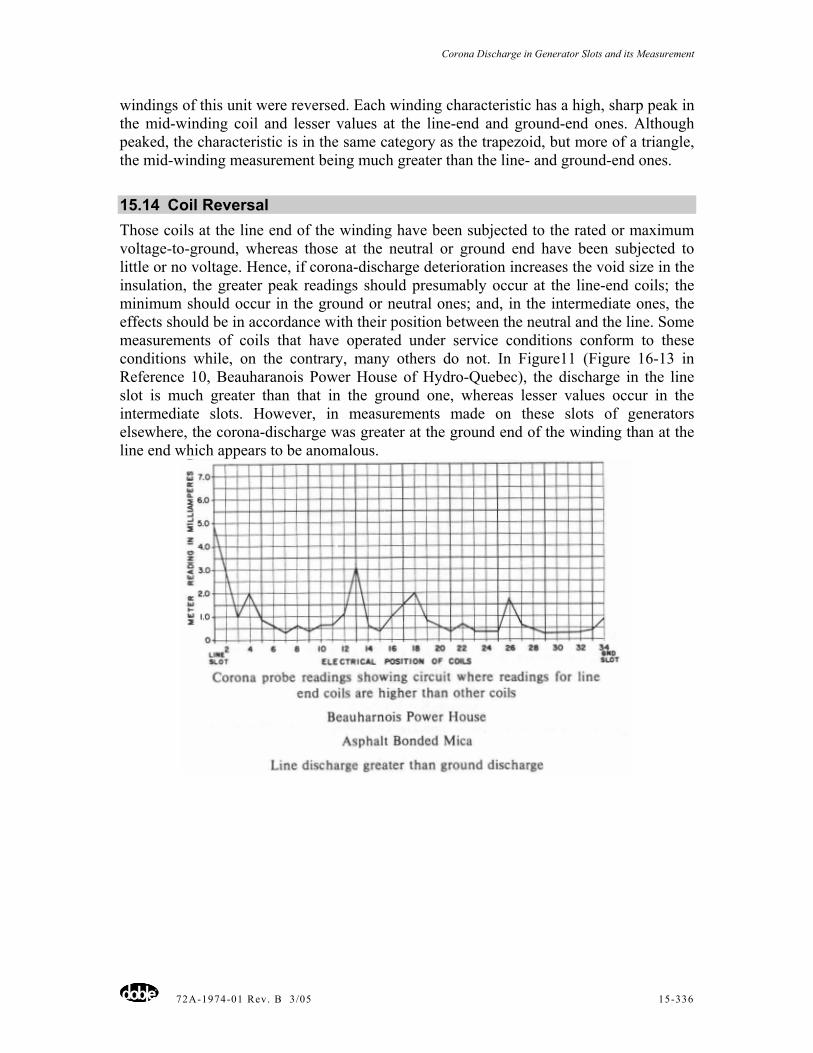
Corona Discharge in Generator Slots and its Measurement
72A-1974-01 Rev. B 3/05 15-336
windings of this unit were reversed. Each winding characteristic has a high, sharp peak in the mid-winding coil and lesser values at the line-end and ground-end ones. Although peaked, the characteristic is in the same category as the trapezoid, but more of a triangle, the mid-winding measurement being much greater than the line- and ground-end ones.
15.14 Coil Reversal Those coils at the line end of the winding have been subjected to the rated or maximum voltage-to-ground, whereas those at the neutral or ground end have been subjected to little or no voltage. Hence, if corona-discharge deterioration increases the void size in the insulation, the greater peak readings should presumably occur at the line-end coils; the minimum should occur in the ground or neutral ones; and, in the intermediate ones, the effects should be in accordance with their position between the neutral and the line. Some measurements of coils that have operated under service conditions conform to these conditions while, on the contrary, many others do not. In Figure11 (Figure 16-13 in Reference 10, Beauharanois Power House of Hydro-Quebec), the discharge in the line slot is much greater than that in the ground one, whereas lesser values occur in the intermediate slots. However, in measurements made on these slots of generators elsewhere, the corona-discharge was greater at the ground end of the winding than at the line end which appears to be anomalous.
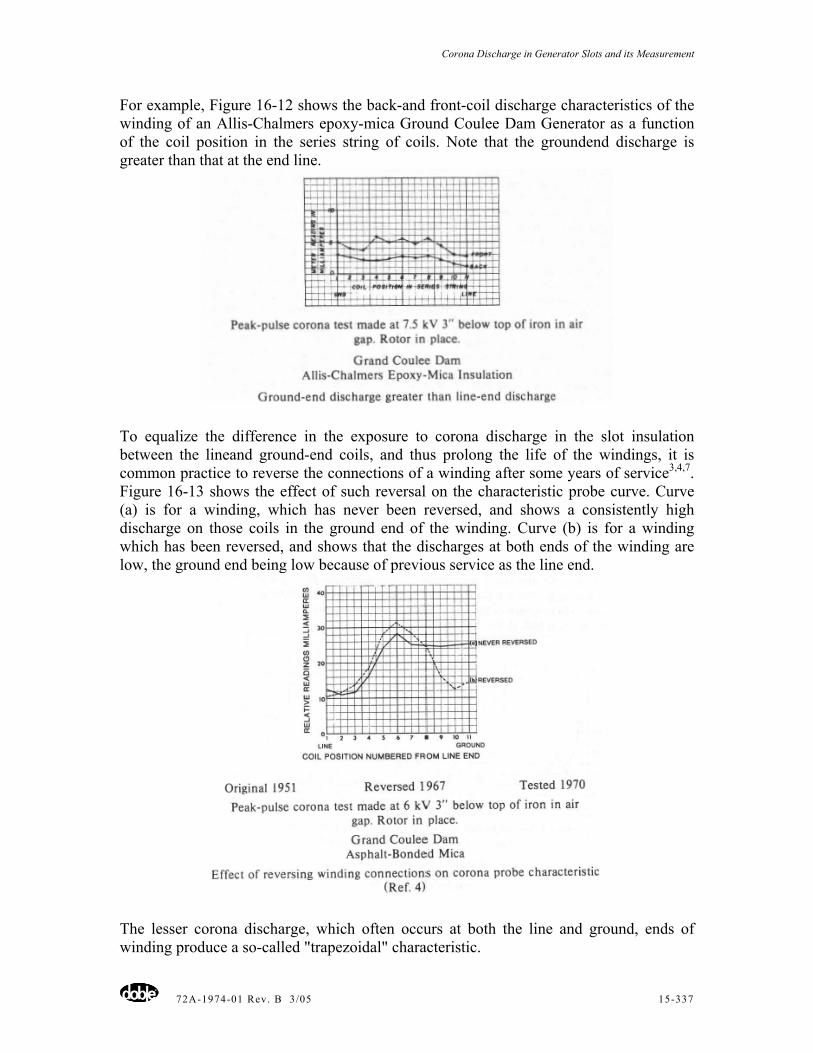
Corona Discharge in Generator Slots and its Measurement
72A-1974-01 Rev. B 3/05 15-337
For example, Figure 16-12 shows the back-and front-coil discharge characteristics of the winding of an Allis-Chalmers epoxy-mica Ground Coulee Dam Generator as a function of the coil position in the series string of coils. Note that the groundend discharge is greater than that at the end line.
To equalize the difference in the exposure to corona discharge in the slot insulation between the lineand ground-end coils, and thus prolong the life of the windings, it is common practice to reverse the connections of a winding after some years of service3,4,7. Figure 16-13 shows the effect of such reversal on the characteristic probe curve. Curve (a) is for a winding, which has never been reversed, and shows a consistently high discharge on those coils in the ground end of the winding. Curve (b) is for a winding which has been reversed, and shows that the discharges at both ends of the winding are low, the ground end being low because of previous service as the line end.
The lesser corona discharge, which often occurs at both the line and ground, ends of winding produce a so-called "trapezoidal" characteristic.
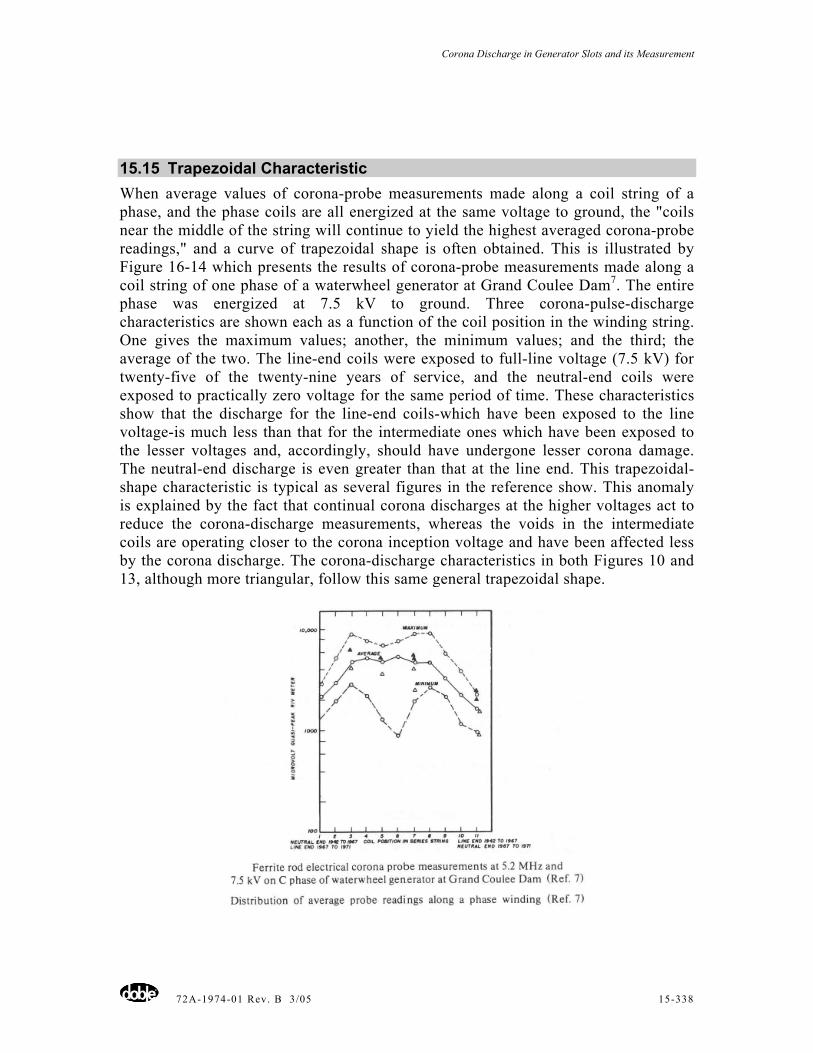
Corona Discharge in Generator Slots and its Measurement
72A-1974-01 Rev. B 3/05 15-338
15.15 Trapezoidal Characteristic When average values of corona-probe measurements made along a coil string of a phase, and the phase coils are all energized at the same voltage to ground, the "coils near the middle of the string will continue to yield the highest averaged corona-probe readings," and a curve of trapezoidal shape is often obtained. This is illustrated by Figure 16-14 which presents the results of corona-probe measurements made along a coil string of one phase of a waterwheel generator at Grand Coulee Dam7. The entire phase was energized at 7.5 kV to ground. Three corona-pulse-discharge characteristics are shown each as a function of the coil position in the winding string. One gives the maximum values; another, the minimum values; and the third; the average of the two. The line-end coils were exposed to full-line voltage (7.5 kV) for twenty-five of the twenty-nine years of service, and the neutral-end coils were exposed to practically zero voltage for the same period of time. These characteristics show that the discharge for the line-end coils-which have been exposed to the line voltage-is much less than that for the intermediate ones which have been exposed to the lesser voltages and, accordingly, should have undergone lesser corona damage. The neutral-end discharge is even greater than that at the line end. This trapezoidal-shape characteristic is typical as several figures in the reference show. This anomaly is explained by the fact that continual corona discharges at the higher voltages act to reduce the corona-discharge measurements, whereas the voids in the intermediate coils are operating closer to the corona inception voltage and have been affected less by the corona discharge. The corona-discharge characteristics in both Figures 10 and 13, although more triangular, follow this same general trapezoidal shape.
Corona Discharge in Generator Slots and its Measurement
72A-1974-01 Rev. B 3/05 15-339
15.16 General Results Of Probe Tests The fact that results of several probe measurements appear to be inconsistent casts some doubt as to their validity as a reliable diagnosis of voids occurring in the slot insulation and its general condition. It has been shown that measurements of coils located at the line end of the winding and subjected to the maximum corona discharge should be most severely damaged, but often measure the lowest quasi-peak values; whereas those located at or near the neutral or ground end, and thus exposed to little or no voltage, often measure relatively high quasi-peak values. Such measurements when plotted produce what has become known as the "trapezoid characteristic." These low values are explained by assuming that the voids in the line-end coils, after some years of service, become short-circuited by tracking. It would be desirable to differentiate between those coils which have suffered damage due to corona discharge, but which-when tested-have relatively low peakpulse readings; and those coils which have not suffered damage due to corona discharge, but which also might have a relatively low peak-pulse reading. Unfortunately, the condition or the deterioration of the insulation cannot be accurately determined by the value of the quasi-peak reading taken alone. A few such tests have been conducted which show that they do indicate the presence of abnormal discharge somewhere within the slot that may soon develop into failure. This would be a reason to make further area probe measurements along its length to locate exactly the danger spot. Since it is believed that each coil has its own individual discharge and deterioration characteristics, probe measurements can be used as one element of a maintenance program, by determining the changes in the individual coil measurements supplemented with capacitance and tip-up values such as are measured with a capacitance bridge or a Doble Test Set.
15.17 Conclusions Before a probe measurement is contemplated, it is recommended that capacitance and power-factor tests of an entire winding (Figure 16-2) be made (preferably each phase individually). These would indicate in a general way how much ionization exists in the windings and also, from the power-factor "tip-up,. characteristic, the corona discharge inception voltage and the general character of the corona discharge. These tests can then indicate whether other, more detailed ones should be made such as magnetic probe tests of the individual slots, so that abnormal discharges or sources of failure may be detected and removed. It should be remembered that the magnetic-probe test is relatively new; and much more may be learned of its capabilities from further measurements, particularly repeat measurements on the same units, and their interpretations. A rather complete analysis of and recommendations for conducting magnetic-probe measurements is given in the paper, "Corona Probe Measurements Taken on Hydro Machines at Grand Coulee Dam," by T. A. Goodwin a and is highly recommended.
Corona Discharge in Generator Slots and its Measurement
72A-1974-01 Rev. B 3/05 15-340
Acknowledgement: The authors are most appreciative of the suggestions and assistance in the preparation of this paper given them by A. L. Rickley and other engineers of the Doble Engineering Company.
15.18 References
1. C. L. Dawes and P. H. Humphries, "Characteristics of Restricted Ionization and its Relation to Insulating Materials, AIEE Transactions Vol. 59, 1940, p 701.
2. C. L. Dawes and E. H. Povey, Dielectric Theory and Practice, Doble Publication (Available on Request).
3. Thomas W. Dakin, Carroll N. Works and John S. Johnson, "An Electromagnetic Probe for Detecting and Locating Discharges in Large Rotating Machine Stators, IEEE Transactions, 1969, Vol. 88, p 251. (Also, J. S. Johnson, Minutes of the Thirty-Sixth Annual International Conference of Doble Clients, 1969, Sec. 7-501.
4. T. A. Goodwin, "Corona Probe Measurements Taken on Hydro Machines at Grant Coulee Dam," Minutes of the Thirty-Eighth Annual International Conference of Doble Clients, 1971, See. 7-501.
5. T. A. Goodwin, "Further Corona Probe Tests and Evaluation of Corona Damage to Stator Coils at Grand Coulee Dam," Minutes of the Thirty-Ninth Annual International Conference of Doble Clients, 1972, Sec. 7-601.
6. W. M. McDermid, Discussion of the T. A. Goodwin Paper5, Minutes of the Thirty-Ninth Annual International Conference of Doble Clients, 1972, Sec. 7-601 B.
7. R. T. Harrold, E. H. Fort and T. A. Goodwin, "The Interpretation of Corona and Dielectric Measurements on Mica-Asphalt Insulation of a 30-Year Old Waterwheel Generator at Grand Coulee Dam, IEE Transaction, Power Apparatus and Systems, Vol. PAS 92, 1973, p 1935.
8. T. W. Dankin and P. J. Malinaric, "A Capacitance Bridge Method for Measuring Integrated DoronaCharge Transfer and Power Loss per Cycle, AIEE Transactions, Vol. 79, 1960, III, p 648.
9. L. E. Smith, "A Peak-Pulse Ammeter-Voltmeter Suitable for Ionization (Corona) Measurement in Electrical Equipment," Minutes of the Thirty-Seventh Annual International Conference of Doble Clients, 1970, Sec. 3-401.
10. J. R. Cosby, P. Menard and C. G. Bickerdike, "Electromagnetic Corona Probe Tests for the Evaluation of Generator Stator Windings," Minutes of the Fortieth Annual International Conference of Doble Clients, 1973, Sec. 7-701.
11. J. S. Johnson, "An Electromagnetic Probe for Detecting and Locating Discharge in Large Rotating Machine Stators," Minutes of the Thirty-Sixth Annual International Conference of Doble Clients. 1969, Sec. 7-501.
Dielectric Theory and Practice
72A-1974-01 Rev. B 3/05 17-341
Chapter 16 – Restricted Ionization in High Voltage Insulation C.L. Dawes
Doble Engineering Company
16.1 Summary Corona, or ionization`, discharges occur within the thin voids which are present in laminated types of insulation and within voids which occur in solid insulation, when the voltage gradient reaches a value of approximately 30 kV/cm (maximum). Typical examples are the built-up laminated mica used in the stators of high-voltage generators and the varnished-cambric and oil-impregnated-paper insulation used with high voltage cables. This type of ionization, being confined to the thin spaces between the layers of insulation, is called "partial discharge" or "restricted ionization" in contrast to that from high-voltage overhead conductors which discharges into free space. The restricted ionization in many cases produces chemically active ozone, which, combined with the high-velocity bombardment of the insulation by the free ions, is a frequent cause of insulation failure. Because the power loss in the solid dielectric and that in the ionization discharge are different functions of the applied voltage, it is possible to separate them by plotting the total dielectric loss using log-log coordinate paper. In order to determine the effects of gap length, pressure, and of other parameters on the ionization characteristics, special apparatus was constructed in which these factors could be controlled. The measurements were made with a precision high-voltage mutual-inductance bridge. An important result was a demonstration of the fact that after the ionization inception voltage is reached, the ionization power loss becomes a linear function of the voltage. In addition, two other methods for measuring ionization are described. In one method, the solid dielectric power loss is that occurring in an ionization-free cable specimen and the ionization-power loss is that in a very short air-gap connected in parallel with it. In a recent ASTM method, a bridge balance is obtained with the applied voltage below the ionization inception voltage of the test specimen. The voltage is then raised to values of voltage greater than the ionization inception voltage. With no further bridge adjustments, the trace of an oscilloscope connected to the detector points of the bridge is a parallelogram whose area is proportional to the ionization power loss.
16.2 Ionization in Impregnated-Paper Insulation Ionization in an air gap (Figure 17-1) shows two parallel electrodes separated by a short air gap, with high voltage E volts applied between them. There are always present in the atmosphere something like 1,000 to 10,000 free electrons per cubic centimeter, as well as photo electrons produced by ultra-violet light. When in a strong electric field, these electrons are attracted to the positive electrode and attain high velocities. * The terms ionization and corona usually are used interchangeably, although corona is more often applied to the discharge from overhead transmission conductors and ionization discharges occurring in spaces within insulation. See Appendix for definitions. They collide with the neutral atoms of the air which happen to lie in their paths and knock free the electrons that are attached to their atomic nuclei, thus leaving free positive ions. The free electrons are attracted to the positive electrode and the positive ions to the negative one. In so doing, they
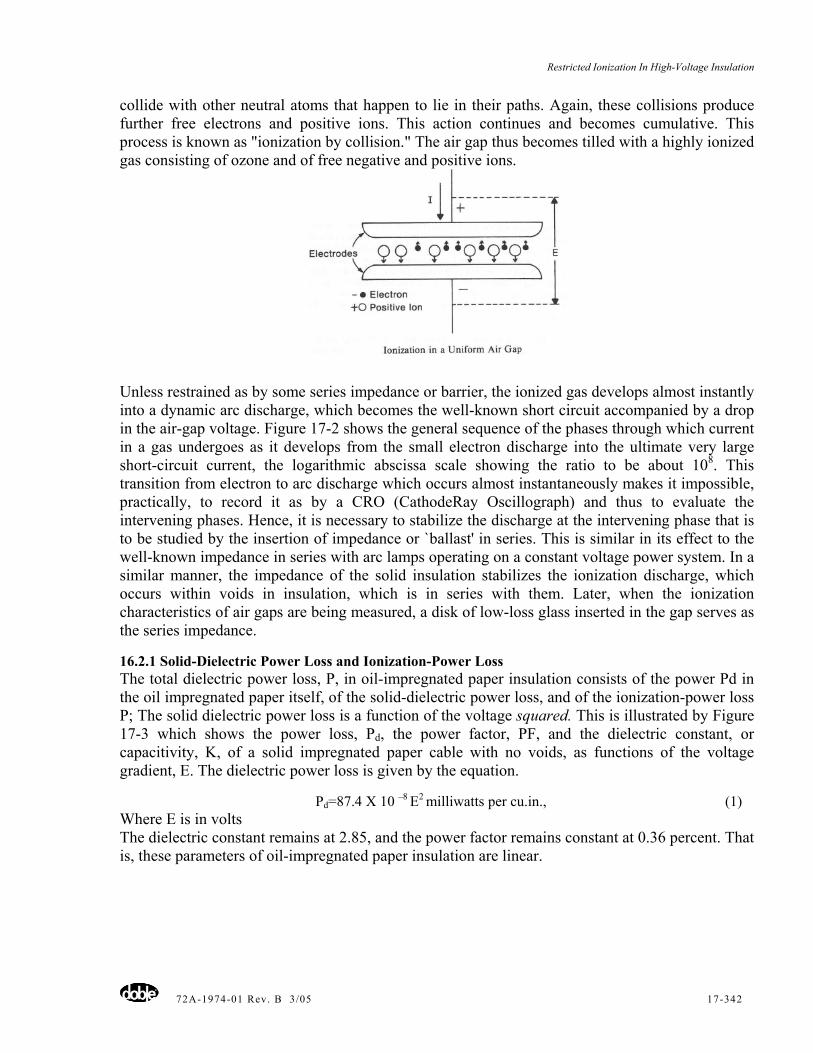
Restricted Ionization In High-Voltage Insulation
72A-1974-01 Rev. B 3/05 17-342
collide with other neutral atoms that happen to lie in their paths. Again, these collisions produce further free electrons and positive ions. This action continues and becomes cumulative. This process is known as "ionization by collision." The air gap thus becomes tilled with a highly ionized gas consisting of ozone and of free negative and positive ions.
Unless restrained as by some series impedance or barrier, the ionized gas develops almost instantly into a dynamic arc discharge, which becomes the well-known short circuit accompanied by a drop in the air-gap voltage. Figure 17-2 shows the general sequence of the phases through which current in a gas undergoes as it develops from the small electron discharge into the ultimate very large short-circuit current, the logarithmic abscissa scale showing the ratio to be about 108. This transition from electron to arc discharge which occurs almost instantaneously makes it impossible, practically, to record it as by a CRO (CathodeRay Oscillograph) and thus to evaluate the intervening phases. Hence, it is necessary to stabilize the discharge at the intervening phase that is to be studied by the insertion of impedance or `ballast' in series. This is similar in its effect to the well-known impedance in series with arc lamps operating on a constant voltage power system. In a similar manner, the impedance of the solid insulation stabilizes the ionization discharge, which occurs within voids in insulation, which is in series with them. Later, when the ionization characteristics of air gaps are being measured, a disk of low-loss glass inserted in the gap serves as the series impedance.
16.2.1 Solid-Dielectric Power Loss and Ionization-Power Loss The total dielectric power loss, P, in oil-impregnated paper insulation consists of the power Pd in the oil impregnated paper itself, of the solid-dielectric power loss, and of the ionization-power loss P; The solid dielectric power loss is a function of the voltage squared. This is illustrated by Figure 17-3 which shows the power loss, Pd, the power factor, PF, and the dielectric constant, or capacitivity, K, of a solid impregnated paper cable with no voids, as functions of the voltage gradient, E. The dielectric power loss is given by the equation.
Pd=87.4 X 10 –8 E2 milliwatts per cu.in., (1) Where E is in volts The dielectric constant remains at 2.85, and the power factor remains constant at 0.36 percent. That is, these parameters of oil-impregnated paper insulation are linear.
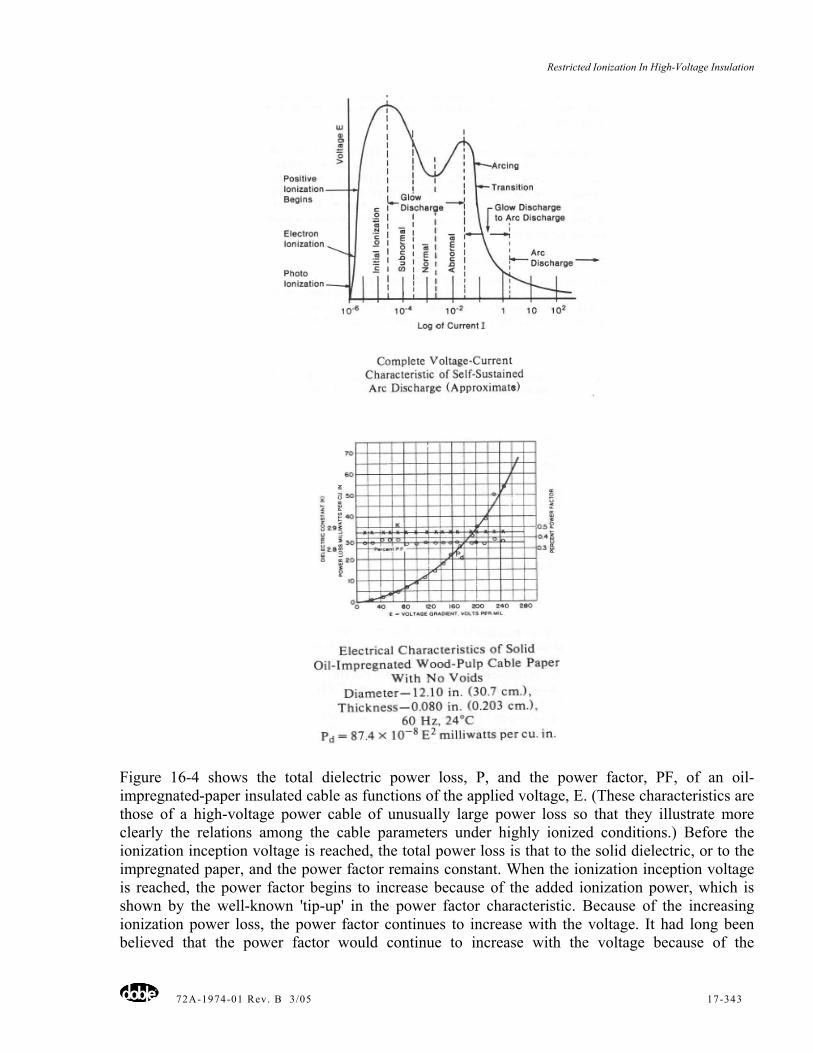
Restricted Ionization In High-Voltage Insulation
72A-1974-01 Rev. B 3/05 17-343
Figure 16-4 shows the total dielectric power loss, P, and the power factor, PF, of an oil-impregnated-paper insulated cable as functions of the applied voltage, E. (These characteristics are those of a high-voltage power cable of unusually large power loss so that they illustrate more clearly the relations among the cable parameters under highly ionized conditions.) Before the ionization inception voltage is reached, the total power loss is that to the solid dielectric, or to the impregnated paper, and the power factor remains constant. When the ionization inception voltage is reached, the power factor begins to increase because of the added ionization power, which is shown by the well-known 'tip-up' in the power factor characteristic. Because of the increasing ionization power loss, the power factor continues to increase with the voltage. It had long been believed that the power factor would continue to increase with the voltage because of the
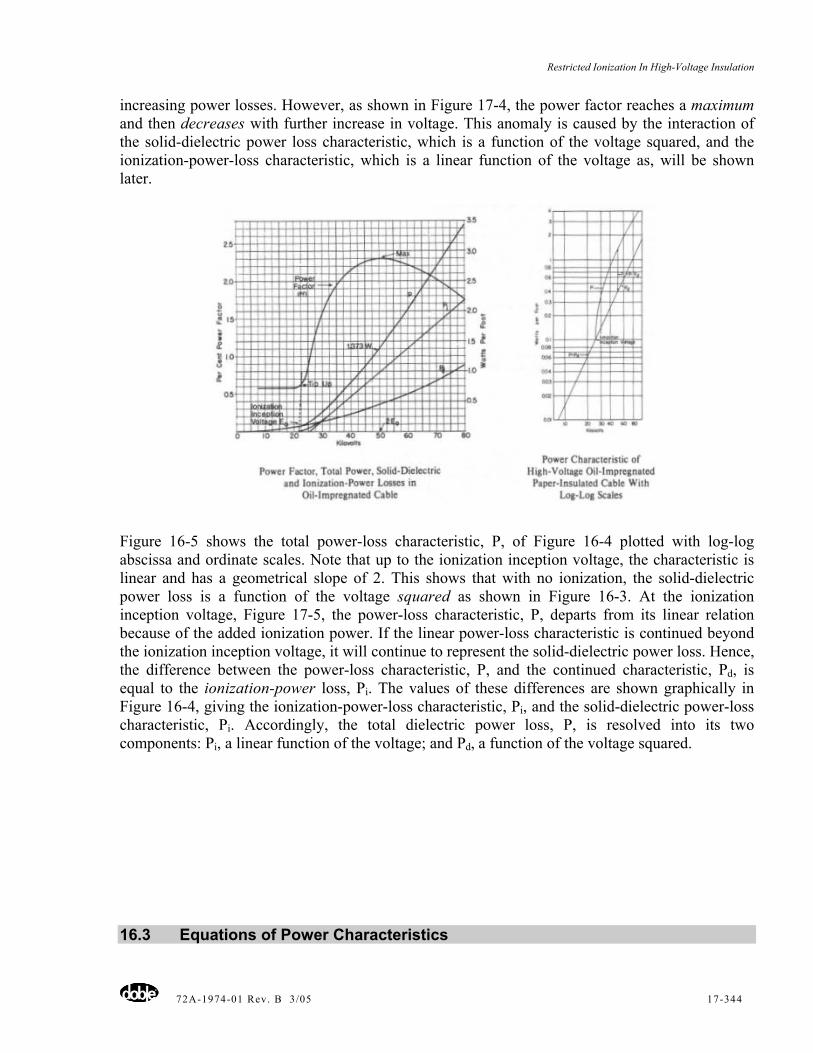
Restricted Ionization In High-Voltage Insulation
72A-1974-01 Rev. B 3/05 17-344
increasing power losses. However, as shown in Figure 17-4, the power factor reaches a maximum and then decreases with further increase in voltage. This anomaly is caused by the interaction of the solid-dielectric power loss characteristic, which is a function of the voltage squared, and the ionization-power-loss characteristic, which is a linear function of the voltage as, will be shown later.
Figure 16-5 shows the total power-loss characteristic, P, of Figure 16-4 plotted with log-log abscissa and ordinate scales. Note that up to the ionization inception voltage, the characteristic is linear and has a geometrical slope of 2. This shows that with no ionization, the solid-dielectric power loss is a function of the voltage squared as shown in Figure 16-3. At the ionization inception voltage, Figure 17-5, the power-loss characteristic, P, departs from its linear relation because of the added ionization power. If the linear power-loss characteristic is continued beyond the ionization inception voltage, it will continue to represent the solid-dielectric power loss. Hence, the difference between the power-loss characteristic, P, and the continued characteristic, Pd, is equal to the ionization-power loss, Pi. The values of these differences are shown graphically in Figure 16-4, giving the ionization-power-loss characteristic, Pi, and the solid-dielectric power-loss characteristic, Pi. Accordingly, the total dielectric power loss, P, is resolved into its two components: Pi, a linear function of the voltage; and Pd, a function of the voltage squared.
16.3 Equations of Power Characteristics
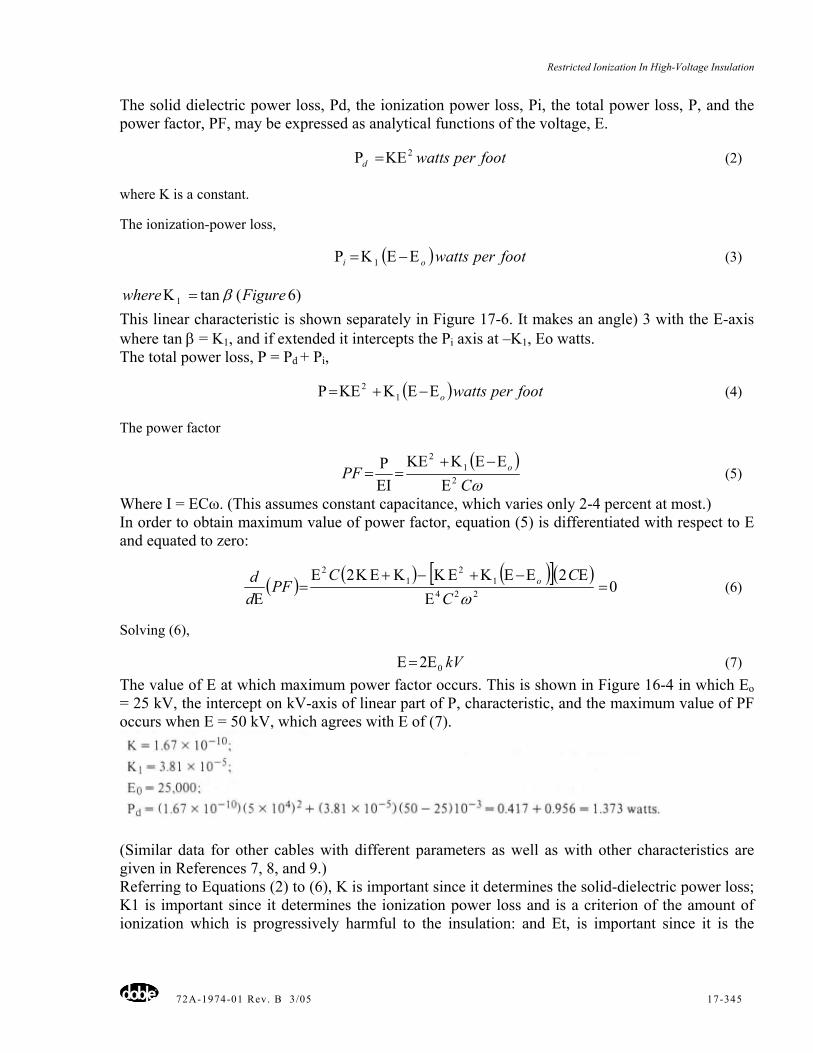
Restricted Ionization In High-Voltage Insulation
72A-1974-01 Rev. B 3/05 17-345
The solid dielectric power loss, Pd, the ionization power loss, Pi, the total power loss, P, and the power factor, PF, may be expressed as analytical functions of the voltage, E.
footperwattsd2ΚΕ=Ρ (2)
where K is a constant.
The ionization-power loss,
( ) footperwattsoi Ε−ΕΚ=Ρ 1 (3)
)6(tan1 Figurewhere β=Κ
This linear characteristic is shown separately in Figure 17-6. It makes an angle) 3 with the E-axis where tan β = K1, and if extended it intercepts the Pi axis at –K1, Eo watts. The total power loss, P = Pd + Pi,
( ) footperwattsoΕ−ΕΚ+ΚΕ=Ρ 12 (4)
The power factor
( )ωC
PF o2
12
ΕΕ−ΕΚ+ΚΕ
=ΕΙΡ
= (5)
Where I = ECω. (This assumes constant capacitance, which varies only 2-4 percent at most.) In order to obtain maximum value of power factor, equation (5) is differentiated with respect to E and equated to zero:
( ) ( ) ( )[ ]( )0
22224
12
12
=Ε
ΕΕ−ΕΚ+ΕΚ−Κ+ΕΚΕ=
Ε ωCCC
PFdd o (6)
Solving (6),
kV02Ε=Ε (7) The value of E at which maximum power factor occurs. This is shown in Figure 16-4 in which Eo = 25 kV, the intercept on kV-axis of linear part of P, characteristic, and the maximum value of PF occurs when E = 50 kV, which agrees with E of (7).
(Similar data for other cables with different parameters as well as with other characteristics are given in References 7, 8, and 9.) Referring to Equations (2) to (6), K is important since it determines the solid-dielectric power loss; K1 is important since it determines the ionization power loss and is a criterion of the amount of ionization which is progressively harmful to the insulation: and Et, is important since it is the
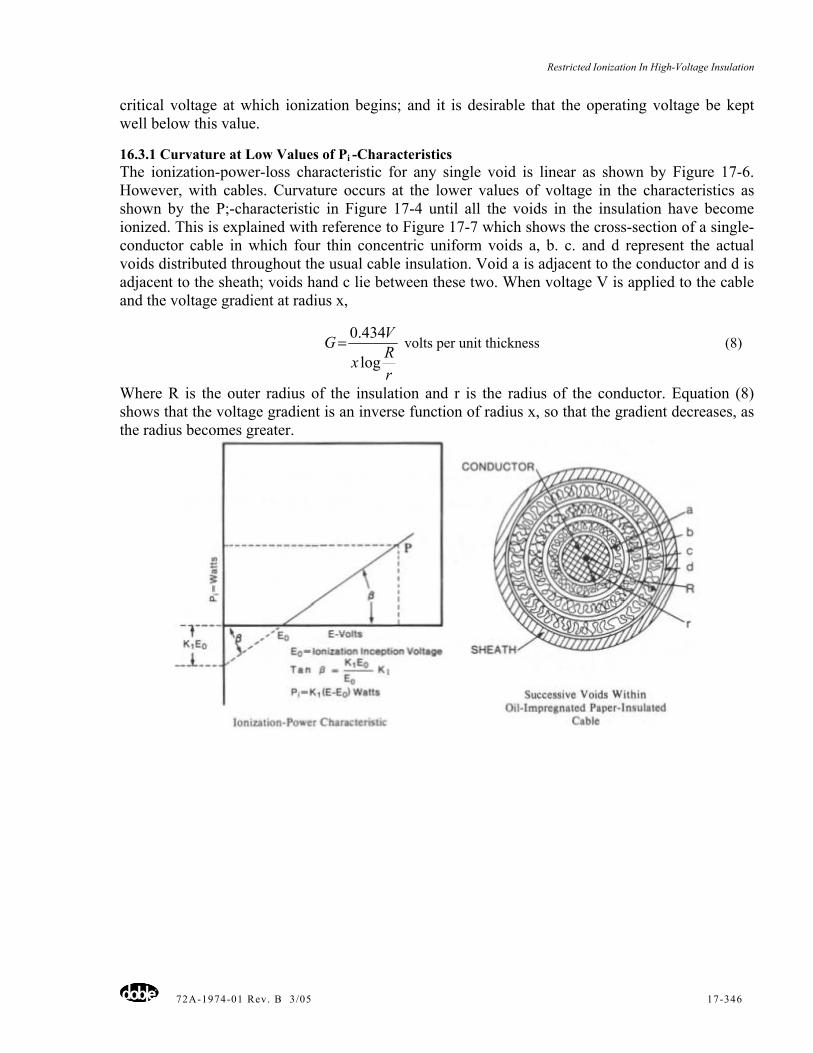
Restricted Ionization In High-Voltage Insulation
72A-1974-01 Rev. B 3/05 17-346
critical voltage at which ionization begins; and it is desirable that the operating voltage be kept well below this value.
16.3.1 Curvature at Low Values of Pi -Characteristics The ionization-power-loss characteristic for any single void is linear as shown by Figure 17-6. However, with cables. Curvature occurs at the lower values of voltage in the characteristics as shown by the P;-characteristic in Figure 17-4 until all the voids in the insulation have become ionized. This is explained with reference to Figure 17-7 which shows the cross-section of a single-conductor cable in which four thin concentric uniform voids a, b. c. and d represent the actual voids distributed throughout the usual cable insulation. Void a is adjacent to the conductor and d is adjacent to the sheath; voids hand c lie between these two. When voltage V is applied to the cable and the voltage gradient at radius x,
rRx
VGlog
434.0= volts per unit thickness (8)
Where R is the outer radius of the insulation and r is the radius of the conductor. Equation (8) shows that the voltage gradient is an inverse function of radius x, so that the gradient decreases, as the radius becomes greater.
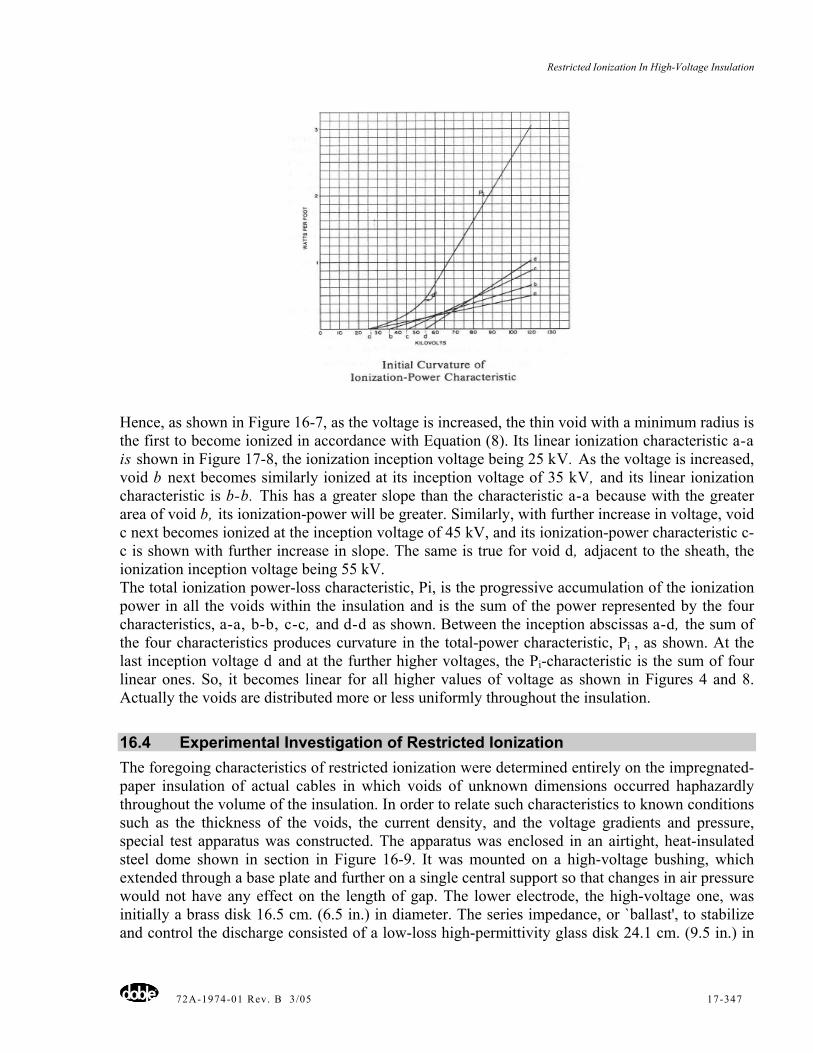
Restricted Ionization In High-Voltage Insulation
72A-1974-01 Rev. B 3/05 17-347
Hence, as shown in Figure 16-7, as the voltage is increased, the thin void with a minimum radius is the first to become ionized in accordance with Equation (8). Its linear ionization characteristic a-a is shown in Figure 17-8, the ionization inception voltage being 25 kV. As the voltage is increased, void b next becomes similarly ionized at its inception voltage of 35 kV, and its linear ionization characteristic is b-b. This has a greater slope than the characteristic a-a because with the greater area of void b, its ionization-power will be greater. Similarly, with further increase in voltage, void c next becomes ionized at the inception voltage of 45 kV, and its ionization-power characteristic c-c is shown with further increase in slope. The same is true for void d, adjacent to the sheath, the ionization inception voltage being 55 kV. The total ionization power-loss characteristic, Pi, is the progressive accumulation of the ionization power in all the voids within the insulation and is the sum of the power represented by the four characteristics, a-a, b-b, c-c, and d-d as shown. Between the inception abscissas a-d, the sum of the four characteristics produces curvature in the total-power characteristic, Pi , as shown. At the last inception voltage d and at the further higher voltages, the Pi-characteristic is the sum of four linear ones. So, it becomes linear for all higher values of voltage as shown in Figures 4 and 8. Actually the voids are distributed more or less uniformly throughout the insulation.
16.4 Experimental Investigation of Restricted Ionization The foregoing characteristics of restricted ionization were determined entirely on the impregnated-paper insulation of actual cables in which voids of unknown dimensions occurred haphazardly throughout the volume of the insulation. In order to relate such characteristics to known conditions such as the thickness of the voids, the current density, and the voltage gradients and pressure, special test apparatus was constructed. The apparatus was enclosed in an airtight, heat-insulated steel dome shown in section in Figure 16-9. It was mounted on a high-voltage bushing, which extended through a base plate and further on a single central support so that changes in air pressure would not have any effect on the length of gap. The lower electrode, the high-voltage one, was initially a brass disk 16.5 cm. (6.5 in.) in diameter. The series impedance, or `ballast', to stabilize and control the discharge consisted of a low-loss high-permittivity glass disk 24.1 cm. (9.5 in.) in
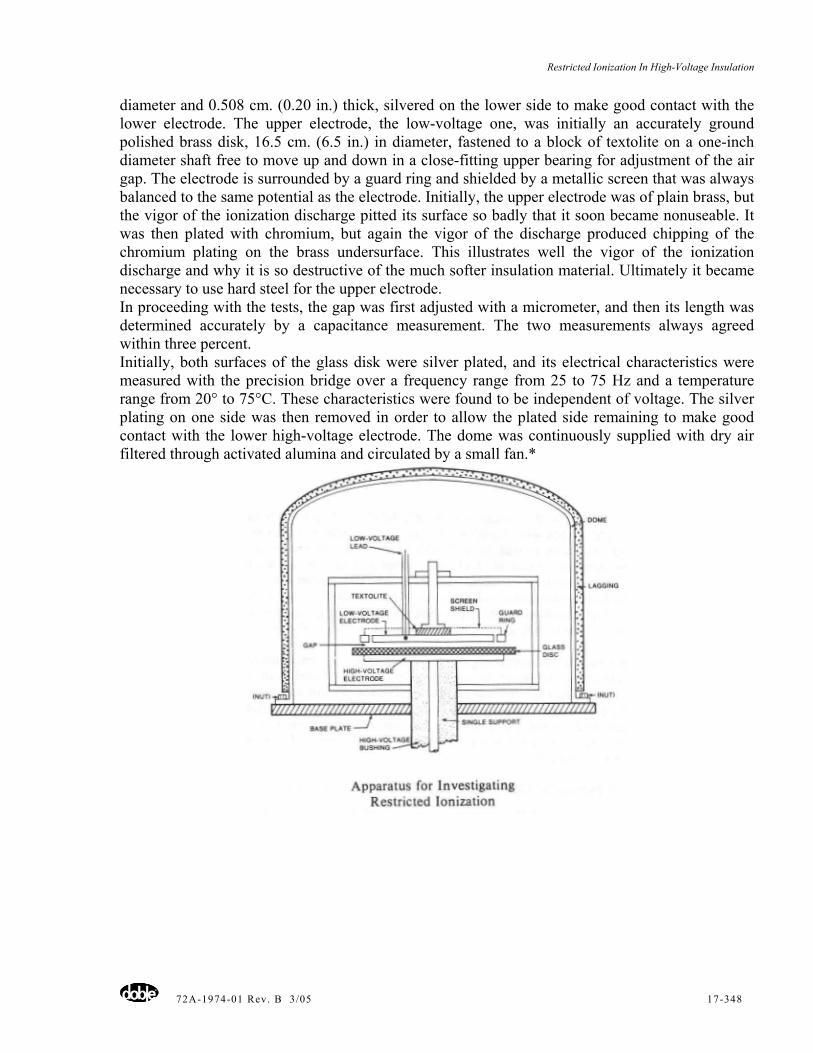
Restricted Ionization In High-Voltage Insulation
72A-1974-01 Rev. B 3/05 17-348
diameter and 0.508 cm. (0.20 in.) thick, silvered on the lower side to make good contact with the lower electrode. The upper electrode, the low-voltage one, was initially an accurately ground polished brass disk, 16.5 cm. (6.5 in.) in diameter, fastened to a block of textolite on a one-inch diameter shaft free to move up and down in a close-fitting upper bearing for adjustment of the air gap. The electrode is surrounded by a guard ring and shielded by a metallic screen that was always balanced to the same potential as the electrode. Initially, the upper electrode was of plain brass, but the vigor of the ionization discharge pitted its surface so badly that it soon became nonuseable. It was then plated with chromium, but again the vigor of the discharge produced chipping of the chromium plating on the brass undersurface. This illustrates well the vigor of the ionization discharge and why it is so destructive of the much softer insulation material. Ultimately it became necessary to use hard steel for the upper electrode. In proceeding with the tests, the gap was first adjusted with a micrometer, and then its length was determined accurately by a capacitance measurement. The two measurements always agreed within three percent. Initially, both surfaces of the glass disk were silver plated, and its electrical characteristics were measured with the precision bridge over a frequency range from 25 to 75 Hz and a temperature range from 20° to 75°C. These characteristics were found to be independent of voltage. The silver plating on one side was then removed in order to allow the plated side remaining to make good contact with the lower high-voltage electrode. The dome was continuously supplied with dry air filtered through activated alumina and circulated by a small fan.*
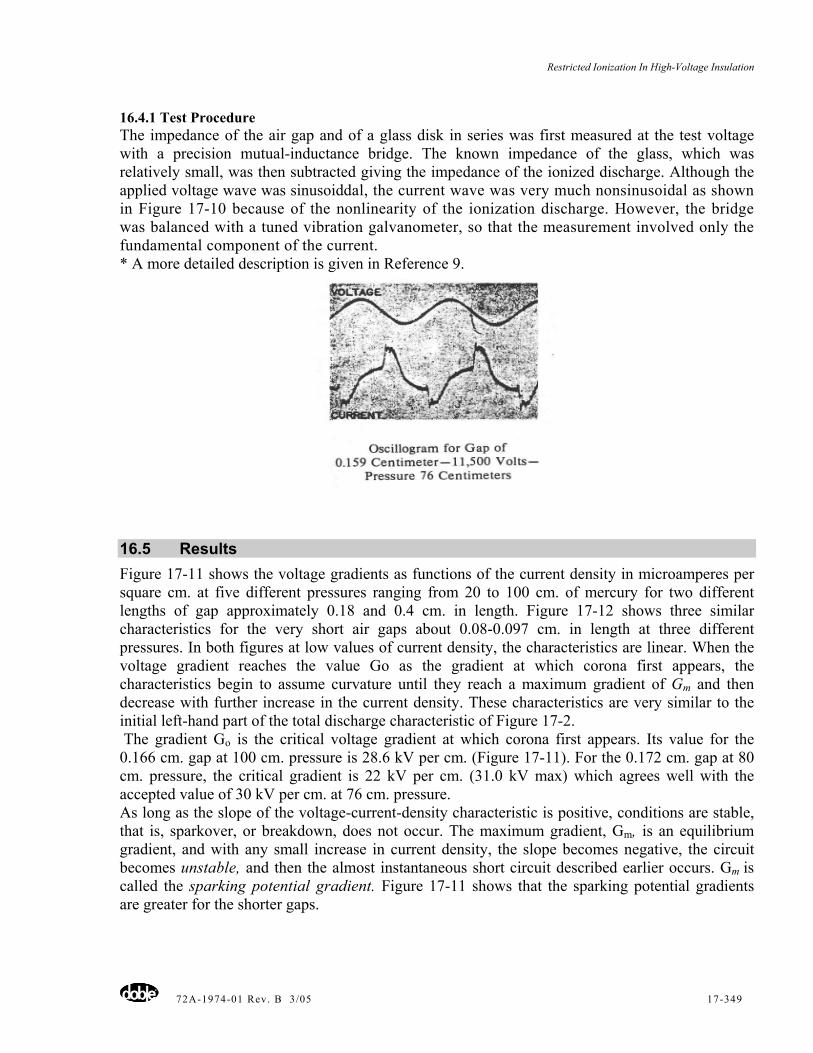
Restricted Ionization In High-Voltage Insulation
72A-1974-01 Rev. B 3/05 17-349
16.4.1 Test Procedure The impedance of the air gap and of a glass disk in series was first measured at the test voltage with a precision mutual-inductance bridge. The known impedance of the glass, which was relatively small, was then subtracted giving the impedance of the ionized discharge. Although the applied voltage wave was sinusoiddal, the current wave was very much nonsinusoidal as shown in Figure 17-10 because of the nonlinearity of the ionization discharge. However, the bridge was balanced with a tuned vibration galvanometer, so that the measurement involved only the fundamental component of the current. * A more detailed description is given in Reference 9.
16.5 Results Figure 17-11 shows the voltage gradients as functions of the current density in microamperes per square cm. at five different pressures ranging from 20 to 100 cm. of mercury for two different lengths of gap approximately 0.18 and 0.4 cm. in length. Figure 17-12 shows three similar characteristics for the very short air gaps about 0.08-0.097 cm. in length at three different pressures. In both figures at low values of current density, the characteristics are linear. When the voltage gradient reaches the value Go as the gradient at which corona first appears, the characteristics begin to assume curvature until they reach a maximum gradient of Gm and then decrease with further increase in the current density. These characteristics are very similar to the initial left-hand part of the total discharge characteristic of Figure 17-2. The gradient Go is the critical voltage gradient at which corona first appears. Its value for the 0.166 cm. gap at 100 cm. pressure is 28.6 kV per cm. (Figure 17-11). For the 0.172 cm. gap at 80 cm. pressure, the critical gradient is 22 kV per cm. (31.0 kV max) which agrees well with the accepted value of 30 kV per cm. at 76 cm. pressure. As long as the slope of the voltage-current-density characteristic is positive, conditions are stable, that is, sparkover, or breakdown, does not occur. The maximum gradient, Gm, is an equilibrium gradient, and with any small increase in current density, the slope becomes negative, the circuit becomes unstable, and then the almost instantaneous short circuit described earlier occurs. Gm is called the sparking potential gradient. Figure 17-11 shows that the sparking potential gradients are greater for the shorter gaps.
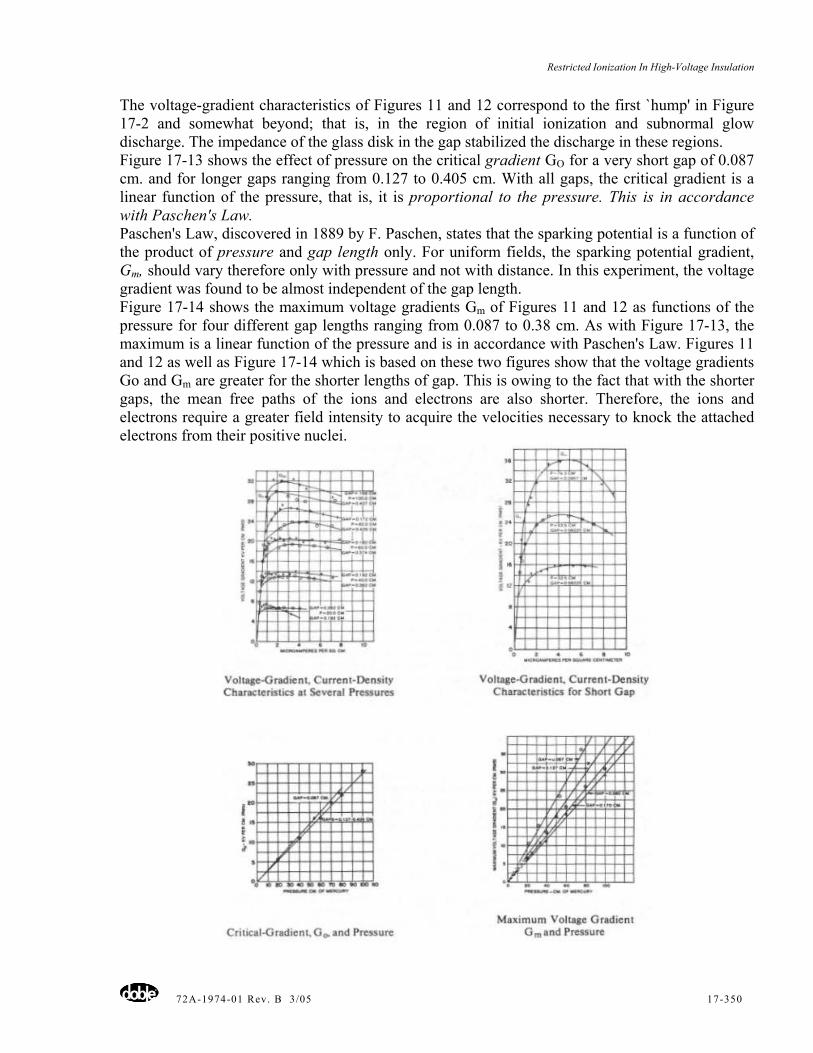
Restricted Ionization In High-Voltage Insulation
72A-1974-01 Rev. B 3/05 17-350
The voltage-gradient characteristics of Figures 11 and 12 correspond to the first `hump' in Figure 17-2 and somewhat beyond; that is, in the region of initial ionization and subnormal glow discharge. The impedance of the glass disk in the gap stabilized the discharge in these regions. Figure 17-13 shows the effect of pressure on the critical gradient GO for a very short gap of 0.087 cm. and for longer gaps ranging from 0.127 to 0.405 cm. With all gaps, the critical gradient is a linear function of the pressure, that is, it is proportional to the pressure. This is in accordance with Paschen's Law. Paschen's Law, discovered in 1889 by F. Paschen, states that the sparking potential is a function of the product of pressure and gap length only. For uniform fields, the sparking potential gradient, Gm, should vary therefore only with pressure and not with distance. In this experiment, the voltage gradient was found to be almost independent of the gap length. Figure 17-14 shows the maximum voltage gradients Gm of Figures 11 and 12 as functions of the pressure for four different gap lengths ranging from 0.087 to 0.38 cm. As with Figure 17-13, the maximum is a linear function of the pressure and is in accordance with Paschen's Law. Figures 11 and 12 as well as Figure 17-14 which is based on these two figures show that the voltage gradients Go and Gm are greater for the shorter lengths of gap. This is owing to the fact that with the shorter gaps, the mean free paths of the ions and electrons are also shorter. Therefore, the ions and electrons require a greater field intensity to acquire the velocities necessary to knock the attached electrons from their positive nuclei.
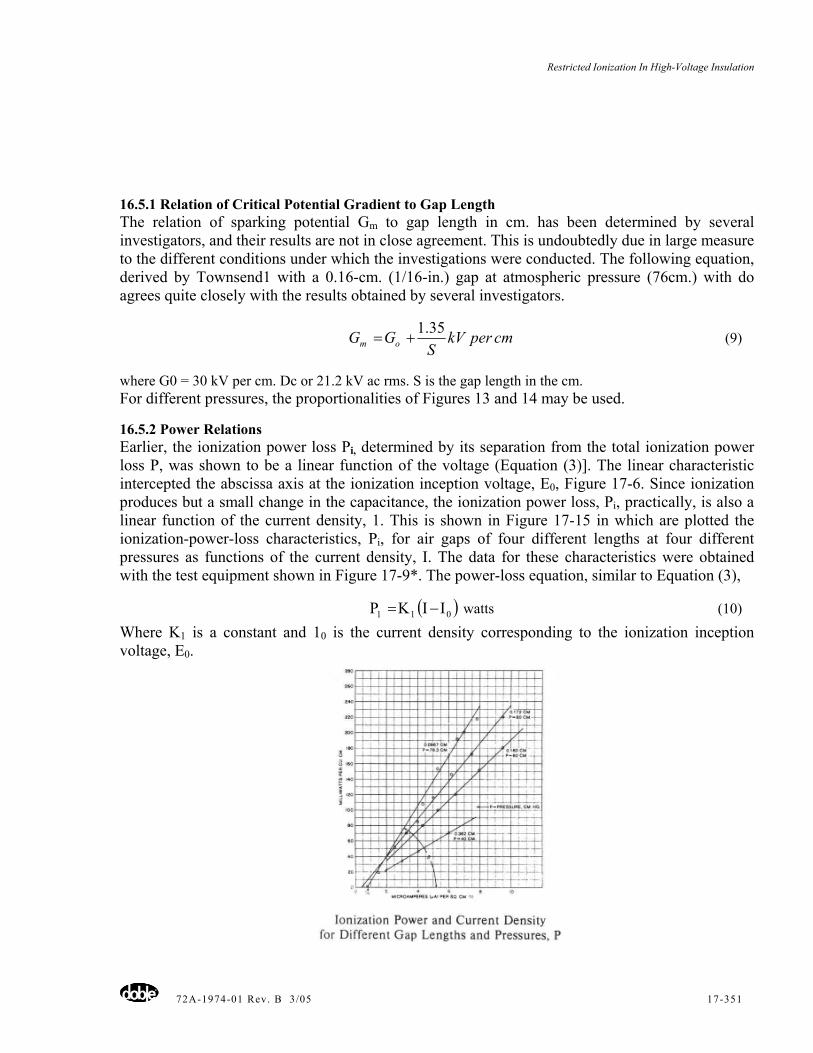
Restricted Ionization In High-Voltage Insulation
72A-1974-01 Rev. B 3/05 17-351
16.5.1 Relation of Critical Potential Gradient to Gap Length The relation of sparking potential Gm to gap length in cm. has been determined by several investigators, and their results are not in close agreement. This is undoubtedly due in large measure to the different conditions under which the investigations were conducted. The following equation, derived by Townsend1 with a 0.16-cm. (1/16-in.) gap at atmospheric pressure (76cm.) with do agrees quite closely with the results obtained by several investigators.
cmperkVS
GG om35.1
+= (9)
where G0 = 30 kV per cm. Dc or 21.2 kV ac rms. S is the gap length in the cm. For different pressures, the proportionalities of Figures 13 and 14 may be used.
16.5.2 Power Relations Earlier, the ionization power loss Pi, determined by its separation from the total ionization power loss P, was shown to be a linear function of the voltage (Equation (3)]. The linear characteristic intercepted the abscissa axis at the ionization inception voltage, E0, Figure 17-6. Since ionization produces but a small change in the capacitance, the ionization power loss, Pi, practically, is also a linear function of the current density, 1. This is shown in Figure 17-15 in which are plotted the ionization-power-loss characteristics, Pi, for air gaps of four different lengths at four different pressures as functions of the current density, I. The data for these characteristics were obtained with the test equipment shown in Figure 17-9*. The power-loss equation, similar to Equation (3),
( )011 Ι−ΙΚ=Ρ watts (10)
Where K1 is a constant and 10 is the current density corresponding to the ionization inception voltage, E0.
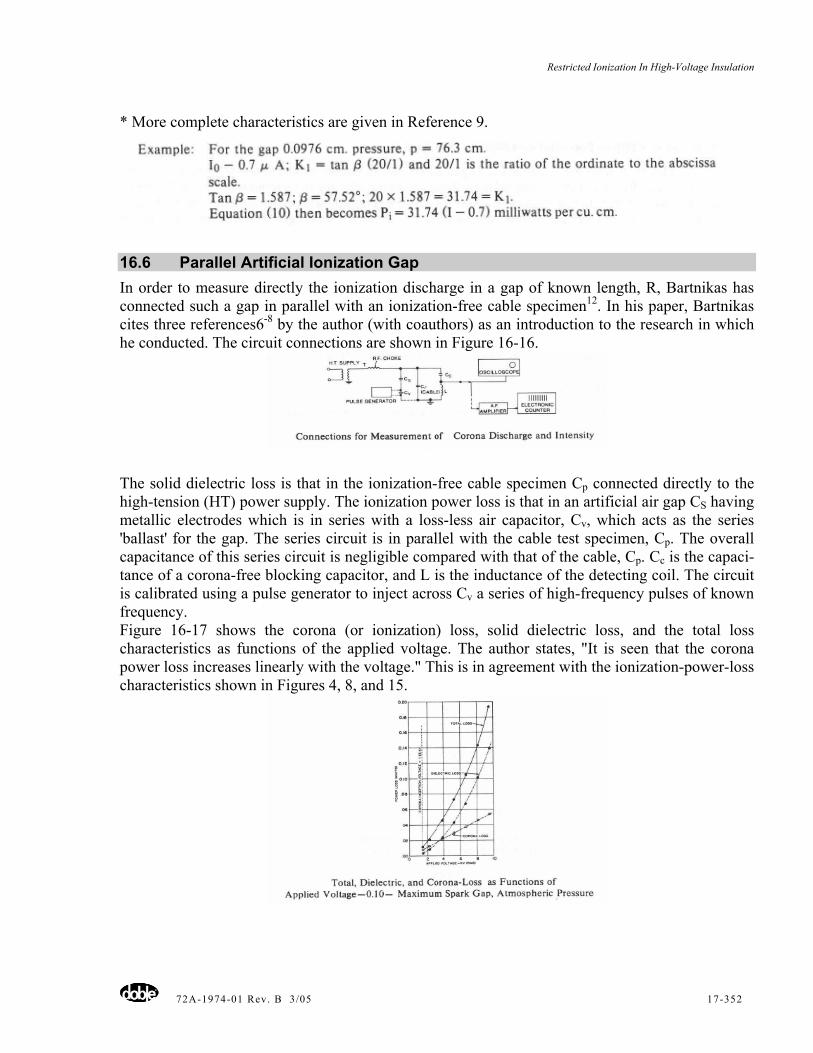
Restricted Ionization In High-Voltage Insulation
72A-1974-01 Rev. B 3/05 17-352
* More complete characteristics are given in Reference 9.
16.6 Parallel Artificial Ionization Gap In order to measure directly the ionization discharge in a gap of known length, R, Bartnikas has connected such a gap in parallel with an ionization-free cable specimen12. In his paper, Bartnikas cites three references6-8 by the author (with coauthors) as an introduction to the research in which he conducted. The circuit connections are shown in Figure 16-16.
The solid dielectric loss is that in the ionization-free cable specimen Cp connected directly to the high-tension (HT) power supply. The ionization power loss is that in an artificial air gap CS having metallic electrodes which is in series with a loss-less air capacitor, Cv, which acts as the series 'ballast' for the gap. The series circuit is in parallel with the cable test specimen, Cp. The overall capacitance of this series circuit is negligible compared with that of the cable, Cp. Cc is the capaci-tance of a corona-free blocking capacitor, and L is the inductance of the detecting coil. The circuit is calibrated using a pulse generator to inject across Cv a series of high-frequency pulses of known frequency. Figure 16-17 shows the corona (or ionization) loss, solid dielectric loss, and the total loss characteristics as functions of the applied voltage. The author states, "It is seen that the corona power loss increases linearly with the voltage." This is in agreement with the ionization-power-loss characteristics shown in Figures 4, 8, and 15.
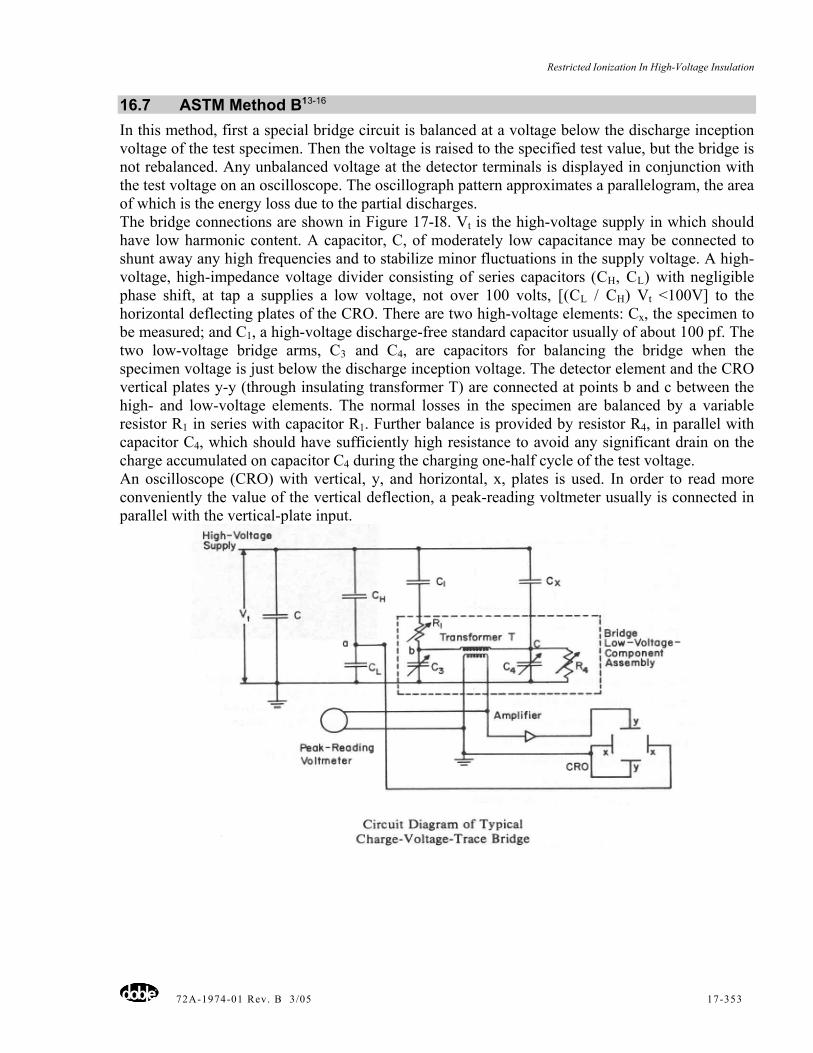
Restricted Ionization In High-Voltage Insulation
72A-1974-01 Rev. B 3/05 17-353
16.7 ASTM Method B13-16
In this method, first a special bridge circuit is balanced at a voltage below the discharge inception voltage of the test specimen. Then the voltage is raised to the specified test value, but the bridge is not rebalanced. Any unbalanced voltage at the detector terminals is displayed in conjunction with the test voltage on an oscilloscope. The oscillograph pattern approximates a parallelogram, the area of which is the energy loss due to the partial discharges. The bridge connections are shown in Figure 17-I8. Vt is the high-voltage supply in which should have low harmonic content. A capacitor, C, of moderately low capacitance may be connected to shunt away any high frequencies and to stabilize minor fluctuations in the supply voltage. A high-voltage, high-impedance voltage divider consisting of series capacitors (CH, CL) with negligible phase shift, at tap a supplies a low voltage, not over 100 volts, [(CL / CH) Vt <100V] to the horizontal deflecting plates of the CRO. There are two high-voltage elements: Cx, the specimen to be measured; and C1, a high-voltage discharge-free standard capacitor usually of about 100 pf. The two low-voltage bridge arms, C3 and C4, are capacitors for balancing the bridge when the specimen voltage is just below the discharge inception voltage. The detector element and the CRO vertical plates y-y (through insulating transformer T) are connected at points b and c between the high- and low-voltage elements. The normal losses in the specimen are balanced by a variable resistor R1 in series with capacitor R1. Further balance is provided by resistor R4, in parallel with capacitor C4, which should have sufficiently high resistance to avoid any significant drain on the charge accumulated on capacitor C4 during the charging one-half cycle of the test voltage. An oscilloscope (CRO) with vertical, y, and horizontal, x, plates is used. In order to read more conveniently the value of the vertical deflection, a peak-reading voltmeter usually is connected in parallel with the vertical-plate input.
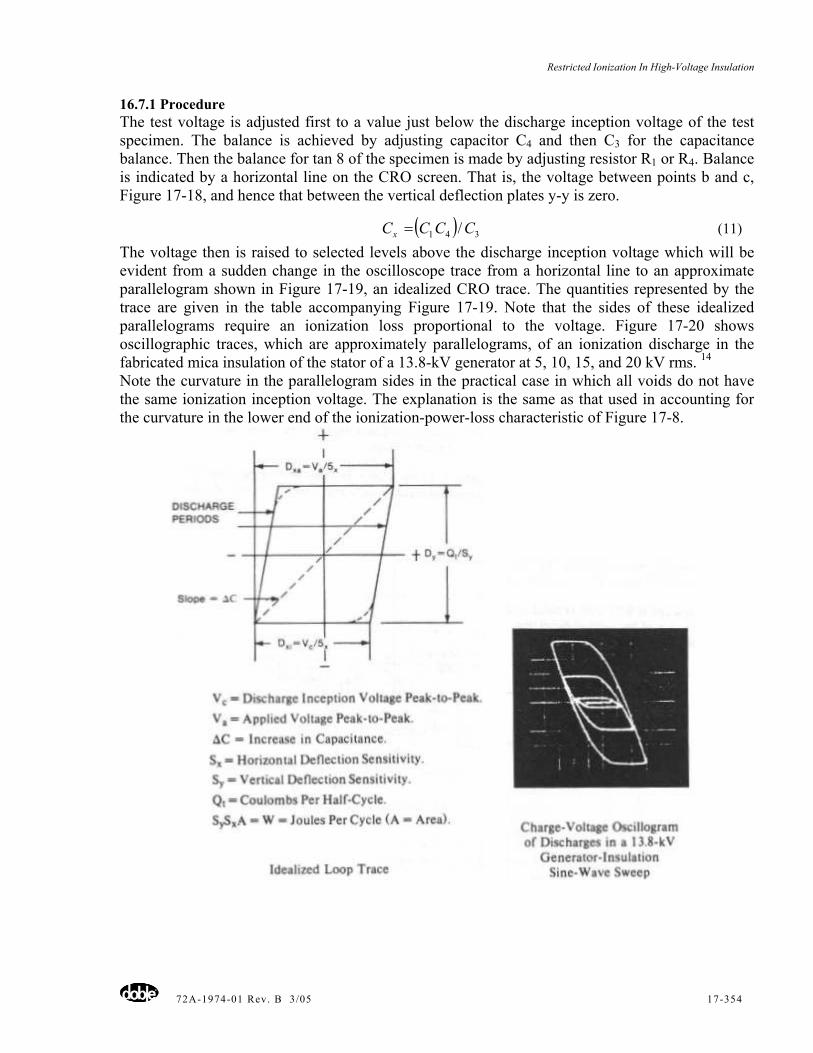
Restricted Ionization In High-Voltage Insulation
72A-1974-01 Rev. B 3/05 17-354
16.7.1 Procedure The test voltage is adjusted first to a value just below the discharge inception voltage of the test specimen. The balance is achieved by adjusting capacitor C4 and then C3 for the capacitance balance. Then the balance for tan 8 of the specimen is made by adjusting resistor R1 or R4. Balance is indicated by a horizontal line on the CRO screen. That is, the voltage between points b and c, Figure 17-18, and hence that between the vertical deflection plates y-y is zero.
( ) 341 /CCCCx = (11)
The voltage then is raised to selected levels above the discharge inception voltage which will be evident from a sudden change in the oscilloscope trace from a horizontal line to an approximate parallelogram shown in Figure 17-19, an idealized CRO trace. The quantities represented by the trace are given in the table accompanying Figure 17-19. Note that the sides of these idealized parallelograms require an ionization loss proportional to the voltage. Figure 17-20 shows oscillographic traces, which are approximately parallelograms, of an ionization discharge in the fabricated mica insulation of the stator of a 13.8-kV generator at 5, 10, 15, and 20 kV rms. 14
Note the curvature in the parallelogram sides in the practical case in which all voids do not have the same ionization inception voltage. The explanation is the same as that used in accounting for the curvature in the lower end of the ionization-power-loss characteristic of Figure 17-8.
Restricted Ionization In High-Voltage Insulation
72A-1974-01 Rev. B 3/05 17-355
16.8 Linear Ionization Power Characteristics The linear characteristic of the ionization power loss as a function of the current density beginning with the ionization inception voltage is explained by the fact that the voltage of an ionization discharge ultimately becomes constant, or nearly so, when the current attains a critical value as shown in Figures 11 and 12. It is very nearly true for the first 'hump' in Figure 17-2 considering that the abscissa scale is logarithmic. Townsend also showed that with direct current at 2.0, 1.5, and 0.5cm. spacing of the electrodes, the volts per centimeter became asymptotically constant as the gradient is increased.1 It follows that with constant voltage across the ionization discharge, the ionization power loss would increase as a linear function of the current. The author is most appreciative of suggestions and assistance in the preparation of this paper given by A. L. Rickley and by E. H. Povey of the Doble Engineering Company.
16.9 Definitions Corona - A luminous discharge due to ionization of air surrounding a conductor caused by a voltage gradient exceeding a certain critical gradient. American Standard Definitions of Electrical Terms (Transmission) 35.60.125). Corona Effect - The particular form of the glow discharge that occurs in the neighborhood of electric conductors where the insulation is subject to high electric stress. IEEE Standard Definitions of General Electrical and Electronic Terms. Corona Effect - The formation of ions by the division of molecules or by the addition or removal of electrons from atoms, molecules, or groups of the latter. American Standard Definitions of Electrical Terms (05.10.130). Corona Inception Voltage (CIV) - The lowest voltage at which continuous corona occurs as the applied voltage is gradually increased. Where the applied voltage is alternating, the CIV is expressed as IIJ2 of the peak voltage. ASTM13. Corona Extinction Voltage (CEV) - The highest voltage at which corona continues as the voltage is gradually decreased from above the corona inception value. Where the applied voltage is alternating, the CEV is expressed as 1/ √2 of the peak voltage. ASTM 13.
16.10 References 1. Cobine, James A. Gaseous Conductors. McGraw-Hill Book Company. 2. Crowther, James A. Ions, Electrons, and Ionizing Radiations. London: Longmans
Green & Co. 3. Townsend, S. Electricity in Gases. Oxford (Clarendon Press). 4. Whitehead, S. Dielectric Phenomena-Electrical Discharge in Gases. D.
VanNostrand Company, Inc., 1927.
5. Bartnikas, R. "Pulse Corona Loss Measurements in Artificial Voids and Cables." CIGRE, vol. II (1966), paper 202.
6. Dawes, C. L. and P. L. Hoover. "Ionization Studies in Paper-Insulated Cables, L" Trans. AIEE, 1926, page 141.
7. Dawes, C. L. and P. H. Humphries. "Characteristics of Restricted Ionization and Its Relation to Voids in Insulating Materials." Trans. AIEE, 1940, page 701.
Restricted Ionization In High-Voltage Insulation
72A-1974-01 Rev. B 3/05 17-356
8. Dawes, C. L. and P. H. Humphries. "Ionization Studies in Paper-Insulated Cables, Ill." Trans. AIEE.1930, page 766.
9. Dawes, C. L. and H. H. Reichard. "Ionization Studies in Paper-Insulated Cables, II." Trans. AIEE. 1929, page 388.
10. Hewitt, G. W. and T. W. Dakin. "Voltage Endurance Tests of Insulating Methods Under Corona Conditions." Trans. AIEE, 1963, page 1033.
11. Schrader, J. E. "Corona in Air Space in a Dielectric." Trans. AIEE, 1922, page 583. 12. Vora, l. P. and S. L. Foster. "Power Transformers and Corona Testing." Trans. AIEE,
1965, page 707. 13. ASTM Standards: Electrical Insulating Test Methods D 1868 (1974 Revision-Page 459). 14. Dakin, T. W., and P. J. Malinaric. "A Capacitance Bridge Method for Measuring Integrated
Corona Charge Transfer and Power Loss per Cycle." Trans. AIEE (1960), Page 648. 15. Povey, E. H. "Ionization Loss Measurements." Minutes of the Thirty-Eighth Annual
International Conference of Doble Clients (1971), Sec. 3-701. 16. ASTM Standards Methods of Tests for Measurement of Energy and integrated
Charge Transfer due to Partial Discharge (Corona) Using Bridge Techniques, Method D-3382.