Embed Size (px)
Citation preview

CRES .REMOTE SENSING LABORATORY
HIM
DIELECTRIC PROPERTIES OF SOILS AS A FUNCTIONOF MOISTURE CONTENT
REMOTE SENSING LABORATORY
, RSL Technical Report 177-47
"(NlsT-CB-Tuf868)~ "blELECTRfc PROPERTIES OFSOILS AS A FUNCTION OF MOISTURE CONTSNT(Kansas Univ. Center for Research, Inc.)61 p HC $4.25 CSCL 083
G3/46
N75-2&555
Unclas266U4
Josef CihlorFowwox T. Ulaby
November, 1974
Supported by:
NATIONAL AERONAUTICS AND SPACE ADM1NISTRAT1OLyndon B. Johnson Space Center f '- \ ""
Houston, Texas 77058 /C^
CONTRACT NAS 9-10261 /C? ^ *•
•^7
THE UNIVERSITY OF KANSAS CENTER FOR RESEARCH, INC.2291 Irving Hill Drive—Campus West Lawrence, Kansas 66045
https://ntrs.nasa.gov/search.jsp?R=19750018483 2018-05-08T04:50:33+00:00Z
THE UNIVERSITY OF KANSAS SPACE TECHNOLOGY CENTERRaymond Nichols Hall CENTER FOR RESEARCH , INC .
2291 Irving Hill Drive—Campus West Lawrence, Kansas 66045
Telephone:
DIELECTRIC PROPERTIES OF SOILS AS A FUNCTION
OF MOISTURE CONTENT
CRES Technical Report 177-47
Josef Cihlar
Fawwaz T. Ulaby
November, 1974
Supported by:
NATIONAL AERONAUTICS AND SPACE ADMINISTRATIONLyndon B. Johnson Space Center
Houston, Texas 77058
CONTRACT NAS 9-10261
.REMOTE SENSING LABORATORY

TABLE OF CONTENTS
Page
ABSTRACT v
1.0 INTRODUCTION 1
2.0 TARGET-SENSOR INTERACTION 1
2.1 Reflection Coefficient 22.2 Skin Depth 3
3.0 DIELECTRIC PROPERTIES OF SOILS 4
3.1 Moisture 53.2 Bulk Density ". 343.3 Soil Type 383.4 Temperature 423.5 Frequency 42
4.0 REPRESENTATIVE DIELECTRIC VALUES 43
APPENDIX A. BIBLIOGRAPHY 57
REFERENCES 60
LIST OF FIGURES
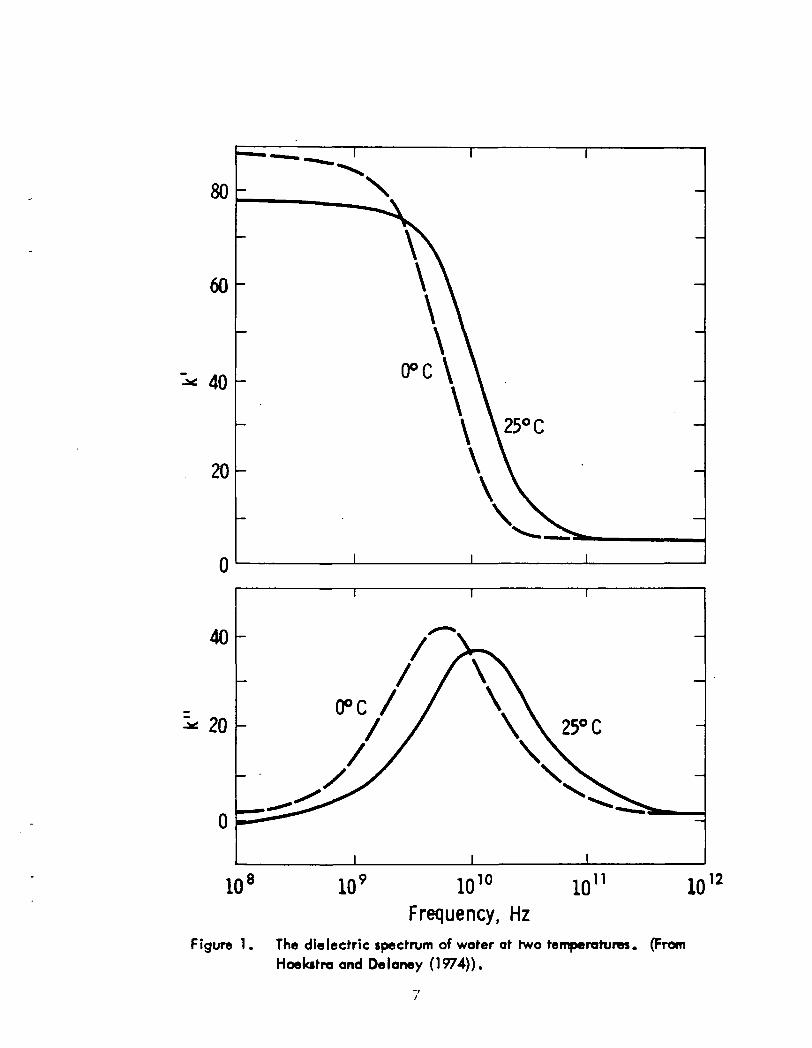
Figure 1. The dielectric spectrum of water at two temperatures.(FromHoekstra and Delaney (1974)). Rage 7
Figure 2. Relative dielectric constant values of soil as a function ofgravimetric water content: Sand; frequency 0.13 GHz - 3.0 GHz;real part. Poge g
Figure 3. Relative dielectric constant values of soil as a function ofgravimetric water content: Sand; frequency 0.13 GHz - 3.0 GHz;imaginary part. Page 9
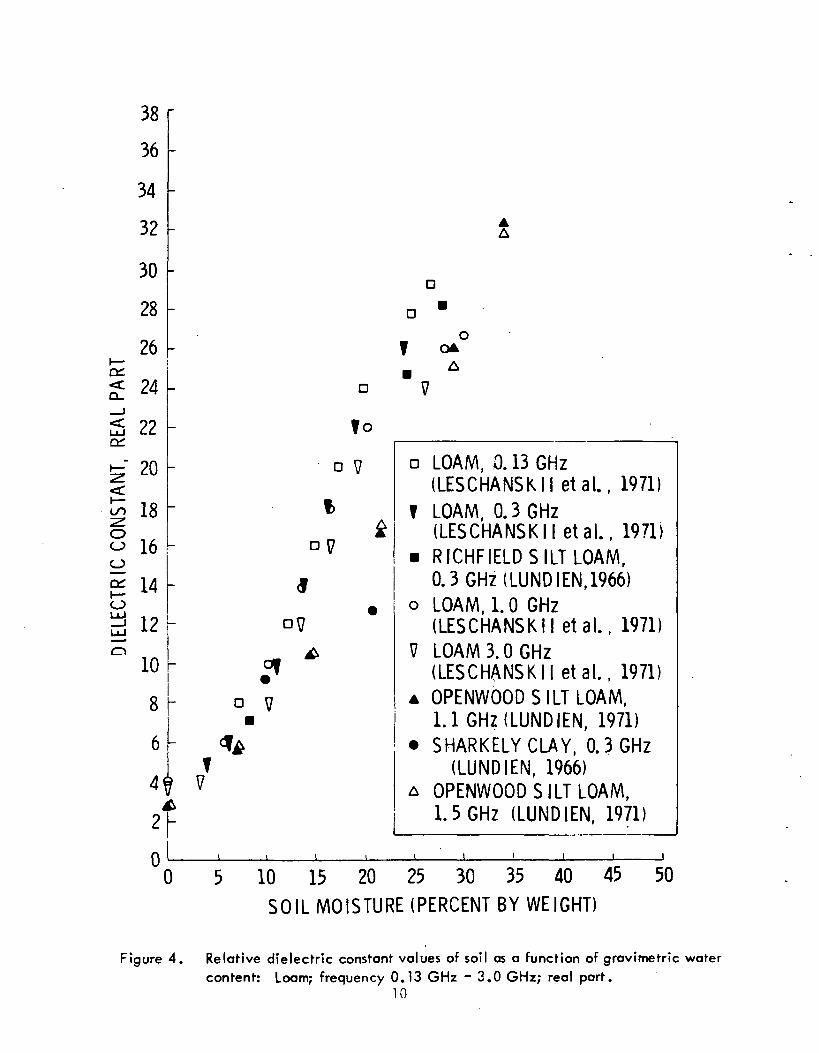
Figure 4. Relative dielectric constant values of soil as a function ofgravimetric water content: Loam; frequency 0.13 GHz - 3.0 GHz;real part. page 10
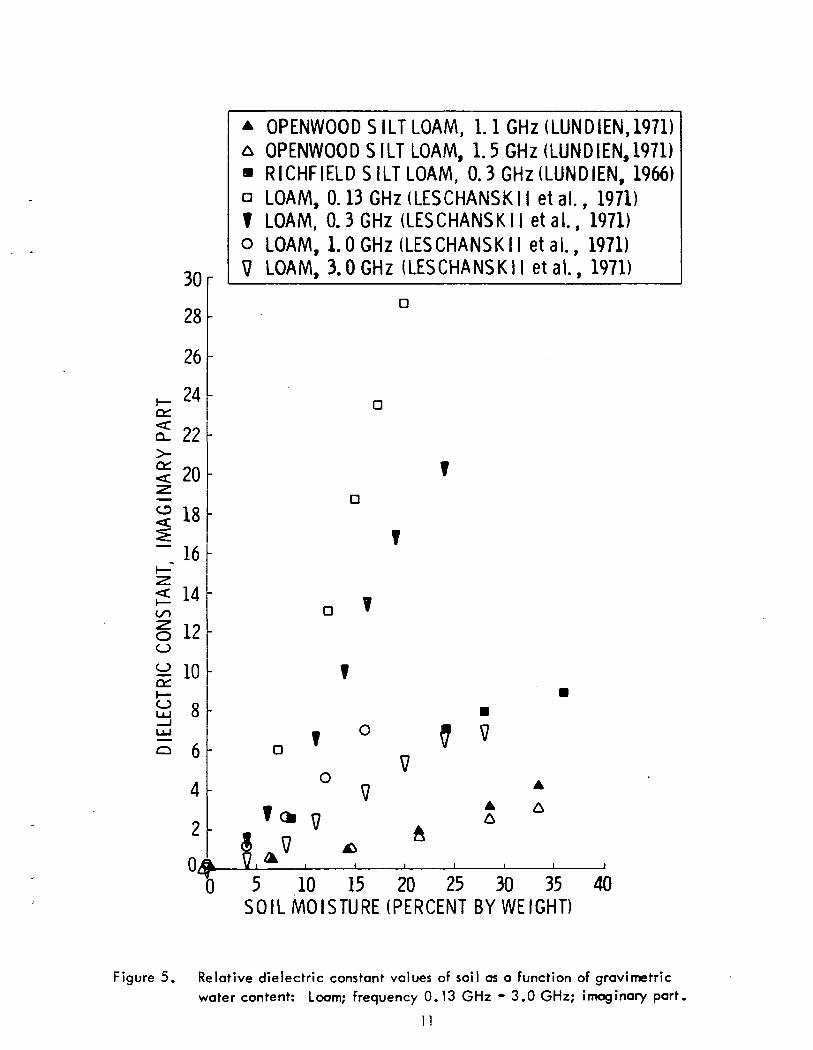
Figure 5. Relative dielectric constant values of soil as a function ofgravimetric water content: Loam; frequency 0.13 GHz - 3.0 GHz;imaginary part. Page 11
Figure 6. Relative dielectric constant values of soil as a function ofgravimetric water content: Clay; frequency 1.1 GHz - 1.5 GHz;real part. Page 12
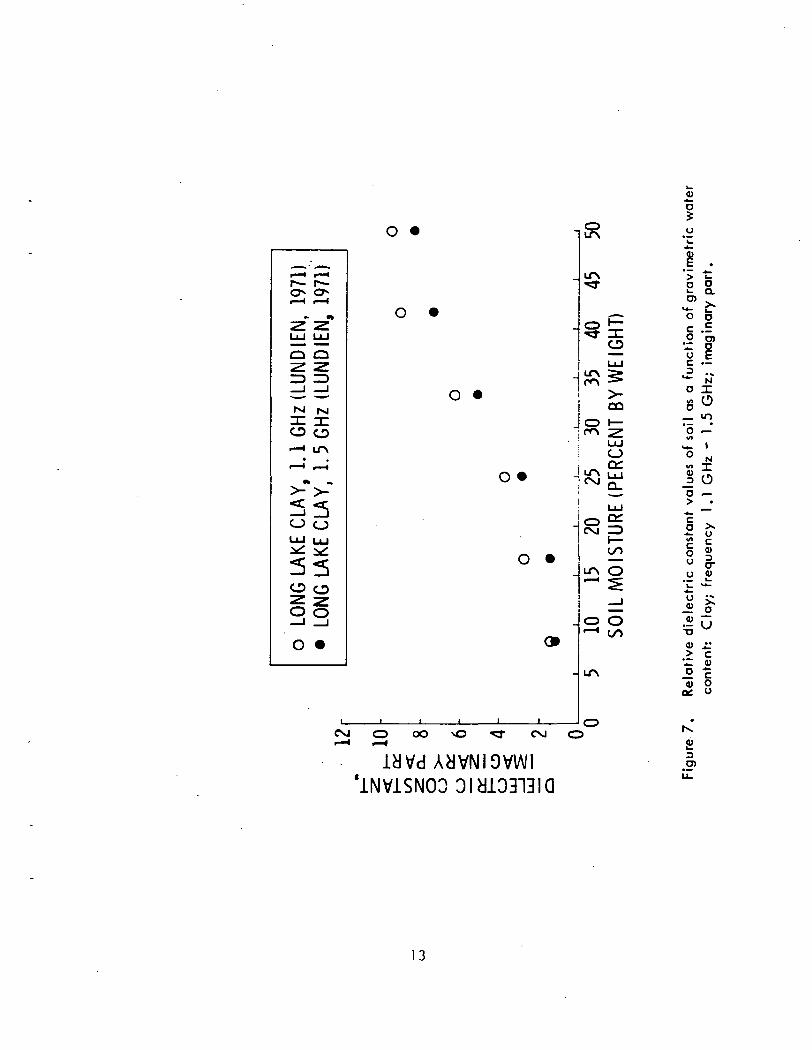
Figure 7. Relative dielectric constant values of soil as a function ofgravimetric water content: Clay; frequency 1.1 GHz -1.5 GHz;imaginary part. Page 13
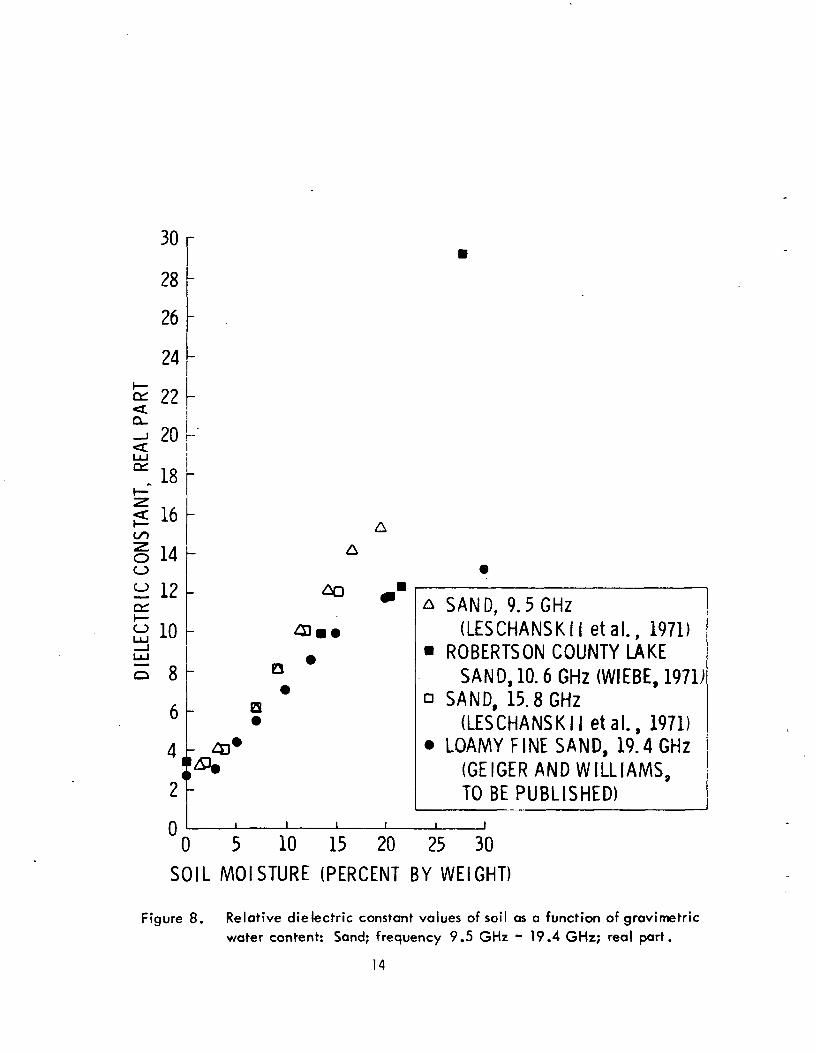
Figure 8. Relative dielectric constant values of soil as a function ofgravimetric water content: Sand; frequency 9.5 GHz - 19.4 GHz;real part. Page 14
Figure 9. Relative dielectric constant values of soil as a function ofgravimetric water content: Sand; frequency 9.5 GHz - 19.4 GHz;imaginary part. page 15
Figure 10. Relative dielectric constant values of soil as a function ofgravimetric water content: Loam; frequency 9.4 GHz - 19.4 GHz;real part. Page 16
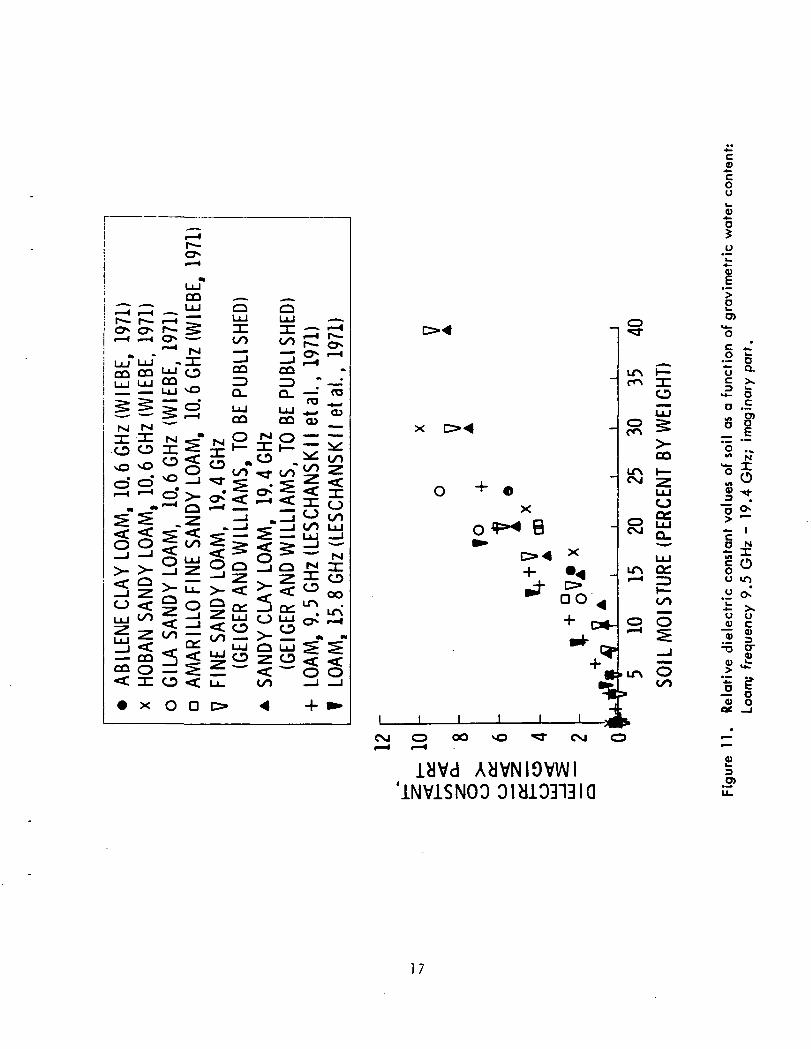
Figure 11. Relative dielectric constant values of soil as a function ofgravimetric water content: Loam; frequency 9.5 GHz - 19.4 GHz;imaginary part. Page ]j
it

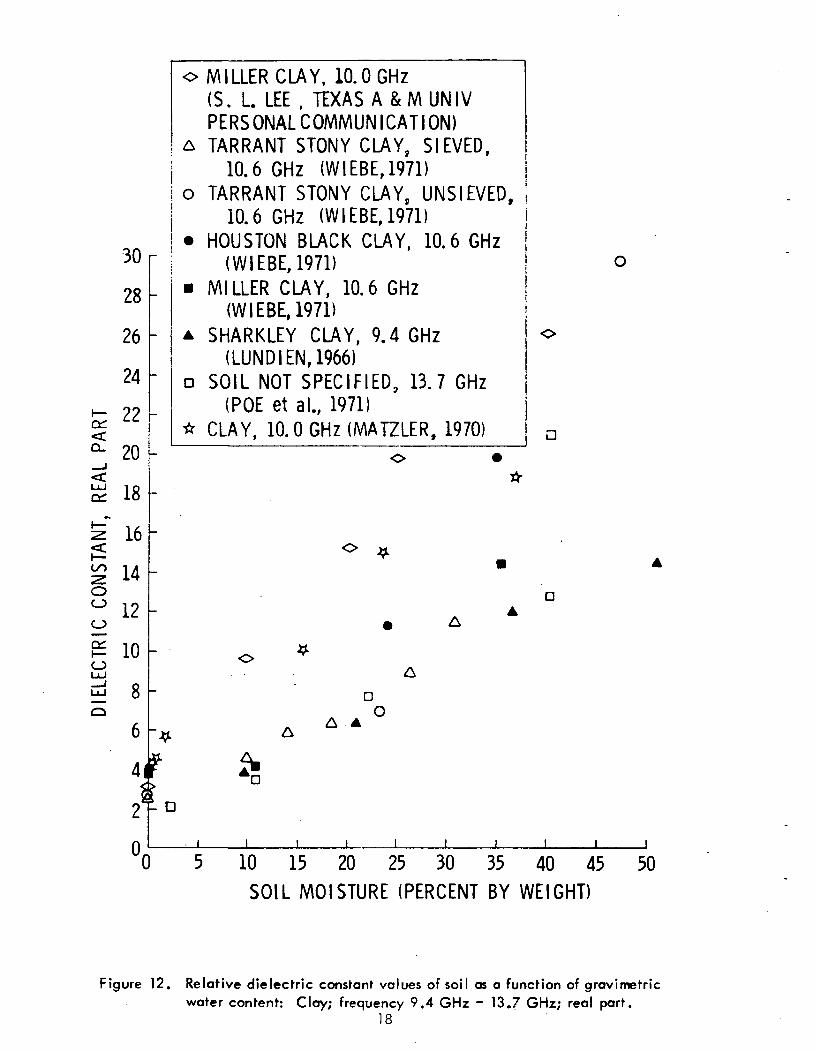
Figure 12. Relative dielectric constant values of soil as a function ofgravimetric water content: Clay; frequency 9.4 GHz - 13.7 GHz;real part. Page 18
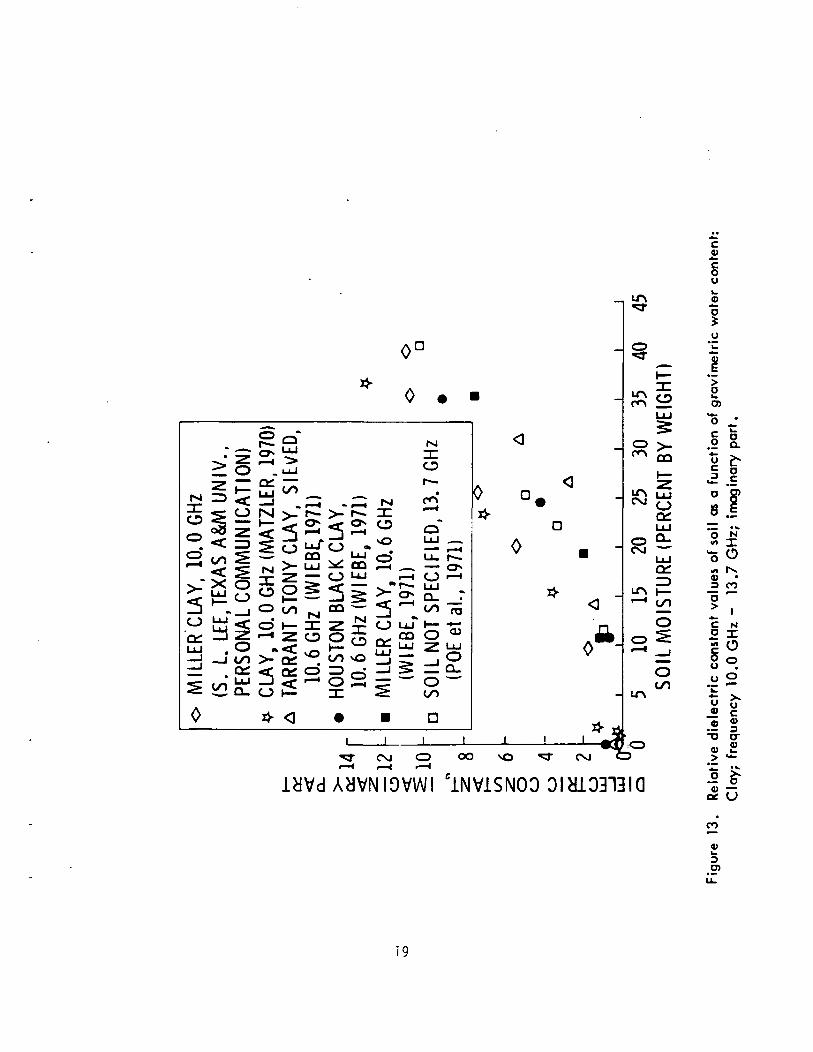
Figure 13. Relative dielectric constant values of soil as a function ofgravimetric water content: Clay; frequency 10.0 GHz - 13.7 GHz;imaginary part. Page 19
Figure 14. Relative dielectric constant values of soil as a function ofgravimetric water content: Sand, loam, clay; frequency 34.5 GHz -37 GHz; real part. Page 20
Figure 15. Relative dielectric constant values of soil as a function ofgravimetric water content: Sand, loam, clay; frequency 34.5 GHz -37 GHz; imaginary part. Page 21
Figure 16. Measured dielectric constant data of loamy soils as a function ofgravimetric water content around 10 GHz. Solid curves weredrawn to fit the data points and the broken curves were extrapolated. Page 23
Figure 17. Relative dielectric constant values of soil as a function of volumetricwater content: Loam, clay; frequency 0.03 GHz - 0.5 GHz; real part. Page 24
Figure 18. Relative dielectric constant values of soil as a function of volumetricwater content: Loam, clay; frequency 0.03 GHz - 0.5 GHz;imaginary part. Page 25
Figure 19. Relative dielectric constant values of soil as a function of volumetricwater content: Sand, loam, clay; frequency 1.1 GHz - 1.5 GHz;real part. Page 26
Figure 20. Relative dielectric constant values of soil as a function of volumetricwater content: Sand, loam, clay; frequency 1.1 GHz -1.5 GHz;imaginary part. Page 27
Figure 21. Relative dielectric constant values of soil as a function of volumetricwater content: Sand, loam, clay; frequency 3.8 GHz - 4.0 GHz;real part. Page 28
Figure 22. Relative dielectric constant values of soil as a function of volumetricwater content: Sand, loam, clay; frequency 3.8 GHz - 4.0 GHz;imaginary part. Page 29
Figure 23. Relative dielectric constant values of soil as a function of volumetricwater content: Sand, loam, clay; frequency 10.0 GHz - 26.0 GHz;real part. Page 30
Figure 24. Relative dielectric constant values of soil as a function of volumetricwater content: Sand, loam, clay; frequency 10.0 GHz - 26.0 GHz;imaginary part. Page 31
• • •MI

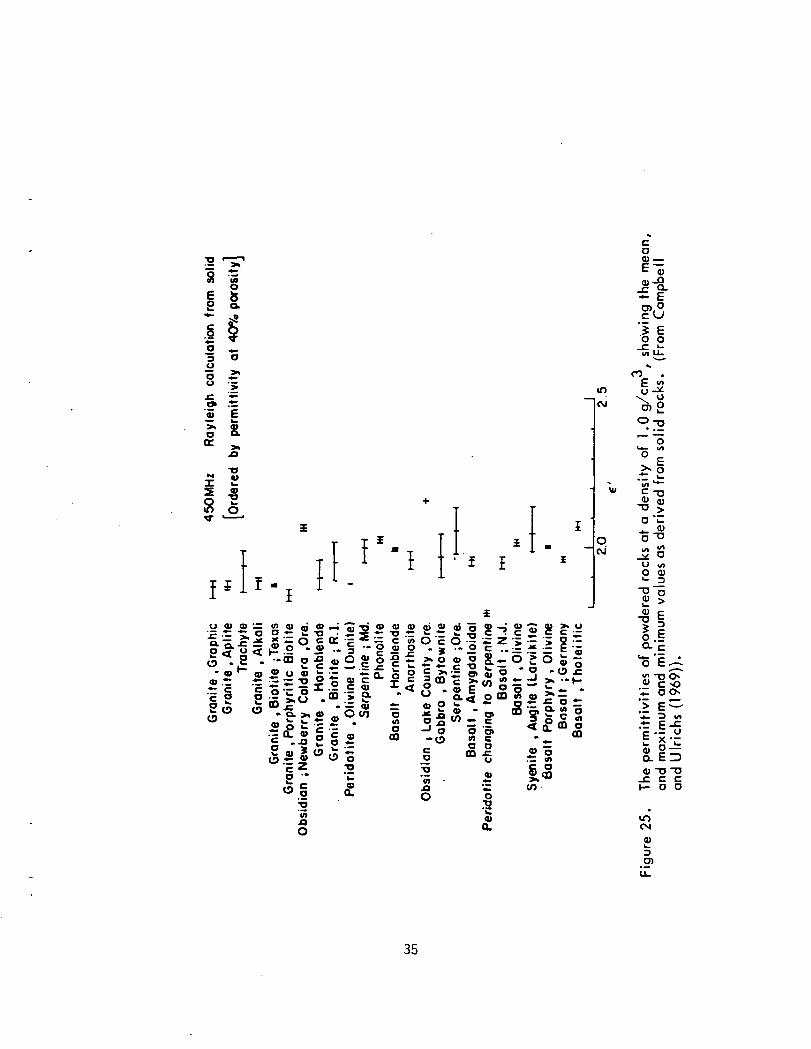
3Figure 25. The permittivities of powdered rocks at a density of 1.0 g/cm .
showing the mean, and maximum and minimum values as derived fromsolid rocks. (From Campbell and Ulrichs (1969)). Page 35
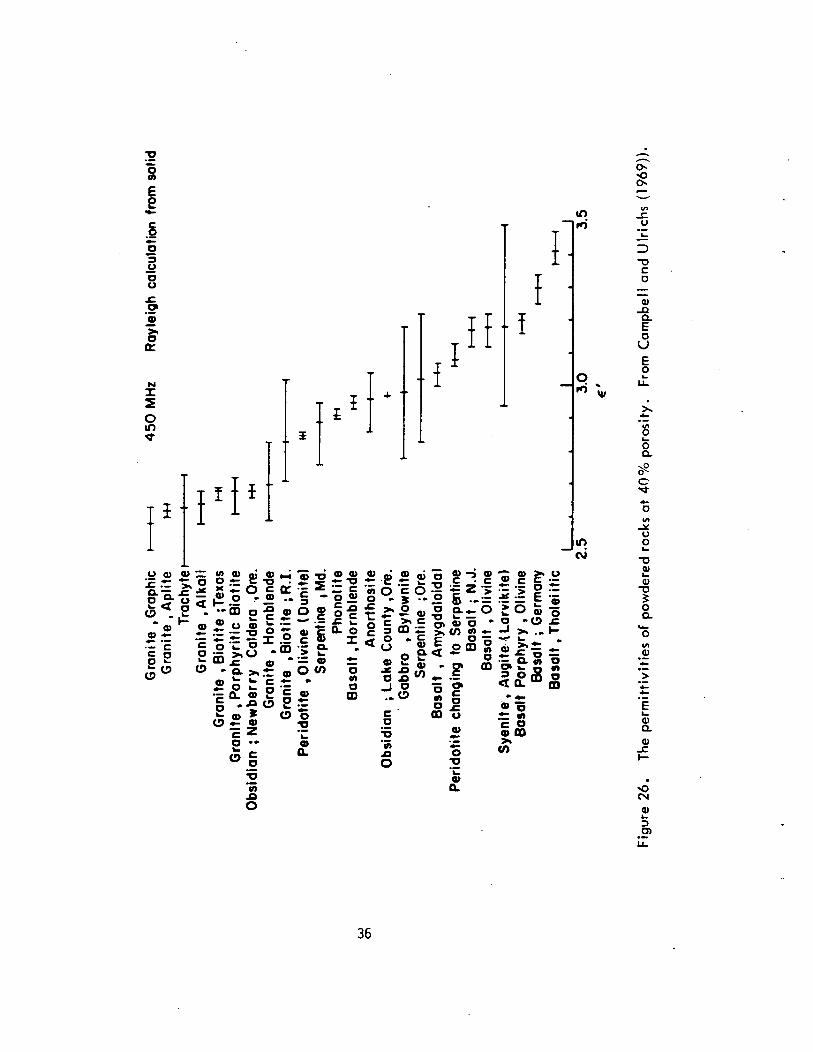
Figure 26. The permittivities of powdered rocks at 40% porosity. (FromCampbell and Ulrichs (1969)). Page 36
Figure 27. Effect of bulk density on the relative dielectric constant. Page 37
Figure 28. Change in relative dielectric constant due to soil moistureunits used. Page 39
Figure 29. Bulk density variation due to compaction as a function ofgravimetric water content. Page 40
Figure 30. Soil textural triangle. Page 41
Figure 31. The permittivity of rocks at 35 GHz as a function of temperature.(From Campbell and Ulrichs (1969)). Page 44
Figure 32. A comparison of the permittivities of solid rocks at 450 MHz and35 GHz.(From Campbell and Ulrichs (1969)). Page 45
Figure 33. Real and imaginary part of the relative dielectric constant as afunction of frequency for a silty clay, moisture content 15% byweight. (From Hoekstra and Delaney (1974)). Page 46
Figure 34. Representative dielectric constant values as a function ofvolumetric water content for sand, loam, and clay af 1.3 GHz. Page 51
Figure 35. Representative dielectric constant values as a function ofvolumetric water content for sand, loam, and clay at 4.0 GHz. Page 52
Figure 36. Representative dielectric constant values as a function ofvolumetric water content for sand, loam, and clay at 10.0 GHz. Page 53
Figure 37. Skin depth as a function of volumetric water content, frequency,and soil type. Page 54
Figure 38. Power reflection coefficient and emissivity as a function of volumetricwater content, frequency, and soil type. Page 56
IV

ABSTRACT
In studying applications of microwave remote sensing techniques to
agricultural, hydrological, and other related problems, the soil dielectric
properties are of considerable importance. In recent years, numerous soil
dielectric constant measurements have been made. Due to the complexity of
the data acquisition procedure, however, the number of measurements in a
single experiment is usually too small to permit a systematic analysis of the
effects of the various parameters that influence soil dielectric properties.
The objective of this report is twofold: 1) to present soil dielectric
constant measurements obtained by various researchers in one publication, thereby
assisting in analysis and utilization of microwave remote sensing data and 2) based
on these measurements, to determine the dependence of the dielectric constant on
various soil parameters. Moisture content is given special attention because of its
practical significance in remote sensing and because it represents the single most
influential parameter as far as soil dielectric properties are concerned. From the
experimental measurements collected in this report, relative complex dielectric
constant curves are derived as a function of volumetric soil water content at three
frequencies (1.3 GHz, 4.0 GHz, and 10.0 GHz) for each of three soil textures
(sand, loam, and clay). These curves, presented in both tabular and graphical form,
were chosen as representative of the reported experimental data. Calculations based
on these curves showed that the power reflection coefficient and emissivity, unlike
skin depth, vary only slightly as a function of frequency and soil texture.
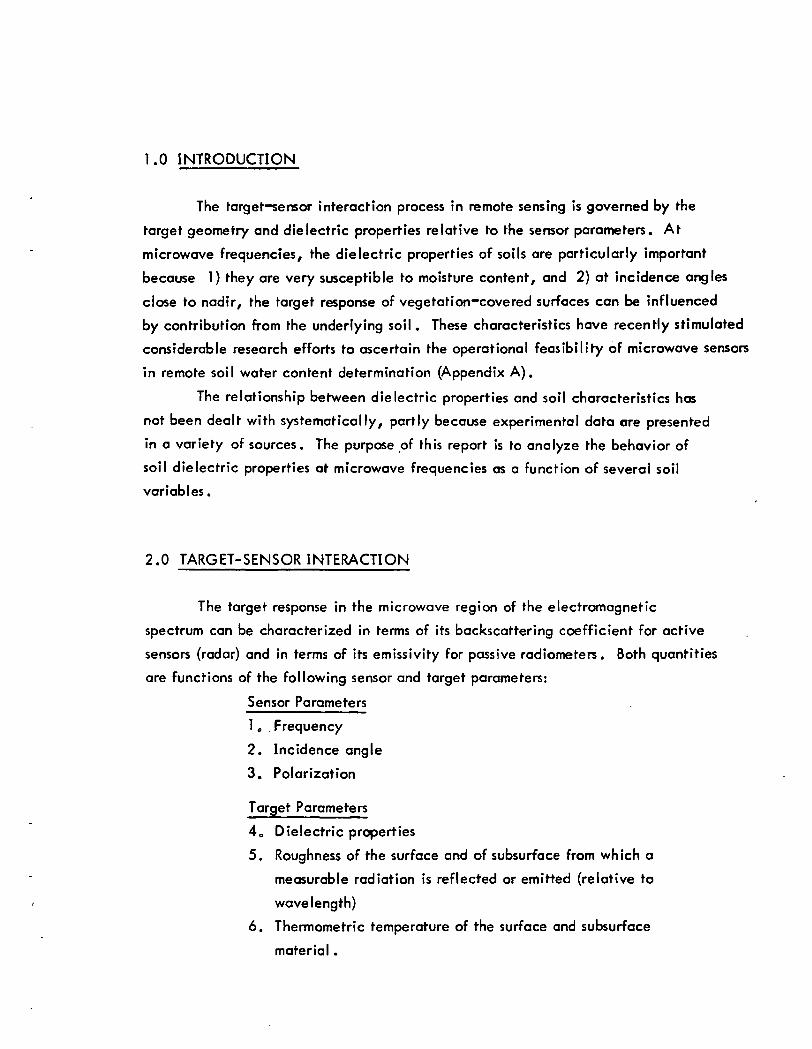
1.0 INTRODUCTION
The target-sensor interaction process in remote sensing is governed by the
target geometry and dielectric properties relative to the sensor parameters. At
microwave frequencies, the dielectric properties of soils are particularly important
because 1) they are very susceptible to moisture content, and 2) at incidence angles
close to nadir, the target response of vegetation-covered surfaces can be influenced
by contribution from the underlying soil. These characteristics have recently stimulated
considerable research efforts to ascertain the operational feasibility of microwave sensors
in remote soil water content determination (Appendix A).
The relationship between dielectric properties and soil characteristics has
not been dealt with systematically, partly because experimental data are presented
in a variety of sources. The purpose of this report is to analyze the behavior of
soil dielectric properties at microwave frequencies as a function of several soil
variables.
2.0 TARGET-SENSOR INTERACTION
The target response in the microwave region of the electromagnetic
spectrum can be characterized in terms of its backscattering coefficient for active
sensors (radar) and in terms of its emissivity for passive radiometers. Both quantities
are functions of the following sensor and target parameters:
Sensor Parameters
1o Frequency
2. Incidence angle
3. Polarization
Target Parameters
4. Dielectric properties
5. Roughness of the surface and of subsurface from which a
measurable radiation is reflected or emitted (relative to
wavelength)
6. Thermometric temperature of the surface and subsurface
material.
The effect* of the first five parameters are explicit for either active or
passive sensors. The rmome trie temperature affects the surface scattering and
emission character through its influence on the dielectric properties. Moreover,
the radiation measured by a radiometer is directly proportional to the target
rhermometric temperature.
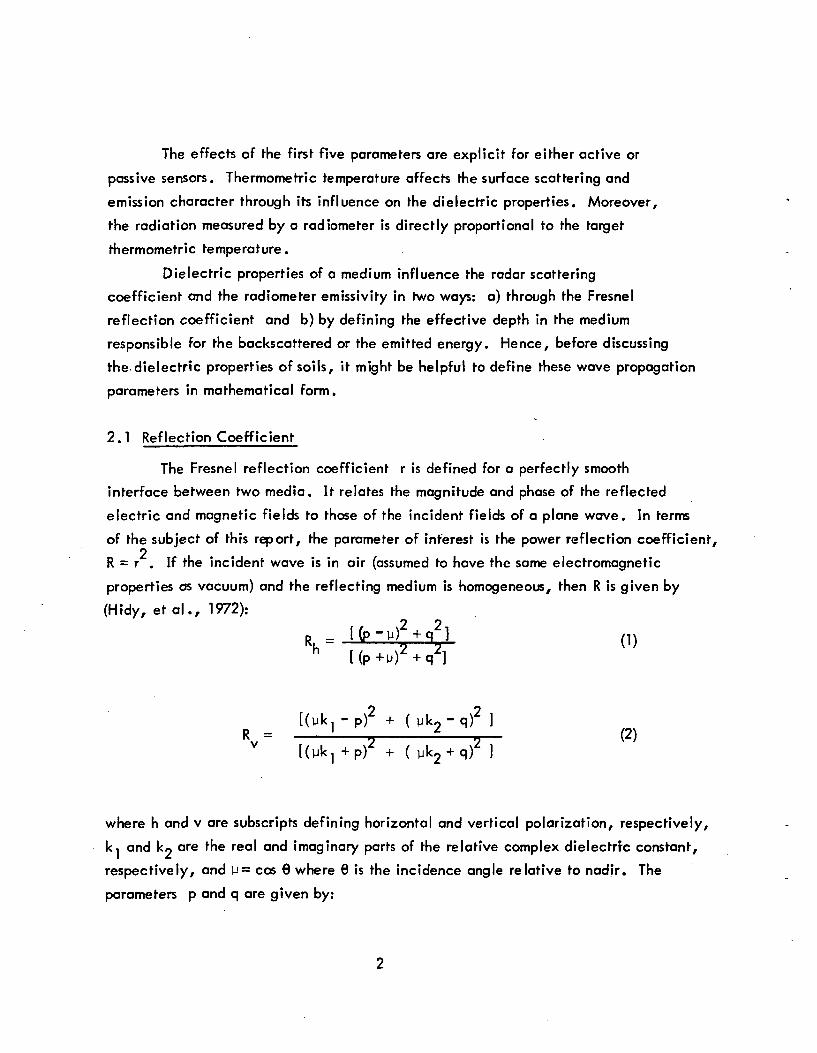
Dielectric properties of a medium influence the radar scattering
coefficient and the radiometer emissivity in two ways: a) through the Fresnel
reflection coefficient and b) by defining the effective depth in the medium
responsible for the backscattered or the emitted energy. Hence, before discussing
the dielectric properties of soils, it might be helpful to define these wave propagation
parameters in mathematical form.
2.1 Reflection Coefficient
The Fresnel reflection coefficient r is defined for a perfectly smooth
interface between two media. It relates the magnitude and phase of the reflected
electric and magnetic fields to those of the incident fields of a plane wave. In terms
of the subject of this report, the parameter of interest is the power reflection coefficient,2
R = r . If the incident wave is in air (assumed to have the same electromagnetic
properties as vacuum) and the reflecting medium is homogeneous, then R is given by
(Hidy, et al., 1972):
R, =h [(p+y)
[(yk -p)2 + ( yk 2 -q ) 2 ]• 7 - 9 (2)
where h and v are subscripts defining horizontal and vertical polarization, respectively,
k, and V* are rne real anc' imaginary parts of the relative complex dielectrfc constant,
respectively, and y = cos 6 where 6 is the incidence angle relative to nadir. The
parameters p and q are given by:
r-t -
1/9o '/ *
+ - +v 2
For a smooth surface, the emissivity is defined as:
e. = 1 - R. ; i = h or v (3)i i ' x '
Although most natural earth surfaces (excluding calm water) are not electromagnetically
smooth at microwave frequencies, the dependence of R on soil moisture (through k, and
k^) can be used as a guide in the study of the response of microwave sensors to soil
moisture .
2.2 Skin Depth
The energy received by a microwave radiometer viewing a given target is
composed of contributions from the target surface as well as sub-surface layers.
Similarly, the backscattered energy (in the case of active microwave sensors) is also
depth dependent. The penetration of microwaves into a medium is defined by the
attenuation coefficient of the medium, which in turn is a function of its dielectric
properties:
k 2 1/2 1/2
where
a = attenuation coefficient, nepers/m ;
X = wavelength, m;
k. , k«= real and imaginary parts of the relative dielectric constant of
the medium.
In the above expression, the relative magnetic permeability was assumed to be unity,
which is a good approximation at microwave frequencies for most natural surfaces
including water.
At a depth h beneath the surface, the power is related to the surface value
P(o) by:
At a depth 6 such that ad= 1, -p-J U- =0.13. 5 is defined as the skin depth.
Reflections from a plane 6 deep by a perfect reflector will undergo additional
attenuation by the same amount, thereby arriving at the surface having a magnitude
that has been reduced to ~ 0.017. If the medium depth profile of k, and kj is not
a constant, then 8 can be defined by:
6i
adh = 1 (6)
3.0 DIELECTRIC PROPERTIES OF SOILS
For naturally occurring substances, dielectric constant measurements in the
microwave region are usually not repeatable by different investigators (Edgerton, et
al., 1971, Ward et al., 1969). Dielectric measurements of soils require high pre-
cision and are time-consuming because of the number of factors that affect soil
dielectric behavior (Poe et al., 1971). Furthermore, since adequate techniques
are available only in the laboratory, preparation of samples for measurements in-
volves a profound disturbance of the mutual arrangements of soil aggregates. It is
not certain to what extent the laboratory-prepared samples are representative of
soils as they exist in the field. However, since no better data are available, these
measurements are continually used for interpretation of remote sensing data,,
The dependence of the dielectric constant has been studied as a function of
several parameters: moisture, bulk density, soil type, temperature, and frequency.
These effects are discussed in the following sections.
3.1 Moisture
For soil dielectric constant measurements, soil moisture is usually expressed
on a weight basis (i.e., gravimetrically):
Wm = yrr^ x 100 (%) (7)
W j
where
m = moisture content by dry weight (%);wW = weight of water in the sample (g);wW , = weight of dry soil in the sample (g).
Lundien (1971) suggested that moisture content expressed on a volume basis may be
preferrable because data plotted against the volumetric water content m should
have little sensitivity to changes in bulk density or degree of soil compaction. The
value of m may be calculated using the bulk density of soil sample Ps and the
density of water pw
Wpw
3(grams/cm) (8)
When soil moisture is expressed on a weight basis, it is possible for two soils to contain
the same water content in percent by weight while the actual amounts of water differ.
For example, a 30% moisture content represents both 0.36 g of water for bulk density ofq q o
1.2 g/cm and 0.54 g for bulk density of 1.8g/cm in 1 cm of soil. It has been
argued that the number of water molecules (i.e ., dipole moments) per unit volume
rather than the weight proportion determines the dielectric contribution of water
(Hoekstra and Delaney, 1974). Formulas for calculating dielectric constants of
mixtures are also based on volume fractions (Poe et al., 1971; Birchak et al., 1974).3 3Consequently, soil water should be expressed in cm or grams per 1 cm of soil when
related to soil dielectric properties. However, many soil dielectric constant
measurements have been presented on a weight basis only. In this report, both data
have been included.

Available studies show that the relative (with respect to vacuum) dielectric
constant of soils increases with increasing moisture content. This is to be expected
since the relative permittivity of dry soil is less than 5 while that of water can be
more than an order of magnitude larger (Figure 1). Figures 2 through 15 contain
measurements on the weight basis, and Figures 17 through 24 show dielectric constant3as a function of water expressed in grams per cm . The data are divided according to
frequency and soil texture (i.e., relative proportions of soil particles of different
sizes). The following observations can be made.
(1) Few of the measurements were taken for moisture contents near 0 per
cent. Results of Matzler (1970, Figure T2) and Geiger and Williams
(1972,Figure 14) show a tendency toward sharp increase in the real
part of the dielectric constant k^ for this moisture content range. Matzler
(1970) suggested that such increase may be due to chemical changes
resulting from addition of water, such as hydration. From the remote
sensing standpoint, these changes are not very important since under
natural conditions, dry soil always contains some water. For example,
the amount of hygroscopic water (i.e., soil water held mostly by soil
.colloids under tensions above approximately 31 atmospheres so that it
is unavailable to plants) was found to be 3.4% for a sandy soil and16.1% for a silty clay (Russell, 1939).
(2) At low moisture contents, k , increases slowly (Figures 2, 4,
8, 10) or remains constant (Figures 6, 12). Lundien (1971)
and Wiebe (1971) explained this phenomenon by the adsorption
of water at the surface of fine particles; the adsorbed water
has a limited mobility (similar to water molecules bound in
ice) and consequently its dielectric constant can be as low
as 0.1 that of free water (Grim, 1968). The possibility that
80
60
40
20
0
40
20
0
10'
\\\
10' 1010
Frequency, Hz10n 10 12
Figure 1. The dielectric spectrum of water at two temperatures. (FHoekstra and Del one y (1974)).

A YUMA SAND, 1.1 GHz (LUNDIEN, 1971)* YUMA SAND, 1.5 GHz (LUNDIEN, 1971)• SAND, 0.13GHz(LESCHANSKII etal., 1971)o SAND, 0 .3GHzLESCHANSKIIe ta l . , 1971)x SAND, 1.0GHz(LESCHANSKIIetaL, 1971)° SAND, 3.0GHz(LESCHANSKII etal.,1971)
24 r
22 -
20 -
£ 18
2 16
^ 14 -C£L 1H '
£* 12 -
£ 10 -
3 8ho
oLU—ILU
Q
6
4
0
A€>•
QBR
xs&
- a
0 5 10 15 20SOIL MOISTURE
(PERCENT BY WEIGHT)
25
Figure 2. RelaMve dielectric const-ant values of soil as a functionof gravimetric water content: Sand; frequency 0.13 GHz3.0 GHz; real part.
8

ro — —. «j no<33 •+* •+*
0» 0)
CO 00 CO
o
o Q
N
M M
o o r-.ro —
o* ef o~ Q" < •<
<<<:<:=> =CO CO CO CO >- >-
• O x D <3 *
'lNVlSNOOOiaiDJI3ia
O IC NO X
!=.o o
8 ^• *no
0 iM
JtO O> fcO
S -2 20 £o o ^_
•*" Ii: » .?o "S ro^ J §.2 o •-"° i N-« 1 X~ .§ O^ go
a> b. •as TOCO
CO
£DO)
38
36
34
32
30
28
26i —
1 24
^ 22
g 20<c£ 18oo 16o^ 14o3 12o
10
8
6
"
-
-
AA
_
0
0 *
Of ot
D " y
fo
D V
— i)A
D y
<f9
ay
^•
a y
<?£T
»^
4^ v.A
nP
D LOAM, D. 13 GHz(LESCHANSK II etal., 1971)
? LOAM, 0.3 GHz(LESCHANSK II etal. , 1971)
• RICHFIELD SILT LOAM,0.3 GHz (LUND IEN.1966)
o LOAM, 1. 0 GHz(LESCHANSK II etal., 1971)
V LOAM 3.0 GHz(LESCHANSK II etal . , 1971)
A OPENWOOD SILT LOAM,1.1 GHz (LUNDIEN, 1971)
• SHARKELYCLAY, 0.3 GHz(LUNDIEN, 1966)
A OPENWOOD SILT LOAM,1.5 GHz (LUNDIEN, 1971)
'i i i i i i
0 10 15 20 25 30 35 40 45 50SOIL MOISTURE (PERCENT BY WEIGHT)
Figure 4. Relative dielectric constant values of soil as a function of gravimetric watercontent: Loam; frequency 0.13 GHz - 3.0 GHz; real part.
10
30
28
26
H- 24CtL
3. 22
20
is16
A OPENWOOD SILT LOAM, 1.1 GHz (LUNDIEN, 1971)A OPENWOOD SILT LOAM, 1.5 GHz (LUNDIEN, 1971)• RICHFIELD SILT LOAM, 0.3 GHz (LUNDIEN, 1966)a LOAM, 0.13 GHz (LESCHANSK11 et al., 1971)f LOAM, 0.3 GHz (LESCHANSK 11 etal., 1971)o LOAM, 1.0 GHz (LESCHANSK 11 etal., 1971)V LOAM, 3.0 GHz (LESCHANSK 11 etal., 1971)
a
£ 1400
o 12o<=> 10cc0 oLU O
LU
0 6
4
2
0^
-D •
-
f•
"
f ° ff V- ° Vo A
" 1 ? * ^ ^ ^. \7,A ,
0 5 10 15 20 25 30 35SOIL MOISTURE (PERCENT BY WEIGHT)
40
Figure 5. Relative dielectric constant values of soil as a function of gravimetricwater content: Loam; frequency 0.13 GHz - 3.0 GHz; imaginary part.
11

;>»
36
1 A34
32
30
28
5 2 6a.
-o LONG LAKE CLAY, 1. 1 GHz
(LUNDIEN, 1971)• LONG LAKE CLAY, 1.5 GHz
(LUNDIEN, 1971)-
0
-
LU24
22
20
I 18oa 16oa 14
10
8
6
41-
2
00 5 15 10 20 25 30 35 40 45
SOIL MOISTURE (PERCENT BY WEIGHT)50
Figure 6. Relative dielectric constant values of soil as a function of gravimetricwater content: Clay; frequency 1.1 GHz - 1.5 GHz; real part.
12
LU LU
O O
Mnio
0 0
O
O •
0 •
O •
LTN
Jo
oLU
o O^~* CO
UTN
CNJ o oo CNJ
AdVNIOVWI'iNVlSN033ldl3313ia
jl)o
§ .° Ii- a.01 _
c —
**• hTO X
Joo —
Ifi|O 1)
Jr _o
=5^« i*> c
*Z V^ c« 8
IO)
13
30
28
26
24
| 22
^ 20<ciiiLXJ
"181 —
| 1600
o 14o¥ 12
^ 101 1 1 AVJ
Uul
5 8
Au
4,i<
2
n
B
-
-
-
-
-
-^
A•
- AQ _•
^•»
D
Q•
- 4D*
'^A
A SAND, 9. 5 GHz(LESCHANSKII etal., 1971)
• ROBERTSON COUNTY LAKESAND,10.6GHz(WIEBE,1971)
D SAND, 15. 8 GHz(LESCHANSKII etal., 1971)
• LOAMY FINE SAND, 19. 4 GHz(GEIGER AND WILLIAMS,TO BE PUBLISHED)
, ,0 5 10 15 20 25 30
SOIL MOISTURE (PERCENT BY WEIGHT)
Figure 8. Relative dielectric constant values of soil as a function of gravimetricwater content: Sand; frequency 9.5 GHz - 19.4 GHz; real part.
14
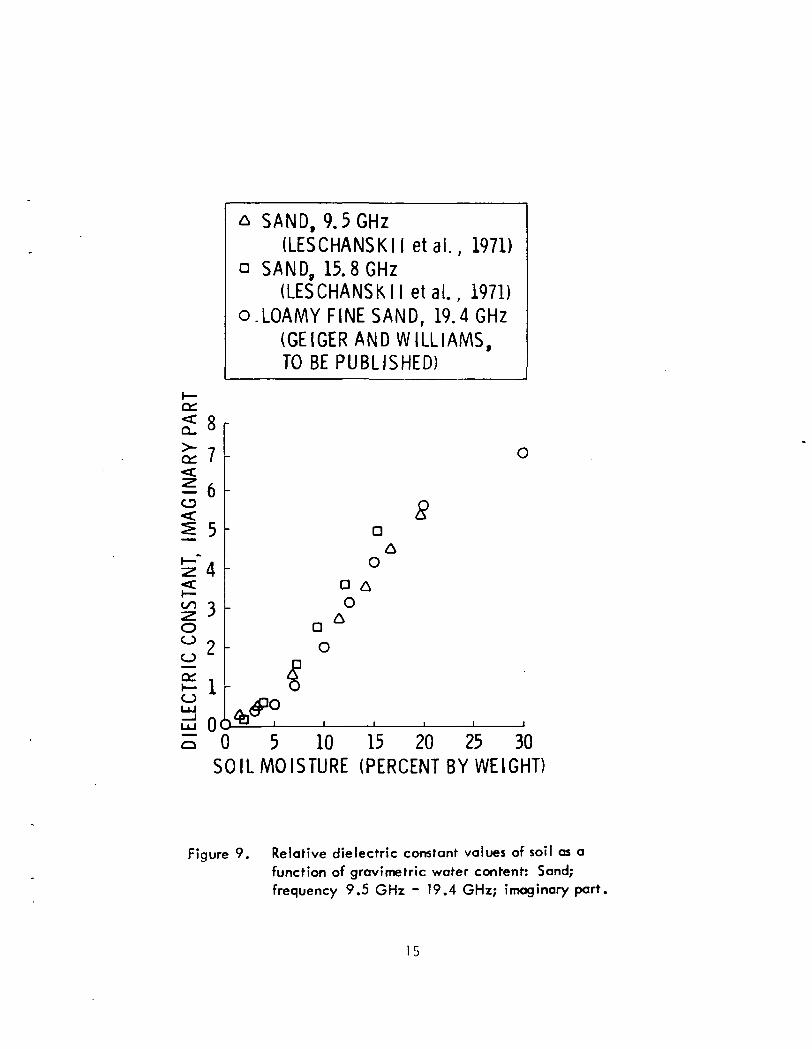
A SAND, 9.5 GHz(LESCHANSKII et al., 1971)
a SAND, 15.8 GHz(LESCHANSKII etal . , 1971)
o.LOAMY FINE SAND, 19.4 GHz(GEIGER AND WILLIAMS,TO BE PUBLISHED)
<:Q_
O
8 r
- 6o
LO O
O0 2o e-
l
8
ao
ao
so
o 0 5 10 15 20 25 30SOIL MOISTURE (PERCENT BY WEIGHT)
Figure 9. Relative dielectric constant values of soil as afunction of gravimetric water content: Sand;frequency 9.5 GHz - 19.4 GHz; imaginary part.
15

24
22
20
£18
£ 14
sg 12o-10r
* ABILENE CLAY LOAM,10.6GHz(WIEBE, 1971)
x HOBAN SANDY LOAM,10.6GHz(WIEBE, 1971)
o GILA SANDY LOAM,10.6GHz(WlEBE, 1971)
D AMARILLO FINE SANDY LOAM,10.6 GHz (WIEBE, 1971)
* RICHFIELD SILT LOAM,9.4 GHz (LUND I EN, 1966)
+ LOAM, 9.5 GHz(LESCHANSKII etal.,1971)
f LOAM, 15.8 GHz(LESCHANSKII etal., 1971)
\7 FINE SANDY LOAM, 19.4 GHz(GEIGER AND WILLIAMS,TO BE PUBLISHED)
* SANDY CLAY LOAM, 19.4 GHz(GEIGER AND WILLIAMS,TO BE PUBLISHED)
v
OLU
8 h
6
V
* *
00 5 10 15 20 25 30 35 40 45
SOIL MOISTURE (PERCENT BY WEIGHT)
Figure 10, Relative dielectric constant values of soil as a function of gravimetric water content:Loam; frequency 9.4 GHz - 19.4 GHz; real part.
16
r ~
! ^i r>-i 0"
— 'LU"
; co^ ^r "j-1i ^^ ^ "i -•••*. ^^^
i i*-- r— •—•--,a^ &* r*- ^i— i •— i O^ • — •
.. -^ NLU LU • 31CO CO LU O
i±|!±l SvO
^i2M M ^~31 1C M — •.0 0 31 2|sosoOg
o o *>. "^ -* o >-
ss^i< < "<O O *= co^^gLU>- >- _J Z^g^izo < § oLUOO ^-}
^<<1=§Si< n: o <• x o a
— »Q QLU LU — -
^ ^ 5 S—. — o^ <— i— ' ' r—lCO CO -ZD ZD "_'O_ Q_ — TO
ra *^LU LU . QjCO CO <D
0 N 0 — -T^ i— n: i— — i«s:S _o ^ co2^%roo-^2•^ ^: • ^ <os' S 2 ^ ^ 3=S ^ < ?= o
_1 1 ^ CO1 «-r —1 CO LU
«— — < — LU 1
^ ^ ^ ~^< ^ § ^ — MO o Zj Q 31
>-<5<°«9 OS 3 0- uSg^OLU^iQ
CO — >• — —.»__"LU O LU ^ ^
z55 zo$ $— < O 0U_ CO _J —I
04 + » •
- C3O4
-
x O4
O + •x
o^< B^^04 x
4- O*' 4 ~
**" DO ^•4* r-J_
"*+»•5^
^T
u> Pro DT
OUJ
S ^x^s-co
« zLUO
_ OSO LU^ Q_
LU\f\ O£-^ Z)
CO
o 0- S
_j• u^ OL e oitf*
i i i i i — i — ^k
co0k.
£oJ
^uL.
J">sO)
^4—oo "t= aC >v
3 0o .E
Mo ..."• N
•*• T~
i^^ •
-5 <^> *^
•H '0 N
!§O IT)
« o Ti :K0 04) C
5 I•° ?5J Jr
* I•^ o& 2
CSJ OO CM
IHVd AdVNIOVWI'!NVlSNOOOiyi0313ia
£3O)
17
^_<cQ_
LU
•s
1 —
CO
oo0
1 —oLU— ILU
O
30
28
26
24
22
20
18
16
14
12
10
8
6
41
2
0
—
_
-
—
_
-*f>- C
o MILLER CLAY, 10.0 GHz(S. L. LEE , TEXAS A &M UN IVPERSONALCOMMUNICATION)
A TARRANT STONY CLAY, SIEVED,10.6 GHz (WIEBE,1971)
o TARRANT STONY CLAY, UNSIEVED,10.6 GHz (WIEBE,1971)
• HOUSTON BLACK CLAY, 10.6 GHz(WIEBE,1971)
• MILLER CLAY, 10.6 GHz(WIEBE.1971)
A SHARKLEY CLAY, 9.4 GHz(LUNDIEN,1966)
a SOIL NOT SPECIFIED, 13.7 GHz(POE et al., 1971)
* CLAY, 10.0GHz(MATZLER, 1970)0 •
*
•
A• ^\
•OA
DO
A A
fg]
1 1 1 1 1 ! 1
5 10 15 20 25 30 35
o
o
a
A
'
1 i I
40 45 50SOIL MOISTURE (PERCENT BY WEIGHT)
Figure 12. Relative dielectric constant values of soil as a function of gravimetricwater content: Clay; frequency 9.4 GHz - 13.7 GHz; real part.
18
0°
M
O
0
or— I
Oa:LU— 1
i0
•>
^
CO
X
u_TUJ
_I
<£
-^OH-
O
1
O1
oCO
UJQ_
0
o^*" '_ofLU
Mt—
iMn:o0
O•— I
«»
O
X}.
oTillU^aJ
uU
CO
>-"3o>-ZO
CO
i—
<Qi0£
<!
F— <
I (W
IEBE
.197
• ^
o>oo'
>-"
o3CQ
0
CO)
o310
1
. — .
CQ
§
MIO
of— «
M
0NO
0•-H . .
^JT —
O LU"
25?i ^iB
i
Mi
O
CO
OLU .— r— 1u_ r*.
O ^LUo_ _r1/1 TO
o "*>
^ Q_0 "CO
D
O
i °-' -D
o . -
* 3
oft-
*±. -•1 1 1 1 1 " ^ f
o >_^^ CQ
SO LLJCS4 o
W>X
a:LU
0 °-ou —LUCXL
^^<—* (/>
OC3 Si— 1 ,
OCO
•e— »
OUJ
CVI C3 OO vO " CVJ CD
clNViSNOOOIHL0313IQ
c£ou
o
u
2
o J
Itv5 c
8 I
'S O
c N2 x
o .o o
8 II I^> •*-
^ ^«S u
CO
V
O)

!
i— •r —^^bV*-,
1 9t
•
"ro
~o£
~_
iCO2:<:inoCOLU— 1
NJino00
vOm
o~
<;CO
<J
CXJr .oi—i
co"5:«=c<:~~— j— j5>Q
<;
QCLUO1 1 ]O
-
fsi1Cor~»ro
•»
O
<:coLU
^uZ
>-
<:o— io
-— **vOsOO*T— 1
LU^ ™
Q^—ID
T*
0LO
*^ro
<CO
1—— 1CO
O— 1LUi |LJL.
mocr
o
CSJfN .
01— 1
«
COs:«i_<|
_»J
i
.
^^^
Q
<cQiLUO1 1 1O~— ^~
NJ
O
1 —m
<CO— 1>•Q
<cCO
LU
^_l_l_
X
1— 1
r —f^s^^^r-H
•
ro
"S
—
CO"Z.<_
oCOLU— 1
M
O
OO
SO
CO
ft
<o
D
C\J>« .r^»o^t—4
^
CO
^<1
1 -»J1
_*
>-. *
Q•p
<cC^LUOLU0
M
O•w^r "m
fh
|>-5O^_**^
CJ
<:CO
•
sONOr>^^^i— 1
*m-,LU
Q~^ID^_^
M^^^n_oLT\
rm
>-~
o>-LU
^/
0£<^CO
^
,
^
i "^
+-J j1— 1r —o^
^^^TOi .O>III*r -*-J
oQ_
Mmor—ro
••,QLU
U_
OLUQ.CO
1—O~^
— i
OCO
•
~
**
o
*<T^>^Fs-U^*
o
0
•< D> ^ -
. D •
Dr .^ •^ X*o • ^ -
O „ 0D °
0 D«~<<i ^ ^•xj _
^•
Lf>
0LPi
LTV'sT
O'!*
Lf\ro
Om
LfNe\j
oCSJ
LP»r— i
0f— 1
LPV
Or c s j o o o v o " d - e s i o
fZl1CoLU
^^>>-CD
1—"LUOry^La H
LUQ_
LU
L M
OIS
TUR
—OCO
|^-o
coun
• •
"ctt>"coU.
i"5JUk_
.1">oD)
'o
_o"uc3 .0 &8 o.~ o2 2
'B N
° i« o1-^_ 1
l£t/t * r\c O8 «o^ •
o -«r• CO
ti X
1 20) 4)
=5 £A\a) ?|> ^
iavd 'iNviSNOO ouuoaiaia 0) —Of U
O)
20

M
OooNO"ro•
Q
<CCO
<]
^_J^^^
p -01— 1
•«
"ro~OJ
— M
^ CO O
5°°.IE NO
o rr*COai'— -• ^*»
O
D
__ _
f— 1r iii '^O^-l
«t•
OJ•*—•o>
:*:COz<c3:oCOLU
M
0
r*"1-ro
cT•<CO
LU
U_
>-
S
O
0
CNJI —O^^
•*CO
^^^^
^J
iQ
<
ryL£~
LU0LU0
M
Of^^^p*»m
•
S<0
>-O
<cCO
LU
L .
X
CVJr*-o»™
%COsrf-^*^
!3i. J
io
</vL^—LUO
UJO
_ 0n tn
—
^
cvJr—S N
M 1~l
0^«^— p»-f"—- ff f~f\1 <*. (T^
ro —• -I Q"s- S
< ^ LT^;O — t^
1 Q O ON• ^^ [ t J ^ H^
>- < Q. r3n^ ^^0 Lu t •£^. « 5 , ,>- Z LUQ LU ^ O2 0 — Q_< — o —CO CO
• •
•N k I~ > —s J 1**
I
•
*t>
D •
«"*• "<3^,f
^r'
<J£f
LTVr
S ^^t -T-
o_
ITk £«"\ ^S~^ ^»
>-QO
o H_5LUO
ITN a:CVJ LU
Q_
LUse1 s\IS*
ag<— i
o ;=:f— < <— 'CO
r»; m
^I I 1 1 1 1 ^Jt
' I I I ! B M O
ci"couk.
i"o
uhi
">
sO)
t*.
Juc3
Ww
Q
tf)O
"o(A
l-fr.o(AID
~0
0in
OU
^Ok_
U
.£^3
>QJ
oe
•
1£-ocO)o
N"XOrvcrs
NX0LO
•
•*!•n>s(Jc9)3O~4)
V4-
X_ouH
8*»
-oco
CO
A^VNIOVWI 'INVISNOO 01^103131 aO)
21
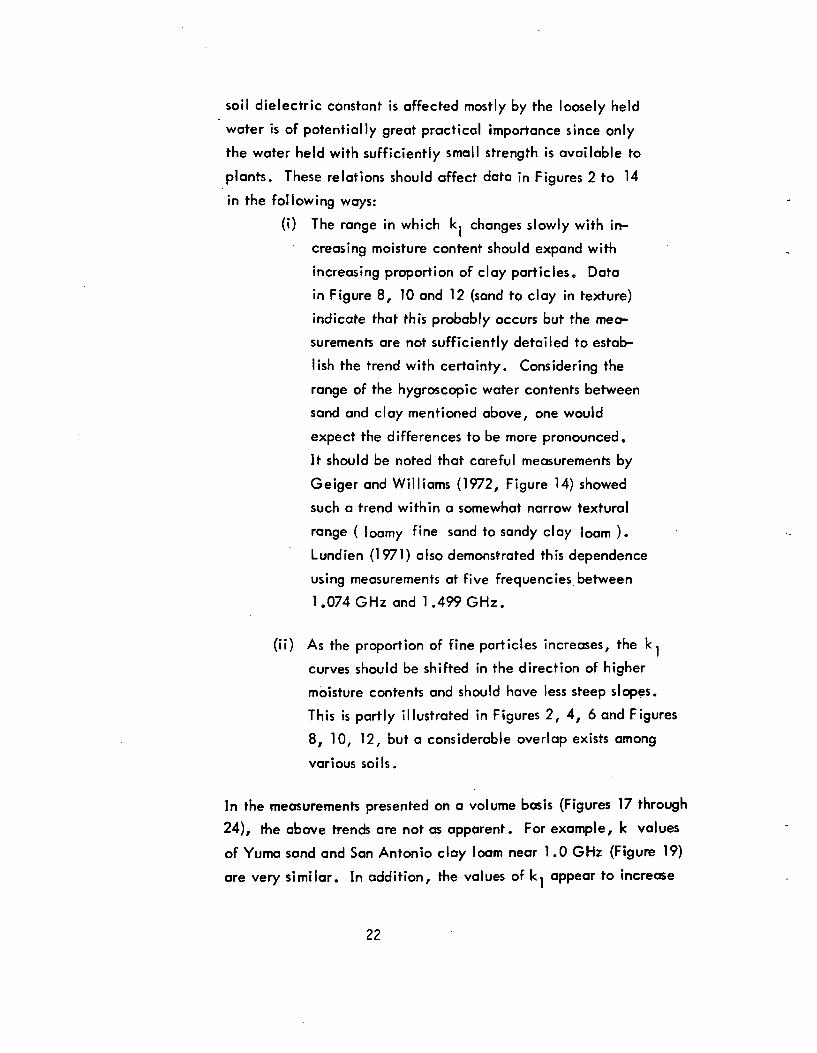
soil dielectric constant is affected mostly by the loosely held
water is of potentially great practical importance since only
the water held with sufficiently small strength is available to
plants. These relations should affect data in Figures 2 to 14
in the following ways:
(i) The range in which k. changes slowly with in-
creasing moisture content should expand with
increasing proportion of clay particles. Data
in Figure 8, 10 and 12 (sand to clay in texture)
indicate that this probably occurs but the mea-
surements are not sufficiently detailed to estab-
lish the trend with certainty. Considering the
range of the hygroscopic water contents between
sand and clay mentioned above, one would
expect the differences to be more pronounced.
It should be noted that careful measurements by
Geiger and Williams (1972, Figure 14) showed
such a trend within a somewhat narrow textural
range ( loamy fine sand to sandy clay loam ).
Lundien (1971) also demonstrated this dependence
using measurements at five frequencies between
1.074 GHz and 1.499 GHz.
(ii) As the proportion of fine particles increases, the k,
curves should be shifted in the direction of higher
moisture contents and should have less steep slopes.
This is partly illustrated in Figures 2, 4, 6 and Figures
8, 10, 12, but a considerable overlap exists among
various soils.
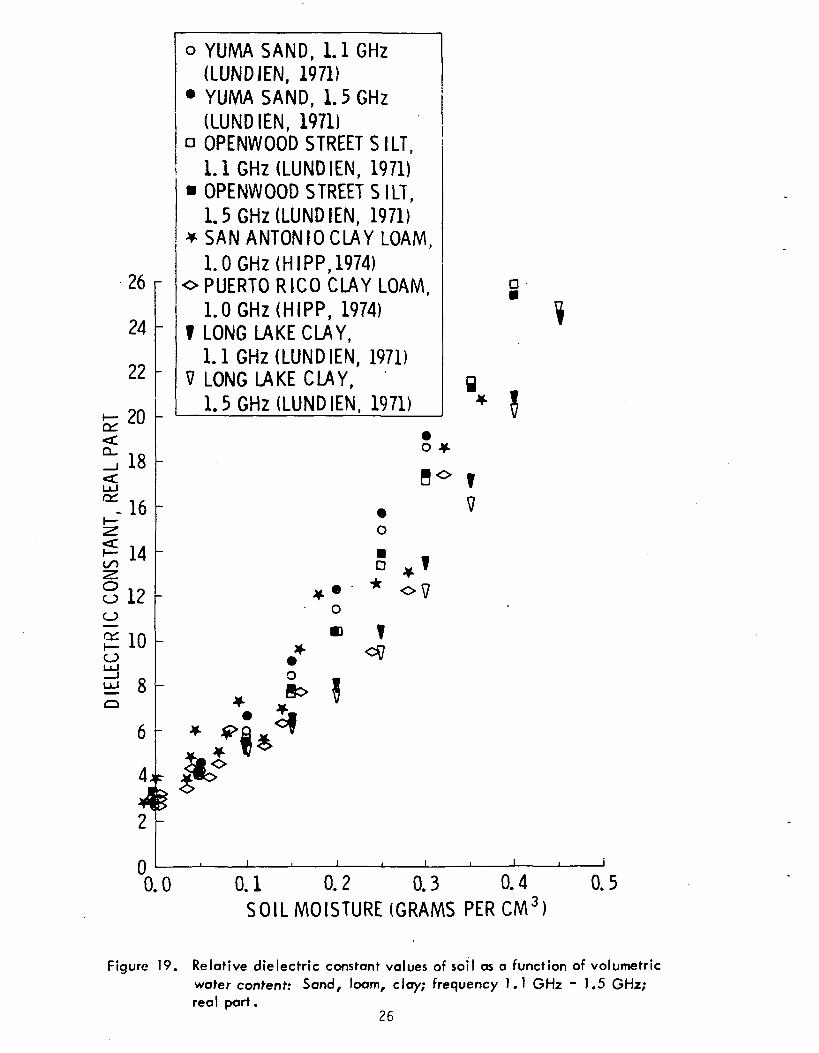
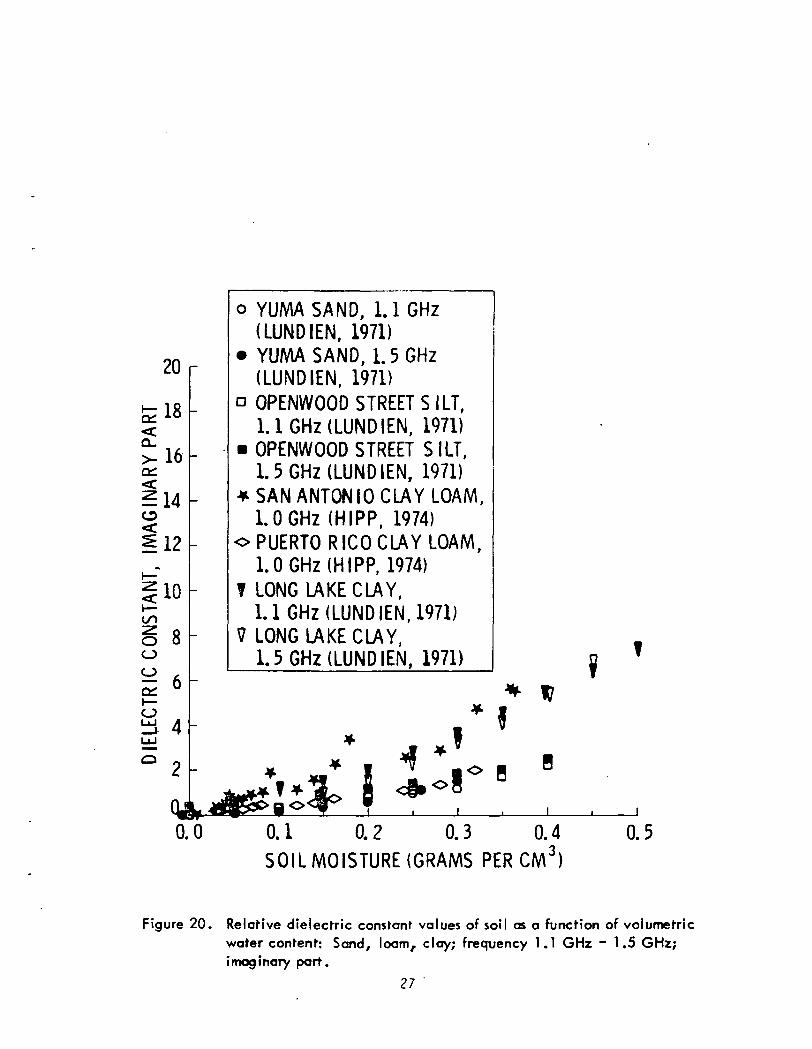
In the measurements presented on a volume basis (Figures 17 through
24), the above trends are not as apparent. For example, k values
of Yuma sand and San Antonio clay loam near 1.0 GHz (Figure 19)
are very similar. In addition, the values of kj appear to increase
22
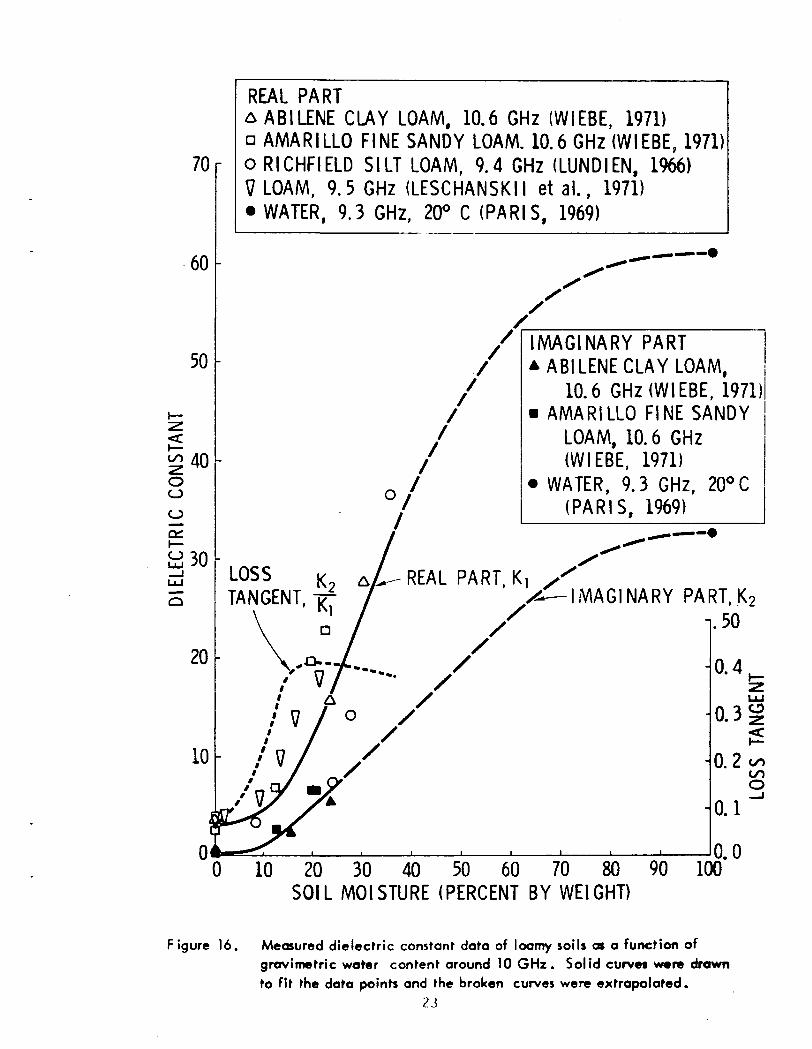
REAL PARTA ABILENE CLAY LOAM, 10.6 GHz (WIEBE, 1971)a AMARILLO FINE SANDY LOAM. 10.6 GHz (WIEBE, 1971)o RICHFIELD SILT LOAM, 9.4 GHz (LUNDIEN, 1966)\7 LOAM, 9.5 GHz (LESCHANSKII et al., 1971)• WATER, 9.3 GHz, 20° C (PARIS, 1969)
IMAGINARY PARTABILENE CLAY LOAM,
10.6 GHz (WIEBE, 1971)AMARILLO FINE SANDY
LOAM, 10.6 GHz(WIEBE, 1971)
WATER, 9.3 GHz, 20° C(PARIS, 1969)
IMAGINARY PART,K
0 20 30 40 50 60 70 80SOIL MOISTURE (PERCENT BY WEIGHT)
Figure 16. Measured dielectric constant data of loamy soils as a function ofgravimetric water content around 10 GHz. Solid curvet were drawnto fit the data points and the broken curves were extrapolated.
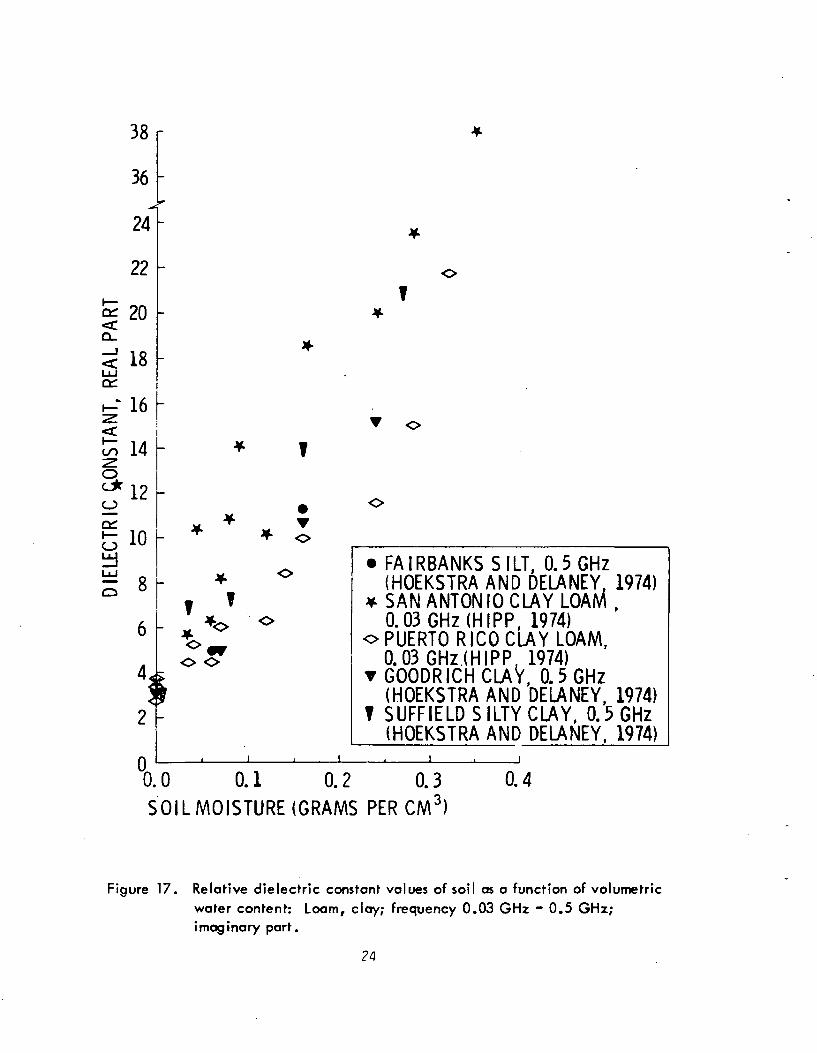
38
36
22
§ 20Ou
< 18
£ 16
£ 14Q
Id
10 h
k^_* _^
S 8
6 -
0
*o
• FAIRBANKS SILT, 0.5 GHz(HOEKSTRA AND DELANEY, 1974)
¥ SAN ANTON 10 CLAY LOAM,0.03 GHz (HIPP, 1974)
o PUERTO RICO CLAY LOAM,0.03 GHz (HIPP, 1974)
T GOODRICH CLAY, 0.5 GHz(HOEKSTRA AND DELANEY, 1974)
? SUFFIELDSILTYCLAY, 0.5 GHz(HOEKSTRA AND DELANEY, 1974)
0.0 0.1 0.2 0.3
SOIL MOISTURE (GRAMS PER CM3)
0.4
Figure 17. Relative dielectric constant values of soil as a function of volumetricwater content: Loam, clay; frequency 0.03 GHz ~ 0.5 GHz;imaginary part.
24

56
54
36
34*
24
£ 22a.
£ 2°
- 18o
i 16
I WH-CO
§12O
510I—oa 8LU
Q 6
4
2
>*
2- *
0*-^0.0
o? o f
• FAIRBANKS SILT, 0.5 GHz(HOEKSTRA AND DELANEY, 1974)
* SAN ANTON 10 CLAY LOAM,0.03 GHz (HIPP, 1974)
o PUERTO RICO CLAY LOAM,0.03 GHz (HIPP, 1974)
T GOODRICH CLAY, 0.5 GHz(HOEKSTRA AND DELANEY, 1974)
? SUFFIELDSILTYCLAY, 0.5 GHz(HOEKSTRA AND DELANEY, 1974)
0.1 0.2 0.3 0.4
SOIL MOISTURE (GRAMS PER CMJ)
Figure 18. Relative dielectric constant- values of soil as a functionof volumetric water content: Loam, clay; frequency 0.03GHz - 0.5 GHz; imaginary part.
25
26
24
22
LU0£
on
18
: 16
14o 10o 12
10 -
£ 8o
6 -
0
o YUMASAND, 1.1 GHz(LUNDIEN, 1971)
• YUMASAND, 1.5 GHz(LUNDIEN, 1971)
D OPENWOOD STREET SILT,1.1 GHz (LUNDIEN, 1971)
•OPENWOOD STREET SILT,1.5 GHz (LUNDIEN, 1971)
* SAN ANTON 10 CLAY LOAM,1.0 GHz (HIPP,1974)
o PUERTO RICO CLAY LOAM,1.0 GHz (HIPP, 1974)
f LONG LAKE CLAY,1.1 GHz (LUNDIEN, 1971)
V LONG LAKE CLAY,1.5 GHz (LUNDIEN, 1971) !
o *
BO T
o
D
O
m
o
0.0 0.1 0.2 0.3 0.4 0.5SOIL MOISTURE (GRAMS PER CM3)
Figure 19. RelaMve dielecrric constant values of soil as a function of volumetricwater content: Sand, loam, clay; frequency 1.1 GHz - 1.5 GHz;real part.
26
20
18Q_
>-16eel
O
112
110
o 8oo
o
o YUMASAND, 1.1 GHz(LUNDIEN, 1971)
• YUMA SAND, 1.5 GHz(LUNDIEN, 1971)
n OPENWOOD STREET SILT,1.1 GHz (LUNDIEN, 1971)
• OPENWOOD STREET SILT,1.5 GHz (LUNDIEN, 1971)
• SAN ANTON 10 CLAY LOAM,1.0 GHz (HIPP, 1974)
o PUERTO RICO CLAY LOAM,1.0 GHz (HIPP, 1974)
? LONG LAKE CLAY,1.1 GHz (LUNDIEN, 1971)
7 LONG LAKE CLAY,1.5 GHz (LUNDIEN, 1971)
SOIL MOISTURE (GRAMS PER CM)
Figure 20. Relative dielectric constant values of soil as a function of volumetricwater content: Sand, loam, clay; frequency 1.1 GHz - 1.5 GHz;imaginary part.
27
• MANCHESTER FINE SAND, 4.0 GHz(HOEKSTRA AND DELANEY, 1974)
• FAIRBANKS SILT, 4.0 GHz(HOEKSTRA AND DELANEY, 1974)
• SAN ANTONIO CLAY LOAM,3.8 GHz (HIPP, 1974)
0 PUERTO RICO CLAY LOAM,3.8 GHz (HIPP, 1974)
^ GOODRICH CLAY, 4.0 GHz(HOEKSTRA AND DELANEY, 1974)
1 SUFFIELDSILTYCLAY, 4.0 GHz(HOEKSTRA AND DELANEY, 1974)
20 r
SOIL MOISTURE (GRAMS PER CM0)
Figure 21. Relative dielectric constant values of soil as a function
of volumetric water content: Sand, loam, clay; frequency3.8 GHz - 4.0 GHz; real part.
28
C£.
14
O< 10
LO
Oooo:\—o
8
• MANCHESTER FINE SAND, 4.0 GHz(HOEKSTRA AND DELANEY, 1974)
• FAIRBANKS SILT, 4.0 GHz(HOEKSTRA AND DELANEY, 1974)
• SAN ANTON 10 CLAY LOAM,3.8 GHz (HIPP, 1974)
o PUERTO RICO CLAY LOAM,3.8 GHz (HIPP, 1974)
T GOODRICH CLAY, 4.0 GHz(HOEKSTRA AND DELANEY, 1974)
7 SUFFIELDSILTYCLAY, 4.0 GHz(HOEKSTRA AND DELANEY, 1974)
v?
0.0 0.1 0.2 0.3SOIL MOISTURE (GRAMS PER CM3)
0.4
Figure 22. Relative dielectric constant values of soil as a functionof volumetric water content: Sand, Ioam7 clay; frequency3.8 GHz - 4.0 GHz; imaginary part.
29
h-
Q_
25
h- "
H-CO
OO
oQCL\—Oa
16
14
12
10
8
6
H
* MANCHESTER FINE SAND, 10.0 GHz(HOEKSTRA AND DELANEY, 1974)
o AAANCHESTER FINE SAND, 26.0 GHz(HOEKSTRA AND DELANEY, 1974)
•FAIRBANKS SILT, 10.0 GHz(HOEKSTRA AND DELANEY, 1974)
o FAIRBANKS SILT, 26.0 GHz(HOEKSTRA AND DELANEY, 1974)
* CLAY, 10.0 GHz (MATZLER, 1970)* GOODRICH CLAY, 10.0 GHz
(HOEKSTRA AND DELANEY, 1974)v GOODRICH CLAY, 26.0 GHz
(HOEKSTRA AND DELANEY, 1974)? SUFFIELDSILTYCLAY, 10.0 GHz
(HOEKSTRA AND DELANEY, 1974)V SUFFIELDSILTYCLAY, 26.0 GHz
(HOEKSTRA AND DELANEY. 1974)
-* V f
0.1 0.2 0.3SOIL MOISTURE (GRAMS PER CMJ)
0.4
Figure 23. Relative dielectric constant values of soil as a function ofvolumetric water content: Sand, loam, clay; frequency10.0 GHz - 26.0 GHz; real part.
30

10 r
o^ 6o c^o g
- 2
• MANCHESTER FINE SAND, 10.0 GHz(HOEKSTRA AND DELANEY, 1974)
a MANCHESTER FINE SAND, 26.0GHZ(HOEKSTRA AND DELANEY, 1974)
• FAIRBANKS SILT, 10.0 GHz(HOEKSTRA AND DELANEY, 1974)
o FAIRBANKS SILT, 26.0 GHz(HOEKSTRA AND DELANEY, 1974)
• CLAY, 10.0 GHz (MATZLER. 1970)T GOODRICH CLAY, 10.0 GHz
(HOEKSTRA AND DELANEY. 1974)v GOODRICH CLAY, 26.0 GHz
(HOEKSTRA AND DELANEY, 1974)f SUFFIELDSILTYCLAY, 10.0 GHz
(HOEKSTRA AND DELANEY, 1974)V SUFFIELDSILTYCLAY, 26.0 GHz
(HOEKSTRA AND DELANEY. 1974)
I
0.0 0.1 0.2 0.3 0.4
SOIL MOISTURE (GRAMS PER CM3)
Figure 24. Relative dielectric constant values of soil as a function ofvolumetric water content: Sand, loam, clay; frequency10.0 GHz - 26.0 GHz; imaginary part.
31
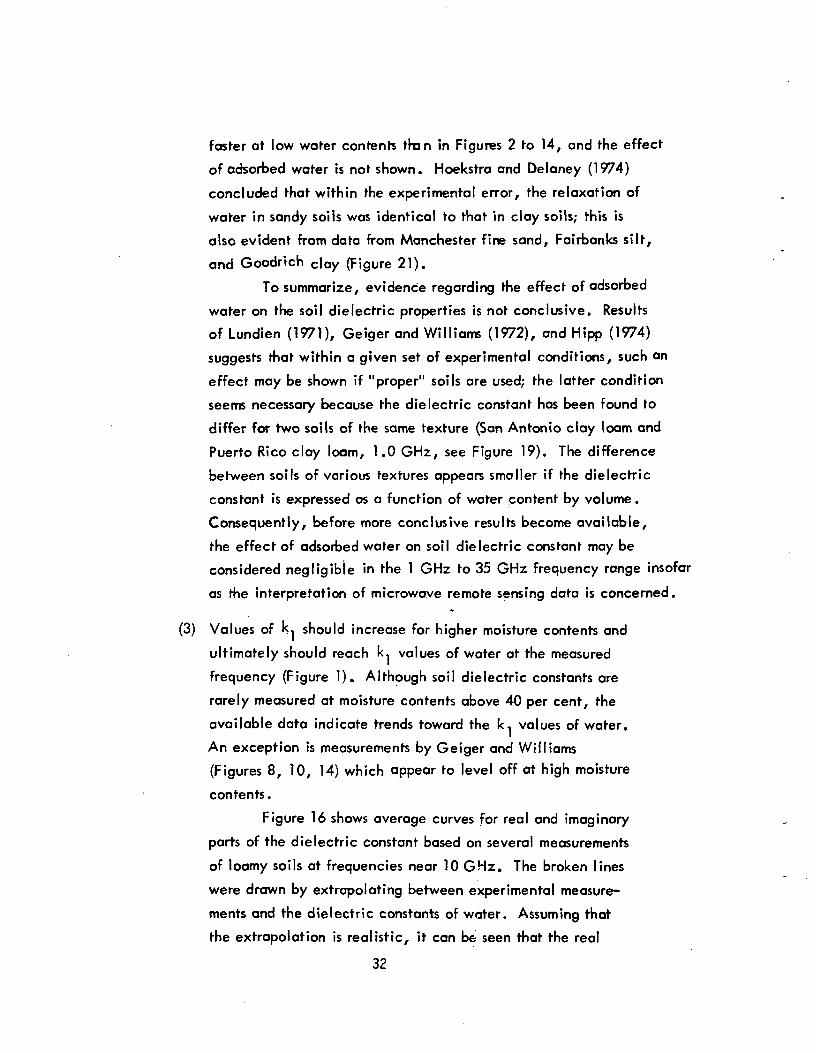
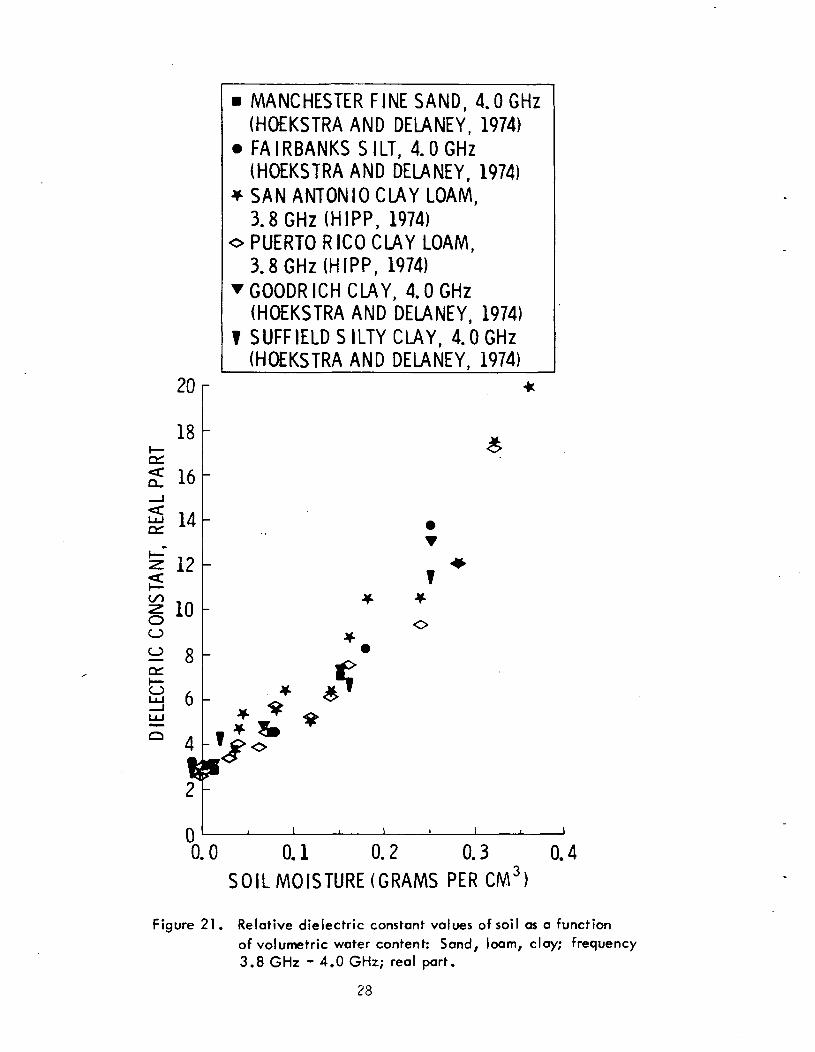
faster at low water contents than in Figures 2 to 14, and the effect
of adsorbed water is not shown. Hoekstra and Delaney (1974)
concluded that within the experimental error, the relaxation of
water in sandy soils was identical to that in clay soils; this is
also evident from data from Manchester fine sand, Fairbanks silt,
and Goodrich c|ay (Figure 21).
To summarize, evidence regarding the effect of adsorbed
water on the soil dielectric properties is not conclusive. Results
of Lundien (1971), Geiger and Williams (1972), and Hipp (1974)
suggests that within a given set of experimental conditions, such an
effect may be shown if "proper" soils are used; the latter condition
seems necessary because the dielectric constant has been found to
differ for two soils of the same texture (San Antonio clay loam and
Puerto Rico clay loam, 1.0 GHz, see Figure 19). The difference
between soils of various textures appears smaller if the dielectric
constant is expressed as a function of water content by volume.
Consequently, before more conclusive results become available,
the effect of adsorbed water on soil dielectric constant may be
considered negligible in the 1 GHz to 35 GHz frequency range insofar
as the interpretation of microwave remote sensing data is concerned.
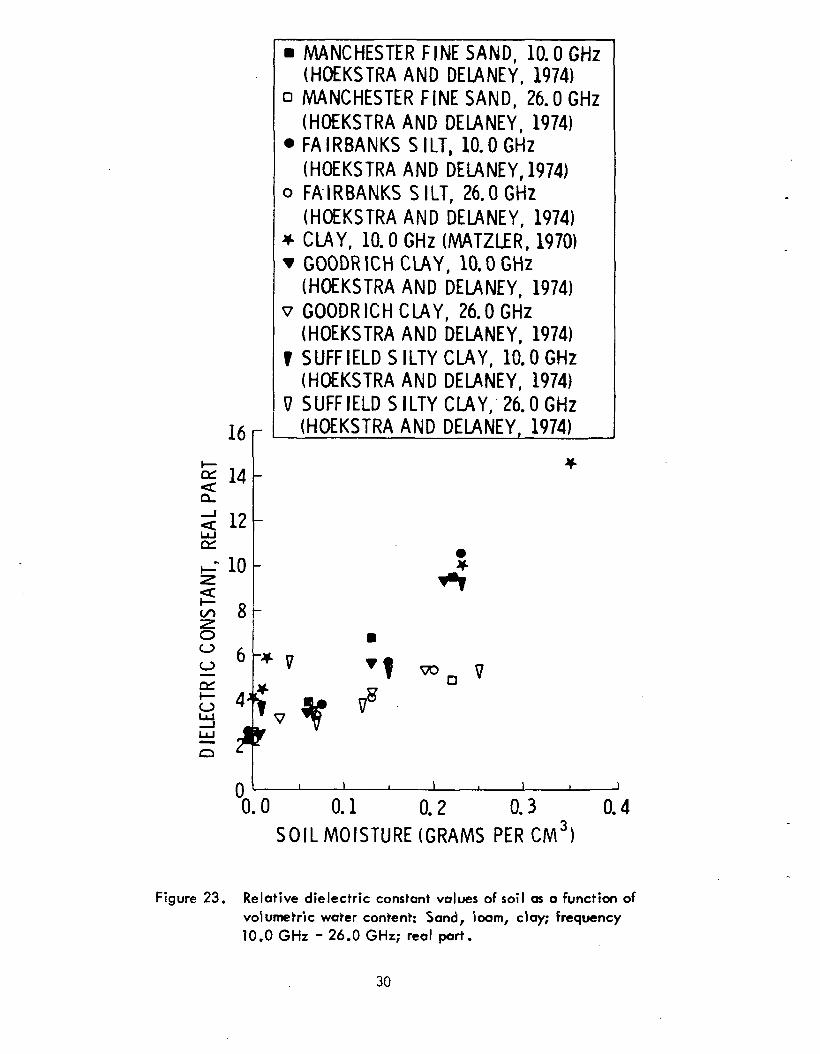
(3) Values of k should increase for higher moisture contents and
ultimately should reach k^ values of water at the measured
frequency (Figure 1). Although soil dielectric constants are
rarely measured at moisture contents above 40 per cent, the
available data indicate trends toward the k, values of water.
An exception is measurements by Geiger and Williams
(Figures 8, 10, 14) which appear to level off at high moisture
contents.
Figure 16 shows average curves for real and imaginary
parts of the dielectric constant based on several measurements
of loamy soils at frequencies near 10 GHz. The broken lines
were drawn by extrapolating between experimental measure-
ments and the dielectric constants of water. Assuming that
the extrapolation is realistic, it can be seen that the real
32
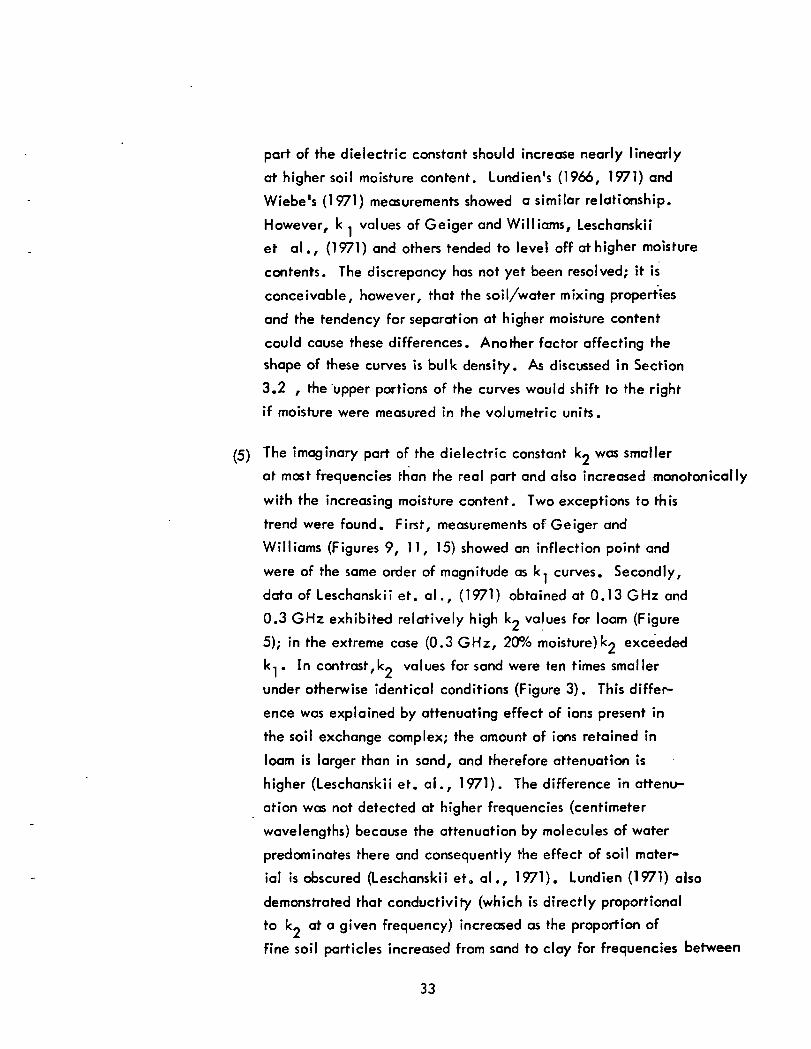
part of the dielectric constant should increase nearly linearly
at higher soil moisture content. Lundien's (1966, 1971) and
Wiebe's (1971) measurements showed a similar relationship.
However, k . values of Geiger and Williams, Leschanskii
et al., (1971) and others tended to level off at higher moisture
contents. The discrepancy has not yet been resolved; it is
conceivable, however, that the soil/water mixing properties
and the tendency for separation at higher moisture content
could cause these differences. Anomer factor affecting the
shape of these curves is bulk density. As discussed in Section
3.2 , the upper portions of the curves would shift to the right
if moisture were measured in the volumetric units.
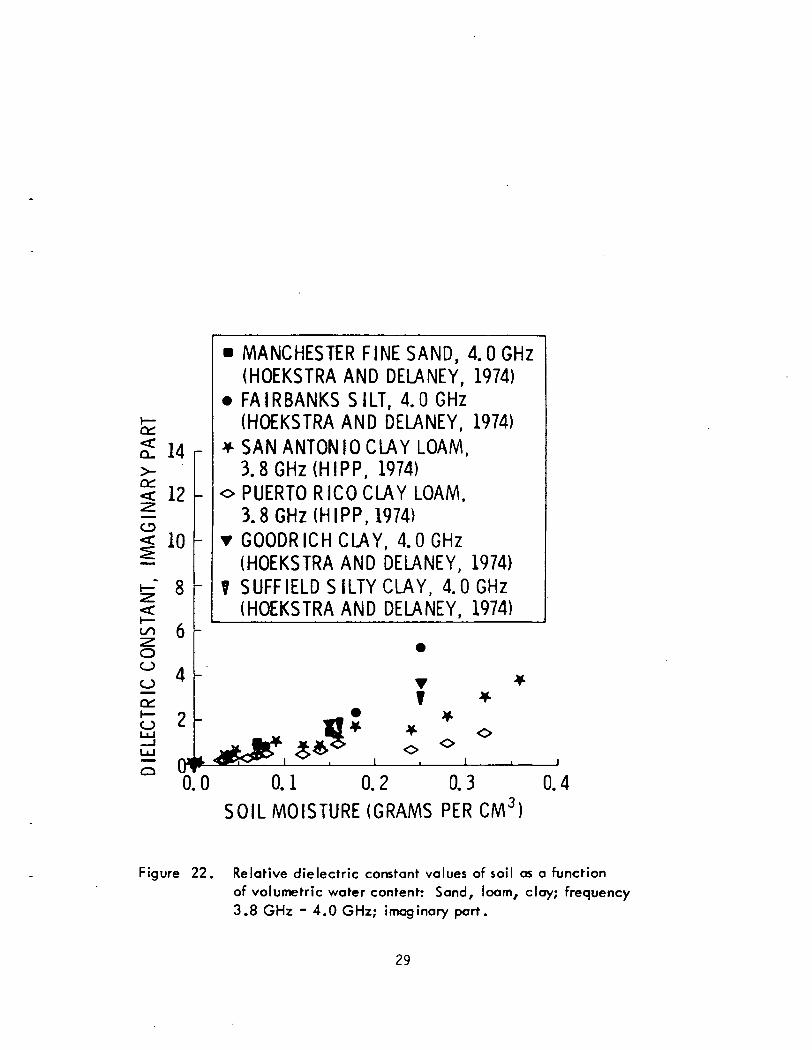
(5) The imaginary part of the dielectric constant kj was smaller
at most frequencies rhan the real part and also increased monotonically
with the increasing moisture content. Two exceptions to this
trend were found. First, measurements of Geiger and
Williams (Figures 9, 11, 15) showed an inflection point and
were of the same order of magnitude as k, curves. Secondly,
data of Leschanskii et. al., (1971) obtained at 0.13 GHz and
0.3 GHz exhibited relatively high V~ values for loam (Figure
5); in the extreme case (0.3 GHz, 20% moisture)^2 exceeded
k-.. In contrast,k« values for sand were ten times smaller
under otherwise identical conditions (Figure 3). This differ-
ence was explained by attenuating effect of ions present in
the soil exchange complex; the amount of ions retained in
loam is larger than in sand, and therefore attenuation is
higher (Leschanskii et. al., 1971). The difference in attenu-
ation was not detected at higher frequencies (centimeter
wavelengths) because the attenuation by molecules of water
predominates there and consequently the effect of soil mater-
ial is obscured (Leschanskii et0 al., 1971). Lundien (1971) also
demonstrated that conductivity (which is directly proportional
to k? at a given frequency) increased as the proportion of
fine soil particles increased from sand to clay for frequencies between
33

1.074 GHz and 1.499 GHz . Figure 18 shows that k~ was
much higher at 0.03 GHz than at 0.5 GHz; no such difference
was detected at higher frequencies for the same soils (Figure 22). .
Thus the ion exchange characteristics of soil material appear to
affect soil dielectric properties at low frequencies. However,
the magnitude of the effect at 0.3 GHz is more pronounced in
the data reported by Leschanskii et al., (1971) (Figure 5) compared
with Lundien's (1966, 1971). It should be noted that Hoekstra and
Delaney (1974) did not detect any ionic interaction at 0.5 GHz.
The relationship between the relative dielectric constant and soil moisture
has been quantified by Lundien (1971) for five frequencies (between 1.074 GHz and
1.499 GHz) in the following form:
m = 1 - Oz2.6- + 0 . 1 1 (grams per cm3) (9)OUV
3.2 Bulk Density
Campbell and Ulrichs (1969) showed that the real part of the dielectric
constant k, of rocks occupied a narrow range of values when the bulk density was
constant (Figure 25). This range expanded considerably for the same rocks when
samples with different bulk densities (constant porosity) were prepared (Figure 26).
This difference could be due to either inherent dielectric properties of the various rocks
or change in bulk density PS . Figure 27 shows that k, increases with bulk density for
a given soil type; consequently, bulk density of a given soil or rock material affects
its dielectric constant. The curve in Figure 27 was calculated from Krotikov's
(1962, in : Peake et al., 1966) formula:
k,= 1 + -V (io)
Equation (10) was also found to hold for pumice at 10 GHz (Peake et al., 1966).
The trend shown in Figure 27is supported by results of Edgerton et al., (1971) who
noticed a decrease in dielectric constant with decreasing bulk density for low moisture
contents.34
co
9i 55
i§o ,_~5 ouO ^
o> .t:« E=* »o a.a: ^
If)
o•o!n 6
<D aj * •—I•^ w "O•^ o c o:o . w ..CD o -Q &o £ J: = 2^0•C o x a
f 1 -^ ^ • a , « a , s j a , j j ^ g _ ; w ~ g
"i * = c '5 O 'c O -1 •: Z •> •= >
0CM
a - o * o
sslif^0 .0"
ne
a. >> vo t -g 50. w £ c
-•o ? Pm *
Oliv
Ser
pen Ano
e
oinoO
;««'•= an i
Lak
e C
ount
y , O
Gab
bro
, B
ytow
ni • •5 cT.-J--£« o i«-0 >0
1258^3^M o S I - -w ^ ^
Se
Bas
alt ,
chan
ging
S. .. _ ^
» 9-
>. y
11
° -s s
.t: <n
o £01AO
t „
it?3i Eo o-Si
u0
>§O u.j_ <"O^
2 >0) c
1 =§.§
> E —V 3 v>
T3 T3C CO O
£ CM0)DO)
35
_o_ooo
>soo:
it
o o> tt> — co o>•^ *• ^- o o -^
i *
I
I -
0
•O *
•o
.t c TJ . i:J go
-oco
0)_QQ.
OU
*
8
8.vOtf^C
Oo
ff
-
§ 25° o .
s
-- a>o -S g * o
™ •»c JS0> 00
coy'M
oQ. O
2
wQ.
0)
O)
36
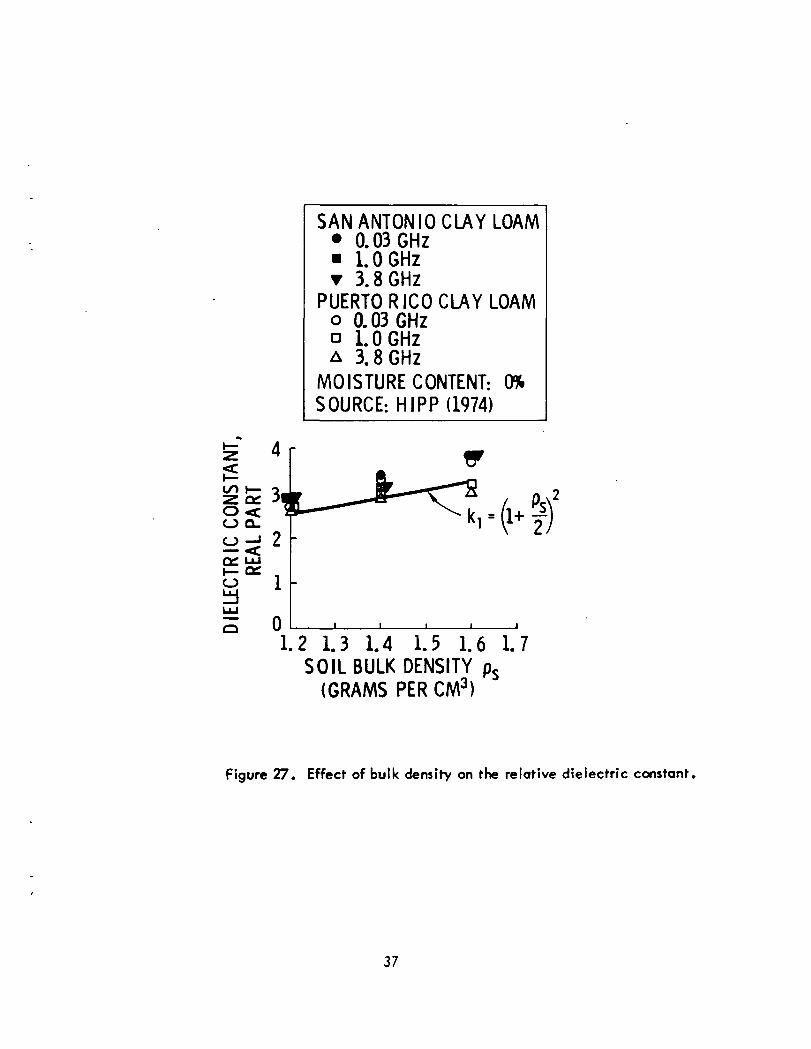
SAN ANTON 10 CLAY LOAM• 0.03 GHz• 1.0 GHzT 3.8 GHz
PUERTO RICO CLAY LOAMo 0.03 GHza 1.0 GHzA 3.8 GHz
MOISTURE CONTENT: 0%SOURCE: HIPP (1974)
CO I—z oco<O 0.
Oa
3
2
1
01.2 1.3 1.4 1.5 1.6 1.7
SOIL BULK DENSITY ps
(GRAMS PER CM3)
Figure 27. Effect of bulk density on the relative dielectric constant.
37
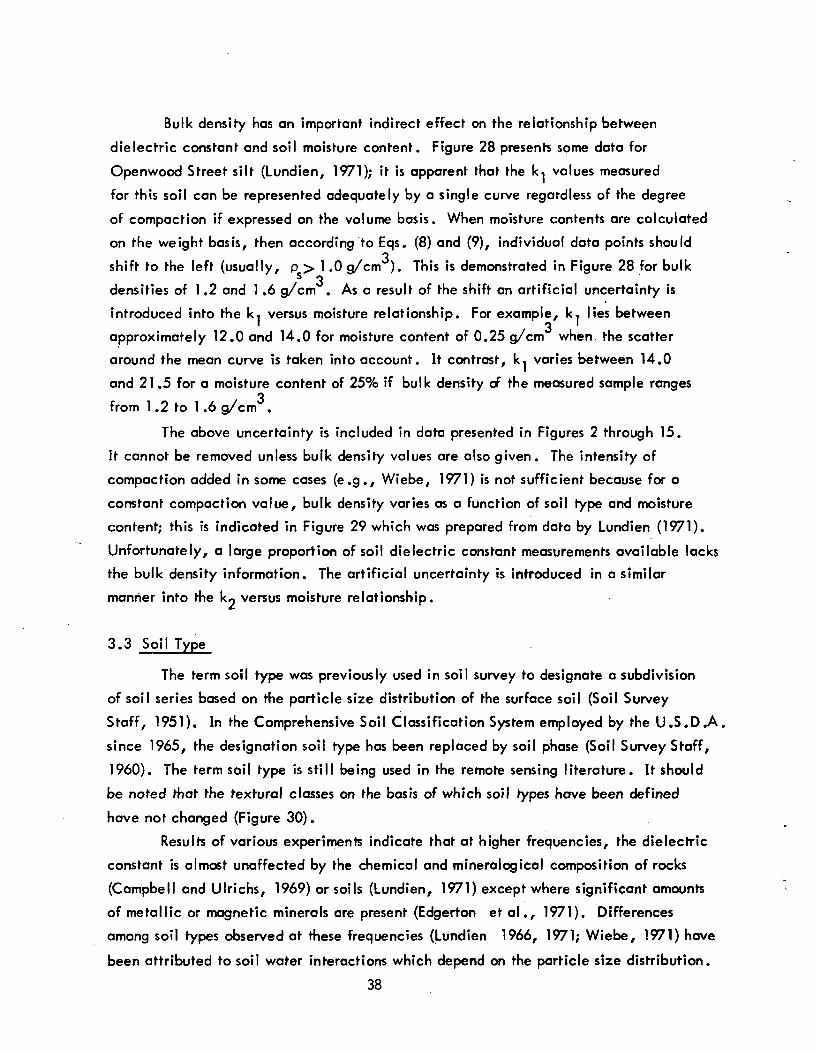
Bulk density has an important indirect effect on the relationship between
dielectric constant and soil moisture content. Figure 28 presents some data for
Openwood Street silt (Lundien, 1971); it is apparent that the k, values measured
for this soil can be represented adequately by a single curve regardless of the degree
of compaction if expressed on the volume basis. When moisture contents are calculated
on the weight basis, then according to Eqs. (8) and (9), individual data points should2
shift to the left (usually, p > 1.0 g/cm ). This is demonstrated in Figure 28 for bulk^ 3
densities of 1.2 and 1.6 g/cm . As a result of the shift an artificial uncertainty is
introduced into the k, versus moisture relationship. For example, k, lies between3
approximately 12.0 and 14.0 for moisture content of 0.25 g/cm when the scatter
around the mean curve is taken into account. It contrast, k, varies between 14.0
and 21.5 for a moisture content of 25% if bulk density of the measured sample rangeso
from 1.2 to 1.6 g/cm .
The above uncertainty is included in data presented in Figures 2 through 15.
It cannot be removed unless bulk density values are also given. The intensity of
compaction added in some cases (e.g., Wiebe, 1971) is not sufficient because for a
constant compaction value, bulk density varies as a function of soil type and moisture
content; this is indicated in Figure 29 which was prepared from data by Lundien (1971).
Unfortunately, a large proportion of soil dielectric constant measurements available lacks
the bulk density information. The artificial uncertainty is introduced in a similar
manner into the kj versus moisture relationship.
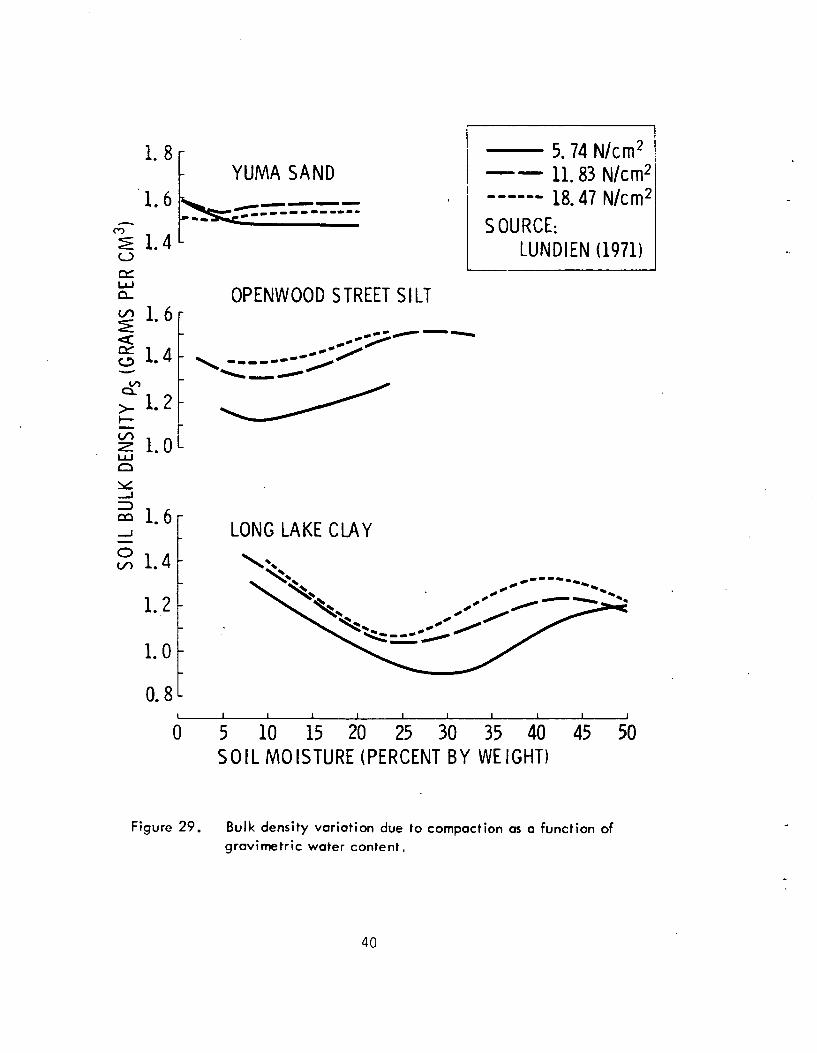
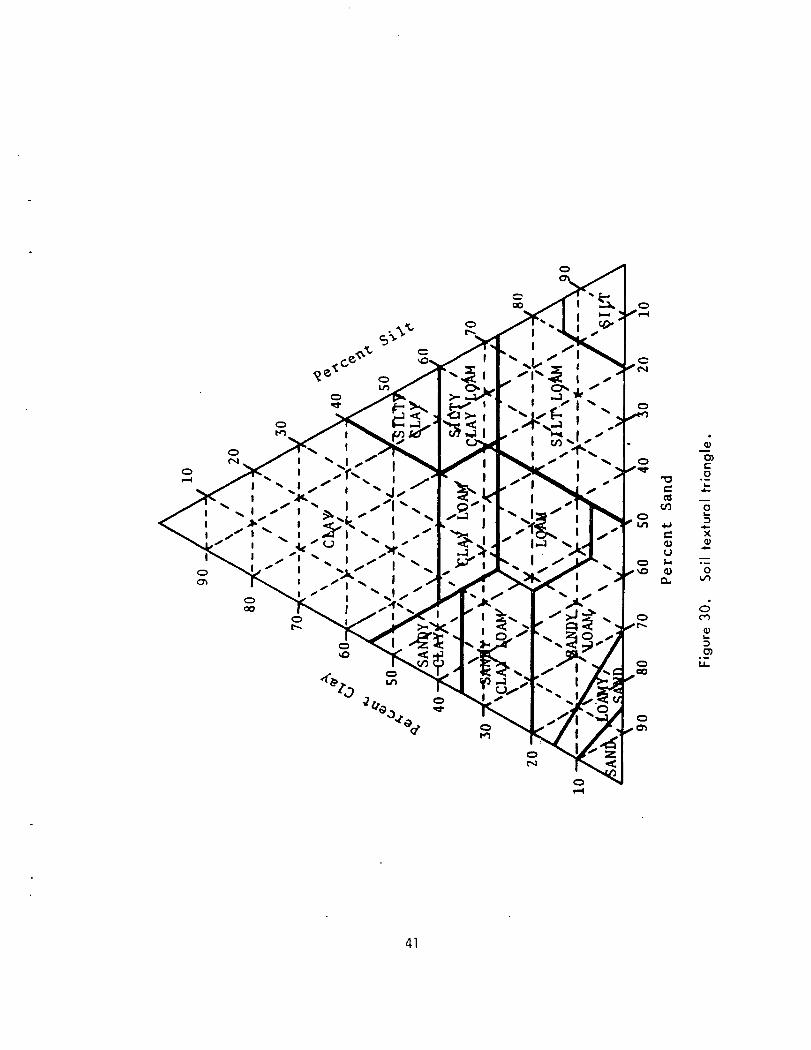
3.3 Soil Type
The term soil type was previously used in soil survey to designate a subdivision
of soil series based on the particle size distribution of the surface soil (Soil Survey
Staff, 1951). In the Comprehensive Soil Classification System employed by the U.S.D.A.
since 1965, the designation soil type has been replaced by soil phase (Soil Survey Staff,
1960). The term soil type is still being used in the remote sensing literature. It should
be noted that the textural classes on the basis of which soil rypes have been defined
have not changed (Figure 30).
Results of various experiments indicate that at higher frequencies, the dielectric
constant is almost unaffected by the chemical and mineralogical composition of rocks
(Campbell and Ulrichs, 1969) or soils (Lundien, 1971) except where significant amounts
of metallic or magnetic minerals are present (Edgerton et al., 1971). Differences
among soil types observed at these frequencies (Lundien 1966, 1971; Wiebe, 1971) have
been attributed to soil water interactions which depend on the particle size distribution.
38

5 30o.
a;-20
"10
Oa!±i 0
SOIL: OPENWOOD STREET SILTFREQUENCY: 1.074 GHzCOMPACTION MOISTURE BY
(N/cm2)5. 7411. 8318. 47
VOLUME WEIGHToA
1.6g/cm3
ps = 1.2 g/cm3
0.0 0.1 0.2 0.3 0.4SOIL MOISTURE (GRAMS PER CM3)
l i i i i i i i i
0 10 20 30 40SOIL MOISTURE (PERCENT BY WEIGHT)
Figure 28. Change in relative dielectric constant due to soil moisture
units used.
39
o
UJQ_
1.8
1.6
1.4
YUMA SAND
g 1.6
1 M
5l.2
CO
LU1.0
5. 74 N/cm2 |11.83 N/cm2
18.47 N/cm2
SOURCE:LUNDIEN (1971)
OPENWOOD STREET SILT
1.6
S 1.4
1.2
1.0
0.8
LONG LAKE CLAY
I I
0 5 10 15 20 25 30 35 40 45 50SOIL MOISTURE (PERCENT BY WEIGHT)
Figure 29. Bulk density variation due to compaction as a function ofgravimetric water content.
40
A
Cco
CO
CCDUJ-<u
cu
O)CO
O
3
"x
O1/1
DO)
41
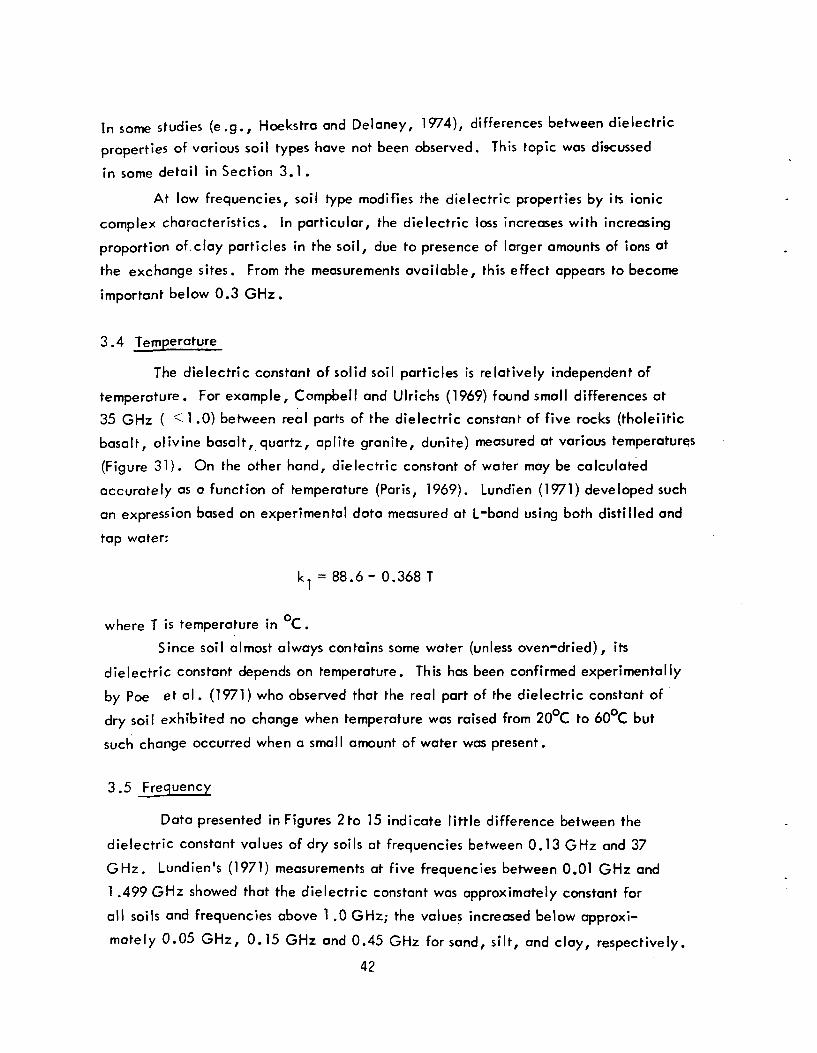
In some studies (e.g., Hoekstra and Delaney, 1974), differences between dielectric
properties of various soil types have not been observed. This topic was discussed
in some detail in Section 3.1 .
At low frequencies, soil type modifies the dielectric properties by its ionic
complex characteristics. In particular, the dielectric loss increases with increasing
proportion of.clay particles in the soil, due to presence of larger amounts of ions at
the exchange sites. From the measurements available, this effect appears to become
important below 0.3 GHz.
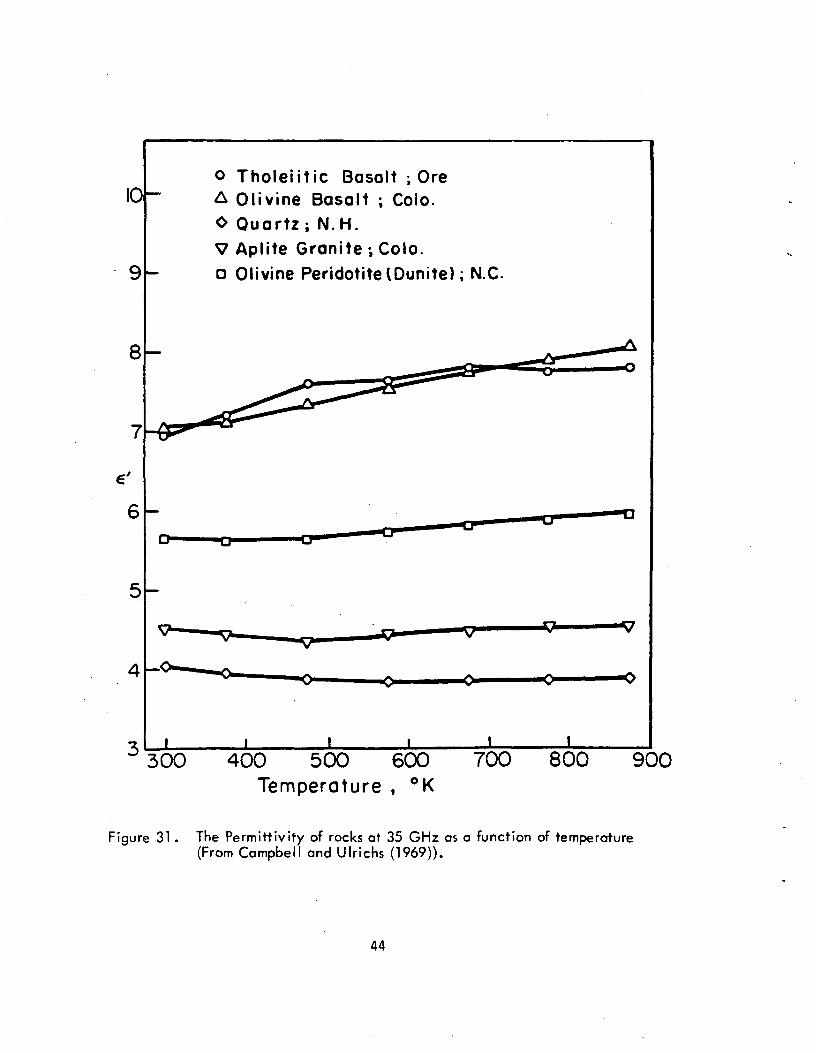
3.4 Temperature
The dielectric constant of solid soil particles is relatively independent of
temperature. For example, Compbell and Ulrichs (1969) found small differences at
35 GHz ( < 1 .0) between real parts of the dielectric constant of five rocks (rholeiitic
basalt, olivine basalt, quartz, aplite granite, dunite) measured at various temperature.s
(Figure 31). On the other hand, dielectric constant of water may be calculated
accurately as a function of temperature (Paris, 1969). Lundien (1971) developed such
an expression based on experimental data measured at L-band using both distilled and
tap water:
k1 = 88.6- 0.368T
where T is temperature in C.
Since soil almost always contains some water (unless oven-dried), its
dielectric constant depends on temperature. This has been confirmed experimentally
by Poe et al. (1971) who observed that the real part of the dielectric constant of
dry soil exhibited no change when temperature was raised from 20°C to 60 C but
such change occurred when a small amount of water was present.
3.5 frequency
Data presented in Figures 2 to 15 indicate little difference between the
dielectric constant values of dry soils at frequencies between 0.13 GHz and 37
GHz. Lundien's (1971) measurements at five frequencies between 0.01 GHz and
1 .499 GHz showed that the dielectric constant was approximately constant for
all soils and frequencies above 1 .0 GHz; the values increased below approxi-
mately 0.05 GHz, 0.15 GHz and 0.45 GHz for sand, silt, and clay, respectively.
42

These data are in agreement with the results measured for rocks: Campbell and
Ulrichs (1969) found that the dielectric constant values of a variety of terrestrial
rocks and minerals exhibited only small differences between two frequencies,
450 MHz and 35 GHz; materials that displayed differences tended to be the in-
homogeneous ones (Figure 32).
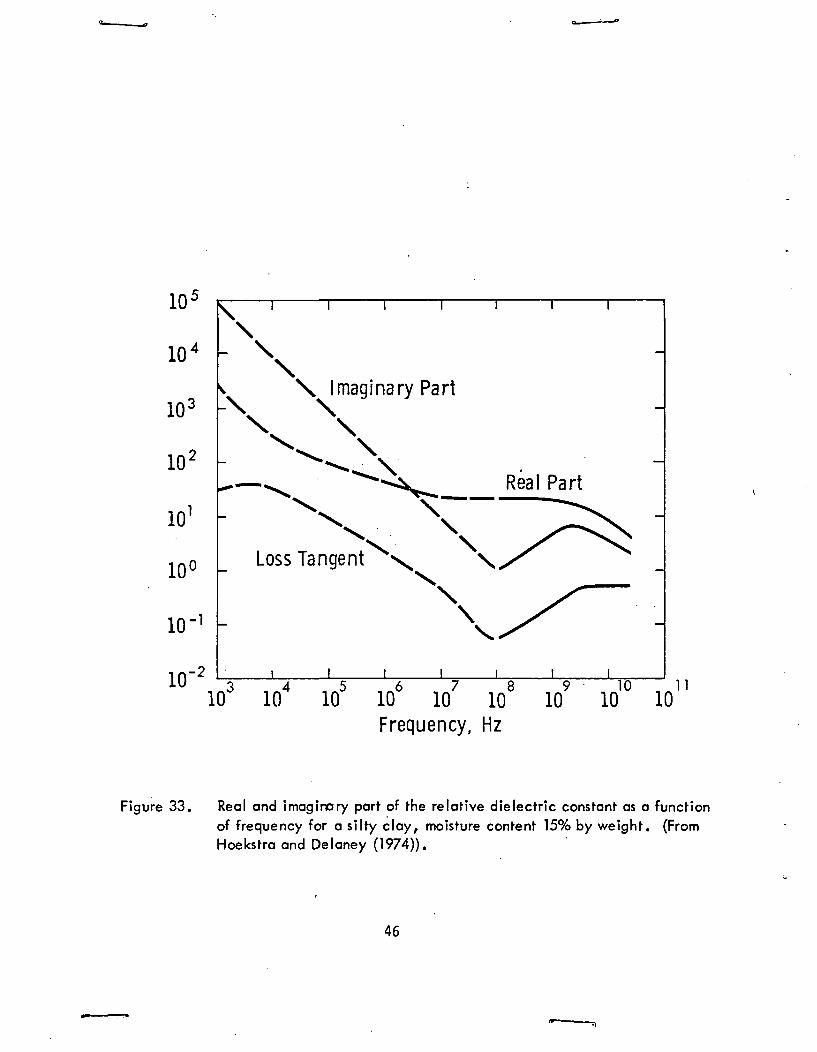
It should be noted again that the above results hold for dry materials; the
dielectric constant becomes frequency dependent when water is added. Hoekstra and
Delaney (1974) presented kj, k2, and loss tangent (kj/ k,) values for a silty clay
at 15% moisture content (Figure 33). Values above 0.1 GHz represent Suffield
silty clay (Figures 17 through 24) while data at lower frequencies were obtained from
a study by Smith-Rose (1933). The dielectric loss can be seen to be small around 0.1 GHz
but increases in both directions. At higher frequencies, the presence of water causes
increase in dielectric loss. The shape of the curves at lower frequencies will depend on
soil type.
4.0 REPRESENTATIVE DIELECTRIC VALUES
As evident from the previous section, a large number of dielectric constant
measurements by various investigators have been made. The data exhibit a scatter
which is due to both inherent soil variability and experimental error. To use these
measurements for analyzing microwave signal variations with moisture content,
however, only one representative data set is needed. Results of section 3.0 suggest
that the dielectric constant vs. soil moisture relationship should be given (i) in terms
of volumetric water content, and (ii) for various frequency/soil type combinations;
lower frequencies are more relevant because of the higher penetration depth.
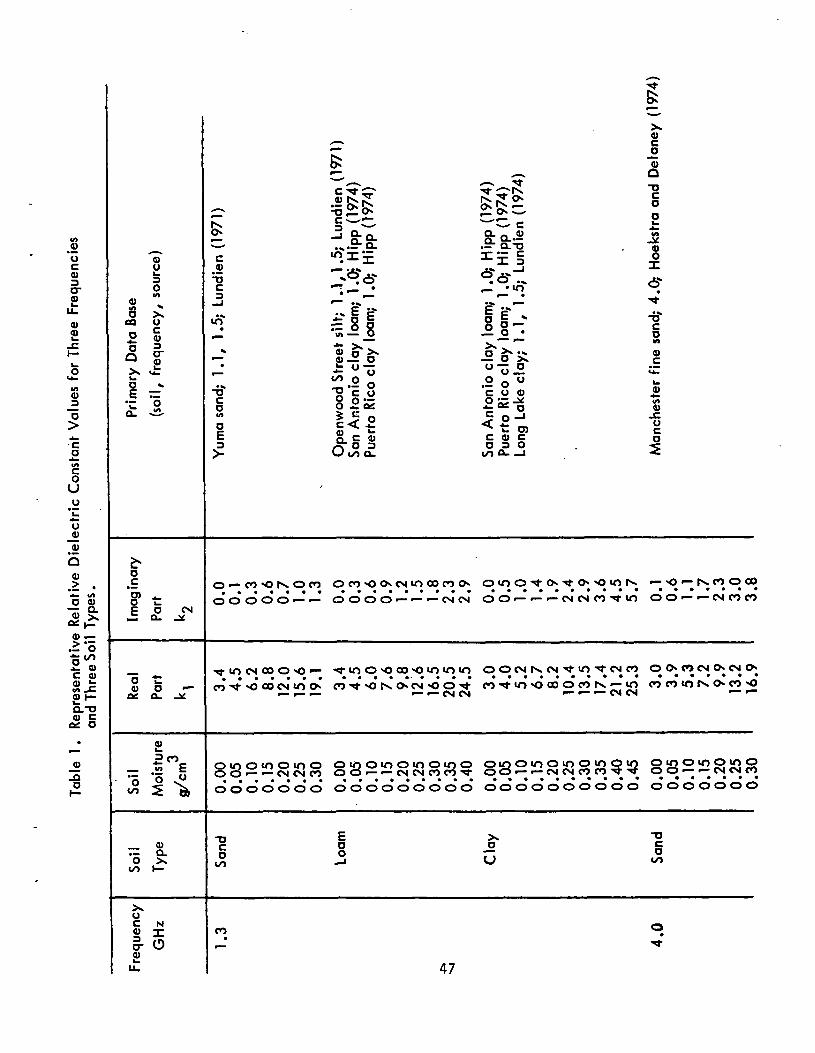
Using data shown in Figures 17 through 24, average curves were drawn through
the points for both k, and k2 for three frequencies (1.3 GHz, 4.0 GHz and 10.0 GHz)
and three soil types (sand, loam, and clay). Values read off from the average curves
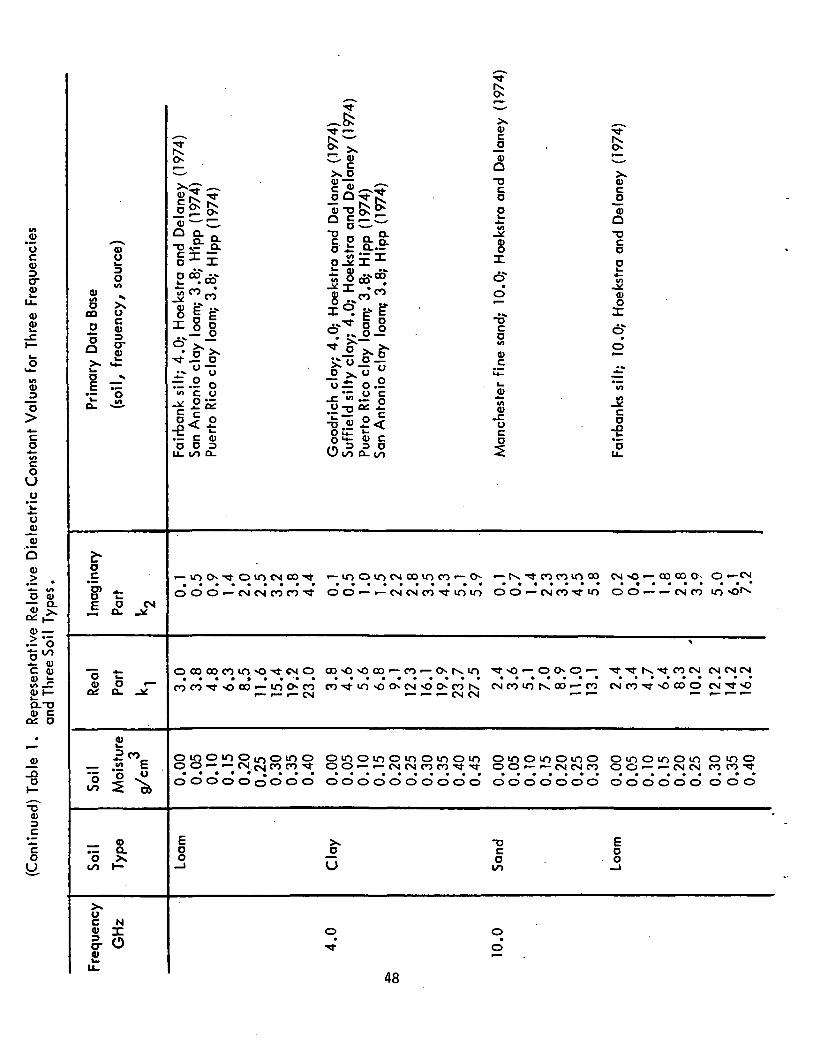
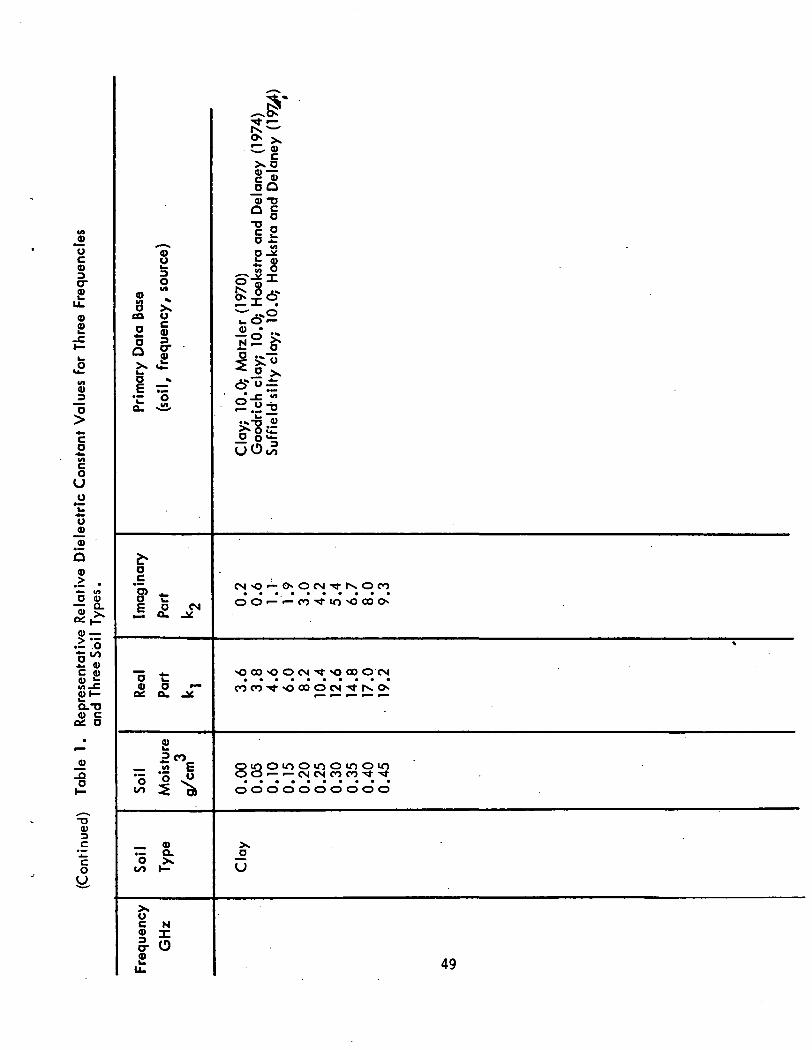
(Figures 34-36) are given in Table 1. The last column of Table 1 gives the primary
data source for the average curves; it shows that the three frequencies and soil types
represent a mean condition only.
43
10
8
€'
o Tholeiitic Basalt ; OreA Olivine Basalt ; Colo.O Quartz; N.H.V Aplite Granite ; Colo.a Olivine Peridotite(Dunite); N.C.
300 400 500 600 700 800Temperature , °K
900
Figure 31 . The Permittivity of rocks at 35 GHz as a function of temperature(From Campbell and Ulrichs (1969)).
44

1 X2 Oo mm 10
o
N
O
-oaNX
_*OO
o -
oI/I0)
'> ^
.•t •<}
Q. in
JJ-y
L «:-e
i|:u
ORIGINAL PAGE ISOF POOR QUALITY; 45
10 5
10 4
103
10 2
101
10°
ID'1
10 -2
I I I • I I I
\ Imaginary Part
Loss Tangent \
I I I I
io3 io4 io7 ~ io8 io9 io'° 10"Frequency, Hz
Figure 33. Real and imaginary part of the relative dielectric constant as a functionof frequency for a silty clay, moisture content 15% by weight. (FromHoekstra and Delaney (1974)).
46
W
.2'o0)
*J*£u_«2
_ct—
o1*.in0)
"5
•c
couL.
0)
Qai*w
•*— i/i
^~ Q.
<S ii*0> —
O fl.C (U® i:in -G
Q.-D0) C
/v O
_•
~O
1—
0)uL.
oin
1 £co u
2 So 2-
Q §T>» i
™ *2C^ *-— -
o
"5) ^_
P O CM« Q. -^
"5 t:0) O —
Q^ Cu ^
£^^ ^
• - " S oO ° \
0)~ Q.O X
«/> t—
UC N4) T*
a- 0£i
^
2^>— 'c
cD
,_T^J
oo
>
00
co - r
8S00
oto
CO
,_r
^^r[
^|1|i ^ ...
^^ f\ ^^••• ^^
i ^ ^^ ™
^^ *^^« ^^• ^^
I- E g-
S ^0*i °~3
ill^ G —
Q_ C 01
CJ ^O ^^
CO ^0 * ^5 CO C^ CO *O ' CM ^O GO CO C^
O O O •— -— O O O O -— — — CM CM
C j QO 3 ^O — *" *"^ ^^) ^^ ^O OO ^O ^^^ ^^^ ^^1
rt GO ^^ l ^ O^ CO ^^ ^O ^^ ^^ C^J *O tF~lj ^^^ 12 :;:. ^ ^.^^(^
O*OOiT)O OiOOiOO»OOtr)Oi— •— CM CM CO O O — •— CM CM CO CO • ~
ooooo ooooooooo
Eoo
47
^^
IIIQ- o <u.=- Q.-D
X|£ J
^ "O*
IfiJ'o'iKo — o.2 o °C ^O 0)
C f* ^j
c u e0 3 0
1/1 Q- _1
omo^rc«>-«*-o>o»ofvOO — — — CMCMCO-«t«O
0 0 CM N. <N ^-10 Tj- CM CO
— — •— CM CM
§82i2°jqg^§!$oooooooooo
ou
1X.
c_0
0
•go0
£4)o
d?*
-b-oo:
9)I/I0)
J=uo
— -o — tvco oO O •— — CM CO
O O« CO CM C* CM
CO CO «O N. O> CO
o in o 10 o «oOO — — CM CM
o o o o o o
co
o•>$•
00
CO
o
oCO
0
0)ocooQ
oL.
|u.a.
o
*o>o'""'
"o
"oCO
*oco
uQ)3
£u.
'sruDOM
^XUc0)
a-£J;
^""5>!2.
L.
O CMa. _*
0 f—O- -S£
£
o ,w
s.
NI0
gl— -
>»_^
^^-^C P^ hjo o^ gjQ) ' — '^,
O. °-
§ X
E«>
III°" o" >-••• ° ~o£.2 o« c _o"c •§ O ^f Oo ^^ ^~
7= c aO D 3u_ t/> a.
O O O - — CNCNCOCO-*
coco-^-'OOC)'— inocof— t— i— CM
^3 l^^ ^3 ^O *iJ Lrt ^^ IjO ^^
^3 ^Tj3 ^^ *^™ ^^J C^4 ^5 CO ^J
oooooo'ooo
j
j?^~E^fc^C- a)cX O
o Q ^f K^O T3 oJ ^
o ^-Il.llo -S in ^^ Q *«ku> O rr^^'
•^ *co
X ^t c'' M"
^^ ^^ O*^ ci O ^^0 iL"U °-5^0.2
-c '« .iJ g^O-o Q£ ii
L» ™J" Q J™^D *» ^^
o t a) c,X 3 => 0x^ I/) ^U (/)
•— inOincNooinco-— ooo-— •— CMCMco-^- in in
coo«ooo-— co-— o^tvinco^in^oo-CN^oo-coiv .
— — •— CM CM
oinoinoinoinoinOO-— •— C M C N C O C O - ^ t T Toooooooooo
0
u
o
A ^k
c>:^0)c_o0)
-oc00
I/I
1X
c?0
• *»
coa>c
1£a>
-Cun1
•~ tx ^ co co m coo o — CM co-^i- m
•* >o «— o o o •—CN co in K co •— co
o in o in o m oo o •— •— CM CN co0 0 O 0 OOO
•D
0CO
o0
c}:J™"
^^IS)c_oVo
oo1-
0)o
6;o•^
«n
co.tou_
CM «O •— OO CO O- O •— CM
o o •— •— CM co in o^
\
•^••^J-f^-»tCOCN CMCMCMC M C O - ^ - O C O O CN^M3
Oino inom o m oO O -- — CM CM COCO-*
O O O O O O O O O
0o
48
J)u0>
£o
0)
o1oU
uJ)0)
Oo
y D
ata
Base
frequency
, so
urc
4)
0) TJ
O
11
^ ^^
..— ^
^ v»
-? 8.(0 —
0°°2 4)C Q)
Q.-00) C
Q£ O
-OO
<uc
oy
OO-— •—
O'CM
0) O
I/I*o S iOOlOOiOOlOOlO
CD — — pgcNcoco-^--^-OOC3C3OOC3C3OO
O
•5 5:«/> H-X
_oU
uC Ho\ T^
5^049
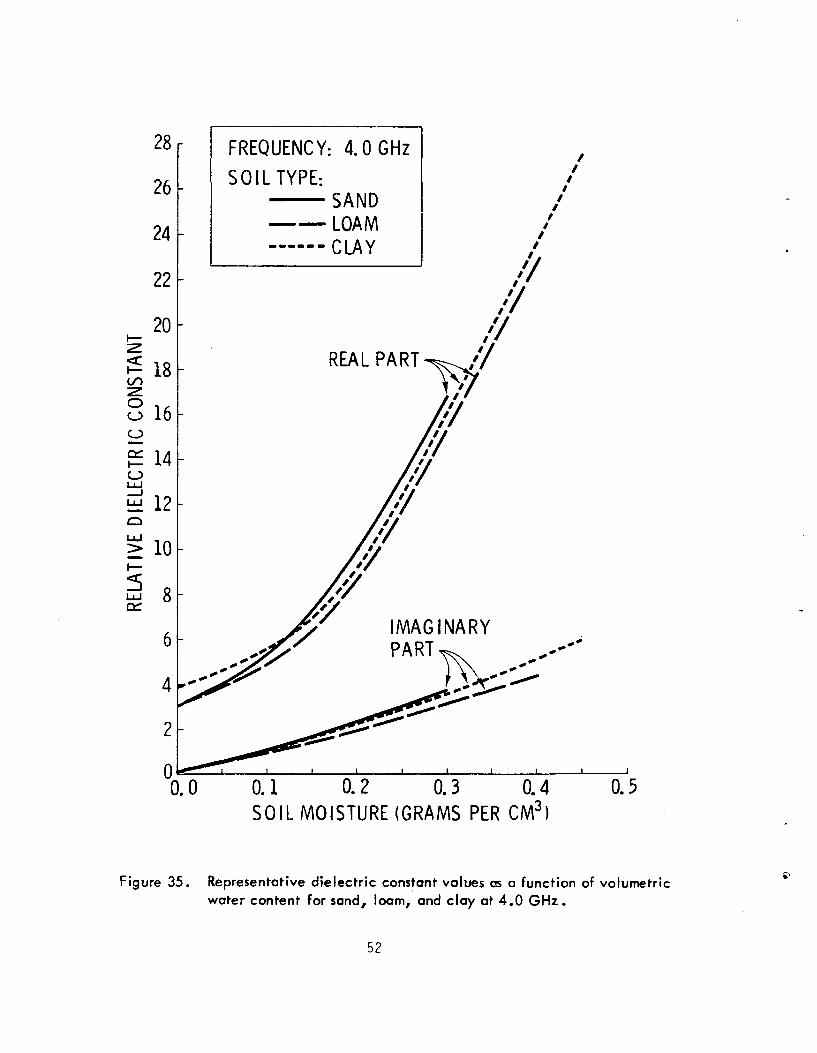
Since the representative dielectric constant curves shown in Figure 34-36
wore related to volumetric moisture, the large number of measurements shown in
Figure 2 through 15 could not be used. It was of interest to determine, however,
whether the two types of dielectric values are similar for equivalent conditions.
To this end, average k, and k« values were extracted from Figures 2 through 15 for
two frequencies (1.3.GHz and 10.0 GHz) and three soil types (sand, loam, and
clay). The average curves were based primarily on the data by Leschanskii, et al.
(1971), Lundien (1971), Wiebe (1971) and Matzler (1970). Secondly, skin depth
was computed as a function of moisture for every frequency/soil type combination;
skin depth was used for the comparison because it reflects the effect of both k and
\<.~. A comparison of the "volumetric" skin depth values to the "gravimetric" skin
depths showed, with one exception, a very good correspondence if the gravimetrico
moistures were multiplied by bulk density values between 1.4 and 1.6 g/cm . The
one exception was loam at 1.3 GHz which was located about half distance between
sand and clay based on the "volumetric" skin depth (Figure 37) but was very close
ro clay if the skin depths are computed from the "gravimetric" data set. An inspection
of the original data showed that this discrepancy was due to relatively high ^ values
for loam given by Leschanskii et al. (1971, see Figure 5) which resulted in a higher
attenuation (Eq. 4) and therefore smaller skin depth. Since physical properties of a
loamy soil are between those of sand and clay, it was decided that the "volumetric"
data set for loam at 1.3 GHz was adequate. The good correspondence between skin
depth values for "gravimetric" and "volumetric" data sets indicates that the values
given in Table 1 and Figures 34-36 are representative of the available measurements
at the three frequencies.
Figure 37 shows skin depth as a function of moisture content, computed from
values in Table 1 for a homogeneous uniformly moist soil. The skin depth values
decrease rapidly at low moisture contents and more slowly as the moisture content
increases. There is almost an order-of-magnitude difference between the three
frequencies. To obtain some information about subsurface moisture contents, low
frequencies are clearly necessary. The magnitude of a remotely measured microwave
signal is related to the reflection coefficient (for active sensors) or emissivity (for
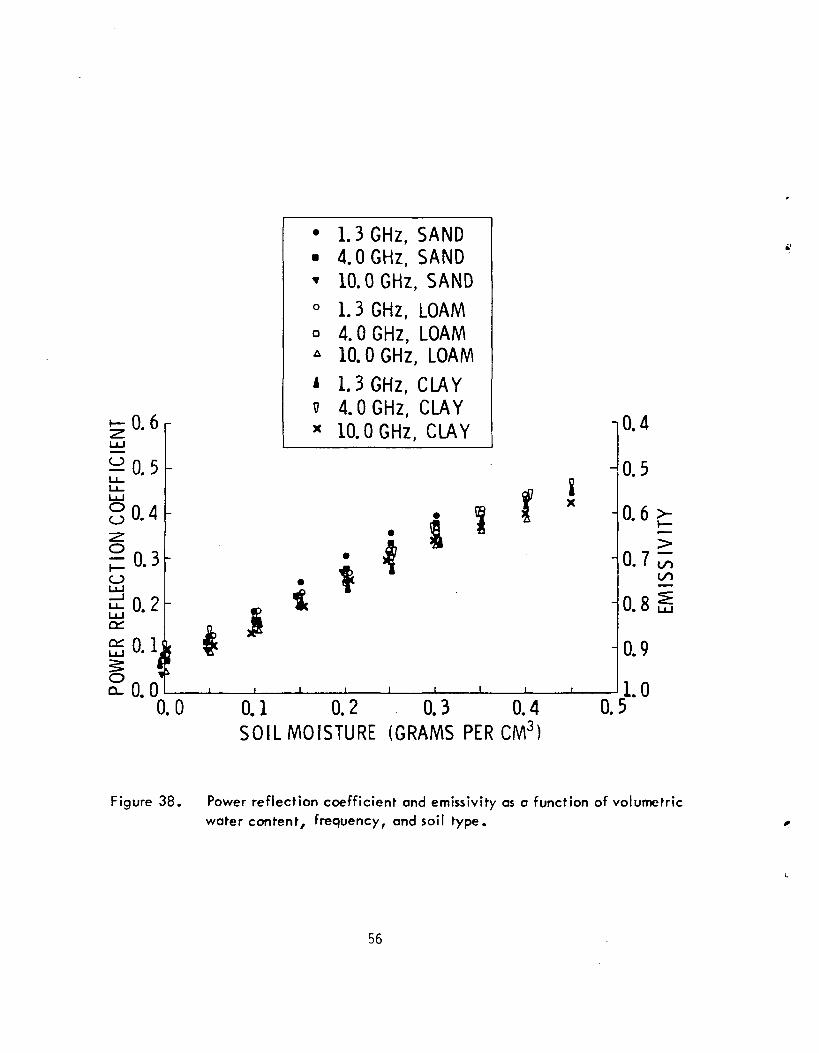
passive sensors) of the soil. Power reflection coefficient (Eq. 1,2) and emissivity
(Eq. 3) were calculated for normal incidence from data in Table 1. The results
(Figure 38) show a small variability due to soil type or frequency for the cases
considered; at any moisture content, the range was less than 0.07. The reflection
50
26
24
22
20i—
118
8 160
LU
512
8
6
4
2
FREQUENCY: 1.3 GHzSOIL TYPE:
SANDLOAMCLAY
</,'-'IMAGINARYPART,
0.1 0.2 0.3 0.4SOIL MOISTURE (GRAMS PER CM3)
0.5
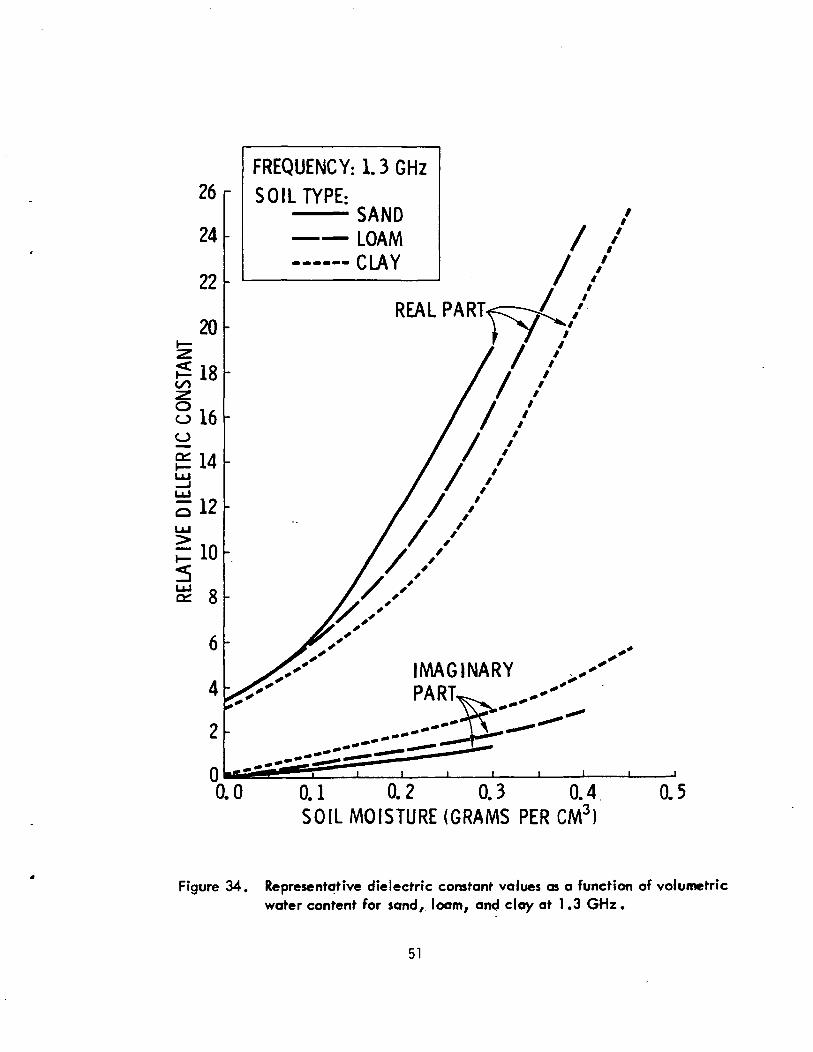
Figure 34. Representative dielectric constant values as a function of volumetricwater content for sand, loam, and cloy at 1.3 GHz.
51
28
26^ \j
24
22
20
r
-
-
FREQUENCY: 4.0 GHz
SOIL TYPE:SANDLOAM
_ _ _ _ _ _ P I A VLLAY
ti§////
////
////
///r
S18
I 16
£ 14oUJ
^ 12Q
jgio
S 8
6
4
0
REAL PART
IMAGINARYPART
0.0 0.1 0.2 0.3 0.4
SOIL MOISTURE (GRAMS PER CM3)
0.5
Figure 35. Representative dielectric constant values ess a function of volumetricwater content for sand, loam, and clay at 4.0 GHz.
52
20
18
z 16
£ 14ooo 12
5 10—iUJ
o 8LU
;= aLU
<* 4
2
0
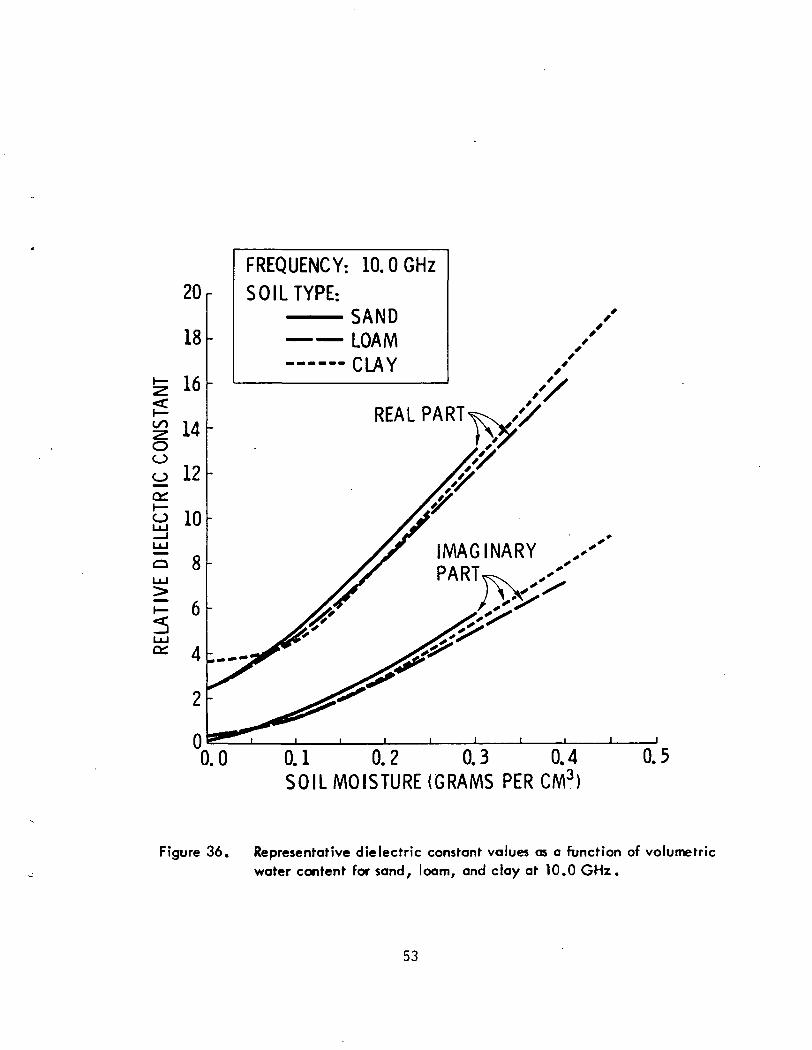
FREQUENCY: 10.0 GHzSOIL TYPE:
SANDLOAMCLAY
IMAGINARY /
i i i i
0.0 0.1 0.2 0.3 0.4 0.5SOIL MOISTURE (GRAMS PER CM3)
Figure 36. Representative dielectric constant values as a function of volumetricwater content for sand, loam, and clay at 10.0 GHz.
53

_____
_ _ _ _ _
SANDLOAMCLAY
1.3 GHz
0.001
SOIL MOISTURE (GRAMS PER CM)
Figure 37. Skin depth as a function of volumetric water content, frequency,and soil type.
54
coefficient changed from 0.08 (-11.0 dB) for a dry soil to 0.45 (-3.5 dB) at3 30.45 g/cm , an average increase of .0082 for every 0.01 g/cm . Emissivity
changed in the opposite direction (Eq. 3). Figure 38 thus suggests that the
proportion of microwave energy normally incident on a smooth, homogeneous
uniformly moist soil which is reflected from the soil is practically independent
of frequency and soil type.
55
^0.6LU
^0.5u_
SO-"
So.3oLU
gO.2
II. Iit 1 1
§; i
O *CL.0.0
0
-
• 1.3 GHz,• 4.0 GHz,* 10.0 GHz0 1.3 GHz,° 4.0 GHz,A 10.0 GHz
A 1.3 GHz,V 4.0 GHz,* 10.0 GHz
• 1• ¥i
fc *k
.0 0.1 0.2
SANDSAND, SAND
LOAMLOAM
, LOAM
CLAYCLAY
, CLAY
* I_ f X• 1 4
*
-
-
0. 3 0. 4 0.
0.4
0.5
0.6^
0.7 ^to
0.8S
0.9
1.0
SOIL MOISTURE (GRAMS PER CM3)
Figure 38. Power reflection coefficient and emissivity as a function of volumetricwater content, frequency, and soil type.
56
APPENDIX A.
BIBLIOGRAPHY
Armand, N. A., A. E. Basharinov, L. F. Borodin, and A. M. Shutko, "MicrowaveRadiation Properties of Thermal and Moist Land Areas," Proceedings of theURSI Specialist Meeting, September, 1974, Bern, Switzerland.
Basharinov, A. E., A. S. Gurvich, S. T. Yegorov, A. A. Kurskaya, D. T. Matvyevand A.M. Shutko, "The Results of Microwave Sounding of the Earth's SurfaceAccording to Experimental Data from the Satellite Cosmos 243," Space Research,vol. 11, Akademie-Verlag, Berlin, 1971.
Basharinov, A. E., L. F. Borodin, and A. M. Shutko, "Passive Microwave Sensingof Moist Soils," Proceedings Ninth International Symposium on Remote Sensingof Environment, University of Michigan, Ann Arbor, April, 1974.
Blinn, John C., III. and Jack G. Quade, "Dependence of Microwave Emission onMoisture Content for Three Soils," Proceedings 1973 International IEEE"GAP& USNC/URSI Meeting, Boulder, Colorado, August, 1973.
Cihlar, J., "Soil Moisture Determination by Microwave Measurements," RSL TechnicalMemorandum 177-38, (Internal Working Paper Only), University of KansasCenter for Research, Inc., Lawrence, Kansas, March, 1973.
Cihlar, J., "Ground Data Acquisition Procedure for Microwave (MAPS) Measurements,"RSL Technical Memorandum 177-42, (Internal Working Paper Only), Universityof Kansas Center for Research, Inc., Lawrence, Kansas, July, 1973.
Cihlar ,J., "Ground Data Acquisition for 1973 Microwave (MAPS) Measurements:Results," RSL Technical Memorandum 177-44, (Internal Working Paper Only),University of Kansas Center for Research, Inc., Lawrence, Kansas, December,1973.
de Loor, G. P., "Radar Ground Returns Part III: Further Measurements on the RadarBackscatter of Vegetation and Soils," Physics Laboratory TNO, Report No.PHL-974-05, The Hague, The Netherlands, March, 1974.
Dickey, F., C. King, J. Holtzman and R. K. Moore, "Moisture Dependency ofRadar Backscatter from Irrigated and Non-Irrigated Fields at 400 MHz and13.3 GHz," IEEE Transactions on Geoscience Electronics, vol. GE-12,no. 1, pp. 19-22, January, 1974.
Eagleman, J. R., "Moisture Detection from Skylab," Proceedings Ninth InternationalSymposium on Remote Sensing of Environment, University of Michigan,Ann Arbor, April, 1974.
57
Eaglemon, J. and F. T. Ulaby, "Radiometer-Scatterometer Soil Moisture Detection,"Proceedings of the A me ri con Astronomicol Society Meeting, August, 1974,Los Angeles, California.
Edgerton, A. T., "Engineering Applications of Microwave Radiometry," ProceedingsFifth International Symposium on Remote Sensing of Environment, Universityof Michigan, Ann Arbor, 1968.
Edgerton, A. T., R. M. Mandl, G. A. Poe, J. E.Jenkins, F. Soltis and S. Sakamoto,"Passive Microwave Measurements of Snow, Soils, and Snow-Ice-Water Systems,"Technical Report No. 4, Aerojet General Corporation, El Monte, California.
Edgerton, A. T., F. Ruskey, D0 Williams, A. Stogryn, G. Poe, D. Meeks and O.Russell, "Microwave Emission Characteristics of Natural Materials and theEnvironment," Final Technical Report 9016R-8, Aerojet General Corporation,El Monte, California.
Jean, B. R., C. L. Kroll, J. A. Richerson, J. W. Rouse, Jr., T. G. Sibley andM. L. Wiebe, "Microwave Radiometer Measurements of Soil Moisture," TechnicalReport RSC-32, Remote Sensing Center, Texas A&M University, College Station,Texas, 41 p.
Kondratyev, K. Ya., V.V. Melentyev, Yn. I. Rabinovich, and E. M. Shulgina,Doklady, AN SSSR, vol. 208, no. 2, 1973.
Kondratyev, K. Ya., E. M. Shulgina, O. M. Pokrovskiy, and Yn. M. Timofeev.Trudy, GGO, 295, pp. 86-97, 1973.
Kroll, C. L., "Remote Monitoring of Soil Moisture Using Microwave Radiometers,"Texas A&M University, Remote Sensing Center, College Station. Texas,1973, 127p.
Poe, G. A. and A. T. Edgerton, "Determination of Soil Moisture Content withAirborne Microwave Radiometry," Final Technical Report 4006R-1, AerojetGeneral Corporation, El Monte, California, 1971.
Poe , G. A., "Remote Sensing of the Near-Surface Moisture Profile of SpecularSoils with Multi-Frequency Microwave Radiometry," Proceedings SPIE,vol. 27, November, 1971. B
Poe, G., A. Stpgryn, and A. T. Edgerton, "Determination of Soil Moisture ContentUsing Microwave Radiometry," Final Technical Report 1684-1, AerojetGeneral Corporation, El Monte, California.
Popov, A. Ye., E. A. Sharkov, and V. S. Etkin, "Characteristics of radiationfrom wet soils in the microwave region," Meteorol. and Gidrol. (USSR),no. 10, pp. 49-57, 1974.
Rouse, J. W., Jr., "On the Effect of Moisture Variations on Radar Backscatrerfrom Rough Surfaces," Technical Memorandum RSC-52, Remote SensingCenter, Texas A&M University, College Station, Texas, 10p., 1972.
58
Rouse, J. W.. Jr., R. W. Newton and S. L. Lee, "On the Feasibility of MonitoringSoil Moisture with Microwave Sensors," Proceedings Ninth InternationalSymposium on Remote Sensing of Environment, University of Michigan,Ann Arbor, April, IV/4.
Schmugge, T., P. Gloersen and T. Wilheit, "Remote Sensing of Soil Moisture withMicrowave Radiometers," Goddard Space Flight Center, NASA, Greenbelt,Maryland, 32p., Preprint X-652-72-305, August, 1972.
Schrnugge, T., P. Gloersen, T. Wilheitand F. Geiger, "Remote Sensing of SoilMoisture v/ith Microwave Radiometers," Journal of Geophysical Research,vol. 79, no. 2, pp. 317-323, 1974.
Stiles, W. H., "The Effect of Surface Roughness on the Microwave Measurementof Soil Moisture Content," M. S. Thesis, University of Arkansas, Fayetteville,Arkansas, 1973.
Ulaby, F. T. and R. K. Moore, "Radar Sensing of Soil Moisture," Proceedings 1973International IEEE-GAP & USNC/URSI Meeting, Boulder, Colorado, August, 1973.
Ulaby, F. T.r "Radar Measurement of Soil Moisture Content, "IEEE Transactions onon Antennas and Propagation, vol. AP-22, no. 2, March, 1974.
Ulaby, F. T., J. Cihlar and R. K. Moore, "Active Microwave Measurement of SoilWater Content," Remote Sensing of Environment, vol. 3, pp. 185-203, 1975.
Ulaby, F. T., "Vegetation and Soil Backscatter Over the 4-18 GHz Region," Proceedingsof the URSI Specialist Meeting, September, 1974, Bern, Switzerland.
Ulaby, F. T. , "Soil Moisture Detection by Skylab's Microwave Sensors," Proceedings ofthe URSI Specialist Meeting, September, 1974, Bern, Switzerland"!
Ulaby,F., T., T. F. Bush, P. P. Batlivala and J . Cihlar, "The Effects of Soil Moistureand Plant Morphology on the Radar Backscatter from Vegetation," RSL TechnicalReport 177-51, University of Kansas Center for Research, Inc., Lawrence,Kansas, July, 1974.
59
REFERENCES
Birchak, J. R., C. G. Gardner, J. E. Hipp and J. M.. Victor, 1974, "HighDielectric Constant Microwave Probes for Sensing Soil Moisture,"Proceedings of the IEEE, vol. 62, no. 1, pp. 93-98.
Campbell, M. J. and J. Ulrichs, 1969, "Electrical Properties of Rocks and TheirSignificance for Lunar Radar Observations," Journal of GeophysicalResearch, vol. 74, pp. 5867-5881.
Edgerton, A. T., R. M. Mandl, G. A. Poe, J. E. Jenkins, F. Soltis, andS. Sakamoto, 1968, "Passive Microwave Measurements of Snow, Soils,and Snow-Ice-Water Systems," Technical Report No. 4, Aerojet GeneralCorporation, El Monte, California.
Geiger, F. E. and D. Williams, 1972, "Dielectric Constants of Soils at MicrowaveFrequencies," Goddard Space Flight Center, Greenbelt, Maryland, 30p.
Grim, R. E., 1968, Cloy Mineralogy, McGraw-Hill Book Co., New York.
Hidy, G. M., et al., 1972, "Development of a Satellite Microwave Radiometer toSense the Surface Temperature of the World Oceans," NASA CR-1960,North American Rockwell Corporation, Downey, California.
Hipp, J. E., 1974, "Soil Electromagnetic Parameters as a Function of Frequency,Soil Density, and Soil Moisture," Proceedings of the IEEE, vol. 62, no. 1,pp. 98-103.
Hoekstra, P. and A. Delaney, 1974, "Dielectric Properties of Soils at UHF andMicrowave Frequencies," Journal of Geophysical Research, vol.79, no. 11,pp. 1699-1708.
Leschanskii, Yu. I., G. N. Lebedeva and V. D. Schumilin, 1971, ("ElectricalParameters of Sandy and Loamy Soils in the Range of Centimeter, Decimeterand Meter Wavel engths). Izvestiya Vysschich Uchebnich Zavedenii,Radiofizika, vol. 14, no. 4, pp. 562-569.
Lundien, J. R., 1966, "Terrain Analysis by Electromagnetic Means," TechnicalReport No. 3-693, Report 2, U. S. Army Engineer Waterways ExperimentStation, Vicksburg, Mississippi, 55p.
Lundien, J. R., 1971, "Terrain Analysis by Electromagnetic Means," TechnicalReport No. 3-693, Report 5, U. S. Army Engineer Waterways ExperimentStation, Vicksburg, Mississippi, 33 p.
60
Marzler, C., 1970, "Messung der Wormeslrahlung der Erdoberflache imMikrowellengebiet," Institute fur Angewandre Physik, Universirat Bern,76P.
Paris, J. f.r 1969, "Microwave Radiomelry and Its Application to Marine Meteorologyand Oceanography," Department or Oceanography, Texas A&M University,210p.
Peake, W. H., et al., 1966, "The Mutual Interpretation of Active and PassiveMicrowave Sensor Outputs," Proceedings Fourth Symposium on Remote Sensingof Environment, University of Michigan, Ann Arbor, pp. 7/1-777.
Poe, G., A. Stogryn and A. T. Edgerton, 1971, "Determination of Soil MoistureContent Using Microwave Radiometry," Final Technical Report 1684-1, AerojetGeneral Corporation, El Monte, California.
Russell, M. B., 1939, "Soil Moisture Sorption Curves for Four Iowa Soils," Soil ScienceSociety of America Proceedings, vol. 4, pp. 51-54.
Smith-Rose, R. L., 1935., "The Electrical Properties of Soil at Frequencies Up to 100 MHz;with a Note on the Sensitivity of Ground in the United Kingdom," ProceedingsPhys. Soc., London, vol. 47, p. 923.
Ward, S. H., G. R. Jiracek and W. I. Linlor, 1969, "Some Factors Affecting Electro-magnetic Detection of Lunar Subsurface Water," IEEE Transactions on GeoscienceElectronics, vol. GE-7, pp. 19-27.
Wiebe, M. L., 1971, "Laboratory Measurements of the Complex Dielectric Constant ofSoils," Technical Report RSC-23, Texas A&M University, College Station,19p.
61