Embed Size (px)
Citation preview

erenteters and the
formations concludeder, whichparticles.the
Journal of Colloid and Interface Science 276 (2004) 85–91www.elsevier.com/locate/jcis
Dielectric analysis of macroporousanion-exchange resin beadssuspensions
Zhen Chena and Kong-Shuang Zhaob,∗
a Department of Chemistry, South China Normal University, Guangzhou 510631, Chinab Department of Chemistry, Beijing Normal University, Beijing 100875, China
Received 30 July 2003; accepted 12 March 2004
Available online 12 May 2004
Abstract
Dielectric measurements were carried out for suspensions of D354 anion-exchange beads dispersed in electrolyte solutions at diffconcentrations, and distinct Maxwell–Wagner dielectric relaxations were observed around 106 Hz. Through fitting the experimental data wobtained the dielectric parameters of the suspensions, and then we calculated the phase parameters from the dielectric paramemeasured volume fractions by Hanai’s method. In light of the present understanding of the interfacial properties, and with the inobtained from the phase parameters, we satisfactorily interpreted the concentration dependences of the dielectric parameters. It ithat Hanai’s method is an effective tool for obtaining the properties of dispersed particles; the properties of the electrical double layare mainly decided by the properties of the electrolyte solution, predict the dielectric behavior of suspensions with conductingThe dielectric relaxation spectroscopy (DRS), based on the M–W mechanism, is also a very sensitive tool for probing the properties ofliquid/solid interface. 2004 Elsevier Inc. All rights reserved.
Keywords: Maxwell–Wagner dielectric relaxation; Electrical double layer; Dielectric relaxation spectroscopy; Counterion association; Debye length
ns-ll–w-cten-
ast
ien
ti-fore.
rense-
eis-triclatere-s is
acial
eterseri-ai’s
partherpa-
hpor-
1. Introduction
It is well known that suspensions in electrolyte solutioare characterized by two typicalmechanisms of dielectric relaxation, low-frequency dielectric relaxation and MaxweWagner dielectric relaxation. In comparison with the lofrequency dielectric relaxation, which has been the subjeof increasing concern during the past years, both experimtally and theoretically, and is well understood now, at lefor the case of dilute suspension of spheres[1], the M–Wdielectric relaxation received far less attention. As O’Br[2] pointed out two decades ago, experimental investigationson M–W dielectric relaxation lag seriously behind theorecal ones even today. More experimental attention thereis highly merited for M–W dielectric relaxation nowadaysAccording to the original M–W theory[3,4], this kind ofrelaxation occurs when the phases in contact have diffevolume conductivities and dielectric permittivities. Sub
* Corresponding author. Fax: +86-10-62208282.E-mail address: [email protected] (K.-S. Zhao).
0021-9797/$ – see front matter 2004 Elsevier Inc. All rights reserved.doi:10.1016/j.jcis.2004.03.024
t
quently, it is found by many other researchers[2,5–7] thatthe M–W dielectric relaxation is observably sensitive to thpolarization of the electric double layer (EDL) of the dperse particles. Therefore, to investigate the M–W dielecrelaxation, an effective method that can accurately reobserved dielectric parameters to phase parameters repsenting the volume properties of both constituent phasedesirable, on the one hand, and some appropriate interfproperties are needed on the other.
Based on Wagner’s theory[4] and Hanai’s equation[8–10]of interfacial polarization, Hanai et al.[11,12]devel-oped a systematic method for calculating phase paramfrom dielectric data due to biphasic structure in a sphcal disperse system. This method, which we call Hanmethod hereafter, has been used in various systems[12–14]and turned out to be valid and practical. In this paper,of Hanai’s method was simply reviewed and was furtemployed to calculate phase parameters from dielectricrameters obtained by fitting theexperimental data. Througthe phase parameters the beads’ properties and some imtant information about ion displacement were obtained.
86 Z. Chen, K.-S. Zhao / Journal of Colloid and Interface Science 276 (2004) 85–91
es,ace
-s forary ims.wass o
tslec-
ai’satedents
esion
theto th-
esese-was
ti-ctrihavame
entlyai etingrmss, wnlyal exfor a
rm
v-the
the
w-
nrs,n-
ned
um,tri-
Research on ionic equilibrium at solid/liquid interfacas one of the most important tasks of colloid and interfscience, retains a measure of concern and is fruitful[15–18].Nevertheless, the fact that different models employed to interpret the same system always lead to different resultthe same properties shows how important and necessis to employ appropriate models to interpret given systeThe present understanding of some interfacial propertiesreviewed, through which the concentration dependencedielectric parameters were interpreted in detail. The resulindicated that the interfacial properties influence the dietric behavior observably.
An appropriate system is also desirable. Since Hanmethod was mostly employed in research on concentrsystems and turned out to be valid, dielectric measuremwere carried out for suspensions of D354 anion-exchangbeads dispersed in electrolyte solutions. The suspenwere densely packed sediments of the resin beads inaqueous phase, so we call them beds in this paper. Duelarge diameter of the beads, the two typical dielectric relaxations were markedly separated from each other[6], distinctM–W dielectric relaxations were observed around 106 Hz,and the dielectric parameters displayed regular dependencon the concentration of the solution. By interpreting thconcentration dependences, the mechanism of M–W dielectric relaxation was discussed, and the dielectric behaviorsatisfactorily elucidated.
2. Method and models
2.1. Hanai’s method
Hanai[11] proposed that it is possible in principle to esmate the phase parameters of the inner phase from dieledata observed for whole systems, since the dielectric beior of disperse systems is characterized by phase parters such as relative permittivities, electricalconductivities,and concentrations of the constituent phase. Consequbased on Wagner’s theory and Hanai’s equation, Hanal. [11,12] developed a systematic method for calculatthe phase parameters from data on dielectric relaxation fospherical disperse systems. Because the disperse systethe present case are densely packed sediment systemsimply review part of Hanai’s method here. This part is oapplied to concentrated suspensions, and the theoreticpressions are based on Hanai’s equation and derivedgeneral system.
The Hanai equation used for this method is of the fo[8–10]
(1)ε∗ − ε∗
i
ε∗a − ε∗
i
(ε∗a
ε∗
)1/3
= 1− φ,
where ε∗ and φ are, respectively, the complex permittiity and the volume fraction of the disperse phase, andsubscriptsa and i denote the continuous medium and
t
f
s
e
c--
,
ofe
-
dispersed particles, respectively. On the basis ofEq. (1), theformulae relevant to the limiting values for high and lofrequency parameters are given as[9,10]
(2)εh − εi
εa − εi
(εa
εh
)1/3
= 1− φ,
(3)εl
(3
κl − κi
− 1
κl
)= 3
(εa − εi
κa − κi
+ εi
κl − κi
)− εa
κa
,
(4)κh
(3
εh − εi
− 1
εh
)= 3
(κa − κl
εa − εi
+ κl
εh − εi
)− κa
εa
,
and
(5)κl − κi
κa − κi
(κa
κl
)1/3
= 1− φ,
whereεl , εh, κl , andκh, which together with the relaxatiofrequency (f0) are collectively called dielectric parameterepresent the limiting relative permittivity and electrical coductivity at low and high frequency, and can be obtaidirectly by fitting the experimental data. Whileκa , φ, εi , andκi are collectively called phase parameters[11], which rep-resent the electrical conductivity of the continuous medithe volume fraction, the relative permittivity, and the eleccal conductivity of the disperse particles, respectively.
For simplicity, Hanai first put
(6)C ≡(
εh
εa
)1/3
(1− φ).
FromEqs. (2), (3), and (5),
(7)C = −Q − √Q2 − 4PR
2P,
where
(8)
P =(
ka
kl
+ 2
)εlD − 3
[εhD − εa(D − 1)
]D
+(
kl
ka
− 1
)εaD,
(9)
Q = 3[2εhD − εa(D − 1)
] −[(
ka
kl
+ 2
)D + 3
]εl
−(
kl
ka
− 1
)εaD,
(10)R = 3(εl − εh),
and
(11)D =(
εakl
εhka
)1/3
.
Next,Eqs. (2) and (5)were substituted forEq. (4)to elim-inateεi andκi . Therefore
J (ka) ≡[
3−(
2+ εa
εh
)C
](1− DC)kh
− 3{kl − [
ka(D − 1) + kl
]C
}(1− C)
(12)+ ka
(1− εh
)C(1− DC) = 0.
εa
Z. Chen, K.-S. Zhao / Journal of Colloid and Interface Science 276 (2004) 85–91 87
os-
ns
lec-, andi--ula-
uirehen
taticsite
withuch
-ionion-
aso-r-, onsys-
by,theoci-
sso-un-rfaceactib-
-s,
into
se of
pactbutown
erein
ne–93ere
eenwereso-me
se-theval-ads
r onyte-ereret to
gedes
The left side ofEq. (12)is a function ofκa provided thatεl , εh, κl , κh, andεa are given throughEqs. (7) and (11).ThoughEq. (12)could not be solved forκa due to the com-plicated functional form, computers could have made it psible to search out a root forJ (κa) = 0 numerically. Usingthe calculated value ofκa in the above way, the values ofφ,εi , andκi then can be derived from the following equatio[11] in sequence:
(13)φ = 1−(
εa
εh
)1/3
C,
(14)εi = εh − εaC
1− C,
and
(15)ki = kl − kaDC
1− DC.
2.2. Interfacial properties
Most colloidal particles and solid surfaces acquire etrostatic charges when in contact with aqueous systemssuch processes are commonly termed as interfacial equlibrium. The present researches[15–17] regard the equilibrium as a chemical reaction rather than as an accumtion of bulk species at the interface, but the way to acqelectrostatic charge varies from system to system. Wcolloidal particles and solid surfaces acquired electroscharges, the charged surface groups will attract oppoions (counterions) from the solution and then associatepart of them due to electrostatic (Coulombic) forces. Sprocess is usually termed as counterion association[18].Rather than original understanding[19,20], present understanding[17,18] indicates that the counterion associatoccurs through direct complexation, analogous to weakpair formation.
Since the concept of an electrical double layer (EDL) wfirst introduced[19,20], various models were gradually prposed[16–21], which were respectively adopted for diffeent purposes or systems. Based on general EDL modelsrepresenting the macroporous monofunctional surfacetem is employed here and graphically represented asFig. 1.
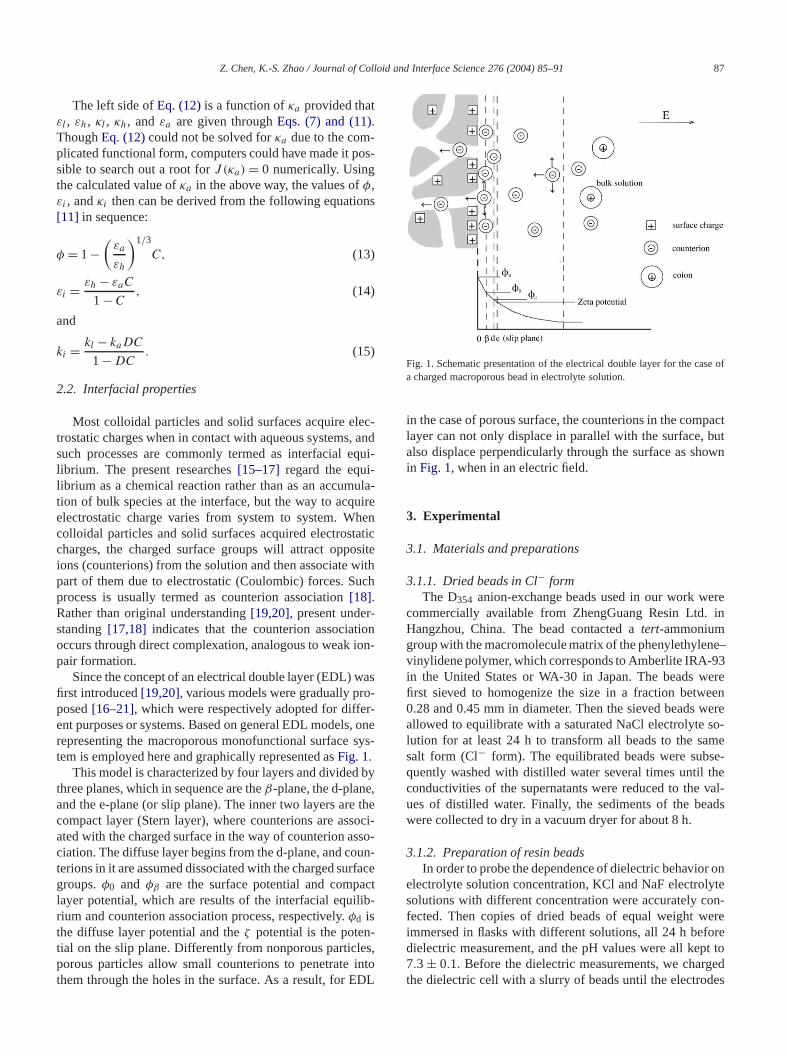
This model is characterized by four layers and dividedthree planes, which in sequence are theβ-plane, the d-planeand the e-plane (or slip plane). The inner two layers arecompact layer (Stern layer), where counterions are assated with the charged surface in the way of counterion aciation. The diffuse layer begins from the d-plane, and coterions in it are assumed dissociated with the charged sugroups.φ0 and φβ are the surface potential and complayer potential, which are results of the interfacial equilrium and counterion association process, respectively.φd isthe diffuse layer potential and theζ potential is the potential on the slip plane. Differently from nonporous particleporous particles allow small counterions to penetratethem through the holes in the surface. As a result, for EDL
e
Fig. 1. Schematic presentation of the electrical double layer for the caa charged macroporous bead in electrolyte solution.
in the case of porous surface, the counterions in the comlayer can not only displace in parallel with the surface,also displace perpendicularly through the surface as shin Fig. 1, when in an electric field.
3. Experimental
3.1. Materials and preparations
3.1.1. Dried beads in Cl− formThe D354 anion-exchange beads used in our work w
commercially available from ZhengGuang Resin Ltd.Hangzhou, China. The bead contacted atert-ammoniumgroup with the macromolecule matrix of the phenylethylevinylidene polymer, which corresponds to Amberlite IRA-in the United States or WA-30 in Japan. The beads wfirst sieved to homogenize the size in a fraction betw0.28 and 0.45 mm in diameter. Then the sieved beadsallowed to equilibrate with a saturated NaCl electrolytelution for at least 24 h to transform all beads to the sasalt form (Cl− form). The equilibrated beads were subquently washed with distilled water several times untilconductivities of the supernatants were reduced to theues of distilled water. Finally, the sediments of the bewere collected to dry in a vacuum dryer for about 8 h.
3.1.2. Preparation of resin beadsIn order to probe the dependence of dielectric behavio
electrolyte solution concentration, KCl and NaF electrolsolutions with different concentration were accurately confected. Then copies of dried beads of equal weight wimmersed in flasks with different solutions, all 24 h befodielectric measurement, and the pH values were all kep7.3 ± 0.1. Before the dielectric measurements, we charthe dielectric cell with a slurry of beads until the electrod

88 Z. Chen, K.-S. Zhao / Journal of Colloid and Interface Science 276 (2004) 85–91
eter
aseou
ame-ex-glent
trannm
HPfre-y aon-
beeand
d to-
per-
he
they
be
Table 1Phase parameters calculated by Hanai’s method from dielectric paramlisted inTable 2
Concentration(mM)
κa
(mS/cm)φ εi κi
(mS/cm)
0.2 0.550 0.51 34 8.020.4 0.820 0.53 34 8.100.6 1.03 0.52 34 8.120.8 1.24 0.54 35 7.981.0 1.53 0.50 34 8.042.0 2.01 0.53 35 7.92
Notes. εi , κi : permittivity and conductivity of the dispersed beads.κa : con-ductivity of the supernatant of the suspension.φ: volume fraction of thebeads, obtained by experiment measurement
were totally submerged in the slurry. The slurry in fact wdensely packed sediments of the resin beads in the aquphase.
3.2. Volume fraction measurement
The method of determining the volume fractionφ of theD354 resin beads relative to the bed was essentially the sas employed by Ishikawa et al.[13]. The large tracer molecule available from Pharmacia Fine Chemicals is Blue Dtran 2000 (mol. wt. 2× 10⁶) and is incapable of enterinthe beads, so its inaccessible volume is roughly equivato the total bead volume. The concentration of Blue Dexwas determined by optical density measurement at 632The volume fraction data are listed inTable 1.
3.3. Dielectric measurement
Dielectric measurements were carried out with an4192A LF impedance analyzer from Hewlett Packard atquency ranging between 5 Hz and 13 MHz, controlled bpersonal computer. The dielectric cell used in our study csists of concentrically cylindrical platinum electrodes[22],and the cell constant and stray capacitance that havedetermined by use of several standard liquids were 0.251.26 pF, respectively. Data obtained were all subjectecertain corrections[23] for errors arising from residual inductance due to the cell assembly.
4. Results and discussion
4.1. Dielectric relaxation spectroscopy (DRS)
Fig. 2shows the frequency dependence of the relativemittivity ε and the conductivityκ for beds of D354 beadsdispersed in KCl solutions with different concentrations. Tcomplex plane plots with the same data are shown inFig. 3,which gives us a series of concentric arcs, denoting thatare non-single-mechanism relaxations[22], due mainly tothe asymmetric distribution of the beads’ size. As can
s
s
.
n
(a)
(b)
Fig. 2. Frequency dependence of relative permittivityε (a) and electric con-ductivity κ (b) for suspensions of D354 beads dispersed in KCl solutionswith different concentrations.
Fig. 3. Complex plane plots of complex relative permittivity for suspensionsof D354 beads dispersed in KCl solutionswith different concentrations.

Z. Chen, K.-S. Zhao / Journal of Colloid and Interface Science 276 (2004) 85–91 89
ds of
.
e-
sed
esu-
ismc-tion
r-o-
ture,
o-ofundbut
hen-d bara
sted
theome-encyvityd
d,ent
ricaln.retical
ndbut
op-i-
e
ant,
and
hich
t
den-ss,te-
ace
Table 2Dielectric parameters estimated by fitting the experimental data for beD354 beads dispersed in KCl solutionswith different concentrations
Concentration(mM)
εl εh �ε κl
(mS/cm)κh
(mS/cm)�κ
(mS/cm)τ
(ns)
0.2 190 53 137 2.31 5.39 3.08 4720.4 143 52 91 2.95 5.46 2.51 3660.6 126 52 74 3.32 5.60 2.28 3310.8 113 52 61 3.64 5.64 2.00 3021.0 99.0 52 47 3.95 5.60 1.65 2892.0 77.4 51 26 5.22 6.55 1.33 244
Notes. εl , εh : limiting relative permittivity at low and high frequency�ε (= εl − εh): dielectric increment.κl , κh: limiting electrical conduc-tivity at low and high frequency.�κ (= κh − κl): conductivity increment.τ : relaxation time.
seen, distinct dielectric relaxations were observed at a frquency around 106 Hz.
Low-frequency dielectric relaxation has been discustheoretically earlier by Einolf and Carstensen[24], Schwarz[25], and Schurr[26], among others, who believed it arisfrom the tangential flow of counterions in the diffuse doble layer, and later by Dukhin and Shilov[1] and Delaceyand White[27], among others, who ascribed its mechanto the tangential diffusive motion of ions in the bulk eletrolyte around the particle, but considered that the relaxafrequency is congruously given by
(16)f0 = ukT
πR2e,
whereR, e, u, k, andT are the radii of the dispersed paticles, the electric charge of the counterions, the ionic mbility, the Boltzmann constant, and the absolute temperarespectively. Accordingly, the low relaxation frequencyf0 isestimated to be 7–30 mHz, using the value of the ionic mbility of chlorine ions in aqueous solutions and the radiibeads in our case. Therefore, the dielectric relaxations foin our case were not low-frequency dielectric relaxationtypical M–W dielectric relaxation.
Dielectric parameters were accurately obtained througfitting the DRS through the Cole–Cole equation in a geral way, and then the phase parameters were calculateHanai’s method. The dielectric parameters and phase pmeters (including the measured volume fractions) are liin Tables 2 and 1, respectively.
To validate these calculated phase parameters, theretical relaxation curves calculated from the phase paraters were compared with the observed ones. The frequdependence of the relative permittivity and the conductiobserved and calculated for the bed of D354 beads dispersein 0.2 mM KCl electrolyte solution are shown inFig. 4.
As can be seen inFig. 4, the theoretical curves are in gooagreement with the observed data over the entire relaxationindicating that the Hanai method is suitable for the prescase and the phase parameters are reasonable.
y-
-
Fig. 4. Frequency dependency of the relative permittivity and the electconductivity of D354 beads dispersed in 0.2 mM KCl electrolyte solutioThe symbols are the measured values and the curves are the theovalues calculated from Hanai’s equations.
4.2. Properties of the resin beads
Because of their macroporous configuration, D354 beadsare penetrable for small ions, so interfacial equilibrium acounterion association occurs not only on the surfacealso on the wall of the interstice within the beads (seeFig. 1).According to the present understanding of interfacial prerties, the interfacial equilibrium and the counterion assocation process for the beads can be expressed as
(17a)≡CH2N(CH3)2 + H+ → ≡[CH2NH(CH3)2
]+,
(17b)KP = exp(−Fφ0/RT )Γ (≡[CH2NH(CH3)2]+)
a(H+)Γ (≡CH2N(CH3)2),
≡[CH2NH(CH3)2
]+ + Cl−
(18a)→ ≡[CH2NH(CH3)2
]+·Cl−,
(18b)
KA = exp(−Fφβ/RT )
× Γ (≡[CH2NH(CH3)2]+·Cl−)
a(Cl−)Γ (≡[CH2NH(CH3)2]+),
where≡CH2N(CH3)2 is the fixed functional group of D354bead, and Cl− is the counterion around it,Γ denotes surfacconcentrations of respective species,a, F , R, andT are theactivity, the Faraday constant, the gas equilibrium constand the absolute temperature, respectively,φ0, φβ are theelectrostatic potential of the surface and compact layer,KP, KA are thermodynamic equilibrium constants.Equa-tion (17)represents the charge-acquisition process, in wthe potential-determining ion (pdi) is H+. Because the pHvalues in all beds are equal and the equilibrium constanKPis invariable at a given temperature, the surface potentialφ0remains equal for all beds; so does the surface chargesity.Equation (18)shows the counterion association procewhich is mainly decided by the concentration of the counrion in the bulk solution when the surface potential or surfcharge density is determinate.

90 Z. Chen, K.-S. Zhao / Journal of Colloid and Interface Science 276 (2004) 85–91
tra--so-esins arerep-i-ht ofnge
a geive
ultoleso-
y
. Weess:fixedon-e
n-ions
spe
the
t ofctingn-lly, andepte-rednotthaore
hereld
thewith
tolate
ac-byes-asede-aser aitheri-ted-
in-tstionlec-l
n of-
errface.e riseewerse-atg to
e-tion.ax-
lly
a-fnc-
ries-tra-
relec-factl di-, on
From Table 1we can see that as the solution concention increases all the values ofεi , φ, andκi remain nearly unchanged. Considering the tiny variation of the electrolytelution concentrations and the rather big diameter of the rbeads, it is reasonable to believe that the volume fractionindependent of the solution concentration (the small discancies among the values ofφ mainly arise from the expermental error). The values ofεi lie around 34, which is mucbigger than the values of gel matrix but smaller than thawater, are reasonable in view of the fact that ion-exchabeads are generally considered to be a combination ofmatrix and an interstitial electrolyte solution. The relatpermittivity εi , therefore, can be simply expressed[14] byεi = fwεw + (1 − fw)εp, wherefw is the volume fractionof water in the frame of the ion-exchange bead, andεp, εware the permittivity of the gel matrix and water. This resshows that the volume fraction of the gel matrix to the whresin beads is unchanged with the tiny variation of thelution concentration. While it isnoticeable that, differentlfrom other researchers’ results[13], the conductivity of thebeads is also independent of the solution concentrationthink this is a result of the counterion association procsince the association between the counterion and thegroup is analogous to weak ion-pair formation, as demstrated inEq. (18), it will not change observably when thconcentration varies lightlyas all weak electrolytes do. Cosequently the conductivities of beads dispersed in solutwith different concentrations are nearly unchanged.
4.3. Interpretation of dielectric parameters
Differing from phase parameters, dielectric parameterreflect the properties of the whole systems exposed in ariodical external electric field. Considering that the M–Wdielectric relaxation is sensitive to the polarization of theEDL, we discuss the dielectric behavior by the use ofproperties of the EDL here. FromTable 1, we find that theconductivity of dispersed beads is much bigger than thathe bulk solution, which means that the beads are conduparticles mainly because of the porous configuration. Whein an added electric field, the field lines, accordingly, are locally perpendicular to the bead surfaces rather than locatangential to the surface as in the dielectric particle caseions will be forced toward the surface instead of being swacross the surface[2]. Therefore, the tangential displacment of counterions in the EDL is neglectable compawith the perpendicular displacement in the present case,ing that the beads are of macroporous configuration, andthe counterions in the Stern layer are consequently mlikely displacing perpendicularly through the beads ratthan displacing in parallel with the surface, when the filines are locally perpendicular (seeFig. 1). In the presenceof an external ac field, and when the frequency is low,counterions in the diffuse layer can displace in phasethe applied ac field, so time is sufficient for counterionsdisplace from one plane to the other and then accumu
l
-
-t
there (considering that the EDL acts like a parallel capitor when the bead’s radius is far bigger than the DelengthλD). As a result, the permittivity of the whole sytem will increase because of the accumulated charges bon the Maxwell’s interfacial polarization concept. When thfrequency is higher than the relaxation frequency, counterions in the diffuse layer can no longer displace in phwith the applied ac field. They will just keep oscillating fovery short distance but cannot reach or accumulate on eplane. Then dielectric relaxation occurs, accompanied by dminishing permittivity due to the decrease of accumulacharge, and increasing conductivity due to the additional oscillation of the counterions.
From Table 2 we can see that both the dielectriccrements�ε (= εl − εh) and the conductivity incremen�κ (= κh − κl) gradually decrease as the concentraof the solution increases. We believe such special dietric behavior is predicted by the concentration of the C−ions in the diffuse layer. According toEq. (18), whenequilibrium is established, since both the concentratiofixed charge≡[CH2NH(CH3)2]+ and the equilibrium constant remain unchanged, as the concentration of Cl− in-creases, the concentration of≡[CH2NH(CH3)2]+·Cl− in-creases and the association degree between Cl− and fixedcharge≡[CH2NH(CH3)2]+ increases too, resulting in fewfixed surface charges remaining unassociated on the suThe fewer unassociated charges on the surface then givto fewer surplus charges in the compact layer, and then fCl− ions will be attracted into the diffuse layer. As a conquence, fewer Cl− ions will accumulate on either planelower frequency and oscillate at higher frequency, leadinboth a smaller dielectric increment�ε and a conductivityincrement�κ as the solution concentration increases.
Relaxation timeτ is another important dielectric paramter, which represents the time to establish the polarizaFor suspensions with dielectric particles, the M–W relation time is of order ofDλ2
D [2,6], whereD is typical iondiffusivity, andλD is the Debye length, which is generagiven by the equation[28]
(19)λD =(
εrε0kT
2nq2
)1/2
,
wheren is the free charge carrier concentration in a mterial of permittivity εr , and q is the electric charge othe free charge. The Debye length thereby is only a fution of n considering that the permittivityεr remains nearlyunchanged when the concentration of the solution valightly. Accordingly, the relaxation time for dielectric particles is inversely proportional to the electrolyte concention. However, although the relaxation time list inTable 2decreases as the electrolyte concentration increases, they aapparently far beyond being inversely proportional to etrolyte concentrations. This result seems to confirm thethat the beads are conducting particles but not typicaelectric ones. For suspensions with conducting particles

Z. Chen, K.-S. Zhao / Journal of Colloid and Interface Science 276 (2004) 85–91 91
lcip-
-s;for
uson-
ent
KCl
-tesuded
im-ce-r
lec-inctlyteara-iatedon,areon-dyer
u-ng
odsedcialtricedforde-s in
ralully
yer.
d.,
ids
ress,
2)
1)
8.ker,
,
(70)
-
.
7)
-
Fig. 5. Relaxation timeτ for suspensions of D354 beads dispersed in KCand NaF solutions with different concentrations as a function of the rerocal of the square root of the bulk solution concentration, 1/n1/2.
the other hand, O’Brien[2] proposed that the M–W relaxation time isa/λD times longer than for dielectric particleherea is the radii of the particles, so the relaxation timeconducting particles is on the order ofDaλD, where the re-laxation time is proportional to the Debye length, and thproportional to the reciprocal of the square root of the ccentration (1/n1/2). Plotting the relaxation timeτ for bedsof beads dispersed in KCl and NaF solutions with differsolution concentration as a function of 1/n1/2 (the data ofthe NaF group were obtained in the same way as for thegroup), we gotFig. 5.
It is noteworthy in Fig. 5 that the relaxation time isperfectly linear with 1/n1/2 for both groups, which is exactly consistent with O’Brien’s conclusion, and indicathat the beads are conducting particles, as we conclfrom the calculated phase parameters. This result alsoplied that, for conducting particles, perpendicular displament of counterions in the diffuse layer mainly accounts fothe dielectric behavior of the whole suspension.
5. Conclusion
For beds of D354 anion-exchange beads dispersed in etrolyte solutions, the dielectric parameters showed distdependencies on the concentration of the bulk electrosolution. It is concluded from the analysis of the phase pmeters that counterions in the compact layer are assocwith the fixed surface groups in the form of complexatianalogous to weak ion-pair formation, and the beadsconducting particles in this case. The analysis on the ccentration dependence of the dielectric parameters indicatethat, the concentration of counterions in the diffuse lapredicts the permittivity increment�ε and conductivity in-crement�κ , and that the relaxation timeτ is proportionalto the Debye length, which is in line with O’Brien’s conclsion about M–W dielectric relaxation time for conducti
particles. The whole work proves that the Hanai methis a practical tool for obtaining the properties of disperparticles through observed dielectric parameters, interfaproperties play an observable role on the M–W dielecrelaxation, and the dielectric relaxation spectroscopy bason the M–W mechanism was in turn proved effectiveresearch on solid/liquid interface equilibrium and henceserves further applications in more analogous systembiology, medicine, technology, etc.
Acknowledgment
Financial support of this work by the National NatuScience Foundation of China (No. 20273010) is gratefacknowledged.
References
[1] S.S. Dukhin, V.N. Shilov, Dielectric Phenomena and the Double Lain Disperse Systems and Polyelectrolytes, Wiley, New York, 1974
[2] R.W. O’Brien, J. Colloid Interface Sci. 113 (1986) 81.[3] J.C. Maxwell, A Treatise on Electricity and Magnetism, third e
Clarendon, Oxford, 1891.[4] K.W. Wagner, Arch. Electrotechnol. 2 (1914) 371.[5] C.T. O’Konski, J. Chem. Phys. 64 (1960) 605.[6] V.N. Shilov, A.V. Delgado, F. Gonzalez-Caballero, C. Grosse, Collo
Surf. A 192 (2001) 253.[7] C. Grosse, J. Phys. Chem. 92 (1988) 3905.[8] T. Hanai, Kolloid Z. 171 (1960) 23.[9] T. Hanai, Kolloid Z. 175 (1961) 61.
[10] T. Hanai, in: P. Sherman (Ed.), Emulsion Science, Academic PLondon/New York, 1968.
[11] T. Hanai, A. Ishikawa, N. Koizumi, Bull. Inst. Chem. Res. KyotoUniv. 55 (1977) 376.
[12] T. Hanai, T. Imakita, N. Koizumi, Colloid Polym. Sci. 260 (1981029.
[13] A. Ishikawa, T. Hanai, N. Koizumi, Jpn. J. Appl. Phys. 20 (19879.
[14] K.S. Zhao, K. Asami, J.P. Lei, Colloid Polym. Sci. 280 (2002) 103[15] N. Kallay, Interfacial Dynamics, in: Surfactant Science Series, Dek
New York, 1999.[16] D.A. Dzombak, M.M. Morel, Surface Complexation Modelling
Wiley–Interscience, New York, 1990.[17] D.E. Yates, S. Levine, T.W. Healy, J. Chem. Soc. Faraday Trans. 1
(1974) 1807.[18] N. Kallay, S. Zalac, J. Colloid Interface Sci. 230 (2000) 1.[19] G.J. Gouy, Phys. Radium 9 (1910) 457.[20] D.L. Chapman, Philos. Mag. 25 (1913) 457.[21] H. Hohl, W. Stumm, J. Colloid Interface Sci. 55 (1976) 281.[22] T. Hanai, H.Z. Zhang, K. Sekine, K. Asaka, K. Asami, Ferro
electrics 86 (1988) 191.[23] K. Asami, A. Irimajiri, T. Hanai, N. Koizumi, Bull. Ins. Chem. Res
Kyoto Univ. 51 (1973) 231.[24] C.W. Einolf, E.L. Carstensen Jr., J. Phys. Chem. 75 (1971) 1091.[25] G. Schwarz, J. Phys. Chem. 66 (1962) 2636.[26] J.M. Schurr, J. Phys. Chem. 68 (1964) 2407.[27] E.H.B. Delacey, L.R. White, J. Chem. Soc. Faraday Trans. 2 (7
(1981) 2007.[28] R. Pething, Dielectric and Electronic Properties of Biological Materi
als, Wiley, New York, 1979.