Embed Size (px)
Citation preview

Motivation Sample and Systemic Risk Measures Methodology and Results Conclusions Appendix
Did the Basel Process of Capital RegulationEnhance the Resiliency of European Banks?
Thomas Gehrig, Maria Chiara Iannino
Workshop on Banking and Institutions, Bank of Finland
15 May 2017

Motivation Sample and Systemic Risk Measures Methodology and Results Conclusions Appendix
Outline
Motivation
Sample and Systemic Risk Measures
Methodology and Results
Conclusions
Appendix
Motivation Sample and Systemic Risk Measures Methodology and Results Conclusions Appendix
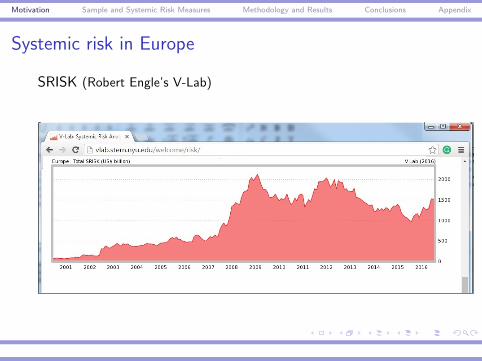
Systemic risk in Europe
SRISK (Robert Engle’s V-Lab)

Motivation Sample and Systemic Risk Measures Methodology and Results Conclusions Appendix
Basel process - Objects
Basel Committee of Banking Supervision, 1988:
I Increase safety and soundness of global banking systemI recommendations of minimum standards for capitalization and
risk management
I Maintain level playing-field for international banksI Attempt to harmonize accounting standards

Motivation Sample and Systemic Risk Measures Methodology and Results Conclusions Appendix
Basel process - open questions
I Evidence-based policy evaluation: Did the process achievethe intended goals? (Hellwig 1996, Wagster 1996)
I Structural analysis: Which policies did contribute toincrease/reduce the resiliency? (Hellwig 2010, Eberlein et al.1998, Danielson et al. 2001)
I Market failure: Which is the underlying market failure thatrequires correction? (Goodhart 2011)
I Self regulation versus statutory regulation: Role of internalmodels? (Behn et al. 2014, Acharya et al. 2014)

Motivation Sample and Systemic Risk Measures Methodology and Results Conclusions Appendix
Motivation
We analyse the evolution of resiliency of the European bankingsector after the implementation of the Basel Capital Accord.
→ We trace both systemic risk (SRISK and CoVaR) andsystematic risk measures (beta and CAPM cost of equity),
→ back to late 1980’s,
→ Has the process of capital regulation increased the resilience ofEuropean Banks?→ What are the main drivers of the evolution of systemic risk?

Motivation Sample and Systemic Risk Measures Methodology and Results Conclusions Appendix
The Basel Process of Capital RegulationThe process was initiated in late 1974:
I Basel I: The first Basel Capital Accord, July 1988→ risk-based capital requirements with fixed risk-weights
I Market Risk Amendment: January 1996→ self-regulatory option to use internal models for market risk
I Basel II: Revised Framework of the Basel Accord, June 2006→ standard approach vs. internal ratings-based credit risk models
I Basel III: Principles for Sound Liquidity Risk Management andSupervision, September 2008→ triggering the ongoing process after the Great Financial Crisis
→ Santiago summit (Nov. 2016): role of internal models

Motivation Sample and Systemic Risk Measures Methodology and Results Conclusions Appendix
Outline
Motivation
Sample and Systemic Risk Measures
Methodology and Results
Conclusions
Appendix
Motivation Sample and Systemic Risk Measures Methodology and Results Conclusions Appendix
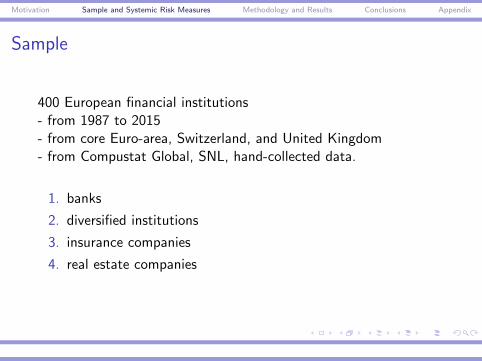
Sample
400 European financial institutions- from 1987 to 2015- from core Euro-area, Switzerland, and United Kingdom- from Compustat Global, SNL, hand-collected data.
1. banks
2. diversified institutions
3. insurance companies
4. real estate companies

Motivation Sample and Systemic Risk Measures Methodology and Results Conclusions Appendix
Empirical analysis
1. We estimate systemic risk: SRISK (Brownless and Engel, RFS2017) and Delta CoVaR (Adrian and Brunnermeier, AER2016))
2. We explain SRISK with weekly market data or quarterlybank/country data.
3. We test the impact of the Basel process with two sets ofdummies:
I time dummies: market risk internal models (Jan 1996), BaselII (June 2006), Basel III guidelines (Sept 2008).
I bank-level dummies: use of credit risk internal models
Motivation Sample and Systemic Risk Measures Methodology and Results Conclusions Appendix
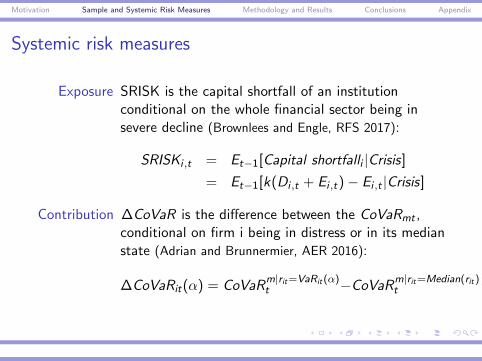
Systemic risk measures
Exposure SRISK is the capital shortfall of an institutionconditional on the whole financial sector being insevere decline (Brownlees and Engle, RFS 2017):
SRISKi ,t = Et−1[Capital shortfalli |Crisis]
= Et−1[k(Di ,t + Ei ,t)− Ei ,t |Crisis]
Contribution ∆CoVaR is the difference between the CoVaRmt ,conditional on firm i being in distress or in its medianstate (Adrian and Brunnermier, AER 2016):
∆CoVaRit(α) = CoVaRm|rit=VaRit(α)t −CoVaR
m|rit=Median(rit)t
Motivation Sample and Systemic Risk Measures Methodology and Results Conclusions Appendix
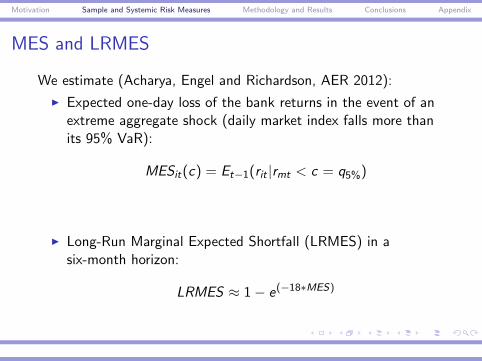
MES and LRMES
We estimate (Acharya, Engel and Richardson, AER 2012):
I Expected one-day loss of the bank returns in the event of anextreme aggregate shock (daily market index falls more thanits 95% VaR):
MESit(c) = Et−1(rit |rmt < c = q5%)
I Long-Run Marginal Expected Shortfall (LRMES) in asix-month horizon:
LRMES ≈ 1− e(−18∗MES)
Motivation Sample and Systemic Risk Measures Methodology and Results Conclusions Appendix
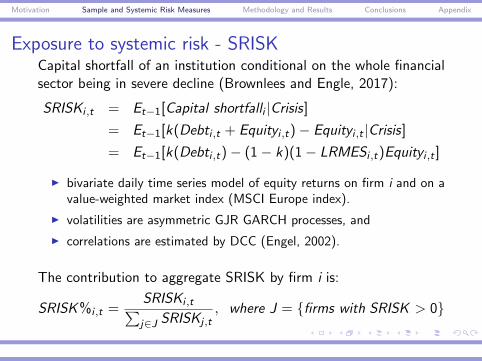
Exposure to systemic risk - SRISKCapital shortfall of an institution conditional on the whole financialsector being in severe decline (Brownlees and Engle, 2017):
SRISKi ,t = Et−1[Capital shortfalli |Crisis]
= Et−1[k(Debti ,t + Equityi ,t)− Equityi ,t |Crisis]
= Et−1[k(Debti ,t)− (1− k)(1− LRMESi ,t)Equityi ,t ]
I bivariate daily time series model of equity returns on firm i and on avalue-weighted market index (MSCI Europe index).
I volatilities are asymmetric GJR GARCH processes, and
I correlations are estimated by DCC (Engel, 2002).
The contribution to aggregate SRISK by firm i is:
SRISK %i ,t =SRISKi ,t∑j∈J SRISKj ,t
, where J = {firms with SRISK > 0}

Motivation Sample and Systemic Risk Measures Methodology and Results Conclusions Appendix
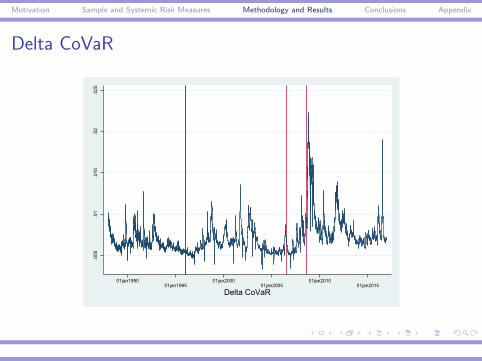
Contribution to systemic risk - Delta CoVaRCoVaR focuses on tail-dependency between the whole sector andone institution i (Adrian and Brunnermier, 2011).
I maximum loss of the market return within the α%-confidenceinterval, conditionally on an event C (rit):
Pr(rmt ≤ CoVaRmt |C (rit) = α
I distress event on firm i is a loss equal to its (1− α)% VaR:
rit = VaRit(α)
∆CoVaR is the difference between the CoVaRmt , conditional onfirm i being in distress or in its median state:
∆CoVaRit(α) = CoVaRm|rit=VaRit(α)t − CoVaR
m|rit=Median(rit)t
Motivation Sample and Systemic Risk Measures Methodology and Results Conclusions Appendix
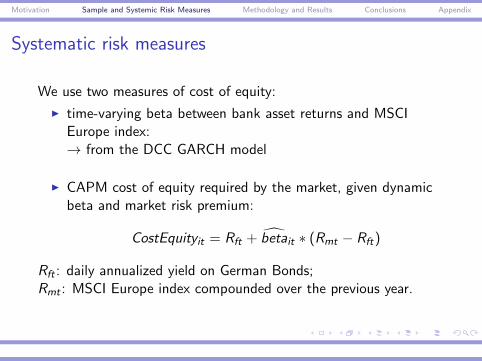
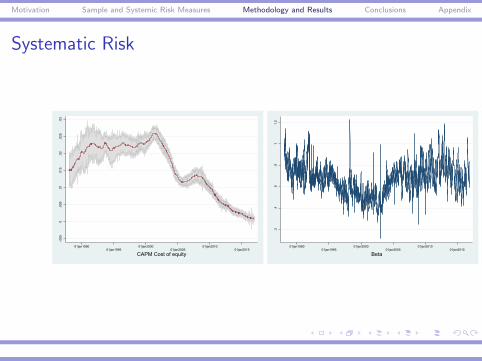
Systematic risk measures
We use two measures of cost of equity:
I time-varying beta between bank asset returns and MSCIEurope index:→ from the DCC GARCH model
I CAPM cost of equity required by the market, given dynamicbeta and market risk premium:
CostEquityit = Rft + betait ∗ (Rmt − Rft)
Rft : daily annualized yield on German Bonds;Rmt : MSCI Europe index compounded over the previous year.
Motivation Sample and Systemic Risk Measures Methodology and Results Conclusions Appendix
Outline of the empirical analysis
1. a baseline regressions of SRISK with quarterly data on theoverall sample, both as panel fixed effects and quantilesregressions.
2. long-run relationship between average SRISK and marketcapitalization, Z-score of default and interest rate, with aVECM on weekly averages.
3. in a subsample of banks where microdata on theimplementation on credit risk models is available, we applyboth panel fixed effects and quantile regressions
4. a counterfactual analysis to compare the observed SRISK onthe systemic risk that would have been realized without Baselregulation.
5. (many robustness checks).
Motivation Sample and Systemic Risk Measures Methodology and Results Conclusions Appendix
Outline
Motivation
Sample and Systemic Risk Measures
Methodology and Results
Conclusions
Appendix
Motivation Sample and Systemic Risk Measures Methodology and Results Conclusions Appendix
Systematic Risk-.0
050
.005
.01
.015
.02
.025
.03
01jan199001jan1995
01jan200001jan2005
01jan201001jan2015
CAPM Cost of equity
.2.4
.6.8
11.
2
01jan199001jan1995
01jan200001jan2005
01jan201001jan2015
Beta
Motivation Sample and Systemic Risk Measures Methodology and Results Conclusions Appendix
Delta CoVaR
.005
.01
.015
.02
.025
01jan199001jan1995
01jan200001jan2005
01jan201001jan2015
Delta CoVaR
Motivation Sample and Systemic Risk Measures Methodology and Results Conclusions Appendix
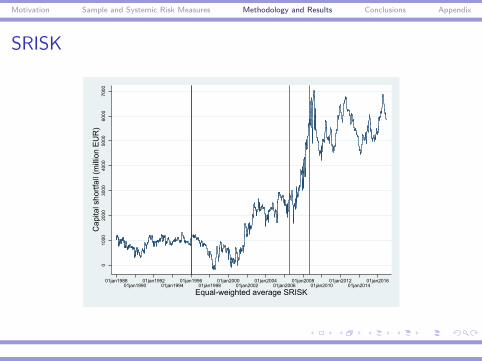
SRISK
010
0020
0030
0040
0050
0060
0070
00C
apita
l sho
rtfal
l (m
illio
n E
UR
)
01jan198801jan1990
01jan199201jan1994
01jan199601jan1998
01jan200001jan2002
01jan200401jan2006
01jan200801jan2010
01jan201201jan2014
01jan2016
Equal-weighted average SRISK
Motivation Sample and Systemic Risk Measures Methodology and Results Conclusions Appendix
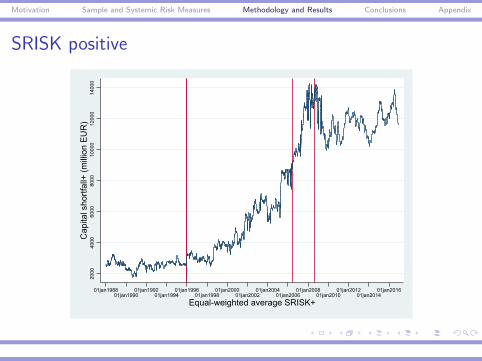
SRISK positive
2000
4000
6000
8000
1000
012
000
1400
0C
apita
l sho
rtfal
l+ (m
illio
n E
UR
)
01jan198801jan1990
01jan199201jan1994
01jan199601jan1998
01jan200001jan2002
01jan200401jan2006
01jan200801jan2010
01jan201201jan2014
01jan2016
Equal-weighted average SRISK+

Motivation Sample and Systemic Risk Measures Methodology and Results Conclusions Appendix
SRISK% quantiles
010
000
2000
030
000
4000
050
000
6000
0C
apita
l sho
rtfal
l (m
illio
n E
UR
)
01jan198801jan1990
01jan199201jan1994
01jan199601jan1998
01jan200001jan2002
01jan200401jan2006
01jan200801jan2010
01jan201201jan2014
01jan2016
Average SRISK by SRISK% quantiles
low 2 3 4 high

Motivation Sample and Systemic Risk Measures Methodology and Results Conclusions Appendix
SRISK under ECB supervision
050
0010
000
1500
020
000
2500
030
000
Cap
ital S
hortf
all (
mill
ion
EU
R)
01jan198801jan1990
01jan199201jan1994
01jan199601jan1998
01jan200001jan2002
01jan200401jan2006
01jan200801jan2010
01jan201201jan2014
01jan2016
SRISK by ECB supervision
non-ECB ECB
Motivation Sample and Systemic Risk Measures Methodology and Results Conclusions Appendix
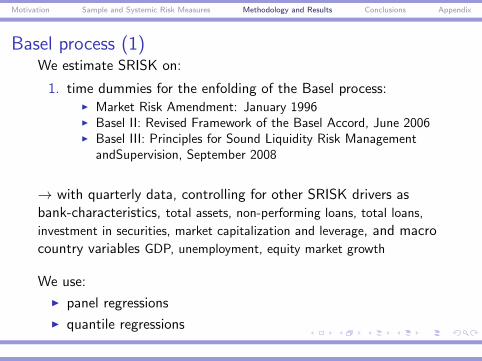
Basel process (1)We estimate SRISK on:
1. time dummies for the enfolding of the Basel process:I Market Risk Amendment: January 1996I Basel II: Revised Framework of the Basel Accord, June 2006I Basel III: Principles for Sound Liquidity Risk Management
andSupervision, September 2008
→ with quarterly data, controlling for other SRISK drivers asbank-characteristics, total assets, non-performing loans, total loans,
investment in securities, market capitalization and leverage, and macrocountry variables GDP, unemployment, equity market growth
We use:
I panel regressions
I quantile regressions
Motivation Sample and Systemic Risk Measures Methodology and Results Conclusions Appendix
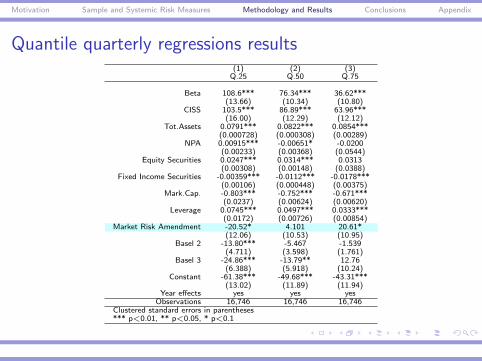
Quantile quarterly regressions results(1) (2) (3)
Q.25 Q.50 Q.75
Beta 108.6*** 76.34*** 36.62***(13.66) (10.34) (10.80)
CISS 103.5*** 86.89*** 63.96***(16.00) (12.29) (12.12)
Tot.Assets 0.0791*** 0.0822*** 0.0854***(0.000728) (0.000308) (0.00289)
NPA 0.00915*** -0.00651* -0.0200(0.00233) (0.00368) (0.0544)
Equity Securities 0.0247*** 0.0314*** 0.0313(0.00308) (0.00148) (0.0388)
Fixed Income Securities -0.00359*** -0.0112*** -0.0178***(0.00106) (0.000448) (0.00375)
Mark.Cap. -0.803*** -0.752*** -0.671***(0.0237) (0.00624) (0.00620)
Leverage 0.0745*** 0.0497*** 0.0333***(0.0172) (0.00726) (0.00854)
Market Risk Amendment -20.52* 4.101 20.61*(12.06) (10.53) (10.95)
Basel 2 -13.80*** -5.467 -1.539(4.711) (3.598) (1.761)
Basel 3 -24.86*** -13.79** 12.76(6.388) (5.918) (10.24)
Constant -61.38*** -49.68*** -43.31***(13.02) (11.89) (11.94)
Year effects yes yes yesObservations 16,746 16,746 16,746
Clustered standard errors in parentheses*** p<0.01, ** p<0.05, * p<0.1
Motivation Sample and Systemic Risk Measures Methodology and Results Conclusions Appendix
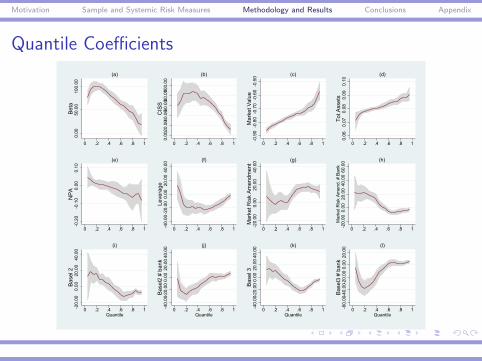
Quantile Coefficients
0.00
50.0
010
0.00
Bet
a
0 .2 .4 .6 .8 1
(a)
0.00
20.0
040.
0060
.008
0.001
00.0
0C
ISS
0 .2 .4 .6 .8 1
(b)
-0.9
0-0
.80
-0.7
0-0
.60
-0.5
0M
arke
t Val
ue
0 .2 .4 .6 .8 1
(c)
0.06
0.07
0.08
0.09
0.10
Tot.A
sset
s
0 .2 .4 .6 .8 1
(d)-0
.20
-0.1
00.
000.
10N
PA
0 .2 .4 .6 .8 1
(e)-4
0.00
-20.
000.
0020
.00
40.0
0Le
vera
ge
0 .2 .4 .6 .8 1
(f)
-20.
000.
0020
.00
40.0
0M
arke
t Ris
k A
men
dmen
t
0 .2 .4 .6 .8 1
(g)
-20.
000.
0020
.00
40.0
060
.00
Mar
ket R
isk
Am
end.
# B
ank
0 .2 .4 .6 .8 1
(h)
-20.
000.
0020
.00
40.0
0B
asel
2
0 .2 .4 .6 .8 1Quantile
(i)
-40.
00-2
0.00
0.00
20.0
040
.00
Bas
el2
# ba
nk
0 .2 .4 .6 .8 1Quantile
(j)-4
0.00
-20.
000.
0020
.00
40.0
0B
asel
3
0 .2 .4 .6 .8 1Quantile
(k)
-60.
00-4
0.00
-20.
000.
0020
.00
Bas
el3
# ba
nk
0 .2 .4 .6 .8 1Quantile
(l)

Motivation Sample and Systemic Risk Measures Methodology and Results Conclusions Appendix
Basel process (2)
We estimate SRISK on:
2. a subsample of 100 banks, and we use bank-level quarterlyinformation on the implementation of IRBA models for creditrisk, after Basel II (2006):
1. Standardised2. Foundation3. Mixed4. Advanced approach
→ we regress residuals of an AR(2) model of weekly SRISK→ we control for other drivers, as market-characteristics: market
stress (CISS), market return, EU policy rate, market capitalization,
book-to-market.

Motivation Sample and Systemic Risk Measures Methodology and Results Conclusions Appendix
SRISK by IRBA models
050
0010
000
1500
020
000
2500
030
000
3500
0C
apita
l Sho
rtfal
l (m
illio
n E
UR
)
01jan198801jan1990
01jan199201jan1994
01jan199601jan1998
01jan200001jan2002
01jan200401jan2006
01jan200801jan2010
01jan201201jan2014
01jan2016
Average SRISK by IRBA
before Basel 2 StandardizedFoundation Mixed or Advanced

Motivation Sample and Systemic Risk Measures Methodology and Results Conclusions Appendix
Panel weekly regression results: SRISK(1) (2) (3) (4) (5) (6)
Beta -186.0*** -186.2*** -118.1***(48.19) (48.94) (30.22)
Cost of Equity -135.0** -130.0** -125.8**(57.05) (56.39) (60.43)
CISS -2.253 -11.65 -9.949 -88.42** -95.69** -83.70**(33.06) (31.68) (31.41) (39.54) (38.92) (36.74)
Zscore -1.136 -1.118 -0.0187 -0.846 -0.838 0.0288(1.007) (0.962) (0.0326) (0.865) (0.775) (0.0257)
Market return -13,267*** -13,239*** -13,309*** -13,308*** -13,284*** -13,296***(3,448) (3,439) (3,460) (3,481) (3,474) (3,478)
Policy rate 822.1** 976.2** 1,170*** 1,765*** 1,915*** 1,656***(405.5) (427.9) (373.4) (486.2) (508.9) (428.7)
Market-to-Book 0.127*** 0.138*** 0.132*** 0.144*** 0.155*** 0.136***(0.0111) (0.0118) (0.0109) (0.0101) (0.0124) (0.0109)
MV 0.00248 0.00560*** 0.00505*** 0.00392* 0.00705*** 0.00384***(0.00192) (0.00203) (0.00137) (0.00208) (0.00202) (0.00116)
1.IRBA#MV -0.00129 0.00162 -0.00105 -0.000532(0.00488) (0.00430) (0.00333) (0.00299)
2.IRBA#MV 0.00931** 0.00976*** 0.00993** 0.00918***(0.00452) (0.00333) (0.00403) (0.00338)
3.IRBA#MV 0.00460** 0.00185 0.00463** 0.00300(0.00201) (0.00201) (0.00230) (0.00183)
4.IRBA#MV 0.00575 0.00510 0.00540 0.00448(0.00492) (0.00502) (0.00462) (0.00440)
1.IRBA -14.33 -8.897 -15.23 18.55* 24.11** 17.62*(14.82) (13.22) (14.25) (9.786) (10.40) (10.32)
2.IRBA -34.42 133.2** -51.28* -36.08 143.0** -6.346(64.84) (63.56) (26.77) (60.90) (68.46) (25.04)
3.IRBA 55.27 130.3** 71.72** 0.738 75.99* 26.48(34.27) (50.08) (31.64) (26.30) (41.90) (21.35)
4.IRBA -44.73 47.54 4.758 -26.97 58.47 8.108(67.85) (61.54) (38.76) (47.86) (50.03) (25.08)
Market Amend. 57.47** 35.95 22.09 42.52* 20.48 50.80***(26.43) (24.20) (15.89) (24.57) (21.46) (16.75)
Constant 5.667 -7.302 -45.73* -117.1*** -130.0*** -142.0***(32.52) (32.68) (26.46) (26.71) (29.03) (32.18)
Country Effects no no yes no no yes
R-squared 0.014 0.014 0.016 0.012 0.011 0.014Number of gvkey 95 95 95 95
Motivation Sample and Systemic Risk Measures Methodology and Results Conclusions Appendix
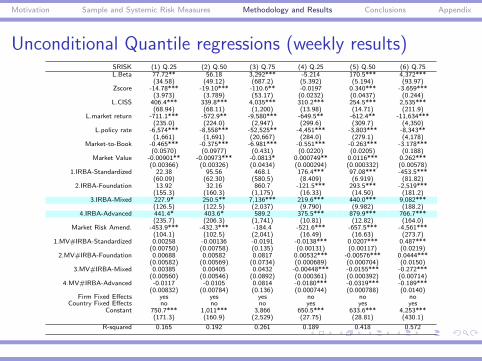
Unconditional Quantile regressions (weekly results)SRISK (1) Q.25 (2) Q.50 (3) Q.75 (4) Q.25 (5) Q.50 (6) Q.75L.Beta 77.72** 56.18 3,292*** -5.214 170.5*** 4,372***
(34.58) (49.12) (687.2) (5.392) (5.194) (93.97)Zscore -14.78*** -19.10*** -110.6** -0.0197 0.340*** -3.659***
(3.973) (3.789) (53.17) (0.0232) (0.0437) (0.244)L.CISS 406.4*** 339.8*** 4,035*** 310.2*** 254.5*** 2,535***
(68.94) (68.11) (1,200) (13.98) (14.71) (211.9)L.market return -711.1*** -572.9** -9,580*** -649.5** -612.4** -11,634***
(235.0) (224.0) (2,947) (299.6) (309.7) (4,350)L.policy rate -6,574*** -8,558*** -52,525** -4,451*** -3,803*** -8,343**
(1,661) (1,691) (20,667) (284.0) (279.1) (4,178)Market-to-Book -0.465*** -0.375*** -6.981*** -0.551*** -0.263*** -3.178***
(0.0570) (0.0977) (0.431) (0.0220) (0.0205) (0.188)Market Value -0.00901** -0.00973*** -0.0813* 0.000749** 0.0116*** 0.262***
(0.00366) (0.00326) (0.0434) (0.000294) (0.000332) (0.00578)1.IRBA-Standardized 22.38 95.56 468.1 176.4*** 97.08*** -453.5***
(60.09) (62.30) (580.5) (8.409) (6.919) (81.82)2.IRBA-Foundation 13.92 32.16 860.7 -121.5*** 293.5*** -2,519***
(155.3) (160.3) (1,175) (16.33) (14.50) (181.2)3.IRBA-Mixed 227.9* 250.5** 7,136*** 219.6*** 440.0*** 9,082***
(126.5) (122.5) (2,037) (9.790) (9.982) (188.2)4.IRBA-Advanced 441.4* 403.6* 589.2 375.5*** 879.9*** 766.7***
(235.7) (206.3) (1,741) (10.81) (12.82) (164.0)Market Risk Amend. -453.9*** -432.3*** -184.4 -521.6*** -657.5*** -4,561***
(104.1) (102.5) (2,041) (16.49) (16.63) (273.7)1.MV#IRBA-Standardized 0.00258 -0.00136 -0.0191 -0.0138*** 0.0207*** 0.487***
(0.00750) (0.00758) (0.135) (0.00131) (0.00117) (0.0219)2.MV#IRBA-Foundation 0.00688 0.00582 0.0817 0.00532*** -0.00576*** 0.0444***
(0.00582) (0.00569) (0.0734) (0.000689) (0.000704) (0.0150)3.MV#IRBA-Mixed 0.00385 0.00405 0.0432 -0.00448*** -0.0155*** -0.272***
(0.00560) (0.00546) (0.0892) (0.000361) (0.000392) (0.00714)4.MV#IRBA-Advanced -0.0117 -0.0105 0.0814 -0.0180*** -0.0319*** -0.189***
(0.00832) (0.00784) (0.136) (0.000744) (0.000788) (0.0140)Firm Fixed Effects yes yes yes no no no
Country Fixed Effects no no no yes yes yesConstant 750.7*** 1,011*** 3,866 650.5*** 633.6*** 4,253***
(171.3) (160.9) (2,529) (27.75) (28.81) (430.1)
R-squared 0.165 0.192 0.261 0.189 0.418 0.572
Motivation Sample and Systemic Risk Measures Methodology and Results Conclusions Appendix
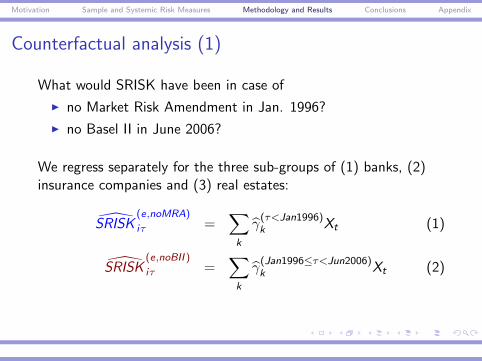
Counterfactual analysis (1)
What would SRISK have been in case of
I no Market Risk Amendment in Jan. 1996?
I no Basel II in June 2006?
We regress separately for the three sub-groups of (1) banks, (2)insurance companies and (3) real estates:
SRISK(e,noMRA)
iτ =∑k
γ(τ<Jan1996)k Xt (1)
SRISK(e,noBII )
iτ =∑k
γ(Jan1996≤τ<Jun2006)k Xt (2)
Motivation Sample and Systemic Risk Measures Methodology and Results Conclusions Appendix
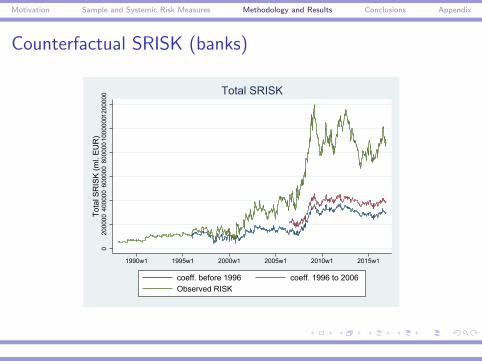
Counterfactual SRISK (banks)
020
0000
4000
0060
0000
8000
0010
0000
0120
0000
Tota
l SR
ISK
(ml.
EU
R)
1990w1 1995w1 2000w1 2005w1 2010w1 2015w1
coeff. before 1996 coeff. 1996 to 2006Observed RISK
Total SRISK
Motivation Sample and Systemic Risk Measures Methodology and Results Conclusions Appendix
Counterfactual SRISK
050
0000
1000
000
1500
000
Tota
l SR
ISK
(ml.
EU
R)
1990w1 1995w1 2000w1 2005w1 2010w1 2015w1
Sector 1
050
0000
1000
000
1500
000
Tota
l SR
ISK
(ml.
EU
R)
1990w1 1995w1 2000w1 2005w1 2010w1 2015w1
Sector 20
5000
0010
0000
015
0000
0To
tal S
RIS
K (m
l. E
UR
)
1990w1 1995w1 2000w1 2005w1 2010w1 2015w1
Sector 3
Total SRISK

Motivation Sample and Systemic Risk Measures Methodology and Results Conclusions Appendix
Counterfactual analysis (2)We implement a Difference-in-Differences analysis:
SRISK eit = σ0 + σ1IRBA + σ2Basel2 + σ3Basel2 ∗ IRBA + εit
I IRBA: dummy for advanced or mixed credit risk internalmodels,
I Basel2: time dummy June 2006,
σ3 = (SRISK IRBA,post−SRISK IRBA,pre)−(SRISK nonIRBA,post−SRISK nonIRBA,pre)
First, we run a probit regression: the probability of implementingIRBA models given market beta, Z-score, market capitalization,market-to-book ratio. A PS is then assign to balance treated andcomparison.

Motivation Sample and Systemic Risk Measures Methodology and Results Conclusions Appendix
Diff-in-Diffs results
Outcome var. SRISK t p-value
Baseline period:Control 5892.937Treated 5275.271
Diff (T-C) -617.666 -0.22 0.83
Follow-up period:Control 1684.41Treated 2.00E+04
Diff (T-C) 1.80E+04 3.3 0.002***
Diff-in-Diffs 1.90E+04 3.73 0.000***
Motivation Sample and Systemic Risk Measures Methodology and Results Conclusions Appendix
SRISK as a tool for supervision? - Deutsche Bank0
5000
010
0000
1500
0020
0000
Cap
ital s
hortf
all (
ml.
EU
R)
01jan200001jan2001
01jan200201jan2003
01jan200401jan2005
01jan200601jan2007
01jan200801jan2009
01jan201001jan2011
01jan201201jan2013
01jan201401jan2015
01jan2016
Equal-weighted average SRISK -Deutsche Bank AG
.2.4
.6.8
11.
21.
41.
61.
82
2.2
01jan200001jan2001
01jan200201jan2003
01jan200401jan2005
01jan200601jan2007
01jan200801jan2009
01jan201001jan2011
01jan201201jan2013
01jan201401jan2015
01jan2016
Market-to-Book -Deutsche Bank AG
Deutsche Bank AG
Motivation Sample and Systemic Risk Measures Methodology and Results Conclusions Appendix
SRISK as tool for supervision? - UBS0
5000
010
0000
Cap
ital s
hortf
all (
ml.
EU
R)
01jan200001jan2001
01jan200201jan2003
01jan200401jan2005
01jan200601jan2007
01jan200801jan2009
01jan201001jan2011
01jan201201jan2013
01jan201401jan2015
01jan2016
Equal-weighted average SRISK -UBS Group AG
.51
1.5
22.
53
3.5
44.
55
01jan200001jan2001
01jan200201jan2003
01jan200401jan2005
01jan200601jan2007
01jan200801jan2009
01jan201001jan2011
01jan201201jan2013
01jan201401jan2015
01jan2016
Market-to-Book -UBS Group AG
UBS Group AG
Motivation Sample and Systemic Risk Measures Methodology and Results Conclusions Appendix
Outline
Motivation
Sample and Systemic Risk Measures
Methodology and Results
Conclusions
Appendix
Motivation Sample and Systemic Risk Measures Methodology and Results Conclusions Appendix
Conclusions: A summary of the Main Results
I Though we observe a decrease in funding costs for Europeaninstitutions, exposure to systemic risk has heightened after theimplementation of Basel Accord.
I Basel process has succeeded in containing systemic risk ofsmaller banks, but it has been less successful for the largerinstitutions.
I Larger institutions could opportunistically exploit the option ofself-regulation by employing internal models, but reducingsystem stability.
Motivation Sample and Systemic Risk Measures Methodology and Results Conclusions Appendix
Conclusions: Unintended consequences
I on stability of the global system: while providing increasing
incentives for prudent in-house risk management over time, we
observe a serious decline in resiliency
I on competition: Basel II provides competitive advantage to large
and more systemic banks, who could implement risk models
strategically at the expenses of smaller banks
Motivation Sample and Systemic Risk Measures Methodology and Results Conclusions Appendix
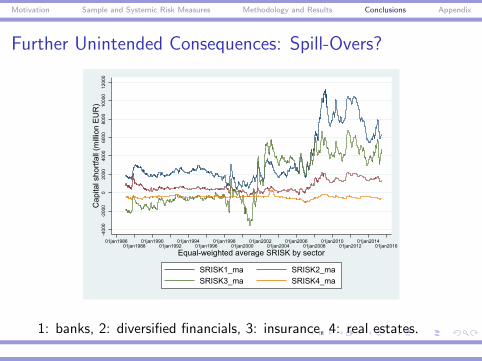
Further Unintended Consequences: Spill-Overs?
-400
0-2
000
020
0040
0060
0080
0010
000
1200
0C
apita
l sho
rtfal
l (m
illio
n E
UR
)
01jan198601jan1988
01jan199001jan1992
01jan199401jan1996
01jan199801jan2000
01jan200201jan2004
01jan200601jan2008
01jan201001jan2012
01jan201401jan2016
Equal-weighted average SRISK by sector
SRISK1_ma SRISK2_maSRISK3_ma SRISK4_ma
1: banks, 2: diversified financials, 3: insurance, 4: real estates.
Motivation Sample and Systemic Risk Measures Methodology and Results Conclusions Appendix
Spillover effects
Other financial sectors are recently building up high levels ofsystemic risk:IFM GFSR Apr. 2016: ”The contribution of life insurers to systemic risk
has increased in recent years [...] Supervisors and regulators should take a
more macroprudential approach to the sector [...] it includes the
international adoption of capital and transparency standards for the
sector.”
→ Are there any spillovers effects from the banking regulation tothe non-banking financial sectors?
Motivation Sample and Systemic Risk Measures Methodology and Results Conclusions Appendix
Outline
Motivation
Sample and Systemic Risk Measures
Methodology and Results
Conclusions
Appendix
Motivation Sample and Systemic Risk Measures Methodology and Results Conclusions Appendix
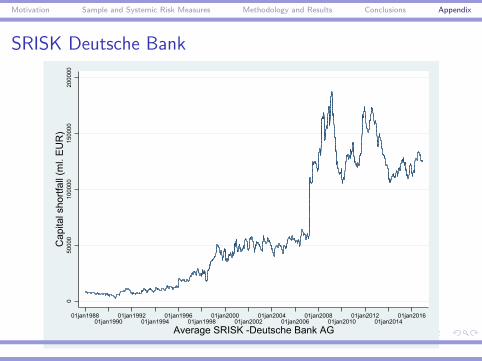
SRISK Deutsche Bank0
5000
010
0000
1500
0020
0000
Cap
ital s
hortf
all (
ml.
EU
R)
01jan198801jan1990
01jan199201jan1994
01jan199601jan1998
01jan200001jan2002
01jan200401jan2006
01jan200801jan2010
01jan201201jan2014
01jan2016
Average SRISK -Deutsche Bank AG
Motivation Sample and Systemic Risk Measures Methodology and Results Conclusions Appendix
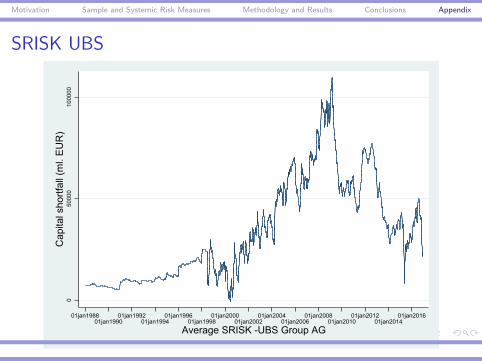
SRISK UBS0
5000
010
0000
Cap
ital s
hortf
all (
ml.
EU
R)
01jan198801jan1990
01jan199201jan1994
01jan199601jan1998
01jan200001jan2002
01jan200401jan2006
01jan200801jan2010
01jan201201jan2014
01jan2016
Average SRISK -UBS Group AG

Motivation Sample and Systemic Risk Measures Methodology and Results Conclusions Appendix
SRISK Barclays0
5000
010
0000
1500
0020
0000
Cap
ital s
hortf
all (
ml.
EU
R)
01jan198801jan1990
01jan199201jan1994
01jan199601jan1998
01jan200001jan2002
01jan200401jan2006
01jan200801jan2010
01jan201201jan2014
01jan2016
Average SRISK -Barclays PLC
Motivation Sample and Systemic Risk Measures Methodology and Results Conclusions Appendix
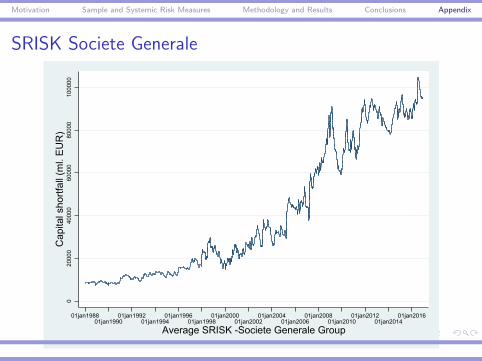
SRISK Societe Generale0
2000
040
000
6000
080
000
1000
00C
apita
l sho
rtfal
l (m
l. E
UR
)
01jan198801jan1990
01jan199201jan1994
01jan199601jan1998
01jan200001jan2002
01jan200401jan2006
01jan200801jan2010
01jan201201jan2014
01jan2016
Average SRISK -Societe Generale Group
Motivation Sample and Systemic Risk Measures Methodology and Results Conclusions Appendix
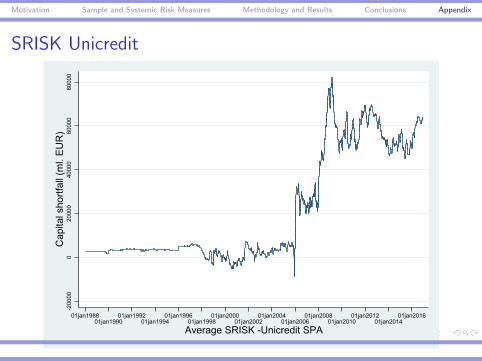
SRISK Unicredit-2
0000
020
000
4000
060
000
8000
0C
apita
l sho
rtfal
l (m
l. E
UR
)
01jan198801jan1990
01jan199201jan1994
01jan199601jan1998
01jan200001jan2002
01jan200401jan2006
01jan200801jan2010
01jan201201jan2014
01jan2016
Average SRISK -Unicredit SPA
Motivation Sample and Systemic Risk Measures Methodology and Results Conclusions Appendix
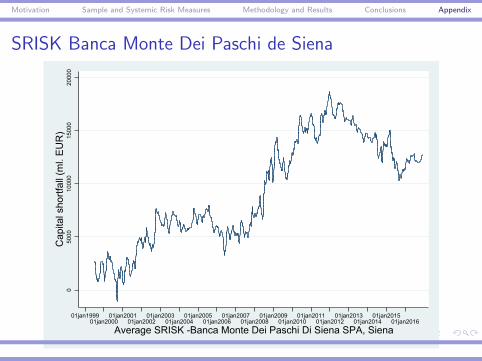
SRISK Banca Monte Dei Paschi de Siena0
5000
1000
015
000
2000
0C
apita
l sho
rtfal
l (m
l. E
UR
)
01jan199901jan2000
01jan200101jan2002
01jan200301jan2004
01jan200501jan2006
01jan200701jan2008
01jan200901jan2010
01jan201101jan2012
01jan201301jan2014
01jan201501jan2016
Average SRISK -Banca Monte Dei Paschi Di Siena SPA, Siena
Motivation Sample and Systemic Risk Measures Methodology and Results Conclusions Appendix
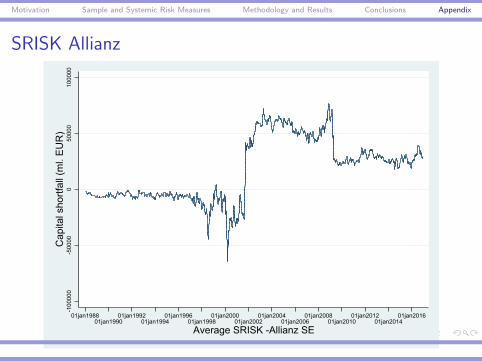
SRISK Allianz-1
0000
0-5
0000
050
000
1000
00C
apita
l sho
rtfal
l (m
l. E
UR
)
01jan198801jan1990
01jan199201jan1994
01jan199601jan1998
01jan200001jan2002
01jan200401jan2006
01jan200801jan2010
01jan201201jan2014
01jan2016
Average SRISK -Allianz SE

Motivation Sample and Systemic Risk Measures Methodology and Results Conclusions Appendix
SRISK Generali Insurance Group-2
0000
020
000
4000
0C
apita
l sho
rtfal
l (m
l. E
UR
)
01jan198801jan1990
01jan199201jan1994
01jan199601jan1998
01jan200001jan2002
01jan200401jan2006
01jan200801jan2010
01jan201201jan2014
01jan2016
Average SRISK -Assicurazioni Generali SPA, Trieste