Embed Size (px)
Citation preview

Electronic copy available at: http://ssrn.com/abstract=1364933
October 2010
McCombs Research Paper Series No. FIN-04-10
Did Subjectivity Play a Role in CDO Credit Ratings?
John M. Griffin
McCombs School of Business
The University of Texas at Austin
Dragon Yongjun Tang
The University of Hong Kong
This paper can also be downloaded without charge from the
Social Science Research Network Electronic Paper Collection:
http://ssrn.com/abstract=1364933

Electronic copy available at: http://ssrn.com/abstract=1364933Electronic copy available at: http://ssrn.com/abstract=1364933
Did Subjectivity Play a Role in CDO Credit Ratings?
John M. Griffin*
The University of Texas at Austin
and
Dragon Yongjun Tang
The University of Hong Kong
© John M. Griffin and Dragon Tang. All rights reserved. Do not post without authors’ permission.
September 30, 2010
* The authors can be reached at [email protected] and [email protected]. We thank the McCombs Research Excellence Fund, Hong Kong RGC Grant #751109, the BSI Gamma Foundation, the McCombs School of Business, University of Hong Kong, and HKUST for generous support. We thank an anonymous referee, associate editor, and Cam Harvey for detailed and beneficial comments. We also thank Itzhak Ben-David, Efraim Benmelech, Bernie Black, Michael Brandt, Benjamin Bystrom, Eric Chang, Joshua Coval, Prachi Deuskar, David Deutsch, Jerry Dwyer, Erkan Erturk, Mark Grinblatt, Bing Han, Jean Helwege, Burton Hollifield, Philip Jorion, Cathy Kahle, Robert Kuberek, Hayne Leland, Michael Lemmon, Francis Longstaff, Evgeny Lyandres, Peter MacKay, Paul Malatesta, Joseph Mason, Frank Partnoy, Lee Partridge, Neil Pearson, Edward Rice, Michael Roberts, Kimberly Rogers, Ann Rutledge, Tony Sanders, Til Schuermann, Mark Seasholes, Amit Seru, Clemens Sialm, Jonathan Sokobin, Chester Spatt, René Stulz, Wing Suen, Sheridan Titman, Nancy Wallace, Lori Walsh, Ashley Wang, Yintian Wang, Yingzi Zhu, and seminar participants at the 16th Mitsui Finance Symposium at the University of Michigan, 2009 China International Conference in Finance, 2009 Conference on Empirical Legal Studies, 2009 NY Fed/NYU Stern Conference on Financial Intermediation, 2009 SFM Conference at National Sun Yat-Sen University, 2010 American Finance Association meetings, 2010 Atlanta Fed Financial Markets Conference, China-Europe International Business School, 2010 China International Finance Conference, 2010 Financial Intermediation Research Society Meeting, 2010 NBER Credit Rating Sessions, 20th Utah Winter Finance Conference, 4th Annual Conference on the Asia-Pacific Markets, University of Arizona, the First Shanghai Winter Finance Conference, Fudan-UNSW Joint Workshop, Hebrew University, HKUST, City University of Hong Kong, Hong Kong Baptist University, the Hong Kong Monetary Authority, the Securities and Exchange Commission, Shanghai Jiaotong University, Thammasat Business School, University of California at Irvine, University of Hawaii, University of Notre Dame Conference on the Financial Crisis, University of Texas at Austin, University of Texas at Dallas, and University of Washington, for helpful discussion and Rolando Campos, Ying Deng, Garrett Fair, Kelvin Law, Dan Luo, Jordan Nickerson, Baolian Wang, Sarah Wang, and Miao Zhang for excellent research assistance.

Electronic copy available at: http://ssrn.com/abstract=1364933Electronic copy available at: http://ssrn.com/abstract=1364933
Did Subjectivity Play a Role in CDO Credit Ratings?
ABSTRACT
Analyzing 916 CDOs issued from January 1997 to December 2007, we find that a credit rating agency frequently made adjustments beyond its main model. The adjustments were typically positive and amounted to AAA tranche sizes 12.1% larger than implied by the rating agency model. These adjustments are difficult to explain by likely determinants, but exhibit a clear pattern: CDOs with smaller model-implied AAA sizes receive larger adjustments. However, CDOs with larger adjustments experience more severe subsequent downgrading. Moreover, prior to April 1, 2007, 91.2% of AAA rated notes only comply with the credit rating agency‘s own AA default rate standard. Accounting for adjustments and the criterion deviation indicates that AAA tranches were structured with BBB support levels on average. Credit rating agencies have recently proposed more qualitative methodologies, but our findings cast doubt on the efficacy of such changes.

Electronic copy available at: http://ssrn.com/abstract=1364933
1
In discussions regarding the causes of the recent financial crisis, the role of collateralized debt
obligations (CDOs) is of central interest. Securitized instruments, like CDOs, are thought to be not
only a driving force behind the housing market boom, but also largely responsible for the damage to
the banking sector.1 Most CDO notes issued prior to mid-2007 were AAA rated. However, in mid-
2007 CDOs began to experience large losses followed by massive downgrading of formerly AAA
rated tranches in 2008 and 2009. How could historically trusted credit ratings suddenly become so
unreliable?
This paper is the first to examine ‗adjustments‘ to a credit rating agency model. These
adjustments are not our estimates, but are implied directly from the key output of a leading credit
rating agency‘s main quantitative model. We study the magnitude, determinants, and consequences
of adjustments. Additionally, we analyze the consistency through time of the default probability
standards, a key model input, which are essentially the tranche-specific assumed risk level of the
CDO.
Rating agencies have been scrutinized and criticized by the media, regulators, members of
Congress, investors, and even the CEOs of the CDO underwriting firms on their role in the recent
credit crisis. A central question being asked is whether credit rating agencies knowingly gave inflated
CDO ratings, or if they truthfully provided their best credit risk assessment based on available
information at the time. Stulz (2008) argues that knowing whether a risk was mis-assessed and the
nature of the mistake is crucial for risk management practice. It seems apparent that understanding
the CDO rating process is an integral part of learning economic lessons from the crisis. While there
1 Brunnermeier (2009) highlights the important role of CDOs and accompanying amplification mechanisms in the crisis. Along this vein, Partnoy (2009a and 2010) argues that reliance on credit ratings and credit rating agencies were the root cause of the crisis. Longstaff (2010) demonstrates contagion effects in 2007 from the asset-backed CDO market to the Treasury bond and stock markets. Longstaff and Myers (2009) show that CDO equity and bank stock equity are mostly driven by a common factor. Deng, Gabriel, and Sanders (2008) link the CDO market to lower spreads of subprime mortgage backed securities (MBS) and Shivdasani and Wang (2009) find that CLOs provided the dominant leveraged buyout financing.

2
is no shortage of opinions and commentary, there has been relatively little empirical examination of
the structured finance credit rating process around the time of the crisis.
CDOs hold debt securities such as bonds, loans, and mortgages as collateral to issue
prioritized tranche notes (see Longstaff and Rajan (2008) and Coval, Jurek, and Stafford (2009b) for
detailed descriptions). Several interesting problems with CDO valuation have been raised. First,
Coval, Jurek, and Stafford (2009a) show that the most senior tranches of CDOs should demand a
much higher risk premium than the observed value. Second, it is conceivable that an ‗economic
catastrophe‘ simply occurred, though compelling evidence from Longstaff and Rajan (2008) would
indicate that this is improbable. 2 Third, CDO market participants may have held unrealistic
assumptions regarding key model inputs such as housing market prospects and default correlations.
Coval, Jurek, and Stafford (2009b) demonstrate that CDO valuation models hinged on a high degree
of confidence in the parameter inputs. Fourth, lax standards (Keys, Mukherjee, Seru, and Vig (2010),
and Mian and Sufi (2009)), fraud (Ben-David (2008)), or increasing reliance on hard information
(Rajan, Seru, and Vig (2010)) in the mortgage origination process could have inflated the collateral
quality of mortgage related CDOs (Barnett-Hart (2009)).
A recent U.S. Securities and Exchange Commission (SEC, 2008) report discusses potential
conflicts of interest in the credit rating agency (CRA) industry, but stops short of making any firm
conclusions. The views of the major CRAs can largely be summed up by Standard and Poor‘s (S&P)
President‘s testimony before Congress: ―there is no evidence of any misconduct by our analysts or
that the fundamental integrity of our ratings process has been compromised. Indeed, the SEC itself
concluded that it found no evidence during its examination that S&P had compromised its standards
2 Deven Sharma, President of S&P, explains the deterioration as a rare unanticipated event [Testimony of Deven Sharma
before U.S. House of Representatives, October 22, 2008]. Longstaff and Rajan (2008) find that the CDX index between 2003 and 2005 was priced such that CDO losses of 35% could occur once every 763 years. Hence, for the rare event hypothesis to completely explain the recent crisis one might need to hold that the once in every 763 years event has just occurred.

3
to please issuers.‖ 3 Despite accusations, evidence of mishandling is mainly limited to a few
embarrassing emails in an SEC examination of over two million emails.
To analyze rating practices, we compile a database of 916 CDOs with note face value of
$612.8 billion, originally issued between January 1997 and December 2007. The data contains
detailed information including key inputs and outputs used in the rating process from one of the top
three major credit rating agencies. Interestingly, the proportion of the CDOs eligible for AAA status
under the CRA model exhibits a correlation of only 0.49 with the actual proportion rated AAA—the
reason the link is not tighter is due to the prevalence of adjustments. We define the AAA
‗adjustment‘ as the difference between the proportion of a CDO rated ‗AAA‘ in practice and the
proportion implied by the CRA main quantitative model output. We find that 84.6% of adjustments
are positive and that, on average, adjustments amount to an additional 12.1% of AAA at the time of
issue.
We examine whether manager experience and credit enhancements such as insurance,
liquidity provisions, overcollateralization, reliance on other commonly used models, or excess spread
can explain the AAA adjustment. We find that they do not. However, over half of the cross-
sectional variation in adjustments can be simply explained by and is negatively related to the AAA
proportions assigned by the CRA model. For example, for CDOs in the smallest quintile of ‗AAA‘
implied by the CRA model, the model yields 42.6% AAA, but the adjustment adds another 26.8%
for a total issuance amount of 69.4% AAA. From a Bayesian perspective, we find that adjustments
are consistent with CDOs being rated with a prior of 82.0% AAA. Adjustments can help explain
why ‗AAA‘ CDO tranches are large and similar in size despite varying CDO structures.
3 Direct quotes of Deven Sharma, President of Standard and Poor‘s, from testimony before U.S. House of Representatives on October 22, 2008.
4
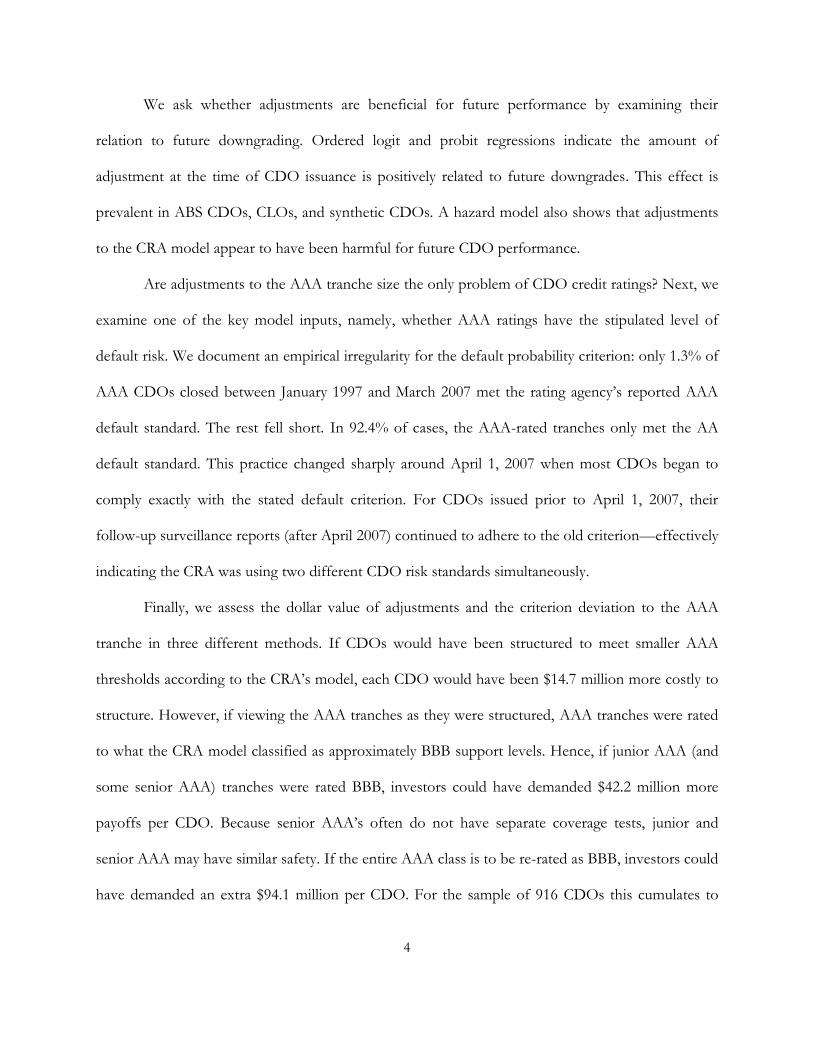
We ask whether adjustments are beneficial for future performance by examining their
relation to future downgrading. Ordered logit and probit regressions indicate the amount of
adjustment at the time of CDO issuance is positively related to future downgrades. This effect is
prevalent in ABS CDOs, CLOs, and synthetic CDOs. A hazard model also shows that adjustments
to the CRA model appear to have been harmful for future CDO performance.
Are adjustments to the AAA tranche size the only problem of CDO credit ratings? Next, we
examine one of the key model inputs, namely, whether AAA ratings have the stipulated level of
default risk. We document an empirical irregularity for the default probability criterion: only 1.3% of
AAA CDOs closed between January 1997 and March 2007 met the rating agency‘s reported AAA
default standard. The rest fell short. In 92.4% of cases, the AAA-rated tranches only met the AA
default standard. This practice changed sharply around April 1, 2007 when most CDOs began to
comply exactly with the stated default criterion. For CDOs issued prior to April 1, 2007, their
follow-up surveillance reports (after April 2007) continued to adhere to the old criterion—effectively
indicating the CRA was using two different CDO risk standards simultaneously.
Finally, we assess the dollar value of adjustments and the criterion deviation to the AAA
tranche in three different methods. If CDOs would have been structured to meet smaller AAA
thresholds according to the CRA‘s model, each CDO would have been $14.7 million more costly to
structure. However, if viewing the AAA tranches as they were structured, AAA tranches were rated
to what the CRA model classified as approximately BBB support levels. Hence, if junior AAA (and
some senior AAA) tranches were rated BBB, investors could have demanded $42.2 million more
payoffs per CDO. Because senior AAA‘s often do not have separate coverage tests, junior and
senior AAA may have similar safety. If the entire AAA class is to be re-rated as BBB, investors could
have demanded an extra $94.1 million per CDO. For the sample of 916 CDOs this cumulates to

5
$38.7 or $86.2 billion in cost to investors. Most of the valuation impact is driven by adjustments.
While these value differences are considerable, they are likely an understatement, as we scrutinize
only one aspect of the credit rating process.
Our study adds to several strands of literature. Longstaff and Rajan (2008) present the first
set of empirical evidence on CDO valuation. An, Deng, and Sanders (2008) find that commercial
mortgage-back securities (CMBS) ratings are hard to fully explain and Stanton and Wallace (2010)
find that CMBS subordination levels gradually decreased through 2007. Ashcraft, Goldsmith-
Pinkham, and Vickery (2009) show that MBS ratings underperform their simple model. Benmelech
and Dlugosz (2009b) and He, Qian, and Strahan (2010) find evidence of potential CDO and MBS
rating shopping and conflicts of interest. Our empirical focus complements recent theoretical
models of credit ratings4 and is related to the more general debate regarding rating standards.5
The rest of this paper is organized as follows. Section I provides the industry background of
CDO credit rating. Section II describes the data, and Section III documents adjustments. Section IV
analyzes the connection between adjustment and downgrading. A deviation from the publicized
default criterion is discovered and discussed in Section V, and Section VI calculates the economic
importance of these effects. Section VII concludes.
4 This recent but growing body of work includes: Bolton, Freixas, and Shapiro (2009), Damiano, Li, and Suen (2008), Farhi, Lerner, and Tirole (2010), Mathis, McAndrews, and Rochet (2009), Opp, Opp, and Harris (2010), Skreta and Veldkamp (2009), and Sangiorgi and Spatt (2010). 5 In bond ratings, Cheng and Neamtiu (2009) find that rating agencies have been improving in their accuracy, timeliness, and volatility post Sarbanes-Oxley Act; Jorion, Shi, and Zhang (2009), in contrast to Blume, Lim, and MacKinlay (1998), find no evidence of tightening standards after controlling for accounting quality. Bongaerts, Cremers, and Goetzmann (2009) find that multiple CRAs provide certification, and Becker and Milbourn (2009) argue that competition has hurt rating quality. John, Ravid, and Reisel (2010) find suboptimal notching practices and Kraft (2010) finds some evidence that rating agencies may cater to the interests of bond issuers.

6
I. Key Aspects of the CDO Modeling and Rating Process
This section explains key aspects of the CDO modeling and rating process to facilitate the
understanding of our empirical analysis. Our discussion is based on publicly released official
documents from credit rating agencies as well as numerous conversations with CDO industry
practitioners, including current or former structured finance analysts with major credit rating
agencies and related parties privy to interactions with credit rating agencies.
A. Issuance and Rating Process
CDOs operate like highly leveraged investment companies with multi-layer debt structures
of different seniorities and a nominal ‗equity‘ tranche.6 Underwriters are often in charge of both
structuring the deal and arranging the notes placement. Unlike conventional security issuances, the
entire deal structure is subject to modification before issuance, and CDO structurers have free
access to rating agency software, so probable rating model outcomes are often known a priori.
Ratings are a focal point of primary offerings for CDO notes. It is almost always critical for issuers
to secure target ratings before the notes issuance, and often CDO prospectuses specify minimum
ratings from particular rating agencies as preconditions to the issuance. Hence, ratings may play a
dual role of evaluation and certification.
Usually, the structuring team of the underwriter submits the CDO term sheet to the business
manager of one or multiple credit rating agencies. The collateral asset pool is typically incomplete,
and the rating analyst will conduct credit risk analysis based on projected collateral characteristics.
The CRA and underwriter may engage in discussion and iteration over assumptions made in the
valuation process. If the underwriter and CRA cannot agree, then the underwriter can pay a small
contract-breaking fee and potentially use ratings from another rating agency.
6 Longstaff and Rajan (2008), Benmelech and Dlugosz (2009a), Sanders (2009), and Coval, Jurek, and Stafford (2009b) present overviews of CDO structure and mechanics. Mason and Rosner (2007) discuss conflicts of interest. In their handbooks, Rutledge and Raynes (2003, 2010) comprehensively explain CDOs.

7
Once the rating committee is ready to release preliminary ratings, a pre-sale report is usually
published on the deal and distributed to potential investors.7 After closing, the CDO manager uses
the proceeds raised from investors to ‗ramp up‘ the collateral pool. The trustee oversees the
operation of the CDO and keeps relevant parties informed. The surveillance analyst assigned by the
rating agency monitors the performance of the CDO using data from the trustee and the manager.
B. Credit Rating Methodology
Rating agencies assign credit ratings according to expected probabilities of default or
expected loss rates.8 To judge the probability of default for each tranche, one needs to compare
future cash inflows generated by collateral assets to the liability payments. Rating analysts make
assumptions on default probability and recovery rate for each individual collateral asset, and, more
importantly, the default correlation among collateral assets. These assumptions are used to derive an
expected loss rate distribution associated with the collateral pool under different scenarios through
simulations such as the Gaussian Copula method.9 These rates are known as scenario default rates
(SDR) by S&P terminology or Default Scenario Collateral Loss Rate by Moody‘s. We follow S&P‘s
terminology hereafter.
The calculation of SDR is analogous to finding Value-at-Risk (VaR) at a given confidence
level. For a scenario with occurrence probability D, one can back out the SDR such that
loss rate using the loss rate distribution of the given asset pool. For example, the
‗AAA‘ scenario is the rarest scenario with an extremely low D. CDO rating software (such as Fitch‘s
VECTOR, Moody‘s CDO ROM, and S&P‘s CDO Evaluator) specifically incorporates these
7 The CRA may release a new issue report shortly after the closing date when the collateral assets are fully ramped. 8 Our descriptions are based on CRA published documents, such as Moody‘s (1998), S&P (2002), and Fitch (2006) in addition to discussions with industry insiders. Because of its simplicity and widespread use we follow S&P‘s terminology. 9 S&P and Fitch always use the Gaussian Copula simulation method which we describe in Internet Appendix A. Moody‘s initially uses the Binomial Expansion Technique, which captures default correlation through its diversity score (DS) framework. In 2004, Moody‘s started using the simulation method for rating synthetic CDOs.

8
maturity-specific ―default criteria‖ (D) as inputs. Internet Appendix Table IA.I contains the AAA
CDO ―default criterion‖ assumptions for maturities from one to ten years from Fitch, Moody‘s, and
S&P. The AAA default criterion is fixed for a given maturity, but SDRs will vary across CDOs.
Apart from the credit risk modeling over the collateral pool, each tranche must undergo a
separate cash flow analysis for cash CDOs but not synthetics. Many scenarios with various market
conditions such as default timing patterns, interest rates, and recovery rates are considered.10 Under
each scenario, a number (say 10,000) of portfolio loss rates will be simulated. The highest collateral
pool loss rate associated with a zero loss rate for the tranche is the break-even default rate (BDR) for
the tranche under this scenario. If 64 scenarios are considered, then the minimum of the 64 BDRs is
the maximum loss rate the tranche can withstand under any scenario. In other words, the BDR is
the highest loss rate resulting from the worst cash flow scenario under which the tranche will still
receive timely interest payments and ultimate principal.
The key requirement for the credit rating agencies to issue a rating on a tranche is that the
break-even default rate from the cash flow analysis is greater than the corresponding scenario default
rate from the default risk analysis (BDR>SDR). For example, if a tranche can withstand a 30.72%
(BDRAAA) loss according to the cash flow analysis, but the collateral pool is not expected to lose
more than 30.71% under the AAA scenario (SDRAAA), then the tranche can obtain an AAA rating.
C. Adjustments
For a generic credit portfolio, the tranche amount admissible for an AAA rating according to
the level of expected default rate specified by the CRA credit risk model is 1−SDRAAA. Hence, we
define 1−SDRAAA for a given CDO as the AAA ‗CRA model fraction‘ as this is literally the most
‗AAA‘ that can be justified solely under the rating agency‘s credit risk model. The CRA model
10 The rating agencies often specify certain scenarios, including stressed ones, for the deal structurer to include in the cash flow analysis. If four default timing patterns, four interest rates, and four recovery rates are considered, then a total of 64 cash flow scenarios will be run.

9
fraction (1-SDR) and the actual tranche size often do not match. We refer to this difference simply
as the ‗adjustment‘ (to the CRA credit risk model). For further clarification, we demonstrate the use
of SDR, BDR, and adjustment of an actual CDO in Internet Appendix B.
Historically, credit rating agencies indicate that the quality (or experience) of the collateral
manager, legal documentation, structure of the cash-flow waterfall, insurance, the nature of the
hedges, and liquidity considerations are important considerations.11 For example, the structure of a
CDO may include insurance from an outside insurer (‗wrap‘) for certain (senior) tranches, making
them less risky by transferring the credit risk to the insurer. The features of CDOs described above
are not described as inputs into the credit rating agency risk models. These CDO features could be
quantitatively incorporated into tranche-specific cash flow analysis and might lead to larger BDRs.
However, for synthetic CDOs there is typically no cash flow analysis and hence the exact maximum
tranche size should correspond to 1-SDR. 12 For cash deals, it is also possible, due to greater
flexibility in modeling choices, that the cash flow modeling is more susceptible to influence from the
investment bank.13 In such a case, it would be better for the empiricist to focus on the outputs (SDR)
from the more standardized credit risk model rather than a potentially biased cash flow model.
Alternatively, adjustments could be made qualitatively beyond any model or completely ‗out-of-
model.‘
D. Empirical Implications
The above discussion of the CDO credit rating process points to several natural directions
of empirical investigation. First, using data from a leading credit rating agency, we will examine if
11 See, Moody‘s (2003, page 11, 18), S&P (2002, pages 15-16, 54-60), Fitch (2006, pages 1, 17-19). Fitch (2006, page 1)
states that ―ratings are ultimately the result of a formal committee process and not simply model output.‖ Moody‘s (2003, p. 18) states, ―Clearly, the relationship between the quantitative and qualitative analyses for synthetic CDOs is especially crucial.‖ 12 SDR is also the main credit risk output. This is also referred to as Scenario Loss Rate or SLR for synthetic CDOs. 13 We thank former employees of two separate investment banks for making us aware of this issue. The CRA has little documentation on the specifics of its cash flow modeling. This could lead to tailoring of a model by an investment bank.

10
there are adjustments to ―the‖ CRA‘s main risk model and their direction. Second, we will examine
if these adjustments are related to more quantitative structural elements such as insurance and
liquidity provisions. Third, we will also separately examine the pattern of adjustments for synthetic
CDOs as no cash flow analysis is typically used here. Finally, we will examine the consistency of
application of the default risk criterion (D).
II. Data and Descriptive Statistics
Rating agencies compile data from trustee reports and host online CDO data services.14
These are often a main investment tool for CDO investors and managers without an in-house CDO
research team. Our dataset is obtained directly from access to one of the three major credit rating
agencies. We begin with the set of all CDOs covered by the credit rating agency, but restrict our
sample to all CDOs with default risk estimates (SDR) data and main asset information available.
This requirement results in a dataset of 916 CDOs issued between January 1997 and December 2007.
For our main analysis, we use data from first available surveillance reports that are typically issued
after the CDO collateral pool is fully ramped (often six months after deal closing as illustrated in
Internet Figure IA1). 530 of our surveillance reports are within the first six-months after the closing
date and a total of 663 within the first year.15 We also use subsequent year-end and last available (as
of September 2008) surveillance report data in Section V.B. Total dollar principal value of all CDO
notes represented by our sample is $612.8 billion. The Securities Industry and Financial Markets
Association (SIFMA) keeps track of global CDO issuance since 2000.16 Over the period of 2000-
2007, our sample consists of 891 CDOs with a principal value of $603.3 billion, which represents
34.9% of the $1,727.5 billion Global CDO Issuance reported by SIFMA over the same period. The
14 Such as Moody‘s CDOCalc, S&P‘s CDO Interface, and Fitch‘s S.M.A.R.T. 15 We report robustness for these smaller samples in Internet Appendix Figure AI5 and Tables IA.III, IA.IX, and IA.X. 16 http://www.sifma.org/uploadedFiles/Research/Statistics/SIFMA_GlobalCDOData.xls.

11
most unique element of our data is the detailed description of the CDO asset pool (collateral
information), summary average value of the inputs, and key parameters going into the rating
agency‘s model including the default probability criterion reported for each CDO at each rating level.
It additionally includes the rating agency model primary outputs. We obtain ratings history from the
credit rating agency. From SDC Platinum, we verify coarser deal structure data (such as tranche size,
deal type, payment frequency, etc.) and ratings. To put the CDO data in the greater debenture
universe, we also gather corporate debentures from the Fixed Income Securities Database.
Panel A of Figure 1 shows the global new-issue rating distribution of corporate debentures
(160,689 rated issues) and CDOs from the rating agency database (5,466 rated tranches from the
sample of 916 CDOs) over the same January 1997 to December 2007 period. For corporate
debentures, the top rating of AAA counts for 11.6% of the total rating issuance value, non-AAA
investment grade for 63.8% (13.7% AA, 29.1% A, and 21.0% BBB), and below investment grade
24.6%. Nevertheless, over the same time period, the rating distribution for CDOs paints a starkly
different picture: among all rated issuances, 84.1% AAA, 14.5% non-AAA investment grade (6.0%
AA, 4.6% A, and 4.0% BBB), and 1.4% below investment grade.17
We next examine the subsequent performance of the AAA-rated debt (both corporate and
CDO tranches) from Panel A as of June 30, 2010. In Panel B we find that corporate bond AAA
ratings are very stable with 76.2% of corporate debt issued between 1997 and 2007 maintaining their
AAA status, and another 8.1% at AA or AA+. About one-eighth (12.8%) become non-rated because
the debt matured/retired, or the rating agencies withdrew the rating. In contrast, only 29.1% of the
CDO‘s original AAA ratings were intact, while 45.2% were downgraded to junk grade and 4.0% to
D. A natural question is: What caused AAA CDO capital to be downgraded so severely?
17 Note that these numbers do not include the unrated equity portion, which is on average 8.2% of the CDO.

12
Table I provides summary statistics of the profiles at closing time for our sample of 916
CDOs. We group CDOs by collateral asset type. Collateralized bond obligations (CBO) are
securitized with bonds. Collateralized loan obligations (CLO) are securitized with loans. CDOs of
ABS are securitized with asset-backed securities (mostly mortgage-backed securities). CDO2 are
securitized with existing CDO notes. (ABS CDOs and CDO2s are often referred to as structured
finance CDOs.) Table I shows that our sample is dominated by CLOs (393 out of 916) and ABS
CDOs (373 out of 916). CBOs (96 out of 916) and CDO2 (54 out of 916) consist of a smaller
portion.
The average collateral rating is BB+ in the overall sample. CBOs and CLOs are smaller than
ABS CDOs and CDO2s in size. CLOs have the largest number of collateral assets, while CDO2s
have the fewest number of collateral assets. Fourteen percent of the sample is synthetic CDOs with
most of these being ABS CDOs. Notwithstanding the variation in compositions, the AAA portion
of the CDOs is highly consistent across collateral types. The average CDO has 75.5% rated AAA
(super senior tranches are counted as AAA-rated). This portion ranges from 71.5% for CDO2s, 72.6%
for CLOs, 72.8% for CBOs, and 79.8% for ABS CDOs.
III. Understanding Adjustments
In this section, we examine the difference between the fraction assigned as AAA for a CDO
according to the credit rating agency model and the fraction rated AAA in practice. We document
these adjustments by examining their magnitude, stylized features, and their potential determinants.
A. AAA Adjustments
Panel A of Table II shows that, for the 916 CDOs, on average the rating agency model
yields 63.4 percent AAA according to the first surveillance report in the data set, but the actual

13
fraction of the CDO issued AAA is 75.5 percent. Hence, the difference between the amount of
AAA issued and that allowed by the CRA model (the adjustment) is 12.1 percent on average. The
adjustment is smallest for ABS CDOs (8.1 percent) and CBOs (10.4 percent), and largest for CDO2s
(14.7 percent) and CLOs (16.0 percent).
The adjustments are large in the early years of the sample, but there are also few
observations here. Adjustments are at their lowest in 2003-2004, but increase each year until 2007,
the last year we have new issues. In 2007 the average adjustment is 18.2 percent. The adjustments in
2007 are also higher in all the different types of CDOs as well.
To examine the effect of the adjustment on the overall AAA graphically, we plot the
distribution of the size of the AAA tranche before and after the adjustment. Figure 2 shows that
according to the credit rating agency risk model, most of the AAA tranche sizes would have been
between 55 and 65 percent of the CDO. For the actual AAA tranche sizes which include the
adjustment, we see that the left tail is thinner—the adjustment has the effect of drastically reducing
the amount of AAA tranches less than 65%. Indeed, the actual AAA issued groups tightly between
70 and 80 percent. The test for differences in the distribution of AAA fraction across two groups is
conducted by calculating the corrected Kolmogorov-Smirnov's D-statistic, with the p-values of the
test as <0.0001. The distribution after adjustment is more concentrated (the standard deviation of
actual AAA size is 0.114, compared to 0.156 for model AAA standard deviation) suggesting that
AAA fraction across CDOs post-adjustment is more similar.
Panel B of Table II reports the cross-sectional correlation between the credit rating agency
model and the actual amount of AAA given. The correlation is only 0.49. Since the actual amount of
AAA given and that from the CRA model differ only by the adjustment, this indicates that the
adjustment is obscuring a large part of the relation between the CRA model and the final proportion

14
rated AAA. However, the adjustment is strongly negatively correlated (correlation coefficient -0.71)
with the amount of AAA given by the CRA model.
B. Explaining Adjustments
To understand the potential driver of this adjustment, in Table III we regress the AAA
adjustment on variables that credit rating agencies stress to be important, but are likely not
incorporated in the credit risk model (as discussed in Section I.C.). Our first variable is collateral
manager experience in the form of a commonly discussed proxy—the past deals performed by the
collateral manager. The variable enters with some statistical significance but a trivial adjusted R2.
Manager experience will become insignificant in the presence of other controls (specifications 7-10).
Other important CDO credit enhancements are overcollateralization, insurance, and liquidity (such
as third party revolving line of credit and reserve account). Specification 2 shows that of the three,
overcollateralization has the most importance for explaining adjustments. However, it enters with a
negative sign, suggesting that overcollateralizing the CDO is associated with less, not more, AAA,
opposite to the effect hypothesized. In later specifications with more controls, the insurance variable
enters with a positive sign, indicating that CDOs with insurance do receive a 4.9% percent larger
AAA tranche.
In specification 3 we include the fraction of AAA from the CRA model; here, the variable
enters with a strong negative coefficient and the adjusted R2 of the model jumps to 0.503. In
specification 4 we include the potential determinants of deal rating, and we find that these increase
the adjusted R2 only to 0.569. Since overcollateralization enters with the opposite sign, we estimate
specification 5 with the CRA AAA and overcollateralization and find an adjusted R2 of 0.562. Hence,
the incremental explanatory power of the past deals performed by the manager, insurance, and
liquidity can only explain a trivial 0.007 of the cross-sectional variation in the adjustment.

15
It is possible that adjustments were made by comparing the CRA model with an alternative
Gaussian Copula simulation model or a traditional alternative such as the Vasicek model. We obtain
AAA estimates from both (as discussed in Internet Appendix A) and find that neither helps to
explain the adjustment. Consistent with the simple summary statistics, adjustments are larger in 2005
(0.020), 2006 (0.029), and especially 2007 (0.059).
One of the most important credit enhancements is excess spread: the ratio of total collateral
income over CDO notes coupon payment. Perhaps credit rating agencies give larger adjustments to
CDOs with larger excess spreads. For a subsample of 669 CDOs with excess spread information, we
find that contrary to expectations CDOs with higher excess spreads actually have slightly less
positive adjustments (Specification 9).
We must note that like most analyses, our specifications cannot rule out an unknown
omitted variable that is highly correlated with the amount of AAA from the CRA model. However,
to the extent that there are missing variables that are quantitative in nature, they could be captured in
the secondary cash flow analysis. As discussed in Section I.B., the break-even default rate (BDR) is
the main output from the cash flow analysis. One possibility is that the credit rating agency gives
larger adjustments to CDOs where the BDR from the secondary cash flow analysis is much greater
than the SDR from the credit rating agency model. We are able to collect BDR information for a
subset of 408 of our CDOs from pre-sale and new issue reports. In specification (10) we find that
the relation is slightly negative. These findings suggest that the adjustment is ‗out-of-model‘ as it is
beyond the formal CRA model and not explained by a key parameter from the cash flow simulation.
The adjustment may indeed be driven by some model, but then one should study whether that
model is applied in a systematic or non-systematic fashion.

16
In Figure 3, we examine a simple scatter plot of the fraction AAA according to the CRA
model relative to the adjustment. The graph shows an almost linear relation where CDOs with a low
amount of AAA given by the CRA model receive large AAA adjustments. Conversely, CDOs where
the model yields a high amount of AAA exhibit little or no adjustment. Notably, this pattern is
similar for synthetic CDOs, which typically do not have cash flow analysis. This suggests that the
CRA is likely making adjustments for reasons other than relying on secondary tranche-specific
analytics.
In Figure 4 we further examine this relation by sorting each type of CDO into five groups
based on the amount of AAA specified by the CRA model. In the quintile where the model yields
the lowest amount of AAA, they receive a 26.8% adjustment on average, and the AAA tranche size
is 69.4%. In the top quintile of the CRA model, the model yields an 85.3% AAA and there is a
negative 0.4% adjustment. CDO2s in the lowest quintile would have only received 29.2% AAA
without the additional 47.0% adjustment enabling a total AAA rated fraction 76.1% of the CDO. In
most of the CDO type groups, there is an almost monotonic decrease in the amount of AAA issued
as the CRA model AAA becomes larger.
This can be consistent with a Bayesian approach.18 The CRA model average AAA size is
0.634 with a standard deviation of 0.156 (the ―data‖), and the actual deal average AAA size is 0.755
with a standard deviation of 0.114 (the ―posterior‖). If we assume truncated normal distributions
(between 0 and 1), then we can back out the prior distribution and find it has a mean AAA of 0.820
and a standard deviation of 0.121. Since the quality of each deal is determined by the collateral asset
pool, it is unclear why it would be optimal for a rating agency to allocate a strong weight towards a
prior deal structure. Investment banks may target a high fraction of AAA to make the deal economic.
As the underwriter presets the deal structure, it is possible that the prior reflects the underwriter‘s
18 We thank the referee for this insight.

17
target structure. In this scenario the Bayesian approach would capture the melding of the investment
bank‘s prior and the credit rating agency‘s empirical standards.
In summary, we are unable to explain adjustments with variables that rating agencies report
to be important considerations. The most systematic feature we find, both economically and
statistically, is that CDOs with low initial amounts of AAA receive large adjustments.
IV. Adjustments and Downgrades
In this section, we examine the efficacy of the credit rating agency adjustment to increase
CDO rating accuracy. Rating changes can be caused by unpredictable market developments, or
inaccurate initial rating assessments. If adjustments are made for beneficial reasons, then we expect
CDOs with larger upward adjustments at the time of rating to receive fewer (or at least no more)
downgrades. We analyze the predictive power of the adjustment at the time of CDO issuance for
future downgrades up until June 30, 2010.
Table IV uses an ordered logit model to predict downgrades. We include type variables in all
specifications since defaults are much worse in ABS, CDOs, and CDO2s. Specification 1 shows that
the adjustment is a significantly positive predictor of downgrading. AAA tranches with larger
adjustments are more likely to be downgraded. The odds ratios on the adjustment range from 6.5 in
specification (5) with the full set of control variables, to 20.5 in specification (1) controlling only for
CDO type. The adjustment has stronger predictive power for downgrading magnitude than the 2006
and 2007 vintages which have odds ratios of 4.6 and 4.3 as shown by specification (3).
Downgrades are much more likely for securities issued in 2006 and 2007. This might be due
to the quality of the collateral in these CDOs or because CDOs were given larger adjustments in
later years. Nevertheless, even after controlling for the year of CDO issue as a dummy variable

18
(specification 3), the adjustment remains highly significant. We include the subjective features of the
CDO such as the number of deals by the manager, overcollateralization, insurance, and liquidity in
specification (4). Interestingly, CDOs managed by more experienced (or potentially more
aggressive/overconfident) managers and CDOs with insurance have a greater probability of
downgrading. Since adjustments may be made in anticipation of future excess spread, we include
excess spread for the smaller sample, but find that this does not affect the importance of AAA
adjustments on future downgrading.
Because of potential advantages of hazard models such as the ability to control for the
length of period at risk, we follow Shumway (2001) and Bharath and Shumway (2008), and use a
proportional hazard model to examine the relation between adjustments and the likelihood of AAA
security downgrading. In Table V we find that a one unit movement in AAA adjustment leads to a
tranche that is 2.5 times (e0.931) more likely to be downgraded by June 30, 2010 even after controlling
for CDO type and vintage effects (in Specification (3)). The effect remains significant after year
dummy variables and further controls, indicating that CDOs that received larger adjustments bear
more hazard of being downgraded.
We estimate our original ordered logit regressions by type (in Panel A of Table IA.VII) and
find that AAA adjustments are related to future downgrades in CLOs, ABS CDOs, and synthetic
CDOs, and weakly related to future downgrades in CBOs. Interestingly, the 2007 vintage effect on
downgrading is only significant within the ABS CDOs. In Internet Appendix Table IA.IX and Table
IA.X, we also examine downgrading for a smaller sample that has the first surveillance data within
six-months or one year of the CDO closing. For our main ordered logit specifications we find
adjustments strongly related to future downgrading in both the six-month and one-year sample. The
hazard model results are insignificant in some specifications with the full set of controls for the six-

19
month sample (Panel A of Table IA.VX), but significant with the larger one-year sample (Panel B).
Many other downgrading regression results are presented in Tables IA.IV to IA.XI.
What would have been the effect on default if the credit rating agency did not make the
adjustment? We are able to collect asset default data as of March 2009 for a set of 791 CDOs. 234
CDOs had collateral impairment ratios higher than the AAA subordination, indicating that these
AAA tranches would likely experience the event of default. Had the rating agency structured the
CDOs at the model subordination ratio, 182 would have had impairment ratios exceeding model
subordination. Hence, 52 or 22.2% of those 234 CDOs were directly affected by the adjustment as
of March 2009. Since losses often accrue with a lag, our analysis here is limited by the fact that we
are unable to collect default data after March 2009.
V. Criterion Deviation
Our analysis thus far does not analyze the validity of credit rating agency assumptions, which
are the inputs of its model. In this section we focus on the most straightforward model input: the
default probability criterion or CDOs presumed credit risk.
A. Rating Default Probability Criterion
Recall from Section I.B. that the default probability criterion is the maximum default
probability allowed under a particular rating and maturity as shown in Table IA.I. In our database we
have the actual default probability criterion reported for each CDO at each rating level. In order to
examine the default probability criterion, we construct a ―criterion deviation‖ defined as actual
criterion minus publicized criterion (as shown in Table IA.I) with the same maturity. A zero
deviation is rating at the edge, and a positive deviation represents a default threshold that is not as

20
strict as the publicized criterion. If the credit rating agency meets its publicized standards, it should
never be the case that the actual default criterion is higher than that publicized.
Panel A of Figure 5 plots the time series of the criterion deviation for the AAA rating with
CDO closing dates from January 1997 to December 2007. Although we will later map those
deviations to rating magnitudes, we do not report the values to keep the identity of the CRA
anonymous. Only three CDOs appear to meet the criteria prior to 2007 and the rest of the
deviations are positive, meaning that the riskiness of the ‗AAA‘ tranche is higher than the publicized
criterion. Beginning in roughly April 2007, the deviations largely disappear. Panel B of Figure 5
zooms in on 2007 and shows that there are relatively few deviations after April 1, 2007.19
It is important to note that the criterion deviation in Figure 5 is an approximation, since it is
not adjusted by differences in maturity. In Figure 6 we plot all actual AAA default probability
criterion against maturity and see that the publicized criteria are smoothly distributed on a convex
curve as expected. CDOs issued prior to April 2007 are shown as a light yellow triangle. Before
April 1, 2007, most of the actual default criteria lie on another distinctive curve, seemingly related to
the shape of the publicized criteria but to the left meaning that the default criteria are higher than
the publicized criteria. CDOs with initial surveillance reports after April 1, 2007 are in dark purple
squares and mostly overlap with publicized criteria. We also plot dashed and dotted lines for the
publicized criteria of the AA+ rating and AA rating. Most CDOs with AAA ratings only meet the
AA rating criterion (between AA and AA+ publicized criterion lines).
We notice one additional, less prominent but clear, irregularity: there are 27 CDOs, which
seem to form a straight line, independent of the maturity. Upon further investigation we notice that
19 Differences in the length of time between when the deal was preliminarily rated and when the first surveillance report
data appears can vary considerably and could potentially explain why a few CDOs issued after April 2007 continue to
look similar to CDO reports prior to April.

21
for those CDOs, not only are their default probability criteria constant and identical, but their
scenario default rates are exactly identical for each of the 19 rating scales from AAA to CCC-. This
is only possible if the CDOs have the exact same portfolio loss distribution, which would seem
improbable given that the CDO features differ considerably as discussed in Internet Appendix C.
Thus far, we have focused on a comparison of actual AAA default probabilities relative to
publicized AAA default standards. We now compare the standards across all rating levels. To fully
characterize this ―criterion deviation‖ finding, we re-assign credit ratings for each tranche
corresponding to the actual default criterion used for CDOs in our sample. The results for all CDOs
are summarized in Table VI before April 1, 2007 (Panel A) and after (Panel B). For CDOs issued
before April 1, 2007, Panel A shows that 1.3% of AAAs comply with the publicized AAA criterion,
4.8% comply with the publicized AA+ criterion, and 92.5% comply with the publicized AA criterion.
The results are similar for AA+ to A-. Then a dramatic change occurs when 96.5% of the BBB
actual default probabilities match publicized default probabilities for CDOs issued before April 1,
2007. Panel B shows that for CDOs issued after April 1, 2007, the compliance rates (actual default
probability meeting publicized default probability criterion) are above 90% for all ratings.
To gauge the economic importance of the default criterion deviation in a comparable scale
we ask how much more AAA the lower criterion allows. We find that using the publicized AAA
default standard amounts to an increase in SDR (and hence less allowable AAA) of 2.7%. First,
while 2.7% seems small, this reduction in the scenario default rate (SDR) could be critical in practice
when the only condition for granting a rating is that the breakeven default rate (BDR) must be
greater than the SDR. Second, the magnitude of the deviation might be important for a CDO that
was structured with a break-even default rate within striking distance of the SDR, the so-called
―rating at the edge‖ practice. Third, the lower tranches are notoriously hard to place. Examining 2.7%

22
as a fraction of the total CDO is in some sense misleading. For our sample, on average 90.7% of the
issuance is above BBB and 9.3% is rated BBB or below, or unrated. Shifting 2.7% of the CDO from
below BBB to investment grade means that instead of having 12.1% of the CDO to place there is
only 9.3% of non-investment grade debt—that is 22% less of hard-to-place debt.20
B. Potential Explanations
One possibility for the criterion shift in April 1, 2007 is that the criterion used by the rating
agency was indeed different, but we only observe the most recent publicized criterion. We first track
the CRA‘s default probability criterion updates. The CRA‘s documentation, including public news
releases, research reports, and presentation slides at conferences and training sessions, confirms the
record of publicized criterion for CDOs as shown in Table IA.I at least back to 2002.
As our analysis has been from the first surveillance report after the CDO issuance, we now
examine the criteria used by the CRA after April 1, 2007 in continuing surveillance reports. In Figure
7 we label the CDOs by whether their date of issuance is before April 1, 2007 (yellow triangles) or
after April 1, 2007 (purple squares). During the eighteen months from April 2007 to September
2008 (when this data stops), there are two main default probability criteria actually used by the CRA
for AAA ratings. CDOs issued after April 1, 2007 (the purple squares) follow the publicized lower
default probability criterion strictly. But all of the CDOs issued prior to April 2007 continue to use
the same default probability criterion demonstrated at the time of issue (in Figure 6). It is not clear
how a CRA model can use two different CDO standards simultaneously.
Importantly, there is no disclosure of changing CDO modeling methods or varying
standards in any of the credit rating agency websites regarding CDOs around April 2007 that we can
locate in our extensive searches. However, there was some documented tightening of standards for
MBS securities and the decline in ABX.HE (an index of CDOs backed by home-equity loans)
20 This might mean one fewer buyer. We thank an anonymous industry expert for brining this issue to our attention.

23
beginning in January 2007. A most notable quote on March 3, 2007 states that, ―the legs that power
the CDO machine for the last three years have fallen off.‖ On April 17, 2007 the managing director
of S&P RMBS testified before a senate banking subcommittee. More details on surrounding credit
market conditions are provided in Internet Appendix D and in Figure IA.6.
VI. Replicating Credit Rating Agency Modeling and Measuring Economic Value
A. Simulation Approach to CDO Valuation
How close can we replicate the credit rating agency model? There are several reasons why
answering this question is useful. First, it helps us to discover if the CDO modeling process is
standard and if there are large structural shifts. Second, it allows us to semi-validate the CDO
modeling process. Third, the replication is useful for examining valuation differences.
We use the Gaussian Copula Monte Carlo simulation model as it is the most widely used by
professionals. All of the average inputs are available in the credit rating agency database except for
recovery rates, which we assume to be 40% for all CDOs.21 It is important to recognize that our
approach here is not subject to questions regarding key assumptions since we use the actual stated
rating agencies assumptions for key standards except for recovery rates. We estimate our simulation
with average CDO characteristics (collateral rating and asset correlation) used by the CRA, rather
than specific underlying collateral details. However, CRAs often (at least preliminarily) rate before
detailed information is available.
We calculate the AAA fraction (1−SDRAAA) from our Monte Carlo simulation as compared
to the output from the CRA and find that, cross-sectionally, the two models have a correlation of
0.82. The high correlations, despite the simplicity of our model, suggest that the CRA approach
21 A 40% recovery rate is common practice for both empirical research and CDS traders. These recovery rates refer to collateral asset recovery rates. The tranche notes recovery rates are endogenously generated in the simulations.
24
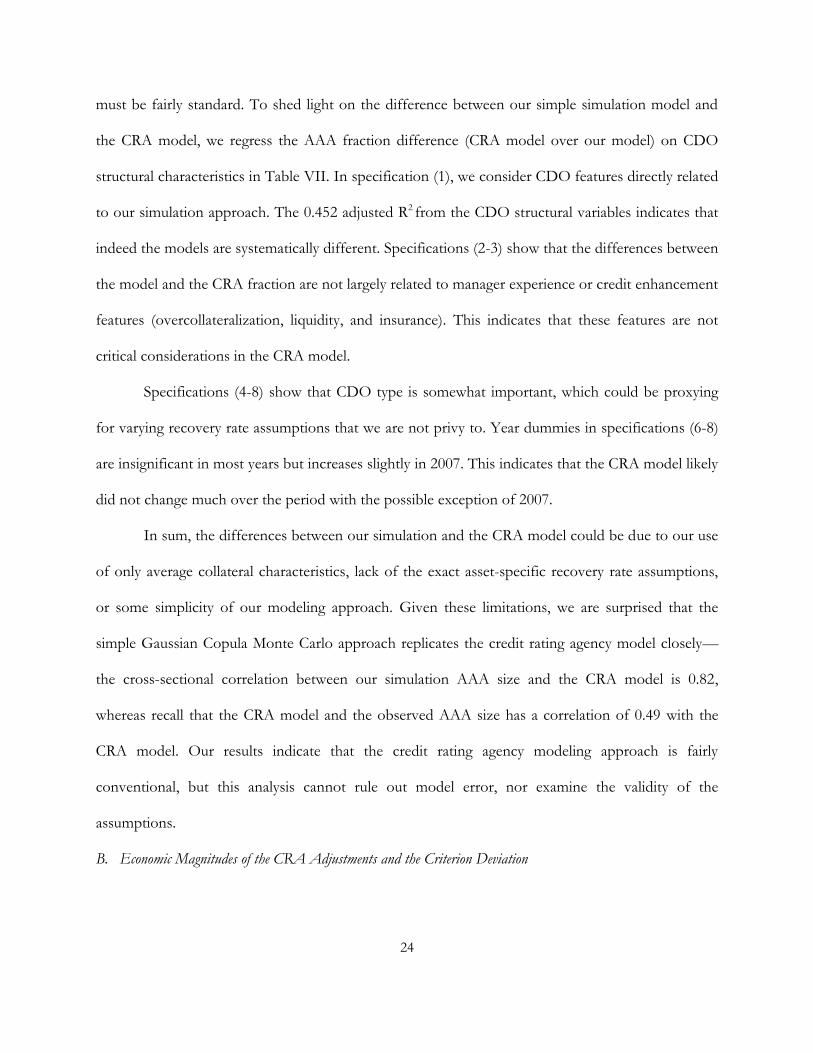
must be fairly standard. To shed light on the difference between our simple simulation model and
the CRA model, we regress the AAA fraction difference (CRA model over our model) on CDO
structural characteristics in Table VII. In specification (1), we consider CDO features directly related
to our simulation approach. The 0.452 adjusted R2 from the CDO structural variables indicates that
indeed the models are systematically different. Specifications (2-3) show that the differences between
the model and the CRA fraction are not largely related to manager experience or credit enhancement
features (overcollateralization, liquidity, and insurance). This indicates that these features are not
critical considerations in the CRA model.
Specifications (4-8) show that CDO type is somewhat important, which could be proxying
for varying recovery rate assumptions that we are not privy to. Year dummies in specifications (6-8)
are insignificant in most years but increases slightly in 2007. This indicates that the CRA model likely
did not change much over the period with the possible exception of 2007.
In sum, the differences between our simulation and the CRA model could be due to our use
of only average collateral characteristics, lack of the exact asset-specific recovery rate assumptions,
or some simplicity of our modeling approach. Given these limitations, we are surprised that the
simple Gaussian Copula Monte Carlo approach replicates the credit rating agency model closely—
the cross-sectional correlation between our simulation AAA size and the CRA model is 0.82,
whereas recall that the CRA model and the observed AAA size has a correlation of 0.49 with the
CRA model. Our results indicate that the credit rating agency modeling approach is fairly
conventional, but this analysis cannot rule out model error, nor examine the validity of the
assumptions.
B. Economic Magnitudes of the CRA Adjustments and the Criterion Deviation

25
To gain a sense of the economic importance of the AAA CRA adjustment and the criterion
deviation, we perform several suggestive valuation calculations. For most of our analysis we focus
only on the AAA class, which entails most of the valuation of the deal. We use three methods,
starting with the most conservative. The first method revalues the AAA tranches by asking what the
adjusted AAA tranche would have been worth had the CRA assigned ratings strictly according to its
credit risk model. If the CRA cut the AAA tranche above the level justified by the model (1-SDR),
we rerate only this additional portion of the tranche. Our second and third methods take the issued
sizes of the AAA tranches as fixed (as they were sold) but assign ratings on them using our simple
simulation model. For the second method, if the CDO has multiple AAA tranches, we distinguish
the senior (and super senior) AAA tranche from the junior AAA tranche so that cutting the CDO at
the stated default levels (without an adjustment) may only affect the rating of the lowest AAA
tranche. The third method is similar to the second in that it also rerates the CDO, but it treats all
AAA tranches as a whole and rerates the entire AAA tranche. For each method we calculate the
effect of the adjustment with and without the criterion deviation.
To illustrate the first method, assume for a hypothetical deal that the actual AAA size is 80%,
but the model implied AAA size is only 70% (because of a SDRAAA of 30%); then we rerate the
additional 10% by mapping the rating corresponding to the 20% SDR cutoff in the CRA model
outputs, which contain the complete list of SDRs for all rating scales. If the SDR for a BBB rating is
20%, then the additional 10% (80%-70%) is assigned a BBB rating. Subsequently, we revalue the
additional 10% of capital by the spread difference between what it was rated at AAA and BBB.
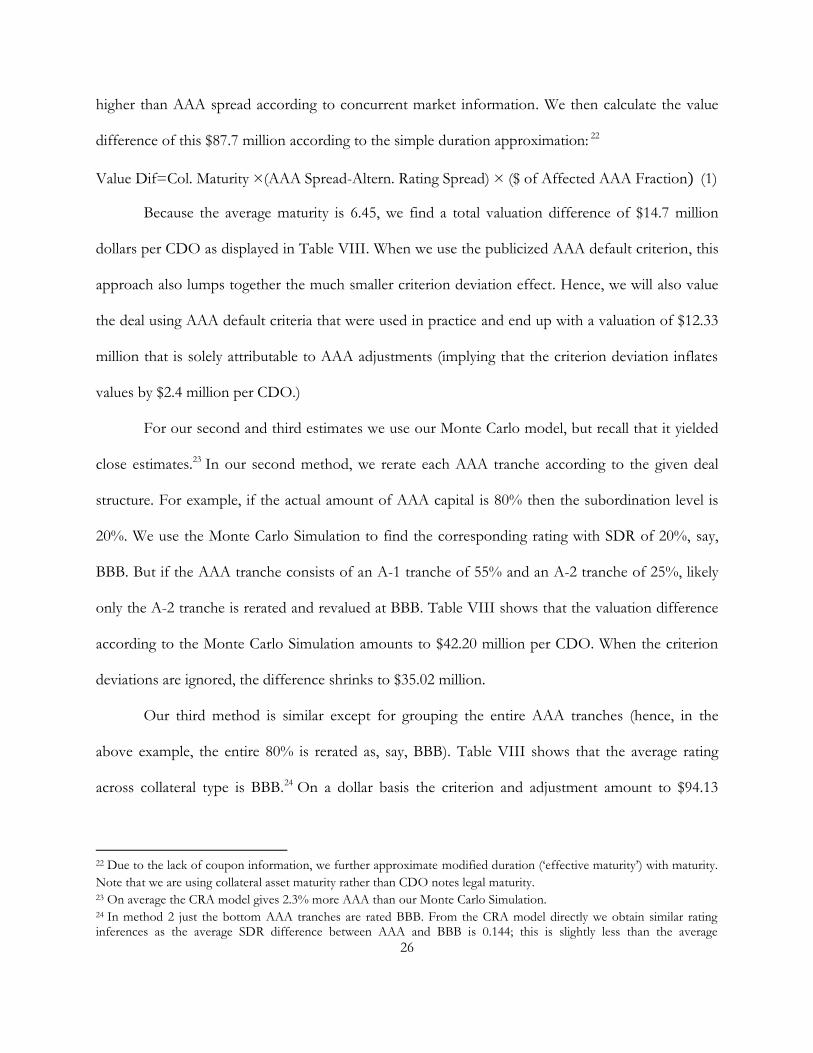
For the first method, we find that if CRAs would have cut the AAA rating at the model-
implied level without the 12.1 percent adjustment, there would be an average of $87.7 million per
CDO that needs to be rerated. This $87.7 million would demand an average spread 2.2 percent
26
higher than AAA spread according to concurrent market information. We then calculate the value
difference of this $87.7 million according to the simple duration approximation: 22
Value Dif Col. Maturity (AAA Spread-Altern. Rating Spread) ( of Affected AAA Fraction (1)
Because the average maturity is 6.45, we find a total valuation difference of $14.7 million
dollars per CDO as displayed in Table VIII. When we use the publicized AAA default criterion, this
approach also lumps together the much smaller criterion deviation effect. Hence, we will also value
the deal using AAA default criteria that were used in practice and end up with a valuation of $12.33
million that is solely attributable to AAA adjustments (implying that the criterion deviation inflates
values by $2.4 million per CDO.)
For our second and third estimates we use our Monte Carlo model, but recall that it yielded
close estimates.23 In our second method, we rerate each AAA tranche according to the given deal
structure. For example, if the actual amount of AAA capital is 80% then the subordination level is
20%. We use the Monte Carlo Simulation to find the corresponding rating with SDR of 20%, say,
BBB. But if the AAA tranche consists of an A-1 tranche of 55% and an A-2 tranche of 25%, likely
only the A-2 tranche is rerated and revalued at BBB. Table VIII shows that the valuation difference
according to the Monte Carlo Simulation amounts to $42.20 million per CDO. When the criterion
deviations are ignored, the difference shrinks to $35.02 million.
Our third method is similar except for grouping the entire AAA tranches (hence, in the
above example, the entire 80% is rerated as, say, BBB). Table VIII shows that the average rating
across collateral type is BBB.24 On a dollar basis the criterion and adjustment amount to $94.13
22 Due to the lack of coupon information, we further approximate modified duration (‗effective maturity‘) with maturity.
Note that we are using collateral asset maturity rather than CDO notes legal maturity. 23 On average the CRA model gives 2.3% more AAA than our Monte Carlo Simulation. 24 In method 2 just the bottom AAA tranches are rated BBB. From the CRA model directly we obtain similar rating inferences as the average SDR difference between AAA and BBB is 0.144; this is slightly less than the average

27
million in value inflation per CDO, 20.1 percent of the AAA CDO value, and $86.22 billion for our
sample of 916 CDOs. When we use actual default criterion instead of the stated criterion valuation
difference drops to $78.91 million per CDO.25 As with the other methods, the valuation differentials
are largest in the ABS CDOs.
Since valuations differ widely between the first method and the latter two methods, we
briefly discuss their differences. The first method asks how much value the adjustment and criterion
deviation added to the transaction from the perspective of the investment bank structuring the deal.
The last two methods are similar to asking what the valuation impact was to investors who bought
the AAA tranches (as they were sold) if they were in fact rated BBB. The rationale for grouping
AAA tranches as a whole in method three is that credit enhancement from overcollaterization and
interest coverage tests are generally only implemented at a class level (instead of a tranche level).
Hence, a senior AAA and a junior AAA can have similar protection. Interestingly, from the
perspective of the investment bank, even the first method estimate of $14.7 million is quite
important. If these underwriting fees are 1.25% to 1.5% of the asset size,26 then the fees would be
$7.9 to $9.5 million per CDO for our sample (with average deal size of $634 million). This rating
inflation allows the structure to receive interest payments more than their payouts, which is crucial
for the economics of CDOs (Coval, Jurek, and Stafford (2009b)).
Overall, these suggestive estimates, while substantial, are likely understatements. For
example, moving massive amounts of capital to BBB would surely increase BBB spread differentials
as the demand was primarily for AAA. Additionally, we do not consider the important effects of
adjustment of 0.121 plus the criterion deviation of 0.027. The average downgrading is about 6 notches in our AAA rated notes. 25 In Internet Appendix Table IA.XVI we more extensively examine the criterion deviation on its own and across all tranches. Consistent with our conjecture, we find that most of the valuation effects are captured in the AAA tranche. 26 Additional rating fees from two rating agencies are about 0.2% or $1.3 million per CDO. http://noir.bloomberg.com/apps/news?pid=newsarchive&sid=ajs7BqG4_X8I, http://www.bloomberg.com/apps/news?pid=newsarchive&sid=a.FcDwf1.ZG4&refer=us.

28
systematic default risk and parameter uncertainty as described in Coval, Jurek, and Stafford (2009a,
2009b). Like Coval, Jurek, and Stafford, we provide another metric that indicates AAA tranches
were massively overpriced. Our analysis can also shed light on the CDO market going forward.
After controlling for other factors such as collateral characteristics, CDOs‘ AAA fractions would
need to be much smaller, and deals will be considerably less profitable. Indeed, CDO issuance has
shrunk from $520.6 billion in 2006 and $481.6 billion in 2007 to $61.9 billion in 2008 and $4.3
billion in 2009 according to SIFMA.
VII. Summary and Concluding Remarks
This paper examines subjectivity in CDO credit ratings by focusing on what happens beyond
a credit rating agency‘s direct quantitative model. Using data on 916 CDOs issued from 1997 to
2007, we find that the actual size of the AAA tranche exhibits a correlation of only 0.49 with the size
from the CRA model, indicating that this modeling process is only part of the picture. ‗Adjustments‘
to the rating agency credit risk model are positive, amounting to an additional 12.1% AAA for the
average CDO. Adjustments are not explained by likely candidates such as manager experience or
credit enhancements. CDOs with lower proportions of AAA implied by the CRA model received
higher adjustments. Adjustments are positive predictors of future 2008-2010 downgrades—they
were not helpful in practice.
Additionally, in examining default risk criteria, we document an empirical irregularity distinct
from the adjustment. The AAA default risk criterion prior to April 2007 is typically a full rating
lower than the stated default risk rating criterion. Thereafter, the CRA switched to the stated criteria
for most of the newly issued CDOs. Nevertheless, even after April 2007, CDOs issued prior to
April 2007 kept the old criterion, such that there were two default probability criteria in place

29
simultaneously. Even using the most conservative calculations, the valuation impact of adjustments
and using the publicized default criteria were greater than structuring and rating fees and hence
could explain the push for underwriters to securitize $1.7 trillion CDOs between 2000 and 2007.
Our results have important implications for investors and regulators in determining the
proper role of credit rating agencies.27 First, there has been a recent movement to blame modeling
and modelers, and to make the rating process more qualitative and less quantitative.28 Our findings
suggest that this step would be in the wrong direction. Second, even after the crisis, rating agencies
are careful not to disclose all the details for how they rated past or current deals. It would seem
sensible to make data on key inputs, outputs, and the rating modeling process more—not less—
transparent. The modeling box could then be opened and debated. Third, upward adjustments
should not be allowed unless the model is flawed or incomplete, and in which case the model itself
should be modified.
While we help answer part of the question, it is important to note that our study is not
meant to be interpreted as a comprehensive analysis of what caused CDOs to fail so quickly. In
addition to the factors in this paper, we find it quite likely that other effects are jointly at work and
hope to see more research on CDO credit ratings. Our findings also suggest that perhaps
researchers should more carefully examine the claims of Akerlof and Romer (1993) (emphasized
recently by Akerlof and Shiller (2009)) regarding linkages between financial sophistry and financial
crises. The causes for the failure of the shadow banking system may be deeper than an exogenous
banking sunspot.
27
Partnoy (2009b) and Coffee (2010) discuss proposals for credit rating agency reform. 28 In a recent overview of proposed rating changes, in one of the two main bullet points S&P (2009) states: ―We are proposing to put greater emphasis on qualitative analysis in our overall rating process.‖ Similarly, Moody‘s (2009) states: ―The results generated by rating models are one of many inputs to the rating process. Ratings are determined collectively through the exercise of judgment by rating committees, which evaluate many quantitative and qualitative factors.‖

30
References Akerlof, George A., and Paul M. Romer, 1993, Looting: The economic underworld of bankruptcy
for profit, Brookings Papers on Economic Activity 2, 1-73. Akerlof, George A., and Robert J. Shiller, 2009, Animal Spirits, Princeton University Press. An, Xudong, Yongheng Deng and Anthony B. Sanders, 2008, Subordination levels in structured
financing. In Arnoud Boot and Anjan Thakor (eds.) Corporate Finance, Volume 3: Financial Intermediation and Banking. Elsevier.
Andrews, Donald, 1993, Tests for parameter instability and structural change with unknown change
point, Econometrica 61, 821-856. Ashcraft, Adam B., Paul Goldsmith-Pinkham, and James Vickery, 2009, MBS ratings and the
mortgage credit boom, Working paper, Federal Reserve Bank of New York. Barnett-Hart, Anna Katherine, 2009, The story of the CDO market meltdown: An empirical analysis,
Harvard College: BA dissertation. Ben-David, Itzhak, 2009, Manipulation of collateral values by borrowers and intermediaries,
Working paper, Ohio State University. Benmelech, Efraim, and Jennifer Dlugosz, 2009a, The alchemy of CDO credit ratings, Journal of
Monetary Economics 56, 617-634. Benmelech, Efraim, and Jennifer Dlugosz, 2009b, The credit rating crisis, NBER Macro Annual, Vol.
24, 161‐207. Bharath, Sreedhar, and Tyler Shumway, 2008, Forecasting default with the Merton distance-to-
default model, Review of Financial Studies 21, 1339-1369. Bongaerts, Dion, Martijn Cremers, and William N. Goetzmann, 2009, Multiple ratings and credit
spreads, Working paper, Yale School of Management. Blume, Marshall E., Felix Lim, and Craig MacKinlay, 1998, The declining credit quality of U.S.
corporate debt: Myth or reality? The Journal of Finance 53, 1389-1413. Bolton, Patrick, Xavier Freixas, and Joel D. Shapiro, 2009, The credit ratings game, NBER Working
paper No. 14712. Brunnermeier, Markus, 2009, Deciphering the liquidity and credit crunch 2007-2008, Journal of
Economic Perspectives 23, 77-100. Cheng, Mei, and Monica Neamtiu, 2009, An empirical analysis of changes in credit rating properties:
Timeliness, accuracy and volatility, Journal of Accounting and Economics 47, 108-130.

31
Coffee, John C. Jr., 2010, Ratings reform: The good, the bad, and the ugly, Working paper,
Columbia University Law School. Coval, Joshua D., Jakub W. Jurek, and Erik Stafford, 2009a, Economic catastrophe bonds, American
Economic Review 99, 628-666. Coval, Joshua D., Jakub W. Jurek, and Erik Stafford, 2009b, The economics of structured finance,
Journal of Economic Perspectives 23, 3-25. Damiano, Ettore, Hao Li, and Wing Suen, 2008, Credible ratings, Theoretical Economics 3, 325-365. Deng, Yongheng, Stuart A. Gabriel, and Anthony B. Sanders, 2009, CDO market implosion and the
pricing of subprime mortgage-backed securities, Working paper, George Mason University. Duffie, Darrell, and Nicolae Garleanu, 2001, Risk and valuation of collateralized debt obligations,
Financial Analysts Journal 57, 41-59. Duffie, Darrell, and Kenneth J. Singleton, 2003, Credit Risk: Pricing, Measurement, and Management,
Princeton University Press. Farhi, Emmanuel, Josh Lerner, and Jean Tirole, 2010, Fear of rejection? Tiered certification and
transparency, NBER Working paper No. 14457. Fitch Ratings, 2006, Global rating criteria for collateralized debt obligations. Gorton, Gary, and Andrew Metrick, 2009, The run on repo and the panic of 2007-2008, Working
paper, Yale School of Management. He, Jie, Jun Qian, and Philip E. Strahan, 2010, Credit ratings and the evolution of the mortgage-
backed securities market, Working paper, Boston College. John, Kose, S. Abraham Ravid, and Natalia Reisel, 2010, The notching rule for subordinated debt
and the information content of debt rating, Financial Management 39, 489-513. Jorion, Philippe, Charles Shi, and Sanjian Zhang, 2009, Tightening credit standards: The role of
accounting quality, Review of Accounting Studies 14, 123-160. Keys, Benjamin J., Tanmoy Mukherjee, Amit Seru, Vikrant Vig, 2010, Did securitization lead to lax
screening? Evidence from subprime loans 2001-2006, Quarterly Journal of Economics 125, 307-362. Kraft, Pepa, 2010, The impact of the contractual use of ratings on the rating process – evidence
from rating agency adjustments, Working paper, University of Chicago. Longstaff, Francis A., 2010, The subprime credit crisis and contagion in financial markets, Journal of
Financial Economics 97, 436-450.

32
Longstaff, Francis A., and Brett Myers, 2009, How does the market value toxic assets? Working
paper, University of California, Los Angeles. Longstaff, Francis A., and Arvind Rajan, 2008, An empirical analysis of the pricing of collateralized
debt obligations, Journal of Finance 63, 529-563. Mason, Joseph R., and Joshua Rosner, 2007, Where did the risk go? How misapplied bond ratings
cause mortgage backed securities and collateralized debt obligation market disruptions, Working paper, Drexel University.
Mathis, Jerome, James McAndrews, and Jean-Charles Rochet, 2009, Rating the raters: Are reputation
concerns powerful enough to discipline rating agencies? Journal of Monetary Economics 56, 657-674.
Merton, Robert C., 1974, On the pricing of corporate debt: The risk structure of interest rates, The
Journal of Finance 29, 449-470. Mian, Atif, and Amir Sufi, 2009, The consequences of mortgage credit expansion: Evidence from
the 2007 mortgage default crisis, Quarterly Journal of Economics 124, 1449-1496. Moody‘s Investor Service, 1998, The double binomial method and its application to a special case of
CBO structures, Moody‘s Special Report. Moody‘s Investors Service, 2003, Moody‘s approach to rating CDOs. Moody‘s Investors Service, 2009, V scores and parameter sensitivities in the global corporate
synthetic CDO sector, Structured Finance Rating Methodology, April 29, 2009. Opp, Christian C., Marcus M. Opp, and Milton Harris, 2010, Rating agencies in the face of
regulation: Rating inflation and regulatory arbitrage, Working paper, Chicago Booth and Berkeley Haas.
Parlour, Christine, and Guillaume Plantin, 2008, Loan sales and relationship banking, Journal of
Finance 63, 1291-1314. Partnoy, Frank, 2009a, Overdependence on credit ratings was a primary cause of the crisis, Working
paper, University of San Diego School of Law. Partnoy, Frank, 2009b, Rethinking regulation of credit rating agencies: An institutional investor
perspective, Working paper, University of San Diego School of Law. Partnoy, Frank, 2010, Historical perspectives on the financial crisis: Ivar Kreuger, the credit-rating
agencies, and two theories about the function, and dysfunction, of markets, Yale Journal on Regulation 26, 431-443.

33
Rajan, Uday, Amit Seru, and Vikrant Vig, 2010, The failure of models that predict failure: Distance, incentives and default, Working paper, University of Chicago.
Rutledge, Ann, and Sylvain Raynes, 2003, The analysis of structured securities: Precise risk
measurement and capital allocation, Oxford University Press. Rutledge, Ann, and Sylvain Raynes, 2010, Elements of structured finance, Oxford University Press. Sanders, Anthony, 2009, A primer of CDO valuation, Working paper, George Mason University. Sangiorgi, Francesco, and Chester Spatt, 2010, Equilibrium credit ratings and policy, Working paper,
Carnegie Mellon University. SEC, 2008, Summary report of issues identified in the commission staff‘s examinations of select
credit rating agencies, Mimeo, U.S Security and Exchange Commission. Shivdasani, Anil, and Yihui Wang, 2009, Did structured credit fuel the LBO boom?, Working paper,
UNC-Chapel Hill. Shumway, Tyler, 2001, Forecasting bankruptcy more accurately: a simple hazard model, Journal of
Business 71, 101-124 Skreta, Vasiliki, and Laura Veldkamp, 2009, Rating shopping and asset complexity: A theory of
rating inflation, Journal of Monetary Economics 56, 678-695. Standard and Poor‘s, 2002, Global cash flow and synthetic CDO criteria. Standard and Poor‘s, 2009, Summary and highlights of proposed changes to our global rating
methodology for corporate cash flow and synthetic CDOs. Stanton, Richard, and Nancy Wallace, 2010, CMBS subordination, ratings inflation, and the crisis of
2007-2009, NBER Working Paper 16206. Stulz, René M., 2008, Risk management failures: What are they and when do they happen? Journal of
Applied Corporate Finance 20, 58-67. Vasicek, Oldrich, 1987, Probability of loss on loan portfolio, Moody‘s KMV Corporation. White, Halbert, 1980, A heteroskedasticity-consistent covariance matrix estimator and a direct test
for heteroskedasticity, Econometrica 48, 817-838.

34
Panel A: CDO and Corporate Bond New-Issue Rating Distribution: 1997-2007
Panel B: Rating Distribution in June 2010 for Originally AAA Rated CDOs and Corporate Bonds
Figure 1. Credit Rating Distribution. The top figure (Panel A) plots the new-issue dollar value rating distribution for CDOs and corporate debentures issued between January 1997 and December 2007. The vertical axis is the issuance fraction in dollar value with the corresponding credit rating. „NIG‟ refers to non-investment grade (ratings below BBB-). The corporate debentures consist of 160,689 rated issues from global rated debt issues in the Fixed Income Securities Database (FISD). The CDO sample includes 5,466 rated tranches of 916 CDOs from a major credit rating agency. The bottom graph (Panel B) illustrates the dollar value rating distribution as of June 30, 2010 for all CDOs and corporate bonds with initial AAA rating (issued between 1997 and 2007, the AAAs from Panel A). „D‟ refers to default. „NR‟ refers to not rated; either the security has already matured, or the rating agency withdrew the rating prematurely.
84.08%
0.10%
5.46%
0.43% 0.30%3.45%
0.81% 0.16%3.08%
0.71% 1.41%
11.6%
0.6%
5.3% 7.8%
12.1% 10.6%6.4% 8.0% 7.6%
5.4%
24.6%
0%
10%
20%
30%
40%
50%
60%
70%
80%
90%
AAA AA+ AA AA- A+ A A- BBB+ BBB BBB- NIG
Issu
ance
Per
cen
tage
CDO Corporate
29.1%
3.0% 4.8%3.3% 3.2% 1.9%
0.6% 1.2% 0.9% 0.5%
45.2%
4.0%2.0%
76.2%
7.4%
0.7% 0.5% 1.6% 0.4% 0.3% 0.2% 0.1% 0.0% 0.0% 0.0%
12.8%
0%
10%
20%
30%
40%
50%
60%
70%
80%
90%
AAA AA+ AA AA- A+ A A- BBB+ BBB BBB- NIG D NR
Fin
al R
atin
g P
erce
nta
ge
CDO Corporate

35
Figure 2. Distribution of AAA Fraction from Credit Rating Agency Model and Actual AAA Fraction in the Capital Structure of the CDO. This figure reports the histograms of AAA fraction from the output of the credit rating agency model (gray bars) and the fraction of the CDO actually rated AAA (black bars). The sample includes 916 CDOs issued between January 1997 and December 2007. The test for differences in the distribution of AAA fraction across two groups is conducted by calculating the corrected Kolmogorov-Smirnov's D-statistic, with p-values of the test of <0.0001. The simple mean difference test between model AAA and actual AAA has a t-statistic of 25.93.
0
2
4
6
8
10
12
14
16
18
0.0 0.1 0.2 0.3 0.4 0.5 0.6 0.7 0.8 0.9 1.0
Fre
quen
cy (
%)
Model AAA Actual AAA

36
Figure 3. Credit Rating Agency Model Predicted AAA Fraction (x-axis) and Initial Adjustment (y-axis). This figure graphs AAA fraction from the credit rating agency model (defined as 1- SDRAAA) in first surveillance reports and the adjustment (difference between actual CDO fraction rated AAA and credit rating agency model AAA fraction). SDRAAA is the scenario default rate for AAA scenario directly from the rating agency model output. The sample includes 916 CDOs issued between January, 1997 and December, 2007.
-0.2
-0.1
0.0
0.1
0.2
0.3
0.4
0.5
0.6
0.7
0.8
0.0 0.1 0.2 0.3 0.4 0.5 0.6 0.7 0.8 0.9 1.0
Ad
just
men
t to
AA
A F
ract
ion
AAA Fraction from Credit Rating Agency Model
Cash CDO Synthetic CDO

37
Figure 4. Credit Rating Agency Model Predicted AAA Fraction and Initial Adjustment by Collateral Asset Type. This figure graphs the AAA fraction from the credit rating agency model (defined as 1-SDRAAA) in first surveillance reports and the adjustment (difference between actual CDO fraction rated AAA and credit rating agency model AAA fraction). The bottom bars are from the credit rating agency model‟s AAA fractions, and the top bars are adjustments. The total length of the bars is the actual AAA fraction. Data is divided into different collateral asset types (CBO, CLO, ABS CDO, CDO2). Within each CDO type, the data is further separated into five groups according to credit rating agency model AAA fraction, from low (group 1) to high (group 5). Empty bars represent negative adjustments. The sample includes 916 CDOs issued between January, 1997 and December, 2007.
2
0.0
0.2
0.4
0.6
0.8
1.0
All CBO CLO ABS CDO CDO
AA
A F
ract
ion
an
d A
dju
stm
ent
CRA1 (LOW) CRA2 CRA3 CRA4 CRA5 (HIGH)
CRA1-Adj CRA2-Adj CRA3-Adj CRA4-Adj CRA5-Adj

38
Panel A: 1997-2007
Panel B: Zoom in on 2007
Figure 5. Difference between Actual and Publicized Default Rate Criterion for CDO AAA Credit Rating in First Reports. This figure graphs the deviation in actual default rate criterion from the publicized default rate criterion for CDO AAA credit ratings across time. The deviation is defined as the difference between the actual criterion in the first credit rating agency surveillance
reports and the publicized criterion with the same maturity (actual−publicized). The magnitude of the deviation (y-axis) is not shown to keep the anonymity of the data source. The black horizontal line refers to zero deviation, and the black vertical line refers to April 1, 2007.
Jan-9
7
May
-98
Oct
-99
Feb
-01
Jul-
02
No
v-0
3
Mar
-05
Aug-
06
Dec
-07
Dev
iati
on
fro
m P
ub
liciz
ed C
rite
rio
n
Closing Date
Jan
-07
Mar
-07
Ap
r-07
Jun
-07
Aug-
07
Sep
-07
No
v-0
7
Dev
iati
on
fro
m P
ub
liciz
ed C
rite
rio
n
Closing Date
CBO CLO
ABS CDO²
0
0
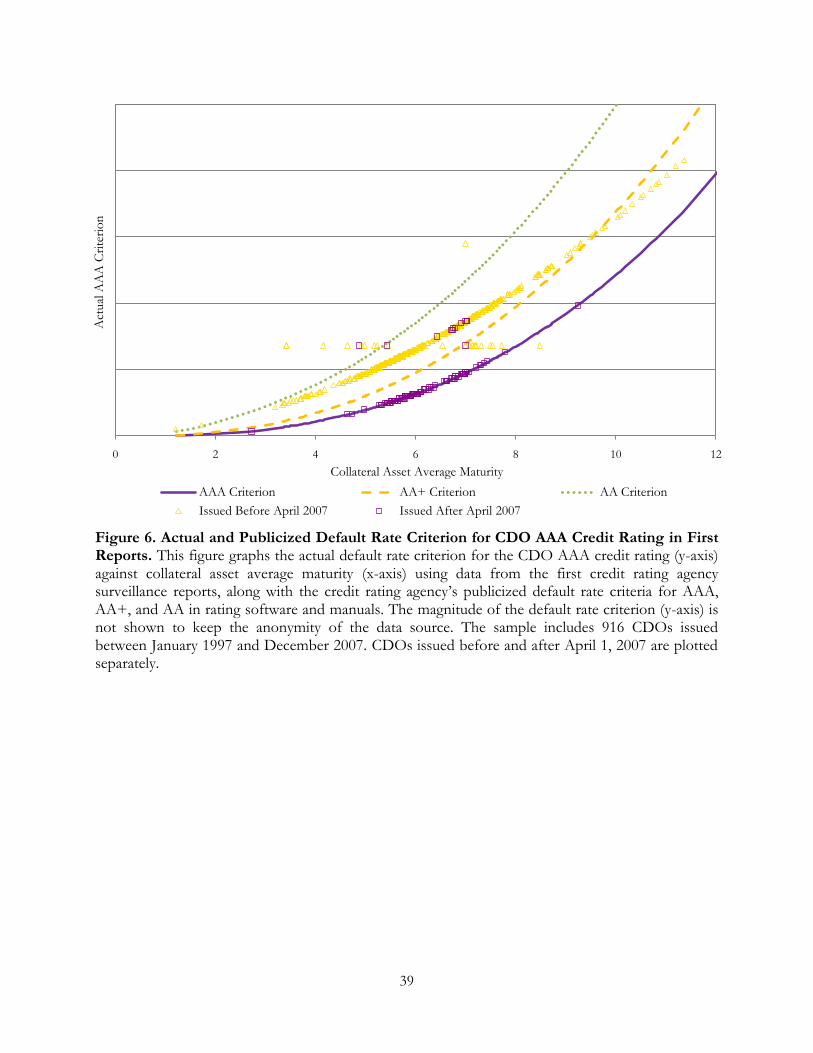
39
Figure 6. Actual and Publicized Default Rate Criterion for CDO AAA Credit Rating in First Reports. This figure graphs the actual default rate criterion for the CDO AAA credit rating (y-axis) against collateral asset average maturity (x-axis) using data from the first credit rating agency surveillance reports, along with the credit rating agency‟s publicized default rate criteria for AAA, AA+, and AA in rating software and manuals. The magnitude of the default rate criterion (y-axis) is not shown to keep the anonymity of the data source. The sample includes 916 CDOs issued between January 1997 and December 2007. CDOs issued before and after April 1, 2007 are plotted separately.
0 2 4 6 8 10 12
Act
ual
AA
A C
rite
rio
n
Collateral Asset Average Maturity
AAA Criterion AA+ Criterion AA Criterion
Issued Before April 2007 Issued After April 2007

40
Figure 7. Actual and Publicized Default Rate Criterion for CDO AAA Credit Rating in All Reports after April 1, 2007. This figure graphs the actual default rate criterion for the CDO AAA credit rating (y-axis) against collateral asset average maturity (x-axis) using data from all credit rating agency surveillance reports from April 1, 2007 to September 30, 2008, along with the credit rating agency‟s publicized default rate criteria for AAA, AA+, and AA in rating software and manuals. The magnitude of the default rate criterion (y-axis) is not shown to keep the anonymity of the data source. The sample includes 916 CDOs issued between January 1997 and December 2007. CDOs issued before and after April 1, 2007 are plotted separately.
0 2 4 6 8 10 12
Act
ual
AA
A C
rite
rio
n
CDO Average Asset Maturity
AAA Criterion AA+ Criterion AA Criterion
Issued Before April 2007 Issued After April 2007

41
Table I
CDO Sample Description
This table reports the average value of the collateral asset characteristics and liability structure for CDOs in
our sample. Data is from first credit rating agency surveillance reports after closing. CDOs are issued over the
period from January 1997 to December 2007. The last reporting date is September 2008. Data is grouped by
collateral asset type (CBO for collateralized bond obligations, CLO for collateralized loan obligations, ABS
CDO for CDOs of Asset-Backed Securities, and CDO2 for CDO of CDOs). Col. Rating is the collateral asset
average credit rating (average is calculated after numerical conversion AAA=1, AA+=2, AA=3, … C=21).
Col. Default Rate is the average expected collateral asset default rate in percentage. Col. Maturity is the collateral
asset weighted average maturity. Col. Size is the total principal value of collateral assets. #. Assets is the average
number of assets in the collateral pool. #. Obligors is the average number of distinctive obligors for the
collateral assets. Synthetic Dummy equals 1 if the CDO is structured synthetically (using credit default swap,
CDS, contracts) and 0 if the CDO is a cash deal. Mgr Deal #. is the average number of CDOs that the
collateral manager has managed including the current CDO. Overcollateralization is the ratio of total collateral
asset principal value over total liability principal value. Insurance Dummy equals 1 if the AAA tranche of the
CDO is insured, and 0 otherwise. CDO insurance could come in two forms. The first type is included in the
CDO structure so that the CDO pays the insurance premium out of asset receivables. In this case, insurance
premium payment is senior to AAA tranches. The second type is bought by CDO investors from the
secondary markets, and it is similar to a credit default swap. Only the first type of insurance matters to the
CDO ratings, as it is part of the structure (credit enhancement). Liquidity Dummy equals 1 if the CDO has
liquidity facility (such as a revolving credit line or reserve account), and 0 otherwise. AAA Fraction is the
fraction of the CDO liability rated AAA; it counts super-senior tranches as AAA rated.
CDO Type
Variables All CBO CLO ABS CDO CDO2
#. Obs. 916 96 393 373 54
Col. Rating BB+ BB- B+ A- BBB
Col. Default Rate (%) 2.69 3.83 4.32 0.86 1.47
Col. Maturity (Years) 6.45 5.30 5.74 7.23 8.32
Col. Size ($ millions) 634.3 394.4 479.3 865.9 589.4
#. Assets 218.3 139.2 325.9 144.7 84.02
#. Obligors 130.0 104.3 158.1 115.3 72.1
Synthetic Dummy 0.14 0.25 0.00 0.25 0.15
Mgr Deal #. 7.9 4.4 8.6 7.9 8.5
Overcollateralization 1.004 0.886 0.948 1.046 1.335
Insurance Dummy 0.061 0.188 0.043 0.048 0.056
Liquidity Dummy 0.235 0.469 0.112 0.284 0.370
AAA Fraction 0.755 0.728 0.726 0.798 0.715

42
Table II
CDO AAA Fraction: Actual, Credit Rating Agency Model, and Adjustment
This table reports the average value of the actual AAA fraction, CRA model predicted AAA fraction, and the
adjustment (difference between actual and CRA model) for CDOs in our sample. Data is from first CRA
CDO surveillance reports and the CDO rating databases. CDOs are issued over the period from January
1997 to December 2007. Actual AAA is the actual fraction of the CDO liability rated AAA, treating super
senior tranches as AAA. CRA Model AAA is the fraction of the CDO that can be rated AAA according to
the rating agency model, defined as 1-SDRAAA. CRA Adjustment is the difference between actual AAA fraction
and CRA model AAA fraction. Panel A displays the sample average value. Data is grouped by collateral asset
type (CBO for collateralized bond obligations, CLO for collateralized loan obligations, ABS CDO for CDOs
of Asset-Backed Securities, and CDO2 for CDOs of CDOs) from the first CRA surveillance reports. Panel B
displays the Pearson correlation matrix with t-statistics of the correlation coefficients in parentheses.
Panel A: Sample Average Value
Variables All CBO CLO ABS CDO CDO2
#. Obs. 916 96 393 373 54
Actual AAA 0.755 0.728 0.726 0.798 0.715
CRA Model AAA 0.634 0.625 0.566 0.717 0.568
CRA Adjustment 0.121 0.104 0.160 0.081 0.147
Positive/Total 770/916 75/96 384/393 263/373 48/54
CRA Adjustment ≤ 2002 0.107 0.106 0.127 0.066 0.127
Positive/Total 102/131 52/65 21/25 24/36 21/25
CRA Adjustment 2003-04 0.062 0.064 0.129 0.003 0.129
Positive/Total 118/155 3/4 67/69 42/74 67/69
CRA Adjustment 2005 0.097 -0.035 0.149 0.057 0.019
Positive/Total 136/156 1/2 73/73 55/73 7/8
CRA Adjustment 2006 0.128 0.091 0.154 0.101 0.128
Positive/Total 223/261 8/11 126/127 79/110 10/13
CRA Adjustment 2007 0.182 0.133 0.206 0.153 0.219
Positive/Total 194/213 11/14 98/99 65/80 20/20
Panel B: Pearson Correlations
Variables Actual AAA CRA Model AAA
CRA Model AAA 0.49 (14.09)
CRA Adjustment 0.27 (5.34) -0.71 (-16.34)

43
Table III
CRA AAA Fraction Adjustment and CDO Characteristics
This table shows the results of OLS regressions. The dependent variable is the CRA AAA fraction adjustment.
The adjustment is defined as the difference between actual AAA fraction and CRA Model predicted AAA
fraction explained in Table II. The independent variables are described in Table I except the following:
Vasicek AAA is the AAA fraction of the CDO predicted by the Vasicek model, Simulation AAA is the AAA
fraction predicted by a Monte Carlo simulation, Multiple CRA is a dummy variable with 1 for multiple rating
on the CDO, and 0 otherwise, Excess Spread is the ratio of average collateral coupon rate over average CDO
notes coupon rate, and BDR-SDR is the difference between break-even default rate (BDR) and scenario
default rate (SDR) in the presale or new issue reports. Data is from CRA CDO presale, new issue, and
surveillance reports, as well as CDO rating databases. CDOs are issued over the period from January 1997 to
December 2007. White (1980) heteroskedasticity-adjusted t-statistics are in the parentheses.
(1) (2) (3) (4) (5) (6) (7) (8) (9) (10)
Intercept 0.107 0.182 0.529 0.559 0.574 0.561 0.531 0.498 0.654 0.414
(13.23) (16.14) (38.03) (38.46) (41.93)
(35.26) (24.90) (22.81) (17.68) (10.61)
Log(Mgr Deal #.) 0.010 0.012 0.007 0.006 0.005 0.003 0.001 0.005
(2.21) (2.82) (2.44) (1.87) (1.60) (0.87) (0.34) (1.23)
Overcollateralization -0.079 -0.061 -0.061 -0.063 -0.063 -0.060 -0.097 -0.030
(-10.07) (-11.00) (-11.03) (-11.51) (-11.20) (-10.89) (-13.21) (-5.48)
Insurance Dummy 0.034 0.040 0.041 0.045 0.049 0.055 0.035
(1.83) (3.10) (3.17) (3.47) (3.79) (3.99) (1.69)
Liquidity Dummy -0.005 0.006 0.002 0.008 0.014 0.013 -0.002
(-0.43) (0.75) (0.20) (1.06) (1.84) (1.77) (-0.21)
CRA AAA -0.642 -0.618 -0.618 -0.711 -0.737 -0.721 -0.778 -0.596
(-30.18) (-30.83) (-30.74) (-19.88) (-19.57) (-19.31) (-19.58) (-9.91)
Vasicek AAA 0.032 0.030 -0.022 -0.017 0.054
(3.16) (1.46) (-1.01) (-0.73) (1.48)
Simulation AAA 0.079 0.112 0.139 0.042 0.032
(1.92) (2.55) (3.17) (0.91) (0.53)
CLO 0.035 0.025 0.029 0.073
(2.81) (1.97) (1.95) (2.31)
ABS CDO 0.031 0.054 0.085 0.032
(1.81) (3.09) (4.28) (0.83)
CDO2 0.017 0.033 0.012 0.005
(0.79) (1.55) (0.53) (0.13)
Synthetic Dummy -0.009 -0.025 -0.035 -0.028
(-0.81) (-2.20) (-2.95) (-1.09)
Closing Year 2005 0.020 0.011 0.027
(2.04) (1.13) (2.51)
Closing Year 2006 0.029 0.011 0.045
(3.15) (1.25) (4.28)
Closing Year 2007 0.059 0.035 0.069
(5.56) (3.28) (4.97)
Multiple CRAs -0.001 0.021
(-0.08) (1.70)
Excess Spread -0.013
(-2.51)
BDR-SDR -0.004
(-3.63)
N 903 903 903 903 903 903 903 903 669 408
Adjusted R2 0.005 0.112 0.503 0.569 0.562 0.579 0.584 0.598 0.696 0.638
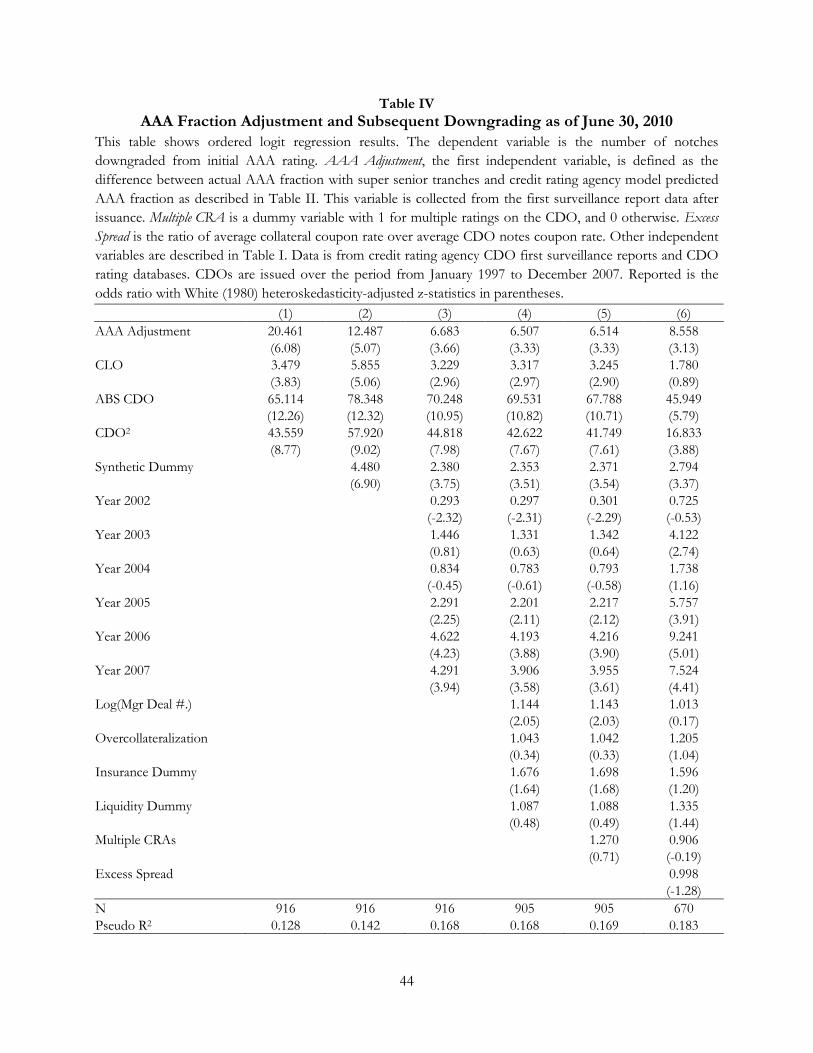
44
Table IV
AAA Fraction Adjustment and Subsequent Downgrading as of June 30, 2010
This table shows ordered logit regression results. The dependent variable is the number of notches
downgraded from initial AAA rating. AAA Adjustment, the first independent variable, is defined as the
difference between actual AAA fraction with super senior tranches and credit rating agency model predicted
AAA fraction as described in Table II. This variable is collected from the first surveillance report data after
issuance. Multiple CRA is a dummy variable with 1 for multiple ratings on the CDO, and 0 otherwise. Excess
Spread is the ratio of average collateral coupon rate over average CDO notes coupon rate. Other independent
variables are described in Table I. Data is from credit rating agency CDO first surveillance reports and CDO
rating databases. CDOs are issued over the period from January 1997 to December 2007. Reported is the
odds ratio with White (1980) heteroskedasticity-adjusted z-statistics in parentheses.
(1) (2) (3) (4) (5) (6)
AAA Adjustment 20.461 12.487 6.683 6.507 6.514 8.558
(6.08) (5.07) (3.66) (3.33) (3.33) (3.13)
CLO 3.479 5.855 3.229 3.317 3.245 1.780
(3.83) (5.06) (2.96) (2.97) (2.90) (0.89)
ABS CDO 65.114 78.348 70.248 69.531 67.788 45.949
(12.26) (12.32) (10.95) (10.82) (10.71) (5.79)
CDO2 43.559 57.920 44.818 42.622 41.749 16.833
(8.77) (9.02) (7.98) (7.67) (7.61) (3.88)
Synthetic Dummy 4.480 2.380 2.353 2.371 2.794
(6.90) (3.75) (3.51) (3.54) (3.37)
Year 2002 0.293 0.297 0.301 0.725
(-2.32) (-2.31) (-2.29) (-0.53)
Year 2003 1.446 1.331 1.342 4.122
(0.81) (0.63) (0.64) (2.74)
Year 2004 0.834 0.783 0.793 1.738
(-0.45) (-0.61) (-0.58) (1.16)
Year 2005 2.291 2.201 2.217 5.757
(2.25) (2.11) (2.12) (3.91)
Year 2006 4.622 4.193 4.216 9.241
(4.23) (3.88) (3.90) (5.01)
Year 2007 4.291 3.906 3.955 7.524
(3.94) (3.58) (3.61) (4.41)
Log(Mgr Deal #.) 1.144 1.143 1.013
(2.05) (2.03) (0.17)
Overcollateralization 1.043 1.042 1.205
(0.34) (0.33) (1.04)
Insurance Dummy 1.676 1.698 1.596
(1.64) (1.68) (1.20)
Liquidity Dummy 1.087 1.088 1.335
(0.48) (0.49) (1.44)
Multiple CRAs 1.270 0.906
(0.71) (-0.19)
Excess Spread 0.998
(-1.28)
N 916 916 916 905 905 670
Pseudo R2 0.128 0.142 0.168 0.168 0.169 0.183

45
Table V
Hazard Model of AAA Downgrading as of June 30, 2010
This table shows hazard rate regression results. The dependent variable is time to first downgrade for initially
AAA rated CDOs. AAA Adjustment, the first independent variable, is defined as the difference between actual
AAA fraction with super senior tranches and credit rating agency model predicted AAA fraction as described
in Table II. Multiple CRA is a dummy variable with 1 for multiple ratings on the CDO, and 0 otherwise. Excess
Spread is CDO collateral interest divided by CDO notes interest. Other independent variables are described in
Table I. Data is from credit rating agency CDO first surveillance reports and CDO rating databases. CDOs
are issued over the period from January 1997 to December 2007. Reported is the parameter estimate with
White (1980) heteorsketasticity-adjusted t-statistics in parentheses.
(1) (2) (3) (4) (5) (6)
AAA Adjustment 2.195 1.533 0.931 0.863 0.861 0.889 (6.65) (4.97) (2.74) (2.38) (2.36) (2.07)
CLO 0.815 1.332 0.656 0.671 0.638 0.407 (3.79) (5.97) (2.71) (2.73) (2.58) (1.05)
ABS CDO 2.120 2.329 2.590 2.640 2.611 2.273 (10.15) (11.11) (11.51) (11.54) (11.37) (6.18)
CDO2 1.639 2.086 2.029 1.933 1.895 1.290 (6.29) (7.86) (7.33) (6.86) (6.70) (3.08)
Synthetic Dummy 1.654 0.778 0.774 0.778 0.880 (12.27) (5.45) (5.00) (5.03) (4.87)
Year 2007 -1.055 -1.089 -1.071 -0.571 (-2.90) (-2.98) (-2.93) (-1.38)
Year 2006 -0.019 -0.162 -0.160 0.502 (-0.07) (-0.56) (-0.55) (1.48)
Year 2005 0.413 0.337 0.349 0.777 (1.60) (1.28) (1.32) (2.45)
Year 2004 1.682 1.673 1.682 2.340 (6.74) (6.56) (6.59) (7.38)
Year 2003 2.673 2.610 2.615 3.152 (10.51) (9.97) (9.99) (9.66)
Year 2002 3.379 3.336 3.364 3.888 (12.74) (12.11) (12.17) (11.34)
Log(Mgr Deal #.) 0.161 0.161 0.058 (3.52) (3.51) (1.09)
Overcollateralization 0.057 0.058 0.088 (0.69) (0.70) (0.77)
Insurance Dummy 0.661 0.675 0.684 (3.13) (3.19) (2.63)
Liquidity Dummy 0.048 0.037 0.192 (0.42) (0.32) (1.50)
Multiple CRAs 0.332 -0.165 (1.36) (-0.45)
Excess Spread -0.002
(-2.60)
N 916 916 916 905 905 670

46
Table VI
Actual-Publicized CDO Rating Criterion Mapping Matrix
This table reports the frequency distribution of rating default rate criterion deviations. In the row „AAA‟, we
compared the AAA rating default rate criterion actually reported in rating agency surveillance reports to the
publicized default rate criterion with the same maturity in publicly distributed CDO rating software and
manuals. If the actual criterion qualifies the publicized criterion, then we assign „0‟ notches deviated. If the
actual criterion does not qualify for AAA rating according to publicized criterion, but qualifies for „AA+‟
(„AA‟, „AA-‟, „A+‟ and below) criterion, then we assign „-1‟ („-2‟, „-3‟, „-4 or less‟) notches deviated. We
calculate the percentage for each category of notch deviations, so all numbers in each row add up to one. This
procedure is done for all ratings from „AAA‟ to „CCC-„. A default probability can qualify for a certain rating if
the actual default probability is less than 1.05 times publicized default probability of such a rating. The default
probabilities are rounded to four decimal points. CDOs are issued over the periods from January 1997 to
March 2007 (Panel A) and from April 2007 to December 2007 (Panel B).
Panel A: CDOs Issued Before April 1, 2007
Number of Notches Deviated
3 or more 2 1 0 -1 -2 -3 -4 or less
AAA - - - 0.013 0.048 0.925 0.009 0.005
AA+ - - 0.005 0.017 0.951 0.015 0.008 0.004
AA - 0.001 0.001 0.022 0.018 0.135 0.717 0.106
AA- 0.000 0.001 0.017 0.010 0.041 0.447 0.461 0.023
A+ 0.001 0.001 0.008 0.015 0.066 0.860 0.046 0.003
A 0.001 0.003 0.012 0.021 0.735 0.225 0.004 0.000
A- 0.001 0.004 0.014 0.049 0.923 0.006 0.003 0.000
BBB+ 0.004 0.009 0.008 0.408 0.568 0.004 0.000 0.000
BBB 0.004 0.009 0.009 0.965 0.013 0.000 0.000 0.000
BBB- 0.012 0.001 0.008 0.976 0.004 0.000 0.000 0.000
BB+ 0.012 0.001 0.015 0.959 0.010 0.003 0.000 0.000
BB 0.012 0.003 0.006 0.964 0.013 0.003 0.000 0.000
BB- 0.013 0.001 0.073 0.909 0.004 0.000 0.000 0.000
B+ 0.013 0.006 0.906 0.071 0.004 0.000 0.000 0.000
B 0.014 0.012 0.499 0.467 0.008 0.000 0.000 0.000
B- 0.019 0.031 0.866 0.080 0.004 0.000 0.000 -
CCC+ 0.022 0.059 0.875 0.044 0.000 0.000 - -
CCC 0.022 0.492 0.483 0.004 0.000 - - -
CCC- 0.013 0.637 0.346 0.004 - - - -
(continued)

47
Table VI―Continued
Panel B: CDOs Issued After April 1, 2007
Number of Notches Changed
3 or more 2 1 0 -1 -2 -3 -4 or less
AAA - - - 0.913 0.008 0.072 0.007 0.000
AA+ - - 0.000 0.913 0.072 0.007 0.007 0.000
AA - 0.000 0.000 0.913 0.000 0.007 0.065 0.014
AA- 0.000 0.000 0.000 0.913 0.007 0.058 0.014 0.007
A+ 0.000 0.000 0.000 0.913 0.007 0.065 0.014 0.000
A 0.000 0.000 0.000 0.913 0.072 0.014 0.000 0.000
A- 0.000 0.000 0.000 0.920 0.072 0.007 0.000 0.000
BBB+ 0.000 0.000 0.000 0.957 0.043 0.000 0.000 0.000
BBB 0.000 0.000 0.000 0.986 0.014 0.000 0.000 0.000
BBB- 0.000 0.000 0.000 1.000 0.000 0.000 0.000 0.000
BB+ 0.000 0.000 0.000 0.986 0.014 0.000 0.000 0.000
BB 0.000 0.000 0.000 0.986 0.014 0.000 0.000 0.000
BB- 0.000 0.000 0.007 0.993 0.000 0.000 0.000 0.000
B+ 0.000 0.000 0.072 0.928 0.000 0.000 0.000 0.000
B 0.000 0.000 0.072 0.928 0.000 0.000 0.000 0.000
B- 0.000 0.000 0.072 0.928 0.000 0.000 0.000 -
CCC+ 0.000 0.000 0.087 0.913 0.000 0.000 - -
CCC 0.000 0.065 0.022 0.913 0.000 - - -
CCC- 0.000 0.072 0.014 0.913 - - - -

48
Table VII
Rating Agency and Our Simulation AAA Fraction Difference Regressions
This table reports coefficient estimates from OLS regressions. The dependent variables are the difference
between the CDO AAA fraction from the credit rating agency model and from a Monte Carlo Model (CRA
AAA – Monte Carlo AAA). The Monte Carlo simulation inputs are average collateral default rates, maturity,
correlations, and number of assets reported by the CRA. The simulation approach is described in the Internet
Appendix A. Recovery rate is assumed to be 40% for all Monte Carlo simulations. The independent variables
are described in Table I. CLO, ABS CDO, and CDO2 are collateral asset type dummy variables. Closing year
dummies for 2002-2007 are included with closing year 2001 and before as the comparison group. CDOs are
issued over the period from January 1997 to December 2007. White (1980) Heteroskedasticity-adjusted t-
statistics are in parentheses.
(continued)

49
Table VII―Continued
Variable (1) (2) (3) (4) (5) (6) (7) (8)
Intercept 0.160 0.016 0.036 -0.006 0.137 0.471 0.562 0.201
(1.68) (3.17) (5.83) (-0.63) (1.37) (4.24) (6.07) (1.94)
Col. Def. Prob. -2.116 -2.118 -1.400 -2.168
(-13.05) (-12.99) (-11.09) (-13.25)
Avg. Col. Rating 0.008 0.008 -0.002 0.009
(7.28) (6.93) (-2.00) (7.11)
Avg. Col. Maturity -0.007 -0.007 -0.003 -0.006 -0.006
(-4.16) (-4.16) (-1.80) (-3.52) (-3.68)
Correlation -0.003 -0.005 -0.026 -0.019 -0.036
(-0.18) (-0.27) (-1.18) (-0.93) (-1.77)
Log(CDO Size) -0.011 -0.011 -0.027 -0.029 -0.015
(-2.44) (-2.35) (-4.94) (-6.11) (-3.00)
# Assets 0.000 0.000 0.000 0.000 -0.000
(1.21) (0.11) (0.63) (0.44) (-0.05)
# Obligors 0.001 0.001 0.001 0.001 0.001
(10.07) (10.32) (9.76) (10.10) (10.79)
Log(Mgr Deal #.) 0.009 -0.003 -0.004 -0.004 -0.004 (3.13) (-1.42) (-1.69) (-1.52) (-1.65) Overcollateralizationn
-0.002 0.003 0.005 0.003 0.004
(-0.30) (0.81) (1.19) (0.81) (1.11)
Insurance Dummy -0.033 0.003 -0.011 0.002 0.004
(-2.69) (0.27) (-1.05) (0.21) (0.45)
Liquidity Dummy -0.016 0.002 0.006 0.004 0.005
(-2.31) (0.40) (0.97) (0.70) (0.90)
CLO 0.062 0.030 0.030 0.044 0.028
(6.32) (3.25) (2.51) (4.00) (2.54)
ABS CDO 0.028 0.031 0.038 0.020 0.038
(2.85) (2.86) (2.95) (1.65) (3.20)
CDO2 -0.027 0.014 0.019 0.005 0.016
(-1.88) (0.99) (1.15) (0.32) (1.08)
Synthetic Dummy -0.016 -0.007 0.001 0.002 -0.010 (-1.85) (-0.90) (0.10) (0.27) (-1.23)
Closing Year 2002 0.003 -0.013 -0.009 (0.17) (-0.91) (-0.68)
Closing Year 2003 0.020 0.006 0.014 (1.47) (0.43) (1.14)
Closing Year 2004 0.002 -0.007 0.005 (0.14) (-0.62) (0.46)
Closing Year 2005 0.009 -0.001 0.010 (0.73) (-0.05) (0.90)
Closing Year 2006 -0.004 -0.010 0.002 (-0.36) (-0.91) (0.19)
Closing Year 2007 0.019 0.017 0.029 (1.44) (1.37) (2.46)
N 902 902 902 902 902 902 902 902
Adjusted R2 0.452 0.010 0.011 0.099 0.460 0.364 0.439 0.469

50
Table VIII
Valuation Effect of Subjectivity
This table reports valuation consequence of adjustment and criterion deviation. The Value Difference per CDO
is calculated as the following:
alue Difference=Collateral Average aturity ize Affected pread Difference,
where Collateral Average Maturity is the average maturity of collateral assets, Size Affected is the dollar value
affected by subjectivity, and Spread Difference is the difference between AAA spread of the affected part and a
benchmark spread. The benchmark spread is calculated using three methods. The first method takes credit
rating agency output across the entire rating spectrum and assigns ratings to the actual CDO structure. If the
top tranche size 75.5% and the rating agency model indicates 75.0% can obtain A rating, then this tranche is
rated as BBB+. The second and third methods use our Monte Carlo simulation to rate the tranches. The
second method evaluates each tranche separately. The third method bundles all AAA tranches together. Two
effects drive the difference between the second and third methods. First, on average, the junior AAA tranche
has wider spread (46 bps) than the senior AAA tranche (35 bps). Second, junior AAA tranche size is on
average smaller than the senior AAA tranche size. All three methods are applied with and without the
criterion deviation. Data is from credit rating agency CDO first surveillance reports and CDO rating
databases. Data is grouped by collateral asset type (CBO for collateralized bond obligations, CLO for
collateralized loan obligations, ABS CDO for CDOs of Asset-Backed Securities, and CDO2 for CDOs of
CDOs). The sample includes 916 CDOs issued over the period from January 1997 to December 2007.
All CBO CLO ABS CDO CDO²
#. Of CDOs 916 96 393 373 54
Collateral Average Maturity (years) 6.45 5.30 5.74 7.23 8.31
Method #1: Adjusted Portion with Model Implied Rating
Size Affected ($ millions) 87.67 56.51 83.90 98.37 96.52
Model Rating BBB+ BBB BBB- A- A
Spread Difference Total (%) 2.24 2.27 2.52 2.04 1.50
Value Difference Total ($ millions) 14.73 7.38 13.12 17.72 15.25
Value Difference w/o Deviation ($ millions) 12.33 6.12 11.96 14.08 11.17
Method #2: Multiple Tranches Impacted Differently
Size Affected ($ millions) 289.57 223.23 273.64 328.59 253.98
Model Rating BBB BBB BBB BBB BBB+
Spread Difference Total (%) 2.40 2.51 2.49 2.41 1.57
Value Difference Total ($ millions) 42.20 29.46 39.35 48.74 32.77
Value Difference w/o Deviation ($ millions) 35.02 24.50 35.53 38.14 22.77
Method #3: Bundling AAA Together
Size Affected ($ millions) 529.62 342.51 366.54 761.05 450.60
Model Rating BBB BBB BBB BBB BBB+
Spread Difference Total (%) 2.56 2.54 2.53 2.66 2.14
Value Difference Total ($ millions) 94.13 54.75 52.94 146.83 74.68
Value Difference w/o Deviation ($ millions) 78.91 47.92 47.49 120.40 57.47

51
Internet Appendices
Internet Appendix A: CDO Valuation Models
This appendix provides a brief introduction to portfolio credit risk analysis. Two valuation approaches
are discussed: the Gaussian Copula Monte Carlo simulation approach and the Vasicek granular portfolio
approach. More detailed explanations can be found in Duffie and Garleanu (2001) or Duffie and
Singleton (2003).
A. Monte Carlo Simulation (Gaussian Copula Approach)
The key to CDO valuation is default correlation. A high correlation collateral asset portfolio will
have more clustered defaults. In such a case, the benefit of portfolio diversification is limited. Senior
tranches and junior tranches will have similar cash flow streams. An intuitive way to calculate default
correlation is to first model the default process. Let Xi be the fundamental determinant of default for
obligor i, so that the default probability of obligor i is:
pi F i . (1)
If we can model the dynamics of Xi and default function F(•), then we can estimate the default
correlation between any two obligors i and j:
ij Cov p
i,p
j ar p
i ar p
j
ar pi ar p
j
pij p
i p
j
pi 1-p
i p
j 1-p
j (2)
This structural approach is economically sensible. The Vasicek (1987) model is a special case when the
fundamental variables can be decomposed into a common factor and a residual term.
However, defaults are rare and irreversible events. Historical data is sparse. Modeling default
time is challenging, as it is a point process. Consequently, deriving default correlation from fundamental
default drivers can be inaccurate. Compared to the above structural approach, a reduced-form approach
is to directly impose correlation structure on default probability, then back out individual default time
using a copula function:
C pi, p
j F F
1 pi F 1 p
j (3)
The above approach can be used to simulate joint default probability first and then determine individual
default time. We use this approach for our Monte Carlo simulation practice.
For a CDO portfolio of assets, let be the default time for obligor , let be the maturity for
obligor , and let p i i pi be the default probability. Instead of building the default correlation
matrix from individual asset fundamentals, we assume the default correlation follows:

52
(4)
So the diagonal elements are all 1 and all off-diagonal elements are all , i.e., all pair-wise correlations are
. We draw independent random numbers from a standard normal distribution. We transform these
independent random numbers into correlated random numbers using the Cholesky decomposition
of . These correlated random numbers are transformed into realized default time using the
cumulative standard normal (Gaussian Copula) density function, and subsequently converted into a
default time using the expected default probability. After the default time is determined, the cash flow of
the entire portfolio as well as for different tranches can be calculated. This simulation is repeated many
times.
The main inputs and parameters for the simulation are portfolio average collateral default rate,
maturity, correlation, number of assets, recovery rate, and the rating default probability criterion from
which a scenario default rate will be derived. Note that controlling for the other model inputs and
parameters, there is a one-to-one correspondence between rating default probability criterion and SDR.
We focus on the AAA ratings.
B. Vasicek Model (Granular Portfolio Approach)
The contingent claim model of Merton (1974) provides an elegant way to calculate single obligor
default probability. If default is defined as when a firm‟s asset value, V, drops below a threshold X, then
default probability at time T is
p Pr 0 (5)
Assume asset value follows a geometric Brownian motion
d t tdt tdW (6)
Then the probability of default can be solved analytically
p N
ln 0
(7)
where N(•) is the cumulative normal probability function.
Vasicek (1987) applies the Merton model to the credit portfolio. In doing so, the portfolio is
assumed to be granular in the sense that each individual asset has homogeneous effects on the portfolio
risk profile. Subsequently, the Law of Large Numbers (LLN) can be applied to derive a closed form
solution for portfolio default probability. Specifically, if each individual default probability is derived
from the Merton model:
pi N ci p (8)

53
and each individual stochastic variable can be decomposed as follows:
Wi i (9)
where Zi and Zj are independent for any i j. Then, for a portfolio with N assets, the cumulative
probability of portfolio loss rate not exceeding is
FN Pk N k (10)
where Pk is the probability of k defaults. For a granular portfolio, Vasicek shows that the portfolio
default probability is
F N 1
N 1
1
N 1 p (11)
The above formula can be flexibly applied to CDO valuation. For example, when we fix , we can find
the default probability . We can also back out given .
Internet Appendix B: A CDO Rating Example
The following example illustrates the derivation of ratings for Independence III CDO, which is a
cash ABS CDO closed on May 9, 2002. The arranger is Bank of America and manager is Independence
Fixed Income (renamed Declaration Research and Management in 2003). Its senior tranches consist of
$186 million of Class A-1 notes and $62 million of Class A-2 notes out of the $300 million total liabilities
(targeting $302 million of collateral assets). So the total A-class notes targeting AAA rating count for
82.67%, and the subordination level is 17.33%.
&P‟s new issue report dated July 9, 2002 provides an DR estimate of 21.11% for „AAA‟ rating
scenario. hat is, under the „AAA‟ scenario, the collateral asset pool is expected to lose no more than
21.11% of its value. The same report also states a Class A BDR of 22.72%. That is, under all cash flow
scenarios considered, Class A notes will make timely interest and principal payments, even if the
portfolio loses 22.72% of its value. The collateral pool is not expected to lose more than 21.11% under
AAA scenario, but Class A notes (tranche A-1 and tranche A-2) can withstand 22.72% portfolio loss;
hence, Class-A tranches can obtain AAA rating.29 Those Class A tranches will maintain AAA rating as
long as the overcollateralization ratio is above 120%, and interest rate coverage ratio is above 115%.
29
Although in the final version BDR must be greater than SDR, those BDR and SDR numbers could be the outcome of several iterations. Note that if the underwriter presented a BDR of 22.72%, but the rating agency calculated a higher SDR, say 23.00%, then the underwriter would need to restructure the deal (for example, cut AAA tranche size or add credit enhancement to it) or change the correlation to persuade the rating agency to calculate a lower SDR. It is common that the underwriter would have already estimated the rating agency model and known the 21.11% SDR for the proposed structure.

54
For a generic credit portfolio, the tranche amount admissible for an AAA rating according to the
CRA credit risk model is 1−SDRAAA. In the Independence III CDO example above, the „AAA‟ scenario is
expected to lose no more than 21.11% of its value at the AAA default probability. A CDO rated at the
edge could then receive 78.89% AAA; hence, this is the „CRA model fraction‟. he difference between
the actual rated tranche size and the CRA model fraction (1-SDR) is referred to as the „adjustment.‟ In
our example of Independence III CDO, the adjustment is 82.67%−(1−21.11%)=3.78%. S&P states the
rationale for “the ratings assigned to the Independence III CDO Ltd.‟s class A, B, and C notes reflect
the credit support provided by excess spread and subordination of cash flow to more junior classes of
notes, diversification in the pool of assets securing the transaction, and protection provided by various
early-amortization triggers.” oody‟s assigned the same ratings after it “evaluated the characteristics of
the underlying collateral, the transaction‟s performance under various default scenarios and related
stress-test analyses, the legal structure, and the expertise of the collateral manager.” A more general
statement from S&P explains the rationale for CDO ratings assigned “reflect the credit enhancement
provided by excess spread, the subordinated classes of notes, the cash flow structure (which is subject to
various stresses by tandard & Poor‟s), the experience and performance of the collateral manager, the
transaction‟s interest rate hedges, diversification in the pool of assets securing the transaction, and
protection provided by various early amortization triggers” (New Issue Report, Centurion CDO VI Ltd.,
October 17, 2002).
Internet Appendix C: A Discussion of Coincidental CDOs
From our main finding in Figure 6 and Figure 7, we notice that a number of CDOs seem to use
the same constant default probability criterion for each of the 19 rating scales, regardless of their
maturities. In Internet Appendix Table IA.XI, we list the 27 CDOs with the same constant default
probability criterion. We further discovered that, not only are their default probability criteria constant
and identical, their scenario default rates are identical for each of the 19 rating scales from AAA to CCC-
across all 27 CDOs. This result will only be possible if they are all drawn from the same portfolio loss
distribution or the CDOs refer to the same collateral asset pool. However, Internet Appendix Table
IA.XI shows that these 27 CDOs are very different from one another; it would seem extremely
improbable that all 27 CDOs could have the same SDRs across all rating scales. The closing dates range
from December 28, 2000 to July 19, 2007. One interesting finding is that all but one of the CDOs are
rated by a group of credit analysts located in New York City and monitored by one surveillance analyst.

55
This group of credit analysts rated 171 CDOs in our sample. So these 26 deals represent 15.2% of those
171 deals. Interestingly, 24 of the 27 CDOs are rated by multiple CRAs.
Internet Appendix D: Events around April 1, 2007
A. Summary of Market Events
We are unable to find any documentation of a shift in credit rating standards in early 2007 on
any of the credit rating agency websites. In recent testimony before Congress, oody‟s CEO did indicate
a tightening of standards for MBS securities in early April 2007 associated with bad news regarding
mortgage securities.30 To understand market conditions around early 2007, we search through relevant
news related to subprime housing and other major credit events. Sanders (2009) shows that Arizona,
California, and Nevada house prices began to move together starting in 2005, and in the second-half of
2006, subprime loan defaults began to increase. In Figure IA6 we plot subprime loans in foreclosure
(using data provided by Loan Performance HPI), as well as relevant news for the first half of 2007 to
shed light on our finding of April 1, 2007 as the ending time of the criterion deviation.
Figure IA6 shows that the delinquency rate on subprime mortgages increased from 4.92% in
January to 5.97% by June (with further increases of another point occurring in August). There were a
number of subprime mortgage lenders either declaring or heading for bankruptcy in January and
February of 2007. Gorton and Metrick (2009) document the decline of the subprime mortgage market,
as measured by the ABX.HE index beginning in January 2007. On March 6, Ben Bernanke calls for a
“stronger regulatory framework” for Fannie Mae and Freddie Mac. On March 22, Senator Shelby of the
Senate banking committee calls for testimony of organizations including credit rating agencies involved
in securitizing mortgages. Since industry insiders claim that the credit rating agencies have long feared
government oversight, one must wonder if credit rating agencies were aware of such testimony. oody‟s
announces revision of its “loan-by-loan” mortgage data fields on April 3. The managing director of S&P
RMBS testified before a senate banking subcommittee on April 17, 2007. On June 23, 2007 Bear Sterns
announces it will bail out a credit hedge fund focusing on subprime mortgage CDOs.
The above events indicate that the crisis was looming in the beginning of 2007, well before
conditions worsened considerably in August 2007 (allegedly after BNP Paribas froze redemption of two
funds on August 9). If the CRA were to make a strategic change over CDO credit ratings around April 1,
2007, its decision might go beyond adjusting rating criterion.
30 In discussing MBS securities, Raymond McDaniel, Chairman and CEO of oody‟s, states, “A first, limited set of rating actions were taken in November 2006, with broader actions beginning in April 2007,” [Direct quotes from testimony before U.S. House of Representatives Committee on Oversight and Government Reform on Oct 22, 2008].

56
B. Did other CDO features change?
In Table IA.XII, we show key characteristics of CDOs issued before and after April 1, 2007.
Beginning in April 2007, CLOs represent most of the newly issued CDOs (72 out of 138). A key
parameter to CDO rating and the main free parameter for the CRA in modeling is the default correlation.
Overall, the most noticeable changes are the increase in correlation and CDO deal size. Focusing on
CLOs, correlations increase from 0.29 to 0.54. Average collateral rating quality, maturity, and synthetics
remain the same. Because CLOs issued after April 1, 2007 may be different from CLOs issued before
April 1, 2007, we also match each new CLO with a seasoned CLO issued before April 1, 2007 on data
reporting time (after April 1, 2007), collateral pool size, maturity, and rating. Still, default correlations of
the new CLOs are much higher than the matched seasoned CLOs. Moreover, the average default
correlation is higher after April 1, 2007 for each CDO type than before April 1, 2007 with the same
reporting time, though the difference is small for ABS CDOs. It would be difficult to fully control for
unobserved variables leading to a shift in correlations. Thus, we only document this shift in CLO
correlations, but leave it to future work to fully understand the reason for this increase in CLO
correlations after April 2007.
Table IA.XII also shows that prior to April 2007, the CRA model assigns 0.64 of the CDO as
AAA, whereas our simulation yields 0.62. Beginning in April 2007, the CRA model yields 0.58 AAA, but
our model yields 0.51 AAA. Hence, despite the tougher AAA criterion, there is still a disconnection
between our Monte Carlo model and that of the CRA.
C. Was April 2007 Special?
Our evidence suggests that the criterion and correlation assumptions by the CRA have become
tougher after April 1, 2007. However, less is known about the ultimate effects on CDO ratings (e.g.,
AAA fraction). The model, namely the functional form transforming parameters and inputs into outputs,
can potentially reinforce or offset effects from criterion and correlation assumptions. We first analyze
the difference between CRA model AAA fraction and our simulation model output separately before
and after April 1, 2007. We find that the model difference is less explained by CDO structural variables
after April 1, 2007 (0.38 adjusted R2) than before (0.47 before).31
In order to formally test possible structural breaks in the CRA CDO model around April 1, 2007,
we conduct Chow tests for structural breaks following Andrews (1993). We report results in Table
IA.XVI. The dependent variable is the difference between the CRA model output and our simulation
model output. Across all three specifications, Table IA.XVI shows that April 2007 is the most evident
31 Here we use the full set of CDO characteristics as in Table VII, specification (5) except that the number of deals by the manager is excluded.

57
break point. Since there is no structural break in the simulation model by construction, any structural
break will come from the CRA model.

58
Internet Appendix: Figures and Tables
Figure IA1. CDO Credit Rating Timeline and Sample Construction. This graph demonstrates the CDO
credit rating process and our data construction. The CDO note issuer, or the arranger/underwriter on behalf
of the issuer, initiates the rating process. After receiving the rating request and the CDO term sheet, the credit
rating agency (CRA) decides whether to rate the deal or not. If the CRA agrees to rate the deal, the issuer
then supplies more detailed deal information and collateral guidelines. Credit rating analysts conduct analysis
and communicate the rating outcome with the CDO arranger who may withdraw the rating request at any
time with a cancellation fee. Once the CRA and CDO arranger agree on the preliminary ratings, the CRA
releases a presale report, which can be distributed to potential CDO investors and other relevant parties.
Subsequently, the CRA releases a new issue report with official ratings shortly after the CDO closing date, on
which investors purchase the CDO notes. (Neither the pre-sale report nor the new issue report are
mandatory.) After the deal is closed, the CDO manager uses the proceeds from investors to purchase
collateral assets and complete the portfolio during the “ramp-up” period. After the completion of the ramp-
up, the trustee will be informed of the collateral changes and distribute the trustee reports periodically. The
CRA will use the current information to monitor the CDO performance and take necessary rating actions.
Our data comes from the CRA‟s surveillance reports, including the first report for the CDO (starting January
2002), every December report (or neighboring month if unavailable), and the latest report as of September
2008. The data covers CDO collateral asset characteristics, as well as the CRA‟s credit risk assessment. Other
deal information and rating history data comes from the CRA CDO rating database and SDC Platinum.
“ramp up”
Periodic surveillance reports
closing
New
issue
report
Pre-
sale
report
Rating
soliciting
Term Sheet
Projected Portfolio
Rating
agreement
Complete Portfolio
Preliminary Rating Global Scale Rating
Trustee report
Performance monitoring
Rating action
Rating Accepted
Or
process cancelledSample Data

59
Figure IA2. CDO Credit Rating Approach. This figure illustrates the CDO rating approach commonly used by major CRAs. Using CDO collateral asset information, the CRA first simulates portfolio loss rates and draws the histogram. his histogram is then used in the second step to map the “idealized default rate” into a scenario default rate according to CRA rating criterion. The first 1% of the histogram probability is zoomed in to show the high quality ratings such as AAA and AA. The idealized default probability for AAA scenario, say y% according to CRA criterion (from the historical AAA corporate bond default rate), is mapped to a scenario default rate x% using the expected portfolio loss histogram, so that the shaded area equals y%. If a CDO tranche can withstand at least x% portfolio loss in the cash flow scenarios, then an AAA rating can be granted.
Step 1: Simulating Portfolio Loss Rate
Step 2: Mapping Idealized Default Probability to Scenario Default Rate
0
4
8
12
16
20
24
28
32
0.00 0.03 0.06 0.09 0.12 0.15 0.18 0.21 0.24 0.27 0.30
Fre
quen
cy (
%)
Portfolio Loss Rate
High correlation CDO
Low correlation CDO
0.0
0.2
0.4
0.6
0.8
1.0
0.00 0.03 0.06 0.09 0.12 0.15 0.18 0.21 0.24 0.27 0.30
Fre
quen
cy (
%)
Portfolio Loss Rate
AA
A S
DR
AA
A S
DR
AA
SD
R
AA
SD
R
y %, the criterion
x2% for high correlation
AA
A S
DR
AA
A S
DR
AA
SD
R
AA
SD
R
x2% for high correlation
AA
A S
DR
AA
A S
DR
AA
SD
R
AA
SD
R
x2% for high correlationx1% for low correlation
y %, the criterion

60
Figure IA3. Distribution of AAA Fraction Adjustment over Time. This figure reports the histogram for AAA fraction adjustment, defined as the difference between actual AAA size and credit rating agency permitted AAA size, year by year. Data is from credit rating agency CDO first surveillance reports and CDO rating databases. CDOs are issued over the period from January 1997 to December 2007.
0
5
10
15
20
25
30
35
Fre
quen
cy (
%)
Year 2003 and Before
0
5
10
15
20
25
30
35
Fre
quen
cy (
%)
Year 2004
0
5
10
15
20
25
30
35
Fre
quen
cy (
%)
Year 2005
0
5
10
15
20
25
30
35
Fre
quen
cy (
%)
Year 2006
0
5
10
15
20
25
30
35
-0.8 -0.7 -0.6 -0.5 -0.4 -0.3 -0.2 -0.1 0 0.1 0.2 0.3 0.4 0.5 0.6 0.7 0.8
Fre
quen
cy (
%)
Year 2007

61
Figure IA4. Distribution of AAA Fraction Adjustment by Types. This figure reports the histogram for AAA fraction adjustment, defined as the difference between actual AAA size and credit rating agency permitted AAA size by types. Data is from credit rating agency CDO first surveillance reports and CDO rating databases. CDOs are issued over the period from January 1997 to December 2007.
0
10
20
30
40
Fre
quen
cy (
%)
CBO
0
10
20
30
40
Fre
quen
cy (
%)
CLO
0
10
20
30
40
Fre
quen
cy (
%)
ABS CDO
0
10
20
30
40
Fre
quen
cy (
%)
CDO
0
10
20
30
40
-0.8 -0.7 -0.6 -0.5 -0.4 -0.3 -0.2 -0.1 0 0.1 0.2 0.3 0.4 0.5 0.6 0.7 0.8
Fre
quen
cy (
%)
Synthetic CDO
2

62
Figure IA5. Credit Rating Agency Model Predicted AAA Fraction (x-axis) and Initial Adjustment (y-axis): Reporting Gap within One Year. This figure graphs AAA fraction from the credit rating agency model (defined as 1- SDRAAA) in first surveillance reports and the adjustment (difference between actual CDO fraction rated AAA and credit rating agency model AAA fraction). SDRAAA is the scenario default rate for AAA scenario directly from the rating agency model output. The sample includes 660 CDOs issued between January, 1997 and December, 2007. This figure is a subset of Figure 3 with the restriction of first surveillance reports dated within one year since CDO closing.
-0.2
-0.1
0.0
0.1
0.2
0.3
0.4
0.5
0.6
0.7
0.8
0.0 0.1 0.2 0.3 0.4 0.5 0.6 0.7 0.8 0.9 1.0
Ad
just
men
t to
AA
A F
ract
ion
AAA Fraction from Credit Rating Agency Model
Reporting Gap <= 180 Days 180 Days < Reporting Gap <= 365 Days

63
Figure IA6. Timeline Leading into the Crisis. This timeline is constructed from various news sources that detail the events leading up to the subprime crisis and is accompanied by a plot of the delinquency rates of subprime mortgages for the period Jan. 1-June 31, 2007. Total foreclosures include REOs.
1. Bajaj, J. C. (2007, June 23). $3.2 Billion Move By Bear Stearns To Rescue Fund. The New York Times.
2. Bajaj, V. (2007, February 28). Freddie Mac Tightens Standards. The New York Times.
3. Bernanke, B. (2007, March 6). GSE Portfolios, Systematic Risk, and Affordable Housing. Speech before the Independent Community Bankers of
America's Annual Convention. Honolulu, Hawaii.
4. Board, L. (2007). Barclays buys EquiFirst for $225M. TheDeal.com.
5. Keoun, B. (2007, January 2). bloomberg.com. Retrieved April 29, 2009, from Bloomberg News Inc.:
http://www.bloomberg.com/apps/news?pid=conewsstory&refer=conews&tkr=MER:US&sid=akwzqnZA.euU
6. King, I. (2009, March 3). The Spark That Ignited A Blaze. The Times, p. 1.
7. Mitchell, D. (2007). Wider AAA' subprime levels weaken nearterm rebound hopes. SourceMedia.
8. National Public Radio. (2008, January 11). Bank of America to Buy Countrywide. Retrieved April 29, 2009, from NPR.org:
http://www.npr.org/templates/story/story.php?storyId=18018024
9. Reuters. (2007, February 5). Mortgage Lender Network Files for Chapter 11. Retrieved April 29, 2009, from Reuters Web Site:
http://www.reuters.com/article/companyNewsAndPR/idUSN0546894120070205
10. Romer, J. (2008, June 9). Cuomo Rewards the Rating Agencies. Retrieved April 29, 2009, from RGE Monitor:
http://www.rgemonitor.com/financemarkets-monitor/252748/cuomo-rewards-the-rating-agencies/
11. Shelby, R. C. (2007). Mortgage Market Turmoil: Causes and Consequences. Washington, DC: Senate Committee on Banking, Housing, and
Urban Affairs.
12. The British Broadcasting Channel. (2008, May 19). Timeline: Sub-prime losses. Retrieved April 29, 2009, from BBC.co.uk:
http://news.bbc.co.uk/2/hi/business/7096845.stm.
13. The Evening Standard. (2007). Paulson says mortgage crisis in US is contained. London.
14. Trejos, D. E. (2007). Foreclosure Rate Hits Historic High. Washington Post.
4.00%
4.50%
5.00%
5.50%
6.00%
6.50%
Del
inquen
cy R
ate
% Subprime
January 2: California-based Ownit Mortgage Solutions files for bankruptcy after being unable to buy back $166 million in loans to Merrill Lynch and other financial firms.[5]
February 5: Mortgage Lenders Network USA Inc. a subprime lender files for Chapter 11 bankruptcy protection as the U.S. housing market slows.[9]
January 11: Amid rumors of bankruptcy, Countrywide Financial corporation is bought out by Bank of America.[8]
March 6: Fed Chairman Ben Bernanke encourages “a stronger regulatory framework” for Fannie ae and Freddie Mac to reduce systematic credit risk.[3]
April 2: New Century Financial, largest U.S. subprime lender, files for chapter 11 bankruptcy.[12]
June 14: Senior US legislator Barney Frank says Fed could lose its authority to regulate mortgage business.[12]
March 22: Senator Shelby, Ranking member of Senate Banking Committee, calls for testimony “from mortgage brokers, bankers, the Wall Street firms involved in securitizing these mortgages, and the credit rating agencies whose ratings make the sale of these securities possible.”[11]
February 7: HSBC warns that slowing house prices had led to higher delinquency rates among US mortgages; bad debts are 20 percent worse than expected.[6]
March 8: Biggest US house builder DR Horton warns of huge losses from subprime fall-out[12]
January 22: Amid risingdelinquencies, subprime Equifirst sold to Barclays[4]
February 27: Freddie Mac refuses to buy subprime mortgages.[2]
March 7: Paulson announces that credit issues “are contained.”[13]
June 15: US home mortgage foreclosure rate hits highest level in 50 years.[14]
June 23: Bear Stearnsbails out fund for $3.2 billion.[1]
April 3: Moody's announces revision of its subprime mortgage model, citing that "the mortgage market has changed
considerably."[10]
March 3: "The legs that powered the CDO machine for the last three years have fallen off," says one major market
player.[7]

64
Figure IA7. Distribution of AAA Fraction Difference between Credit Rating Agency Output and Our Monte Carlo Simulation. Panel A reports the raw difference (CRA AAA – Monte Carlo AAA). Panel B reports the percentage difference (CRA AAA – Monte Carlo AAA)/CRA AAA. Data is from credit rating agency CDO first surveillance reports and CDO rating databases. CDOs are issued over the period from January 1997 to December 2007.
Panel A: Difference between CRA AAA and Monte Carlo AAA
Panel B: Percentage Difference between CRA AAA and Monte Carlo AAA
0
2
4
6
8
10
12
-0.7 -0.6 -0.5 -0.4 -0.3 -0.2 -0.1 0 0.1 0.2 0.3 0.4
Fre
quen
cy (
%)
CRA AAA - Monte Carlo AAA
0
2
4
6
8
10
12
-0.7 -0.6 -0.5 -0.4 -0.3 -0.2 -0.1 0 0.1 0.2 0.3 0.4
Fre
quen
cy (
%)
(CRA AAA - Monte Carlo AAA)/CRA AAA

65
Figure IA8. AAA Fraction Predicted by Credit Rating Agency Model and Our Monte Carlo Simulation. This figure graphs credit rating agency model predicted AAA fraction (x-axis) in first surveillance reports versus our Monte Carlo simulation AAA fraction (y-axis). Our Monte Carlo simulations use publicly disclosed default rate criterion for AAA credit rating and assume a 40% recovery rate for all CDO collateral assets. The sample includes 916 CDOs issued between January 1997 and December 2007.
0.0
0.2
0.4
0.6
0.8
1.0
0.0 0.2 0.4 0.6 0.8 1.0
All CDOs
0.0
0.2
0.4
0.6
0.8
1.0
0.0 0.2 0.4 0.6 0.8 1.0
Cashflow CLO
0.0
0.2
0.4
0.6
0.8
1.0
0.0 0.2 0.4 0.6 0.8 1.0
Cashflow CBO
0.0
0.2
0.4
0.6
0.8
1.0
0.0 0.2 0.4 0.6 0.8 1.0
Synthetic CBO
0.0
0.2
0.4
0.6
0.8
1.0
0.0 0.2 0.4 0.6 0.8 1.0
Cashflow ABS CDO
0.0
0.2
0.4
0.6
0.8
1.0
0.0 0.2 0.4 0.6 0.8 1.0
Synthetic ABS CDO
0.0
0.2
0.4
0.6
0.8
1.0
0.0 0.2 0.4 0.6 0.8 1.0
Cashflow CDO2
0.0
0.2
0.4
0.6
0.8
1.0
0.0 0.2 0.4 0.6 0.8 1.0
Synthetic CDO2

66
Table IA.I
AAA CDO Rating Default Rate Criterion from Fitch, Moody’s, and S&P
This table reports the AAA rating default rate criterion for CDOs for maturities from 1 to 10 years. Fitch and
oody‟s report “idealized default probabilities” (the 10-year idealized default probabilities correspond to their
rating factors), while S&P reports actual expected default rate. Fitch and S&P state that their default
probabilities are cumulative. The choice of decimal point for reporting is directly from the rating agencies. All
numbers are in percentage.
Maturity in Years
All in percent 1 2 3 4 5 6 7 8 9 10
Fitch Criterion 0.00 0.00 0.01 0.02 0.03 0.05 0.08 0.11 0.15 0.19
Moody's Criterion 0.0001 0.0002 0.0007 0.0018 0.0029 0.0040 0.0052 0.0066 0.0082 0.0100
S&P Criterion 0.000 0.009 0.030 0.065 0.118 0.190 0.285 0.405 0.552 0.728

67
Table IA.II
Correlation Matrix of Main Variables
This table reports the pair-wise correlations between the variables summarized in Table I. The upper right
half matrix contains Spearman rank-order correlations. The bottom left half matrix contains Pearson product-
moment correlations. Variable definitions are in Table I. Data is from credit rating agency CDO first
surveillance reports and CDO rating databases. CDOs are issued over the period from January 1997 to
December 2007.
Pearson (bottom left) and Spearman (upper right) Correlation Matrix
Variables 1 2 3 4 5 6 7 8 9 10 11 12
Col. Rating 1 0.97 -0.54 -0.36 0.37 0.13 -0.21 -0.07 -0.41 0.06 -0.16 -0.48
Col. Def. Prob. 2 0.83 -0.58 -0.36 0.40 0.19 -0.21 -0.05 -0.40 0.05 -0.15 -0.47
Col. Maturity (Years) 3 -0.42 -0.43 0.28 -0.38 -0.31 0.30 0.11 0.31 -0.13 0.11 0.15
Col. Size ($ millions) 4 -0.49 -0.30 0.20 0.15 0.20 0.26 0.27 0.29 -0.03 -0.02 0.24
# Assets 5 0.36 0.31 -0.27 -0.01 0.85 -0.25 0.22 -0.10 -0.10 -0.23 -0.08
# Obligors 6 0.15 0.14 -0.19 0.13 0.86 -0.14 0.27 -0.01 -0.09 -0.14 0.13
Synthetic Dummy 7 -0.17 -0.18 0.24 0.19 -0.22 -0.14 0.15 0.22 -0.09 0.22 0.01
Log(Mgr Deal #.) 8 -0.08 -0.04 0.11 0.23 0.23 0.30 0.15 0.09 -0.11 -0.06 0.02
Overcollateralization 9 -0.17 -0.15 0.12 0.16 -0.05 -0.03 0.16 0.03 -0.07 0.03 -0.25
Insurance Dummy 10 0.04 0.12 -0.14 0.00 -0.10 -0.09 -0.09 -0.10 -0.06 0.04 0.10
Liquidity Dummy 11 -0.12 -0.13 0.08 0.00 -0.20 -0.14 0.22 -0.06 0.05 0.04 0.04
AAA Fraction 12 -0.42 -0.27 0.03 0.30 -0.04 0.11 -0.09 0.04 0.21 0.14 0.09

68
Table IA.III
CRA AAA Fraction Adjustment and CDO Characteristics
This table shows the results of OLS regressions. The dependent variable is the CRA AAA fraction
adjustment. The adjustment is defined as the difference between actual AAA fraction and CRA Model
predicted AAA fraction explained in Table II. The independent variables are described in Table I except the
following: Vasicek AAA is the AAA fraction of the CDO predicted by the Vasicek model, Simulation AAA is
the AAA fraction predicted by a Monte Carlo simulation, Multiple CRA is a dummy variable with 1 for
multiple rating on the CDO, and 0 otherwise, Excess Spread is the ratio of average collateral coupon rate over
average CDO notes coupon rate, and BDR-SDR is the difference between break-even default rate (BDR) and
scenario default rate (SDR) in the presale or new issue reports. Data is from CRA CDO presale, new issue,
and surveillance reports, as well as CDO rating databases. CDOs are issued over the period from January
1997 to December 2007. White (1980) heteorsketasticity-adjusted t-statistics are in the parentheses.

69
Table IA.III―Continued
Panel A: First Surveillance Report Is Issued within 180-Days after Closing
(1) (2) (3) (4) (5) (6) (7) (8) (9) (10)
Intercept 0.110 0.197 0.518 0.563 0.570 0.555 0.496 0.440 0.372 0.335
(9.28) (13.14) (29.02) (30.84) (33.60) (28.79) (13.61) (11.68) (5.58) (6.81)
Log(Mgr Deals) 0.004 0.005 0.003 0.004 0.003 0.001 0.000 -0.003
(0.74) (0.97) (0.76) (0.99) (0.71) (0.33) (0.03) (-0.78)
Overcollateralization -0.085 -0.067 -0.068 -0.070 -0.066 -0.064 -0.092 -0.024
(-9.05) (-10.43) (-10.51) (-10.87) (-10.24) (-10.02) (-11.77) (-3.91)
Insurance Dummy 0.023 0.042 0.032 0.032 0.036 0.011 0.038
(0.89) (2.35) (1.78) (1.75) (2.02) (0.58) (1.86)
Liquidity Dummy -0.008 0.006 0.001 0.009 0.014 0.015 0.008
(-0.58) (0.57) (0.15) (0.95) (1.42) (1.52) (0.81)
CRA AAA -0.624 -0.598 -0.595 -0.740 -0.785 -0.761 -0.774 -0.424
(-23.15) (-24.25) (-24.14) (-15.38) (-15.65) (-15.37) (-13.88) (-5.80)
Vasicek AAA 0.009 0.102 0.032 0.042 0.113
(0.64) (3.45) (1.00) (1.20) (2.77)
Simulation AAA 0.160 0.219 0.251 0.156 0.020
(2.89) (3.80) (4.40) (2.50) (0.29)
CLO 0.043 0.047 0.225 0.041
(1.63) (1.79) (5.16) (1.06)
ABS CDO -0.033 0.013 0.210 -0.073
(-1.15) (0.42) (4.43) (-1.62)
CDO2 -0.041 -0.001 0.153 -0.105
(-1.26) (-0.02) (3.12) (-2.14)
Synthetic Dummy -0.017 -0.030 -0.036 0.113
(-1.28) (-2.20) (-2.48) (3.24)
Closing Year 2005 0.016 0.010 0.022
(1.20) (0.72) (1.91)
Closing Year 2006 0.029 0.021 0.044
(2.41) (1.69) (4.06)
Closing Year 2007 0.064 0.049 0.064
(4.73) (3.31) (4.45)
Multiple CRAs 0.001 0.001
(0.04) (0.03)
Excess Spread -0.000
(-1.43)
BDR-SDR -0.002
(-1.76)
N 522 522 522 522 522 522 522 522 403 288
Adjusted R2 -0.001 0.135 0.507 0.595 0.592 0.603 0.612 0.629 0.701 0.663
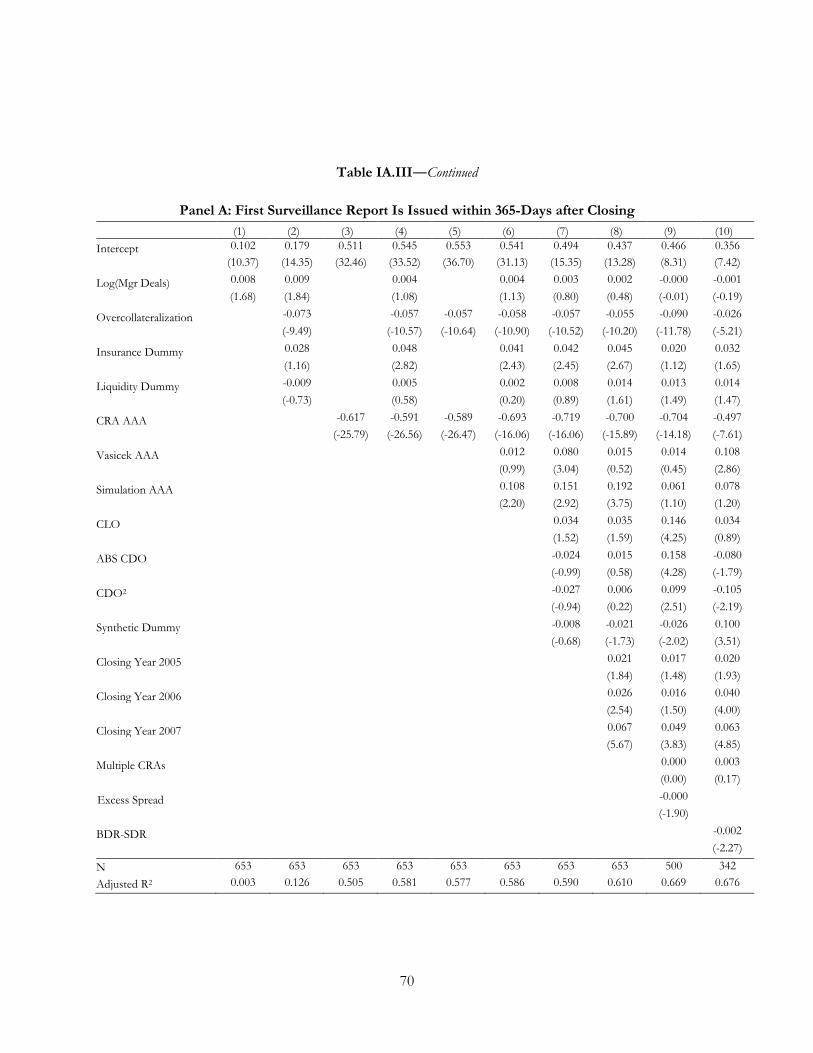
70
Table IA.III―Continued
Panel A: First Surveillance Report Is Issued within 365-Days after Closing
(1) (2) (3) (4) (5) (6) (7) (8) (9) (10)
Intercept 0.102 0.179 0.511 0.545 0.553 0.541 0.494 0.437 0.466 0.356
(10.37) (14.35) (32.46) (33.52) (36.70) (31.13) (15.35) (13.28) (8.31) (7.42)
Log(Mgr Deals) 0.008 0.009 0.004 0.004 0.003 0.002 -0.000 -0.001
(1.68) (1.84) (1.08) (1.13) (0.80) (0.48) (-0.01) (-0.19)
Overcollateralization -0.073 -0.057 -0.057 -0.058 -0.057 -0.055 -0.090 -0.026
(-9.49) (-10.57) (-10.64) (-10.90) (-10.52) (-10.20) (-11.78) (-5.21)
Insurance Dummy 0.028 0.048 0.041 0.042 0.045 0.020 0.032
(1.16) (2.82) (2.43) (2.45) (2.67) (1.12) (1.65)
Liquidity Dummy -0.009 0.005 0.002 0.008 0.014 0.013 0.014
(-0.73) (0.58) (0.20) (0.89) (1.61) (1.49) (1.47)
CRA AAA -0.617 -0.591 -0.589 -0.693 -0.719 -0.700 -0.704 -0.497
(-25.79) (-26.56) (-26.47) (-16.06) (-16.06) (-15.89) (-14.18) (-7.61)
Vasicek AAA 0.012 0.080 0.015 0.014 0.108
(0.99) (3.04) (0.52) (0.45) (2.86)
Simulation AAA 0.108 0.151 0.192 0.061 0.078
(2.20) (2.92) (3.75) (1.10) (1.20)
CLO 0.034 0.035 0.146 0.034
(1.52) (1.59) (4.25) (0.89)
ABS CDO -0.024 0.015 0.158 -0.080
(-0.99) (0.58) (4.28) (-1.79)
CDO2 -0.027 0.006 0.099 -0.105
(-0.94) (0.22) (2.51) (-2.19)
Synthetic Dummy -0.008 -0.021 -0.026 0.100
(-0.68) (-1.73) (-2.02) (3.51)
Closing Year 2005 0.021 0.017 0.020
(1.84) (1.48) (1.93)
Closing Year 2006 0.026 0.016 0.040
(2.54) (1.50) (4.00)
Closing Year 2007 0.067 0.049 0.063
(5.67) (3.83) (4.85)
Multiple CRAs 0.000 0.003
(0.00) (0.17)
Excess Spread -0.000
(-1.90)
BDR-SDR -0.002
(-2.27)
N 653 653 653 653 653 653 653 653 500 342
Adjusted R2 0.003 0.126 0.505 0.581 0.577 0.586 0.590 0.610 0.669 0.676
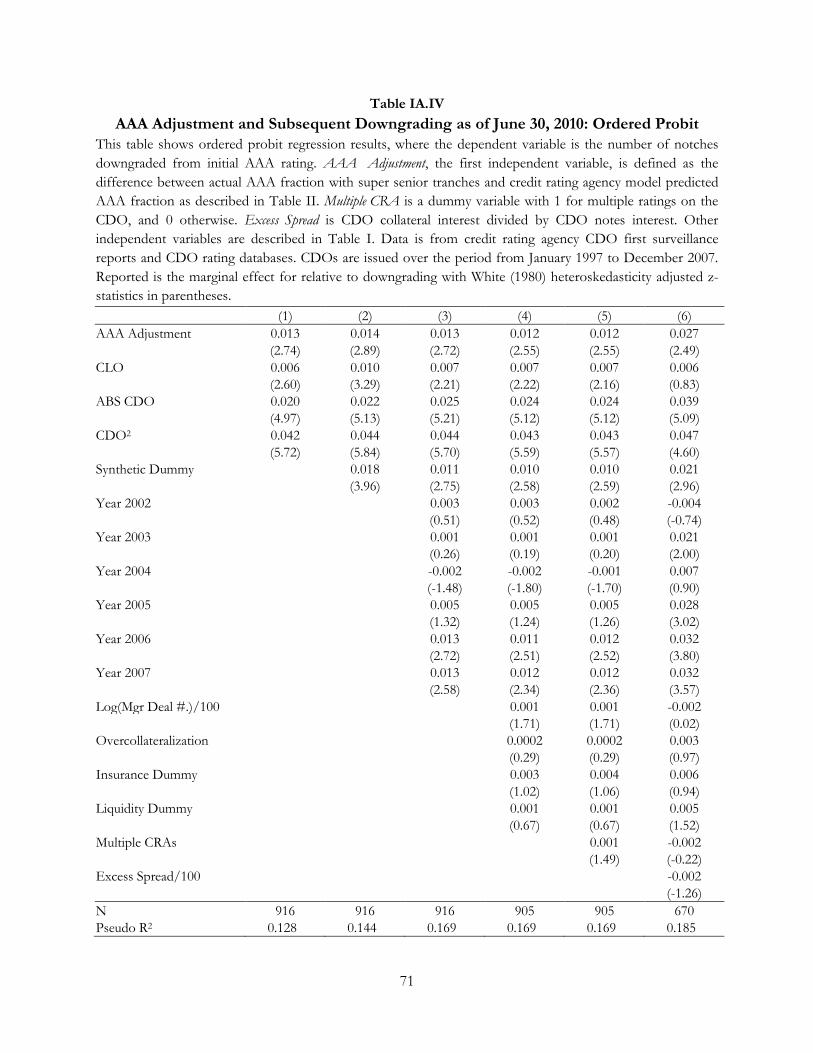
71
Table IA.IV
AAA Adjustment and Subsequent Downgrading as of June 30, 2010: Ordered Probit
This table shows ordered probit regression results, where the dependent variable is the number of notches
downgraded from initial AAA rating. AAA Adjustment, the first independent variable, is defined as the
difference between actual AAA fraction with super senior tranches and credit rating agency model predicted
AAA fraction as described in Table II. Multiple CRA is a dummy variable with 1 for multiple ratings on the
CDO, and 0 otherwise. Excess Spread is CDO collateral interest divided by CDO notes interest. Other
independent variables are described in Table I. Data is from credit rating agency CDO first surveillance
reports and CDO rating databases. CDOs are issued over the period from January 1997 to December 2007.
Reported is the marginal effect for relative to downgrading with White (1980) heteroskedasticity adjusted z-
statistics in parentheses.
(1) (2) (3) (4) (5) (6)
AAA Adjustment 0.013 0.014 0.013 0.012 0.012 0.027
(2.74) (2.89) (2.72) (2.55) (2.55) (2.49)
CLO 0.006 0.010 0.007 0.007 0.007 0.006
(2.60) (3.29) (2.21) (2.22) (2.16) (0.83)
ABS CDO 0.020 0.022 0.025 0.024 0.024 0.039
(4.97) (5.13) (5.21) (5.12) (5.12) (5.09)
CDO2 0.042 0.044 0.044 0.043 0.043 0.047
(5.72) (5.84) (5.70) (5.59) (5.57) (4.60)
Synthetic Dummy 0.018 0.011 0.010 0.010 0.021
(3.96) (2.75) (2.58) (2.59) (2.96)
Year 2002 0.003 0.003 0.002 -0.004
(0.51) (0.52) (0.48) (-0.74)
Year 2003 0.001 0.001 0.001 0.021
(0.26) (0.19) (0.20) (2.00)
Year 2004 -0.002 -0.002 -0.001 0.007
(-1.48) (-1.80) (-1.70) (0.90)
Year 2005 0.005 0.005 0.005 0.028
(1.32) (1.24) (1.26) (3.02)
Year 2006 0.013 0.011 0.012 0.032
(2.72) (2.51) (2.52) (3.80)
Year 2007 0.013 0.012 0.012 0.032
(2.58) (2.34) (2.36) (3.57)
Log(Mgr Deal #.)/100 0.001 0.001 -0.002
(1.71) (1.71) (0.02)
Overcollateralization 0.0002 0.0002 0.003
(0.29) (0.29) (0.97)
Insurance Dummy 0.003 0.004 0.006
(1.02) (1.06) (0.94)
Liquidity Dummy 0.001 0.001 0.005
(0.67) (0.67) (1.52)
Multiple CRAs 0.001 -0.002
(1.49) (-0.22)
Excess Spread/100 -0.002
(-1.26)
N 916 916 916 905 905 670
Pseudo R2 0.128 0.144 0.169 0.169 0.169 0.185

72
Table IA.V
AAA Adjustment and Subsequent Downgrading as of June 30, 2010: Plain Probit
This table shows plain probit regression results, where the dependent variable is a dummy variable equal to 1
if the AAA has been downgraded, and 0 otherwise. AAA Adjustment, the first independent variable, is defined
as the difference between actual AAA fraction with super senior tranches and credit rating agency model
predicted AAA fraction as described in Table II. Multiple CRA is a dummy variable with 1 for multiple ratings
on the CDO, and 0 otherwise. Excess Spread is CDO collateral interest divided by CDO notes interest. Other
independent variables are described in Table I. Data is from credit rating agency CDO first surveillance
reports and CDO rating databases. CDOs are issued over the period from January 1997 to December 2007.
Reported is the marginal effect for downgrading with White (1980) heteroskedasticity adjusted z-statistics in
parentheses.
(1) (2) (3) (4) (5) (6) AAA Adjustment 0.457 0.423 0.315 0.295 0.297 0.231 (3.25) (2.91) (2.06) (1.82) (1.83) (1.13) CLO 0.124 0.189 0.233 0.237 0.229 0.142 (2.12) (3.20) (2.96) (2.92) (2.81) (1.25) ABS CDO 0.517 0.528 0.580 0.577 0.571 0.450 (11.57) (12.08) (11.19) (10.91) (10.64) (5.18) CDO2 0.308 0.324 0.350 0.344 0.339 0.194 (5.94) (6.86) (7.59) (7.01) (6.73) (2.12) Synthetic Dummy 0.244 0.212 0.202 0.209 0.311 (4.70) (3.39) (3.05) (3.16) (5.04) Year 2002 -0.402 -0.402 -0.394 -0.221 (-4.70) (-4.72) (-4.52) (-1.62) Year 2003 -0.226 -0.236 -0.231 -0.013 (-2.30) (-2.41) (-2.34) (-0.11) Year 2004 -0.262 -0.281 -0.275 -0.116 (-3.06) (-3.26) (-3.17) (-1.05) Year 2005 -0.042 -0.057 -0.051 0.130 (-0.48) (-0.64) (-0.57) (1.49) Year 2006 0.030 0.004 0.008 0.155 (0.37) (0.04) (0.09) (1.76) Year 2007 -0.105 -0.130 -0.122 0.001 (-1.22) (-1.44) (-1.34) (0.01) Log(Mgr Deal #.) 0.036 0.035 0.007 (1.96) (1.93) (0.35) Overcollateralization 0.0002 0.0005 0.074 (0.01) (0.01) (0.80) Insurance Dummy 0.055 0.065 0.027 (0.74) (0.87) (0.29) Liquidity Dummy 0.030 0.030 0.096 (0.65) (0.66) (1.88) Multiple CRAs 0.137 0.040 (1.58) (0.28) Excess Spread/100 -0.060 (-1.90) N 916 916 916 905 905 670 Pseudo R2 0.137 0.151 0.187 0.187 0.189 0.220

73
Table IA.VI
AAA Adjustment and Subsequent Downgrading as of June 30, 2010: OLS
This table shows OLS regression results, where the dependent variable is the number of notches downgraded
from initial AAA rating. AAA Adjustment, the first independent variable, is defined as the difference between
actual AAA fraction with super senior tranches and credit rating agency model predicted AAA fraction as
described in Table II. Multiple CRA is a dummy variable with 1 for multiple ratings on the CDO and 0
otherwise. Excess Spread is CDO collateral interest divided by CDO notes interest. Other independent
variables are described in Table I. Data is from credit rating agency CDO first surveillance reports and CDO
rating databases. CDOs are issued over the period from January 1997 to December 2007. Reported is the
coefficient estimate with White (1980) heteroskedasticity adjusted z-statistics in parentheses.
(1) (2) (3) (4) (5) (6) Intercept -0.047 -1.191 -1.198 -1.795 -2.545 0.248 (-0.08) (-2.03) (-2.02) (-2.51) (-2.50) (0.15) AAA Adjustment 8.975 7.321 4.507 4.440 4.411 4.823 (6.50) (5.49) (3.50) (3.21) (3.19) (2.98) CLO -0.261 1.148 -0.489 -0.483 -0.546 -2.397 (-0.40) (1.79) (-0.63) (-0.61) (-0.68) (-2.27) ABS CDO 11.878 11.858 10.898 10.783 10.702 8.659 (18.19) (18.99) (14.98) (14.63) (14.43) (7.92) CDO2 9.724 10.332 8.889 8.676 8.598 5.563 (10.01) (11.10) (9.08) (8.63) (8.53) (4.40) Synthetic Dummy 5.265 2.908 2.852 2.891 3.606 (9.29) (4.99) (4.65) (4.71) (5.10) Year 2002 -3.558 -3.505 -3.435 -0.671 (-3.30) (-3.24) (-3.17) (-0.56) Year 2003 -0.298 -0.441 -0.382 2.558 (-0.30) (-0.45) (-0.39) (2.33) Year 2004 -1.473 -1.593 -1.550 1.160 (-1.69) (-1.80) (-1.75) (1.17) Year 2005 1.234 1.141 1.184 4.087 (1.51) (1.36) (1.41) (4.32) Year 2006 3.751 3.533 3.561 5.518 (4.78) (4.33) (4.37) (6.02) Year 2007 3.814 3.582 3.641 5.356 (4.76) (4.26) (4.32) (5.65) Log(Mgr Deal #.) 0.391 0.389 0.068 (2.27) (2.26) (0.37) Overcollateralization 0.109 0.110 0.408 (0.33) (0.34) (0.84) Insurance Dummy 1.315 1.363 1.456 (1.80) (1.86) (1.70) Liquidity Dummy 0.162 0.164 0.337 (0.38) (0.39) (0.71) Multiple CRAs 0.811 -0.485 (1.03) (-0.40) Excess Spread -0.008 (-2.70) N 916 916 916 905 905 670 Adjusted R2 0.505 0.548 0.607 0.606 0.606 0.667
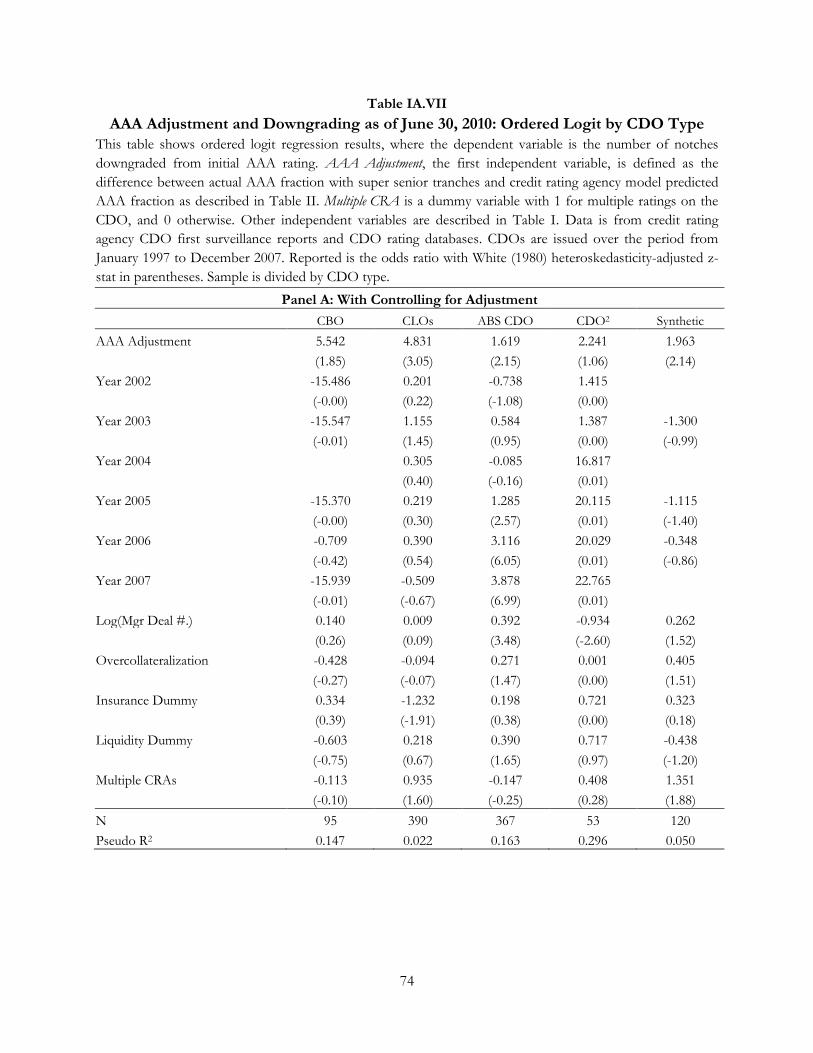
74
Table IA.VII
AAA Adjustment and Downgrading as of June 30, 2010: Ordered Logit by CDO Type
This table shows ordered logit regression results, where the dependent variable is the number of notches
downgraded from initial AAA rating. AAA Adjustment, the first independent variable, is defined as the
difference between actual AAA fraction with super senior tranches and credit rating agency model predicted
AAA fraction as described in Table II. Multiple CRA is a dummy variable with 1 for multiple ratings on the
CDO, and 0 otherwise. Other independent variables are described in Table I. Data is from credit rating
agency CDO first surveillance reports and CDO rating databases. CDOs are issued over the period from
January 1997 to December 2007. Reported is the odds ratio with White (1980) heteroskedasticity-adjusted z-
stat in parentheses. Sample is divided by CDO type.
Panel A: With Controlling for Adjustment
CBO CLOs ABS CDO CDO2 Synthetic
AAA Adjustment 5.542 4.831 1.619 2.241 1.963
(1.85) (3.05) (2.15) (1.06) (2.14)
Year 2002 -15.486 0.201 -0.738 1.415
(-0.00) (0.22) (-1.08) (0.00)
Year 2003 -15.547 1.155 0.584 1.387 -1.300
(-0.01) (1.45) (0.95) (0.00) (-0.99)
Year 2004 0.305 -0.085 16.817
(0.40) (-0.16) (0.01)
Year 2005 -15.370 0.219 1.285 20.115 -1.115
(-0.00) (0.30) (2.57) (0.01) (-1.40)
Year 2006 -0.709 0.390 3.116 20.029 -0.348
(-0.42) (0.54) (6.05) (0.01) (-0.86)
Year 2007 -15.939 -0.509 3.878 22.765
(-0.01) (-0.67) (6.99) (0.01)
Log(Mgr Deal #.) 0.140 0.009 0.392 -0.934 0.262
(0.26) (0.09) (3.48) (-2.60) (1.52)
Overcollateralization -0.428 -0.094 0.271 0.001 0.405
(-0.27) (-0.07) (1.47) (0.00) (1.51)
Insurance Dummy 0.334 -1.232 0.198 0.721 0.323
(0.39) (-1.91) (0.38) (0.00) (0.18)
Liquidity Dummy -0.603 0.218 0.390 0.717 -0.438
(-0.75) (0.67) (1.65) (0.97) (-1.20)
Multiple CRAs -0.113 0.935 -0.147 0.408 1.351
(-0.10) (1.60) (-0.25) (0.28) (1.88)
N 95 390 367 53 120
Pseudo R2 0.147 0.022 0.163 0.296 0.050

75
Table IA.VII―Continued
Panel B: Without Controlling for Adjustment
CBO CLOs ABS CDO CDO2 Synthetic
Year 2002 -15.531 0.377 -0.851 0.668
(-0.00) (0.43) (-1.25) (0.00)
Year 2003 -15.501 1.062 0.448 0.662 -1.382
(-0.01) (1.36) (0.73) (0.00) (-1.07)
Year 2004 0.385 -0.240 14.962
(0.52) (-0.46) (0.01)
Year 2005 -16.055 0.399 1.215 18.110 -1.386
(-0.00) (0.55) (2.43) (0.01) (-1.77)
Year 2006 -0.110 0.594 3.137 18.254 -0.321
(-0.07) (0.84) (6.07) (0.01) (-0.80)
Year 2007 -15.590 -0.038 3.936 21.175
(-0.01) (-0.05) (7.09) (0.01)
Log(Mgr Deal #.) 0.074 0.041 0.387 -0.946 0.277
(0.14) (0.44) (3.44) (-2.65) (1.62)
Overcollateralization -1.169 -0.790 0.108 -0.114 0.082
(-0.78) (-0.57) (0.65) (-0.33) (0.37)
Insurance Dummy 0.799 -0.440 0.141 0.532 0.339
(1.05) (-0.80) (0.27) (0.00) (0.19)
Liquidity Dummy -0.475 0.196 0.433 0.815 -0.500
(-0.60) (0.60) (1.83) (1.12) (-1.38)
Multiple CRAs -0.595 0.974 -0.194 0.496 1.403
(-0.58) (1.68) (-0.34) (0.34) (2.01)
N 95 390 367 53 120
Pseudo R2 0.104 0.013 0.160 0.288 0.038

76
Table IA.VIII
Residual AAA Adjustment and Downgrading as of June 30, 2010: Ordered Logit
This table shows ordered logit regression results, where the dependent variable is the number of notches
downgraded from initial AAA rating. AAA Adjustment Residual, the first independent variable, is the residual
in the AAA fraction adjustment regression reported in Column 8 of Table III. Multiple CRA is a dummy
variable with 1 for multiple ratings on the CDO, and 0 otherwise. Excess Spread is CDO collateral interest
divided by CDO notes interest. Other independent variables are described in Table I. Data is from credit
rating agency CDO first surveillance reports and CDO rating databases. CDOs are issued over the period
from January 1997 to December 2007. Reported is the odds ratio with White (1980) heteroskedasticity-
adjusted z-stat in parentheses.
(1) (2) (3) (4) (5) (6)
AAA Adjustment Residual 6.230 5.931 6.641 6.452 6.514 8.558
(3.31) (3.19) (3.34) (3.32) (3.33) (3.13)
CLO 3.901 6.830 3.694 4.038 3.942 2.225
(4.20) (5.49) (3.30) (3.49) (3.42) (1.25)
ABS CDO 53.417 67.901 66.202 72.193 70.227 47.848
(11.82) (11.94) (10.79) (10.90) (10.79) (5.86)
CDO2 42.885 60.357 46.960 51.904 50.750 21.052
(8.69) (9.00) (8.03) (8.12) (8.06) (4.21)
Synthetic Dummy 5.210 2.529 2.613 2.634 3.151
(7.59) (3.97) (3.98) (4.01) (3.80)
Year 2002 0.260 0.261 0.265 0.626
(-2.57) (-2.57) (-2.54) (-0.78)
Year 2003 1.212 1.146 1.155 3.473
(0.42) (0.30) (0.32) (2.44)
Year 2004 0.703 0.687 0.697 1.499
(-0.89) (-0.94) (-0.90) (0.86)
Year 2005 2.052 2.010 2.026 5.192
(1.97) (1.87) (1.89) (3.70)
Year 2006 4.292 4.029 4.054 8.834
(4.05) (3.78) (3.80) (4.92)
Year 2007 4.395 4.075 4.131 7.910
(4.01) (3.69) (3.72) (4.52)
Log(Mgr Deal #.) 1.148 1.146 1.017
(2.10) (2.08) (0.22)
Overcollateralization 0.900 0.899 1.017
(-0.93) (-0.94) (0.10)
Insurance Dummy 1.859 1.885 1.799
(1.98) (2.02) (1.50)
Liquidity Dummy 1.107 1.109 1.364
(0.59) (0.60) (1.55)
Multiple CRAs 1.297 0.929
(0.77) (-0.14)
Excess Spread 0.998
(-1.28)
N 905 905 905 905 905 670
Pseudo R2 0.119 0.136 0.166 0.168 0.169 0.183
77
Table IA.IX
AAA Fraction Adjustment and Subsequent Downgrading as of June 30, 2010:
Restricting the Gap between First Surveillance Report Date and Closing Date
This table shows ordered logit regression results. The dependent variable is the number of notches
downgraded from initial AAA rating. AAA Adjustment, the first independent variable, is defined as the
difference between actual AAA fraction with super senior tranches and credit rating agency model predicted
AAA fraction as described in Table II. Multiple CRA is a dummy variable with 1 for multiple ratings on the
CDO, and 0 otherwise. Excess Spread is the ratio of average collateral coupon rate over average CDO notes
coupon rate. Other independent variables are described in Table I. CDO2 dummy is not included as model
cannot be estimated properly. Data is from credit rating agency CDO first surveillance reports and CDO
rating databases. CDOs are issued over the period from January 1997 to December 2007. Reported is the
odds ratio with White (1980) heteorskedasticity-adjusted z-statistics in parentheses.
(continued)

78
Table IA.IX―Continued
Panel A: First Surveillance Report Is Issued within 180-Days after Closing
(1) (2) (3) (4) (5) (6)
AAA Adjustment 3.177 2.883 2.205 2.318 2.336 3.352
(4.81) (4.40) (3.10) (2.99) (3.00) (3.21)
CLO -2.069 -1.706 -1.897 -1.942 -2.021 -3.198
(-6.20) (-4.73) (-5.13) (-5.12) (-5.30) (-6.07)
ABS CDO 1.334 1.451 1.539 1.459 1.377 0.560
(4.06) (4.20) (4.37) (4.07) (3.83) (1.08)
Synthetic Dummy 1.044 0.703 0.674 0.734 1.322
(3.80) (2.43) (2.24) (2.42) (3.22)
Year 2002 -2.504 -2.456 -2.365 -2.006
(-1.23) (-1.21) (-1.17) (-0.95)
Year 2003 -1.971 -2.010 -2.047 -1.682
(-1.01) (-1.02) (-1.04) (-0.81)
Year 2004 -2.990 -2.993 -2.982 -3.628
(-1.54) (-1.55) (-1.54) (-1.78)
Year 2005 -1.692 -1.657 -1.631 -1.690
(-0.88) (-0.86) (-0.85) (-0.83)
Year 2006 -0.911 -0.899 -0.890 -1.176
(-0.48) (-0.47) (-0.46) (-0.58)
Year 2007 -1.128 -1.110 -1.068 -1.543
(-0.59) (-0.58) (-0.55) (-0.76)
Log(Mgr Deal #.) 0.145 0.142 0.021
(1.73) (1.69) (0.22)
Overcollateralization 0.118 0.110 0.201
(0.81) (0.75) (1.02)
Insurance Dummy 0.281 0.343 0.493
(0.68) (0.82) (0.94)
Liquidity Dummy 0.152 0.161 0.183
(0.66) (0.70) (0.68)
Multiple CRAs 1.194 0.428
(2.52) (0.65)
Excess Spread -0.002
(-0.85)
N 530 530 530 523 523 404
Pseudo R2 0.130 0.137 0.157 0.158 0.162 0.195

79
Table IA.IX―Continued
Panel B: First Surveillance Report Is Issued within 365-Days after Closing
(1) (2) (3) (4) (5) (6)
AAA Adjustment 3.314 2.972 2.203 2.371 2.373 3.066
(5.42) (4.86) (3.35) (3.35) (3.35) (3.33)
CLO -1.490 -1.111 -1.426 -1.385 -1.431 -2.525
(-4.92) (-3.38) (-4.16) (-3.94) (-4.07) (-5.21)
ABS CDO 1.898 2.036 2.072 2.104 2.051 1.356
(6.12) (6.31) (6.27) (6.22) (6.05) (2.76)
Synthetic Dummy 0.877 0.420 0.350 0.379 0.822
(3.65) (1.66) (1.34) (1.45) (2.40)
Year 2002 -2.145 -2.136 -2.072 -1.628
(-1.42) (-1.40) (-1.36) (-1.05)
Year 2003 -0.545 -0.653 -0.665 -0.219
(-0.38) (-0.45) (-0.46) (-0.15)
Year 2004 -2.053 -2.169 -2.153 -2.192
(-1.44) (-1.50) (-1.49) (-1.49)
Year 2005 -0.606 -0.673 -0.651 -0.415
(-0.43) (-0.47) (-0.46) (-0.29)
Year 2006 0.104 0.002 0.019 0.131
(0.07) (0.00) (0.01) (0.09)
Year 2007 0.002 -0.095 -0.056 -0.162
(0.00) (-0.07) (-0.04) (-0.11)
Log(Mgr Deals) 0.131 0.128 -0.012
(1.77) (1.73) (-0.14)
Overcollateralization 0.124 0.118 0.229
(0.97) (0.92) (1.22)
Insurance Dummy 0.254 0.297 0.488
(0.67) (0.78) (1.05)
Liquidity Dummy 0.131 0.135 0.332
(0.65) (0.67) (1.42)
Multiple CRAs 0.891 0.476
(2.04) (0.76)
Excess Spread -0.001
(-0.76)
N 663 663 663 654 654 501
Pseudo R2 0.125 0.130 0.153 0.154 0.156 0.188
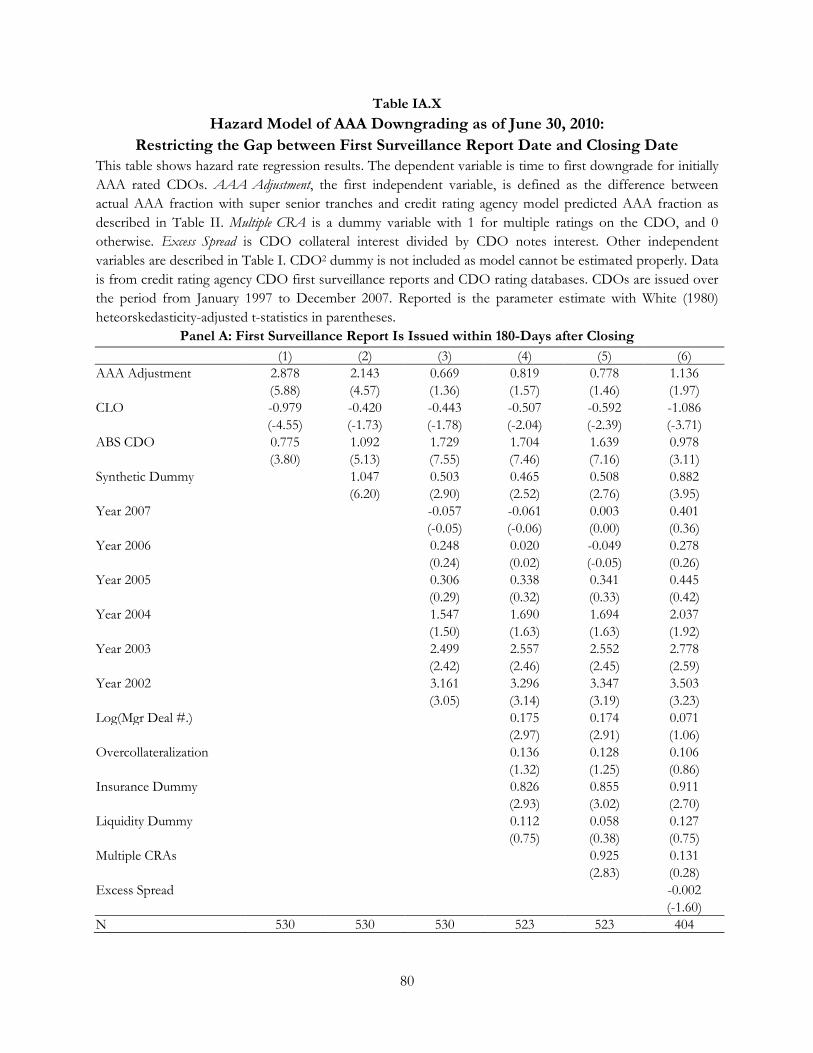
80
Table IA.X
Hazard Model of AAA Downgrading as of June 30, 2010:
Restricting the Gap between First Surveillance Report Date and Closing Date
This table shows hazard rate regression results. The dependent variable is time to first downgrade for initially
AAA rated CDOs. AAA Adjustment, the first independent variable, is defined as the difference between
actual AAA fraction with super senior tranches and credit rating agency model predicted AAA fraction as
described in Table II. Multiple CRA is a dummy variable with 1 for multiple ratings on the CDO, and 0
otherwise. Excess Spread is CDO collateral interest divided by CDO notes interest. Other independent
variables are described in Table I. CDO2 dummy is not included as model cannot be estimated properly. Data
is from credit rating agency CDO first surveillance reports and CDO rating databases. CDOs are issued over
the period from January 1997 to December 2007. Reported is the parameter estimate with White (1980)
heteorskedasticity-adjusted t-statistics in parentheses.
Panel A: First Surveillance Report Is Issued within 180-Days after Closing
(1) (2) (3) (4) (5) (6)
AAA Adjustment 2.878 2.143 0.669 0.819 0.778 1.136 (5.88) (4.57) (1.36) (1.57) (1.46) (1.97)
CLO -0.979 -0.420 -0.443 -0.507 -0.592 -1.086 (-4.55) (-1.73) (-1.78) (-2.04) (-2.39) (-3.71)
ABS CDO 0.775 1.092 1.729 1.704 1.639 0.978 (3.80) (5.13) (7.55) (7.46) (7.16) (3.11)
Synthetic Dummy 1.047 0.503 0.465 0.508 0.882 (6.20) (2.90) (2.52) (2.76) (3.95)
Year 2007 -0.057 -0.061 0.003 0.401 (-0.05) (-0.06) (0.00) (0.36)
Year 2006 0.248 0.020 -0.049 0.278 (0.24) (0.02) (-0.05) (0.26)
Year 2005 0.306 0.338 0.341 0.445 (0.29) (0.32) (0.33) (0.42)
Year 2004 1.547 1.690 1.694 2.037 (1.50) (1.63) (1.63) (1.92)
Year 2003 2.499 2.557 2.552 2.778 (2.42) (2.46) (2.45) (2.59)
Year 2002 3.161 3.296 3.347 3.503 (3.05) (3.14) (3.19) (3.23)
Log(Mgr Deal #.) 0.175 0.174 0.071 (2.97) (2.91) (1.06)
Overcollateralization 0.136 0.128 0.106 (1.32) (1.25) (0.86)
Insurance Dummy 0.826 0.855 0.911 (2.93) (3.02) (2.70)
Liquidity Dummy 0.112 0.058 0.127 (0.75) (0.38) (0.75)
Multiple CRAs 0.925 0.131 (2.83) (0.28)
Excess Spread -0.002
(-1.60)
N 530 530 530 523 523 404

81
Table IA.X―Continued
Panel B: First Surveillance Report Is Issued within 365-Days after Closing
(1) (2) (3) (4) (5) (6)
AAA Adjustment 3.287 2.454 0.887 1.087 1.078 1.284 (7.32) (5.66) (1.89) (2.20) (2.14) (2.18)
CLO -0.677 -0.033 -0.156 -0.163 -0.229 -0.666 (-3.37) (-0.15) (-0.67) (-0.69) (-0.96) (-2.24)
ABS CDO 1.050 1.414 1.983 2.032 1.986 1.560 (5.38) (6.92) (9.08) (9.15) (8.92) (5.59)
Synthetic Dummy 1.183 0.553 0.471 0.490 0.647 (7.62) (3.48) (2.79) (2.91) (3.38)
Year 2007 -0.075 0.027 0.087 0.617 (-0.07) (0.02) (0.08) (0.56)
Year 2006 0.661 0.579 0.544 0.941 (0.64) (0.56) (0.52) (0.90)
Year 2005 0.369 0.399 0.404 0.764 (0.36) (0.39) (0.39) (0.73)
Year 2004 1.818 1.989 1.993 2.486 (1.78) (1.94) (1.94) (2.38)
Year 2003 2.854 2.938 2.937 3.374 (2.79) (2.85) (2.85) (3.21)
Year 2002 3.510 3.650 3.695 4.061 (3.41) (3.52) (3.56) (3.83)
Log(Mgr Deal #.) 0.180 0.181 0.070 (3.43) (3.43) (1.15)
Overcollateralization 0.157 0.154 0.181 (1.71) (1.69) (1.52)
Insurance Dummy 0.680 0.695 0.717 (2.63) (2.68) (2.42)
Liquidity Dummy 0.165 0.128 0.247 (1.21) (0.93) (1.66)
Multiple CRAs 0.787 0.219 (2.53) (0.47)
Excess Spread -0.001
(-1.07)
N 663 663 663 654 654 501

82
Table IA.XI
AAA Fraction Adjustment and Subsequent Downgrade as of July 31, 2009
This table shows regression results, where the dependent variable is the number of notches downgraded from
initial AAA rating, or downgrade notches plus 0.5 if the tranche is on negative rating watch list („w/ Watch‟,
as of July 31, 2009) for potential downgrade. AAA Adjustment, the first independent variable, is defined as
the difference between actual AAA fraction with super senior tranches and credit rating agency model
predicted AAA fraction as described in Table III. The last independent variable, Multiple CRA, is a dummy
variable with 1 for multiple rating on the CDO, and 0 otherwise. Other independent variables are described in
Table I. Data is from credit rating agency CDO first surveillance reports and CDO rating databases. CDOs
are issued over the period from January 1997 to December 2007. Panel A is for ordered logit regression
where the dependent variable is AAA downgrade notches. Reported are the odds ratio and heteorskedasticity
adjusted robust z-stat in parentheses. Panel B is for ordered probit, plain probit, and OLS regressions.
Dependent variables are notches downgraded from AAA for specifications (1), (3), (5), and notches
downgraded plus a half notch for rating watch negative for specifications (2), (4), and (6). Reported are
coefficient estimates and White (1980) heteorskedasticity adjusted robust z-stat (for ordered logit, ordered
probit, and plain probit) or t-stat (for OLS) in parentheses.
(continued)

83
Table IA.XI―Continued
Panel A: Ordered Logit Regression
Dependent Variable: AAA Downgrade Notches
All CDOs CLOs Ex-CLOs
(1) (2) (3) (4) (5) (6) (7)
AAA Adjustment 25.587 15.686 7.252 7.020 6.796 88.9 5.634
(6.66) (5.67) (3.96) (3.66) (3.60) (2.83) (2.83)
CLO 2.505 4.372 2.470 2.670 2.716
(2.70) (3.40) (1.92) (2.12) (2.16)
ABS CDO 60.098 76.053 78.140 81.120 87.323 64.176
(11.28) (10.16) (9.39) (9.71) (9.83) (8.72)
CDO2 36.207 50.290 43.064 42.271 43.123 29.218
(6.90) (6.64) (6.26) (6.05) (6.07) (5.46)
Synthetic Dummy 4.216 2.060 2.010 2.030 1.018
(7.04) (3.27) (2.96) (3.04) (0.06)
Year 2007 4.905 4.567 4.092 0.735 11.005
(3.24) (3.24) (3.00) (-0.35) (4.56)
Year 2006 4.437 4.114 3.736 1.274 5.358
(3.11) (3.09) (2.88) (0.28) (3.48)
Year 2005 1.892 1.860 1.669 1.059 1.174
(1.32) (1.34) (1.10) (0.07) (0.35)
Year 2004 0.681 0.643 0.603 0.957 0.376
(-0.70) (-0.86) (-0.99) (-0.05) (-1.98)
Year 2003 1.185 1.076 1.103 2.799 0.438
(0.26) (0.11) (0.15) (1.08) (-1.31)
Year 2002 0.228 0.230 0.222 1.112 0.115
(-2.08) (-2.15) (-2.16) (0.11) (-3.24)
Log(Mgr Deals) 1.166 1.162 1.001 1.314
(2.20) (2.14) (0.01) (2.63)
Overcollateralization 1.058 1.042 0.862 1.117
(0.50) (0.37) (-0.09) (1.11)
Insurance Dummy 2.086 2.093 0.508 2.075
(2.15) (2.14) (-0.92) (1.44)
Liquidity Dummy 1.170 1.173 1.182 1.216
(0.84) (0.86) (0.46) (0.93)
Multiple CRAs 0.688 0.332 0.985
(-1.46) (-1.50) (-0.06)
N 899 899 899 888 888 388 500
Pseudo R2 0.143 0.157 0.188 0.189 0.190 0.015 0.193
(continued)

84
Table IA.XI―Continued
Panel B: Alternative Econometric Specifications
Ordered Probit Plain Probit OLS
Downgrade w/ Watch Downgrade w/ Watch Downgrade w/ Watch
(1) (2) (3) (4) (5) (6)
AAA Adjustment 1.148 1.154 1.174 1.157 4.834 4.841 (3.67) (3.69) (2.84) (2.81) (3.53) (3.53)
CLO 0.451 0.400 0.831 0.776 -0.280 -0.350 (1.82) (1.65) (3.29) (3.10) (-0.33) (-0.42)
ABS CDO 2.450 2.417 2.328 2.267 11.354 11.371 (9.90) (10.01) (9.67) (9.51) (13.65) (13.68)
CDO2 2.099 2.058 1.607 1.549 8.754 8.716 (6.55) (6.51) (5.44) (5.29) (6.23) (6.19)
Synthetic Dummy 0.471 0.462 0.589 0.622 2.723 2.646 (3.58) (3.50) (3.72) (3.84) (4.59) (4.47)
Year 2007 0.685 0.704 0.064 0.086 3.477 3.504 (2.88) (2.97) (0.25) (0.34) (3.48) (3.50)
Year 2006 0.617 0.645 0.223 0.259 3.274 3.318 (2.71) (2.85) (0.89) (1.04) (3.34) (3.38)
Year 2005 0.172 0.196 0.051 0.079 0.672 0.759 (0.74) (0.85) (0.20) (0.31) (0.66) (0.74)
Year 2004 -0.355 -0.335 -0.507 -0.479 -1.737 -1.700 (-1.40) (-1.33) (-1.87) (-1.78) (-1.54) (-1.51)
Year 2003 -0.026 -0.008 -0.303 -0.277 -0.520 -0.496 (-0.09) (-0.03) (-0.99) (-0.91) (-0.43) (-0.41)
Year 2002 -0.830 -0.811 -0.902 -0.875 -3.656 -3.636 (-2.34) (-2.29) (-2.49) (-2.43) (-2.88) (-2.85)
Log(Mgr Deal #.) 0.079 0.081 0.099 0.099 0.421 0.424 (1.97) (2.01) (2.09) (2.09) (2.53) (2.54)
Overcollateralization 0.016 0.017 0.025 0.024 0.078 0.088 (0.24) (0.25) (0.34) (0.33) (0.24) (0.27)
Insurance Dummy 0.328 0.326 0.454 0.447 1.478 1.486 (1.84) (1.83) (1.99) (1.98) (2.17) (2.18)
Liquidity Dummy 0.112 0.127 0.117 0.128 0.245 0.271 (1.09) (1.23) (0.92) (1.01) (0.53) (0.59)
Multiple CRAs -0.196 -0.202 -0.271 -0.269 -0.441 -0.460 (-1.37) (-1.41) (-1.66) (-1.65) (-0.61) (-0.64)
Constant -1.759 -1.729 -2.110 -2.100 (-6.08) (-6.10) (-2.85) (-2.84)
N 888 888 888 888 888 888
Pseudo/Adjusted R2 0.190 0.178 0.274 0.272 0.614 0.616

85
Table IA.XII
Characteristics of CDOs with Constant Criterion and Identical Model Output
This table summarizes the characteristics of 27 CDOs with constant default probability criterion (independent of maturity) and identical SDR across all
ratings. Variable definitions are in Table I. Manager (Mgr), underwriter (UW), and analyst names are coded with a number. # Raters is the number of
rating agencies rating the CDO. AAA dng is the number of notches the AAA tranche of the CDO was downgraded as of July 31, 2009.
CDO #
Closing Date
Rating Date
Structure Type Mgr # UW # Report Date
WAM WAR #
Assets Corr.
Credit Analyst #
Surveillance Analyst #
Original Amt
# Raters
AAA Spread
AAA Dng
1 12/28/00 12/29/00 Cash CBO 7 8 8/15/08 3.41 BB- 117 0.15 14 1 500 2 50 0
2 2/6/01 2/7/01 Cash ABS CDO 6 11 8/18/08 6.54 B- 94 0.31 5 1 300 2 48 3
3 4/19/01 5/7/01 Cash CLO 9 14 8/13/08 3.42 B 333 0.30 7 1 438 3 50 3
4 5/24/01 6/4/01 Cash ABS CDO 12 6 8/29/08 7.18 B- 38 0.18 4 1 240 3 48 0
5 12/18/01 1/3/02 Cash CBO 7 1 8/15/08 5.45 B+ 142 0.25 7 1 327 2 50 0
6 11/14/02 11/20/02 Cash ABS CDO 6 18 8/22/08 7.14 BB 306 0.64 7 1 300 3 55 4
7 10/29/03 10/29/03 Cash ABS CDO 8 2 8/29/08 7.21 BBB- 88 0.39 2 1 400 3 12 0
8 4/22/04 4/27/04 Cash ABS CDO 1 5 7/31/08 7.20 BBB- 104 0.48 7 1 410 2 60 3
9 7/29/04 9/1/04 Cash ABS CDO 14 16 8/29/08 7.14 A 318 0.55 7 1 2442 2 NA 3
10 7/30/04 8/4/04 Cash CLO 7 9 8/18/08 5.23 B+ 105 0.17 7 1 216 2 43 0
11 10/26/04 11/1/04 Cash ABS CDO 1 10 9/2/08 7.31 B+ 221 0.75 7 1 550 2 36 19
12 6/9/05 7/1/05 Cash ABS CDO 15 13 8/29/08 8.48 BB- 135 0.55 11 1 382 2 27 9
13 12/15/05 12/23/05 Cash ABS CDO 1 15 9/5/08 7.54 B+ 136 0.69 7 1 500 1 27.5 19
14 4/20/06 4/25/06 Cash CDO2 5 4 8/28/08 7.08 BB+ 92 0.54 6 2 287 2 15 0
15 7/27/06 8/3/06 Synthetic CBO 1 11 8/7/08 4.15 B+ 89 0.17 3 1 301 2 24 0
16 9/13/06 9/28/06 Cash CLO 3 15 7/3/08 5.17 B+ 168 0.28 5 1 300 2 NA 0
17 10/26/06 11/1/06 Synthetic ABS CDO 11 12 8/29/08 7.49 CCC+ 214 0.82 9 1 1504 2 30 19
18 11/21/06 12/4/06 Cash CLO 2 3 8/13/08 4.92 B 442 0.32 13 1 399 1 NA 0
19 12/14/06 12/29/06 Cash CLO 10 7 6/11/07 6.15 B+ 232 0.25 10 1 400 2 24 0
20 12/15/06 12/21/06 Cash ABS CDO 1 7 8/29/08 7.00 B- 95 0.65 2 1 350 2 43* 14
21 12/19/06 12/29/06 Cash CDO2 5 4 8/10/08 7.72 BB- 103 0.59 12 1 334 2 15 11
22 12/21/06 12/28/06 Synthetic CBO 1 9 8/11/08 4.64 BBB- 100 0.09 9 1 1000 2 20 0
23 1/10/07 1/18/07 Cash ABS CDO 1 17 8/31/08 7.00 CCC- 105 0.76 1 1 500 2 32 19
24 1/24/07 2/1/07 Cash CLO 2 3 7/10/08 4.98 B 453 0.33 13 1 484 2 NA 0
25 5/1/07 5/21/07 Cash CLO 4 5 7/18/08 4.87 B 331 0.60 13 1 400 2 22.5 0
26 6/28/07 7/2/07 Synthetic ABS CDO 3 7 9/8/08 7.00 B- 178 0.79 5 1 1000 1 45 19
27 7/19/07 8/1/07 Cash CLO 13 12 9/2/08 5.43 B 91 0.39 8 1 309 2 29 0

86
Table IA.XIII
Characteristics of CDOs Issued Before and After April 1, 2007
This table reports the mean value of deal characteristics for CDOs issued before and after April 1, 2007.
CDOs are issued over the period from January 1997 to December 2007. Col. Rating is the collateral asset
average credit rating. Correlation is the collateral asset weighted average correlation. Col. Maturity is the
collateral asset weighted average maturity. Col. Size is the total principal value of collateral assets. #. Assets is
the number of assets in the collateral pool. #. Obligors is the number of distinctive obligors for the collateral
assets. Synthetic Dummy equals to 1 if the CDO is structured synthetically (using credit default swap, CDS,
contracts) and 0 if the CDO is a cash deal. Overcollateralization is the ratio of total collateral asset principal
value over total liability principal value. Insurance Dummy equals to 1 if the AAA tranche of the CDO is insured
and 0 otherwise. Liquidity Dummy equals to 1 if the CDO has liquidity facility (such as a revolving credit line
or hedging agreements), and 0 otherwise. CRA AAA is the AAA fraction from CRA model. Simulation AAA
is the AAA fraction from the simulation model. AAA Adjustment is the difference between the actual AAA
fraction and the CRA AAA. The summary statistics are reported for collateralized bond obligations (CBOs),
collateralized loan obligations (CLOs), CDOs collateralized with asset-backed securities (ABS CDO), and
CDOs consisting of notes of existing CDOs (CDO2).
Variables
All CBO CLO ABS CDO CDO2
Before After Before After Before After Before After Before After
#. Obs. 778 138 85 11 321 72 329 44 43 11
Col. Rating 10.97 11.89 13.48 11.91 14.41 14.79 7.15 7.93 9.23 8.73
Correlation 0.39 0.55 0.18 0.44 0.29 0.54 0.53 0.56 0.54 0.60
Col. Maturity 6.49 6.23 5.14 6.56 5.72 5.82 7.29 6.79 8.83 6.31
Col. Size 605.6 796 347.9 754 466.8 535 821.5 1198 499.8 940
#. Assets 210.2 264 125.9 242 318.9 357 142.6 161 82.3 91
#. Obligors 127.7 143 102.0 122 155.6 169 114.6 121 71.0 76
Synthetic Dummy 0.11 0.25 0.19 0.73 0.00 0.00 0.21 0.50 0.07 0.45
Overcollateralization 1.01 0.98 0.88 0.96 0.95 0.96 1.05 1.00 1.40 1.09
Insurance Dummy 0.06 0.04 0.21 0.00 0.05 0.00 0.04 0.14 0.07 0.00
Liquidity Dummy 0.25 0.14 0.48 0.36 0.12 0.06 0.30 0.18 0.40 0.27
Actual AAA 0.753 0.761 0.738 0.729 0.726 0.726 0.794 0.828 0.706 0.751
CRA AAA 0.643 0.579 0.626 0.610 0.581 0.498 0.720 0.695 0.556 0.616
Simulation AAA 0.622 0.511 0.646 0.541 0.531 0.412 0.706 0.652 0.605 0.566
AAA Adjustment 0.110 0.182 0.102 0.119 0.145 0.228 0.074 0.133 0.150 0.135

87
Table IA.XIV
CRA Model and Monte Carlo Simulation
This table provides the mean and standard deviation of the statistics for the AAA fraction obtained from a
leading credit rating agency (CRA Model) and from a Gaussian Copula Monte Carlo Simulation model (MC
AAA). The correlation between the two is also reported. The summary statistics are reported for
collateralized bond obligations (CBOs), collateralized loan obligations (CLOs), CDOs collateralized with
asset-backed securities (ABS CDO), and CDOs consisting of notes of existing CDOs (CDO2). Results are
further divided by whether the CDO is a cash deal or synthetic deal with CDS contracts. The CDOs are
issued from January 1997 to December 2007. The Monte Carlo Simulation inputs are average collateral
default rates, maturity, correlations, and number of assets reported by the CRA. The default rate criterion for
AAA scenario is taken from the CRA‟s manual. he simulation approach is described in the Appendix. For
our simulation‟s recovery rate assumptions, a fixed 40% recovery rate is used for all CDOs.
All
Cash
Synthetic
CBO CLO ABS CDO
CDO2 CBO CLO ABS CDO
CDO2
N 916 72 393 281 46 24 0 92 8
CRA AAA 0.63 0.62 0.57 0.76 0.56 0.63 - 0.59 0.60
Std. dev. 0.16 0.13 0.076 0.15 0.19 0.13 - 0.20 0.14
MC AAA 0.58 0.60 0.49 0.70 0.58 0.61 - 0.56 0.57
Std. dev. 0.14 0.11 0.06 0.14 0.14 0.12 - 0.12 0.15
Correlation 0.82 0.76 0.44 0.86 0.73 0.72 - 0.82 0.23

88
Table IA.XV
Rating Agency and Our Simulation AAA Fraction Percentage Difference Regressions
This table reports coefficient estimates from OLS regressions. The dependent variables are the percentage
difference between the CDO AAA fraction from the credit rating agency model and from a Monte Carlo
Model (CRA AAA – Monte Carlo AAA)/CRA AAA. The Monte Carlo Simulation inputs are average
collateral default rates, maturity, correlations, and number of assets reported by the CRA. The simulation
approach is described in the Appendix. Recovery rate is assumed to be 40% for all simulations. The
independent variables are described in Table I. CLO, ABS CDO, and CDO2 are collateral asset type dummy
variables. Closing year dummies for 2002-2007 are included with closing year 2001 and before as the
comparison group. CDOs are issued over the period from January 1997 to December 2007. White (1980)
Heteroskedasticity-adjusted t-statistics are in parentheses.
(continued)

89
Table IA.XV―Continued
Variable (1) (2) (3) (4) (5) (6) (7) (8)
Intercept -33.372 -4.122 -0.637 -0.934 23.150 347.520 277.391 50.351
(-0.46) (-1.18) (-0.15) (-0.15) (0.31) (3.78) (4.05) (0.65)
Col. Def. Prob. -2359.37 -2435.39 -1994.22 -2465.49
(-19.15) (-20.18) (-21.16) (-20.20)
Avg. Col. Rating 7.701 5.473 -6.619 5.381
(9.44) (6.11) (-7.94) (5.91)
Avg. Col. Maturity -4.967 -3.381 -0.131 -3.371 -3.425
(-3.97) (-2.72) (-0.09) (-2.64) (-2.73)
Correlation -42.250 13.137 22.506 20.932 10.907
(-3.85) (0.97) (1.23) (1.36) (0.72)
Log(CDO Size) 1.586 -0.237 -14.258 -10.142 -1.283
(0.45) (-0.07) (-3.16) (-2.86) (-0.34)
# Assets 0.057 -0.020 0.015 -0.004 -0.016
(2.24) (-0.71) (0.45) (-0.12) (-0.55)
# Obligors 0.125 0.132 0.113 0.100 0.122
(2.14) (2.23) (1.57) (1.64) (2.04)
Log(Mgr Deal #.) 2.386 2.052 1.593 2.294 2.165 (1.25) (1.22) (0.77) (1.31) (1.26) Overcollateralizationn
0.861 0.858 2.175 0.658 1.319
(0.24) (0.29) (0.60) (0.22) (0.44)
Insurance Dummy -7.444 15.752 -0.793 15.141 16.438
(-0.87) (2.26) (-0.09) (2.10) (2.32)
Liquidity Dummy -1.431 1.501 3.181 1.272 1.966
(-0.29) (0.37) (0.65) (0.31) (0.48)
CLO 9.458 11.985 22.248 29.839 19.793
(1.33) (1.76) (2.26) (3.68) (2.43)
ABS CDO -0.619 -38.720 -30.670 -42.964 -31.516
(-0.09) (-4.78) (-2.87) (-4.89) (-3.57)
CDO2 -36.684 -62.953 -53.094 -63.521 -56.434
(-3.52) (-5.90) (-3.94) (-5.62) (-5.06)
Synthetic Dummy -10.020 -11.988 1.837 -3.294 -10.855 (-1.58) (-2.02) (0.25) (-0.54) (-1.77)
Closing Year 2002 -11.633 -27.616 -25.332 (-0.93) (-2.62) (-2.45)
Closing Year 2003 -11.486 -23.871 -18.379 (-1.00) (-2.49) (-1.94)
Closing Year 2004 -16.601 -20.465 -12.622 (-1.60) (-2.36) (-1.47)
Closing Year 2005 -11.656 -16.968 -10.444 (-1.17) (-2.04) (-1.27)
Closing Year 2006 -17.822 -18.234 -10.610 (-1.79) (-2.20) (-1.29)
Closing Year 2007 -22.001 -17.435 -9.668 (-2.04) (-1.94) (-1.08)
N 901 901 901 901 901 901 901 901
Adjusted R2 0.347 0.001 -0.002 0.032 0.389 0.109 0.367 0.390

90
Table IA.XVI
Model Explicability Comparison
This table reports the OLS regression results with different dependent variables for AAA fraction. The
dependent variables are the AAA fractions predicted by the Vasicek model, Monte Carlo Simulation, CRA
Model, and Actual AAA fraction. The independent variables are described in Table I of the text. CLO, ABS
CDO, and CDO2 are collateral asset type dummy variables. Data is from CRA CDO surveillance reports and
CDO rating databases. CDOs are issued over the period from January 1997 to December 2007. Data is
grouped by report date (first reports versus continuing reports). Heteroskedasticity and autocorrelation
adjusted robust t-statistics are in the parentheses.
Vasicek Model MC Simulation CRA Model Actual AAA
First Cont‟d First Cont‟d First Cont‟d First Cont‟d
Intercept 0.54 0.71 1.14 0.92 1.27 1.17 0.74 0.55 (4.81) (12.79) (21.19) (29.46) (12.83) (24.70) (5.03) (7.29)
Col. Def. Prob. 0.08 0.80 0.20 0.08 -1.98 -1.57 0.86 0.34 (0.42) (10.04) (2.26) (-1.90) (-12.15) (-23.19) (3.56) (-3.10)
Avg. Col. Rating -0.04 -0.05 -0.03 -0.03 -0.02 -0.03 -0.01 -0.01 (-28.83) (-62.59) (-49.80) (-69.20) (-19.54) (-48.31) (-8.21) (-7.27)
Correlation 0.68 0.81 -0.45 -0.46 -0.46 -0.45 -0.12 -0.04 (33.77) (62.89) (-45.95) (-62.92) (-25.62) (-40.94) (-4.32) (-2.37)
Avg. Col. Maturity 0.01 0.02 0.00 0.00 -0.01 -0.01 0.00 0.00 (6.45) (19.37) (-2.23) (-2.64) (-5.71) (-6.94) (-1.41) (0.97)
Log(CDO Size) -0.01 -0.01 0.00 0.01 -0.01 0.00 0.01 0.01 (-0.98) (-4.60) (0.58) (-7.00) (-2.03) (-0.02) (1.11) (3.37)
# Assets (×100) 0.02 0.00 0.00 0.00 0.00 0.00 -0.01 -0.02 (3.81) (1.44) (0.31) (-1.29) (0.47) (-0.45) (-1.82) (-4.57)
# Obligors (×100) -0.03 -0.02 0.00 0.00 0.08 0.07 0.06 0.06 (-3.45) (-3.43) (-0.87) (-0.87) (-9.70) (15.35) (4.96) (7.69)
CLO -0.03 -0.05 -0.03 -0.04 0.00 -0.01 0.01 -0.02 (-3.01) (-8.28) (-6.36) (-12.22) (-0.43) (-2.71) (0.38) (-2.08)
ABS CDO 0.23 0.14 0.02 0.02 0.06 0.00 0.04 0.02 (18.42) (18.14) (4.04) (5.19) (5.16) (0.03) (2.42) (2.14)
CDO2 0.21 0.10 -0.01 -0.02 0.01 -0.04 0.00 -0.04 (12.95) (10.05) (-0.91) (-3.88) (1.01) (-4.66) (0.22) (-3.33)
Synthetic Dummy -0.01 -0.01 -0.01 0.00 -0.01 -0.06 -0.03 -0.04 (-0.88) (-2.31) (-1.68) (1.27) (-1.50) (-11.49) (-3.03) (-4.22)
N 912 2478 912 2478 912 2478 912 2478
Adjusted R2 0.96 0.96 0.94 0.91 0.83 0.87 0.29 0.18

91
Table IA.XVII
Tests of Structural Breaks in Rating Agency Model
This table reports the F values from the Chow test for structural breaks in the rating agency model of selected
known break points. The break points separate the whole sample into two groups: one dated before the break
point and the other after. The dependent variables are the difference between the CDO AAA fraction from
the CRA model and from a Monte Carlo Model (CRA AAA – Monte Carlo AAA). The Monte Carlo
simulation inputs are average collateral default rates, maturity, correlations, and number of assets reported by
the CRA. The simulation approach is described in the Appendix. Recovery rate assumptions are fixed at 40%
for all specifications. Model specifications (1), (2), (3) are considered as follows:
AAA Dif = + Col. Def. Prob. +
Avg. Col. Rating +
Avg. Col. aturity (1)
+ Correlation +
Ln Col ize
AAA Dif = + Col. Def. Prob. +
Avg. Col. Rating +
Avg. Col. aturity
+ Correlation +
Ln Col ize+
Assets +
Overcollateralization (2)
+ Insurance Dummy +
Liquidity Dummy+
CLO Dummy
+ AB CDO Dummy +
CDO Dummy +
ynthetic Dummy +
AAA Dif = + Col. Def. Prob. +
Avg. Col. Rating +
Avg. Col. aturity (3)
+ Assets +
AB CDO Dummy +
Variable definitions are in Table I. CDOs are issued over the period from January 1997 to December 2007.
Model Specifications
Break Point (1) (2) (3)
Jan-04 1.96 1.63 2.18
Jan-05 1.22 1.37 0.84
Jan-06 2.87 1.45 1.96
Feb-06 3.14 1.58 2.04
Mar-06 3.62 1.92 2.46
Apr-06 4.79 2.48 3.27
Jul-06 6.94 3.62 4.96
Oct-06 9.26 4.90 6.12
Jan-07 9.38 4.91 5.53
Feb-07 9.04 5.43 4.40
Mar-07 9.00 5.36 4.80
Apr-07 10.96 7.03 8.01
May-07 8.81 5.18 6.03
Jun-07 7.32 4.37 5.66
Jul-07 6.44 4.16 5.63
Aug-07 2.56 1.94 2.67
Sep-07 2.37 1.62 1.94

92
Table IA.XVIII
Valuation Effect of the Criterion Deviation
This table describes the valuation effects due to actual CDO credit rating default rate criterion deviation away
from publicized default probability criteria. Each rating from the credit rating agency using actual criterion is
converted into a rating according to publicized criterion with the same maturity, as shown in Table VI. Avg.
Maturity is the average maturity of the collateral assets. Avg. Spread is the average spread for CDO notes with
the same rating. Percentage Dif. is the present value difference in percentage due to the spread difference
defined as the following:
Percentage Dif = Average aturity (Actual-Publicized) pread
Value Dif. is the total value difference in dollars:
alue Dif = Percentage Dif Amount
CDOs are issued over the period from January 1997 to March 2007, totaling 788 CDOs. An asterisk indicates
numbers are from a larger sample due to lack of data for sample CDOs.
Rating # Tranches
Amount ($Bn)
Fraction(%)
Avg. Maturity
Avg. Spread
Percentage Dif. (%)
Value Dif. ($mm)
AAA 1739 379.68 84.59% 6.68 33.60 2.11 8013.49
AA+ 13 0.37 0.08% 6.66 84.60 -1.31 -4.84
AA 648 23.74 5.29% 7.03 64.84 3.59 852.71
AA- 49 2.05 0.46% 6.98 64.57 4.90 100.59
A+ 42 1.44 0.32% 6.84 81.34 4.79 69.21
A 556 14.25 3.17% 6.56 124.29 3.33 474.42
A- 177 4.12 0.92% 6.45 147.97 7.81 321.76
BBB+ 35 0.66 0.15% 6.34 278.51 -0.54 -3.60
BBB 713 13.81 3.08% 6.56 268.48 -0.05 -7.46
BBB- 153 2.96 0.66% 7.15 296.60 -0.13 -3.75
BB+ 83 0.71 0.16% 7.77 598.43 -0.57 -4.08
BB 300 3.96 0.88% 6.10 464.90 -0.12 -4.95
BB- 54 0.84 0.19% 6.45 443.61 -0.01 -0.09
B+ ― ― ― ― 366.14* ― ―
B 4 0.24 0.05% 6.93 467.61* -3.40 -8.18
B- 4 0.03 0.01% 5.70 850.00 -20.67 -5.79
Sum 4570 448.87 100.00% 9789.44