Embed Size (px)
Citation preview
Did First-Mover Advantage
Survive the Dot-Com Crash?*
Marvin B. Lieberman
Anderson Graduate School of Management UCLA
Los Angeles, CA 90095-1481
Email: [email protected]
December 2, 2007
________________________________________________________________________
*This paper has benefited from comments by Thomas Eisenmann, Phillip Leslie, and seminar participants at CMU, Emory, NYU, Wharton, UC Berkeley, UCLA and the Stanford and Utah Strategy Conferences. I thank former students in my course, “Business Strategy and the Internet,” for their appraisals of specific Internet markets, which provided background information for this study. I am particularly grateful to Andrew Bachman and David Binetti, who collected the initial data set, and David Choi, Jeffrey Brown and Tatsuo Ushijima, who enlarged the sample. Anand Bodapati and Vernon Richardson alerted me to data sources. All errors are my responsibility alone. The Price Center for Entrepreneurship at UCLA provided financial support.

Did First-Mover Advantage Survive the Dot-Com Crash?
ABSTRACT
Widespread expectations of first-mover advantages contributed to the rush of market
entry during the early growth phase of the Internet sector. After the shakeout, however,
such beliefs came into question. This study assesses the magnitude and sources of first-
mover advantages in 46 Internet markets, based on data for more than 200 publicly traded
entrants. The findings show a large premium in stock market capitalization and revenue
for early entrants in markets with network effects, and for pioneers with patented
innovations. Absent these factors, first-mover advantages appear minimal. First-movers
had higher propensity to patent, and their patents were far more likely to be cited. This
suggests that early entrants played a disproportionate role in promoting new technology,
even though many innovative pioneers failed to survive. In general, the findings imply
that first-mover advantages arose within the Internet sector but were contingent upon
market and firm characteristics.
2
1. Introduction
Internet commerce in the late 1990s was widely characterized as a “land grab” where
firms rushed to acquire market positions before competitors had an opportunity to do so.
Some pioneering entrants—such as Amazon, eBay and Yahoo—gained enormous stock
market capitalization as investors anticipated that early entry would translate into large
financial returns. High market valuations and widespread belief in first-mover
advantages sustained a gold rush mentality among Internet entrants. Once the bubble
burst in mid-2000, however, serious doubts arose about the validity of such views.
Within a few years many Internet pioneers had disappeared, and a comparatively late
entrant, Google, emerged with a market capitalization that eclipsed all others in the
Internet sector.
Was the perception of first-mover advantages an illusion, as Michael Porter (2001) has
claimed? Others have expressed a more tempered view that first-mover advantages
existed during the rise of the commercial Internet, but managers vastly overestimated
their magnitude and pervasiveness (Adner and Rangan, 2001; Liebowitz, 2002). Such
assessments have been based upon impressionistic evidence rather than systematic
analysis. The aim of this study is to provide a reasonably comprehensive appraisal of the
extent of first-mover advantages in Internet markets. The study includes a broad sample
of Internet entrants and tests for conditions under which first-mover advantages might be
expected to arise. The results show advantages for early entrants in markets with
network effects, and for pioneers with patented innovations. Absent these factors, first-
mover advantages appear minimal.
The sudden rise of Internet commerce can be viewed as a natural experiment: many new
“market spaces”1 were created almost simultaneously by a common technology shock. A
1 In this study, the term “market space” refers to an Internet market or sub-market that is reasonably well defined in terms of the product or service and the competitor set.
3

large proportion of Internet entrants became publicly traded, often within a year or two of
founding, leading to the availability of extensive information on stock market value,
revenue, and other attributes. Thus, the early history of Internet commerce provides a
unique laboratory for studying the effects of entry timing on firm performance.
This study takes an exploratory approach, intended to identify and assess potential first-
mover advantages within the Internet sector without imposing detailed structural
assumptions. The presentation is organized as follows. The next section briefly reviews
the literature on first-mover advantages, emphasizing the potential sources of such
advantages in Internet-related markets. Section 3 describes the study’s methodology and
data sample, covering more than 200 entrants in 46 Internet product market categories.
Section 4 presents a series of regression-based tests, focusing on the degree to which
pioneering firms maintained higher market capitalization or revenue than their peers,
controlling for various factors. The tests show a large premium in stock market
capitalization for early entrants in markets with network effects, and for firms with
patented innovations. Section 5 provides an analysis of entrant survival. Section 6
concludes the paper with an assessment of the study’s findings and limitations.
2. Potential Sources of First-Mover Advantages in Internet Markets
First-mover advantages accrue to a firm that gains a first-mover opportunity (through
proficiency or luck) and is able to maintain an edge despite subsequent entry. A large
literature has developed on this topic, given its importance for strategic entry decisions.
The issues, evidence, and ongoing debate have been summarized in review articles (e.g.,
Lieberman and Montgomery, 1988, 1998; Kerin, Varadarajan and Peterson, 1992;
Kalyanaram, Robinson and Urban, 1995; Szymanski, Troy and Bharadwaj, 1995;
Vanderwerf and Mahon, 1997). One general conclusion from this literature is that the net
benefits of early entry are contingent upon a variety of industry and firm-specific factors.
4
The description below draws upon the conceptual surveys of Lieberman and
Montgomery (1988, 1998), who refer to four types of mechanisms that can sustain a first-
mover advantage: (1) proprietary technology, (2) preemption of scarce resources, (3)
customer switching costs, and (4) network effects. To be successful, a pioneer must be
able to draw upon at least one of these mechanisms. These potential sources of
advantage are frequently offset by higher costs or risks faced by the pioneer. Hence, the
mechanisms are necessary but not sufficient to make pioneering a superior strategy.
Proprietary Technology
Observers have often noted that the transparency of many Internet business methods
makes imitation by competitors relatively easy (e.g., Porter, 2001). Thus, compared to
other technology-driven sectors, the Internet would appear to offer limited opportunities
to support first-mover advantages through proprietary technology. Secrecy, the most
common method for keeping technological advantage proprietary (Levin, et al., 1987), is
virtually impossible in many parts of the Internet environment. Some Internet pioneers,
such as Amazon, have developed superior technology and maintained leadership by
racing down the learning curve ahead of competitors. But in the absence of patents and
other means of intellectual property protection, the ability to sustain such a lead for an
extended period is open to question.
Patents provide a means to protect innovations from imitation, and patent counts serve as
an indicator of firms’ innovative activity. Internet patents have attracted much attention
and controversy, even though patent rates in the Internet sector remain below those found
in many other technology-oriented industries. Patents on “business methods” (e.g.,
Amazon’s patent on “one click” ordering, and Priceline’s patent for reverse auctions)
have been particularly controversial, and some have questioned the ability of such patents
to withstand future challenges (Allison and Tiller, 2003; Hall, 2003). In this study we
consider the degree to which patents by Internet start-ups may contribute to the
sustainability of first-mover advantages.
5
Preemption of Superior Resources
Prior studies of first-mover advantages have shown that early market entrants may be
able to preempt superior resources of various types: physical assets, geographic
positions, and positions in customer perceptual space. For most Internet companies,
physical assets are inconsequential. Other types of resource preemption that may occur
in an Internet environment are more difficult to assess.
Preemption of superior positions in geographic space, an effective strategy for many
brick and mortar companies, is irrelevant for Internet firms. Even so, the Web can be
perceived as providing its own form of real estate, with some locations more valuable
than others.2 As an example, Monster.com paid AOL $100 million in 1999 for the right
to serve as AOL’s sole provider of recruitment services for four years. This preemptive
move blocked rivals’ access to a leading consumer portal and helped build brand
recognition and referrals for Monster.com. Given the importance of network effects in
Monster’s market environment (see below) this may have contributed to the firm’s
ultimate success.
Preemption of positions in customer perceptual space may be sustainable and important
for some Internet companies. Early entrants such as Yahoo, eBay and Amazon invested
heavily to nurture consumer recognition of their brands. These firms also broadened
their product lines to expand and defend their initial position. Subsequent entrants to
Internet markets in the late 1990s mounted large advertising campaigns in an effort to
develop name recognition. By most accounts, though, these funds were largely wasted,
even when firms entered as pioneers in their market segments. One example is the
Internet retailer eToys, which established huge name recognition but nevertheless failed.
Clearly, the ability of Internet pioneers to capture strong customer perception has not
been sufficient to ensure success or survival.
2 One might consider efforts in the late 1990s to preempt “domain names” as an Internet equivalent of geographic preemption in more traditional industries. Nevertheless, the market prices of superior domain names have fallen precipitously in recent years, and new names have been created.
6
It is difficult to judge the overall importance of these forms of resource preemption by
Internet companies, and we lack specific data that might support such an assessment. It
seems likely that resource preemption opportunities exist and have been exploited by
firms in the Internet sector. Nevertheless, we have no evidence that these have been the
dominant mechanisms used by successful Internet pioneers to support and defend their
position. Rather, as the above examples suggest, firms have exploited resource
preemption opportunities to reinforce primary advantages derived from other
mechanisms.
Customer Switching Costs
Early entrants may enjoy greater opportunities than followers to capture customers
through switching costs (often referred to during the Internet boom as “stickiness” or
“lock-in”). Switching costs arise in several ways. For software products that require
large initial investments by the buyer (e.g., e-commerce transaction platforms) switching
costs arise from the fixed cost nature of the basic investment and incentives to maintain
compatibility over time. Switching costs can also develop more gradually as buyers gain
experience with the seller’s product, and as the seller customizes the product to conform
to the buyer’s tastes. One example is the loyalty of many buyers to Amazon.com: users
grow accustomed to features of Amazon’s site, which evolve to suit the individual user’s
preferences. These factors allow experienced buyers to search more efficiently on
Amazon than on the web sites of competitors. The resulting lock-in may be compounded
by a third source of switching costs, arising from the desire of buyers to avoid risk and
uncertainty. For example, as Amazon’s reputation for reliability has grown, many
consumers are now willing to pay the firm a premium to avoid the risk of delay, fraud or
loss that may be associated with purchases from an unknown, but lower price vendor.
Undoubtedly, switching costs are an important source of advantage for many Internet
companies. Moreover, as the Amazon example suggests, switching costs are likely to
enhance the first-mover advantages enjoyed by some Internet pioneers. Unfortunately,
7

though, comprehensive and objective measures of switching costs are not available.
Hence, it is not possible to directly test the importance of switching costs in this study.
Network Effects
Network effects, the fourth category of mechanisms that support first-mover advantage,
tend to be more important in technology and communications-related industries than in
the economy as whole. The potential for network effects led many to anticipate strong
first-mover advantages in Internet markets. However, many entrants and investors failed
to think carefully about the specific structural conditions required to support large
network effects.
Network effects (also known as network externalities, or demand side economies of
scale) arise when the value of a product or service to a given user increases with the
number of other users (Shapiro and Varian, 1999). The positive feedback that is
generated causes the market to tip in favor of the firm that emerges as the standard,
potentially leading to a winner-take-all market structure. Hence, in markets with
network effects, the leading firm is likely to capture disproportionate returns. Depending
on the magnitude of the feedback, the leading firm may be able to drive out smaller
rivals; and potential entrants may choose to stay out of the market once a strong
bandwagon builds in favor of the leader (Goldfarb, Kirsch and Miller, 2007). Thus, one
might expect higher profits, and perhaps fewer competitors, for the firm that emerges as
the leader in a market with substantial network effects.
While the first entrant into the market has the initial opportunity to exploit the network
effect, in many cases later entrants prove more successful. For example, Netscape
introduced the first commercial Internet browser, but Microsoft entered aggressively and
emerged as dominant. Thus, the presence of network effects gives the first-mover an
opportunity but not a birthright for success. To prevail, the pioneer must recognize and
exploit the network opportunity, and also avoid challenges by later entrants who may try
to leverage other strengths to build a dominant network position.
8
Various types of network effects can be observed in Internet markets. A strong form of
network effect potentially arises in environments where one firm serves as a “market
maker,” coordinating among numerous buyers and sellers who seek to transact in a
common forum. Buyers seek a forum that maximizes the number of sellers, and sellers
seek to maximize the number of buyers. A single forum is likely to emerge as the
dominant meeting place (unless groups of buyers and sellers have highly differentiated
needs, leading to a more fragmented market). Internet examples include eBay, the
successful coordinator of consumer auctions; the Monster Board, which serves a similar
matching function in the job market; and DoubleClick, which coordinates between
advertisers and the owners of Web pages on which the ads are displayed.
A second type of network effect arises from what is sometimes called the “virtuous
cycle.” A web site or product with more visitors or customers than rivals becomes
perceived as more successful and is able to attract higher quality alliance partners. These
alliances contribute to further growth in the site’s customer base, leading to more
alliances, and so on.3 Such feedback loops have benefited Amazon, Yahoo, and other
early Internet entrants. They were also a factor in the browser wars, leading to the
ascendancy of Microsoft’s Internet Explorer over Netscape—once Explorer attained the
majority of users, outside software developers cut back their support of Netscape in favor
of Explorer. Such effects often arise in software markets, where buyers are influenced to
purchase the dominant product in order to maximize compatibility. The strength of this
second type of network effect can vary substantially from case to case.
In this study we lack specific, quantitative data on the potential magnitude of network
effects. Rather, we proceed indirectly by examining the characteristics of markets where
first-movers have been most successful. As indicated above, network effects are likely to
be prevalent in Internet environments where firms assume the role of “market maker.”
3 A similar virtuous cycle operates in the case of “market makers” described above. The difference is largely one of degree: feedback is likely to be stronger when the site serves an explicit matching function where buyers and sellers both seek a broad choice set.
9
Markets where firms take the role of a “broker” between buyers and sellers may have
similar characteristics. We find that early entrants have been substantially more
successful than followers in these two types of environments, which provides indirect
evidence supporting the role of network effects.
First-mover Disadvantages
The potential advantages of pioneering entry, discussed above, are counterbalanced by
various disadvantages.4 Later entrants may be able to “free ride” on the first-mover’s
investments, and followers may benefit by waiting until key technological and market
uncertainties have been resolved. A more basic failure arises when the pioneer’s market
proves not to be commercially viable. Many Internet entrants discovered that the market
spaces that they hoped to develop were not economically attractive. For example,
Webvan and others found that the home grocery delivery market could not sustain even a
single stand-alone company. To enjoy a first-mover advantage, not only must the
pioneering firm be successful relative to subsequent entrants; the market space must be
viable enough to profitably support at least one firm.
3. Data and Methods
The previous discussion raises the question of how first-mover advantages can be
objectively identified and evaluated. Empirical researchers face numerous challenges
relating to market definition, sample selection, entrant identification and classification,
and performance measurement.
Lieberman and Montgomery (1988) define first-mover advantage in terms of the ability
of the pioneer to earn economic profits (i.e., profits that exceed the cost of capital). Such
a metric, based on accounting profits, is difficult to implement and potentially
inappropriate for Internet companies. One reason is that successful startup businesses
4 See Lieberman and Montgomery (1988, 1998) for more detailed discussion of first-mover disadvantages.
10
take nearly a decade, on average, to reach profitability (Biggadike, 1976). Hence,
historical profit rates during the rise of the Internet are unlikely to be a good indicator of
competitive advantage. After the market crash, many of the surviving companies began
to earn significant accounting profits. Even so, substantial consolidation within the
Internet sector makes it difficult to link these profits to the original startup firms.
To assess the potential first-mover advantages of Internet companies, we draw primarily
upon historical measures of stock market capitalization, which incorporate investor
expectations of future profitability. Market capitalization, measured quarterly from 1999
to 2003, serves as the primary dependent variable in this study. We compare market
capitalization across firms that compete directly within Internet sub-markets. We also
consider total company revenue as a dependent variable, capturing relative firm size. A
further metric of success, company survival, is also considered.
The sample for this study includes 207 publicly-traded Internet entrants, classified into
46 sub-markets as described below. We refer to these submarkets as product categories
or “market spaces,” following terminology in common use during the early years of
Internet commerce. Two measures of firm performance, market capitalization and
revenue, were recorded quarterly from 1999 through the end of 2003. A third measure of
performance, survival, is based upon dates of exit observed through November 2007. In
addition, data were collected on entry and IPO dates, patents, and company origins.
Our most basic tests for first-mover advantage use dummy variable regression to assess
the market value (or revenue) of pioneers relative to later entrants within each product
category. If first-movers enjoyed higher market capitalization (or revenue) on average,
the estimated coefficient of the first-mover dummy should appear positive and significant
in these regressions. More specific tests consider whether the magnitude of advantage
was related to market or firm characteristics, such as network effects or patents. Tests to
distinguish these mechanisms were carried out by adding interaction terms to the first-
mover dummy, or by adding measures of patent activity.
11
Internet company stock prices rose and fell dramatically over the period of the sample,
peaking in mid-2000. This market “bubble” had a strong effect on the stock prices of
virtually all Internet companies. Hence the anticipated future returns of first-movers, as
well as those of follower firms, shifted markedly over the period of the sample. The
regression approach of this study compares each firm’s market value to that of
competitors within their market space; i.e., net of the average level of Internet stock
prices in each period. Consequently, the study identifies first-mover advantages in a
relative sense: the premium enjoyed by first-movers relative to later entrants. The study
isolates the effect of early entry on relative firm performance but cannot give definitive
answers on the absolute magnitude of first-mover advantages.
Data over the period from 1999 to 2003 makes it possible to see if the relative advantage
of early entrants—as anticipated by investors and reflected in stock prices—was
changing over time. Shifts in the impact of firm and market characteristics can also be
identified. Most estimated effects remain fairly stable despite large movements in the
average level of Internet stock prices. We do not pursue any financial analysis after
2003, as the disappearance of most companies in the sample (through bankruptcy,
dissolution, merger or acquisition) reduces the sample size beyond the point where
comparative analysis is meaningful.
Data Sample
The sample is limited to public firms traded on the NASDAQ or other U.S. exchange.
All firms had their initial public offering (IPO) by the end of 2001. Candidates for
inclusion were identified from lists of Internet public companies5 and lists of IPOs issued
from 1995 to 2000. Of the firms included in the sample, about half sold primarily to
other businesses (B2B), and half to consumers (B2C). More than 40% of the companies
had disappeared as independent entities by the end of 2002, and nearly 70% by the end of
2007. Given the high rate of entry and exit from the sample, the number of companies,
and the exact identity of the firms, varies by quarter.
5 In particular, we used the Internet Stock List, http://www.wsrn.com/apps/internetstocks/.
12
The sample is restricted to firms whose primary business involved the provision of
Internet-related services or software. Three major categories of Internet companies have
been excluded: Internet service providers (ISPs), telecommunications companies, and
hardware vendors. We exclude ISPs because of their initial tendency to serve regional
markets, which are hard to identify.6 We exclude Internet hardware and
telecommunications companies because their product categories tend to overlap with pre-
existing markets. In addition, many of these firms predate the commercial Internet.
Sample selection biases can be problematic in investigations of first-mover advantages
(see, for example, Golder and Tellis (1993) and Vanderwerf and Mahon (1997)), and this
study is no exception. There is much debate in the literature about the identity of first-
movers and the extent to which survivor biases may lead to an overestimate of first-
mover advantages. Firms that are regarded as first-movers in some studies have been
shown by other investigators to have been preceded by a precursor firm. Indeed, studies
of Internet first-movers by Hidding and Williams (2002) and Wilson et al. (2003) argue
that such well-known Internet pioneers as Amazon, eBay, and Yahoo were actually “fast
followers” (being preceded, respectively, by Book Stacks Unlimited, OnSale, and Web
Crawler). These studies suggest that “fast followers” (which are often identified in the
present study as “first-movers” within the sample set of public companies) were more
successful than the earliest Internet pioneers, which often failed.
If the sample is limited to companies that ultimately became public, a bias arises in cases
where market pioneers remained private or failed without issuing an IPO. In such
instances the “true” first-mover is omitted from the sample, and a follower firm is
misclassified as the pioneer. In many industries this is a serious consideration. In the
Internet markets of the 1990s, however, there was enormous impetus for entrants to go
public in order to raise capital to sustain their growth. Given the high valuation of
Internet companies, startups faced strong incentives to become publicly traded, and the
threshold of early success required for an IPO was set very low. The set of “first-
13
movers” identified in the present study were early entrants that are commonly regarded
as market pioneers. While the term “first-mover” may in some cases overstate their order
of entry, these firms were clearly among the earliest entrants into their market space.
Many studies use the terms “first-mover,” “early entrant” and “pioneer” interchangeably,
recognizing that fine-grained distinctions between “first-movers” and “fast followers” are
often largely semantic. In this study we define first-movers in several ways to ensure that
the results are robust to changes in definition.
A more serious distortion may come from the bias of the sample toward successful
market spaces. To be included in the sample, at least two public firms must have been
active in the market space. Many Internet pioneers attempted to initiate novel markets
but failed. Most of these firms never filed an IPO; in a few instances only a single firm
went public in the market space. Exclusion of such cases from this study creates a bias in
favor of successful markets, and hence a likely overstatement of the overall extent of
Internet first-mover advantages.7 In effect, our analysis gauges the performance of
pioneers relative to followers, contingent on some minimum viability of the market
space. One might expect to find superior performance by pioneers under these
conditions, even if pioneering was an inferior strategy for Internet start-ups on average.
The analysis includes controls for entrants that were spinoffs from established firms, and
for firms that began as “brick and mortar” companies, predating the commercial Internet
in some cases. Otherwise, we ignore the possibility that entry order was endogenously
determined by factors intrinsic to the firm. Moreover, our approach assumes a
distribution of entry dates broad enough that first-movers and followers can be
effectively distinguished. If first-mover advantages are large and anticipated by all
potential market entrants, entry will cease once the initial firm(s) have entered (Goldfarb,
Kirsch and Miller, 2007). Although bunched entry of this sort characterized a few
6 We include one category of ISP, the free segment, whose entrants served the US national market. 7 Although similar to the (firm) survivor bias discussed in the literature on first-mover advantages, this “market survivor” bias has seldom been recognized.
14
products in the sample, in most cases we observe entry dates spanning over multiple
years.
Classification of “Market Spaces”
An important issue in any empirical study of first-mover advantage is the definition and
classification of markets. The identity of initial entrants depends upon how narrowly or
broadly the markets are defined. In this study, a two-step procedure was used to define
Internet product categories or “market spaces.” First, classifications were developed
based on the author’s judgments, given business descriptions found on companies’ web
sites and profiles listed on Yahoo Finance8. These classifications were then refined using
information on each firm’s top three competitors, as denoted by Hoover’s Online.9
Table 1 gives an illustration of the method for refining the industry classifications, using
the Hoover’s Online data, which were collected in March 2001.10 More than two-dozen
public firms were initially identified within the Internet Advertising/Marketing sector,
broadly defined. It proved difficult to group these companies into meaningful sub-
markets on the basis of their business descriptions alone. Using competitor information
from Hoover’s Online, however, a set of meaningful and objective classifications could
be made. Consider, for example, the firms that compete with DoubleClick, the pioneer
and category leader in the “advertising network” sub-market. The primary business of
DoubleClick and its rivals involves the coordination of online banner advertisements in
an effort to maximize their effectiveness. (Several parties are involved in this effort: the
coordination company (e.g., DoubleClick), the company placing the ad, the owner of the
web site that displays the ad, and the consumer being targeted.) As shown in Table 1, the
competitor listings from Hoover’s imply that six public companies competed with each
other in this market in late 2000. DoubleClick and 24/7 Media, the largest firms, were
listed as principal competitors for each of their four smaller rivals. By comparison, 8 <http://finance.yahoo.com/> 9 These competitor listings, which are based on assessments made by the Hoover’s staff, are available at http://www.hoovers.com/.
15
DoubleClick and 24/7 Media were not generally ranked as top competitors for the other
advertising/ marketing firms identified in the study. Thus, the Hoover’s Online
information allows competitors within the “advertising network” market to be
distinguished from firms within the broader advertising/marketing category.
As indicated by this example, the Hoover’s Online competitor information provides a
reasonably objective method for identifying companies that compete closely within a
specific product category. Firms that did not have a clear classification based on the
Hoover’s data were generally excluded from the study. The result of this process was the
identification of 46 product categories containing at least two public competitors during
some or all of the period from 1999 to 2003. The names of the product categories, and
the identity of the first-mover(s) within each category, are shown in Table 2.
The product categories were grouped into broader designations reflecting common
Internet business models (Eisenmann, 2002). These designations are as follows: market
maker, broker, portal, retailer, content provider, software, infrastructure, and other.
These groupings play an important role in the tests for first-mover advantages. In
addition, markets were classified as either “B2B” (business to business) or “B2C”
(business to consumer), a distinction commonly drawn during the early days of Internet
commerce.
Identification of the First-Mover Firms
Several types of information were used to identify firms’ order of entry. Complicating
this task is the fact that entry is not instantaneous; for most firms it is a sequential process
that cannot be precisely linked to a single calendar date. Hence, the exact timing of entry
is often ambiguous. We tried, to the extent possible, to determine the order of entry
based on the dates when firms became active competitors within their market space.
10 The method is easy to apply and may be applicable in other studies where it is necessary to identify a coherent set of market competitors.
16
Typically, one of the first actions of a new Internet-related company was to officially
register its domain name. Such registration or “web entry” dates correspond closely to
the founding dates indicated on many company Web sites. Given this correspondence
and the availability of registry information for nearly all firms in the sample, the date of
domain registration was initially taken as the firm’s date of entry.11
Other information was used to refine the entry dates. In cases where a large discrepancy
was found between the domain registration date and the founding date indicated by the
company on its web site, the latter was selected as the entry date.12 In cases where two
or more early entrants had proximate dates of domain registration, we relied on th
companies’ own web sites (including historical records of sites provided by the
“Wayback Machine,”
e
www.archive.org), Hoover’s Online, and other web records to
establish the order of entry. We also collected company incorporation dates, but as
indicators of entry order we found these dates less reliable than information from the
other sources.
With firms sequenced by entry date, “first-movers” were defined in three alternative
ways. In the first approach, the firm with the earliest date of entry in the market space
was identified as the unique first-mover.13 In the second approach, the earliest one-third
of market entrants were denoted as first-movers. The third approach (which provides the
preferred method for this study) is intermediate between the first two: if all firms entered
after 1995, the earliest entrant was taken as the sole first-mover;14 otherwise, firms
entering prior to the end of 1995 were classified as first-movers up to the first 30% of
11 These registration dates were obtained by querying the “WhoIs” function on the Network Solutions web site (http://www.netsol.com/cgi-bin/whois/whois) in mid-2000. (This method is no longer a reliable source of initial entry dates, as many firms’ domain registrations have been changed or renewed, and registration has lapsed for some exiting firms.) 12 One exception is for firms with brick and mortar origins. For such firms we used the date of first entry on the web, as denoted by the date of domain registration or historical information provided on the firm’s web site. 13 In two market spaces, dual first-movers were assigned as the entry dates were within several days of each other (FreeMarkets and Vertical Net; Homestore and HomeSeekers). In one additional market space, the entries were at similar times, but precise dates were unavailable. 14 If the entry dates of the first two entrants differed by two weeks or less, both were classified as first-movers.
17
entrants. Based on this definition, twelve of the 46 market spaces in the sample have two
first-movers, one market space has three (e-business software suites/platforms) and one
has eight (Internet consulting). All others have a unique first-mover firm.
Dummy variables were defined with their value set equal to 1 if the firm was classified as
a first-mover, and zero otherwise. Thus, three alternative dummy variables for first-
movers were tested in the analysis: FM1 (a single first-mover within each market space),
FM33 (the first third of entrants selected as first-movers), and FM, the preferred,
intermediate measure.
All three definitions gave similar results in the regression analysis. However, the third
definition has the advantage that it allows for multiple first-movers in markets with a
large number of early entrants. Hence it is robust to possible error in the recorded entry
dates, which are known less precisely for entrants in the early 1990s. In several cases the
second entrant in our sample (who was still quite early in the entry queue) is the firm that
is widely perceived as the market pioneer. While identification of a unique market
pioneer might seem attractive, more inclusive definitions are common in the empirical
literature on first-mover advantages.
Performance Measures
The main performance measure in this study is stock market capitalization. A secondary
performance measure is quarterly revenue. These serve as dependent variables in
regressions that were run quarterly from late 1999 through the end of 2003. The market
capitalization and revenue data were obtained from Wharton WRDS and Compustat.
Explanatory Factors Relating to First-mover Advantage
Section 2 described four types of mechanisms that can sustain a first-mover advantage.
These mechanisms are not directly observable and thus must be represented by proxies in
the empirical analysis. The proxies used in this study are the count of firm patents and
18

the classification of market type. As described below, these measures serve as imperfect
indicators of the mechanisms that potentially support first-mover advantages.
Proprietary Technology and Patents. For reasons discussed in Section 2, proprietary
technology is likely to be less important as a source of sustainable advantage for Internet
companies than for many other technology businesses. Even so, the availability of patent
data makes objective measures of intellectual property feasible. The annual count of US
patents awarded to each firm in the sample was obtained from the Delphion database.15
Typically, these patents pertain to business methods or software. In addition to the total
count of patents granted to each firm, we collected information on patent application
dates, technology class and forward citations. The patent data were collected in
November, 2005, which assures that the vast majority of patents filed by firms prior to
the end of 2003 are included (despite an average lag of about two years between
application and approval).
Table 3 lists the patent holders in the sample and summary statistics on their patents.
These data show that first-movers led followers in various aspects of patenting. First of
all, early entrants were more likely to patent: 40% of first-movers in the sample had filed
at least one patent by the sample cutoff date of December 2003, as compared with 30% of
followers.16 Amazon and Yahoo headed the list of first-movers in terms of patent count.
Among patent holders, the first-movers as a group had slightly more patents per firm
(10.1 versus 8.1), and they led by a larger margin in business method patents (3.8 versus
1.8 per firm on average). This differential is even more striking in the case of forward
citations, which are often used as a measure of patent quality or importance. First-
movers had 142 forward citations per firm on average, as compared with 55 citations per
firm for the follower companies. Thus, first-movers appear to have had higher-quality
patents as well as higher rates of patenting.
15 The data were collected from the Delphion web site, http://www.delphion.com/. 16 This classification uses the intermediate definition of first-movers (FM).
19

The patent statistics summarized in Table 3 can be transformed in a variety of ways to
yield testable measures. The most obvious approach is to take the cumulative count of
patents awarded to each firm through the end of the observation year. This is the patent
stock measure used in the regressions. We interacted this patent stock with the first-
mover dummy to determine if patents filed by first-mover companies were associated
with higher market value. (Going beyond this basic analysis, we tested a variety of finer-
grained measures, incorporating information on citation count, technology class, and date
of application. These results are described in a related paper.)
Preemption of Resources. As argued in Section 2, resource preemption seems unlikely to
be a major source of first-mover advantages for Internet companies. Possible exceptions
are in markets where pioneers may be able to preempt customers’ “perceptual space” to
some degree. Unfortunately, we lack objective criteria to identify such markets, so
resource preemption is not considered in the regression analysis below.
Switching Costs. It was argued in Section 2 that switching costs are likely to be
important in some Internet markets, contributing to first-mover advantage. But
unfortunately, as in the case of resource preemption, objective empirical measures are
unavailable. One might anticipate, however, that switching costs are greater in certain
market categories (e.g., software) than in others (e.g., retailing of products that are
purchased infrequently). To explore such possibilities, dummy variables were tested in
the regressions for various product or business model types: e.g., software, broker,
retailer, portal, etc.17 Such groupings were also used in the tests for network effects,
discussed below.
Network Effects. Empirical work on network effects has been limited, and no standard
measures have been developed. Therefore, this study takes an indirect approach to assess
the influence of network effects on first-mover advantage. This approach involves
interacting the first-mover dummy and the designations for generic business type.
20

A strong type of network effect can arise when opportunities exist for a “market maker”
to bring together relatively dispersed sets of buyers and sellers. Such environments,
where the market maker plays a coordinating role, correspond to some of the great
success stories of Internet commerce, such as eBay. The following market spaces were
assigned to the “market maker” category: consumer auctions, advertising network,
employment search, real estate, and vertical marketplace. Internet markets where firms
perform a brokerage function may exhibit similar characteristics. The brokerage markets
in the sample include: stockbroker, auto broker, mortgage broker, insurance quote
aggregator, tickets (entertainment), and travel.
Tests for such network effects were implemented by defining dummy variables specific
to first-movers within the “market maker” and “broker” categories. Positive regression
coefficients for first-movers in one or both of these categories, controlling for general
first-mover effects, potentially denotes the existence of network effects that support first-
mover advantage.
While this first type of network effect often arises in markets where the firm serves as a
nexus between buyers and sellers, the second type of network effect is more general: a
“virtuous cycle,” of positive feedback allows a firm with initial success to attract more
and better alliance partners (and/or customers), which contributes in turn to further
success, and so on. It is not clear, however, how this second, more general type of
network effect can be effectively measured. Possibilities include counting the number of
alliance partners, assessing their quality, or measuring the size of the firm’s customer
base. Such measures, to the extent that they can be collected, are all endogenous with
firm performance. This raises questions of cause and effect that are hard to resolve, both
conceptually and empirically. Given these difficulties, no explicit measure of this second
type of network effect was included in this study. However, firms in some of the
brokerage markets in the sample may benefit from this second type of network effect.
17 See Eisenmann (2002) for a discussion of Internet business models.
21
Control variables
Further measures were included in the regressions to control for the fact that some
companies in the sample have origins that predate the commercial Web. Such firms
include Internet spin-offs from established companies (e.g., barnesandnoble.com, DLJ
Direct, Expedia, FTD.com, Travelocity) and “brick and mortar” firms that repositioned
themselves by adopting a large Internet component (e.g., Charles Schwab, Ticketmaster,
TMP Worldwide, Hotel Reservation Network). There are 10 spinoffs in the sample and
20 firms with brick and mortar origins. Nearly all of the brick and mortar firms operated
as hybrids, with a large Internet presence (accounting for most of these firms’ market
capitalization at the peak of the Internet bubble) as well as an off-line business
component.
4. Regression Results
Market Value Regressions
Tables 4, 5, and 6 report the results of OLS regressions using the logarithm of market
capitalization as the dependent variable. All regressions in these tables include separate
constant terms (fixed effects) for each market space in the sample, as well as dummy
variables that control for “spinoffs” and “brick and mortar” origins. Regressions in Table
4 include the basic FM dummy to gauge the average magnitude of the first-mover
premium within the market spaces. Table 5 adds firms’ patent counts to the regression
specification, as well as interactions between the FM dummy and the “market maker”
and “broker” categories. These measures allow the first-mover premium to be
disaggregated into components relating to patents and network effects. A further
interaction term is added in Table 6 to identify a possible premium in the value of patents
obtained by first-mover firms.
The tables report the regression estimates for the middle and final calendar quarters from
late 1999 to 2003. (Intermediate quarters were similar.) By comparing the coefficients
22

across quarters, it is possible to determine if the underlying effects (as anticipated by
investors and incorporated in stock prices) were changing over time. The number of
observations varies by quarter, peaking in mid-2000 and then falling as more than half of
the firms in the sample disappear as independent public companies. Temporal shifts in
the regression coefficients could be driven by changes in sample composition; however,
estimates were similar when the sample was limited to surviving firms.
The estimates in Table 4 show that the average premium of first-mover companies,
measured in terms of stock market capitalization, was positive and reasonably constant
over time. The first-mover dummy is statistically significant in all but one of the
semiannual regressions. Its coefficient takes an average value of about 0.9, implying that
the typical first-mover had a market value roughly two to three times that of follower
firms. Thus, Table 4 demonstrates that early entrants enjoyed a market capitalization
premium that was statistically significant and substantial in magnitude when assessed
within the market spaces of the sample.
The “brick and mortar” coefficient rises in intermediate years of the sample to values that
exceed the FM coefficient in Table 4, with a relatively large standard error. This
suggests that hybrid firms had higher market capitalization than the average firm, but
with much variation. The control variable for companies that originated as spinoffs
appears insignificant in Table 4 (and throughout the analysis). Thus, the spinoffs are
essentially indistinguishable from other firms in the sample (although spinoffs had a
slightly lower rate of market pioneering, with only two—Expedia and Net2Phone—
classified as first-movers).
Table 5 gives results of the expanded regressions, which include measures to test the
potential influences of network effects and patents.18 The addition of these measures
causes the coefficient of the basic (non-interacted) first-mover dummy to fall to zero and
become statistically insignificant. This suggests that first-mover advantages have been
minimal for pioneers that do not benefit from network effects or patents.
23
The FM*MarketMaker and FM*Broker interactions capture the valuation premium of
pioneers in markets with potential network effects. Both sets of coefficients are positive
and significant in most periods.19 Moreover, the coefficients grow in magnitude,
approximately doubling from 1999 to 2003. The values shown in 2003 imply that
pioneers in network markets had average capitalization roughly 10 to 20 times greater
than that of later entrants.20 One conclusion is that the market premium shown for first-
movers in Table 4 is largely concentrated within this group of network market pioneers.
Similar interaction tests for the other business model categories, including “portal,”
“software” and “retail,” proved uniformly insignificant in the analysis.
The patent stock measure, denoting the firm’s cumulative patent applications through the
end of the observation year, appears highly significant in Table 5. The estimated
coefficients are close to 1.0, implying a unitary elasticity between patenting and market
value (i.e., a 10% increase in patents was associated with a 10% increase in market
value). This estimate applies to all patent holders, not limited to first-mover companies.
Such a premium is larger than what might be anticipated in a sector where patents have
been relatively unimportant. Most likely, the patent coefficients capture market valuation
associated with differences in firms’ unobserved innovative capabilities, as well as the
actual economic value of the patents. When added to the regressions, the company patent
stocks appear more “important” than the first-mover dummies in accounting for the
variation in firm value within the sample.
To determine if the patent premium differs between market pioneers and later entrants, an
interaction between FM and patents was tested. Table 6 gives the results when this
interaction term is added to the regressions. It shows that first-mover patents were 18The patent measure is in logarithms, with counts increased by 1 to avoid undefined values. 19 There is, however, great variation among the market maker pioneers. For example, the employment network (job boards) market space has two first-movers: TMP Worldwide (which owns the ‘Monster Board’) and Dice (which has remained focused on engineering employment in Silicon Valley). Both firms entered at about the same time, but TMP actively exploited the network effect and grew to have a market value more than one hundred times that of Dice.
24
indistinguishable from other patents in the early years of the sample. (Even so, first-
movers were more likely than other firms to patent, so first-movers had disproportionate
value associated with patents in these early years.) In 2002, a significant premium
emerges for patents by first-movers, and by 2003, the value associated with each first-
mover patent is more than twice that of a patent held by other companies on average.
Thus, we observe a substantial increase in the value associated with first-mover patents,
starting in the years following the Internet stock market crash. To some extent, this
growth in the value of first-mover patents is due to the fact that many of the weaker but
innovative pioneers failed to survive through the final year of the sample. These firms
were typically acquired by buyers who sought their patent portfolios.
Experiments with other patent measures showed a premium for business process patents
in some situations. No such premium was found for firms with patent applications prior
to market entry or IPO. (These findings, and a more detailed analysis of the patent data,
are provided in a related study.)
In general, the results in Tables 4, 5 and 6 show significant advantages for first-movers
when relative market capitalization is gauged within the market space. The advantages
of early entry appear largely confined to pioneers in markets with strong network effects,
and those with patented innovations. Table 7 addresses the robustness of these findings
by considering alternative definitions of first-movers. The table also gives regression
results with the industry fixed effects omitted, in order to view the impact on firm value
in absolute terms (rather than relative to competitors within the market space). While
such results proved fairly consistent across time periods, the regressions shown in Table
7 are based on data for the second quarter of 2003. This quarter was selected because it
falls toward the end of the coverage period while retaining a reasonable sample size.
The first three regressions in Table 7 show the effects of changing the definition of first-
mover. The first regression uses the preferred definition (FM); the second regression
20 This multiple is computed by adding the coefficients for the basic first-mover dummy and the “FM*NetworkMarket” dummy, and exponentiating the result.
25
assumes a unique first-mover in each market space (FM1); and the third regression
assigns the earliest 1/3 of entrants in each market space as first-movers (FM33). The fit
is slightly worse with these alternative definitions, and significance levels fall, but
otherwise the results appear reasonably robust across the three definitions.
The final columns of Table 7 give market value regressions based on simple OLS
estimation, omitting the industry fixed effects. In these regressions, market capitalization
is gauged relative to the mean of the sample rather than the mean of each market space.
Results are similar to those with industry fixed effects, except that the FM*MarketMaker
coefficients fall in magnitude and lose their statistical significance. This implies that on
average, the “market maker” pioneers enjoyed a large premium relative to followers in
their market space, but not relative to firms in the sample as a whole. If the consumer
auction market (eBay) is removed from the sample the trend becomes more extreme.
This reflects the fact that several of the market spaces in the “market maker” category
have fallen far short of their initial promise.21 The pioneering entrants into these market
spaces achieved Pyrrhic victories, succeeding relative to their direct competitors but
essentially failing overall.
Revenue Regressions
Table 8 reports the regressions using quarterly revenues as the dependent variable.
Explanatory variables are identical to those in Table 5, and the estimates are similar to
those shown in that table for market capitalization. Thus, the revenue regressions
corroborate the findings obtained when market capitalization is used as the dependent
variable. However, a few minor differences are notable.
The control variable for brick and mortar hybrids appears consistently positive and
significant in the revenue regressions through the end of 2001, indicating that in the early
years of the sample, brick and mortar hybrids had substantially higher revenue than the
21 This is particularly true for vertical marketplaces, real estate, and perhaps advertising network. The average market value of follower firms in the “market maker” categories lies significantly below the sample mean.
26
average firm in their market space. The differential disappears once competing startup
companies grow in size. A similar pattern is shown in the market value regressions
(Table 5), except that the differential is absent in the early period of the sample. One
interpretation is that during the years of market boom, the brick-and-mortar hybrids
failed to enjoy the same stock price premium as Internet startup firms.
Another difference between Tables 5 and 8 is that the patent coefficient is smaller in the
revenue regressions. (Although not shown, the patent interaction for first-mover firms
was also smaller.) These findings are consistent with the idea that patents contribute
more to profitability (or profit growth) than to revenues. Yet they also raise questions
about the endogeneity of patents. The implicit assumption in the regressions reported in
this paper is that patents contribute to market value, but some degree of reverse causality
is likely.
5. Analysis of Entrant Survival
Additional analysis was performed to investigate firm survival. Defining survival in the
case of Internet companies is not straightforward. Most firms in the sample failed to
survive as independent entities; however, the severity of outcomes varies greatly. At one
extreme, firms that liquidated or disappeared after bankruptcy must be classified as
failures. At the other extreme, firms that continue in their original markets as
independent companies, actively traded on major stock exchanges, are clearly survivors.
Most firms fall into a middle ground that spans a broad range. Nearly half the firms in
the sample were acquired, some under duress, but others at attractive prices. In most
cases the identities and Web presence of these firms have been maintained by the
acquiring company. One unusually aggressive acquirer, InterActiveCorp, bought up
many successful first-movers in the “broker” category, including Expedia, Hotel
Reservation Network, LendingTree, and Ticketmaster. Other companies in the sample
have consolidated through merger. Additional firms have been taken private, or have
been delisted from NASDAQ.
27
By November 2007, more than two-thirds of the 207 firms in the sample had disappeared
as independent companies. Among the clear failures, 32 had declared bankruptcy, and
five others disappeared or exited from their market space. In addition, there were 23
mergers (including in this category the buybacks of prior spinoffs by Barnes & Noble,
FTD, Rightstart, VitaminShoppe and Sabre) and 84 acquisitions of non-bankrupt firms.
Thus, more than half of the firms in the sample were acquired or merged.
The pattern of these exits appears far more random than what might be expected from the
analysis of market capitalization and revenue discussed previously. Of the 142 firms that
disappeared as independent companies, 33% were first-movers (FM) as compared with
32% for the sample as a whole. The percentage of firms having at least one patent was
virtually identical (34%) between the companies that disappeared and those in the sample
overall. In general, the similarity between firms that disappeared from the sample, and
those that did not, is striking.
Table 9 reports the findings of a statistical survival analysis, based on the Cox
proportional hazards model. This analysis confirms the near absence of any systematic
patterns relating to firm exit. Using a narrow definition of exit, there are 37 failures in
the sample; firms that were acquired or merged are coded as right-censored on their date
of acquisition. Under the broadest definition, firms that disappeared through merger or
acquisition are categorized as failures. Hazard estimates are shown for both definitions.
Given that virtually no failures occurred during the rising period of the Internet stock
market boom, the “entry date” for all firms was set at January 1, 2000. (If actual entry
dates are used, the model shows a strong survival advantage for earlier entrants, but this
result is essentially spurious.) In the Cox model, coefficients greater than 1.0 indicate
above average mortality, whereas coefficients below 1.0 denote low mortality rates.
Very few coefficients in Table 9 are statistically significant. In contrast with the results of
the market capitalization and revenue regressions reported previously, none of the first-
mover or patent measures were found to be significant in the survival analysis. Table 9
shows some weakly significant patterns relating to market type, with higher mortality for
28
firms in the retailer and market maker categories (based on the stringent definition of
exit). In general, it seems clear that the positive effects of patenting and pioneering on
firm value did not carry over to influence firm survival.
6. Conclusions
This study has considered the conditions under which first-mover advantages would be
expected to arise in Internet-related markets. The analysis of market value and revenue
shows advantages for early entrants in environments with network effects, and for
pioneers with patented innovations. Absent these factors, Internet first-mover advantages
appear minimal at best.
Thus, Internet first-mover advantages seem to have arisen under specific and limited
conditions, consistent with the extant theory. Internet first-mover advantages appear
much less extensive than what many early entrants anticipated. In the euphoria of the
early growth of Internet commerce, many entrepreneurs failed to understand the basis for
first-mover advantages (or they failed to perform adequate analysis prior to entry). The
view that first-mover advantages are pervasive throughout the Internet sector is clearly
incorrect.
Perhaps surprisingly, the survival rates of the Internet companies show almost no
systematic pattern. There is no evidence that early entry promoted survival, or that it led
to higher mortality. The contrast between these findings and those for market value
raises the question of whether survival is in fact a good measure of performance in the
Internet sector. While some companies that disappeared were clear failures, many firms
that were acquired can be regarded as successes.
A central finding of this paper, based on the analysis of market value and revenue, is that
first-mover advantages have been concentrated in product categories within the broader
classifications of “market maker” or “broker.” Such environments would seem
29

particularly conducive to the development of network effects. Nevertheless, in the
absence of specific measures of network externalities, support for this argument remains
incomplete. Further efforts are needed to deepen our understanding of network effects
within Internet business environments.
Outside of the “market maker” and “broker” categories, the mechanisms shown to
support first-mover advantages relate to patents. Internet first-movers had higher rates of
patenting than firms in the sample overall, and their patents received far more citations.
Moreover, the market value analysis suggests that first-mover patents had higher
potency. Work is in progress to shed additional light on connections between order of
entry, patenting, and market value.
These findings are subject to many caveats and limitations. The measures developed in
the study are crude proxies that correspond only imperfectly to the factors they are
designed to represent. Moreover, it proved impossible to develop measures for some
potentially important mechanisms, such as switching costs. Switching costs, rather than
network effects, may account for some of the first-mover benefits identified, such as
those in the “brokerage” category.
In addition to deficiencies of the empirical measures, sample selection biases may
influence the results. The sample is clearly biased toward successful Internet markets
(and hence a finding of successful first-movers); it omits many pioneering entrants whose
markets proved not to be viable. Limitation of the sample to public companies may
screen out early entrants who were in fact the true market pioneers. Although the
analysis finds first-mover advantages on average in the sample, the concentration of these
advantages within a few Internet sectors, combined with the sample selection biases,
suggests that early entry was likely an inferior strategy for the vast majority of
companies.
The main performance measure in this study, stock market capitalization, reflects
investor expectations, which may add a further unknown bias. Moreover, by comparing
30
the performance of pioneers with that of followers within each market space, first-mover
advantages have been gauged in relative terms, and not in terms of absolute long run
profits. This relative measure of performance may be distorted by the entry and exit of
firms in the sample.
Despite these limitations, the central findings of the study seem reasonably robust, and
they are consistent with common perceptions. Numerous early entrants within the
Internet “market maker” and “broker” categories remain successful to date (e.g., eBay,
E*TRADE, Expedia, Monster.com), as have pioneers that accumulated large portfolios
of patents (e.g., Amazon, Yahoo). This study has taken a broad perspective in an effort
to extend our understanding of Internet first-mover advantages. Many opportunities
remain to explore specific issues in detail.
31

References
Allison, J.R. and E.H. Tiller (2003). “Internet Business Method Patents.” In Wesley M. Cohen and Stephen A. Merrill, eds., Patents in the Knowledge-Based Economy, National Research Council, pp. 259-284. Biggadike, E. R. (1976). Corporate Diversification: Entry Strategy and Performance. Cambridge, MA, Harvard University Press. Eisenmann, Thomas R. (2002). Internet Business Models. Boston, McGraw-Hill. Golder, Peter N., and Gerard J. Tellis (1993). “Pioneer Advantage: Marketing Logic or Marketing Legend?” Journal of Marketing Research 30(2): 158-170. Goldfarb, Brent, David Kirsch, and David A. Miller (2007). “Was There Too Little Entry During the Dot Com Era?” Journal of Financial Economics 86(1): 100-144. Hall, Bronwyn H. (2003). “Business Method Patents, Innovation, and Policy.” NBER Working Paper 9717 (http://www.nber.org/papers/w9717). Hidding, Gezinus J. and Jeffrey R. Williams (2002). “Are There First-Mover advantages in B2B eCommerce Technologies?” Working paper, Carnegie-Mellon University. Kalyanaram, G., William Robinson and Glenn Urban (1995). “Order of Market Entry: Established Empirical Generalizations, Emerging Empirical Generalizations, and Future Research.” Marketing Science 14(3): G212-G221. Kerin, R., R. Rajan Varadarajan and Robert Peterson (1992). “First-Mover Advantage: A Synthesis, Conceptual Framework, and Research Propositions.” Journal of Marketing 56(4): 33-52. Levin, Richard, Alvin Klevorick, Richard Nelson, and Sidney Winter (1987). “Appropriating the Returns from Industrial Research and Development.” Brookings Papers on Economic Activity 3: 783-820. Lieberman, Marvin B., and David B. Montgomery (1988). “First-Mover Advantages.” Strategic Management Journal 9: 41-58. Lieberman, Marvin B., and David B. Montgomery (1988). “First-Mover (Dis)Advantages: Retrospective and Link with the Resource-Based View.” Strategic Management Journal 19: 1111-1125. Liebowitz, Stan (2002). Re-thinking the Network Economy: The True Forces that Drive the Digital Marketplace. AMACON Books.
32
33
Porter, Michael E. (2001). “Strategy and the Internet.” Harvard Business Review (March). Rangan, Subramanian, and Ron Adner (2001). “Profits and the Internet: Seven Misconceptions.” Sloan Management Review 42(4): 44-53. Shapiro, Carl and Hal R. Varian (1998). Information Rules. Boston, MA, Harvard Business School Press. Syzmanski, D., Lisa Troy and Sandar Bharadwaj (1995). “Order of entry and business performance: An empirical synthesis and reexamination.” Journal of Marketing 59(4): 17-33. Vanderwerf, Peter, and John F. Mahon (1997). “Meta-Analysis of the Impact of Research Methods on Findings of First-Mover Advantages.” Management Science. 43: 1510-1519. Wilson, Thomas, Kuncheria, Thomas and Gezinus J. Hidding (2003). “Complementary Resources and (Fast-)follower Advantages in e-Business Technology Industries.” Paper presented at the CIST conference, Atlanta, Georgia.
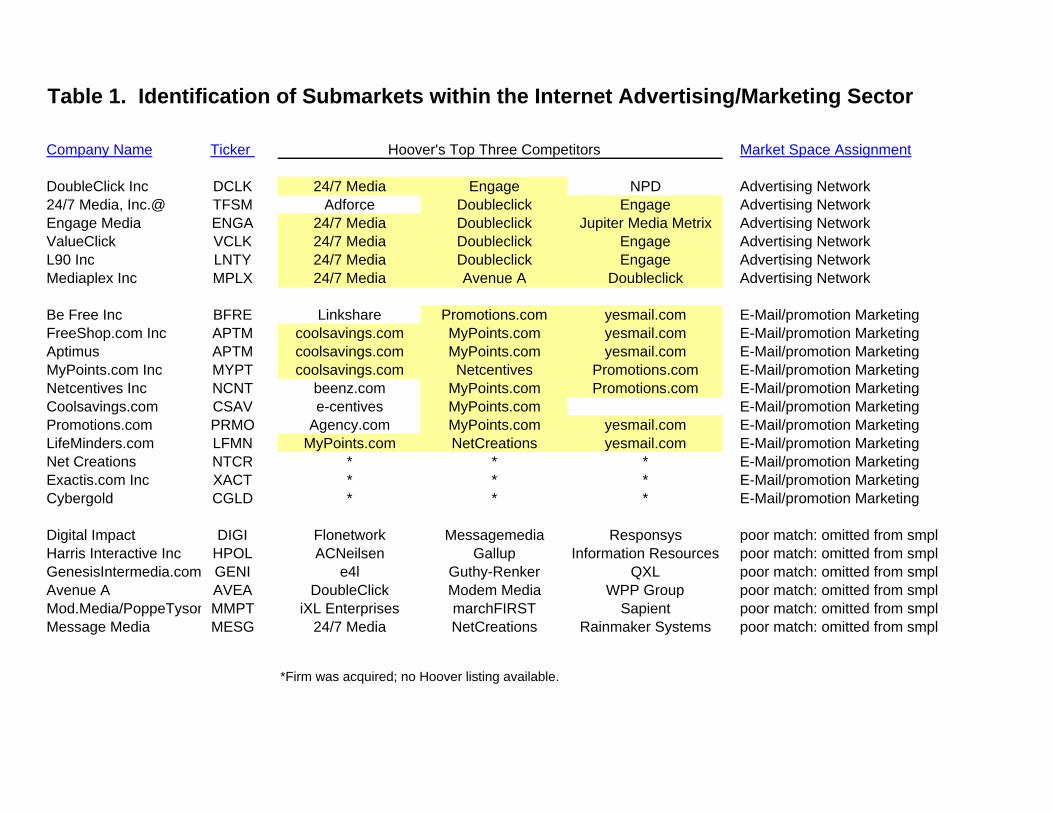
Table 1. Identification of Submarkets within the Internet Advertising/Marketing Sector
Company Name Ticker Hoover's Top Three Competitors Market Space Assignment
DoubleClick Inc DCLK 24/7 Media Engage NPD Advertising Network24/7 Media, Inc.@ TFSM Adforce Doubleclick Engage Advertising NetworkEngage Media ENGA 24/7 Media Doubleclick Jupiter Media Metrix Advertising NetworkValueClick VCLK 24/7 Media Doubleclick Engage Advertising NetworkL90 Inc LNTY 24/7 Media Doubleclick Engage Advertising NetworkMediaplex Inc MPLX 24/7 Media Avenue A Doubleclick Advertising Network
Be Free Inc BFRE Linkshare Promotions.com yesmail.com E-Mail/promotion MarketingFreeShop.com Inc APTM coolsavings.com MyPoints.com yesmail.com E-Mail/promotion MarketingAptimus APTM coolsavings.com MyPoints.com yesmail.com E-Mail/promotion MarketingMyPoints.com Inc MYPT coolsavings.com Netcentives Promotions.com E-Mail/promotion MarketingNetcentives Inc NCNT beenz.com MyPoints.com Promotions.com E-Mail/promotion MarketingCoolsavings.com CSAV e-centives MyPoints.com E-Mail/promotion MarketingPromotions.com PRMO Agency.com MyPoints.com yesmail.com E-Mail/promotion MarketingLifeMinders.com LFMN MyPoints.com NetCreations yesmail.com E-Mail/promotion MarketingNet Creations NTCR * * * E-Mail/promotion MarketingExactis.com Inc XACT * * * E-Mail/promotion MarketingCybergold CGLD * * * E-Mail/promotion Marketing
Digital Impact DIGI Flonetwork Messagemedia Responsys poor match: omitted from smplHarris Interactive Inc HPOL ACNeilsen Gallup Information Resources poor match: omitted from smplGenesisIntermedia.com GENI e4l Guthy-Renker QXL poor match: omitted from smplAvenue A AVEA DoubleClick Modem Media WPP Group poor match: omitted from smplMod.Media/PoppeTyson MMPT iXL Enterprises marchFIRST Sapient poor match: omitted from smplMessage Media MESG 24/7 Media NetCreations Rainmaker Systems poor match: omitted from smpl
*Firm was acquired; no Hoover listing available.
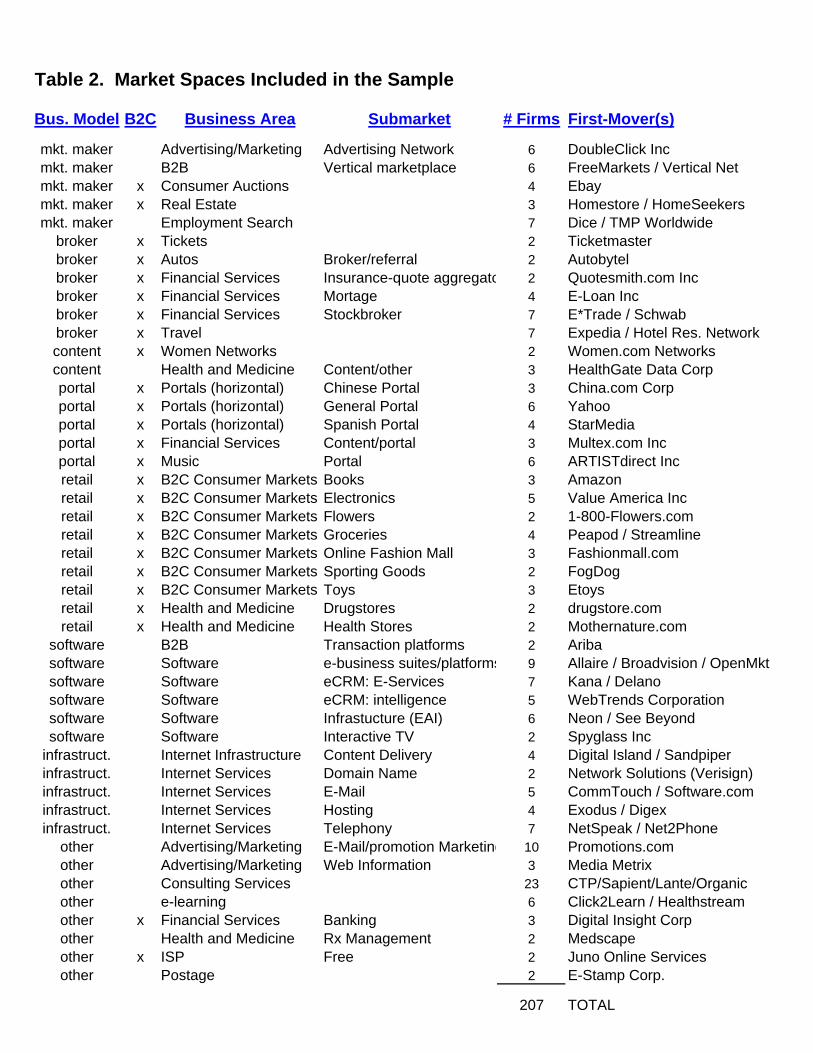
Table 2. Market Spaces Included in the Sample
Bus. Model B2C Business Area Submarket # Firms First-Mover(s)
mkt. maker Advertising/Marketing Advertising Network 6 DoubleClick Incmkt. maker B2B Vertical marketplace 6 FreeMarkets / Vertical Netmkt. maker x Consumer Auctions 4 Ebaymkt. maker x Real Estate 3 Homestore / HomeSeekersmkt. maker Employment Search 7 Dice / TMP Worldwide
broker x Tickets 2 Ticketmasterbroker x Autos Broker/referral 2 Autobytelbroker x Financial Services Insurance-quote aggregato 2 Quotesmith.com Incbroker x Financial Services Mortage 4 E-Loan Incbroker x Financial Services Stockbroker 7 E*Trade / Schwabbroker x Travel 7 Expedia / Hotel Res. Networkcontent x Women Networks 2 Women.com Networkscontent Health and Medicine Content/other 3 HealthGate Data Corpportal x Portals (horizontal) Chinese Portal 3 China.com Corpportal x Portals (horizontal) General Portal 6 Yahooportal x Portals (horizontal) Spanish Portal 4 StarMedia portal x Financial Services Content/portal 3 Multex.com Incportal x Music Portal 6 ARTISTdirect Incretail x B2C Consumer Markets Books 3 Amazonretail x B2C Consumer Markets Electronics 5 Value America Incretail x B2C Consumer Markets Flowers 2 1-800-Flowers.comretail x B2C Consumer Markets Groceries 4 Peapod / Streamlineretail x B2C Consumer Markets Online Fashion Mall 3 Fashionmall.comretail x B2C Consumer Markets Sporting Goods 2 FogDogretail x B2C Consumer Markets Toys 3 Etoysretail x Health and Medicine Drugstores 2 drugstore.comretail x Health and Medicine Health Stores 2 Mothernature.com
software B2B Transaction platforms 2 Aribasoftware Software e-business suites/platforms 9 Allaire / Broadvision / OpenMktsoftware Software eCRM: E-Services 7 Kana / Delanosoftware Software eCRM: intelligence 5 WebTrends Corporationsoftware Software Infrastucture (EAI) 6 Neon / See Beyondsoftware Software Interactive TV 2 Spyglass Inc
infrastruct. Internet Infrastructure Content Delivery 4 Digital Island / Sandpiperinfrastruct. Internet Services Domain Name 2 Network Solutions (Verisign)infrastruct. Internet Services E-Mail 5 CommTouch / Software.cominfrastruct. Internet Services Hosting 4 Exodus / Digexinfrastruct. Internet Services Telephony 7 NetSpeak / Net2Phone
other Advertising/Marketing E-Mail/promotion Marketing 10 Promotions.comother Advertising/Marketing Web Information 3 Media Metrixother Consulting Services 23 CTP/Sapient/Lante/Organicother e-learning 6 Click2Learn / Healthstreamother x Financial Services Banking 3 Digital Insight Corpother Health and Medicine Rx Management 2 Medscapeother x ISP Free 2 Juno Online Servicesother Postage 2 E-Stamp Corp.
207 TOTAL
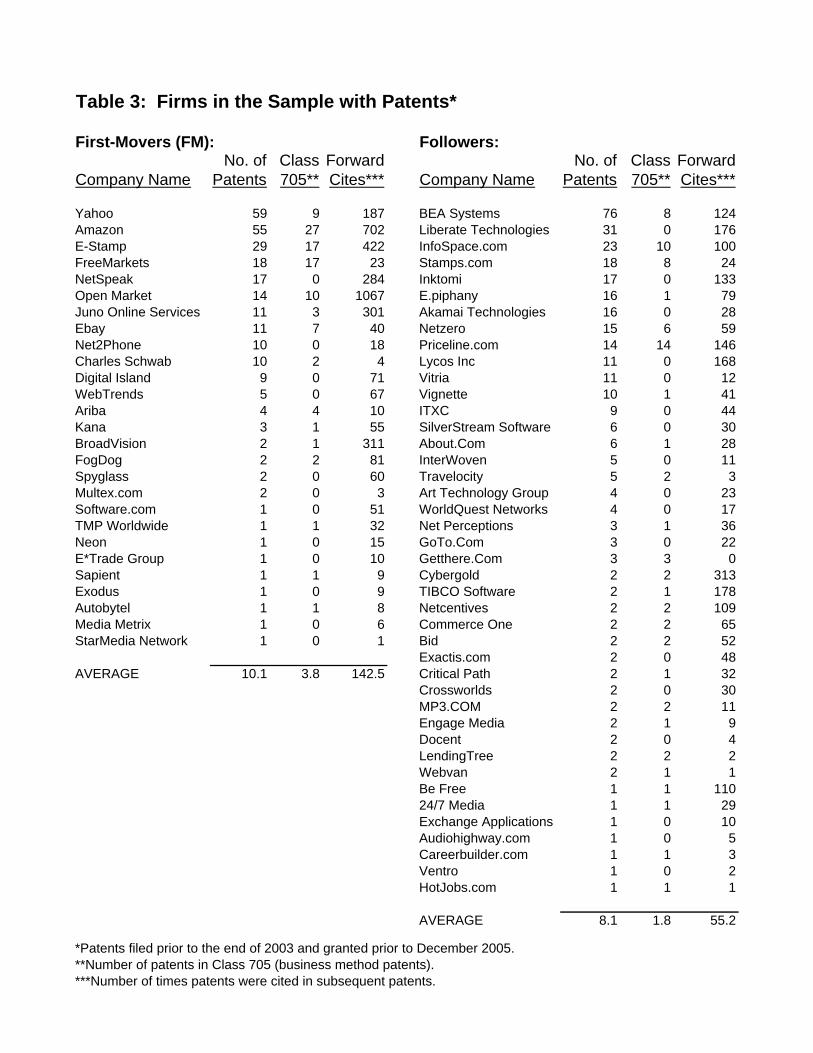
Table 3: Firms in the Sample with Patents*
First-Movers (FM): Followers:No. of Class Forward No. of Class Forward
Company Name Patents 705** Cites*** Company Name Patents 705** Cites***
Yahoo 59 9 187 BEA Systems 76 8 124Amazon 55 27 702 Liberate Technologies 31 0 176E-Stamp 29 17 422 InfoSpace.com 23 10 100FreeMarkets 18 17 23 Stamps.com 18 8 24NetSpeak 17 0 284 Inktomi 17 0 133Open Market 14 10 1067 E.piphany 16 1 79Juno Online Services 11 3 301 Akamai Technologies 16 0 28Ebay 11 7 40 Netzero 15 6 59Net2Phone 10 0 18 Priceline.com 14 14 146Charles Schwab 10 2 4 Lycos Inc 11 0 168Digital Island 9 0 71 Vitria 11 0 12WebTrends 5 0 67 Vignette 10 1 41Ariba 4 4 10 ITXC 9 0 44Kana 3 1 55 SilverStream Software 6 0 30BroadVision 2 1 311 About.Com 6 1 28FogDog 2 2 81 InterWoven 5 0 11Spyglass 2 0 60 Travelocity 5 2 3Multex.com 2 0 3 Art Technology Group 4 0 23Software.com 1 0 51 WorldQuest Networks 4 0 17TMP Worldwide 1 1 32 Net Perceptions 3 1 36Neon 1 0 15 GoTo.Com 3 0 22E*Trade Group 1 0 10 Getthere.Com 3 3 0Sapient 1 1 9 Cybergold 2 2 313Exodus 1 0 9 TIBCO Software 2 1 178Autobytel 1 1 8 Netcentives 2 2 109Media Metrix 1 0 6 Commerce One 2 2 65StarMedia Network 1 0 1 Bid 2 2 52
Exactis.com 2 0 48AVERAGE 10.1 3.8 142.5 Critical Path 2 1 32
Crossworlds 2 0 30MP3.COM 2 2 11Engage Media 2 1 9Docent 2 0 4LendingTree 2 2 2Webvan 2 1 1Be Free 1 1 11024/7 Media 1 1 29Exchange Applications 1 0 10Audiohighway.com 1 0 5Careerbuilder.com 1 1 3Ventro 1 0 2HotJobs.com 1 1 1
AVERAGE 8.1 1.8 55.2
*Patents filed prior to the end of 2003 and granted prior to December 2005. **Number of patents in Class 705 (business method patents).***Number of times patents were cited in subsequent patents.
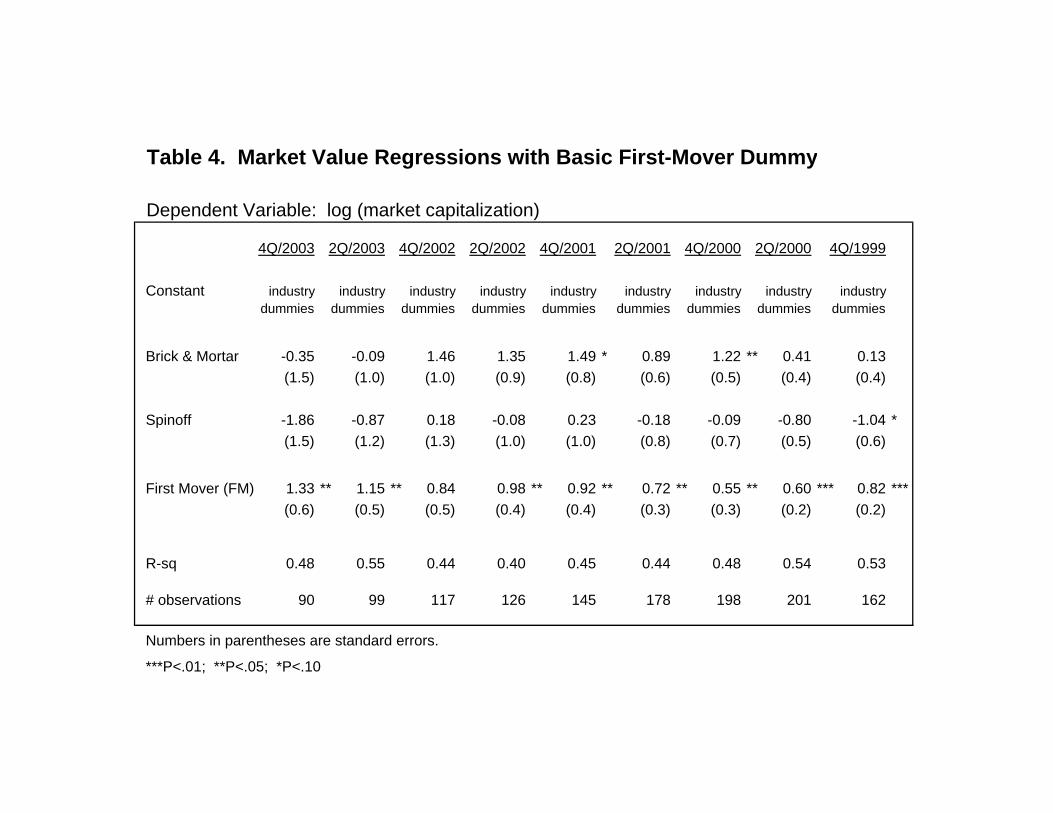
Table 4. Market Value Regressions with Basic First-Mover Dummy
Dependent Variable: log (market capitalization)
4Q/2003 2Q/2003 4Q/2002 2Q/2002 4Q/2001 2Q/2001 4Q/2000 2Q/2000 4Q/1999
Constant industry industry industry industry industry industry industry industry industrydummies dummies dummies dummies dummies dummies dummies dummies dummies
Brick & Mortar -0.35 -0.09 1.46 1.35 1.49 * 0.89 1.22 ** 0.41 0.13(1.5) (1.0) (1.0) (0.9) (0.8) (0.6) (0.5) (0.4) (0.4)
Spinoff -1.86 -0.87 0.18 -0.08 0.23 -0.18 -0.09 -0.80 -1.04 *(1.5) (1.2) (1.3) (1.0) (1.0) (0.8) (0.7) (0.5) (0.6)
First Mover (FM) 1.33 ** 1.15 ** 0.84 0.98 ** 0.92 ** 0.72 ** 0.55 ** 0.60 *** 0.82 ***(0.6) (0.5) (0.5) (0.4) (0.4) (0.3) (0.3) (0.2) (0.2)
R-sq 0.48 0.55 0.44 0.40 0.45 0.44 0.48 0.54 0.53
# observations 90 99 117 126 145 178 198 201 162
Numbers in parentheses are standard errors.
***P<.01; **P<.05; *P<.10
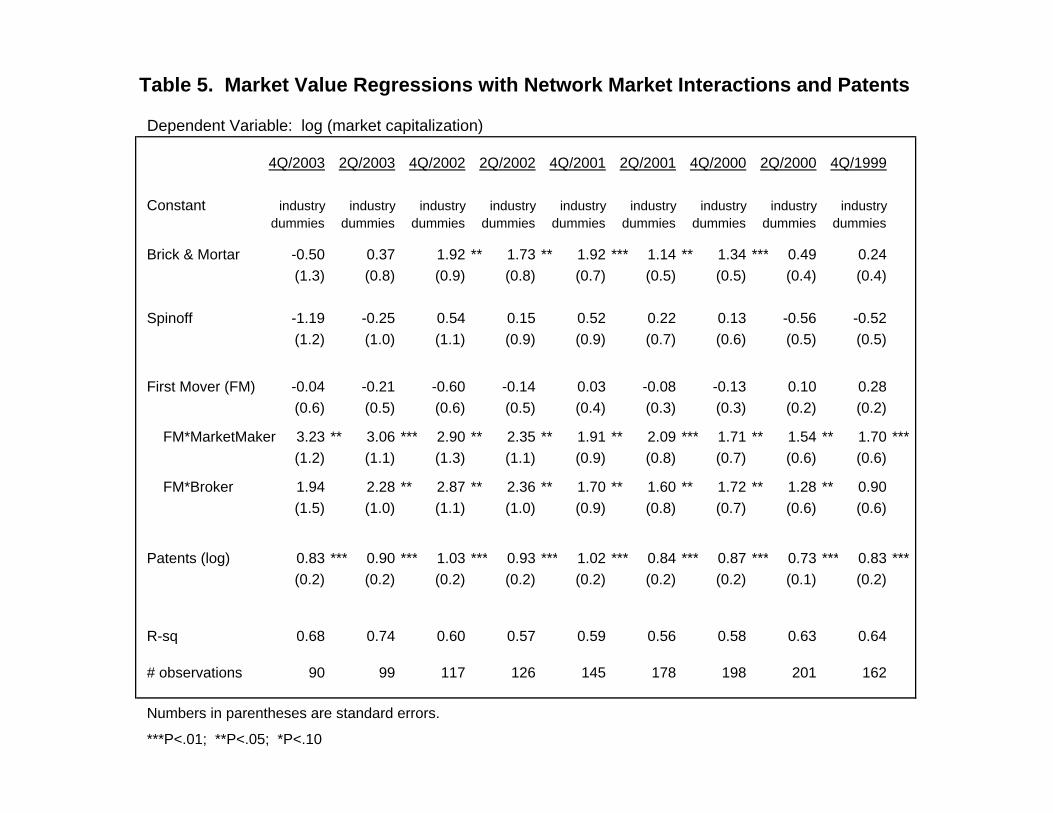
Table 5. Market Value Regressions with Network Market Interactions and Patents
Dependent Variable: log (market capitalization)
4Q/2003 2Q/2003 4Q/2002 2Q/2002 4Q/2001 2Q/2001 4Q/2000 2Q/2000 4Q/1999
Constant industry industry industry industry industry industry industry industry industrydummies dummies dummies dummies dummies dummies dummies dummies dummies
Brick & Mortar -0.50 0.37 1.92 ** 1.73 ** 1.92 *** 1.14 ** 1.34 *** 0.49 0.24(1.3) (0.8) (0.9) (0.8) (0.7) (0.5) (0.5) (0.4) (0.4)
Spinoff -1.19 -0.25 0.54 0.15 0.52 0.22 0.13 -0.56 -0.52(1.2) (1.0) (1.1) (0.9) (0.9) (0.7) (0.6) (0.5) (0.5)
First Mover (FM) -0.04 -0.21 -0.60 -0.14 0.03 -0.08 -0.13 0.10 0.28(0.6) (0.5) (0.6) (0.5) (0.4) (0.3) (0.3) (0.2) (0.2)
FM*MarketMaker 3.23 ** 3.06 *** 2.90 ** 2.35 ** 1.91 ** 2.09 *** 1.71 ** 1.54 ** 1.70 ***(1.2) (1.1) (1.3) (1.1) (0.9) (0.8) (0.7) (0.6) (0.6)
FM*Broker 1.94 2.28 ** 2.87 ** 2.36 ** 1.70 ** 1.60 ** 1.72 ** 1.28 ** 0.90(1.5) (1.0) (1.1) (1.0) (0.9) (0.8) (0.7) (0.6) (0.6)
Patents (log) 0.83 *** 0.90 *** 1.03 *** 0.93 *** 1.02 *** 0.84 *** 0.87 *** 0.73 *** 0.83 ***(0.2) (0.2) (0.2) (0.2) (0.2) (0.2) (0.2) (0.1) (0.2)
R-sq 0.68 0.74 0.60 0.57 0.59 0.56 0.58 0.63 0.64
# observations 90 99 117 126 145 178 198 201 162
Numbers in parentheses are standard errors.
***P<.01; **P<.05; *P<.10
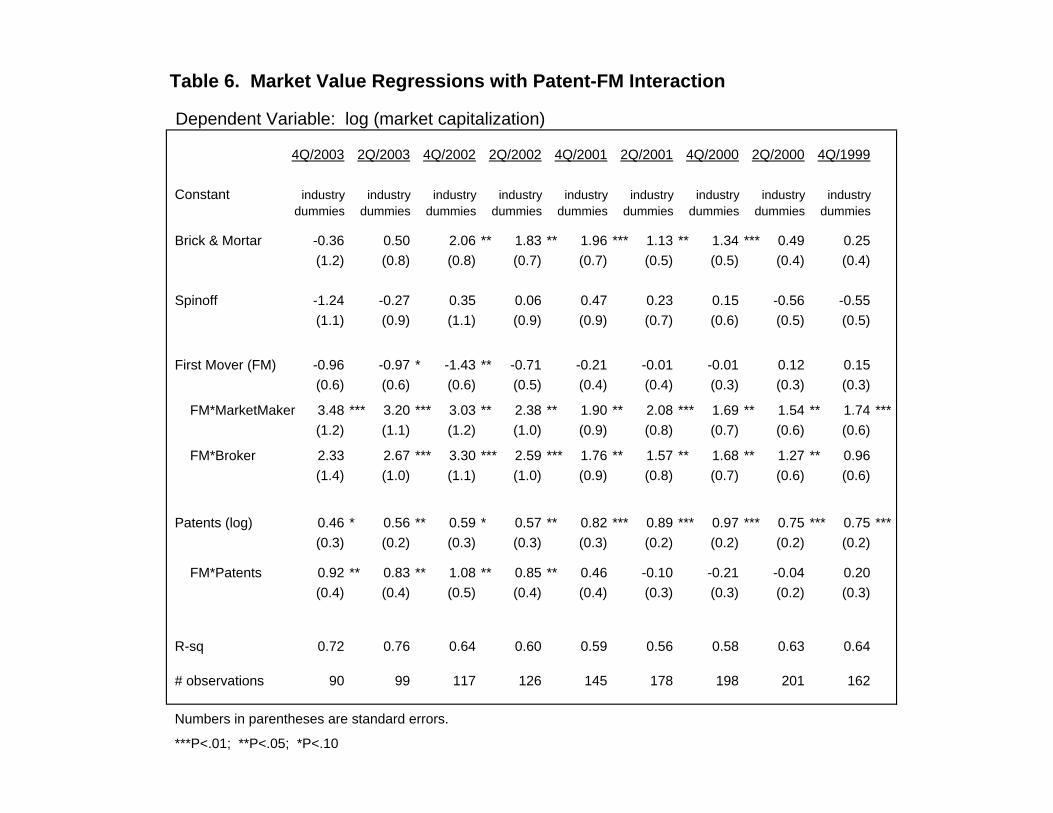
Table 6. Market Value Regressions with Patent-FM Interaction
Dependent Variable: log (market capitalization)
4Q/2003 2Q/2003 4Q/2002 2Q/2002 4Q/2001 2Q/2001 4Q/2000 2Q/2000 4Q/1999
Constant industry industry industry industry industry industry industry industry industrydummies dummies dummies dummies dummies dummies dummies dummies dummies
Brick & Mortar -0.36 0.50 2.06 ** 1.83 ** 1.96 *** 1.13 ** 1.34 *** 0.49 0.25(1.2) (0.8) (0.8) (0.7) (0.7) (0.5) (0.5) (0.4) (0.4)
Spinoff -1.24 -0.27 0.35 0.06 0.47 0.23 0.15 -0.56 -0.55(1.1) (0.9) (1.1) (0.9) (0.9) (0.7) (0.6) (0.5) (0.5)
First Mover (FM) -0.96 -0.97 * -1.43 ** -0.71 -0.21 -0.01 -0.01 0.12 0.15(0.6) (0.6) (0.6) (0.5) (0.4) (0.4) (0.3) (0.3) (0.3)
FM*MarketMaker 3.48 *** 3.20 *** 3.03 ** 2.38 ** 1.90 ** 2.08 *** 1.69 ** 1.54 ** 1.74 ***(1.2) (1.1) (1.2) (1.0) (0.9) (0.8) (0.7) (0.6) (0.6)
FM*Broker 2.33 2.67 *** 3.30 *** 2.59 *** 1.76 ** 1.57 ** 1.68 ** 1.27 ** 0.96(1.4) (1.0) (1.1) (1.0) (0.9) (0.8) (0.7) (0.6) (0.6)
Patents (log) 0.46 * 0.56 ** 0.59 * 0.57 ** 0.82 *** 0.89 *** 0.97 *** 0.75 *** 0.75 ***(0.3) (0.2) (0.3) (0.3) (0.3) (0.2) (0.2) (0.2) (0.2)
FM*Patents 0.92 ** 0.83 ** 1.08 ** 0.85 ** 0.46 -0.10 -0.21 -0.04 0.20(0.4) (0.4) (0.5) (0.4) (0.4) (0.3) (0.3) (0.2) (0.3)
R-sq 0.72 0.76 0.64 0.60 0.59 0.56 0.58 0.63 0.64
# observations 90 99 117 126 145 178 198 201 162
Numbers in parentheses are standard errors.
***P<.01; **P<.05; *P<.10
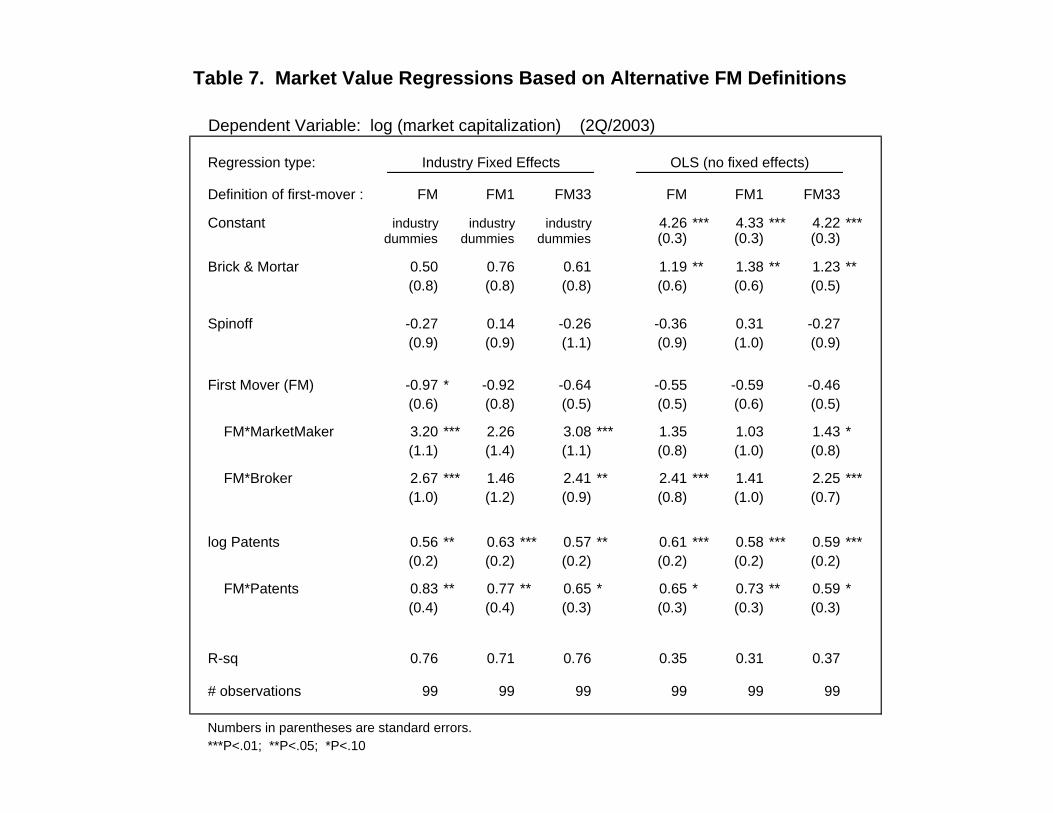
Table 7. Market Value Regressions Based on Alternative FM Definitions
Dependent Variable: log (market capitalization) (2Q/2003)
Regression type:
Definition of first-mover : FM FM1 FM33 FM FM1 FM33
Constant industry industry industry 4.26 *** 4.33 *** 4.22 ***dummies dummies dummies (0.3) (0.3) (0.3)
Brick & Mortar 0.50 0.76 0.61 1.19 ** 1.38 ** 1.23 **(0.8) (0.8) (0.8) (0.6) (0.6) (0.5)
Spinoff -0.27 0.14 -0.26 -0.36 0.31 -0.27(0.9) (0.9) (1.1) (0.9) (1.0) (0.9)
First Mover (FM) -0.97 * -0.92 -0.64 -0.55 -0.59 -0.46(0.6) (0.8) (0.5) (0.5) (0.6) (0.5)
FM*MarketMaker 3.20 *** 2.26 3.08 *** 1.35 1.03 1.43 *(1.1) (1.4) (1.1) (0.8) (1.0) (0.8)
FM*Broker 2.67 *** 1.46 2.41 ** 2.41 *** 1.41 2.25 ***(1.0) (1.2) (0.9) (0.8) (1.0) (0.7)
log Patents 0.56 ** 0.63 *** 0.57 ** 0.61 *** 0.58 *** 0.59 ***(0.2) (0.2) (0.2) (0.2) (0.2) (0.2)
FM*Patents 0.83 ** 0.77 ** 0.65 * 0.65 * 0.73 ** 0.59 *(0.4) (0.4) (0.3) (0.3) (0.3) (0.3)
R-sq 0.76 0.71 0.76 0.35 0.31 0.37
# observations 99 99 99 99 99 99
Numbers in parentheses are standard errors.***P<.01; **P<.05; *P<.10
Industry Fixed Effects OLS (no fixed effects)
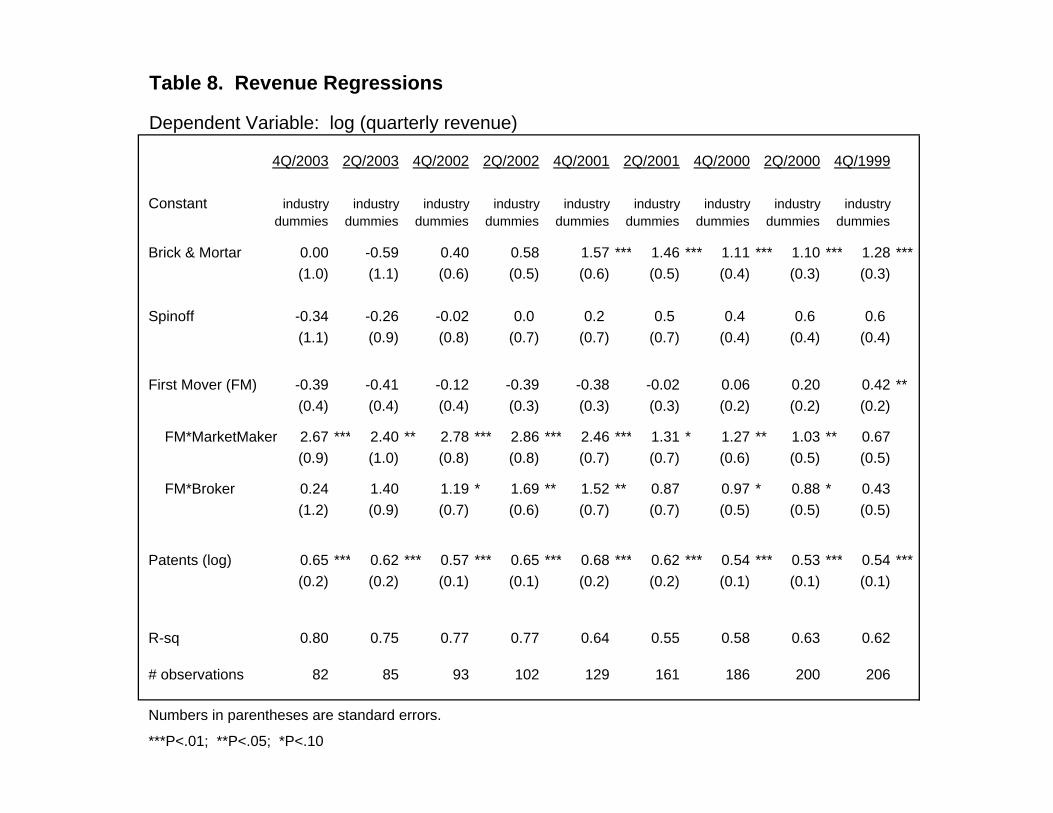
Table 8. Revenue Regressions
Dependent Variable: log (quarterly revenue)
4Q/2003 2Q/2003 4Q/2002 2Q/2002 4Q/2001 2Q/2001 4Q/2000 2Q/2000 4Q/1999
Constant industry industry industry industry industry industry industry industry industrydummies dummies dummies dummies dummies dummies dummies dummies dummies
Brick & Mortar 0.00 -0.59 0.40 0.58 1.57 *** 1.46 *** 1.11 *** 1.10 *** 1.28 ***(1.0) (1.1) (0.6) (0.5) (0.6) (0.5) (0.4) (0.3) (0.3)
Spinoff -0.34 -0.26 -0.02 0.0 0.2 0.5 0.4 0.6 0.6(1.1) (0.9) (0.8) (0.7) (0.7) (0.7) (0.4) (0.4) (0.4)
First Mover (FM) -0.39 -0.41 -0.12 -0.39 -0.38 -0.02 0.06 0.20 0.42 **(0.4) (0.4) (0.4) (0.3) (0.3) (0.3) (0.2) (0.2) (0.2)
FM*MarketMaker 2.67 *** 2.40 ** 2.78 *** 2.86 *** 2.46 *** 1.31 * 1.27 ** 1.03 ** 0.67(0.9) (1.0) (0.8) (0.8) (0.7) (0.7) (0.6) (0.5) (0.5)
FM*Broker 0.24 1.40 1.19 * 1.69 ** 1.52 ** 0.87 0.97 * 0.88 * 0.43(1.2) (0.9) (0.7) (0.6) (0.7) (0.7) (0.5) (0.5) (0.5)
Patents (log) 0.65 *** 0.62 *** 0.57 *** 0.65 *** 0.68 *** 0.62 *** 0.54 *** 0.53 *** 0.54 ***(0.2) (0.2) (0.1) (0.1) (0.2) (0.2) (0.1) (0.1) (0.1)
R-sq 0.80 0.75 0.77 0.77 0.64 0.55 0.58 0.63 0.62
# observations 82 85 93 102 129 161 186 200 206
Numbers in parentheses are standard errors.
***P<.01; **P<.05; *P<.10
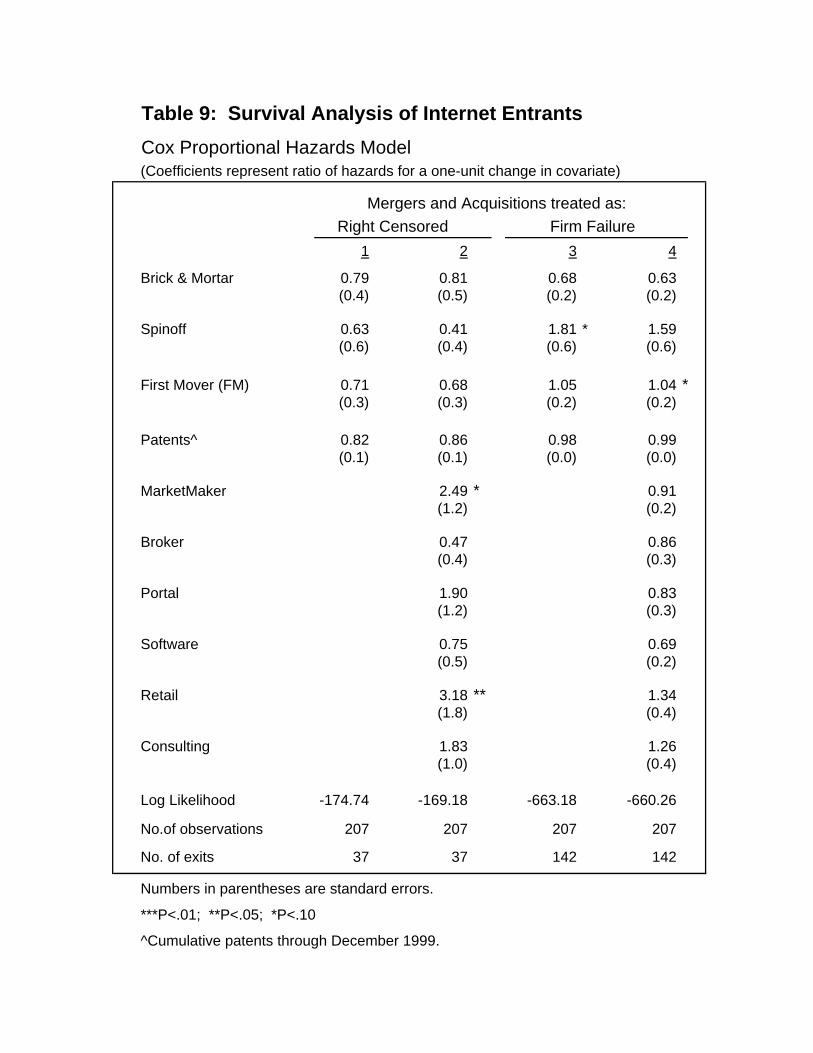
Table 9: Survival Analysis of Internet EntrantsCox Proportional Hazards Model(Coefficients represent ratio of hazards for a one-unit change in covariate)
1 2 3 4
Brick & Mortar 0.79 0.81 0.68 0.63(0.4) (0.5) (0.2) (0.2)
Spinoff 0.63 0.41 1.81 * 1.59(0.6) (0.4) (0.6) (0.6)
First Mover (FM) 0.71 0.68 1.05 1.04 *(0.3) (0.3) (0.2) (0.2)
Patents^ 0.82 0.86 0.98 0.99(0.1) (0.1) (0.0) (0.0)
MarketMaker 2.49 * 0.91(1.2) (0.2)
Broker 0.47 0.86(0.4) (0.3)
Portal 1.90 0.83(1.2) (0.3)
Software 0.75 0.69(0.5) (0.2)
Retail 3.18 ** 1.34(1.8) (0.4)
Consulting 1.83 1.26(1.0) (0.4)
Log Likelihood -174.74 -169.18 -663.18 -660.26
No.of observations 207 207 207 207
No. of exits 37 37 142 142
Numbers in parentheses are standard errors.
***P<.01; **P<.05; *P<.10
^Cumulative patents through December 1999.
Mergers and Acquisitions treated as: Right Censored Firm Failure


![[XLS]rajahmundrycorporation.orgrajahmundrycorporation.org/ComercialConnectionsList/D1... · Web viewSRI.PRAGALLAPATHI GAVARRAJU PAPPULA STREET, D.NO.31-7-4, 068774 BODAPATI VENKATA](https://img.pdfslide.us/doc/110x75/5b06bb627f8b9a58148d39c5/xlsra-viewsripragallapathi-gavarraju-pappula-street-dno31-7-4-068774-bodapati.jpg)