Embed Size (px)
Citation preview
DI
SC
US
SI
ON
P
AP
ER
S
ER
IE
S
Forschungsinstitut zur Zukunft der ArbeitInstitute for the Study of Labor
Did Employer Sanctions Lose Their Bite?Labor Market Effects of Immigrant Legalization
IZA DP No. 4972
May 2010
Magnus LofstromLaura HillJoseph Hayes
Did Employer Sanctions Lose Their
Bite? Labor Market Effects of Immigrant Legalization
Magnus Lofstrom Public Policy Institute of California
and IZA
Laura Hill Public Policy Institute of California
Joseph Hayes
Public Policy Institute of California
Discussion Paper No. 4972 May 2010
IZA
P.O. Box 7240 53072 Bonn
Germany
Phone: +49-228-3894-0 Fax: +49-228-3894-180
E-mail: [email protected]
Any opinions expressed here are those of the author(s) and not those of IZA. Research published in this series may include views on policy, but the institute itself takes no institutional policy positions. The Institute for the Study of Labor (IZA) in Bonn is a local and virtual international research center and a place of communication between science, politics and business. IZA is an independent nonprofit organization supported by Deutsche Post Foundation. The center is associated with the University of Bonn and offers a stimulating research environment through its international network, workshops and conferences, data service, project support, research visits and doctoral program. IZA engages in (i) original and internationally competitive research in all fields of labor economics, (ii) development of policy concepts, and (iii) dissemination of research results and concepts to the interested public. IZA Discussion Papers often represent preliminary work and are circulated to encourage discussion. Citation of such a paper should account for its provisional character. A revised version may be available directly from the author.
IZA Discussion Paper No. 4972 May 2010
ABSTRACT
Did Employer Sanctions Lose Their Bite? Labor Market Effects of Immigrant Legalization*
Taking advantage of the ability to identify immigrants who were unauthorized to work prior to obtaining Legal Permanent Resident status, we use the New Immigrant Survey to examine whether lacking legal status to work in the U.S. constrains employment outcomes of illegal immigrants. With the exception of high-skilled unauthorized immigrants, the data fail to reveal evidence of improved employment outcomes attributable to legal status. In light of evidence that unauthorized immigrants experienced increased wages as a result of receiving amnesty through the 1986 Immigration and Reform Control Act during the 1990s, we interpret the results as evidence of ineffective employer sanctions. JEL Classification: J8, J15, J18, J31, J61 Keywords: unauthorized, illegal, undocumented, immigration, legalization, amnesty Corresponding author: Magnus Lofstrom Public Policy Institute of California 500 Washington Street, Suite 600 San Francisco, CA 94111 USA E-mail: [email protected]
* The authors are grateful to Randy Capps, Ellen Hanak, Martin Guzi, Hans Johnson, Sherrie Kossoudji, Eric Larsen, Lindsay Lowell and Deborah Reed for their helpful comments as well as participants in meetings of the Population Association of America, the Western Economic Association, the Institute of the Study of Labor (IZA), the Association for Public Policy Analysis and Management and the Migration Policy Institute.
1
1. Introduction
In 1986 Congress enacted the Immigration Reform and Control Act (IRCA) with the
intention of curtailing the inflow of unauthorized immigrant workers. The framers of IRCA
pursued a three-pronged strategy. First, a general amnesty for those unauthorized workers
meeting certain residence or work requirements wiped the slate clean for the millions of
undocumented immigrants already established in the country. Second, the legislation imposed
sanctions on employers that hire unauthorized immigrants, attempting to remove the lure of
higher-paying employment for would-be unauthorized workers. Third, the legislation provided
more funds for border enforcement, in an effort to make it more difficult to enter the country
without proper documentation. By all measures, IRCA failed to achieve its key objective. Since
IRCA’s enactment, the undocumented immigrant population has grown from about 3 million to
close to 12 million in 2008 (Passel and Cohn, 2009).
The general public is deeply—and often vociferously—concerned about the effects
unauthorized immigrants may have on the economy. Policymakers continue to face difficult
decisions about whether and how to legalize some of these immigrants, weighing the costs and
benefits of doing so. As with IRCA, an important factor in their consideration is the effect that
legalization will have on employment outcomes. Earnings are likely to be lower and job
opportunities limited if legal status cause undocumented workers to face difficulties in obtaining
jobs which effectively utilize their skills. Removing these barriers would then lead to higher
earnings and possibly productivity gains.
A consistent picture of employment gains to legalization emerges from the research based
on IRCA, although the magnitudes of the effects vary substantially. Estimates of the wage effect
(as measured in 1992, about four years after receiving legal status) using survey data from the
Legalized Population Survey (LPS) find gains for men of between 6 and 15 percent (Rivera-
Batiz, 1999; Kossoudji and Cobb-Clark, 2002 and Amuedo-Dorantes, Bansak, and Rafael,
2007). Wage gains are also found in recent studies using the 1990 Census; Pan (2010) puts the
wage legalization benefit among men at about 12 percent while Barcellos (2010) provides a more
modest estimate of about 6 percent. Further evidence that lacking legal status impedes
employment outcomes is provided by Kossoudji and Cobb-Clark (2000) who finds indication of
upward occupational mobility among unauthorized immigrant men who received amnesty.
2
Not surprisingly given the abundance of evidence of legalization employment gains, many
assume that if a new amnesty were to be granted to today’s working population of unauthorized
immigrants, these workers would generally enjoy higher earnings and better job matches as a
result, with the potential for a widespread economic boost (Hinojosa-Ojeda, 2010 and Pastor et
al, 2010). However, some new research based on more recent survey data suggest that caution
for such optimism is warranted. For example, in a study of agricultural workers, Pena (2010)
concludes that “that a new legalization program would have minimal effects on the earnings of
currently undocumented farm workers as they transition to legal employment’ (p.2).
Furthermore, both Pan (2010) and Barcellos (2010) provide evidence that the positive wage
effects among workers who obtained legal status through IRCA dissipated over time. However,
the latter two studies rely on data from sources such as the Census, American Community
Survey (ACS) and the Current Population Survey (CPS) which do not contain information on
legal status. In sum, the effects of legal status on employment outcomes in today’s labor market
are unclear.
In this paper we take advantage of new data that allows for direct identification of
unauthorized immigrant workers to assess whether unauthorized immigrants are likely to
experience upward occupational mobility or wage gains from receiving legal status. We argue
that the IRCA based estimated employment effects may not provide a good basis for which to
base our expectations of the labor market effect of a new legalization program for two reasons.
First, relying on IRCA to identify the causal labor market impact of legalization is challenging
since relevant comparison groups are themselves likely to be affected by the large scale amnesty
and employer sanctions and that the earnings of unaffected groups, i.e. natives, may grow
differently over time. Second, and maybe more importantly, it is also possible that the role of
employer sanctions has changed and that it is no longer an effective deterrent. This may be due
to lax enforcement combined with widespread availability of false work authorization
documents.
We analyze how receiving Legal Permanent Resident (LPR) status affects occupational
mobility and wages of individuals who previously worked illegally in the U.S. and whether LPR
status allow them to obtain jobs in more desirable occupations and/or to increase wages. To do
so we use recent data from the New Immigrant Survey (NIS) and explore whether such potential
effects differ between workers who crossed the border illegally and workers who violated the
3
terms of a temporary visa. Importantly the NIS sample is rich enough to allow for tests of
differences in legalization effects by skills and is not restricted to Mexican and Central American
immigrants. Although legal status is not exogenously determined in the NIS sample we provide
numerous robustness checks of our results and discuss the directions of potential biases in our
estimates.
We find that improvements in employment outcomes from a new legalization program are
likely to be small, and possibly zero—at least in the short run. Specifically, the employment
outcomes of immigrants who cross the border without documentation do improve over time, but
none of these improvements are attributable to gaining legal status. These immigrants are
typically low-skilled workers with little education and lacking proficiency in the English
language. On the other hand, those immigrants who gain legalization after violating the terms of
a temporary visa are likely to demonstrate some occupational mobility that may be related to
acquiring legal status. On average, these workers are more highly skilled than those who cross
the border illegally. The differences we observe in occupational earnings growth between these
two groups of unauthorized immigrants are specifically attributable to their differences in skill:
We find that highly skilled immigrants in both groups exhibit occupational improvements after
gaining legal status.
The paper is organized in the following way. We discuss relevant existing research in section
2, introduce our data in section 3 and show descriptive statistics in section 4. The empirical
method is presented in section 5, results are discussed in section 6 and lastly, in section 7 we
provide a summary with our conclusions.
2. Previous Research
Most of the existing studies have in common that they take advantage of the 1986
Immigration Reform and Control Act (IRCA) and that they find an earnings penalty for
undocumented status and an increase in earnings resulting from legalization, often with varying
results by gender and differing returns to English skills and other human capital. Studies have
applied various methods utilizing mostly the Legalized Population Survey (LPS), a panel dataset
of formerly undocumented immigrants who received legal status under IRCA. These data have
the advantage that survey respondents are observed in the working population before and after
legalization. One challenge faced, though, is how to construct a suitable comparison group of
4
legal immigrants whose earnings can be meaningfully compared to those of the newly legalized
group.
Rivera-Batiz (1999) uses the LPS to examine the earnings of undocumented Mexican
workers. He then uses the 1990 census to compare these with the earnings of the overall
Mexican-born working population in the U.S. This analysis reveals a wage penalty of 14 and 26
percentage points for men and women, respectively, vis-à-vis the comparable legal working
population. He goes on to compare the earnings of legalized immigrants earnings pre- and post-
IRCA, finding an increase of 13 percentage points for men and 17 for women.
Kossoudji and Cobb-Clark (2002) also examine the effect of the IRCA legalizations,
employing the LPS to focus on the earnings of Mexican and Central American men. They use
the National Longitudinal Survey of Youth (NLSY) to construct a comparison group of Latino
men, and estimate the wage penalty for unauthorized status to be between 14 and 24 percent.
They estimate the earnings benefit of legalization to be a rather modest six percent, and they
attribute these gains to increased occupational mobility – in particular, an enhanced ability to
secure employment that rewards human capital such as English or formal education.
Amuedo-Dorantes, Bansak and Raphael (2007) also use the LPS and NLSY to estimate the
legalization effects of IRCA – in particular, what role occupational mobility and a change in the
reservation wage might play in the labor force attachment of newly legalized immigrants. They
consider the experience of both sexes and find a decrease in employment rates for men of five
percent and a decrease in labor force participation by women of nearly seven percent. Like
Kossoudji and Cobb-Clark, however, they find that legalization enhances the value of
immigrants’ human capital – particularly English skills – in commanding higher earnings.
Both Pan (2010) and Barcellos (2010) use IRCA’s January 1, 1982 residency requirement in
the Legally Authorized Workers (LAW) program to identify the effects of legalization. Unlike
previous research which relied on LPS data, they utilize large nationally representative survey
data to compare outcomes of pre-1982 arrivals to those of later arrivals. Both studies find
positive legalization wage effects in the 1990s but also evidence that these effects diminished
over time. Primarily due to the inability to directly identify unauthorized workers in the data, it is
unclear whether the identified effects reflect legalization.
Attributing the wage growth of the previously unauthorized to legalization may be
challenging in the case of previous research. IRCA legalized nearly 3 million low-skilled
5
workers, and in doing so, dramatically increased the supply of workers who were both low
skilled and legal. At the same time, new employer sanctions against the hiring of unauthorized
workers were toughened. Each of these actions could have affected both the targeted group (the
formerly unauthorized) and the likely comparison groups: (1) the low-skilled workers who were
legal before and after IRCA and (2) the low-skilled immigrant workers who remain unauthorized
after IRCA.
Comparing wages of formerly unauthorized low-skill workers to those of low-skill workers
who were legal both before and after IRCA might make wage growth appear greater than it is.
Because IRCA legalized so many immigrants, the supply of legal low-skilled workers may have
increased sufficiently that, at least theoretically, the average wages of the group that was legal
before IRCA might have actually fallen after IRCA. Thus, the gap between the two groups
appears smaller, but in part because wages of one group have fallen while the wages of the other
have risen. Not all can be attributed to growth in absolute wages of the formerly unauthorized.
Similarly, the introduction of employer sanctions against the hiring of unauthorized workers
makes employers less willing to pay unauthorized workers what they would receive in absence
of sanctions, making this group an inappropriate comparison group as the relatively higher wages
of previously unauthorized workers at least partly represents the worsening conditions for
unauthorized workers. In both instances, the result would also be an overestimation of the effect
of legalization. An alternative approach of using a group not affected by the amnesty may seem
like a reasonable strategy. However, this group may differentially be affected by changes in the
economy or other relevant factors that may change over time.
Not surprisingly, the results of previous studies are sensitive to the choice of comparison
group, as seen in the wide range of relative gains reported above. The study that compares
earnings for unauthorized immigrants after legalization to, arguably, the most appropriate group
(relatively young Latino men with limited labor market experience) finds the smallest effects of
legalization on wages (Kossoudji and Cobb-Clark, 2002). However, even this group may have
been negatively affected by IRCA through statistical discrimination (Bansak and Rapahel, 2001),
and the downward pressure on the comparison group may thus lead to overstating the benefits of
acquiring legal status.
Our research examines legalization in an economic environment where legalization could be
expected to have minimal effects beyond a relatively small group of immigrants experiencing a
6
change in legal status—approximately 240,000 out of an estimated 7.9 million unauthorized
immigrants in 2003 (Passel and Cohn, 2009). Recognizing that labor markets change over time
we use more recent data from the NIS which provide a relevant comparison group in the same
dataset – continuously legal immigrants. This group attained LPR status at the same time, and
has the same set of demographic, human capital, employment, and immigration-related
information, all of which is measured and reported in the same way as for the unauthorized
worker groups. Furthermore, the unauthorized population has changed since the 1980s and now
includes many who are not from Mexico and Central America and whose skills vary to a greater
extent. Our sample includes workers of both genders, in various occupations, from a wide range
of countries, who arrived in the U.S. at various points. This variety allows us to extrapolate our
results to a wider swath of the immigrant population, more closely reflecting the current
population of unauthorized immigrants most likely to be eligible for a future amnesty.
3. Data
The data utilized in this paper come from the New Immigrant Survey (NIS). The NIS seeks
to provide a nationally representative public-use dataset on adults and their families who have
recently gained legal permanent residence in the United States. The NIS takes as its sampling
frame the USCIS administrative records of all foreign-born persons admitted to LPR status.
From this universe, a stratified sample is drawn and detailed interviews are conducted. The first
full cohort surveyed as part of this project used a target population of 289,478 adult immigrants
granted LPR status between May and November of 2003 (Jasso et al., 2006).
The 2003 NIS gathered details about historical and current employment (for example, dates,
occupation, industry, and earnings), including for U.S. jobs held before admission to LPR, and
work authorization attained, migration history as well as standard socioeconomic information.
To determine each immigrant’s legal status prior to earning LPR status, we look at migration and
employment history. If a respondent reports having arrived with no documents, or with falsified
documents, he or she is classified as a illegal border crosser or “crosser” for short If, instead, a
respondent reports having worked while on a visa that did not permit employment, he or she is
classified as visa abuser or “overstayer” for short. Otherwise, the respondent is classified as
having worked legally on that pre-LPR job and is referred to as continuously legal. From these
7
detailed data we are able to observe immigrants in their first U.S. jobs and soon after earning
green cards (between 3 and 14 months). We can thus measure gains for the unauthorized relative
to the documented in earning LPR status.
Our analysis begins with the full sample of 8,573 completed interviews. We eliminate
records for which key information is missing – namely, age, sex, marital and household status,
education, and whether the respondent worked for pay before or after gaining LPR status – and
retain 7,522 records. We then restrict our sample to individuals between the ages of 18 and 65
with valid responses for occupation in pre-LPR and post-LPR jobs, and who reported working in
both periods. These restrictions yield 4,486 individuals for our occupational mobility analysis.
Finally, requiring valid calculable wage information for both pre-and post-LPR jobs, we winnow
down the dataset to 2,660 observations for examining hourly wages. To analyze the economic
benefits of receiving legal status, we focus on two outcomes – median gender and occupation
specific annual earnings and hourly wages.
The objective with the first measure is to evaluate whether the data provides evidence that
previously unauthorized immigrants experience upward occupational mobility as a result of
removing the potential barrier of lacking legal status. To do so, we use gender-specific median
earnings of foreign-born individuals by occupation, as recorded in the 2000 census, as an
outcome measure. For each job under consideration, a census occupation code is provided. Using
the 5% 2000 census Public Use Microdata Sample File (PUMS) data, we calculate the median
gender-specific earnings for foreign-born persons in each occupation, then assign these earnings
data to each job performed by each respondent. In this way, we can compare changes between
pre- and post-LPR earnings, among former overstayers, crossers, and continuously legal
workers. As mentioned above, the analysis using this measure may best be viewed as one of
occupational mobility, but we frequently refer to this measure “occupational earnings.”
This measure fails to capture earnings growth within the same occupation, or similarly
remunerated occupation, as a result of legalization. Hence, similarly to previous research (e.g.
Kossoudji and Cobb-Clark, 2002), we also examine hourly wages. Although there are several
advantages of using this outcome measure, there are a few potential drawbacks.
First, the data only allows us to reliably generate earnings or wages for about 60 percent of
the sample of individuals who meet our sample restriction criteria. The reasons are either missing
earnings information or missing information that would allow us to determine the time period the
8
reported earnings refer to (i.e. per year, month or week). When we compare the sample of those
who have reported their hourly wages to the larger sample for whom we have occupation data,
we find little difference between the two (Hill, Lofstrom and Hayes, 2010).
Second, because the pre-LPR status period for about one-quarter of our sample is more than
five years prior to the interview date, we are uncertain as to whether the reported historical
earnings information, i.e., pre-LPR wages, is accurate. Our extensive sensitivity analyses
discussed below, addressing both the differences in the occupational earnings and wage samples
as well as potential drawbacks with our labor market outcome measures, provide no indication
that these issues alter the conclusions drawn in the report.
4. Descriptive Statistics
We begin our analysis by comparing our sample of recent immigrants by legal experience in
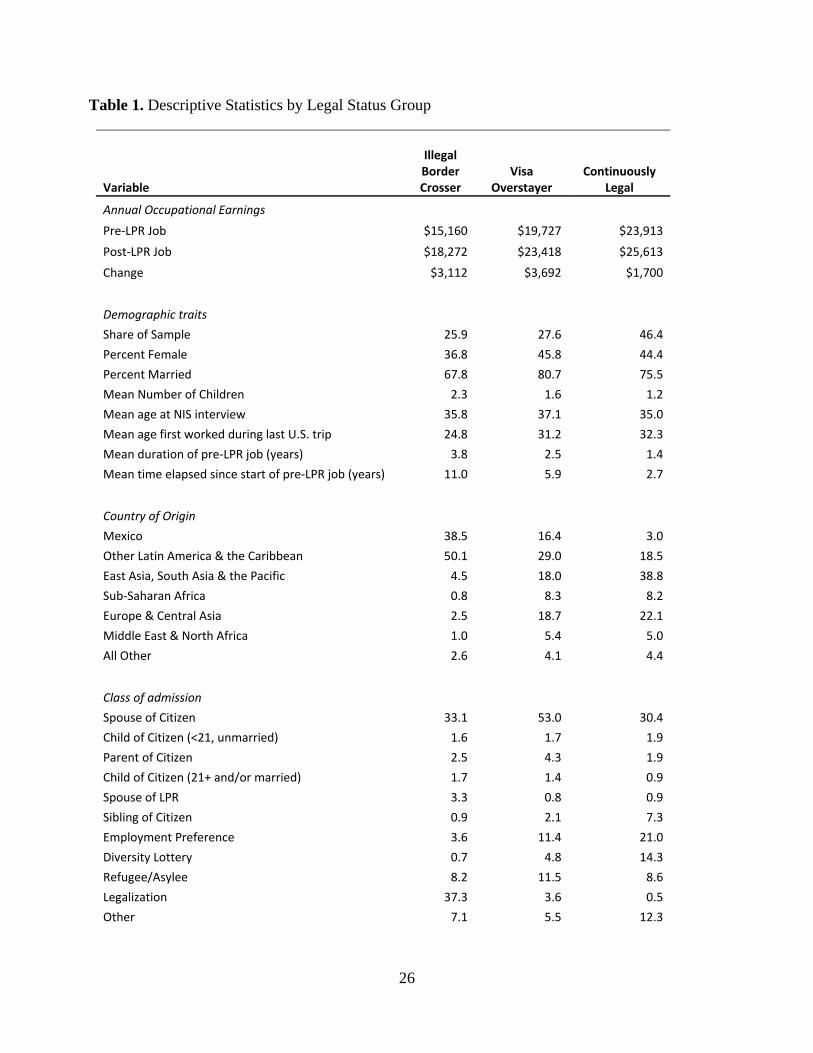
the U.S. Table 1 shows that slightly more than one-half of our occupation sample (those
individuals who reported working in both the pre- and post-LPR period) were employed without
authorization in the U.S. in the pre-LPR period. The percent who abused a visa, 27.6 percent, is
just slightly greater that the proportion of illegal border crossers, 25.9 percent.
Illegal border crossers appear to earn substantially less than their counterparts. Their group’s
median annual earnings in their last reported U.S. occupation prior to earning LPR status average
about $15,000, more than $4,500 less than the visa abusers, and nearly $9,000 less than the
continuously legal group. A similar pattern holds for the first reported post-LPR occupation: the
formerly illegal workers earn roughly $18,000 on average, compared to $23,000 for former visa
abusers and over $25,000 for the legal group. A simple comparison of the earnings differences,
pre- and post-LPR, suggests that the two groups of formerly unauthorized workers stand to gain
substantially more from earning green cards than do their always-legal counterparts – their
earnings rise by an average of $3,100 (illegal border crossers) and $3,700 (visa abusers),
compared to $1,700 for the continuously legal group.
Immigrants in our three legal groups differ in many dimensions of observable characteristics.
For example, Table 1 shows that illegal border crossers are less likely to be female, less likely to
be married, and have more children than do their counterparts. Close to 90 percent of illegal
border crossers come from Latin America and the Caribbean, with slightly more than 38 percent
9
from Mexico. In the legal sub-group, Asian immigrants constitute nearly 40 percent, while only
three percent are Mexican. The class of admission used to gain LPR status also varies greatly
across the three groups. While family preferences are the most common way of receiving legal
permanent resident status for each group, employment preferences are much more commonly
used by continuously legal immigrants (21.0 percent) than by visa abusers (11.4 percent) or
illegal border crossers (3.6 percent). A similar, if less pronounced, pattern emerges in the use of
the diversity lottery. Illegal border crossers are the most likely group to employ the
“legalization” option – 37.3% obtained LPR status this way. This not a program, but rather a
collection of special legislation and other instances in which illegal residents qualified to have
their deportation orders canceled. The legalization category includes those who qualified for the
Nicaraguan Adjustment and Central American Relief Act of 1997.
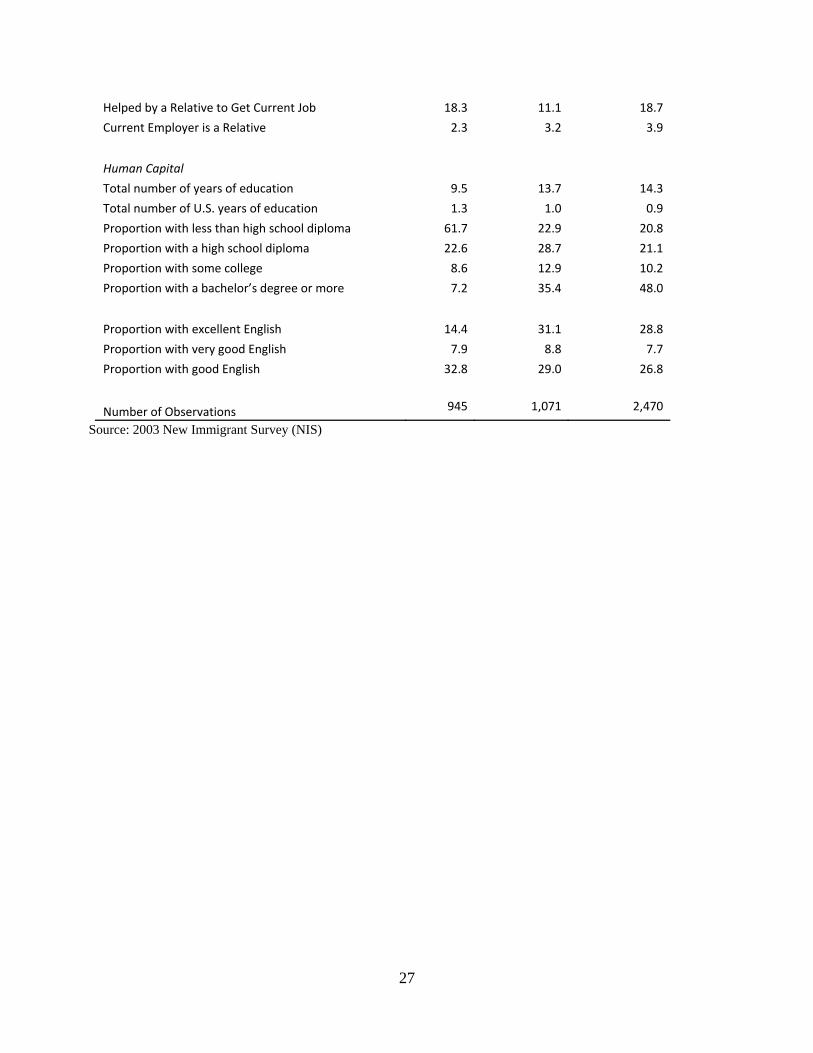
The illegal border crossers group displays low levels of education, as reflected in the mean
total years of education (9.5 years) and the profile of educational attainment – 61.7 percent do
not have a high school diploma, compared with 22.9 and 20.8 percent of visa abusers and
continuously legal immigrants, respectively. Similarly, only 7.2 percent of illegal border crossers
have a bachelor’s degree, while more than a third of the visa abusers and nearly half of strictly
legal respondents do. English ability also varies across the three groups with visa abusers
appearing to be the most fluent group. Forty-five percent of illegal border crossers report that
they speak and understand English either “not well” or “not at all,” compared with only about a
third of each of the other groups, and only 14.4 percent report top levels of speaking and
comprehension, as compared with roughly a third for visa abusers and continuously legal
respondents. We also observe differences in the time elapsed between the beginning of that pre-
LPR occupation and the eventual NIS interview – illegal border crossers had been in the U.S. for
an average of 11.0 years since taking that job, compared with 5.9 years and 2.7 years,
respectively, for the visa abusers and the strictly legal immigrants.
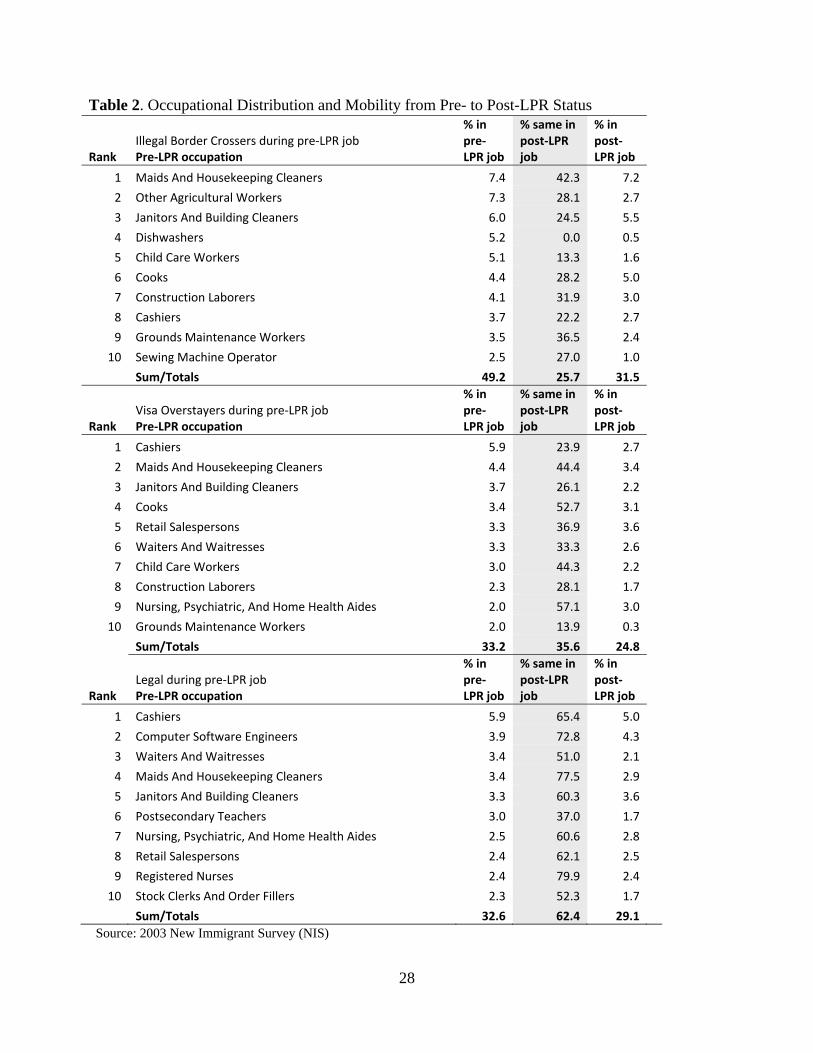
To better understand occupational mobility, we examine occupations by legal status group.
Table 2 displays for each group the top ten pre-LPR occupations and their representation. The
second column shows what percentage of these job-holders stayed in the same occupation in
their post-LPR job. The last column shows each of the top ten pre-LPR period job’s
representation in the post-LPR era. A few patterns emerge.
10
First, the jobs most commonly held by former illegal border crossers tend to be in low-skill
occupations. Many of these occupations appear as well among the jobs reported by former visa
overstayers, the new additions being retail salespersons, waiters and waitresses, and nursing,
psychiatric, and home health aides. Some of the same jobs appear near the top of the list for
continuously legal workers as well, but now the additions are in more conspicuously high-skill
occupations: computer software engineers and postsecondary teachers.
Almost without exception, the most commonly held occupation in the post-LPR job is the
one held in the pre-LPR job. (The two exceptions are dishwashers, who predominantly took
other jobs in the food service industry, and child care workers, who were only slightly more
likely to take jobs as maids and housekeeping cleaners than to stay in their previous occupation.)
Third, the two groups of formerly unauthorized workers show a greater propensity towards
occupational mobility than does the group of consistently legal workers. In just this sample of
the ten most common occupations for each group, the former illegal border crossers stayed in
their pre-LPR occupations about 26 percent of the time. The former visa abusers maintained their
pre-LPR occupations 36 percent of the time. But the consistently legal immigrants stayed in their
pre-LPR occupations 62 percent of the time. This may be largely a result of the aforementioned
differences in recent U.S. experience – both formerly illegal groups report much more time spent
here since beginning the pre-LPR job than do the consistently legal immigrants.
5. Empirical Model
Our empirical strategy is to compare employment outcomes of unauthorized workers to
immigrants with no unauthorized immigration history. Clearly we need to address the
endogeneity, or selection, concerns stemming from the possibility that individuals sort
themselves into the three groups partially based on factors related to employment outcomes. It
should be pointed out that we do not view the comparison of outcomes across groups as a quasi-
experimental exercise since the distinction across groups is arguably due to unobservable
personal decisions and characteristics which may also be linked to earnings. Our approach is to
as carefully as possible control for these factors in our empirical models by including variables
that serve as proxies.
11
Immigrants can obtain LPR status through different classes of admission. The most
common pathway is through family already present in the U.S. Close to 2/3 of immigrants who
received a green card in our sample used these close family relations to obtain LPR status. The
next most common pathways are through refugee/asylum status (11.5 percent) and employment
preferences (11.4 percent).
Although it is well known that immigrants in different class of admission groups differ in
observable skills, they may also differ with respect to unobservable earnings related factors. For
example, it may be that immigrants obtaining LPR status through employment preferences
possess more of these characteristics, say motivation, ambition or ability, than immigrants who
receive a green card through family. It is also possible that immigrants receiving a green card
through family preferences benefit from existing family networks to a greater extent than other
immigrants. Controlling for eventual class of LPR admission may then serve to address the role
of unobservable earnings related characteristics. In addition, the inclusion of country of origin
fixed effects will further control for such factors, which are unobserved by the econometrician.
We use ordinary least squares (OLS) to estimate the following regression model of pre-
LPR status log-annual earnings and log-hourly wages, , of individual i from country j who
arrived at time t.
Pre-LPR Pre-LPR
1 2ijt i i it i j t ijty IBC OS eα α β γ δ τ= + + + + + +X W (1)
Where IBC and OS are indicator variables for border crossers and overstayers and;
= Matrix containing demographic characteristics such as age, gender, family
composition, educational attainment and geographic location
iW = Matrix containing network proxies represented by class of admission and whether
post-LPR job was obtained with the help of family or relative and whether the
person works for a relative.
= Country of origin fixed effects
= Year of entry fixed effects
An analysis of labor market outcomes at first U.S. job potentially provides information
on the penalty of lacking legal status. A concern with interpreting this as a legalization effect in a
cross sectional regression is that it may well be due to unobservable factors correlated with legal
Pre-LPRi
y
Pre-LPRitX
jδ
tτ
12
status. Instead, we view this as a starting point, arguing that if the lack of legal status is a barrier
to good employment outcomes, removing this barrier should lead to better outcomes for this
group, holding other individual factors constant, and comparing those changes to those of
continuously legal.
To do so, we specify a model of the changes in outcomes between the pre- and post-LPR
periods. The specification contains the above factors as well as information on post-LPR English
ability and education obtained in the U.S. These post-LPR factors are added to the X matrix, now
labeled .
1 2
Post-Pre ' ' Post-LPR ' ' ' 'ijt i i it i j t ijty IBC OSα α β δ τ εΔ = + + + + + +X W (2)
The parameters of interest in specifications (1) and (2) are , , , and . Under the
assumptions that and Pre-LPR[ | , , ] 0it it i tE e OS δ τ =X , i.e., conditional
on , the disturbance term is uncorrelated with legal status, OLS will yield
unbiased estimates of the employment effect of legalization. Similar assumptions are necessary
for OLS estimates of and to be unbiased, although these are arguably more tenable given
the focus on changes. A limitation to our OLS approach is that there is no formal test for whether
these assumptions hold. Unfortunately, we are not aware of an appropriate instrument for legal
status in the pre-LPR period in our data. Nonetheless, we believe that the above factors, which
also include potentially important controls for unobservable factors like networks, time-of-arrival
macro economic conditions, assimilation and transferability of human capital, substantially
reduce the concerns of endogeneity of legal status.
Also if, among our NIS sample, the above factors fail to capture employment related
unobservable factors correlated with legal status (such as ability, motivation and networks), these
factors are likely to be positively correlated with authorized status, exacerbating the differences
between legal and illegal workers and hence leading to an upward bias of the OLS estimated
legalization benefits. From this perspective, the presented results below are upper bounds of the
employment gains to adjusting to legal status.
However, it is also possible that our NIS sample is not representative of the general
unauthorized population in the country. It seems plausible that the unauthorized immigrants who
Post-LPRitX
1α 2α 1α′ 2α′
Pre-LPR[ | , , ] 0it it i tE e IBC δ τ =X
Pre-LPR , and it i tδ τX
1α′ 2α′
13
find a way to obtain a green card are positively selected, compared to those who do not. If
lacking legal status can be overcome more easily among the positively selected unauthorized
immigrants in the NIS data by using, for example, their network of friends and family, our
estimates understate what the true employment gains to legalization are. That is, our results
cannot be expected to be the same for the general population of unauthorized immigrants
residing in the United States unless the two groups are similar and operate in similar labor
markets.
Comparing the same sample of unauthorized in the NIS as the one used in this paper to
Passel’s (2009) CPS estimates of the characteristics of the unauthorized working age population
in general, Hill, Lofstrom and Hayes (2010) show that the distributions of educational attainment
and occupations are very similar across samples. One noticeable difference is that the NIS
sample is slightly older and has been in the U.S. longer than the overall population of
unauthorized immigrants. This is not surprising but is also of policy relevant since, like with
IRCA, a new amnesty is very likely to include a length of residency requirement, meaning that
the most recent arrivals will not qualify for receiving legal status. Overall, a comparison of
observable factors fail to reveal evidence that the NIS sample is substantially different from the
population of unauthorized immigrants who are most likely to qualify for any future amnesty.
6. Empirical Results
Occupational Earnings and Mobility
We begin our discussion of the empirical results with an analysis of pre-LPR median earnings by
occupation. Before doing so, a reminder on our terminology is warranted. For simplicity, we will
frequently refer to our foreign born gender-specific median annual earnings by occupations simply as
“occupational earnings”, particularly in the pre-LPR analysis.
Pre-LPR Status Occupational Earnings Differences
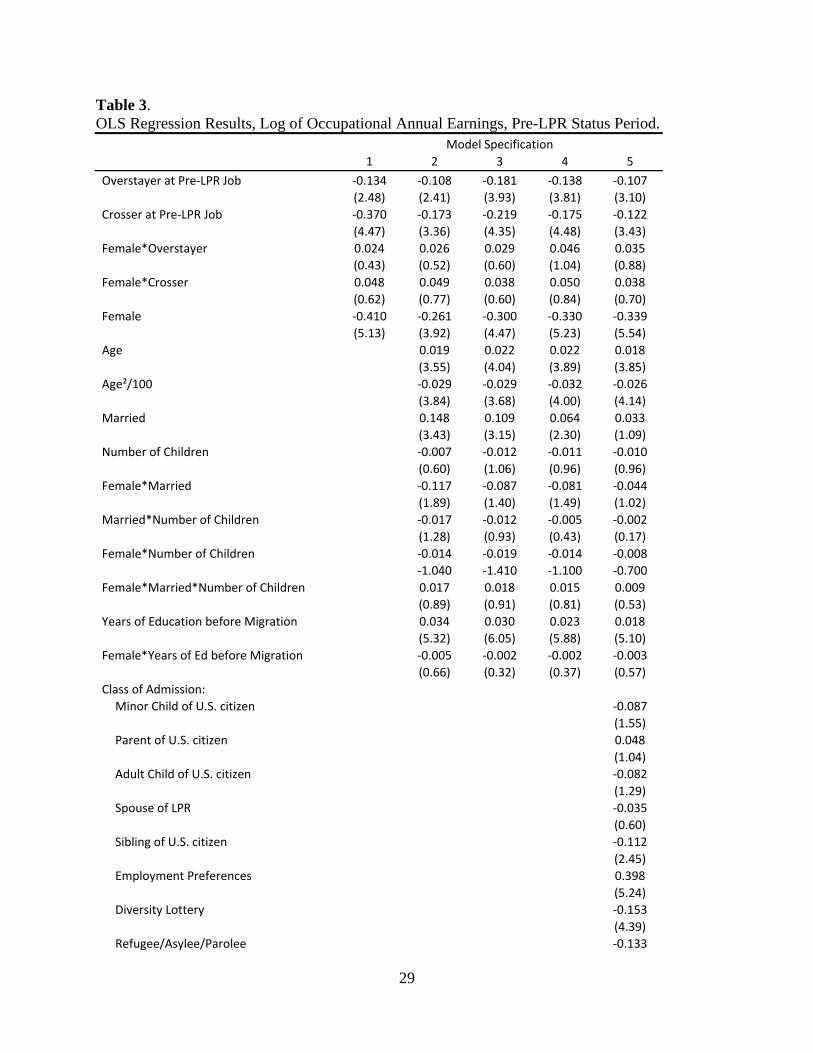
Unauthorized workers are employed in occupations with substantially lower earnings than
are legal workers. Model 1 in Table 3 shows that the pre-LPR period unadjusted occupational
earnings differences between crossers and individuals authorized to work are approximately 31
14
and 28 percent respectively for men and women.1 The unadjusted unauthorized occupational
earnings penalty for overstayers is substantially smaller, 13 percent for men and 10 percent for
women.
The observed pre-LPR occupational earnings differences may not be related to legal status
but may instead be a consequence of differences in earnings-related factors. We next investigate
how much of the unauthorized occupational earnings gaps are due to differences in demographic
characteristics. The Model 2 results indicate that roughly between ¼ and ½ of the lower
occupational earnings among unauthorized workers are due to differences in factors such as age,
family composition, geographic location and years of schooling. A closer look reveals that
among these factors education differences drive the results. In fact, we obtain adjusted gaps of
the same magnitudes as those reported for Model 2 using a model specification where we only
add years of schooling to the Model 1 specification.2
We find that differences in year of arrival are somewhat important factors contributing to the
observed pre-LPR unauthorized occupational earnings differences (Model 3). Furthermore,
differences in the country of origin composition across the three legal status groups help explain
the lower occupational earnings among unauthorized immigrants. The Model 4 specification
results show that roughly three to five percentage points of the lower earnings of unauthorized
immigrants can be attributed to differences in the country of origin composition.
We next investigate whether differences in class of admission or use of family-specific
networks matters. Results are presented as Model specification 5. We find that these variables
help explain the pre-LPR occupational earnings gap somewhat beyond the ones already taken
into account. Comparing observationally similar crossers to continuously legal immigrants, we
estimate that the pre-legalization earnings penalty, based on median occupational earnings, of
being a crosser is about 12 percent for men and 8 percent for women. For male overstayers the
penalty is approximately 10 percent and even less for women, about 7 percent.
The finding that unauthorized immigrants work in occupations with lower median annual
earnings than observationally similar legal workers in the pre-LPR period is consistent with
unauthorized status limiting their labor market opportunities. As discussed above, these
differences may be due to other factors than legal status and a more reliable approach to estimate
1 We use eb-1, where b is the estimated coefficient, to convert the log point estimates into percentages. 2 The results are not presented in the table but are available upon request.
15
the legalization effect is to see whether legal status opens the doors to occupations that allow
previously unauthorized immigrants to find jobs that are better aligned with their skills, and
hence better paid. Consequently, we next address the issue whether obtaining legal status leads
to greater upward occupational mobility, as measured by occupational earnings, and whether
legalization allows pre-LPR status unauthorized workers to catch up with their continuously
legal counterparts.
Occupational Mobility - Pre-Post Changes in Occupational Earnings
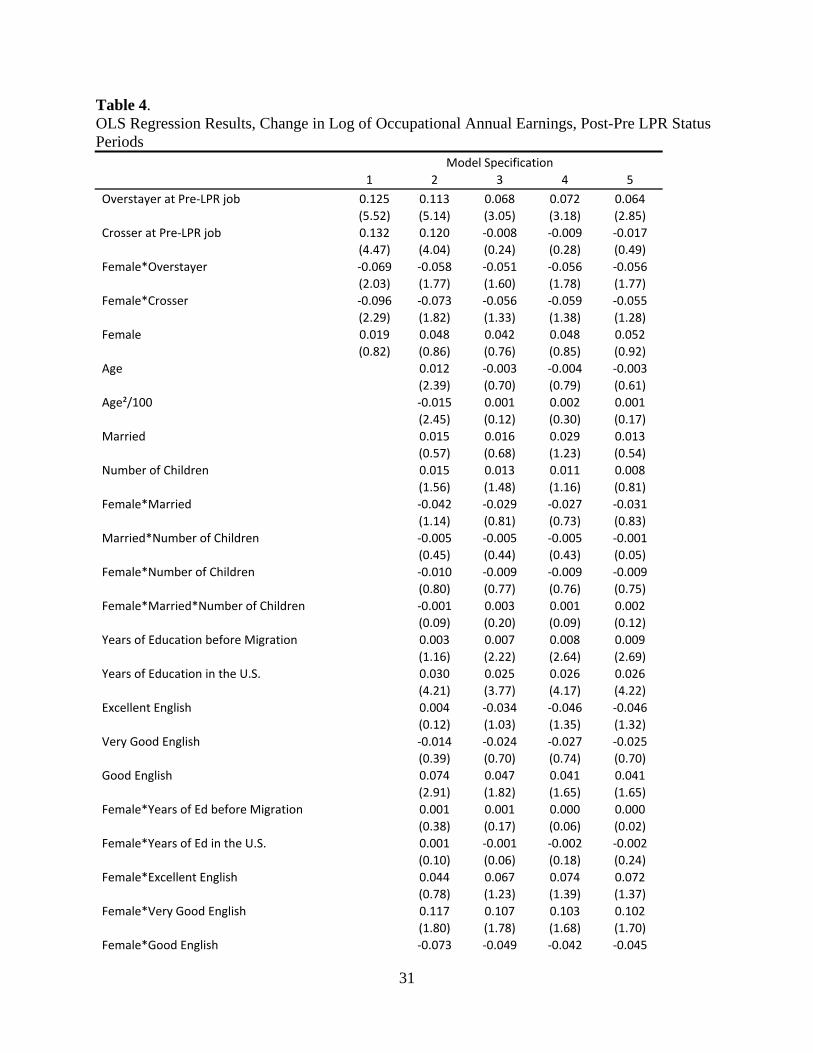
Between the pre- and post-LPR periods, the annual occupational earnings of male
immigrants who were unauthorized to work in the pre-LPR period increased by roughly 13
percent more than did the occupational earnings of continuously legal immigrants, Table 4. The
unadjusted differences are roughly the same for males who crossed the border illegally or
violated the terms of a visa. The occupational earnings growth differences among women are
smaller. Female overstayers’ and crossers’ occupational earnings grew by about six and four
percent respectively more than the earnings of continuously legal women. These unadjusted
occupational earnings growth differences are shown as Model 1 in Table 4. We next turn to an
analysis of whether, and to what extent, these differences are due to factors other than
legalization.
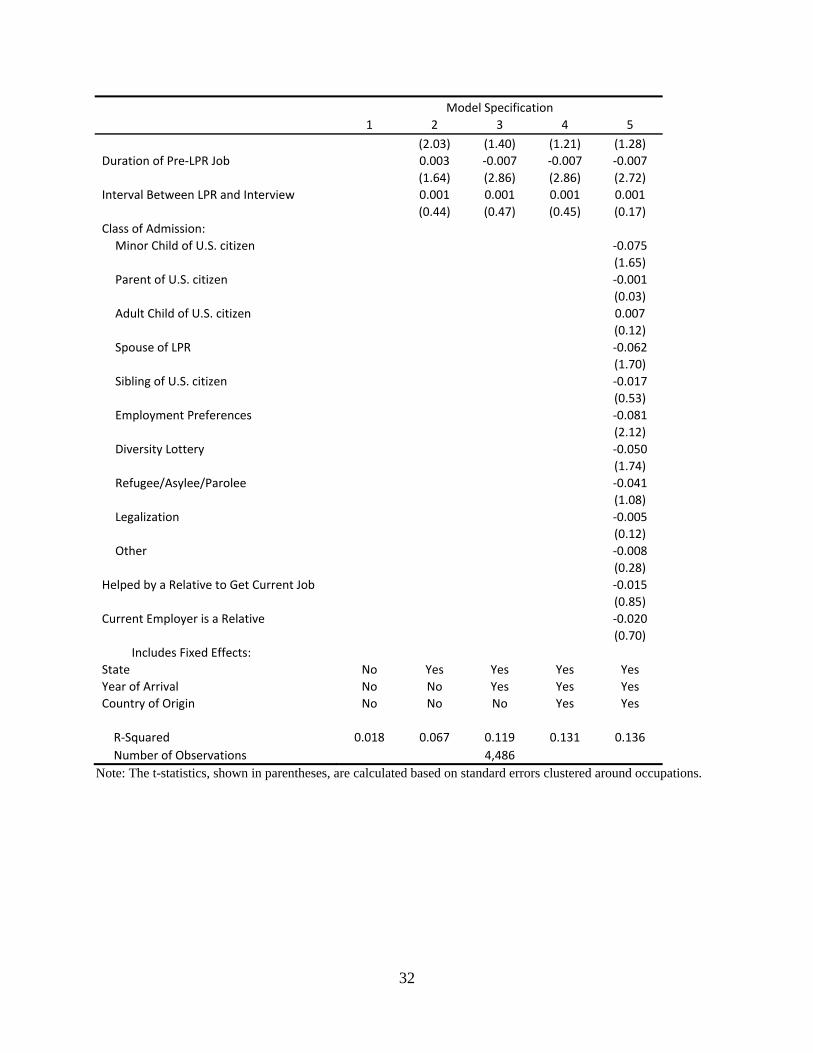
The estimates using Model specification 2 in Table 4 indicate that differences in the
demographic composition between the three legalization groups are not major factors explaining
the relatively higher earnings growth among pre-LPR unauthorized workers. However, the
Model 3 results show that the observed greater increase in earnings among immigrants who were
not authorized to work in the pre-LPR period, compared to immigrants who were authorized, is
to a large extent due to the fact that they have been in the U.S. for a longer time.3 This appears to
be particularly relevant to crossers for whom we do not find any greater increase in occupational
earnings once this factor is accounted for. In fact, the subsequent addition of controls for country
of origin, class of admission or family network differences across groups do not change the
estimated occupational earnings growth differences greatly compared to the ones shown for
Model 3.
3 Note that given that all post-LPR status interviews took place within a few months, the arrival year fixed effects captures assimilation, or put differently, years in the U.S. effects on earnings. They also capture potential long lasting effects of the macro economic conditions present at the time of arrival in the U.S.
16
The results indicate that overstayers benefited significantly from obtaining LPR status.
Although they worked in occupations with lower earnings in the pre-LPR status period than their
otherwise observationally similar legal immigrant counterparts, they work in equally well paid
occupations after receiving their green cards.4 This holds for both men and women and suggests
that legalization opened the door to labor market opportunities they could not access without
authorization to work. Crossers, on the other hand, are not as fortunate and do not improve their
occupational earnings appreciably after receiving LPR status. We fail to find evidence that the
earnings of immigrant men or women in this legal status group increase at all in response to
obtaining green cards, relative to those of their observationally similar continuously legal
counterparts.
Our empirical results point towards years in the U.S. as a major determinant in explaining
occupational earnings growth differences between unauthorized workers and continuously legal
immigrants. However, as Table 2 indicates, few of the workers in the latter group have been in
the U.S. for a very long time, the average years since first U.S. job is less than 3 years, compared
to 11 years for illegal border crossers. This is not surprising since temporary work visas, such as
H-1B, are issued for three years (renewable once for a total of six years). Given the limitations of
how long continuously legal workers can work legally in the U.S. without adjusting their status
to LPR, we estimated the occupational earnings models for the sub-sample of immigrants who
have spent no more than five years since their first U.S. job. The results, shown in Appendix
Table A1, are similar to the ones we obtain with our larger unrestricted samples of immigrants.
The magnitudes of the legal status parameters are somewhat smaller, and not surprisingly less
precisely estimated, and imply that receiving legal status leads to greater upward occupational
mobility only for visa overstayers.
Exploring the Role of Skills
Why do overstayers benefit from legalization while crossers do not? A look at Table 1
reveals that these two groups differ in terms of skills. Over 60 percent of crossers have less than
a high school diploma, while the same is true for a much smaller share of overstayers, 23
percent. Also, over 30 percent of overstayers report excellent English ability, while only 14
4 We fail to reject the hypotheses of equal earnings between observationally similar overstayers and continuously legal immigrants in post-LPR status earnings regression model, results not shown but available upon request.
17
percent of crossers do. It is possible that for the relatively more highly skilled group, overstayers,
lack of legal status might suppress earnings opportunities, whereas for the less skilled it does not.
One approach to test whether relatively higher-skilled unauthorized immigrants are more
constrained by their legal status than their less-skilled counterparts is to look for differences in
the impact of receiving a green card for unauthorized workers by educational attainment. To do
so, we defined indicator variables for schooling level (less than high school, high school
graduate, some college or college graduate) and interacted these variables with legal status. The
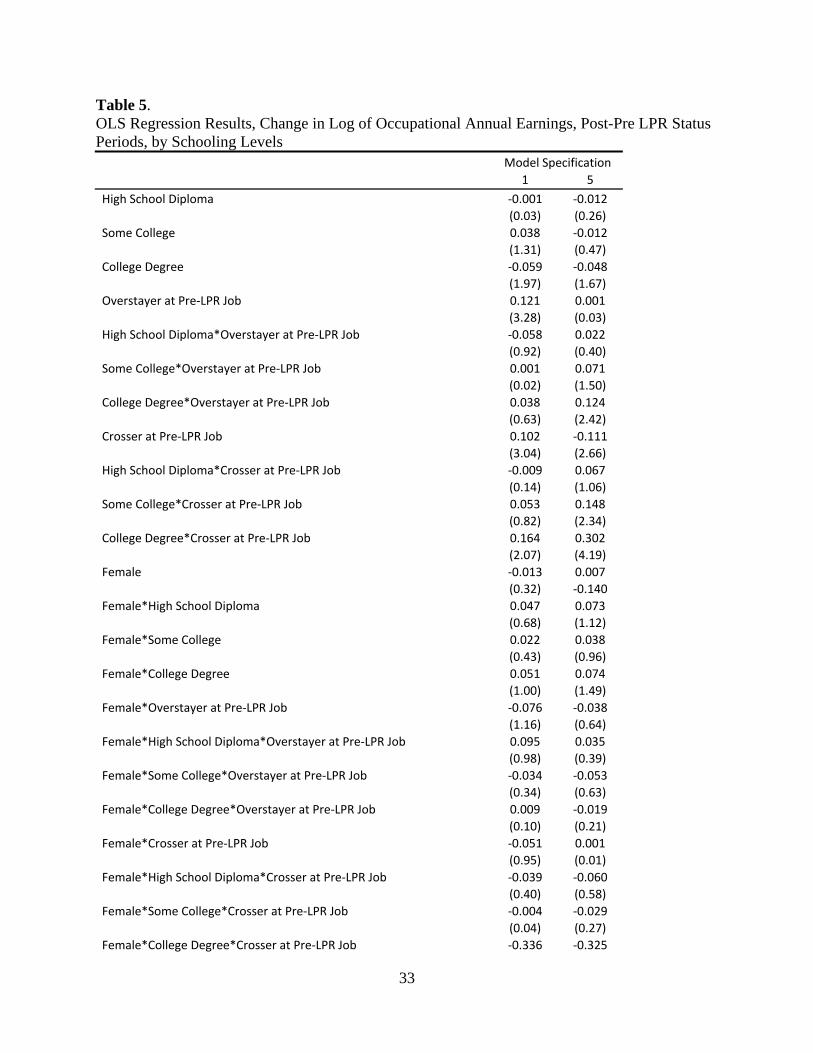
pre-post occupational mobility results, presented in Table 5, quite clearly show that upward
mobility as a result of receiving legal status is limited to unauthorized workers with at least some
college education. The estimates indicate that unauthorized workers, both overstayers and
crossers, who arrived in the U.S. with no more than a high school degree, experienced no greater
occupational mobility than observationally similar legal workers. These results suggest that the
finding that overstayers benefitted from receiving legal status while crossers did not is driven by
the relatively higher levels of skill and education among overstayers.
Many unauthorized immigrants are low-skilled and work in low-skilled jobs, as can be seen
in Table 2. It is of course possible that it is the lack of legal rights to work in the U.S. that
constrains these workers to low-skilled occupations. Table 2 also reveals that a higher proportion
of unauthorized workers leave their pre-LPR occupation than continuously legal immigrants. An
alternative way to determine the labor market benefits of receiving LPR status is to restrict the
analysis to immigrants who were observed in low-skilled occupations in the pre-LPR period.
We hypothesize that if unauthorized status limits some workers to these low-skilled
occupations, we would expect to see a higher proportion of unauthorized immigrants moving to
occupations with higher earnings once they receive LPR status. To test this, we analyze
occupational mobility of a subset of our occupational earnings sample restricted to immigrants
who reported working in specific low-skilled occupations in the period before receiving legal
status. The subset is limited to occupations for which we have representation from all three legal
status groups, wherein the typical worker has less than a high school degree, and that are among
the most common low-skilled occupations for unauthorized workers. These restrictions yield the
following low-skilled occupations; maids and housekeeping cleaners, janitors and building
cleaners, cooks, dishwashers, construction workers, child care workers and agricultural workers.
The low-skill occupation sample represents approximately 20 percent of our full occupational
18
earnings sample and consists of 37 percent continuously legal immigrants, 22 percent
overstayers and 41 percent crossers.
The results limited to the sub-sample of immigrants working in low-skilled occupations in
the pre-LPR period, shown in Table 6, show that previously unauthorized immigrants moved up
to more remunerative occupations than did continuously legal immigrants (Model 1). However,
once we control for our full set of observable characteristics, Model 5, we find no evidence that
unauthorized immigrants moved to more high paying occupations than did continuously legal
immigrants. The results fail to reveal any differences across the three legal status groups in
occupational earnings in the post-LPR period.
These results suggest that the relatively skilled unauthorized workers for whom we found
benefitting from receiving a green card were not limited to these common low-skilled
occupations in the pre-LPR period – if these existed in any meaningful numbers, we would
expect to see higher earnings among the unauthorized immigrants in the post-LPR period – we
do not. Also, the results imply that the greater occupational mobility that we observe in Table 2
among unauthorized immigrants in low-skilled occupations is mostly not associated with moves
to higher paying occupations.
So far we have relied on an outcome measure using gender-specific median annual earnings
among immigrants. We next turn to an analysis in which we rely on individuals’ reported hourly
wages.
Results Using Self-Reported Wages
As with our occupational median earnings measure, we observe substantially lower
wages among unauthorized workers, as compared to continuously legal workers. Model 1 in
Table 7 shows that the pre-LPR period unadjusted wage differences between crossers and
individuals authorized to work are approximately 42 and 41 percent respectively for men and
women. The unadjusted unauthorized earnings penalty for overstayers is substantially smaller,
12 percent for men and 10 percent for women.
The wage differences are likely to be at least partially due to some of the differences in
demographic characteristics such as family composition, education and geographic location,
shown in Table 1. The results in Model 2 show that these factors explain much of the lower
earnings among unauthorized workers. In fact, these factors alone explain the lower wages
19
among overstayers, relative to continuously legal workers.5 Furthermore, once we add country of
origin and year of arrival fixed effects, we fail to find a pre-LPR earnings penalty among
crossers.
We next explore whether receiving legal status allowed for greater wage growth among
unauthorized workers. Given that we do not find a pre-LPR wage penalty for unauthorized
workers, we do not expect to find higher wage growth among the unauthorized once our set of
control variables is taken into account. Nonetheless, we examine the possibility of such
differences by estimating regressions of pre-post-LPR changes in hourly wages and present the
results in Table 8. Hourly wages increased substantially more between the pre- and post-LPR
periods among unauthorized workers compared to continuously legal workers. However, as with
our occupational mobility analysis, the greater growth is mostly due to demographic factors and
the greater time spent in the U.S. by previously unauthorized workers.
Above, we tested the hypothesis that if unauthorized workers are restricted to low-skilled
occupations in their first job in the U.S. we would expect that they are more likely to move to
better paid occupations after receiving a green card than observationally similar continuously
legal immigrants in the same pre-LPR low-skilled occupations. Although we found no support
for this notion, it is possible that there was greater upward mobility within occupations among
the previously unauthorized workers. That is, some of these workers may not change their
occupation but upon receiving a green card they obtain better paid position in the same
occupation (for example, going from a non-unionized to unionized janitorial job). Our
occupational earnings analysis would fail to reveal such a pattern. To address this concern, we
re-estimate the models in Table 6 using instead of the post-LPR occupational annual earnings the
reported post-LPR wages. Utilizing this outcome measure addresses the concern of within
occupational improvements in remuneration. The results from this sensitivity analysis are shown
in Appendix Table A2 and also provide no evidence of higher post-LPR wages among the
previously unauthorized low-skilled occupation workers compared to their observationally
similar continuously legal counterparts.
Our estimates may underestimate the impact of legal status if continuously legal immigrants
benefit from adjusting to permanent legal status (for example, for H-1B holders the adjustment
5 Controlling only for years of schooling reduces the earnings gap between continuously legal workers and crossers by half, relative to the unadjusted differences.
20
removes the attachment to a particular employer). To address this concern, we looked at pre- to
post-LPR wage gains among the continuously legal sample. Although the unadjusted gains to
adjustment to LPR status are positive and significant (27 percent) once we account for
potentially relevant factors such as the number of years between the first job and the post-LPR
job, we find no statistically significant effect of adjusting to legal status for the continuously
legal sample.6 The results suggest that the unadjusted wage gains are primarily due to labor
market assimilation and not due to change in status.
Overall, the results using hourly wages are consistent with our median occupational earnings
measures. A noteworthy difference is that these results more strongly indicate that the labor
market benefits, as measured by hourly wages, to gaining legal status are very limited and
possibly zero. In our occupational mobility analysis we found some evidence that overstayers
benefitted from gaining legal status. There is a concern that the lack of a wage effect even among
these previously unauthorized workers may be due to the smaller, more restrictive sub-sample
for which we have valid wage information. To address this concern we re-estimated key model
specification using the median annual occupational earnings measure limited to the smaller wage
sample. The results, presented in Appendix Table A3, are very similar to the full occupation
sample results and do not reveal any meaningful sensitivity of the specific sample used.
Although we are not able to determine the reason for the differences in pre-LPR results between
occupational based earnings and hourly wages, we note that it may be due to recall bias. The pre-
LPR period for unauthorized workers was several years earlier on average than it was among
continuously legal immigrants. It is possible that because of this, they recall pre-LPR wages with
greater error than legal immigrants do.
As discussed above, there is a concern that individuals do not accurately recall wages from
the first job held in the U.S. as for many this was more than five years ago. However, we believe
that the reported occupation of their first job in the U.S. and current wages at the time of the
interview closely reflect their actual labor market outcomes. Furthermore, the main conclusions
that the there are no labor market benefits of obtaining legal status for most unauthorized
immigrant workers, do not depend on the outcome measure used. Overall, the broad sensitivity
analyses we provide suggest that our results are robust to the employment measure used.
6 The estimated adjusted wage change is about -4 percent with a t-statistic of -0.88. The results are not shown in the tables but available upon request from the authors.
21
7. Summary and Conclusions
Nearly 12 million unauthorized immigrants live in the United States (Passel and Cohn,
2009). Currently, legislators in Washington, D.C., are considering comprehensive reform in
federal immigration policies, including legalizing unauthorized immigrants. Many observers,
supported by the findings of the 1986 IRCA based research, believe that the economic effects of
a legalization program could be substantial, significantly improving employment outcomes
among the workers restricted in their opportunities due to lack of legal status (Hinojosa-Ojeda,
2010).
In this paper we use recent data from the New Immigrant Survey (NIS) to assess whether a
new legalization program is likely to lead to upward occupational mobility or wage gains.
Importantly, the rich NIS data allow us to identify immigrant workers who were unauthorized to
work prior to obtaining LPR status and to distinguish between different types of illegal
immigration experience – those who crossed the border without proper documentation and those
who violated the terms of their visa. We use the group of continuously legal immigrants as a
comparison group in our empirical approach.
We find that legalizing unauthorized immigrants is unlikely to lead to dramatic changes in
the labor market outcomes of most unauthorized immigrants. This is especially true for low-
skilled workers, for whom any improvement is likely to be small at best. For immigrants who
cross the border without documentation, employment outcomes do improve over time—but none
of these improvements are attributable to gaining legal status. For those who gain legalization
after overstaying a temporary visa, the outlook is slightly better. In these cases, we do see some
upward occupational mobility, which may be related to acquiring legal status. However, this
finding is specifically attributable to skill level: We find that highly skilled immigrants,
regardless of how they arrived in the United States, exhibit occupational improvements after
gaining legal status.
These findings differ from the influential research based on IRCA, which consistently found
evidence of employment gains (e.g. Rivera-Batiz, 1999; Kossoudji and Cobb-Clark, 2002 and
Amuedo-Dorantes, Bansak, and Rafael, 2007). This research was limited to Mexican and Central
American immigrants and did not separately identify effects for crossers and overstayers.
However, we do not believe that the differences are driven by these factors since the only
22
noticeable gains found in our study are, regardless of illegal status group, among the relatively
few most educated unauthorized immigrants (a small number of whom originate in Mexico or
Central America).7 What are then the most likely reasons for the discrepancy?
One noticeable difference between our study and the IRCA research is that we only observe
outcomes among the previously unauthorized immigrants during the first year after adjusting
status while the LPS collects the information about four years after becoming legal. It is
plausible that one year is not enough time for the employment legalization benefits to
materialize. If unauthorized immigrants are receiving below market wages for legal workers, it is
reasonable to expect that they would also be more likely to search for new employment than
continuously legal immigrants after obtaining LPR status. However, Hill, Lofstrom and Hayes
(2010) find no evidence supporting this. They also find no support for greater investments in
human capital among the previously unauthorized, which would lead to future improvements in
labor market outcomes. Lastly, the period between receiving legal status and the NIS interview
was sufficiently long for us to detect gains among high-skilled previously unauthorized
immigrants, for whom we would expect that it would take longer time to find new suitable
employment than low-skilled workers. This is not conclusive but suggests that the differences
may not be due to short-run versus medium-run.
Our findings of small or no gains are however consistent with recent research relying on
more recent data. For example, Pan (2010) and Barcellos (2010) provide evidence that the
positive wage effects among workers who obtained legal status through IRCA dissipated over
time and are no longer noticeable. It appears that the labor market for low-skilled unauthorized
immigrants may have changed and that employer sanctions may have lost their bite.
Immediately following IRCA’s implementation, employers of all types were probably
concerned about the employer sanctions that were part of the legislation. In the current era, it
seems likely that employment law violations are more likely anticipated among the employers of
the highly skilled than among those employing low-skilled workers. This should then impact the
wages and occupational opportunities for the high-skill and low-skilled unauthorized workers
differently.
7 Recent studies estimate that the group with a bachelor’s degree or more comprise a relatively small share of the unauthorized immigrant population, about 15 percent in 2008 (Passel and Cohn 2009).
23
Employers of low-skilled workers probably correctly assess the very low probability that
they will be caught or fined for having hired unauthorized workers. Thus, the relatively
ineffective employer sanctions mean that they do not differentiate pay to low-skilled laborers
based on legal status. In the period immediately following IRCA, employers likely did expect
that the newly approved employer sanctions for hiring unauthorized workers would have teeth.
That does not appear to be the case now. Indeed, because we find that there are no real
differences in occupational mobility or reported wages among low-skilled unauthorized
immigrants, when compared to continuously legal immigrants it appears that labor markets
function competitively for low-skilled unauthorized workers.
The labor market for high-skilled workers may on the other hand be monopsonistic, with
fewer and larger employers than the low-skilled labor market. The cost of detection and fines
(including reputational cost) and of losing a trained employee because of employment law
violations might be too great for high-skill employer, and they might avoid hiring unauthorized
workers in the first place. After a high-skilled unauthorized immigrant gains legal status, he or
she could successfully apply for jobs that were formerly closed off. Because we separate high-
skill workers from low-skill workers, we may be in a position to observe an effect of employer
sanctions on the occupational mobility and reported wages of unauthorized high-skill workers
after they become legal.
Lastly but importantly, the results in this paper have strong policy relevance. Comprehensive
immigration reform will need to include a newly effective employment verification system,
possibly mandating the use of the federal government’s E-Verify program for all new hires, as
well as sanctions for employers with teeth in order for the reform to act as a deterrent to future
unauthorized immigration.
24
References Amuedo-Dorantes, Catalina, Cynthia Bansak, and Steven Raphael, “Gender Differences
in the Labor Market: Impact of IRCA’s Amnesty Provisions,” American Economic Review; Papers and Proceedings, May 2007.
Bansak, Cynthia and Steven Raphael (2001), “Immigration Reform and the Earnings of
Latino Workers: Do Employer Sanctions cause Discrimination?” Industrial and Labor Relations Review, 54(2): 275-295.
Barcellos, Silvia Helena, “Legalization and the Economic Status of Immigrants” RAND
Working Paper, March 2010. Bratsberg, Brent, James F. Ragan Jr., and Zafar M. Nasir, “The Effect of Naturalization
on Wage Growth: A Panel Study of Young Immigrants,” Journal of Labor Economics, 2002, 20(3).
Gass Kandilov, Amy and Ivan Kandilov, “The Effect of Legalization on Wages and Health
Insurance: Evidence from the National Agricultural Workers Survey,” 2009. Hill, Laura E., Magnus Lofstrom and Joseph M. Hayes, “Immigrant Legalization:
Assessing the Labor Market Effects” Public Policy Institute of California, Research Report, April, 2010.
Hinojosa-Ojeda, Raúl, “Raising the Floor for American Workers: The Economic Benefits
of Comprehensive Immigration Reform” Center for American Progress/Immigration Policy Center Report, January 2010.
Hoefer, Michael, Nancy Rytina, and Bryan C. Baker, “Estimates of the Unauthorized
Immigrant Population Residing in the United States: January 2007,” Population Estimates, Office of Immigration Statistics, Department of Homeland Security, September, 2008.
Jasso, Guillermina, Douglas S. Massey, Mark R. Rosenzweig, and James P. Smith, “The New
Immigrant Survey 2003 Round 1 (NIS-2003-1) Public Release Data,” March 2006. Kaushal, Neeraj, “Amnesty Programs and the Labor Market for Undocumented
Workers,” Journal of Human Resources, 2006, 41(3): 631–647. Kossoudji, Sherrie A. and Deborah A. Cobb-Clark, “IRCA's Impact on the Occupational
Concentration and Mobility of Newly-Legalized Mexican Men” Journal of Population Economics, 2000, 13: 81-98.
Kossoudji, Sherrie A. and Deborah A. Cobb-Clark, “Coming out of the Shadows:
Learning about Legal Status and Wages from the Legalized Population,” Journal of Labor Economics, 2002, 20(3): 598-628.
25
Pan, Ying, “The Impact of Legal Status on Immigrants’ Earnings and Human Capital:
Evidence from the IRCA 1986”, Louisiana State University, Working Paper 2010-02, 2010.
Passel, Jeffrey. Unpublished tabulations from March CPS, Pew Hispanic Center, 2009. Passel, Jeffrey and D’Vera Cohn,” Trends in Unauthorized Immigration: Undocumented
Inflow Now Trails Legal Inflow,” Report, Pew Hispanic Center, October 2, 2008. Passel, Jeffrey, and D’Vera Cohn, “A Portrait of Unauthorized Immigrants in the United
States” Pew Hispanic Center, April 14, 2009. Pastor, Manuel, Justin Scoggins, Jennifer Tran, and Rhonda Ortiz, “The Economic
Benefits of Immigrant Authorization in California”, Center for the Study of Immigrant Integration Report, University of Southern California, January 2010.
Pena, Anita Alves, “Legalization and Immigrants in U.S. Agriculture.” B.E. Journal of
Economic Analysis & Policy 10 (1): Article 7, 2010. Rivera-Batiz, Francisco, “Undocumented Workers in the Labor Market: An Analysis of
the Earnings of Legal and Illegal Mexican Immigrants in the United States,” Journal of Population Economics, 1999, 12(1): 91–116.
26
Table 1. Descriptive Statistics by Legal Status Group
Variable
Illegal Border Crosser
Visa Overstayer
Continuously Legal
Annual Occupational Earnings
Pre‐LPR Job $15,160 $19,727 $23,913
Post‐LPR Job $18,272 $23,418 $25,613
Change $3,112 $3,692 $1,700
Demographic traits
Share of Sample 25.9 27.6 46.4
Percent Female 36.8 45.8 44.4
Percent Married 67.8 80.7 75.5
Mean Number of Children 2.3 1.6 1.2
Mean age at NIS interview 35.8 37.1 35.0
Mean age first worked during last U.S. trip 24.8 31.2 32.3
Mean duration of pre‐LPR job (years) 3.8 2.5 1.4
Mean time elapsed since start of pre‐LPR job (years) 11.0 5.9 2.7
Country of Origin
Mexico 38.5 16.4 3.0
Other Latin America & the Caribbean 50.1 29.0 18.5
East Asia, South Asia & the Pacific 4.5 18.0 38.8
Sub‐Saharan Africa 0.8 8.3 8.2
Europe & Central Asia 2.5 18.7 22.1
Middle East & North Africa 1.0 5.4 5.0
All Other 2.6 4.1 4.4
Class of admission
Spouse of Citizen 33.1 53.0 30.4
Child of Citizen (<21, unmarried) 1.6 1.7 1.9
Parent of Citizen 2.5 4.3 1.9
Child of Citizen (21+ and/or married) 1.7 1.4 0.9
Spouse of LPR 3.3 0.8 0.9
Sibling of Citizen 0.9 2.1 7.3
Employment Preference 3.6 11.4 21.0
Diversity Lottery 0.7 4.8 14.3
Refugee/Asylee 8.2 11.5 8.6
Legalization 37.3 3.6 0.5
Other 7.1 5.5 12.3
27
Helped by a Relative to Get Current Job 18.3 11.1 18.7
Current Employer is a Relative 2.3 3.2 3.9
Human Capital
Total number of years of education 9.5 13.7 14.3
Total number of U.S. years of education 1.3 1.0 0.9
Proportion with less than high school diploma 61.7 22.9 20.8
Proportion with a high school diploma 22.6 28.7 21.1
Proportion with some college 8.6 12.9 10.2
Proportion with a bachelor’s degree or more 7.2 35.4 48.0
Proportion with excellent English 14.4 31.1 28.8
Proportion with very good English 7.9 8.8 7.7
Proportion with good English 32.8 29.0 26.8
Number of Observations 945 1,071 2,470
Source: 2003 New Immigrant Survey (NIS)
28
Table 2. Occupational Distribution and Mobility from Pre- to Post-LPR Status
Rank Illegal Border Crossers during pre‐LPR job Pre‐LPR occupation
% in pre‐LPR job
% same in post‐LPR job
% in post‐LPR job
1 Maids And Housekeeping Cleaners 7.4 42.3 7.2 2 Other Agricultural Workers 7.3 28.1 2.7 3 Janitors And Building Cleaners 6.0 24.5 5.5 4 Dishwashers 5.2 0.0 0.5 5 Child Care Workers 5.1 13.3 1.6 6 Cooks 4.4 28.2 5.0 7 Construction Laborers 4.1 31.9 3.0 8 Cashiers 3.7 22.2 2.7 9 Grounds Maintenance Workers 3.5 36.5 2.4
10 Sewing Machine Operator 2.5 27.0 1.0 Sum/Totals 49.2 25.7 31.5
Rank Visa Overstayers during pre‐LPR job Pre‐LPR occupation
% in pre‐LPR job
% same in post‐LPR job
% in post‐LPR job
1 Cashiers 5.9 23.9 2.7 2 Maids And Housekeeping Cleaners 4.4 44.4 3.4 3 Janitors And Building Cleaners 3.7 26.1 2.2 4 Cooks 3.4 52.7 3.1 5 Retail Salespersons 3.3 36.9 3.6 6 Waiters And Waitresses 3.3 33.3 2.6 7 Child Care Workers 3.0 44.3 2.2 8 Construction Laborers 2.3 28.1 1.7 9 Nursing, Psychiatric, And Home Health Aides 2.0 57.1 3.0
10 Grounds Maintenance Workers 2.0 13.9 0.3 Sum/Totals 33.2 35.6 24.8
Rank Legal during pre‐LPR job Pre‐LPR occupation
% in pre‐LPR job
% same in post‐LPR job
% in post‐LPR job
1 Cashiers 5.9 65.4 5.0 2 Computer Software Engineers 3.9 72.8 4.3 3 Waiters And Waitresses 3.4 51.0 2.1 4 Maids And Housekeeping Cleaners 3.4 77.5 2.9 5 Janitors And Building Cleaners 3.3 60.3 3.6 6 Postsecondary Teachers 3.0 37.0 1.7 7 Nursing, Psychiatric, And Home Health Aides 2.5 60.6 2.8 8 Retail Salespersons 2.4 62.1 2.5 9 Registered Nurses 2.4 79.9 2.4
10 Stock Clerks And Order Fillers 2.3 52.3 1.7 Sum/Totals 32.6 62.4 29.1
Source: 2003 New Immigrant Survey (NIS)
29
Table 3. OLS Regression Results, Log of Occupational Annual Earnings, Pre-LPR Status Period.
Model Specification 1 2 3 4 5
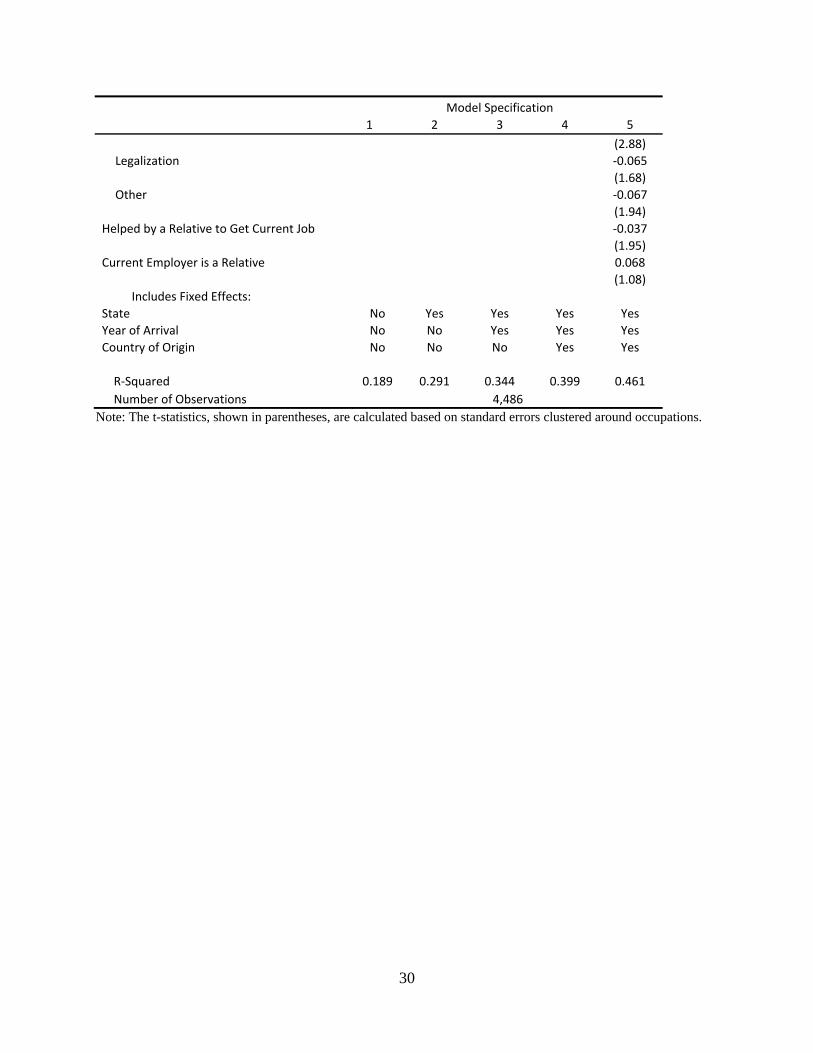
Overstayer at Pre‐LPR Job ‐0.134 ‐0.108 ‐0.181 ‐0.138 ‐0.107 (2.48) (2.41) (3.93) (3.81) (3.10) Crosser at Pre‐LPR Job ‐0.370 ‐0.173 ‐0.219 ‐0.175 ‐0.122 (4.47) (3.36) (4.35) (4.48) (3.43) Female*Overstayer 0.024 0.026 0.029 0.046 0.035 (0.43) (0.52) (0.60) (1.04) (0.88) Female*Crosser 0.048 0.049 0.038 0.050 0.038 (0.62) (0.77) (0.60) (0.84) (0.70) Female ‐0.410 ‐0.261 ‐0.300 ‐0.330 ‐0.339 (5.13) (3.92) (4.47) (5.23) (5.54) Age 0.019 0.022 0.022 0.018 (3.55) (4.04) (3.89) (3.85) Age²/100 ‐0.029 ‐0.029 ‐0.032 ‐0.026 (3.84) (3.68) (4.00) (4.14) Married 0.148 0.109 0.064 0.033 (3.43) (3.15) (2.30) (1.09) Number of Children ‐0.007 ‐0.012 ‐0.011 ‐0.010 (0.60) (1.06) (0.96) (0.96) Female*Married ‐0.117 ‐0.087 ‐0.081 ‐0.044 (1.89) (1.40) (1.49) (1.02) Married*Number of Children ‐0.017 ‐0.012 ‐0.005 ‐0.002 (1.28) (0.93) (0.43) (0.17) Female*Number of Children ‐0.014 ‐0.019 ‐0.014 ‐0.008 ‐1.040 ‐1.410 ‐1.100 ‐0.700 Female*Married*Number of Children 0.017 0.018 0.015 0.009 (0.89) (0.91) (0.81) (0.53) Years of Education before Migration 0.034 0.030 0.023 0.018 (5.32) (6.05) (5.88) (5.10) Female*Years of Ed before Migration ‐0.005 ‐0.002 ‐0.002 ‐0.003 (0.66) (0.32) (0.37) (0.57) Class of Admission: Minor Child of U.S. citizen ‐0.087 (1.55) Parent of U.S. citizen 0.048 (1.04) Adult Child of U.S. citizen ‐0.082 (1.29) Spouse of LPR ‐0.035 (0.60) Sibling of U.S. citizen ‐0.112
(2.45) Employment Preferences 0.398
(5.24) Diversity Lottery ‐0.153
(4.39) Refugee/Asylee/Parolee ‐0.133
30
Model Specification 1 2 3 4 5
(2.88) Legalization ‐0.065
(1.68) Other ‐0.067
(1.94) Helped by a Relative to Get Current Job ‐0.037 (1.95) Current Employer is a Relative 0.068 (1.08)
Includes Fixed Effects: State No Yes Yes Yes Yes Year of Arrival No No Yes Yes Yes Country of Origin No No No Yes Yes R‐Squared 0.189 0.291 0.344 0.399 0.461 Number of Observations 4,486
Note: The t-statistics, shown in parentheses, are calculated based on standard errors clustered around occupations.
31
Table 4. OLS Regression Results, Change in Log of Occupational Annual Earnings, Post-Pre LPR Status Periods
Model Specification 1 2 3 4 5
Overstayer at Pre‐LPR job 0.125 0.113 0.068 0.072 0.064 (5.52) (5.14) (3.05) (3.18) (2.85) Crosser at Pre‐LPR job 0.132 0.120 ‐0.008 ‐0.009 ‐0.017 (4.47) (4.04) (0.24) (0.28) (0.49) Female*Overstayer ‐0.069 ‐0.058 ‐0.051 ‐0.056 ‐0.056 (2.03) (1.77) (1.60) (1.78) (1.77) Female*Crosser ‐0.096 ‐0.073 ‐0.056 ‐0.059 ‐0.055 (2.29) (1.82) (1.33) (1.38) (1.28) Female 0.019 0.048 0.042 0.048 0.052 (0.82) (0.86) (0.76) (0.85) (0.92) Age 0.012 ‐0.003 ‐0.004 ‐0.003 (2.39) (0.70) (0.79) (0.61) Age²/100 ‐0.015 0.001 0.002 0.001 (2.45) (0.12) (0.30) (0.17) Married 0.015 0.016 0.029 0.013 (0.57) (0.68) (1.23) (0.54) Number of Children 0.015 0.013 0.011 0.008 (1.56) (1.48) (1.16) (0.81) Female*Married ‐0.042 ‐0.029 ‐0.027 ‐0.031 (1.14) (0.81) (0.73) (0.83) Married*Number of Children ‐0.005 ‐0.005 ‐0.005 ‐0.001 (0.45) (0.44) (0.43) (0.05) Female*Number of Children ‐0.010 ‐0.009 ‐0.009 ‐0.009 (0.80) (0.77) (0.76) (0.75) Female*Married*Number of Children ‐0.001 0.003 0.001 0.002 (0.09) (0.20) (0.09) (0.12) Years of Education before Migration 0.003 0.007 0.008 0.009 (1.16) (2.22) (2.64) (2.69) Years of Education in the U.S. 0.030 0.025 0.026 0.026 (4.21) (3.77) (4.17) (4.22) Excellent English 0.004 ‐0.034 ‐0.046 ‐0.046 (0.12) (1.03) (1.35) (1.32) Very Good English ‐0.014 ‐0.024 ‐0.027 ‐0.025 (0.39) (0.70) (0.74) (0.70) Good English 0.074 0.047 0.041 0.041 (2.91) (1.82) (1.65) (1.65) Female*Years of Ed before Migration 0.001 0.001 0.000 0.000 (0.38) (0.17) (0.06) (0.02) Female*Years of Ed in the U.S. 0.001 ‐0.001 ‐0.002 ‐0.002 (0.10) (0.06) (0.18) (0.24) Female*Excellent English 0.044 0.067 0.074 0.072 (0.78) (1.23) (1.39) (1.37) Female*Very Good English 0.117 0.107 0.103 0.102 (1.80) (1.78) (1.68) (1.70) Female*Good English ‐0.073 ‐0.049 ‐0.042 ‐0.045
32
Model Specification 1 2 3 4 5
(2.03) (1.40) (1.21) (1.28) Duration of Pre‐LPR Job 0.003 ‐0.007 ‐0.007 ‐0.007 (1.64) (2.86) (2.86) (2.72) Interval Between LPR and Interview 0.001 0.001 0.001 0.001 (0.44) (0.47) (0.45) (0.17) Class of Admission: Minor Child of U.S. citizen ‐0.075 (1.65) Parent of U.S. citizen ‐0.001 (0.03) Adult Child of U.S. citizen 0.007 (0.12) Spouse of LPR ‐0.062 (1.70) Sibling of U.S. citizen ‐0.017
(0.53) Employment Preferences ‐0.081
(2.12) Diversity Lottery ‐0.050
(1.74) Refugee/Asylee/Parolee ‐0.041
(1.08) Legalization ‐0.005
(0.12) Other ‐0.008
(0.28) Helped by a Relative to Get Current Job ‐0.015 (0.85) Current Employer is a Relative ‐0.020 (0.70)
Includes Fixed Effects: State No Yes Yes Yes Yes Year of Arrival No No Yes Yes Yes Country of Origin No No No Yes Yes R‐Squared 0.018 0.067 0.119 0.131 0.136 Number of Observations 4,486
Note: The t-statistics, shown in parentheses, are calculated based on standard errors clustered around occupations.
33
Table 5. OLS Regression Results, Change in Log of Occupational Annual Earnings, Post-Pre LPR Status Periods, by Schooling Levels
Model Specification 1 5
High School Diploma ‐0.001 ‐0.012 (0.03) (0.26)
Some College 0.038 ‐0.012 (1.31) (0.47)
College Degree ‐0.059 ‐0.048 (1.97) (1.67)
Overstayer at Pre‐LPR Job 0.121 0.001 (3.28) (0.03)
High School Diploma*Overstayer at Pre‐LPR Job ‐0.058 0.022 (0.92) (0.40)
Some College*Overstayer at Pre‐LPR Job 0.001 0.071 (0.02) (1.50)
College Degree*Overstayer at Pre‐LPR Job 0.038 0.124 (0.63) (2.42)
Crosser at Pre‐LPR Job 0.102 ‐0.111 (3.04) (2.66)
High School Diploma*Crosser at Pre‐LPR Job ‐0.009 0.067 (0.14) (1.06)
Some College*Crosser at Pre‐LPR Job 0.053 0.148 (0.82) (2.34)
College Degree*Crosser at Pre‐LPR Job 0.164 0.302 (2.07) (4.19)
Female ‐0.013 0.007 (0.32) ‐0.140
Female*High School Diploma 0.047 0.073 (0.68) (1.12)
Female*Some College 0.022 0.038 (0.43) (0.96)
Female*College Degree 0.051 0.074 (1.00) (1.49)
Female*Overstayer at Pre‐LPR Job ‐0.076 ‐0.038 (1.16) (0.64)
Female*High School Diploma*Overstayer at Pre‐LPR Job 0.095 0.035 (0.98) (0.39)
Female*Some College*Overstayer at Pre‐LPR Job ‐0.034 ‐0.053 (0.34) (0.63)
Female*College Degree*Overstayer at Pre‐LPR Job 0.009 ‐0.019 (0.10) (0.21)
Female*Crosser at Pre‐LPR Job ‐0.051 0.001 (0.95) (0.01)
Female*High School Diploma*Crosser at Pre‐LPR Job ‐0.039 ‐0.060 (0.40) (0.58)
Female*Some College*Crosser at Pre‐LPR Job ‐0.004 ‐0.029 (0.04) (0.27)
Female*College Degree*Crosser at Pre‐LPR Job ‐0.336 ‐0.325
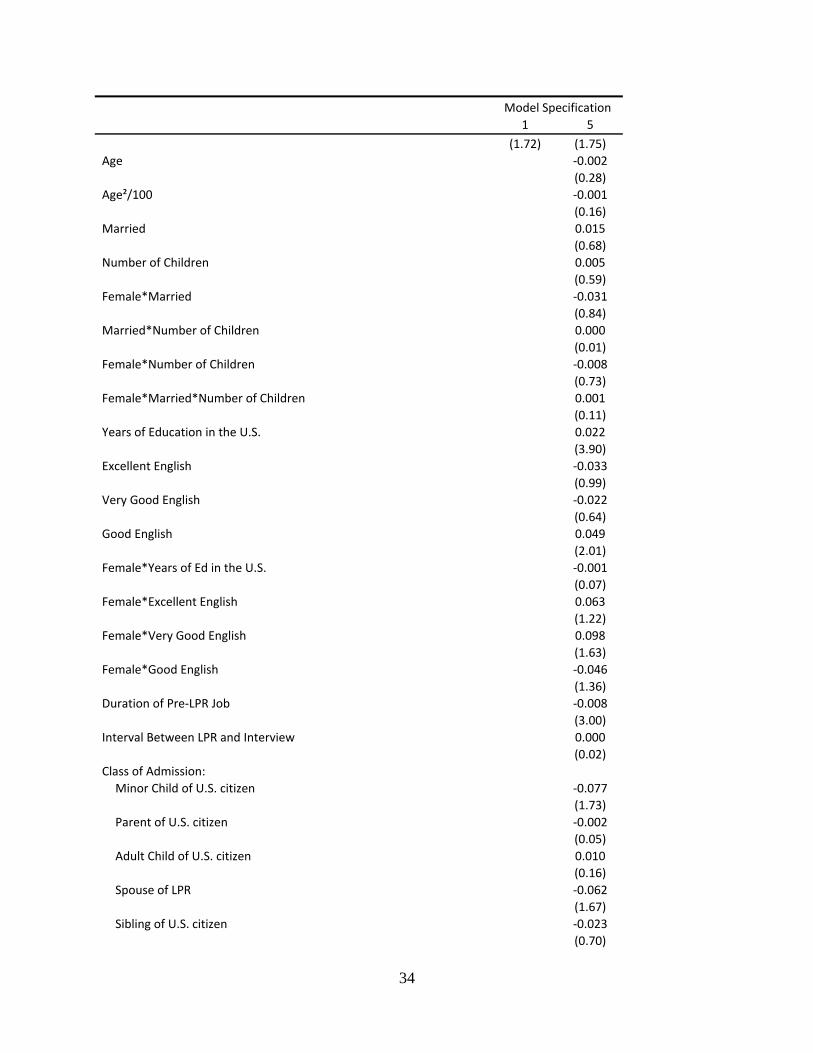
34
Model Specification 1 5
(1.72) (1.75) Age ‐0.002
(0.28) Age²/100 ‐0.001
(0.16) Married 0.015
(0.68) Number of Children 0.005
(0.59) Female*Married ‐0.031
(0.84) Married*Number of Children 0.000
(0.01) Female*Number of Children ‐0.008
(0.73) Female*Married*Number of Children 0.001
(0.11) Years of Education in the U.S. 0.022
(3.90) Excellent English ‐0.033
(0.99) Very Good English ‐0.022
(0.64) Good English 0.049
(2.01) Female*Years of Ed in the U.S. ‐0.001
(0.07) Female*Excellent English 0.063
(1.22) Female*Very Good English 0.098
(1.63) Female*Good English ‐0.046
(1.36) Duration of Pre‐LPR Job ‐0.008
(3.00) Interval Between LPR and Interview 0.000
(0.02) Class of Admission: Minor Child of U.S. citizen ‐0.077
(1.73) Parent of U.S. citizen ‐0.002
(0.05) Adult Child of U.S. citizen 0.010
(0.16) Spouse of LPR ‐0.062
(1.67) Sibling of U.S. citizen ‐0.023
(0.70)
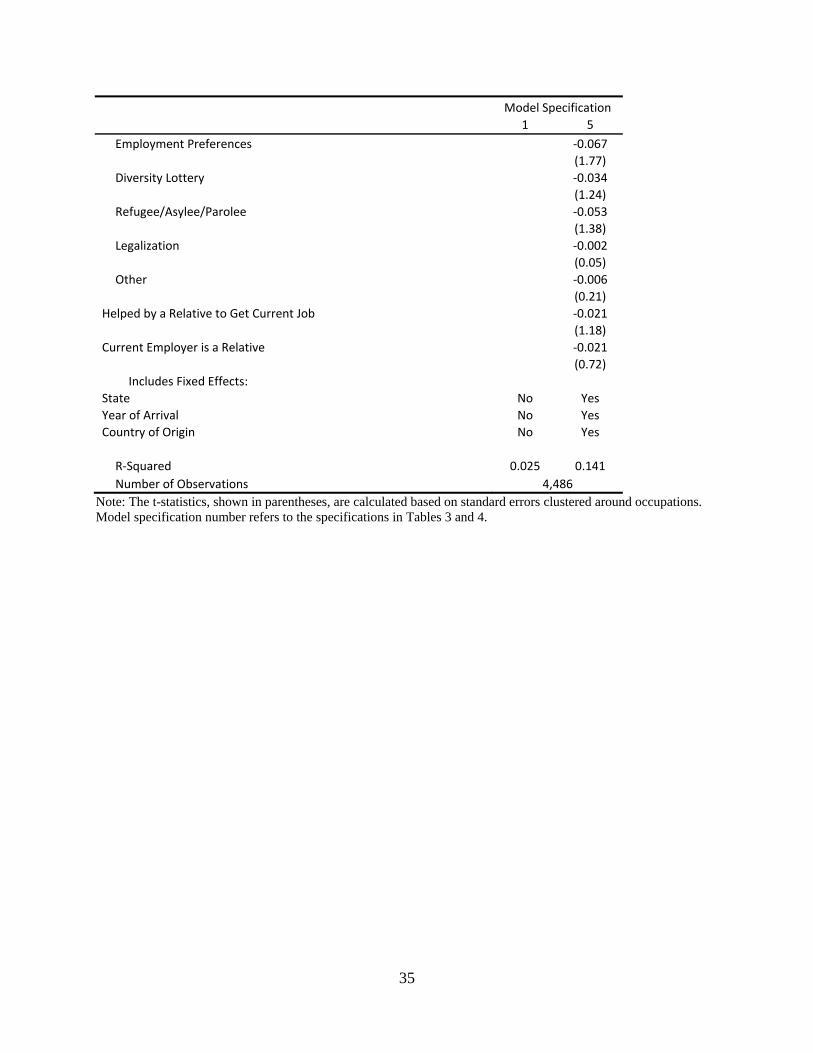
35
Model Specification 1 5
Employment Preferences ‐0.067 (1.77)
Diversity Lottery ‐0.034 (1.24)
Refugee/Asylee/Parolee ‐0.053 (1.38)
Legalization ‐0.002 (0.05)
Other ‐0.006 (0.21)
Helped by a Relative to Get Current Job ‐0.021 (1.18)
Current Employer is a Relative ‐0.021 (0.72)
Includes Fixed Effects: State No Yes Year of Arrival No Yes Country of Origin No Yes
R‐Squared 0.025 0.141 Number of Observations 4,486
Note: The t-statistics, shown in parentheses, are calculated based on standard errors clustered around occupations. Model specification number refers to the specifications in Tables 3 and 4.
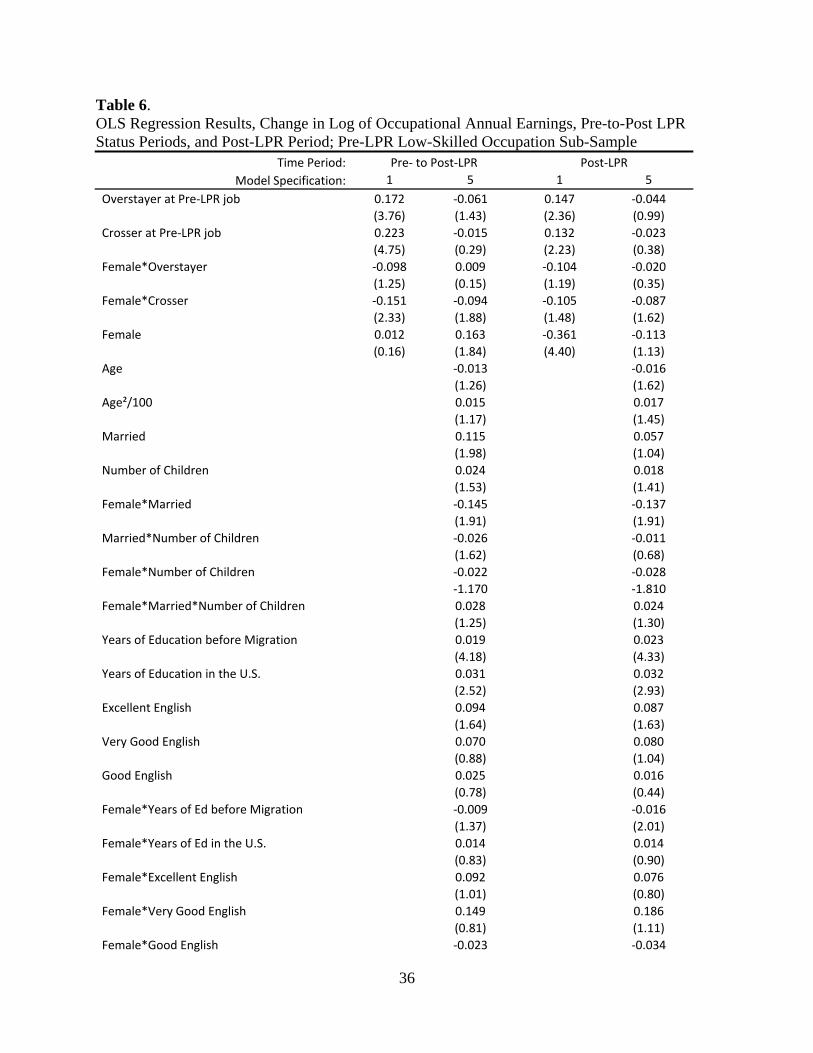
36
Table 6. OLS Regression Results, Change in Log of Occupational Annual Earnings, Pre-to-Post LPR Status Periods, and Post-LPR Period; Pre-LPR Low-Skilled Occupation Sub-Sample
Time Period: Pre‐ to Post‐LPR Post‐LPR Model Specification: 1 5 1 5
Overstayer at Pre‐LPR job 0.172 ‐0.061 0.147 ‐0.044 (3.76) (1.43) (2.36) (0.99)
Crosser at Pre‐LPR job 0.223 ‐0.015 0.132 ‐0.023 (4.75) (0.29) (2.23) (0.38)
Female*Overstayer ‐0.098 0.009 ‐0.104 ‐0.020 (1.25) (0.15) (1.19) (0.35)
Female*Crosser ‐0.151 ‐0.094 ‐0.105 ‐0.087 (2.33) (1.88) (1.48) (1.62)
Female 0.012 0.163 ‐0.361 ‐0.113 (0.16) (1.84) (4.40) (1.13)
Age ‐0.013 ‐0.016 (1.26) (1.62)
Age²/100 0.015 0.017 (1.17) (1.45)
Married 0.115 0.057 (1.98) (1.04)
Number of Children 0.024 0.018 (1.53) (1.41)
Female*Married ‐0.145 ‐0.137 (1.91) (1.91)
Married*Number of Children ‐0.026 ‐0.011 (1.62) (0.68)
Female*Number of Children ‐0.022 ‐0.028 ‐1.170 ‐1.810
Female*Married*Number of Children 0.028 0.024 (1.25) (1.30)
Years of Education before Migration 0.019 0.023 (4.18) (4.33)
Years of Education in the U.S. 0.031 0.032 (2.52) (2.93)
Excellent English 0.094 0.087 (1.64) (1.63)
Very Good English 0.070 0.080 (0.88) (1.04)
Good English 0.025 0.016 (0.78) (0.44)
Female*Years of Ed before Migration ‐0.009 ‐0.016 (1.37) (2.01)
Female*Years of Ed in the U.S. 0.014 0.014 (0.83) (0.90)
Female*Excellent English 0.092 0.076 (1.01) (0.80)
Female*Very Good English 0.149 0.186 (0.81) (1.11)
Female*Good English ‐0.023 ‐0.034
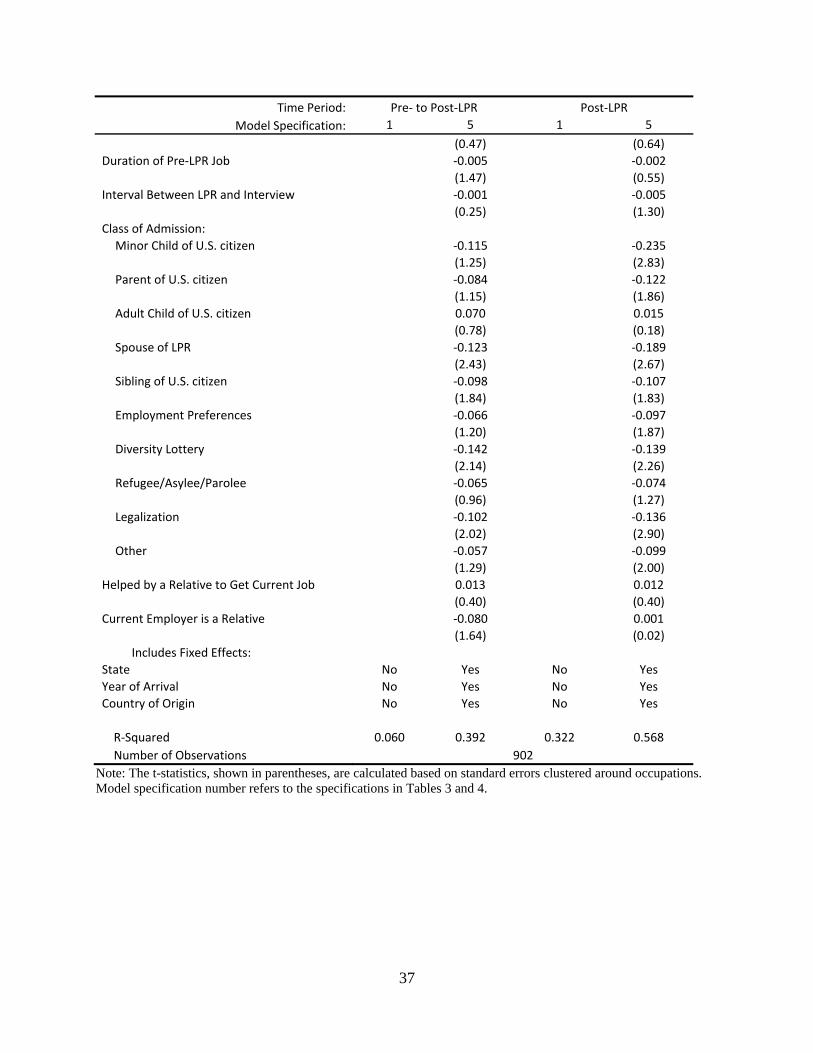
37
Time Period: Pre‐ to Post‐LPR Post‐LPR Model Specification: 1 5 1 5
(0.47) (0.64) Duration of Pre‐LPR Job ‐0.005 ‐0.002
(1.47) (0.55) Interval Between LPR and Interview ‐0.001 ‐0.005
(0.25) (1.30) Class of Admission: Minor Child of U.S. citizen ‐0.115 ‐0.235
(1.25) (2.83) Parent of U.S. citizen ‐0.084 ‐0.122
(1.15) (1.86) Adult Child of U.S. citizen 0.070 0.015
(0.78) (0.18) Spouse of LPR ‐0.123 ‐0.189
(2.43) (2.67) Sibling of U.S. citizen ‐0.098 ‐0.107
(1.84) (1.83) Employment Preferences ‐0.066 ‐0.097
(1.20) (1.87) Diversity Lottery ‐0.142 ‐0.139
(2.14) (2.26) Refugee/Asylee/Parolee ‐0.065 ‐0.074
(0.96) (1.27) Legalization ‐0.102 ‐0.136
(2.02) (2.90) Other ‐0.057 ‐0.099
(1.29) (2.00) Helped by a Relative to Get Current Job 0.013 0.012
(0.40) (0.40) Current Employer is a Relative ‐0.080 0.001
(1.64) (0.02) Includes Fixed Effects:
State No Yes No Yes Year of Arrival No Yes No Yes Country of Origin No Yes No Yes
R‐Squared 0.060 0.392 0.322 0.568 Number of Observations 902
Note: The t-statistics, shown in parentheses, are calculated based on standard errors clustered around occupations. Model specification number refers to the specifications in Tables 3 and 4.
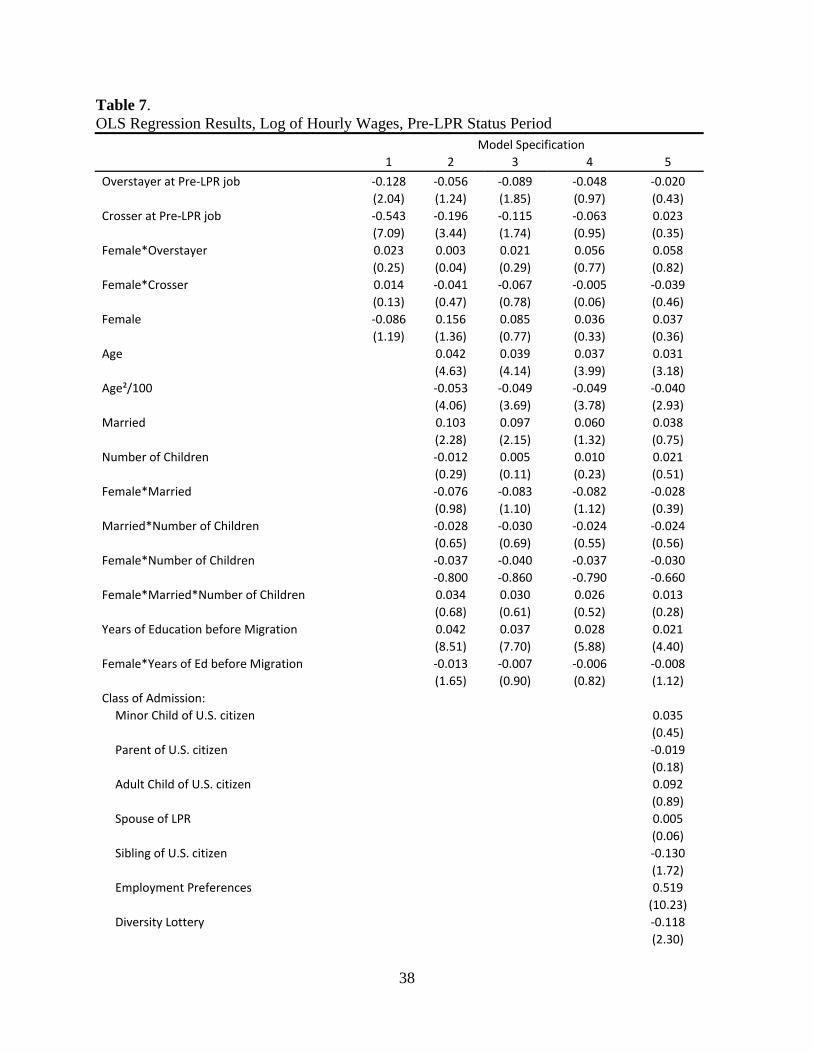
38
Table 7. OLS Regression Results, Log of Hourly Wages, Pre-LPR Status Period
Model Specification 1 2 3 4 5
Overstayer at Pre‐LPR job ‐0.128 ‐0.056 ‐0.089 ‐0.048 ‐0.020 (2.04) (1.24) (1.85) (0.97) (0.43)
Crosser at Pre‐LPR job ‐0.543 ‐0.196 ‐0.115 ‐0.063 0.023 (7.09) (3.44) (1.74) (0.95) (0.35)
Female*Overstayer 0.023 0.003 0.021 0.056 0.058 (0.25) (0.04) (0.29) (0.77) (0.82)
Female*Crosser 0.014 ‐0.041 ‐0.067 ‐0.005 ‐0.039 (0.13) (0.47) (0.78) (0.06) (0.46)
Female ‐0.086 0.156 0.085 0.036 0.037 (1.19) (1.36) (0.77) (0.33) (0.36)
Age 0.042 0.039 0.037 0.031 (4.63) (4.14) (3.99) (3.18)
Age²/100 ‐0.053 ‐0.049 ‐0.049 ‐0.040 (4.06) (3.69) (3.78) (2.93)
Married 0.103 0.097 0.060 0.038 (2.28) (2.15) (1.32) (0.75)
Number of Children ‐0.012 0.005 0.010 0.021 (0.29) (0.11) (0.23) (0.51)
Female*Married ‐0.076 ‐0.083 ‐0.082 ‐0.028 (0.98) (1.10) (1.12) (0.39)
Married*Number of Children ‐0.028 ‐0.030 ‐0.024 ‐0.024 (0.65) (0.69) (0.55) (0.56)
Female*Number of Children ‐0.037 ‐0.040 ‐0.037 ‐0.030 ‐0.800 ‐0.860 ‐0.790 ‐0.660
Female*Married*Number of Children 0.034 0.030 0.026 0.013 (0.68) (0.61) (0.52) (0.28)
Years of Education before Migration 0.042 0.037 0.028 0.021 (8.51) (7.70) (5.88) (4.40)
Female*Years of Ed before Migration ‐0.013 ‐0.007 ‐0.006 ‐0.008 (1.65) (0.90) (0.82) (1.12)
Class of Admission: Minor Child of U.S. citizen 0.035
(0.45) Parent of U.S. citizen ‐0.019
(0.18) Adult Child of U.S. citizen 0.092
(0.89) Spouse of LPR 0.005
(0.06) Sibling of U.S. citizen ‐0.130
(1.72) Employment Preferences 0.519
(10.23) Diversity Lottery ‐0.118
(2.30)
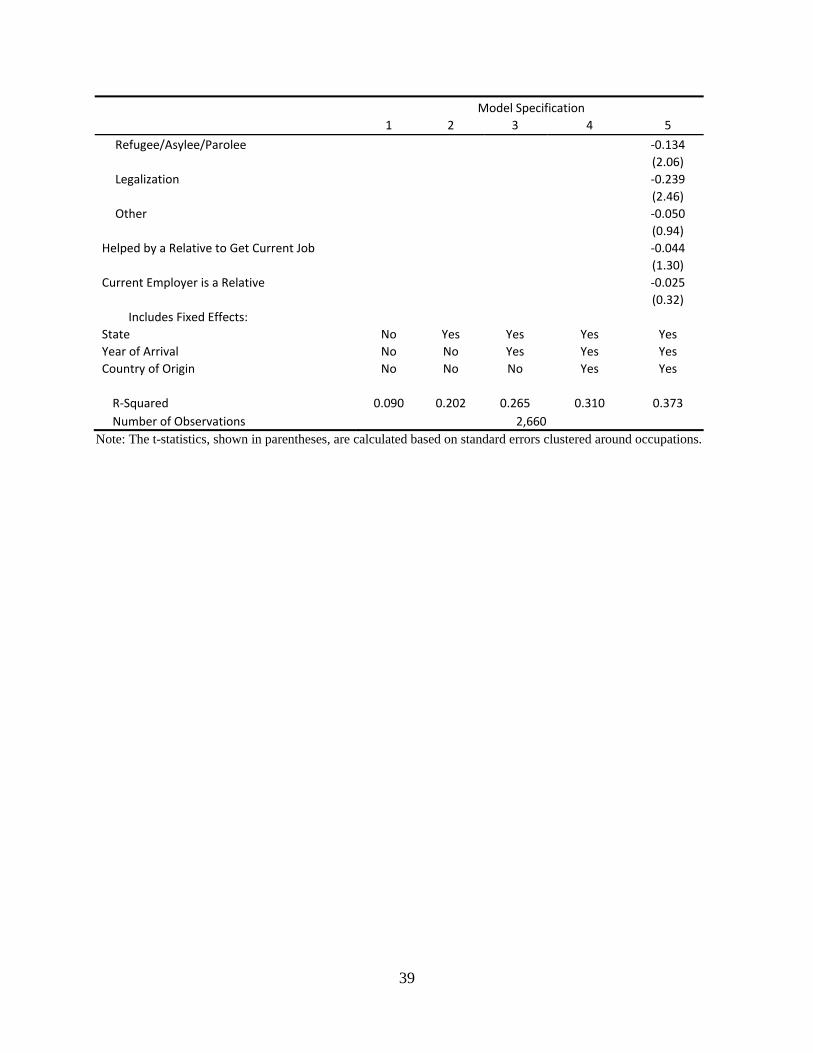
39
Model Specification 1 2 3 4 5
Refugee/Asylee/Parolee ‐0.134 (2.06)
Legalization ‐0.239 (2.46)
Other ‐0.050 (0.94)
Helped by a Relative to Get Current Job ‐0.044 (1.30)
Current Employer is a Relative ‐0.025 (0.32)
Includes Fixed Effects: State No Yes Yes Yes Yes Year of Arrival No No Yes Yes Yes Country of Origin No No No Yes Yes
R‐Squared 0.090 0.202 0.265 0.310 0.373 Number of Observations 2,660
Note: The t-statistics, shown in parentheses, are calculated based on standard errors clustered around occupations.
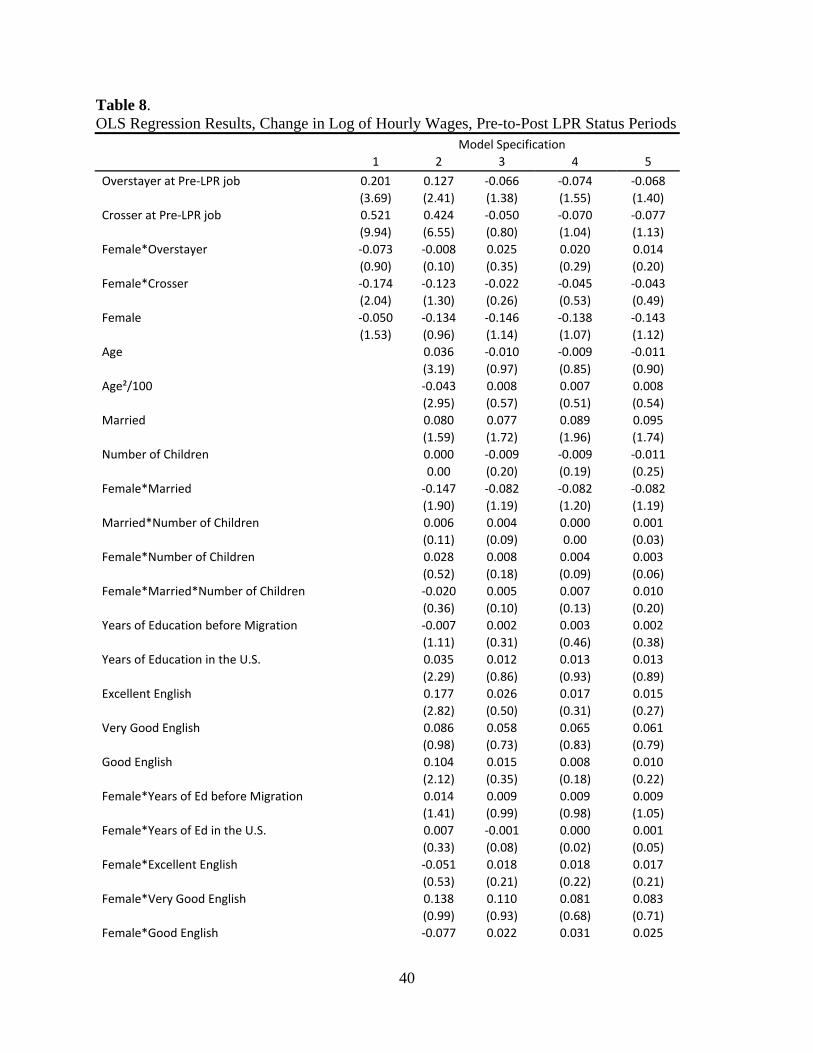
40
Table 8. OLS Regression Results, Change in Log of Hourly Wages, Pre-to-Post LPR Status Periods
Model Specification 1 2 3 4 5
Overstayer at Pre‐LPR job 0.201 0.127 ‐0.066 ‐0.074 ‐0.068 (3.69) (2.41) (1.38) (1.55) (1.40)
Crosser at Pre‐LPR job 0.521 0.424 ‐0.050 ‐0.070 ‐0.077 (9.94) (6.55) (0.80) (1.04) (1.13)
Female*Overstayer ‐0.073 ‐0.008 0.025 0.020 0.014 (0.90) (0.10) (0.35) (0.29) (0.20)
Female*Crosser ‐0.174 ‐0.123 ‐0.022 ‐0.045 ‐0.043 (2.04) (1.30) (0.26) (0.53) (0.49)
Female ‐0.050 ‐0.134 ‐0.146 ‐0.138 ‐0.143 (1.53) (0.96) (1.14) (1.07) (1.12)
Age 0.036 ‐0.010 ‐0.009 ‐0.011 (3.19) (0.97) (0.85) (0.90)
Age²/100 ‐0.043 0.008 0.007 0.008 (2.95) (0.57) (0.51) (0.54)
Married 0.080 0.077 0.089 0.095 (1.59) (1.72) (1.96) (1.74)
Number of Children 0.000 ‐0.009 ‐0.009 ‐0.011 0.00 (0.20) (0.19) (0.25)
Female*Married ‐0.147 ‐0.082 ‐0.082 ‐0.082 (1.90) (1.19) (1.20) (1.19)
Married*Number of Children 0.006 0.004 0.000 0.001 (0.11) (0.09) 0.00 (0.03)
Female*Number of Children 0.028 0.008 0.004 0.003 (0.52) (0.18) (0.09) (0.06)
Female*Married*Number of Children ‐0.020 0.005 0.007 0.010 (0.36) (0.10) (0.13) (0.20)
Years of Education before Migration ‐0.007 0.002 0.003 0.002 (1.11) (0.31) (0.46) (0.38)
Years of Education in the U.S. 0.035 0.012 0.013 0.013 (2.29) (0.86) (0.93) (0.89)
Excellent English 0.177 0.026 0.017 0.015 (2.82) (0.50) (0.31) (0.27)
Very Good English 0.086 0.058 0.065 0.061 (0.98) (0.73) (0.83) (0.79)
Good English 0.104 0.015 0.008 0.010 (2.12) (0.35) (0.18) (0.22)
Female*Years of Ed before Migration 0.014 0.009 0.009 0.009 (1.41) (0.99) (0.98) (1.05)
Female*Years of Ed in the U.S. 0.007 ‐0.001 0.000 0.001 (0.33) (0.08) (0.02) (0.05)
Female*Excellent English ‐0.051 0.018 0.018 0.017 (0.53) (0.21) (0.22) (0.21)
Female*Very Good English 0.138 0.110 0.081 0.083 (0.99) (0.93) (0.68) (0.71)
Female*Good English ‐0.077 0.022 0.031 0.025
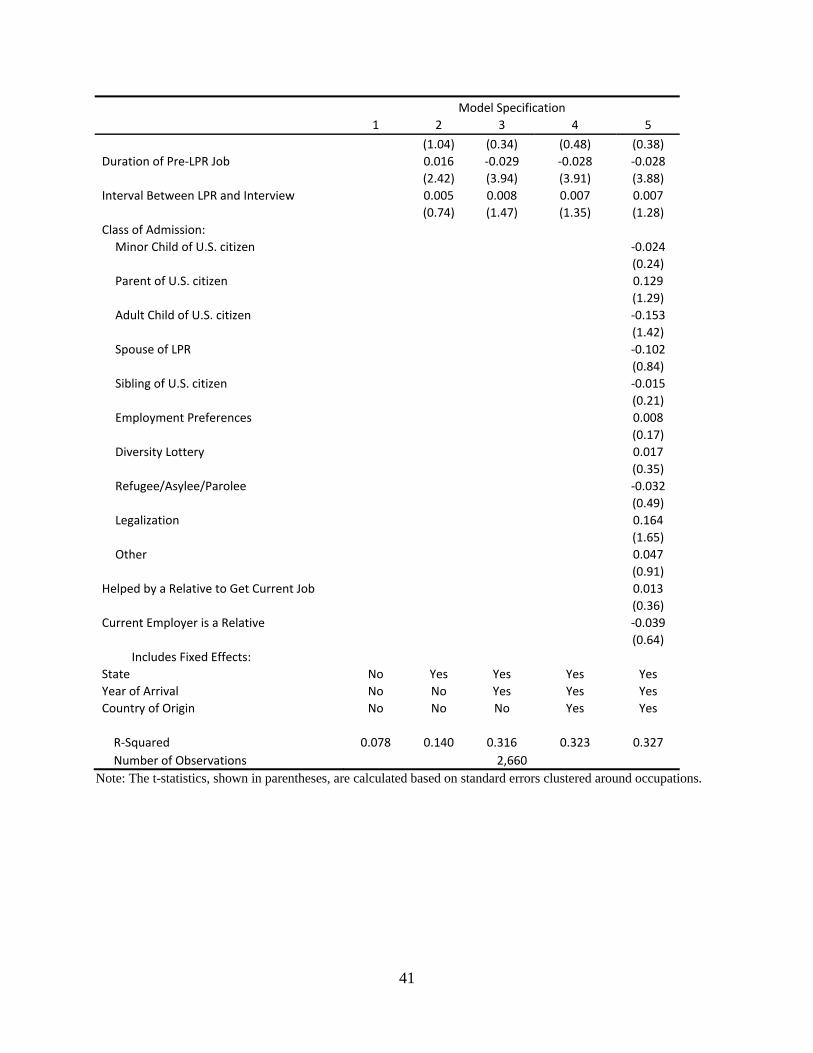
41
Model Specification 1 2 3 4 5
(1.04) (0.34) (0.48) (0.38) Duration of Pre‐LPR Job 0.016 ‐0.029 ‐0.028 ‐0.028
(2.42) (3.94) (3.91) (3.88) Interval Between LPR and Interview 0.005 0.008 0.007 0.007
(0.74) (1.47) (1.35) (1.28) Class of Admission: Minor Child of U.S. citizen ‐0.024
(0.24) Parent of U.S. citizen 0.129
(1.29) Adult Child of U.S. citizen ‐0.153
(1.42) Spouse of LPR ‐0.102
(0.84) Sibling of U.S. citizen ‐0.015
(0.21) Employment Preferences 0.008
(0.17) Diversity Lottery 0.017
(0.35) Refugee/Asylee/Parolee ‐0.032
(0.49) Legalization 0.164
(1.65) Other 0.047
(0.91) Helped by a Relative to Get Current Job 0.013
(0.36) Current Employer is a Relative ‐0.039
(0.64) Includes Fixed Effects:
State No Yes Yes Yes Yes Year of Arrival No No Yes Yes Yes Country of Origin No No No Yes Yes
R‐Squared 0.078 0.140 0.316 0.323 0.327 Number of Observations 2,660
Note: The t-statistics, shown in parentheses, are calculated based on standard errors clustered around occupations.
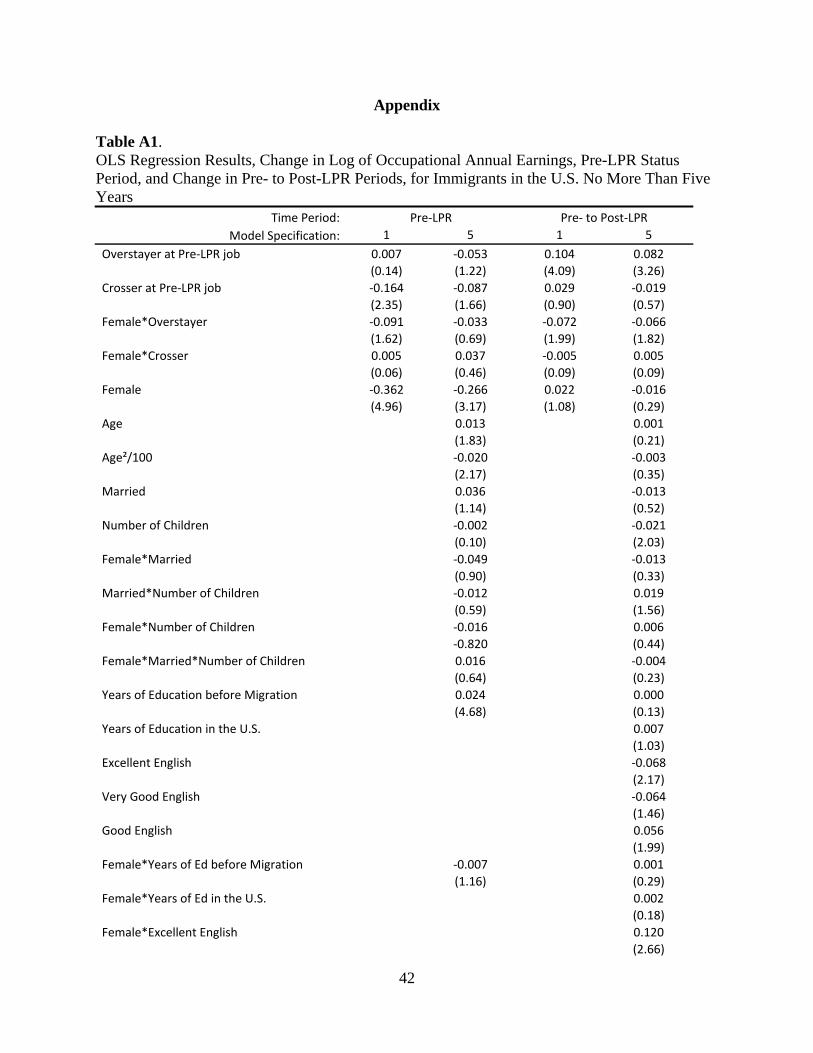
42
Appendix Table A1. OLS Regression Results, Change in Log of Occupational Annual Earnings, Pre-LPR Status Period, and Change in Pre- to Post-LPR Periods, for Immigrants in the U.S. No More Than Five Years
Time Period: Pre‐LPR Pre‐ to Post‐LPR Model Specification: 1 5 1 5
Overstayer at Pre‐LPR job 0.007 ‐0.053 0.104 0.082 (0.14) (1.22) (4.09) (3.26)
Crosser at Pre‐LPR job ‐0.164 ‐0.087 0.029 ‐0.019 (2.35) (1.66) (0.90) (0.57)
Female*Overstayer ‐0.091 ‐0.033 ‐0.072 ‐0.066 (1.62) (0.69) (1.99) (1.82)
Female*Crosser 0.005 0.037 ‐0.005 0.005 (0.06) (0.46) (0.09) (0.09)
Female ‐0.362 ‐0.266 0.022 ‐0.016 (4.96) (3.17) (1.08) (0.29)
Age 0.013 0.001 (1.83) (0.21)
Age²/100 ‐0.020 ‐0.003 (2.17) (0.35)
Married 0.036 ‐0.013 (1.14) (0.52)
Number of Children ‐0.002 ‐0.021 (0.10) (2.03)
Female*Married ‐0.049 ‐0.013 (0.90) (0.33)
Married*Number of Children ‐0.012 0.019 (0.59) (1.56)
Female*Number of Children ‐0.016 0.006 ‐0.820 (0.44)
Female*Married*Number of Children 0.016 ‐0.004 (0.64) (0.23)
Years of Education before Migration 0.024 0.000 (4.68) (0.13)
Years of Education in the U.S. 0.007 (1.03)
Excellent English ‐0.068 (2.17)
Very Good English ‐0.064 (1.46)
Good English 0.056 (1.99)
Female*Years of Ed before Migration ‐0.007 0.001 (1.16) (0.29)
Female*Years of Ed in the U.S. 0.002 (0.18)
Female*Excellent English 0.120 (2.66)
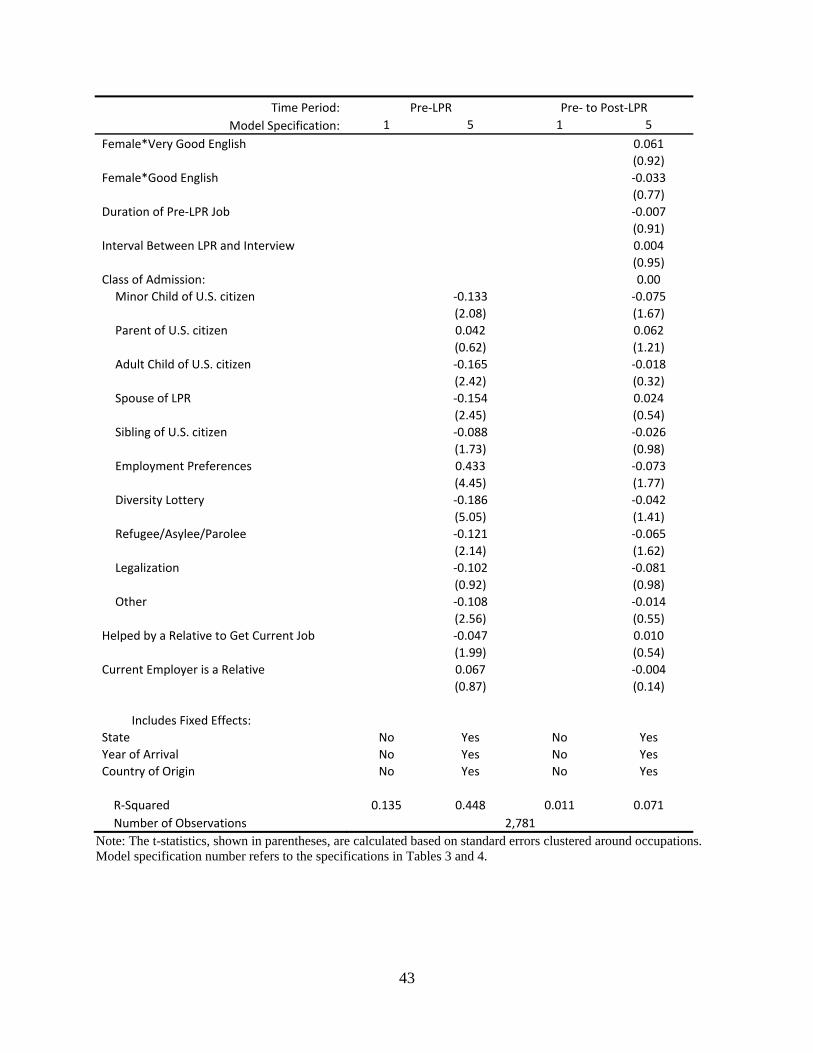
43
Time Period: Pre‐LPR Pre‐ to Post‐LPR Model Specification: 1 5 1 5
Female*Very Good English 0.061 (0.92)
Female*Good English ‐0.033 (0.77)
Duration of Pre‐LPR Job ‐0.007 (0.91)
Interval Between LPR and Interview 0.004 (0.95)
Class of Admission: 0.00 Minor Child of U.S. citizen ‐0.133 ‐0.075
(2.08) (1.67) Parent of U.S. citizen 0.042 0.062
(0.62) (1.21) Adult Child of U.S. citizen ‐0.165 ‐0.018
(2.42) (0.32) Spouse of LPR ‐0.154 0.024
(2.45) (0.54) Sibling of U.S. citizen ‐0.088 ‐0.026
(1.73) (0.98) Employment Preferences 0.433 ‐0.073
(4.45) (1.77) Diversity Lottery ‐0.186 ‐0.042
(5.05) (1.41) Refugee/Asylee/Parolee ‐0.121 ‐0.065
(2.14) (1.62) Legalization ‐0.102 ‐0.081
(0.92) (0.98) Other ‐0.108 ‐0.014
(2.56) (0.55) Helped by a Relative to Get Current Job ‐0.047 0.010
(1.99) (0.54) Current Employer is a Relative 0.067 ‐0.004
(0.87) (0.14)
Includes Fixed Effects: State No Yes No Yes Year of Arrival No Yes No Yes Country of Origin No Yes No Yes
R‐Squared 0.135 0.448 0.011 0.071 Number of Observations 2,781
Note: The t-statistics, shown in parentheses, are calculated based on standard errors clustered around occupations. Model specification number refers to the specifications in Tables 3 and 4.
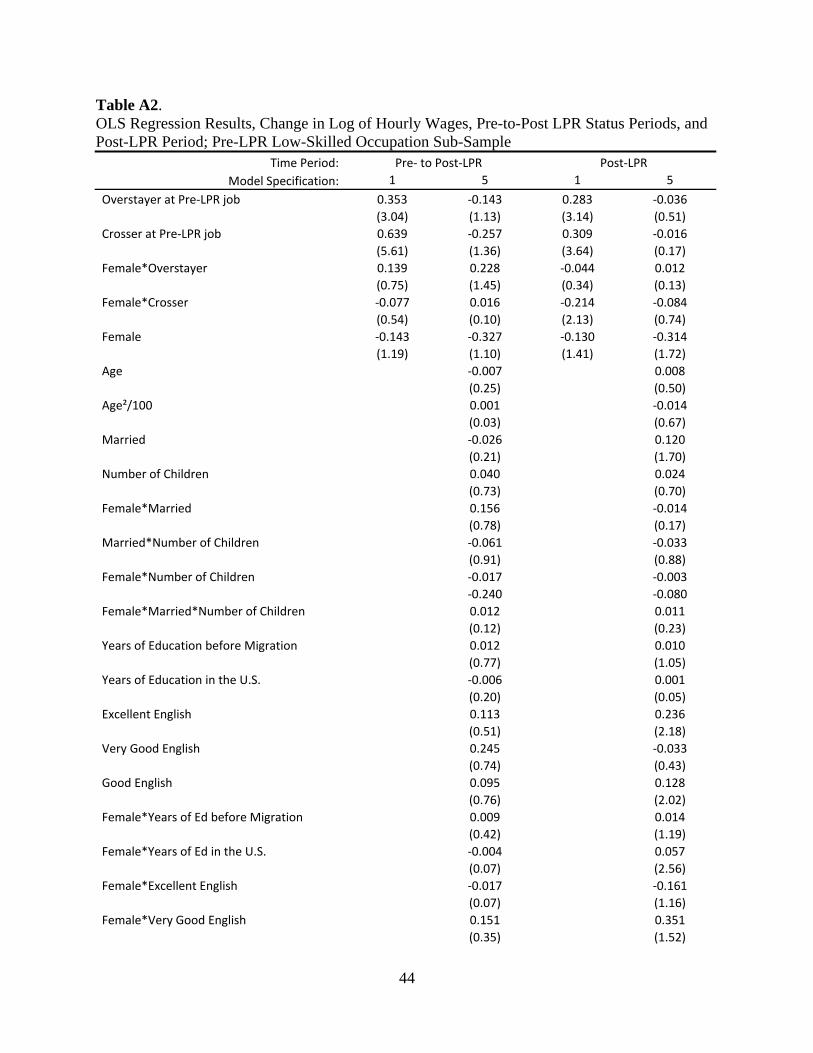
44
Table A2. OLS Regression Results, Change in Log of Hourly Wages, Pre-to-Post LPR Status Periods, and Post-LPR Period; Pre-LPR Low-Skilled Occupation Sub-Sample
Time Period: Pre‐ to Post‐LPR Post‐LPR Model Specification: 1 5 1 5
Overstayer at Pre‐LPR job 0.353 ‐0.143 0.283 ‐0.036 (3.04) (1.13) (3.14) (0.51)
Crosser at Pre‐LPR job 0.639 ‐0.257 0.309 ‐0.016 (5.61) (1.36) (3.64) (0.17)
Female*Overstayer 0.139 0.228 ‐0.044 0.012 (0.75) (1.45) (0.34) (0.13)
Female*Crosser ‐0.077 0.016 ‐0.214 ‐0.084 (0.54) (0.10) (2.13) (0.74)
Female ‐0.143 ‐0.327 ‐0.130 ‐0.314 (1.19) (1.10) (1.41) (1.72)
Age ‐0.007 0.008 (0.25) (0.50)
Age²/100 0.001 ‐0.014 (0.03) (0.67)
Married ‐0.026 0.120 (0.21) (1.70)
Number of Children 0.040 0.024 (0.73) (0.70)
Female*Married 0.156 ‐0.014 (0.78) (0.17)
Married*Number of Children ‐0.061 ‐0.033 (0.91) (0.88)
Female*Number of Children ‐0.017 ‐0.003 ‐0.240 ‐0.080
Female*Married*Number of Children 0.012 0.011 (0.12) (0.23)
Years of Education before Migration 0.012 0.010 (0.77) (1.05)
Years of Education in the U.S. ‐0.006 0.001 (0.20) (0.05)
Excellent English 0.113 0.236 (0.51) (2.18)
Very Good English 0.245 ‐0.033 (0.74) (0.43)
Good English 0.095 0.128 (0.76) (2.02)
Female*Years of Ed before Migration 0.009 0.014 (0.42) (1.19)
Female*Years of Ed in the U.S. ‐0.004 0.057 (0.07) (2.56)
Female*Excellent English ‐0.017 ‐0.161 (0.07) (1.16)
Female*Very Good English 0.151 0.351 (0.35) (1.52)
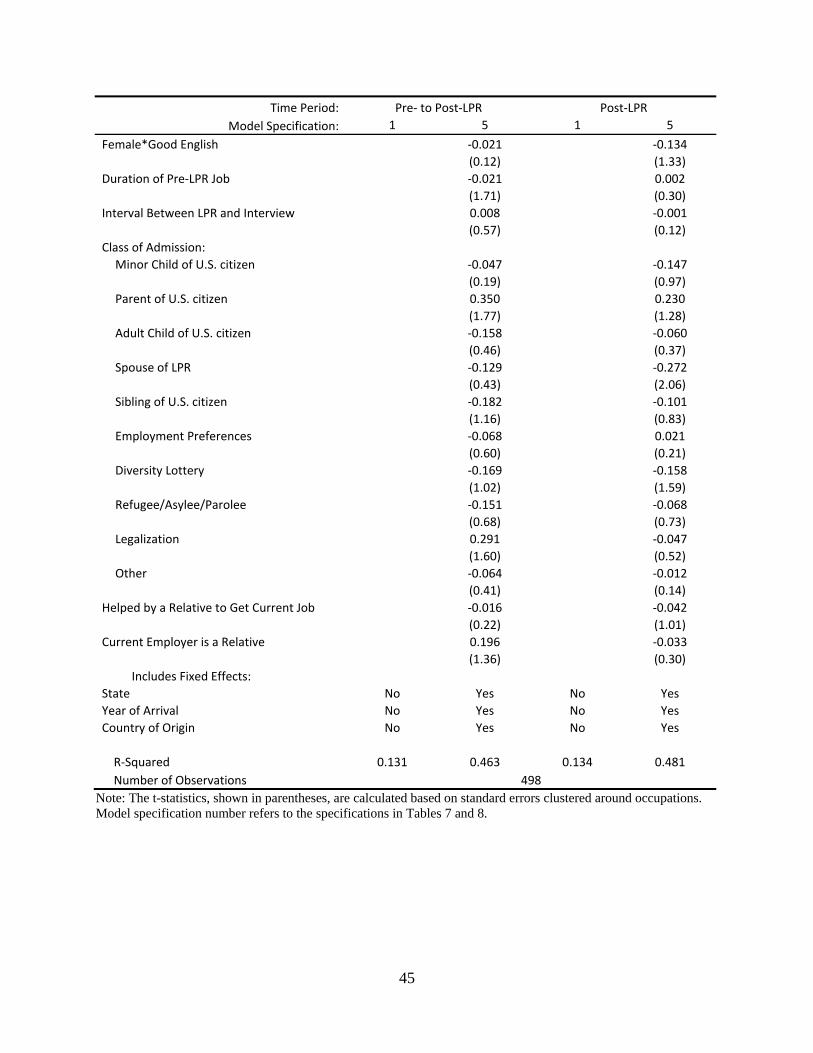
45
Time Period: Pre‐ to Post‐LPR Post‐LPR Model Specification: 1 5 1 5
Female*Good English ‐0.021 ‐0.134 (0.12) (1.33)
Duration of Pre‐LPR Job ‐0.021 0.002 (1.71) (0.30)
Interval Between LPR and Interview 0.008 ‐0.001 (0.57) (0.12)
Class of Admission: Minor Child of U.S. citizen ‐0.047 ‐0.147
(0.19) (0.97) Parent of U.S. citizen 0.350 0.230
(1.77) (1.28) Adult Child of U.S. citizen ‐0.158 ‐0.060
(0.46) (0.37) Spouse of LPR ‐0.129 ‐0.272
(0.43) (2.06) Sibling of U.S. citizen ‐0.182 ‐0.101
(1.16) (0.83) Employment Preferences ‐0.068 0.021
(0.60) (0.21) Diversity Lottery ‐0.169 ‐0.158
(1.02) (1.59) Refugee/Asylee/Parolee ‐0.151 ‐0.068
(0.68) (0.73) Legalization 0.291 ‐0.047
(1.60) (0.52) Other ‐0.064 ‐0.012
(0.41) (0.14) Helped by a Relative to Get Current Job ‐0.016 ‐0.042
(0.22) (1.01) Current Employer is a Relative 0.196 ‐0.033
(1.36) (0.30) Includes Fixed Effects:
State No Yes No Yes Year of Arrival No Yes No Yes Country of Origin No Yes No Yes
R‐Squared 0.131 0.463 0.134 0.481 Number of Observations 498
Note: The t-statistics, shown in parentheses, are calculated based on standard errors clustered around occupations. Model specification number refers to the specifications in Tables 7 and 8.
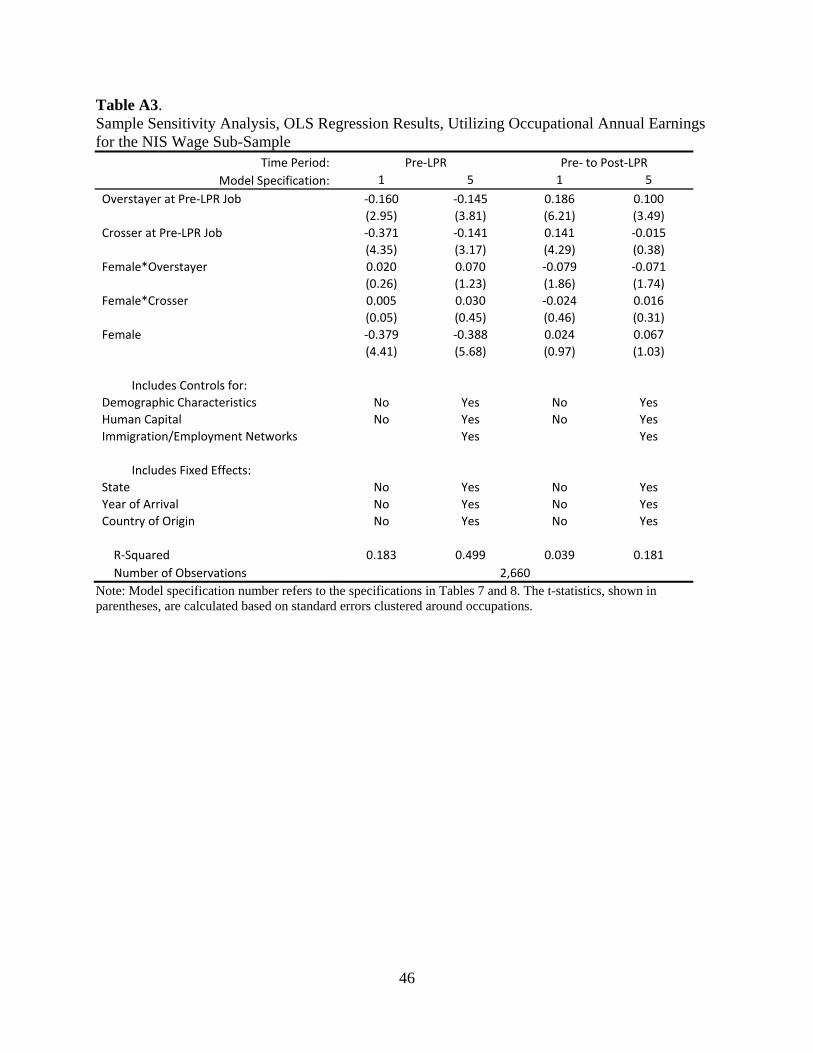
46
Table A3. Sample Sensitivity Analysis, OLS Regression Results, Utilizing Occupational Annual Earnings for the NIS Wage Sub-Sample
Time Period: Pre‐LPR Pre‐ to Post‐LPR Model Specification: 1 5 1 5
Overstayer at Pre‐LPR Job ‐0.160 ‐0.145 0.186 0.100 (2.95) (3.81) (6.21) (3.49)
Crosser at Pre‐LPR Job ‐0.371 ‐0.141 0.141 ‐0.015 (4.35) (3.17) (4.29) (0.38)
Female*Overstayer 0.020 0.070 ‐0.079 ‐0.071 (0.26) (1.23) (1.86) (1.74)
Female*Crosser 0.005 0.030 ‐0.024 0.016 (0.05) (0.45) (0.46) (0.31)
Female ‐0.379 ‐0.388 0.024 0.067 (4.41) (5.68) (0.97) (1.03)
Includes Controls for: Demographic Characteristics No Yes No Yes Human Capital No Yes No Yes Immigration/Employment Networks Yes Yes
Includes Fixed Effects: State No Yes No Yes Year of Arrival No Yes No Yes Country of Origin No Yes No Yes
R‐Squared 0.183 0.499 0.039 0.181 Number of Observations 2,660
Note: Model specification number refers to the specifications in Tables 7 and 8. The t-statistics, shown in parentheses, are calculated based on standard errors clustered around occupations.