Embed Size (px)
Citation preview
Diana Stuart Sinton
National Institute for Technology & Liberal Education
GIS as a Tool for Teaching & Learning
PACSCL December 2, 2005
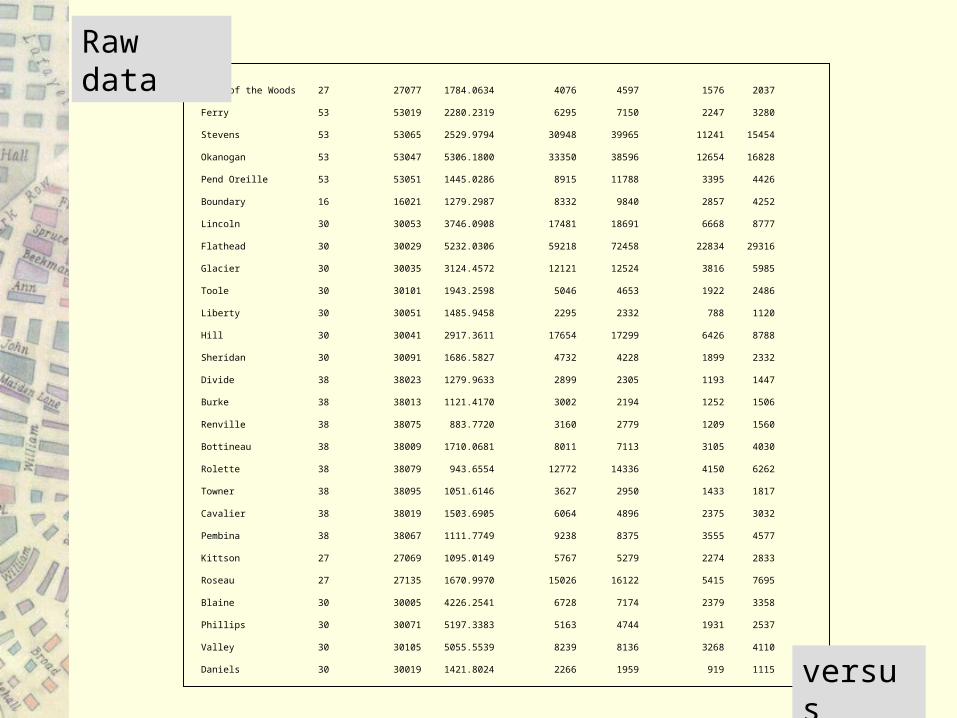
Lake of the Woods 27 27077 1784.0634 4076 4597 1576 2037
Ferry 53 53019 2280.2319 6295 7150 2247 3280
Stevens 53 53065 2529.9794 30948 39965 11241 15454
Okanogan 53 53047 5306.1800 33350 38596 12654 16828
Pend Oreille 53 53051 1445.0286 8915 11788 3395 4426
Boundary 16 16021 1279.2987 8332 9840 2857 4252
Lincoln 30 30053 3746.0908 17481 18691 6668 8777
Flathead 30 30029 5232.0306 59218 72458 22834 29316
Glacier 30 30035 3124.4572 12121 12524 3816 5985
Toole 30 30101 1943.2598 5046 4653 1922 2486
Liberty 30 30051 1485.9458 2295 2332 788 1120
Hill 30 30041 2917.3611 17654 17299 6426 8788
Sheridan 30 30091 1686.5827 4732 4228 1899 2332
Divide 38 38023 1279.9633 2899 2305 1193 1447
Burke 38 38013 1121.4170 3002 2194 1252 1506
Renville 38 38075 883.7720 3160 2779 1209 1560
Bottineau 38 38009 1710.0681 8011 7113 3105 4030
Rolette 38 38079 943.6554 12772 14336 4150 6262
Towner 38 38095 1051.6146 3627 2950 1433 1817
Cavalier 38 38019 1503.6905 6064 4896 2375 3032
Pembina 38 38067 1111.7749 9238 8375 3555 4577
Kittson 27 27069 1095.0149 5767 5279 2274 2833
Roseau 27 27135 1670.9970 15026 16122 5415 7695
Blaine 30 30005 4226.2541 6728 7174 2379 3358
Phillips 30 30071 5197.3383 5163 4744 1931 2537
Valley 30 30105 5055.5539 8239 8136 3268 4110
Daniels 30 30019 1421.8024 2266 1959 919 1115
Raw data
versus
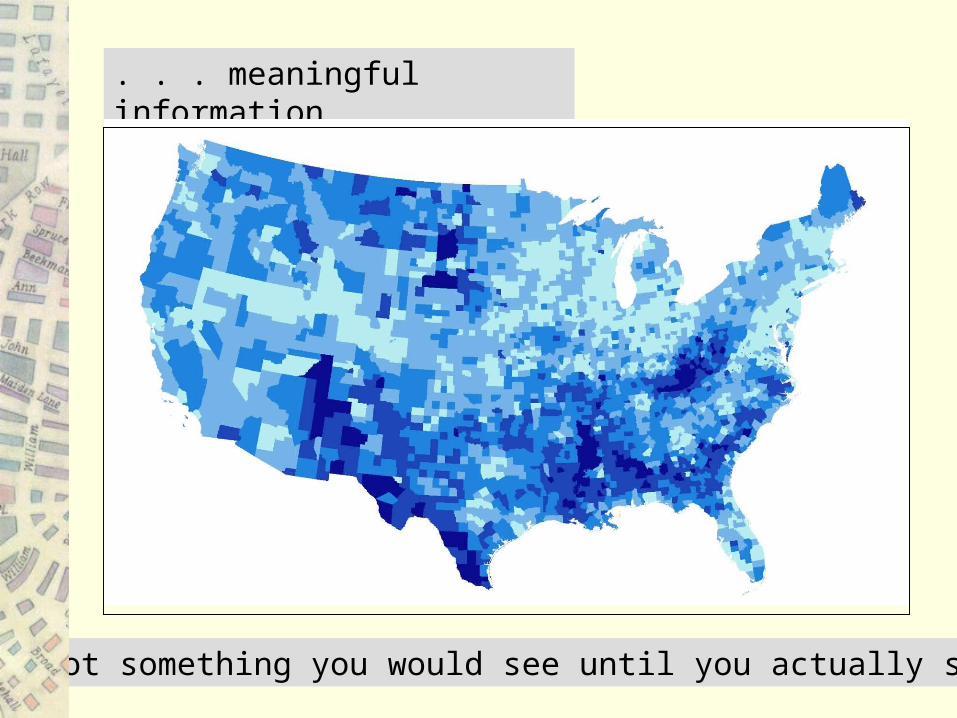
. . . meaningful information
“It’s not something you would see until you actually saw it.”

Establish connections between curriculum and skills of
1) critical thinking,
2) quantitative reasoning,
3) geographic awareness,
all supported by cartographic/spatial visualization.
How is it used to teach & learn?
* GIS creates a spatial lens that supports geographic curiosity.*
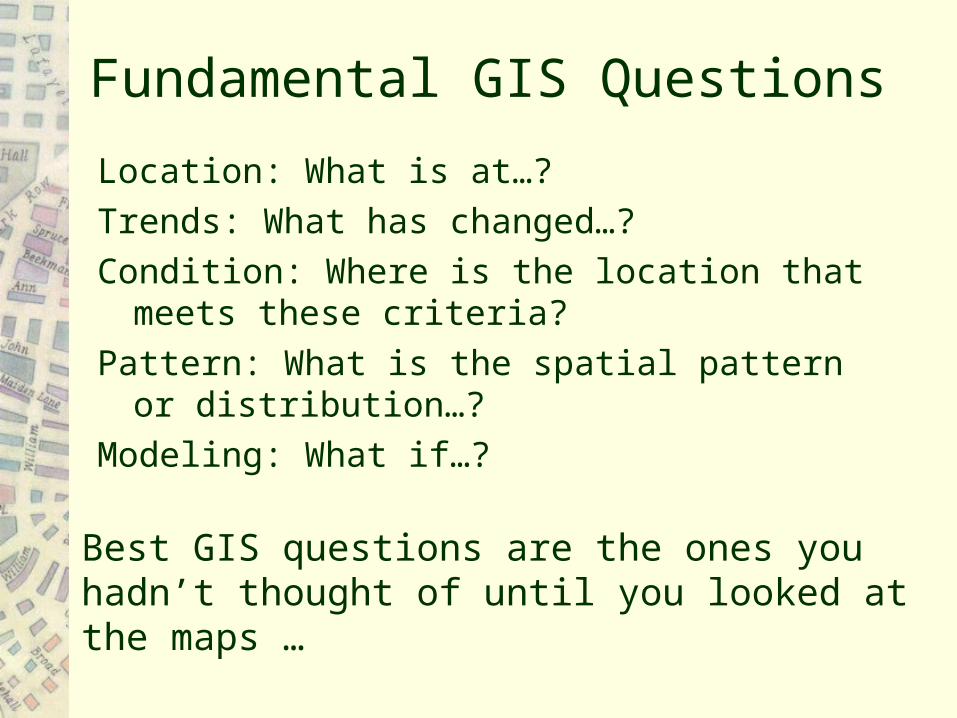
Fundamental GIS Questions
Location: What is at…?
Trends: What has changed…?
Condition: Where is the location that meets these criteria?
Pattern: What is the spatial pattern or distribution…?
Modeling: What if…?
Best GIS questions are the ones you hadn’t thought of until you looked at the maps …
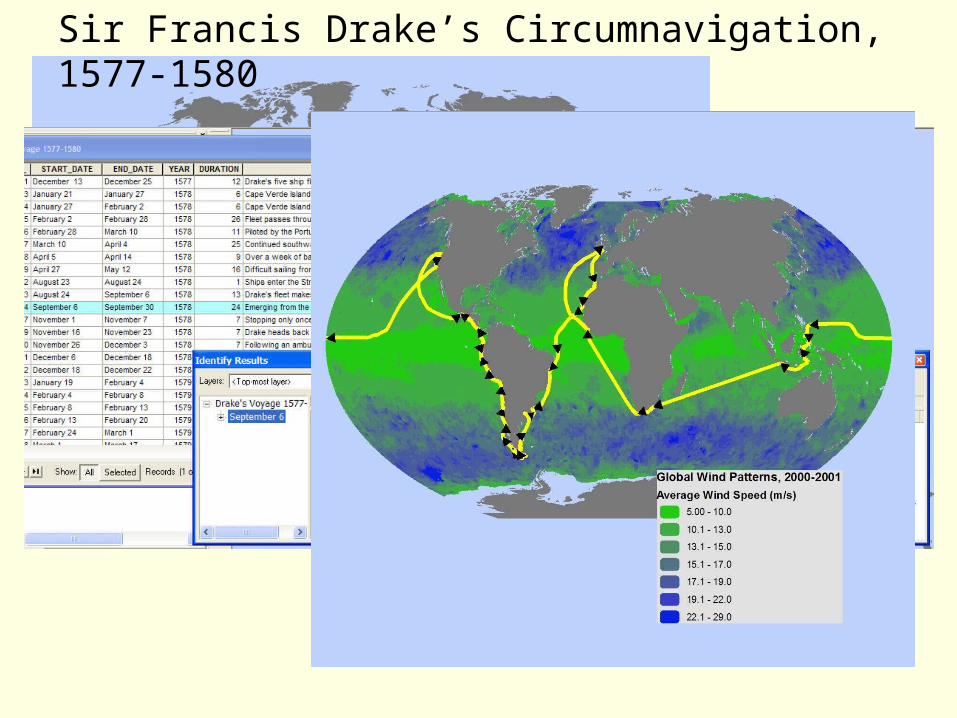
Sir Francis Drake’s Circumnavigation, 1577-1580
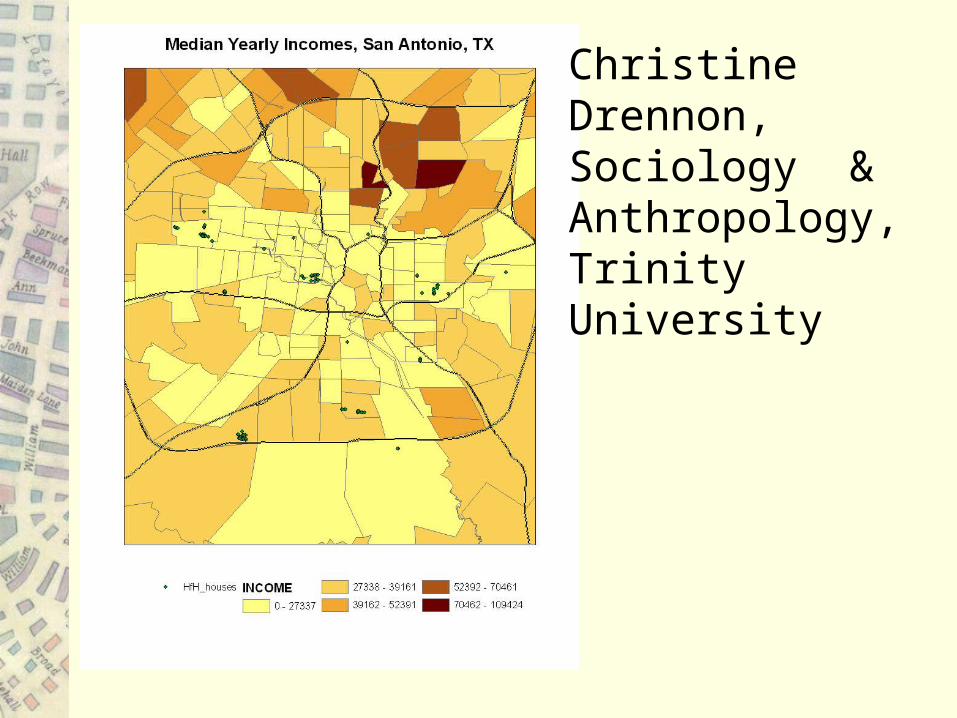
Christine Drennon, Sociology & Anthropology, Trinity University

Patrick Rael, History, Bowdoin College
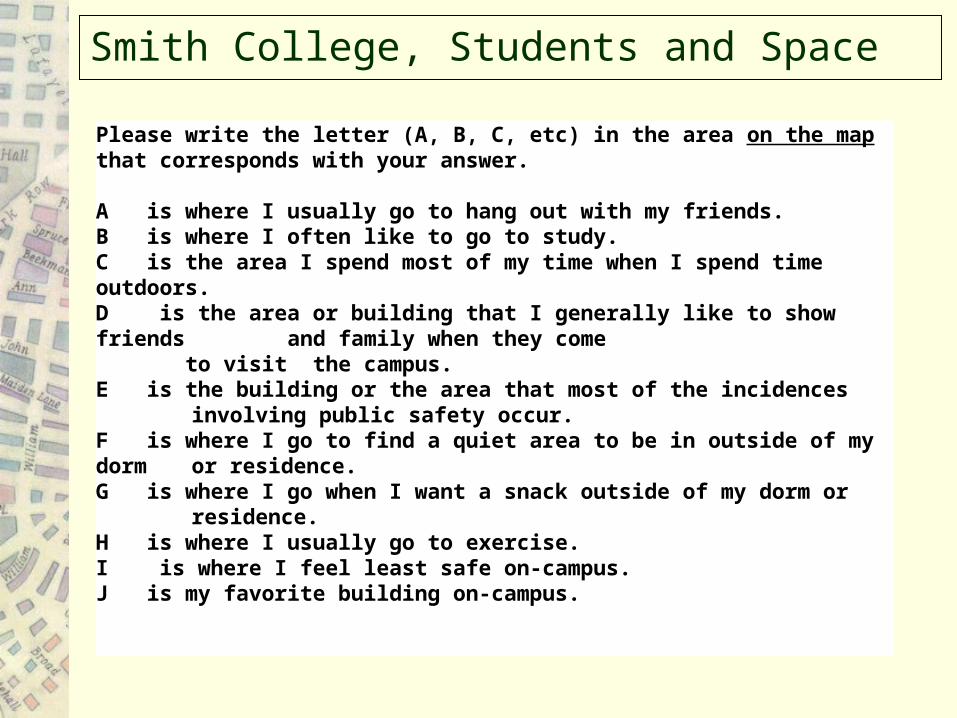
Smith College, Students and Space
Please write the letter (A, B, C, etc) in the area on the map that corresponds with your answer.
A is where I usually go to hang out with my friends.B is where I often like to go to study.C is the area I spend most of my time when I spend time outdoors.D is the area or building that I generally like to show friends and family when they come to visit the campus.E is the building or the area that most of the incidences involving public safety occur.F is where I go to find a quiet area to be in outside of my dorm
or residence.G is where I go when I want a snack outside of my dorm or residence.H is where I usually go to exercise.I is where I feel least safe on-campus.J is my favorite building on-campus.
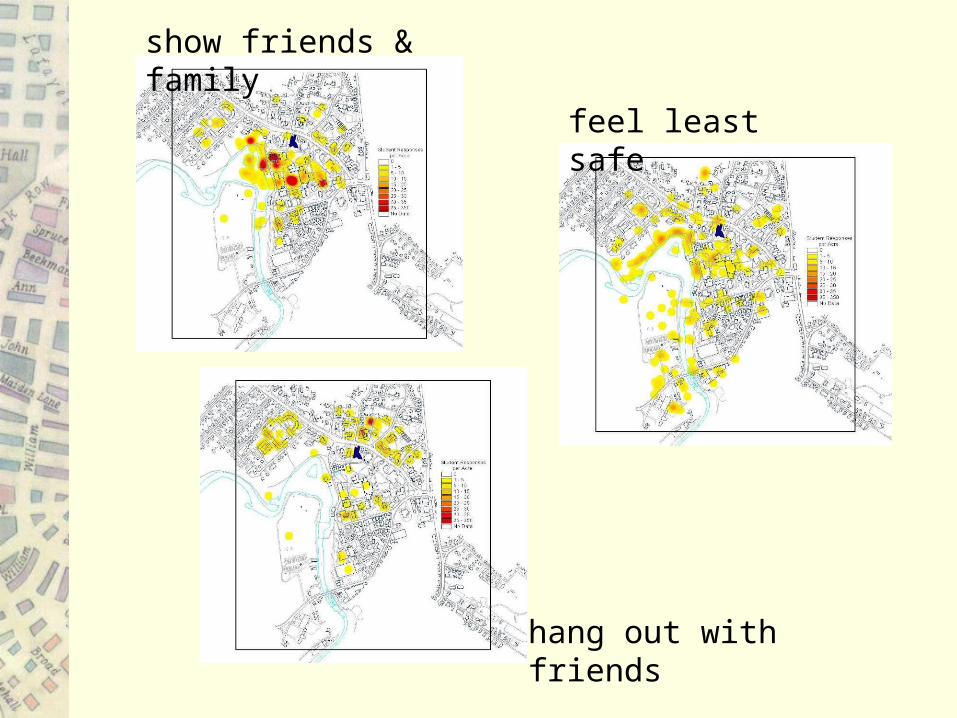
show friends & family
feel least safe
hang out with friends