Embed Size (px)
Citation preview
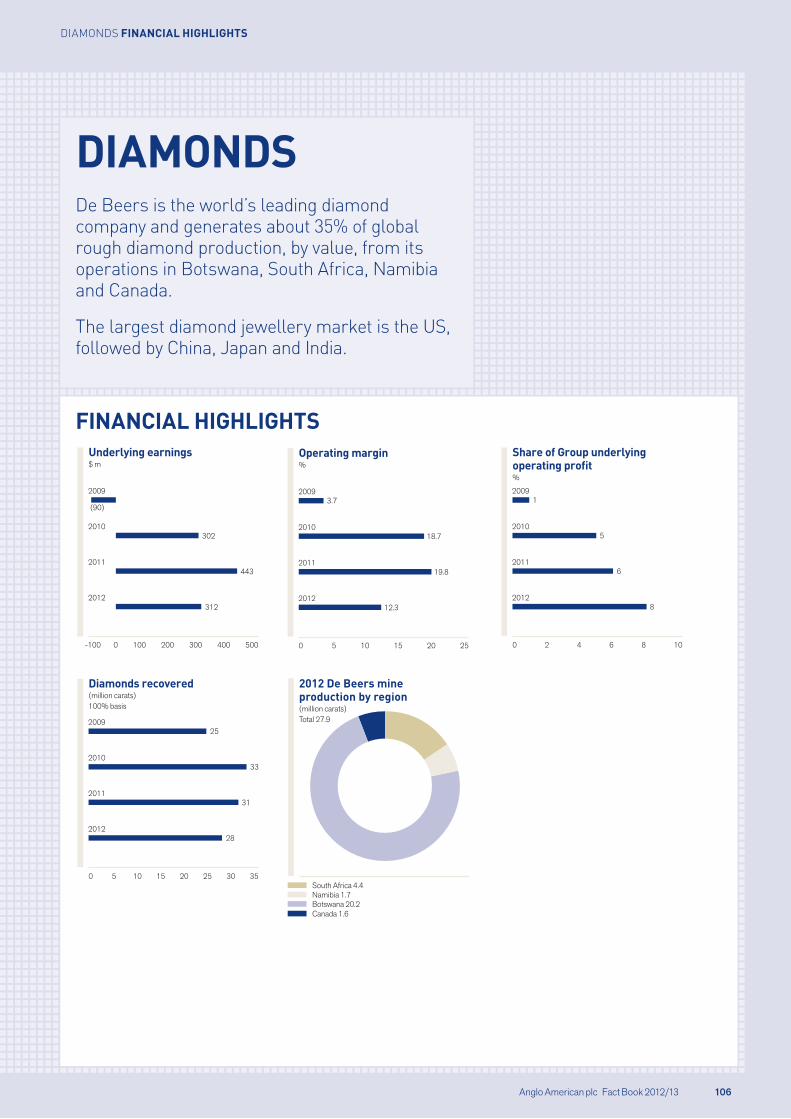
DIAMONDSDe Beers is the world’s leading diamond company and generates about 35% of global rough diamond production, by value, from its operations in Botswana, South Africa, Namibia and Canada.
The largest diamond jewellery market is the US, followed by China, Japan and India.
FINANCIAL HIGHLIGHTS
-100 0 100 200 400300 500
2012
2011
2010
2009
Underlying earnings $ m
(90)
302
443
312
0 5 10 15 2520
2012
2011
2010
2009
Operating margin%
3.7
18.7
19.8
12.3
Namibia 1.7South Africa 4.4
Canada 1.6Botswana 20.2
2012 De Beers mine production by region (million carats)Total 27.9
0 2 4 6 108
2012
2011
2010
2009
Share of Group underlyingoperating profit%
1
5
6
8
0 105 15 2520 3530
2012
2011
2010
2009
Diamonds recovered(million carats) 100% basis
25
33
31
28
Anglo American plc Fact Book 2012/13 106
DIAMONDS FINANCIAL HIGHLIGHTS
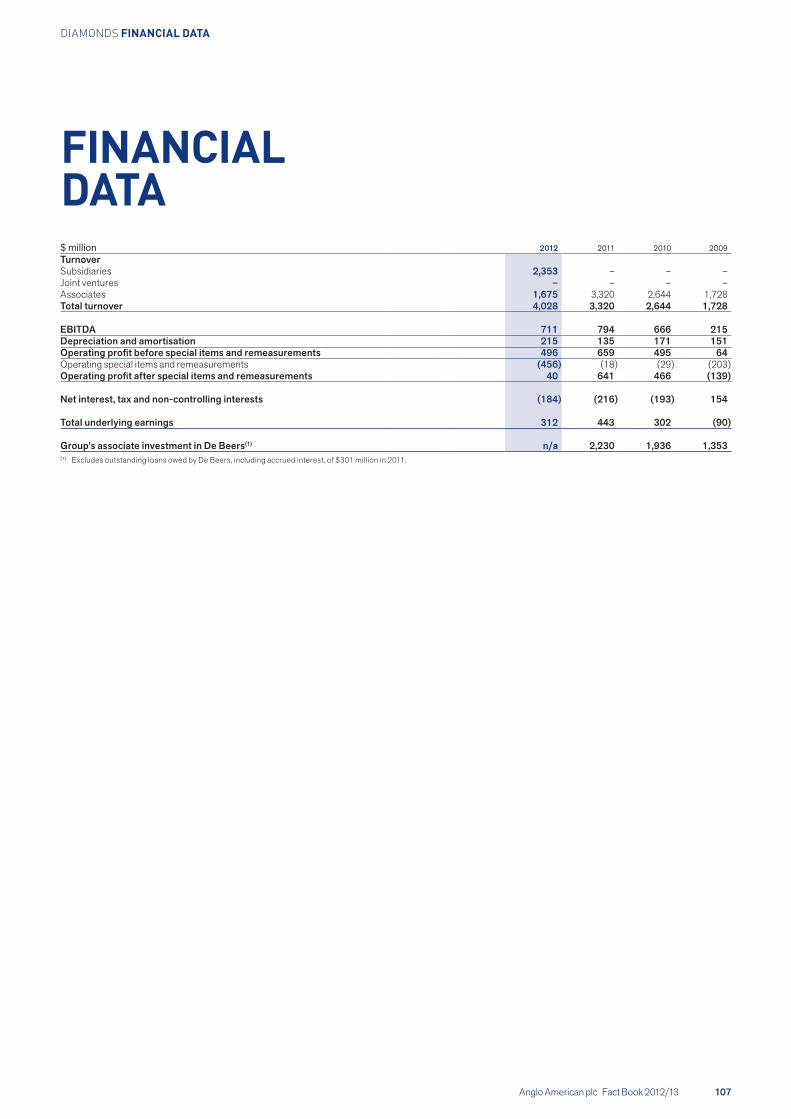
FINANCIAL DATA$ million 2012 2011 2010 2009TurnoverSubsidiaries 2,353 – – –Joint ventures – – – –Associates 1,675 3,320 2,644 1,728Total turnover 4,028 3,320 2,644 1,728
EBITDA 711 794 666 215Depreciation and amortisation 215 135 171 151Operating profit before special items and remeasurements 496 659 495 64Operating special items and remeasurements (456) (18) (29) (203)Operating profit after special items and remeasurements 40 641 466 (139)
Net interest, tax and non-controlling interests (184) (216) (193) 154
Total underlying earnings 312 443 302 (90)
Group’s associate investment in De Beers(1) n/a 2,230 1,936 1,353(1) Excludes outstanding loans owed by De Beers, including accrued interest, of $301 million in 2011.
Anglo American plc Fact Book 2012/13 107
DIAMONDS FINANCIAL DATA
BUSINESSOVERVIEWUNDERLYING OPERATING PROFIT(2011: $659 m)
$496 mSHARE OF GROUP UNDERLYING OPERATING PROFIT
8%UNDERLYING EBITDA(2011: $794 m)
$711m
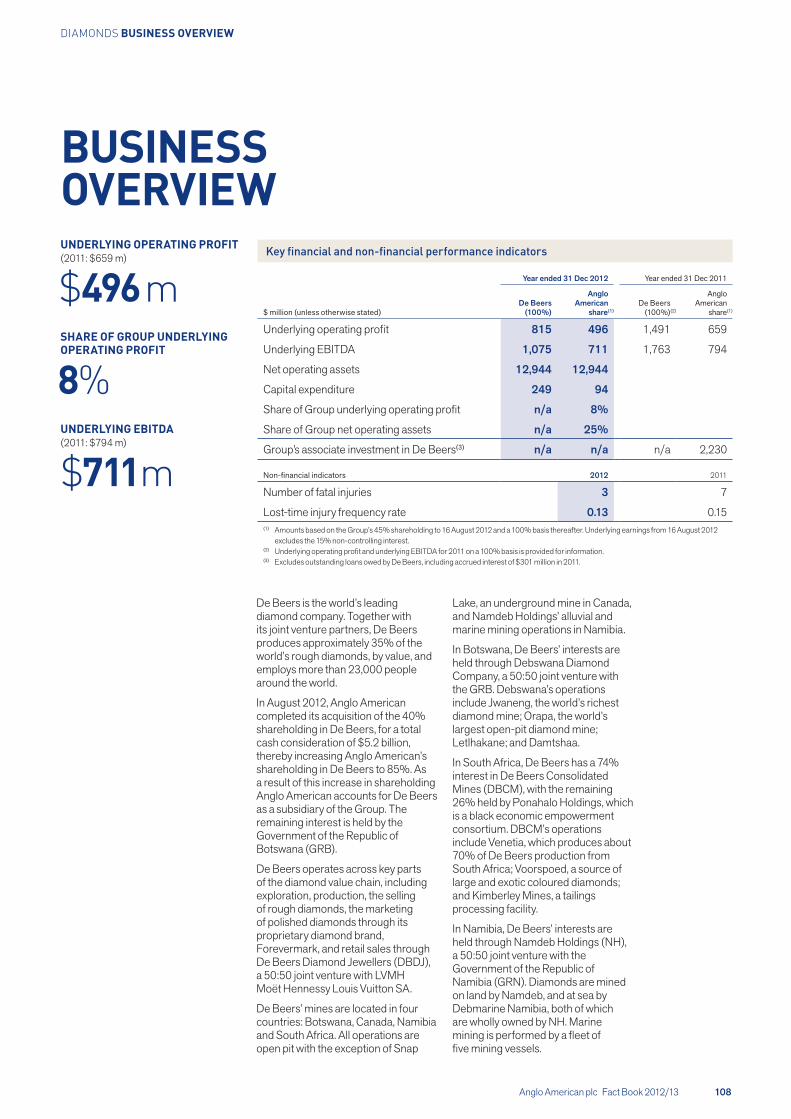
Key financial and non-financial performance indicators
Year ended 31 Dec 2012 Year ended 31 Dec 2011
$ million (unless otherwise stated)De Beers
(100%)
Anglo American
share(1)De Beers
(100%)(2)
Anglo American
share(1)
Underlying operating profit 815 496 1,491 659
Underlying EBITDA 1,075 711 1,763 794
Net operating assets 12,944 12,944
Capital expenditure 249 94
Share of Group underlying operating profit n/a 8%
Share of Group net operating assets n/a 25%
Group’s associate investment in De Beers(3) n/a n/a n/a 2,230
Non-financial indicators 2012 2011
Number of fatal injuries 3 7
Lost-time injury frequency rate 0.13 0.15(1) Amounts based on the Group’s 45% shareholding to 16 August 2012 and a 100% basis thereafter. Underlying earnings from 16 August 2012
excludes the 15% non-controlling interest.(2) Underlying operating profit and underlying EBITDA for 2011 on a 100% basis is provided for information.(3) Excludes outstanding loans owed by De Beers, including accrued interest of $301 million in 2011.
De Beers is the world’s leading diamond company. Together with its joint venture partners, De Beers produces approximately 35% of the world’s rough diamonds, by value, and employs more than 23,000 people around the world.
In August 2012, Anglo American completed its acquisition of the 40% shareholding in De Beers, for a total cash consideration of $5.2 billion, thereby increasing Anglo American’s shareholding in De Beers to 85%. As a result of this increase in shareholding Anglo American accounts for De Beers as a subsidiary of the Group. The remaining interest is held by the Government of the Republic of Botswana (GRB).
De Beers operates across key parts of the diamond value chain, including exploration, production, the selling of rough diamonds, the marketing of polished diamonds through its proprietary diamond brand, Forevermark, and retail sales through De Beers Diamond Jewellers (DBDJ), a 50:50 joint venture with LVMH Moët Hennessy Louis Vuitton SA.
De Beers’ mines are located in four countries: Botswana, Canada, Namibia and South Africa. All operations are open pit with the exception of Snap
Lake, an underground mine in Canada, and Namdeb Holdings’ alluvial and marine mining operations in Namibia.
In Botswana, De Beers’ interests are held through Debswana Diamond Company, a 50:50 joint venture with the GRB. Debswana’s operations include Jwaneng, the world’s richest diamond mine; Orapa, the world’s largest open-pit diamond mine; Letlhakane; and Damtshaa.
In South Africa, De Beers has a 74% interest in De Beers Consolidated Mines (DBCM), with the remaining 26% held by Ponahalo Holdings, which is a black economic empowerment consortium. DBCM’s operations include Venetia, which produces about 70% of De Beers production from South Africa; Voorspoed, a source of large and exotic coloured diamonds; and Kimberley Mines, a tailings processing facility.
In Namibia, De Beers’ interests are held through Namdeb Holdings (NH), a 50:50 joint venture with the Government of the Republic of Namibia (GRN). Diamonds are mined on land by Namdeb, and at sea by Debmarine Namibia, both of which are wholly owned by NH. Marine mining is performed by a fleet of five mining vessels.
Anglo American plc Fact Book 2012/13 108
DIAMONDS BUSINESS OVERVIEW
BUSINESSOVERVIEW continued
In Canada, De Beers wholly owns its two mining operations; Victor, located in Northern Ontario; and Snap Lake, in the Northwest Territories. De Beers also has a 51% shareholding in a joint venture in Gahcho Kué, a project in the vicinity of Snap Lake. The project is at an advanced permitting stage. When operational, Gahcho Kué is expected to produce approximately 4.5 million carats per annum over a life of mine of 11 years.
De Beers sells rough diamonds through two distribution channels: over 90% is sold via long term contract sales to clients (known as Sightholders), with the remainder being sold via regular auctions. De Beers is also an equal joint venture partner in DTC Botswana and in Namibia DTC with the GRB and GRN, respectively. The local companies facilitate local sales and beneficiation, and are intermediaries in the global selling function.
As part of its long term contract sales, De Beers sorts and values production into 14,000 price points. These diamonds are aggregated and sold to Sightholders at one of 10 Sights each year.
De Beers is a global leader in the use of innovative online systems to auction rough, uncut diamonds to small, mid-tier and large manufacturing, retailing and trading businesses.
De Beers participates at the polished end of the value chain through its proprietary diamond brand, Forevermark, and, at the retail end, through DBDJ.
Diamonds inscribed as Forevermark provide consumers with confidence that their diamonds are beautiful, rare and responsibly sourced. They are available in carefully selected, authorised jewellers in the major consumer markets around the world.
DBDJ’s high-end retail stores are located in the most fashionable areas in the world, including New York, Beijing, Hong Kong, London, Paris, Tokyo and Dubai.
Element Six is the global leader in the design, development and production of synthetic diamond supermaterials for a range of applications. It comprises two businesses: Technologies which is wholly owned; and Abrasives, in which De Beers has a 60% interest (Umicore SA hold the remaining 40%).
Anglo American plc Fact Book 2012/13 109
DIAMONDS BUSINESS OVERVIEW
Botswana
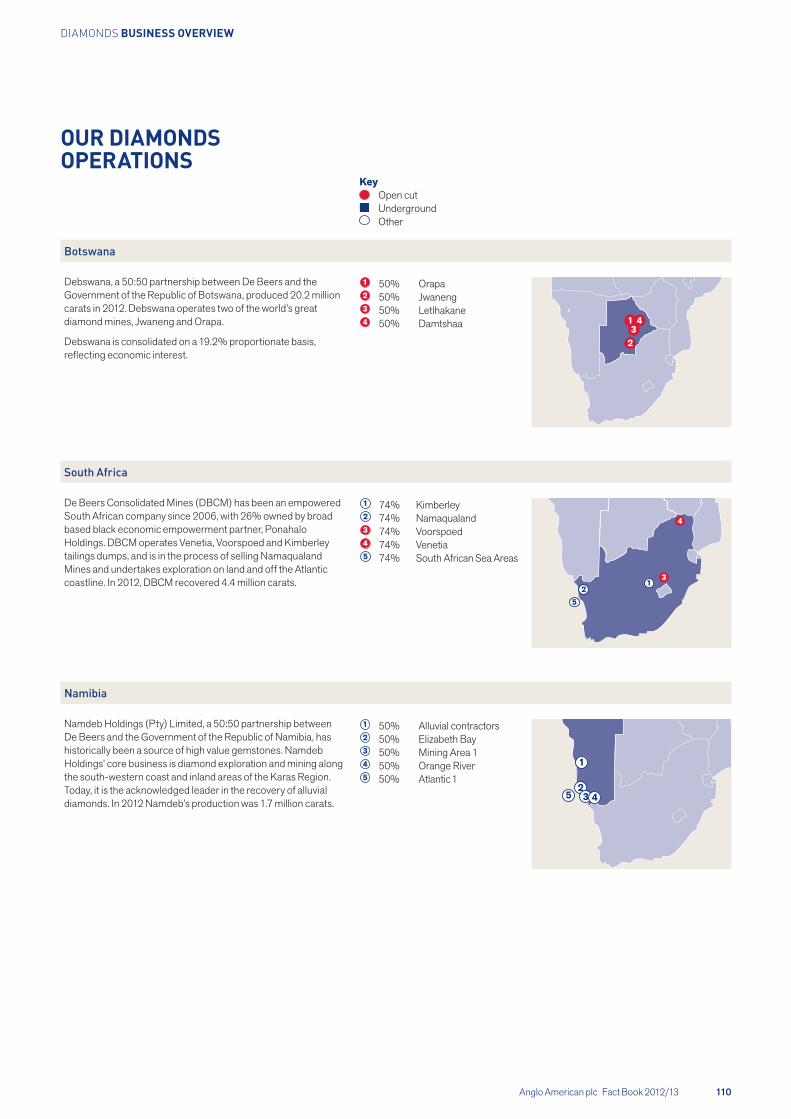
Debswana, a 50:50 partnership between De Beers and the Government of the Republic of Botswana, produced 20.2 million carats in 2012. Debswana operates two of the world’s great diamond mines, Jwaneng and Orapa.
Debswana is consolidated on a 19.2% proportionate basis, reflecting economic interest.
1 50% Orapa 2 50% Jwaneng3 50% Letlhakane 4 50% Damtshaa 41
23
South Africa
De Beers Consolidated Mines (DBCM) has been an empowered South African company since 2006, with 26% owned by broad based black economic empowerment partner, Ponahalo Holdings. DBCM operates Venetia, Voorspoed and Kimberley tailings dumps, and is in the process of selling Namaqualand Mines and undertakes exploration on land and off the Atlantic coastline. In 2012, DBCM recovered 4.4 million carats.
1 74% Kimberley 2 74% Namaqualand3 74% Voorspoed 4 74% Venetia5 74% South African Sea Areas
12
5
3
4
Namibia
Namdeb Holdings (Pty) Limited, a 50:50 partnership between De Beers and the Government of the Republic of Namibia, has historically been a source of high value gemstones. Namdeb Holdings’ core business is diamond exploration and mining along the south-western coast and inland areas of the Karas Region. Today, it is the acknowledged leader in the recovery of alluvial diamonds. In 2012 Namdeb’s production was 1.7 million carats.
1 50% Alluvial contractors 2 50% Elizabeth Bay 3 50% Mining Area 1 4 50% Orange River 5 50% Atlantic 1
1
23 45
Key Open cut Underground Other
Anglo American plc Fact Book 2012/13 110
DIAMONDS BUSINESS OVERVIEW
OUR DIAMONDS OPERATIONS
Canada
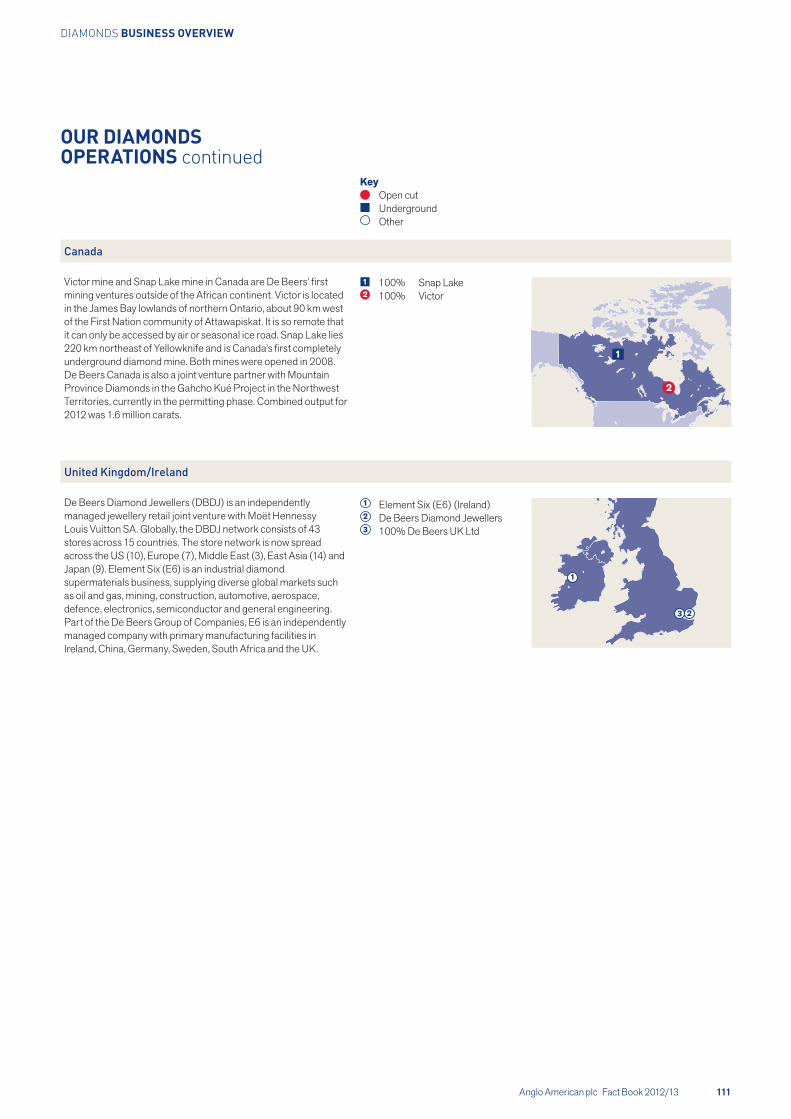
Victor mine and Snap Lake mine in Canada are De Beers’ first mining ventures outside of the African continent. Victor is located in the James Bay lowlands of northern Ontario, about 90 km west of the First Nation community of Attawapiskat. It is so remote that it can only be accessed by air or seasonal ice road. Snap Lake lies 220 km northeast of Yellowknife and is Canada’s first completely underground diamond mine. Both mines were opened in 2008. De Beers Canada is also a joint venture partner with Mountain Province Diamonds in the Gahcho Kué Project in the Northwest Territories, currently in the permitting phase. Combined output for 2012 was 1.6 million carats.
1 100% Snap Lake 2 100% Victor
2
1
United Kingdom/Ireland
De Beers Diamond Jewellers (DBDJ) is an independently managed jewellery retail joint venture with Moët Hennessy Louis Vuitton SA. Globally, the DBDJ network consists of 43 stores across 15 countries. The store network is now spread across the US (10), Europe (7), Middle East (3), East Asia (14) and Japan (9). Element Six (E6) is an industrial diamond supermaterials business, supplying diverse global markets such as oil and gas, mining, construction, automotive, aerospace, defence, electronics, semiconductor and general engineering. Part of the De Beers Group of Companies, E6 is an independently managed company with primary manufacturing facilities in Ireland, China, Germany, Sweden, South Africa and the UK.
1 Element Six (E6) (Ireland) 2 De Beers Diamond Jewellers3 100% De Beers UK Ltd
1
23
Key Open cut Underground Other
Anglo American plc Fact Book 2012/13 111
DIAMONDS BUSINESS OVERVIEW
OUR DIAMONDS OPERATIONS continued
Around 60% of the world’s diamonds, by value, originate from south and central Africa, with significant sources also found in Russia, Australia and Canada.
Most diamonds come from the mining of kimberlite deposits. Another important source of gem diamonds, however, has been secondary alluvial deposits formed by the weathering of primary kimberlites and the subsequent deposition of released diamonds in rivers and beach gravels.
Rough or uncut diamonds are broadly classified either as gem or industrial quality, with gem being overwhelmingly the larger of the two markets by value. The primary world market for gem diamonds is retail jewellery, where aspects such as size, colour, shape and clarity have a large impact on valuation.
MarketsDemand for diamond jewellery in the key markets of the US, China and Japan grew, albeit at a slower pace than in 2011, with demand from India remaining broadly flat. This, together with higher polished stock levels, resulted in a decline in polished prices particularly in the third quarter of the year. Although rough diamond prices remained broadly stable in the first half of 2012, a combination of weaker polished prices, high levels of cutting centre stock and tightening liquidity in the mid-stream, resulted in a price correction during the third quarter. By the end of 2012, rough diamond prices stabilised, reflecting a modest improvement in consumer demand during the holiday sales season in most major diamond jewellery markets.
Operating performanceMining and manufacturingDe Beers’ full-year production declined by 11% to 27.9 million carats (2011: 31.3 million carats). In light of prevailing diamond market trends, as well as operational challenges, the company’s stated strategy of producing to demand has been maintained. Operations continue to focus on maintenance and waste stripping backlogs, while a number of factors impacted production at specific sites. At Debswana, this included the Jwaneng Mine slope failure in June. DBCM saw lower grades from Venetia, and production was also impacted by
INDUSTRYOVERVIEW
the disposal of Finsch in September 2011. Canada’s Snap Lake showed significant improvement during 2012 as work continues on optimising the mine to enable economic access to the promising, though challenging, orebody.
Debmarine Namibia’s Grand Banks mining vessel was re-commissioned in 2012 and Namdeb’s Elizabeth Bay mining area was brought back into operation during the year.
Element Six experienced a challenging year, with weakness in a number of key end-markets, particularly in the second half of the year. In response, Element Six focused on cost containment and improved operational performance and made significant progress on a number of its strategic milestones, including improved customer service and innovation.
SalesDe Beers’ total sales decreased to $6.1 billion (100% basis), primarily as a result of diminished demand for rough diamonds, changing product requirements from Sightholders and reduced availability of some goods.
BrandsForevermark continued to grow strongly in 2012, particularly in the core markets of China, Japan, India and the
US, and was launched in South Africa, Canada and the UAE. It is now available in more than 900 retail partners in 12 markets. Since the launch of Forevermark, more than 500,000 diamonds have been inscribed with a unique identification number showing that they have met the brand’s high standards of quality, ethical integrity and provenance.
DBDJ faced the challenging market conditions experienced by most high-end jewellers in 2012, but continued to focus on expanding its store network in China, a market of significant opportunity for high-end jewellery brands. New stores were opened in Shanghai and Nanjing, giving DBDJ five stores in China, with an additional store scheduled to open in 2013. Franchise partners will open further stores in Kuala Lumpur, Baku and Vancouver in 2013. DBDJ currently has 43 stores in leading diamond consumer markets around the world.
OtherThe agreement entered into by De Beers in the US in 2006 to settle all outstanding class actions against it became unconditional and effective in May. The $295 million settlement, plus interest, held in escrow since 2006 is now being distributed in accordance with the court ordered plan.
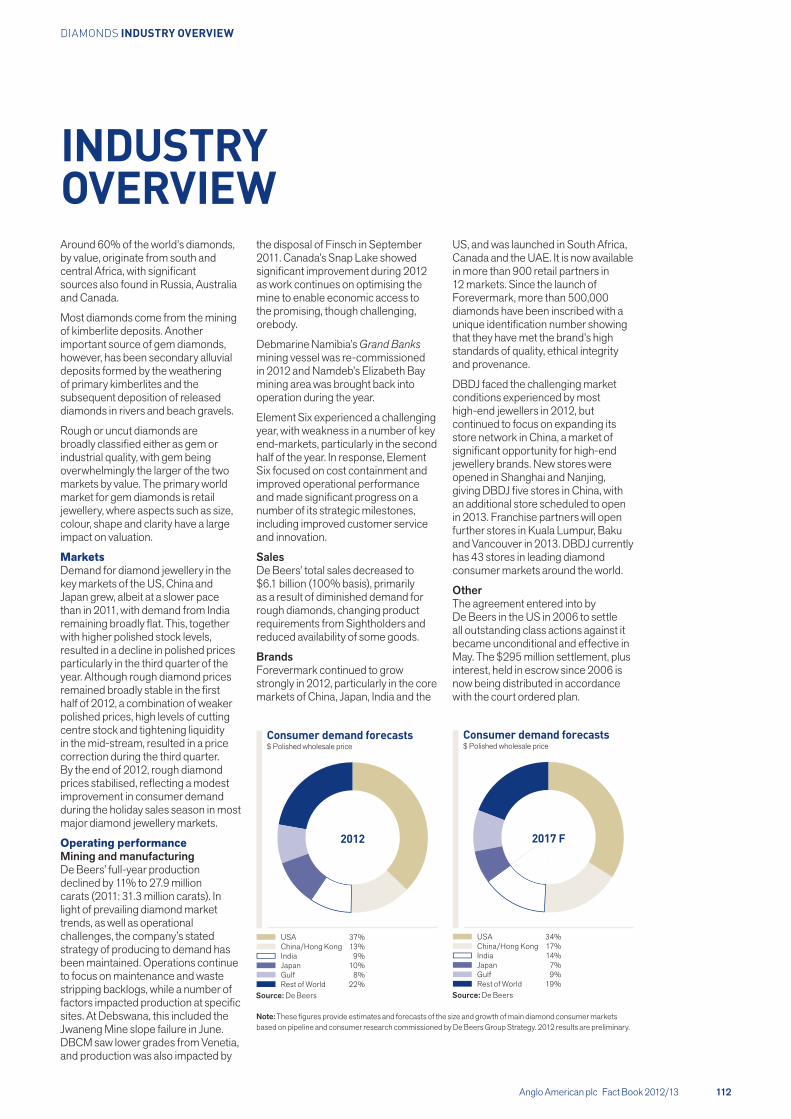
Consumer demand forecasts $ Polished wholesale price
USA 37%China/Hong Kong 13%India 9%Japan 10%Gulf 8%Rest of World 22%
Source: De Beers
2012
Consumer demand forecasts $ Polished wholesale price
2017 F
USA 34%China/Hong Kong 17%India 14%Japan 7%Gulf 9%Rest of World 19%
Source: De Beers
Note: These figures provide estimates and forecasts of the size and growth of main diamond consumer markets based on pipeline and consumer research commissioned by De Beers Group Strategy. 2012 results are preliminary.
Anglo American plc Fact Book 2012/13 112
DIAMONDS INDUSTRY OVERVIEW
De Beers’ vision is to unlock the full economic value of its leadership position in the diamond industry.
De Beers is a demand-driven business, with a clear understanding that consumer desire is the overwhelming source of value for its diamonds. With growth in demand for diamonds expected to outstrip production growth in the medium to long term, the company aims to maximise the value of every carat mined, sorted and sold. To achieve this objective, De Beers focuses on optimising the value of its mining assets, selling to selected leading diamantaires and offering consumers the integrity and confidence of its brands.
STRATEGY
Anglo American plc Fact Book 2012/13 113
DIAMONDS STRATEGY
PROJECT PIPELINE – KEY PROJECTS
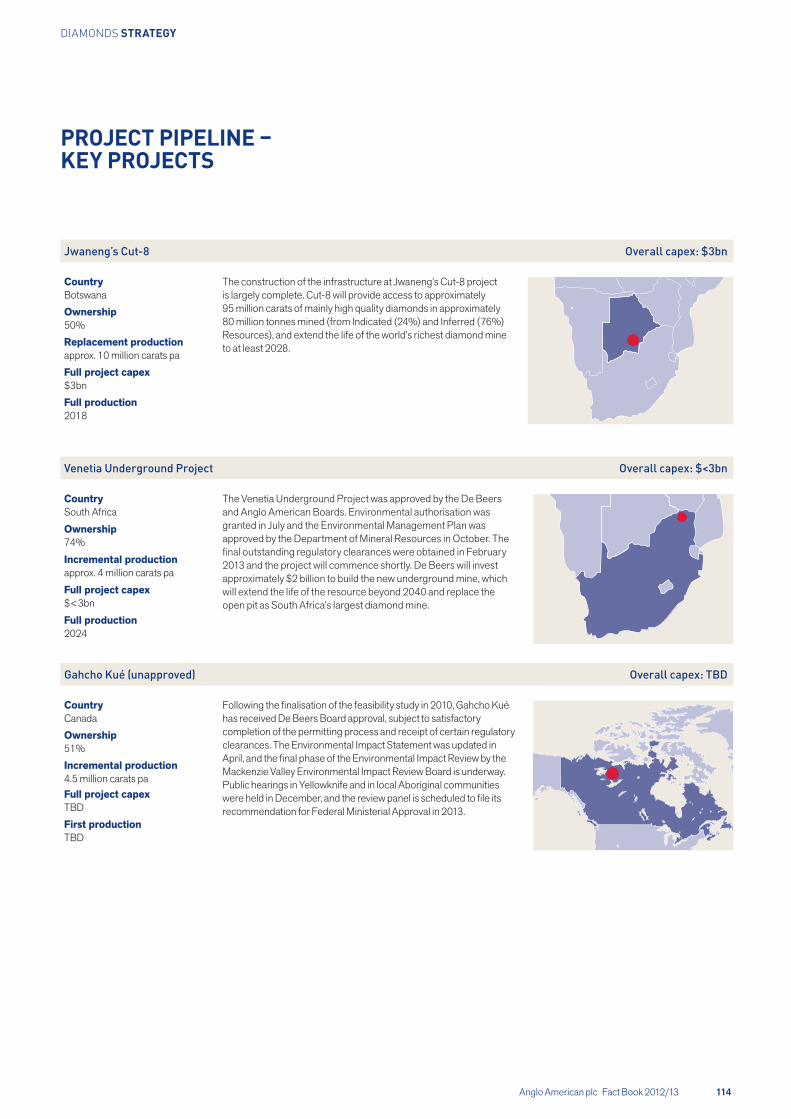
Jwaneng’s Cut-8 Overall capex: $3bn
CountryBotswana
The construction of the infrastructure at Jwaneng’s Cut-8 project is largely complete. Cut-8 will provide access to approximately 95 million carats of mainly high quality diamonds in approximately 80 million tonnes mined (from Indicated (24%) and Inferred (76%) Resources), and extend the life of the world’s richest diamond mine to at least 2028.
Ownership50%Replacement productionapprox. 10 million carats paFull project capex$3bnFull production2018
Venetia Underground Project Overall capex: $<3bn
CountrySouth Africa
Ownership74%
Incremental productionapprox. 4 million carats pa
Full project capex$<3bn
Full production2024
The Venetia Underground Project was approved by the De Beers and Anglo American Boards. Environmental authorisation was granted in July and the Environmental Management Plan was approved by the Department of Mineral Resources in October. The final outstanding regulatory clearances were obtained in February 2013 and the project will commence shortly. De Beers will invest approximately $2 billion to build the new underground mine, which will extend the life of the resource beyond 2040 and replace the open pit as South Africa’s largest diamond mine.
Gahcho Kué (unapproved) Overall capex: TBD
CountryCanada
Following the finalisation of the feasibility study in 2010, Gahcho Kué has received De Beers Board approval, subject to satisfactory completion of the permitting process and receipt of certain regulatory clearances. The Environmental Impact Statement was updated in April, and the final phase of the Environmental Impact Review by the Mackenzie Valley Environmental Impact Review Board is underway. Public hearings in Yellowknife and in local Aboriginal communities were held in December, and the review panel is scheduled to file its recommendation for Federal Ministerial Approval in 2013.
Ownership51%Incremental production4.5 million carats paFull project capexTBDFirst productionTBD
Anglo American plc Fact Book 2012/13 114
DIAMONDS STRATEGY
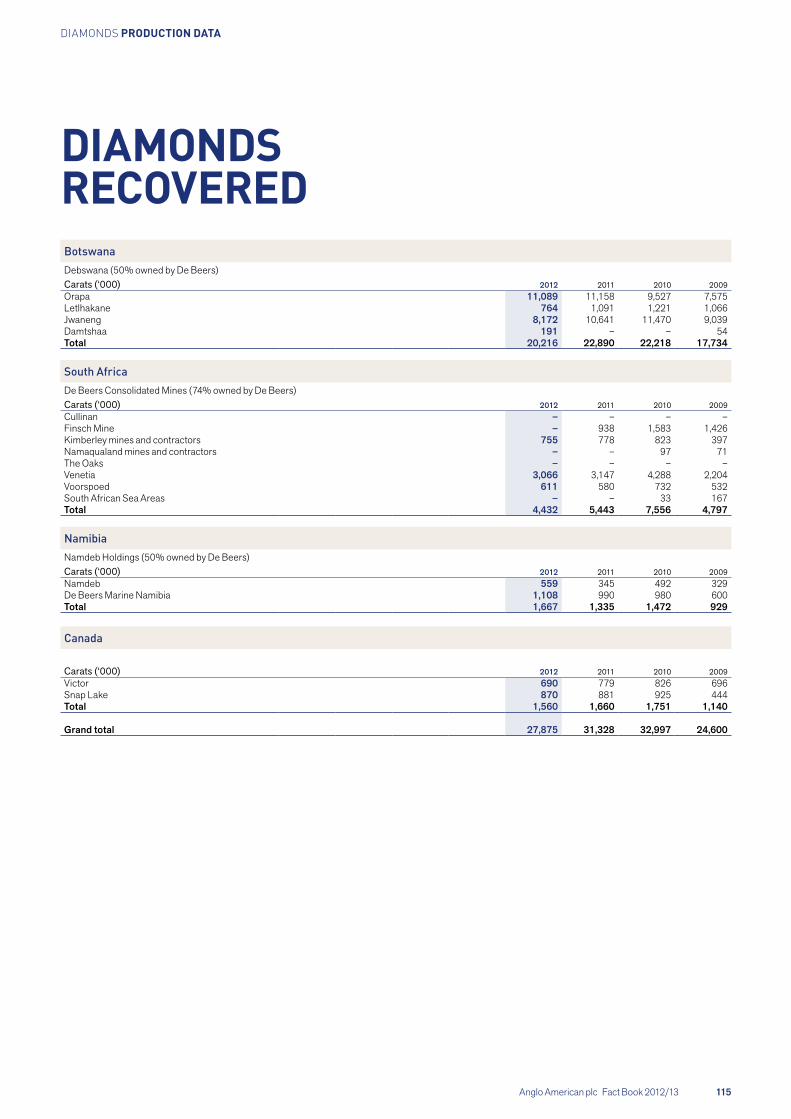
DIAMONDS RECOVEREDBotswanaDebswana (50% owned by De Beers)Carats (‘000) 2012 2011 2010 2009Orapa 11,089 11,158 9,527 7,575Letlhakane 764 1,091 1,221 1,066Jwaneng 8,172 10,641 11,470 9,039Damtshaa 191 – – 54Total 20,216 22,890 22,218 17,734
South AfricaDe Beers Consolidated Mines (74% owned by De Beers)Carats (‘000) 2012 2011 2010 2009Cullinan – – – –Finsch Mine – 938 1,583 1,426Kimberley mines and contractors 755 778 823 397Namaqualand mines and contractors – – 97 71The Oaks – – – –Venetia 3,066 3,147 4,288 2,204Voorspoed 611 580 732 532South African Sea Areas – – 33 167Total 4,432 5,443 7,556 4,797
NamibiaNamdeb Holdings (50% owned by De Beers)Carats (‘000) 2012 2011 2010 2009Namdeb 559 345 492 329De Beers Marine Namibia 1,108 990 980 600Total 1,667 1,335 1,472 929
Canada
Carats (‘000) 2012 2011 2010 2009Victor 690 779 826 696Snap Lake 870 881 925 444Total 1,560 1,660 1,751 1,140
Grand total 27,875 31,328 32,997 24,600
Anglo American plc Fact Book 2012/13 115
DiamonDs PRODUCTION DATA
Anglo American plc Fact Book 2012/13 116
DIAMONDS Diamond Reserve and Diamond Resource estimates as at 31 December 2012
DIAMONDS DIAMOND RESERVES AND DIAMOND RESOURCES
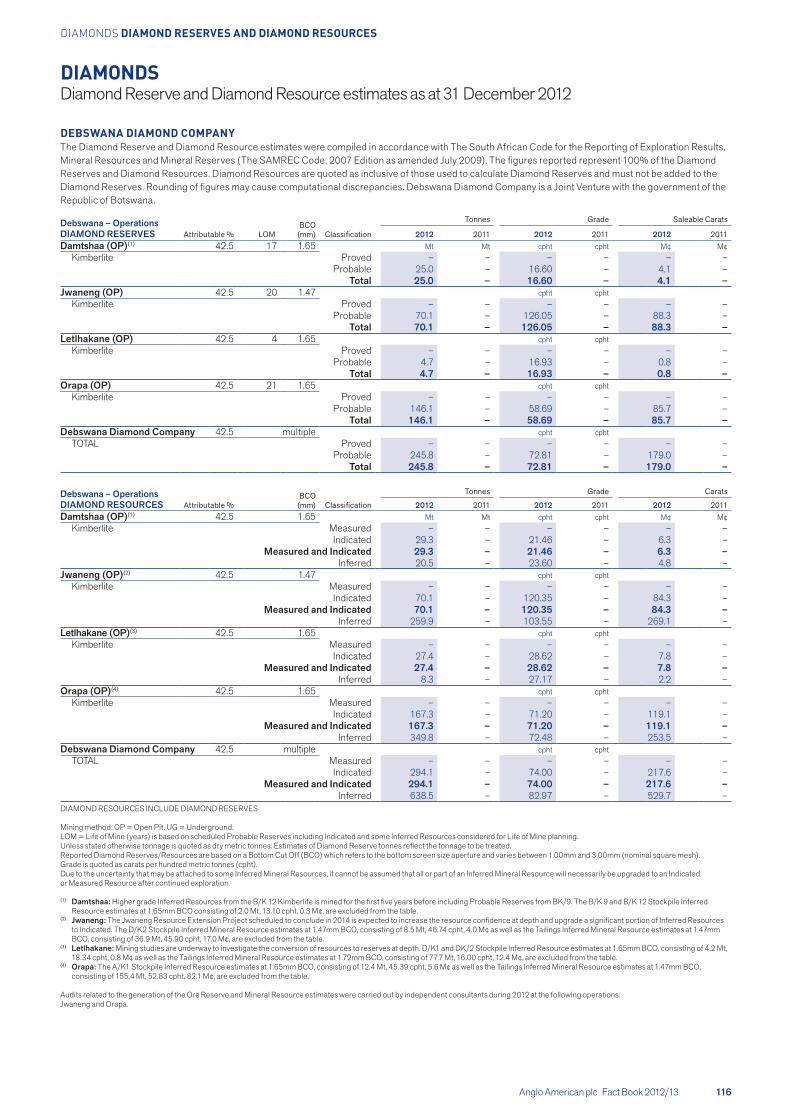
DEBSWANA DIAMOND COMPANYThe Diamond Reserve and Diamond Resource estimates were compiled in accordance with The South African Code for the Reporting of Exploration Results, Mineral Resources and Mineral Reserves (The SAMREC Code, 2007 Edition as amended July 2009). The figures reported represent 100% of the Diamond Reserves and Diamond Resources. Diamond Resources are quoted as inclusive of those used to calculate Diamond Reserves and must not be added to the Diamond Reserves. Rounding of figures may cause computational discrepancies. Debswana Diamond Company is a Joint Venture with the government of the Republic of Botswana.
Debswana – Operations LOM
BCO (mm)
Tonnes Grade Saleable Carats
Classification 2012 2011 2012 2011 2012 2011DIAMOND RESERVES Attributable %Damtshaa (OP)(1) 42.5 17 1.65 Mt Mt cpht cpht M¢ M¢
Kimberlite Proved – – – – – –Probable 25.0 – 16.60 – 4.1 –
Total 25.0 – 16.60 – 4.1 –Jwaneng (OP) 42.5 20 1.47 cpht cpht
Kimberlite Proved – – – – – –Probable 70.1 – 126.05 – 88.3 –
Total 70.1 – 126.05 – 88.3 –Letlhakane (OP) 42.5 4 1.65 cpht cpht
Kimberlite Proved – – – – – –Probable 4.7 – 16.93 – 0.8 –
Total 4.7 – 16.93 – 0.8 –Orapa (OP) 42.5 21 1.65 cpht cpht
Kimberlite Proved – – – – – –Probable 146.1 – 58.69 – 85.7 –
Total 146.1 – 58.69 – 85.7 –Debswana Diamond Company 42.5 multiple cpht cpht
TOTAL Proved – – – – – –Probable 245.8 – 72.81 – 179.0 –
Total 245.8 – 72.81 – 179.0 –
Debswana – Operations BCO (mm)
Tonnes Grade Carats
DIAMOND RESOURCES Attributable % Classification 2012 2011 2012 2011 2012 2011Damtshaa (OP)(1) 42.5 1.65 Mt Mt cpht cpht M¢ M¢
Kimberlite Measured – – – – – –Indicated 29.3 – 21.46 – 6.3 –
Measured and Indicated 29.3 – 21.46 – 6.3 –Inferred 20.5 – 23.60 – 4.8 –
Jwaneng (OP)(2) 42.5 1.47 cpht cphtKimberlite Measured – – – – – –
Indicated 70.1 – 120.35 – 84.3 –Measured and Indicated 70.1 – 120.35 – 84.3 –
Inferred 259.9 – 103.55 – 269.1 –Letlhakane (OP)(3) 42.5 1.65 cpht cpht
Kimberlite Measured – – – – – –Indicated 27.4 – 28.62 – 7.8 –
Measured and Indicated 27.4 – 28.62 – 7.8 –Inferred 8.3 – 27.17 – 2.2 –
Orapa (OP)(4) 42.5 1.65 cpht cphtKimberlite Measured – – – – – –
Indicated 167.3 – 71.20 – 119.1 –Measured and Indicated 167.3 – 71.20 – 119.1 –
Inferred 349.8 – 72.48 – 253.5 –Debswana Diamond Company 42.5 multiple cpht cpht
TOTAL Measured – – – – – –Indicated 294.1 – 74.00 – 217.6 –
Measured and Indicated 294.1 – 74.00 – 217.6 –Inferred 638.5 – 82.97 – 529.7 –
DIAMOND RESOURCES INCLUDE DIAMOND RESERVES Mining method: OP = Open Pit, UG = Underground. LOM = Life of Mine (years) is based on scheduled Probable Reserves including Indicated and some Inferred Resources considered for Life of Mine planning. Unless stated otherwise tonnage is quoted as dry metric tonnes. Estimates of Diamond Reserve tonnes reflect the tonnage to be treated. Reported Diamond Reserves/Resources are based on a Bottom Cut Off (BCO) which refers to the bottom screen size aperture and varies between 1.00mm and 3.00mm (nominal square mesh). Grade is quoted as carats per hundred metric tonnes (cpht). Due to the uncertainty that may be attached to some Inferred Mineral Resources, it cannot be assumed that all or part of an Inferred Mineral Resource will necessarily be upgraded to an Indicated or Measured Resource after continued exploration.
(1) Damtshaa: Higher grade Inferred Resources from the B/K 12 Kimberlite is mined for the first five years before including Probable Reserves from BK/9. The B/K 9 and B/K 12 Stockpile Inferred Resource estimates at 1.65mm BCO consisting of 2.0 Mt, 13.10 cpht, 0.3 M¢, are excluded from the table.
(2) Jwaneng: The Jwaneng Resource Extension Project scheduled to conclude in 2014 is expected to increase the resource confidence at depth and upgrade a significant portion of Inferred Resources to Indicated. The D/K2 Stockpile Inferred Mineral Resource estimates at 1.47mm BCO, consisting of 8.5 Mt, 46.74 cpht, 4.0 M¢ as well as the Tailings Inferred Mineral Resource estimates at 1.47mm BCO, consisting of 36.9 Mt, 45.90 cpht, 17.0 M¢, are excluded from the table.
(3) Letlhakane: Mining studies are underway to investigate the conversion of resources to reserves at depth. D/K1 and DK/2 Stockpile Inferred Resource estimates at 1.65mm BCO, consisting of 4.2 Mt, 18.34 cpht, 0.8 M¢ as well as the Tailings Inferred Mineral Resource estimates at 1.72mm BCO, consisting of 77.7 Mt, 16.00 cpht, 12.4 M¢, are excluded from the table.(4) Orapa: The A/K1 Stockpile Inferred Resource estimates at 1.65mm BCO, consisting of 12.4 Mt, 45.39 cpht, 5.6 M¢ as well as the Tailings Inferred Mineral Resource estimates at 1.47mm BCO, consisting of 155.4 Mt, 52.83 cpht, 82.1 M¢, are excluded from the table.
Audits related to the generation of the Ore Reserve and Mineral Resource estimates were carried out by independent consultants during 2012 at the following operations: Jwaneng and Orapa.
Anglo American plc Fact Book 2012/13 117
DIAMONDS Diamond Reserve and Diamond Resource estimates as at 31 December 2012
DIAMONDS DIAMOND RESERVES AND DIAMOND RESOURCES
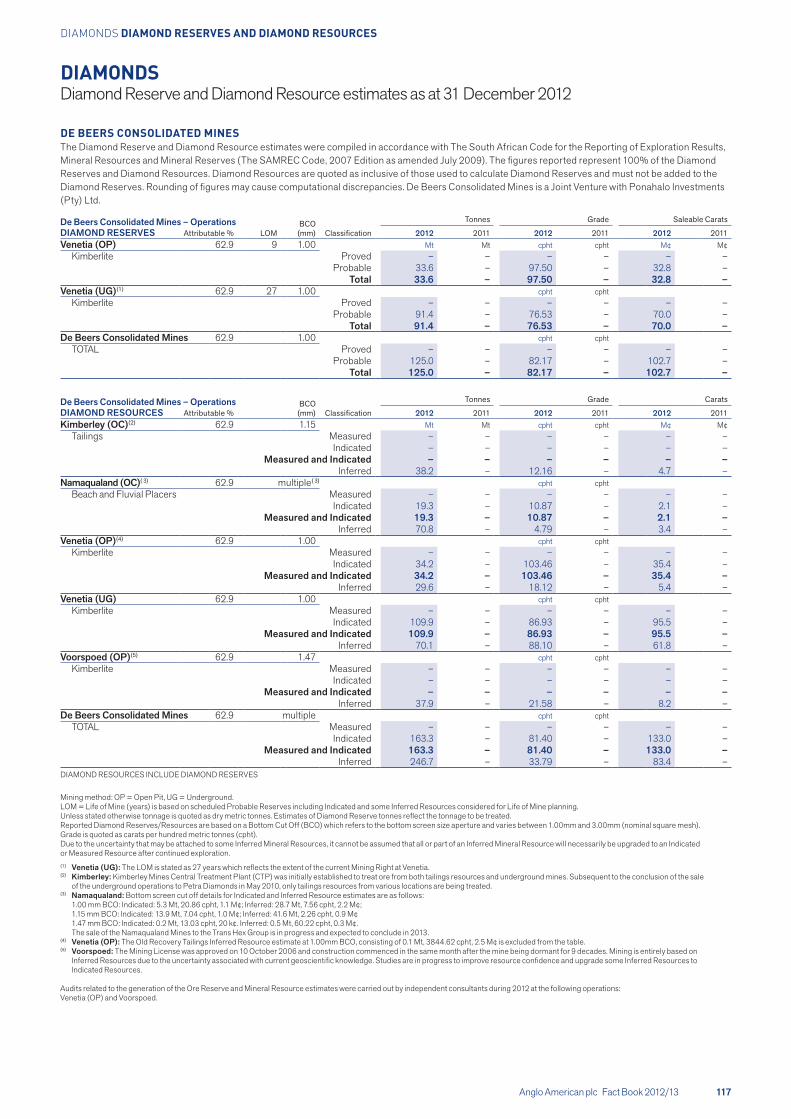
DE BEERS CONSOLIDATED MINESThe Diamond Reserve and Diamond Resource estimates were compiled in accordance with The South African Code for the Reporting of Exploration Results, Mineral Resources and Mineral Reserves (The SAMREC Code, 2007 Edition as amended July 2009). The figures reported represent 100% of the Diamond Reserves and Diamond Resources. Diamond Resources are quoted as inclusive of those used to calculate Diamond Reserves and must not be added to the Diamond Reserves. Rounding of figures may cause computational discrepancies. De Beers Consolidated Mines is a Joint Venture with Ponahalo Investments (Pty) Ltd.
Tonnes Grade Saleable CaratsDe Beers Consolidated Mines – Operations BCO (mm)DIAMOND RESERVES Attributable % LOM Classification 2012 2011 2012 2011 2012 2011
Venetia (OP) 62.9 9 1.00 Mt Mt cpht cpht M¢ M¢Kimberlite Proved – – – – – –
Probable 33.6 – 97.50 – 32.8 –Total 33.6 – 97.50 – 32.8 –
Venetia (UG)(1) 62.9 27 1.00 cpht cphtKimberlite Proved – – – – – –
Probable 91.4 – 76.53 – 70.0 –Total 91.4 – 76.53 – 70.0 –
De Beers Consolidated Mines 62.9 1.00 cpht cphtTOTAL Proved – – – – – –
Probable 125.0 – 82.17 – 102.7 –Total 125.0 – 82.17 – 102.7 –
De Beers Consolidated Mines – Operations BCO (mm)
Tonnes Grade Carats
DIAMOND RESOURCES Attributable % Classification 2012 2011 2012 2011 2012 2011Kimberley (OC)(2) 62.9 1.15 Mt Mt cpht cpht M¢ M¢
Tailings Measured – – – – – –Indicated – – – – – –
Measured and Indicated – – – – – –Inferred 38.2 – 12.16 – 4.7 –
Namaqualand (OC)( 3) 62.9 multiple( 3) cpht cphtBeach and Fluvial Placers Measured – – – – – –
Indicated 19.3 – 10.87 – 2.1 –Measured and Indicated 19.3 – 10.87 – 2.1 –
Inferred 70.8 – 4.79 – 3.4 –Venetia (OP)(4) 62.9 1.00 cpht cpht
Kimberlite Measured – – – – – –Indicated 34.2 – 103.46 – 35.4 –
Measured and Indicated 34.2 – 103.46 – 35.4 –Inferred 29.6 – 18.12 – 5.4 –
Venetia (UG) 62.9 1.00 cpht cphtKimberlite Measured – – – – – –
Indicated 109.9 – 86.93 – 95.5 –Measured and Indicated 109.9 – 86.93 – 95.5 –
Inferred 70.1 – 88.10 – 61.8 –Voorspoed (OP)(5) 62.9 1.47 cpht cpht
Kimberlite Measured – – – – – –Indicated – – – – – –
Measured and Indicated – – – – – –Inferred 37.9 – 21.58 – 8.2 –
De Beers Consolidated Mines 62.9 multiple cpht cphtTOTAL Measured – – – – – –
Indicated 163.3 – 81.40 – 133.0 –Measured and Indicated 163.3 – 81.40 – 133.0 –
Inferred 246.7 – 33.79 – 83.4 –DIAMOND RESOURCES INCLUDE DIAMOND RESERVES
Mining method: OP = Open Pit, UG = Underground. LOM = Life of Mine (years) is based on scheduled Probable Reserves including Indicated and some Inferred Resources considered for Life of Mine planning. Unless stated otherwise tonnage is quoted as dry metric tonnes. Estimates of Diamond Reserve tonnes reflect the tonnage to be treated. Reported Diamond Reserves/Resources are based on a Bottom Cut Off (BCO) which refers to the bottom screen size aperture and varies between 1.00mm and 3.00mm (nominal square mesh). Grade is quoted as carats per hundred metric tonnes (cpht). Due to the uncertainty that may be attached to some Inferred Mineral Resources, it cannot be assumed that all or part of an Inferred Mineral Resource will necessarily be upgraded to an Indicated or Measured Resource after continued exploration.(1) Venetia (UG): The LOM is stated as 27 years which reflects the extent of the current Mining Right at Venetia.(2) Kimberley: Kimberley Mines Central Treatment Plant (CTP) was initially established to treat ore from both tailings resources and underground mines. Subsequent to the conclusion of the sale of the underground operations to Petra Diamonds in May 2010, only tailings resources from various locations are being treated.(3) Namaqualand: Bottom screen cut off details for Indicated and Inferred Resource estimates are as follows:
1.00 mm BCO: Indicated: 5.3 Mt, 20.86 cpht, 1.1 M¢; Inferred: 28.7 Mt, 7.56 cpht, 2.2 M¢; 1.15 mm BCO: Indicated: 13.9 Mt, 7.04 cpht, 1.0 M¢; Inferred: 41.6 Mt, 2.26 cpht, 0.9 M¢ 1.47 mm BCO: Indicated: 0.2 Mt, 13.03 cpht, 20 k¢. Inferred: 0.5 Mt, 60.22 cpht, 0.3 M¢. The sale of the Namaqualand Mines to the Trans Hex Group is in progress and expected to conclude in 2013.
(4) Venetia (OP): The Old Recovery Tailings Inferred Resource estimate at 1.00mm BCO, consisting of 0.1 Mt, 3844.62 cpht, 2.5 M¢ is excluded from the table.(5) Voorspoed: The Mining License was approved on 10 October 2006 and construction commenced in the same month after the mine being dormant for 9 decades. Mining is entirely based on Inferred Resources due to the uncertainty associated with current geoscientific knowledge. Studies are in progress to improve resource confidence and upgrade some Inferred Resources to Indicated Resources. Audits related to the generation of the Ore Reserve and Mineral Resource estimates were carried out by independent consultants during 2012 at the following operations:Venetia (OP) and Voorspoed.
Anglo American plc Fact Book 2012/13 118
DIAMONDS Diamond Reserve and Diamond Resource estimates as at 31 December 2012
DIAMONDS DIAMOND RESERVES AND DIAMOND RESOURCES
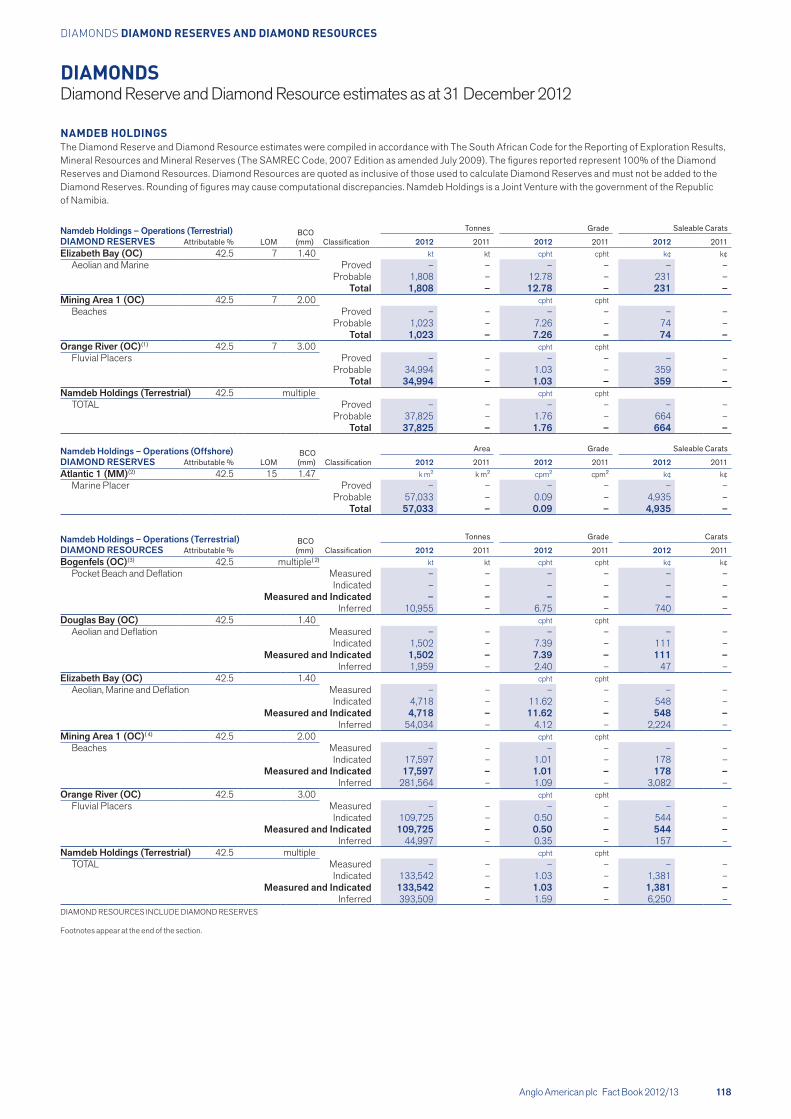
NAMDEB HOLDINGSThe Diamond Reserve and Diamond Resource estimates were compiled in accordance with The South African Code for the Reporting of Exploration Results, Mineral Resources and Mineral Reserves (The SAMREC Code, 2007 Edition as amended July 2009). The figures reported represent 100% of the Diamond Reserves and Diamond Resources. Diamond Resources are quoted as inclusive of those used to calculate Diamond Reserves and must not be added to the Diamond Reserves. Rounding of figures may cause computational discrepancies. Namdeb Holdings is a Joint Venture with the government of the Republic of Namibia.
Tonnes Grade Saleable CaratsNamdeb Holdings – Operations (Terrestrial) BCO (mm)DIAMOND RESERVES Attributable % LOM Classification 2012 2011 2012 2011 2012 2011
Elizabeth Bay (OC) 42.5 7 1.40 kt kt cpht cpht k¢ k¢Aeolian and Marine Proved – – – – – –
Probable 1,808 – 12.78 – 231 –Total 1,808 – 12.78 – 231 –
Mining Area 1 (OC) 42.5 7 2.00 cpht cphtBeaches Proved – – – – – –
Probable 1,023 – 7.26 – 74 –Total 1,023 – 7.26 – 74 –
Orange River (OC)(1) 42.5 7 3.00 cpht cphtFluvial Placers Proved – – – – – –
Probable 34,994 – 1.03 – 359 –Total 34,994 – 1.03 – 359 –
Namdeb Holdings (Terrestrial) 42.5 multiple cpht cphtTOTAL Proved – – – – – –
Probable 37,825 – 1.76 – 664 –Total 37,825 – 1.76 – 664 –
Namdeb Holdings – Operations (Offshore) BCO (mm)
Area Grade Saleable Carats
DIAMOND RESERVES Attributable % LOM Classification 2012 2011 2012 2011 2012 2011Atlantic 1 (MM)(2) 42.5 15 1.47 k m² k m² cpm² cpm² k¢ k¢
Marine Placer Proved – – – – – –Probable 57,033 – 0.09 – 4,935 –
Total 57,033 – 0.09 – 4,935 –
Namdeb Holdings – Operations (Terrestrial) BCO (mm)
Tonnes Grade Carats
DIAMOND RESOURCES Attributable % Classification 2012 2011 2012 2011 2012 2011Bogenfels (OC)(3) 42.5 multiple( 2) kt kt cpht cpht k¢ k¢
Pocket Beach and Deflation Measured – – – – – –Indicated – – – – – –
Measured and Indicated – – – – – –Inferred 10,955 – 6.75 – 740 –
Douglas Bay (OC) 42.5 1.40 cpht cphtAeolian and Deflation Measured – – – – – –
Indicated 1,502 – 7.39 – 111 –Measured and Indicated 1,502 – 7.39 – 111 –
Inferred 1,959 – 2.40 – 47 –Elizabeth Bay (OC) 42.5 1.40 cpht cpht
Aeolian, Marine and Deflation Measured – – – – – –Indicated 4,718 – 11.62 – 548 –
Measured and Indicated 4,718 – 11.62 – 548 –Inferred 54,034 – 4.12 – 2,224 –
Mining Area 1 (OC)( 4) 42.5 2.00 cpht cphtBeaches Measured – – – – – –
Indicated 17,597 – 1.01 – 178 –Measured and Indicated 17,597 – 1.01 – 178 –
Inferred 281,564 – 1.09 – 3,082 –Orange River (OC) 42.5 3.00 cpht cpht
Fluvial Placers Measured – – – – – –Indicated 109,725 – 0.50 – 544 –
Measured and Indicated 109,725 – 0.50 – 544 –Inferred 44,997 – 0.35 – 157 –
Namdeb Holdings (Terrestrial) 42.5 multiple cpht cphtTOTAL Measured – – – – – –
Indicated 133,542 – 1.03 – 1,381 –Measured and Indicated 133,542 – 1.03 – 1,381 –
Inferred 393,509 – 1.59 – 6,250 –DIAMOND RESOURCES INCLUDE DIAMOND RESERVES Footnotes appear at the end of the section.
Anglo American plc Fact Book 2012/13 119
DIAMONDS Diamond Reserve and Diamond Resource estimates as at 31 December 2012
DIAMONDS DIAMOND RESERVES AND DIAMOND RESOURCES
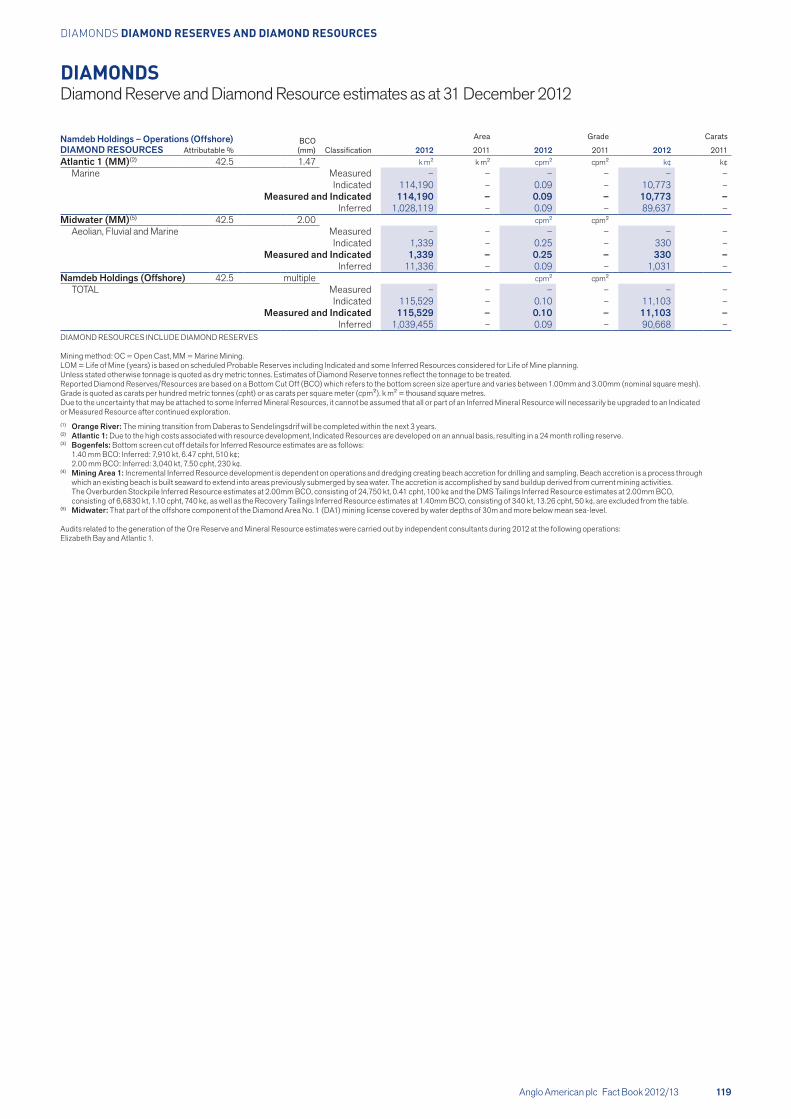
Namdeb Holdings – Operations (Offshore) BCO (mm)
Area Grade Carats
DIAMOND RESOURCES Attributable % Classification 2012 2011 2012 2011 2012 2011Atlantic 1 (MM)(2) 42.5 1.47 k m² k m² cpm² cpm² k¢ k¢
Marine Measured – – – – – –Indicated 114,190 – 0.09 – 10,773 –
Measured and Indicated 114,190 – 0.09 – 10,773 –Inferred 1,028,119 – 0.09 – 89,637 –
Midwater (MM)(5) 42.5 2.00 cpm² cpm²Aeolian, Fluvial and Marine Measured – – – – – –
Indicated 1,339 – 0.25 – 330 –Measured and Indicated 1,339 – 0.25 – 330 –
Inferred 11,336 – 0.09 – 1,031 –Namdeb Holdings (Offshore) 42.5 multiple cpm² cpm²
TOTAL Measured – – – – – –Indicated 115,529 – 0.10 – 11,103 –
Measured and Indicated 115,529 – 0.10 – 11,103 –Inferred 1,039,455 – 0.09 – 90,668 –
DIAMOND RESOURCES INCLUDE DIAMOND RESERVES Mining method: OC = Open Cast, MM = Marine Mining. LOM = Life of Mine (years) is based on scheduled Probable Reserves including Indicated and some Inferred Resources considered for Life of Mine planning. Unless stated otherwise tonnage is quoted as dry metric tonnes. Estimates of Diamond Reserve tonnes reflect the tonnage to be treated. Reported Diamond Reserves/Resources are based on a Bottom Cut Off (BCO) which refers to the bottom screen size aperture and varies between 1.00mm and 3.00mm (nominal square mesh). Grade is quoted as carats per hundred metric tonnes (cpht) or as carats per square meter (cpm²). k m² = thousand square metres. Due to the uncertainty that may be attached to some Inferred Mineral Resources, it cannot be assumed that all or part of an Inferred Mineral Resource will necessarily be upgraded to an Indicated or Measured Resource after continued exploration.(1) Orange River: The mining transition from Daberas to Sendelingsdrif will be completed within the next 3 years.(2) Atlantic 1: Due to the high costs associated with resource development, Indicated Resources are developed on an annual basis, resulting in a 24 month rolling reserve.(3) Bogenfels: Bottom screen cut off details for Inferred Resource estimates are as follows: 1.40 mm BCO: Inferred: 7,910 kt, 6.47 cpht, 510 k¢; 2.00 mm BCO: Inferred: 3,040 kt, 7.50 cpht, 230 k¢.(4) Mining Area 1: Incremental Inferred Resource development is dependent on operations and dredging creating beach accretion for drilling and sampling. Beach accretion is a process through which an existing beach is built seaward to extend into areas previously submerged by sea water. The accretion is accomplished by sand buildup derived from current mining activities. The Overburden Stockpile Inferred Resource estimates at 2.00mm BCO, consisting of 24,750 kt, 0.41 cpht, 100 k¢ and the DMS Tailings Inferred Resource estimates at 2.00mm BCO, consisting of 6,6830 kt, 1.10 cpht, 740 k¢, as well as the Recovery Tailings Inferred Resource estimates at 1.40mm BCO, consisting of 340 kt, 13.26 cpht, 50 k¢, are excluded from the table.(5) Midwater: That part of the offshore component of the Diamond Area No. 1 (DA1) mining license covered by water depths of 30m and more below mean sea-level.
Audits related to the generation of the Ore Reserve and Mineral Resource estimates were carried out by independent consultants during 2012 at the following operations: Elizabeth Bay and Atlantic 1.
Anglo American plc Fact Book 2012/13 120
DIAMONDS Diamond Reserve and Diamond Resource estimates as at 31 December 2012
DIAMONDS DIAMOND RESERVES AND DIAMOND RESOURCES
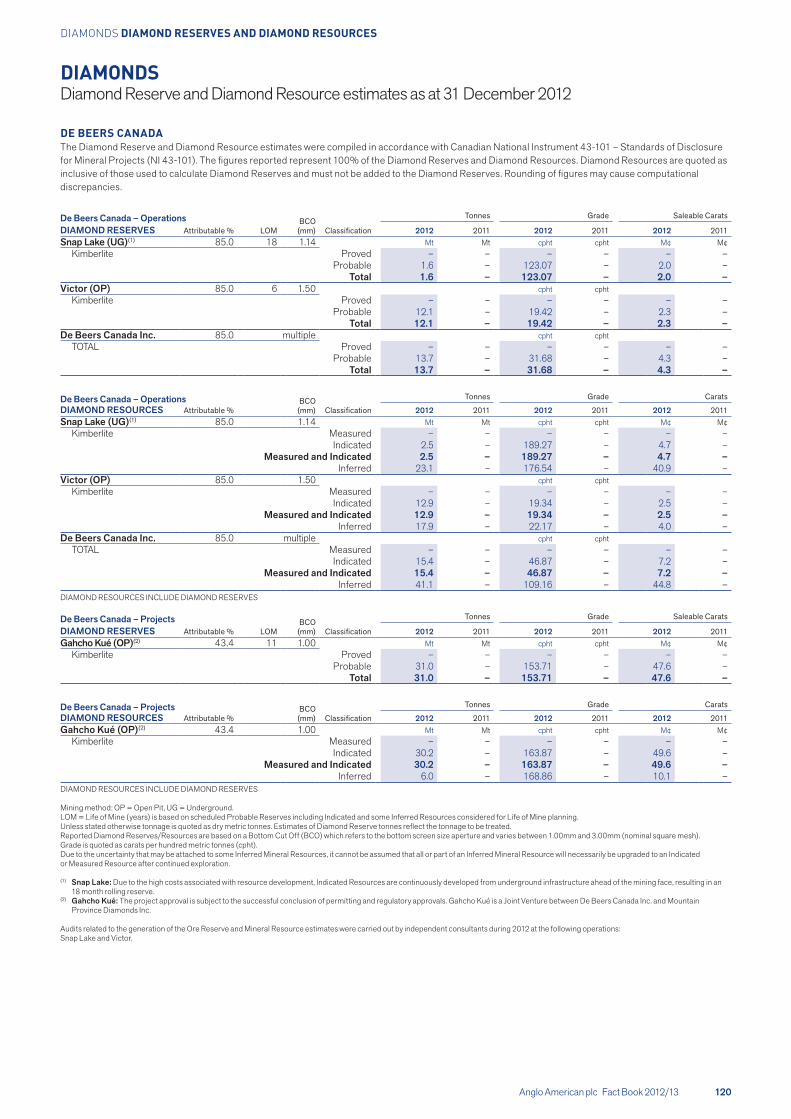
DE BEERS CANADAThe Diamond Reserve and Diamond Resource estimates were compiled in accordance with Canadian National Instrument 43-101 – Standards of Disclosure for Mineral Projects (NI 43-101). The figures reported represent 100% of the Diamond Reserves and Diamond Resources. Diamond Resources are quoted as inclusive of those used to calculate Diamond Reserves and must not be added to the Diamond Reserves. Rounding of figures may cause computational discrepancies.
De Beers Canada – OperationsLOM
BCO (mm)
Tonnes Grade Saleable Carats
DIAMOND RESERVES Attributable % Classification 2012 2011 2012 2011 2012 2011Snap Lake (UG)(1) 85.0 18 1.14 Mt Mt cpht cpht M¢ M¢
Kimberlite Proved – – – – – –Probable 1.6 – 123.07 – 2.0 –
Total 1.6 – 123.07 – 2.0 –Victor (OP) 85.0 6 1.50 cpht cpht
Kimberlite Proved – – – – – –Probable 12.1 – 19.42 – 2.3 –
Total 12.1 – 19.42 – 2.3 –De Beers Canada Inc. 85.0 multiple cpht cpht
TOTAL Proved – – – – – –Probable 13.7 – 31.68 – 4.3 –
Total 13.7 – 31.68 – 4.3 –
De Beers Canada – Operations BCO (mm)
Tonnes Grade Carats
DIAMOND RESOURCES Attributable % Classification 2012 2011 2012 2011 2012 2011Snap Lake (UG)(1) 85.0 1.14 Mt Mt cpht cpht M¢ M¢
Kimberlite Measured – – – – – –Indicated 2.5 – 189.27 – 4.7 –
Measured and Indicated 2.5 – 189.27 – 4.7 –Inferred 23.1 – 176.54 – 40.9 –
Victor (OP) 85.0 1.50 cpht cphtKimberlite Measured – – – – – –
Indicated 12.9 – 19.34 – 2.5 –Measured and Indicated 12.9 – 19.34 – 2.5 –
Inferred 17.9 – 22.17 – 4.0 –De Beers Canada Inc. 85.0 multiple cpht cpht
TOTAL Measured – – – – – –Indicated 15.4 – 46.87 – 7.2 –
Measured and Indicated 15.4 – 46.87 – 7.2 –Inferred 41.1 – 109.16 – 44.8 –
DIAMOND RESOURCES INCLUDE DIAMOND RESERVES
De Beers Canada – ProjectsLOM
BCO (mm)
Tonnes Grade Saleable Carats
DIAMOND RESERVES Attributable % Classification 2012 2011 2012 2011 2012 2011Gahcho Kué (OP)(2) 43.4 11 1.00 Mt Mt cpht cpht M¢ M¢
Kimberlite Proved – – – – – –Probable 31.0 – 153.71 – 47.6 –
Total 31.0 – 153.71 – 47.6 –
De Beers Canada – Projects BCO
(mm)
Tonnes Grade Carats
DIAMOND RESOURCES Attributable % Classification 2012 2011 2012 2011 2012 2011Gahcho Kué (OP)(2) 43.4 1.00 Mt Mt cpht cpht M¢ M¢
Kimberlite Measured – – – – – –Indicated 30.2 – 163.87 – 49.6 –
Measured and Indicated 30.2 – 163.87 – 49.6 –Inferred 6.0 – 168.86 – 10.1 –
DIAMOND RESOURCES INCLUDE DIAMOND RESERVES Mining method: OP = Open Pit, UG = Underground. LOM = Life of Mine (years) is based on scheduled Probable Reserves including Indicated and some Inferred Resources considered for Life of Mine planning. Unless stated otherwise tonnage is quoted as dry metric tonnes. Estimates of Diamond Reserve tonnes reflect the tonnage to be treated. Reported Diamond Reserves/Resources are based on a Bottom Cut Off (BCO) which refers to the bottom screen size aperture and varies between 1.00mm and 3.00mm (nominal square mesh). Grade is quoted as carats per hundred metric tonnes (cpht). Due to the uncertainty that may be attached to some Inferred Mineral Resources, it cannot be assumed that all or part of an Inferred Mineral Resource will necessarily be upgraded to an Indicated or Measured Resource after continued exploration.
(1) Snap Lake: Due to the high costs associated with resource development, Indicated Resources are continuously developed from underground infrastructure ahead of the mining face, resulting in an 18 month rolling reserve.
(2) Gahcho Kué: The project approval is subject to the successful conclusion of permitting and regulatory approvals. Gahcho Kué is a Joint Venture between De Beers Canada Inc. and Mountain Province Diamonds Inc. Audits related to the generation of the Ore Reserve and Mineral Resource estimates were carried out by independent consultants during 2012 at the following operations:Snap Lake and Victor.