Embed Size (px)
Citation preview
Full Terms & Conditions of access and use can be found athttps://www.tandfonline.com/action/journalInformation?journalCode=rero20
Economic Research-Ekonomska Istraživanja
ISSN: (Print) (Online) Journal homepage: https://www.tandfonline.com/loi/rero20
Diamond model and the export competitiveness ofthe agriculture industry from emerging markets:an exploratory vision based on a spatial effectstudy using a genetic algorithm
Da Huo, Yan Chen, Ken Hung, Zening Song, Jialin Guan & An Ji
To cite this article: Da Huo, Yan Chen, Ken Hung, Zening Song, Jialin Guan & An Ji (2020)Diamond model and the export competitiveness of the agriculture industry from emergingmarkets: an exploratory vision based on a spatial effect study using a genetic algorithm, EconomicResearch-Ekonomska Istraživanja, 33:1, 2427-2443, DOI: 10.1080/1331677X.2019.1679212
To link to this article: https://doi.org/10.1080/1331677X.2019.1679212
© 2020 The Author(s). Published by InformaUK Limited, trading as Taylor & FrancisGroup.
Published online: 06 Nov 2019.
Submit your article to this journal Article views: 1529
View related articles View Crossmark data
Citing articles: 3 View citing articles

Diamond model and the export competitivenessof the agriculture industry from emerging markets:an exploratory vision based on a spatial effect studyusing a genetic algorithm
Da Huoa, Yan Chenb, Ken Hungc, Zening Songd, Jialin Guane and An Jif
aSchool of International Trade and Economics, Central University of Finance and Economics, Beijing,China; bSchool of Economics and Management, Beijing University of Posts and Telecommunications,Beijing, China; cA.R. Sanchez School of Business, Texas A&M International University, Laredo, TX,USA; dInternational Business School, Beijing Foreign Studies University, Beijing City, China; eSchool ofInternational Economics and Trade, Jilin University of Finance and Economics, Changchun City, JilinProvince, China; fCollege of Liberal Arts and Science, University of Chicago, Chicago, IL, USA
ABSTRACTA deeper understanding of the comparative advantage of emerg-ing markets in agricultural export can be gained by analysing thespatial connections of emerging markets through the frameworkprovided by the diamond model. The geographic economics fac-tors are transformed to interconnections of emerging markets bya genetic algorithm based on Mahalanobis distances. The spatialeffect of geographic economics factors on export competitivenessof agriculture is further identified by spatial modelling. The irri-gated land area, competitive labour cost, foreign direct investment(F.D.I.), and export market opportunity are important to furtherdevelop the export competitiveness of the agriculture industryfrom emerging markets based on spatial modelling. Also there is aspatial disturbances effect in agricultural export of emerging mar-kets based on transformed interconnections structured by geo-graphic economic factors. A fuzzy cluster analysis is furtherperformed, and the stationary solution of clusters in dynamic tran-sition across market segments is analysed by a Markov Chain. It isfurther found that the distribution of emerging markets with ahigher level of export competitiveness can be more concentratedin clusters with lower levels of proportion. The findings of thisresearch can offer support to global managers in further under-standing the spatial effect of geographic economics factors onexport competitiveness of agriculture from emerging markets.
ARTICLE HISTORYReceived 30 January 2019Accepted 30 September 2019
KEYWORDdiamond model; exportcompetitiveness; emergingmarkets; agricultureindustry; genetic algorithm;spatial effect
JEL CLASSIFICATIONF23; C21; Q17; O57
1. Introduction
With the development of theories referring to emerging markets, an increasingamount of research has concentrated on the export competitiveness of agriculture.
CONTACT Da Huo [email protected]� 2020 The Author(s). Published by Informa UK Limited, trading as Taylor & Francis Group.This is an Open Access article distributed under the terms of the Creative Commons Attribution License (http://creativecommons.org/licenses/by/4.0/), which permits unrestricted use, distribution, and reproduction in any medium, provided the original work isproperly cited.
ECONOMIC RESEARCH-EKONOMSKA ISTRA�ZIVANJA2020, VOL. 33, NO. 1, 2427–2443https://doi.org/10.1080/1331677X.2019.1679212

The research is concerned on calculations of the export competitiveness, primarily basedon revealed comparative advantage (R.C.A.) indexes. Zhang, Xu, and Wu (2006)reviewed the trade status of Shanxi agricultural products, and suggested concentrating ondeveloping the agricultural product with comparative advantage in Shanxi, and optimis-ing the import and export structure of Shanxi agriculture products on the basis of com-parative advantage, as well as promoting the quality of export product and improving itscompetitiveness in international market substantially. Cao, Feng, and Zhang (2011) alsoanalysed export competitiveness of agricultural products between China and CentralAsian countries by revealing comparable advantage index, and found that China’s totalagricultural products do not have comparable advantage, while the status of CentralAsian countries have changed from comparable advantage into comparable disadvantage.China and Central Asian countries on specific categories of agricultural products havedifferent advantage structures, and there can be vast bilateral trade potential on the basisof comparable advantage. In addition, Sufri (2012) found that corn, shrimp, crops, etc.,in Indonesia have good prospects for the needs of domestic and export orientation.
Furthermore, researchers are also concerned with the identification of key determi-nants of export competitiveness. Liu and Revell (2009) discovered that emerging mar-kets such as China have higher comparative advantages in labour-intensiveagricultural products such as vegetables and that the performance of labour-intensiveproducts is positively related to China’s increase of share in world trade.Mwansakilwa, Tembo, and Mugisha (2013) also found that the supply and competi-tiveness of flower exports are positively influenced by domestic flower production,real G.D.P. and population of importing countries, relative depreciation of domesticcurrency and world export prices, while exports from competing countries and realinterest rates were found to negatively influence flower exports. Monetary policiesand exchange rate regimes that promote trade are suggested to enhance productionand exporting. It is indicated in the literature that wage costs, irrigated land area,price index, export of the agriculture industry, domestic consumption demand, for-eign direct investment (F.D.I.), and the exchange rate against U.S. dollars of differentcountries from emerging markets are important factors that influence the exportcompetitiveness of the agriculture industry from emerging markets.
This research aims to analyse the export competitiveness of agriculture fromemerging markets based on the diamond model. This research further reveals theeffect of advantages on export competitiveness of agriculture from emerging markets,by addressing the spatial effect of resources based on interconnections across emerg-ing markets. The effect of factors to represent the dimensions of diamond model isfurther analysed in a integrative system. The interconnections across emerging mar-kets are transformed from geographic economics factors by a genetic algorithm basedon Mahalanobis distance. The spatial effect of resources on export competitiveness ofagriculture is further analysed by spatial modelling based on interconnections ofemerging markets. The fuzzy cluster analysis is further performed to analyse the clus-tering attributes of market segmentation in export of agriculture from emerging mar-kets. Furthermore, the stationary solution in dynamic transmission of differentclusters is further analysed by a Markov Chain. The effect of geographic economicsfactors on export competitiveness of agriculture from emerging markets is studied
2428 D. HUO ET AL.
based on diamond model, by an exploration from integrative and dynamic vision.The findings of this research provides support to global managers in furthering theirunderstanding of spatial effects of geographic economics factors on export competi-tiveness of agriculture from emerging markets.
2. Literature review
Porter (1980) pointed out that the competitive advantage of countries can be furtheranalysed by assessing the resources and conditions in the national industrial environ-ment. Porter (1990) further pointed out the diamond model in which the factorendowment, market demand, relevant industry, and firm strategy and rivalry areimportant resources that support the national competitiveness in different industries.In addition, the government policy and market opportunity are also important condi-tions that effect on national competitive advantage. Grant (1991) pointed out that thediamond theoretical framework offered an important explanation on the nationalcompetitiveness of industry by importing the functions of the national industrial con-dition on firm strategies. The factor endowment of an industry is important to offerinput and supply for competitive advantages. Domestic market demand offers import-ant motivation for continuous upgrading of technology in fulfilling consumerdemand. The relevant industry also plays an important role in supporting the compe-tition at global market. Rivalry between domestic firms can further encourage thecompetitiveness and sustainability of companies through enhanced competition.Furthermore, the government policy and market opportunities also have an effect onthe industrial environment and national competitive advantages in the global market.Snowdon and Stonehouse (2006) also pointed out that the diamond model is animportant theoretical framework that analysed the microeconomic foundations to glo-bal competitiveness. The theory investigates the business context that effects on com-petition process, and the factors involved in the diamond structure are importantdeterminants to the sustainable competition and production of companies.
The export competitiveness of agriculture has been a traditional support to emerg-ing markets in global competition. The diamond model can offer an importantframework in analysing the export competitiveness of agriculture from emerging mar-kets. Furthermore, the interconnections of resources can offer support to the nationalcompetitive advantage, and the spatial effect of the resource interconnections onexport competitiveness of agriculture from emerging markets can be further analysedbased on the diamond theoretical framework. This research hypothesised the dia-mond model offers important framework to further reveal the dimensions that struc-ture the export competitiveness of the agriculture industry from emerging markets.
H1: The diamond model is hypothesised to be supported in export competitivenessof the agriculture industry from emerging markets.
2.1. Land use and labour resources factors
Land use and labour resources can be an important factor to support export competitive-ness of agriculture from emerging markets. Venables (2016) pointed out that the labour
ECONOMIC RESEARCH-EKONOMSKA ISTRA�ZIVANJA 2429

and physical resources are important supports to the development of economic growth,and they are also important to the transformation of developing economies. In addition,Fitriani and Sumarminingsih (2015) pointed out that rationale land use for agriculturalproduction is important in economic development. Lin and Lin (2008) also pointed outthe advantage in labour costs offered by emerging markets to further support globalcompetition.
H1a: The irrigated land of emerging markets has a positive relationship with the exportcompetitiveness of agriculture.
H1b: The wage level of emerging markets has a negative relationship with the exportcompetitiveness of agriculture.
2.2. Consumer demand condition
The domestic consumption can be important motivation to enhance export competi-tiveness of the agriculture industry from emerging markets. Mceachern and Seaman(2005) analysed the competitiveness of British agriculture, and found that consumerviews of meat production vary widely, while attributes towards producers were posi-tive. Furthermore, Krugman (1980) revealed that home market effects can offer coun-tries a comparative advantage in their cross-border trade by increasing returns fromeconomies of scale. Companies are more likely to concentrate on t production inproximity to their domestic markets, aiming to achieve economies of scale and tosave on transportation costs.
H1c: The consumption of emerging markets has negative relationship with the exportcompetitiveness of agriculture.
2.3. F.D.I. support
The F.D.I. inflow can offer support to export competitiveness of agriculture fromemerging markets by a spillover effect on associated industries. Zhang, Li, Li, andZhou (2010) pointed out that the F.D.I. from foreign companies can encourage thetechnological upgrading and managerial efficiency of domestic companies.Shiralashetti and Hugar (2009) also pointed out that F.D.I. can motivate G.D.P.growth rate, growth in industry and service sector, reduction in unemployment,reduction in poverty, improvement in standard of living, increase in foreign exchangereserves, increase in exports, and improvement in stock market. The positive networkeffect of F.D.I. can encourage the further development of relevant industry that sup-port the export competitiveness of agriculture from emerging markets.
H1d: F.D.I. in emerging markets has a positive relationship with the exportcompetitiveness of agriculture
2.4. Price competition
The price level of agriculture products can offer support to the export competitiveness ofthe agriculture industry from emerging markets in global competition. The industry-based view proposed by Porter (1981) pointed out that the rivalry of companies can be
2430 D. HUO ET AL.
important motivation for companies to enhance competitiveness and sustainability.Manova and Zhang (2012) pointed out that the pricing strategy of export companies canbe important in competition in the global market. Companies working with competitivepricing strategies can be encouraged to further enhance the competitiveness inagriculture.
H1e: The price level of agriculture in emerging markets has a positive relationship withthe export competitiveness of agriculture.
2.5. Export opportunity and exchange rate policy
The agricultural exports and the exchange rate in emerging markets can be importantmarket opportunities and government policy that effects the export competitivenessof agriculture in emerging markets. Lado, Martinez-Ros, and Valenzuela (2004)pointed out that the marketing strategy of export companies can vary at different des-tinations. Krautheim (2013) also pointed out that the export companies need to makedecisions on different corporate strategies in competing at different markets. Theincrease of export based on enhanced involvement of global market by emergingmarkets further offers support export competitiveness, and strengthen the power ofemerging markets in global business negotiation based on the increase of marketshare. Furthermore, Coates (2015) pointed out that the cost-benefit of financial regu-lation of the exchange rate can be important to the economy. The foreign exchangerate in emerging markets also can be important to export competitiveness of agricul-ture. Also the foreign exchange rate policy can have important effect on export com-petitiveness of the agriculture industry for bulk commodity transaction.
H1f: The export of emerging markets has a positive relationship with the exportcompetitiveness of agriculture.
H1g: The foreign exchange rate of emerging markets has a positive relationship with theexport competitiveness of agriculture.
Export competitiveness can be further influenced by interconnections of resourcesacross different countries based on the diamond theoretical framework. With furtherdevelopment of research in this area, Burianova and Belova (2012) analysed theimpact of crisis on Czech agrarian trade comparative advantage development in rela-tion to selected trade partners based on the R.C.A. index generated from agriculturalforeign trade of the Czech Republic. Ortega and Valencia (2011) analysed the inter-national competitiveness of agriculture industrial products of the State of Michoacan,and also pointed out that measuring international competitiveness in the agribusinesssector offers a clear, comprehensive, and multifunctional agriculture complex reality.
H2: The interconnections of emerging markets have a spatial effect and negativerelationship with the export competitiveness of agriculture.
Snowdon and Stonehouse (2006) pointed out that Porter suggested the cluster ofentities involved in the competition system be further analysed in referring to inter-connections based on diamond model. Bowen Jr and Leinbach (2006) pointed outthat the diamond model offers important theoretical framework to analyse the chan-nels that local characteristics effect on navigation of opportunities and pressures at
ECONOMIC RESEARCH-EKONOMSKA ISTRA�ZIVANJA 2431
different locations. Kamath, Agrawal, and Chase (2012) further pointed out that thefunctioning system of diamond model is based on integrative structure that formulatethe success of clusters in economics of geography. Antle and Stoorvogel (2006) indi-cated that complexity of specific spatial attributes can have important effects on ecosys-tem services of crops. Anselin, Bongiovanni, and Lowenberg-DeBoer (2004) pointed outthat there is a spatial autocorrelation site-specific effect of regional conditions on cornproducts. The interconnections of geographic economics factors based on diamondmodel can have spatial effect on export competitiveness of the agriculture industry.
3. Research method
3.1. Measurement of export competitiveness
The R.C.A. index is used to measure the export competitiveness of the agricultureindustry from emerging markets. Esterhuizen et al. (2006) pointed out that theBalassa method supports the definition developed on competitiveness, and themethod of revealed comparative advantage (R.C.A.) allows for the measurement ofcompetitiveness under real world conditions. In addition, Kathuria (2013) analysedthe comparative advantage of India and Bangladesh for the clothing sector in theworld export trade with the help of Balassa’s index of the R.C.A., and revealed thatthe share of clothing sector in India’s total merchandise exports has come down dur-ing the period, and India has been able to maintain its comparative advantage inarticles of apparel and clothing accessories, knitted or crocheted during the studyperiod. According to Balassa (1987), the R.C.A. is:
XRCAi ¼ ðXi=XiwÞ=ðX=XWÞ
Xi is the value of national exports of business i, Xiw is the value of total world exportsof business i. X is the value of national exports in all industries, and Xw is the valueof total world exports in all industries. This index normalises for the country’s sharein total world trade.
3.2. Identification of Mahalanobis distance
The Mahalanobis distance of each two countries is measured on the basis of export com-petitiveness and its determinants, which include wage of emerging markets, irrigated landarea of emerging markets, price index of agricultural products in emerging markets, con-sumer demand, F.D.I., export of the agriculture industry, and the exchange rate of U.S.dollars to the local currency in emerging markets. The application of Mahalanobis dis-tance can be helpful to overcome the different scales of variables in structuring the inter-connections of emerging markets. The Mahalanobis distance is measured by:
dij ¼ffiffiffiffiffiffiffiffiffiffiffiffiffiffiffiffiffiffiffiffiffiffiffiffiffiffiffiffiffiffiffiffiffiffiffiffiffiffiffiffiffiffiffiffiffiffiðxi�xjÞT
X�1ðxi � xjÞ
q
Mahalanobis distance overcomes the different scales across different variables inmeasuring the distances of country nodes. The data is collected from emerging
2432 D. HUO ET AL.
markets as following: China, India, Indonesia, Malaysia, Pakistan, Philippines, SouthKorea, Thailand, Czech Republic, Hungary, Poland, Russia, Argentina, Brazil, Chile,Colombia, Mexico, Peru, Egypt, Israel, Jordan, Morocco, South Africa and Turkey.The countries with emerging markets are selected from the M.S.C.I. emerging mar-kets index. The annual data from 1997 to 2006 is obtained from Euro Monitor data-base, and the sample size is 240. For the comparison between different countries, thevalues in the domestic currency are all changed to U.S. dollars according to the tem-porary exchange rate. The value consumption and export of the agriculture industryis measured by millions of U.S. dollars. The wage level is measured by U.S. dollarsand irrigated land area is measured by thousand hectares.
3.3. Transformation of spatial matrix
The genetic algorithm is further performed based on the objective of minimising theerror in the transformation of dimensions based on export competitiveness and coun-try level factors in emerging markets into two visionary dimensions. The objectivefunction is:
E ¼Xni<j
ððdij��dijÞ2=dij�Þ=Xni<j
dij�
dij is the Mahalanobis distance between the emerging markets based on export com-petitiveness and country level factors, and dij� is the Mahalanobis distance of emerg-ing markets based on the two dimensions. The transformation of interconnectionsacross emerging markets in export of agriculture can be helpful to overcome thecurse of dimensions issue in further analysing the effect of geographic economics fac-tors on export competitiveness. The objective function aims to minimise the errorsbetween these two distances in the transformation based on nonlinear mapping.
3.4. Analysis of spatial effect
The interconnections across emerging markets are further structured based on thetwo dimensions transformed from the geographic economics factors by genetic algo-rithm, which overcomes the curse of dimensions that affect the performance of ana-lysis due to analysis based on over complex dimensions. The spatial regressionanalysis is further performed to analyse the spatial effect of geographic economics fac-tors on export competitiveness of emerging markets based on the interconnectionsacross different markets by the geographic economics factors. The spatial autoregres-sive model with spatial autoregressive disturbances (S.A.R.A.R.) is performed to esti-mate the spatial lag effect and spatial disturbances effect of resources based ondiamond model in support to export competitiveness of the agriculture industry fromemerging markets.
ECONOMIC RESEARCH-EKONOMSKA ISTRA�ZIVANJA 2433

3.5. Fuzzy cluster analysis
The fuzzy analysis is further performed based on dimensions developed by generic algo-rithm, and different clusters of emerging markets based on export competitiveness and itsdeterminants are visualised. The number of clusters in the fuzzy cluster analysis is identi-fied by Xie–Beni index (Xie & Beni, 1991). The Xie–Beni Index is as following:
VXB ¼Pc
i¼1
Pnj¼1lij
2|xi � ti|2
nmini 6¼j |tj � ti|2
VXB is the Xie–Beni index, Xi is the database of local conditions and transportationfacilities, and ti is the vector of centroids. The minimum VXB leads to an optimalnumber of clusters in the fuzzy cluster analysis. The data involved in the fuzzy clusteranalysis are standardised.
3.6. Markov Chain analysis
The stationary solution of clusters in market segmentation is further analysed by aMarkov Chain. The transition matrix of the clusters across different segments is asfollows:
PðtrasitionÞ ¼Pc1c1Pc1c2 � � � Pc1ciPc2c1Pc2c2 � � � Pc2ci
..
.... . .. ..
.
Pcic1Pcic2 � � � Pcici
0BBB@
1CCCA
P(transition) is the transition matrix of clusters, and Pc1ci represents that probability thatCluster 1 is transited to Cluster i. Furthermore, di represents that stationary solutionof probability for Cluster i in transition of different market segments, the stationarysolution can be identified by the Markov Chain as follows:
Pc1c1d1 þ Pc2c1d2 þ � � � þ Pcic1di ¼ d1Pc1c2d1 þ Pc2c2d2 þ � � � þ Pcic2di ¼ d2
..
.... . .. ..
....
Pc1cid1 þ Pc2cid2 þ � � � þ Pcicidi ¼ did1 þ d2 þ � � � þ di ¼ 1
The clusters of emerging markets is identified by the fuzzy cluster analysis, and thestationary solution in transition of clusters at different market segmentations is per-formed by the Markov Chain.
4. Result
The Mahalanobis distance across different countries from emerging markets is meas-ured on the basis of export competitiveness of agriculture and geographic economics
2434 D. HUO ET AL.

factors, which include wage rates, irrigated land area, price index of agricultural prod-ucts, consumer demand, F.D.I., export of agricultural products, and the exchange rateof U.S. dollars to the local currency.
Figure A1 shows the vision of market segments in two dimensions developed fromthe export competitiveness and factors that influence it by a nonlinear mapping basedon a genetic algorithm. The dimensions of export competitiveness and geographiceconomics factors have been transformed to two dimensions by the genetic algorithm.Figure A2 further shows that the best fitness and mean of generation fitness are grad-ually convergent in the transformation of geographic economics factors into intercon-nections of emerging markets by genetic algorithm.
Table A1 shows the spatial effect of geographic economics factors on export com-petitiveness from emerging markets. The spatial weight the markets in export of agri-culture is structured by the interconnections based on transformation of geographiceconomics factors by genetic algorithm. It is found that the interconnections ofemerging markets have a negative spatial disturbances effect on export competitive-ness of the agriculture industry, with a significant spatial disturbances effect repre-sented by rho.
It is found that the diamond model is supported in explaining the export competi-tiveness of the agriculture industry from emerging markets, and H1 is supported. Theirrigated land of emerging markets has a positive relationship with the export com-petitiveness of the agriculture industry in spatial effect, and H1a is supported. Thewage level of emerging markets has a negative relationship with the export competi-tiveness of the agriculture industry, and H1b is supported. Therefore, the land andlabour factors based on the diamond theoretical framework have an important effecton the export competitiveness of the agriculture industry from emerging markets.
It is also found that the market demand has an important effect on the exportcompetitiveness of the agriculture industry from emerging markets by concerningspatial effect. The F.D.I. of emerging markets has a positive relationship with theexport competitiveness of the agriculture industry, and H1d is supported. The F.D.I.can offer further support to the relevant industry based on a network effect, and isalso important to the export competitiveness of agriculture from emerging markets.However, it is found that the consumption of emerging markets has a negative rela-tionship with the export competitiveness of the agriculture industry in spatial effect,and H1c is not supported. In addition, the price level of agricultural products isfound to have no significant effect on export competitiveness in agriculture fromemerging markets, and H1e is not supported.
Furthermore, it is found that the export of emerging markets has a positive relationshipwith the export competitiveness of the agriculture industry in spatial effect, and H1f issupported. The market opportunity is important to the export competitiveness of the agri-culture industry from emerging markets by concerning spatial effect. But the foreignexchange rate is found to have no significant effect on export competitiveness in the agri-culture industry from emerging markets, and H1g is not supported.
It is also found that geographic economics factors have a spatial disturbances effecton the export competitiveness of the agriculture industry from emerging markets,and H2 is supported. The interconnections of emerging markets have negative spatial
ECONOMIC RESEARCH-EKONOMSKA ISTRA�ZIVANJA 2435
disturbances effects on export competitiveness across the markets. Cliff and Ord(1981) pointed out that the S.A.R.A.R. model can be applied to further analyse thecombination of the spatial autoregressive effect and the spatial disturbances effect.The result shows that the random issues occurred on export of agriculture can havespatial autocorrelation in emerging markets. The random issues which may be causedby natural and environmental changes can have a negative spatial autocorrelation inexport of agriculture from emerging markets.
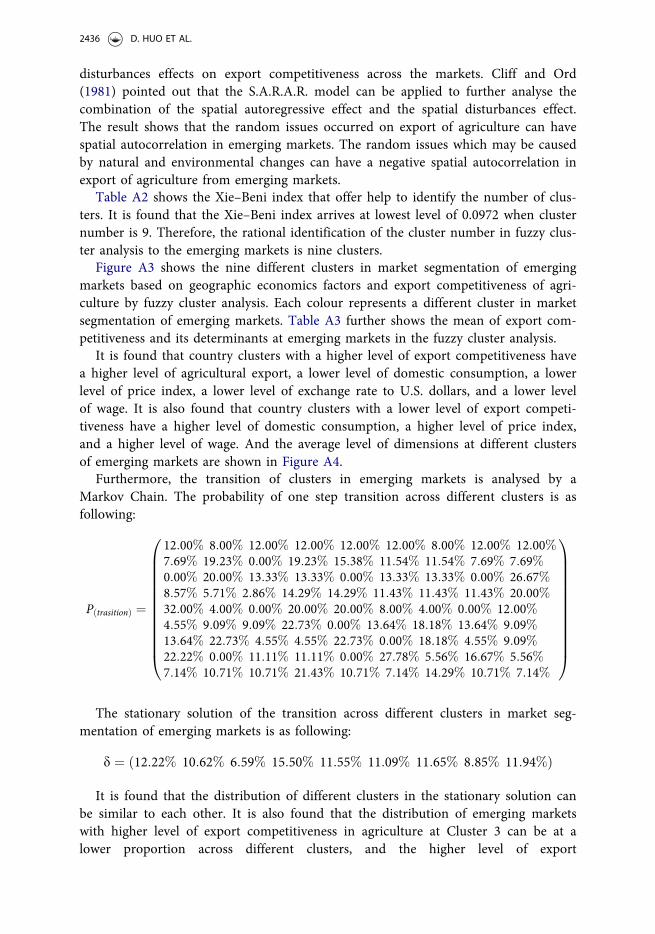
Table A2 shows the Xie–Beni index that offer help to identify the number of clus-ters. It is found that the Xie–Beni index arrives at lowest level of 0.0972 when clusternumber is 9. Therefore, the rational identification of the cluster number in fuzzy clus-ter analysis to the emerging markets is nine clusters.
Figure A3 shows the nine different clusters in market segmentation of emergingmarkets based on geographic economics factors and export competitiveness of agri-culture by fuzzy cluster analysis. Each colour represents a different cluster in marketsegmentation of emerging markets. Table A3 further shows the mean of export com-petitiveness and its determinants at emerging markets in the fuzzy cluster analysis.
It is found that country clusters with a higher level of export competitiveness havea higher level of agricultural export, a lower level of domestic consumption, a lowerlevel of price index, a lower level of exchange rate to U.S. dollars, and a lower levelof wage. It is also found that country clusters with a lower level of export competi-tiveness have a higher level of domestic consumption, a higher level of price index,and a higher level of wage. And the average level of dimensions at different clustersof emerging markets are shown in Figure A4.
Furthermore, the transition of clusters in emerging markets is analysed by aMarkov Chain. The probability of one step transition across different clusters is asfollowing:
PðtrasitionÞ ¼
12:00% 8:00% 12:00% 12:00% 12:00% 12:00% 8:00% 12:00% 12:00%7:69% 19:23% 0:00% 19:23% 15:38% 11:54% 11:54% 7:69% 7:69%0:00% 20:00% 13:33% 13:33% 0:00% 13:33% 13:33% 0:00% 26:67%8:57% 5:71% 2:86% 14:29% 14:29% 11:43% 11:43% 11:43% 20:00%32:00% 4:00% 0:00% 20:00% 20:00% 8:00% 4:00% 0:00% 12:00%4:55% 9:09% 9:09% 22:73% 0:00% 13:64% 18:18% 13:64% 9:09%13:64% 22:73% 4:55% 4:55% 22:73% 0:00% 18:18% 4:55% 9:09%22:22% 0:00% 11:11% 11:11% 0:00% 27:78% 5:56% 16:67% 5:56%7:14% 10:71% 10:71% 21:43% 10:71% 7:14% 14:29% 10:71% 7:14%
0BBBBBBBBBBBB@
1CCCCCCCCCCCCA
The stationary solution of the transition across different clusters in market seg-mentation of emerging markets is as following:
d ¼ ð12:22% 10:62% 6:59% 15:50% 11:55% 11:09% 11:65% 8:85% 11:94%Þ
It is found that the distribution of different clusters in the stationary solution canbe similar to each other. It is also found that the distribution of emerging marketswith higher level of export competitiveness in agriculture at Cluster 3 can be at alower proportion across different clusters, and the higher level of export
2436 D. HUO ET AL.

competitiveness of agriculture can be concentrated in emerging markets at Cluster 3.The distribution of emerging markets with lower level of export competitiveness inagriculture Cluster 4 can be a higher proportion in comparison to proportions ofother clusters. The distribution of emerging markets with lower level of export com-petitiveness at stationary solution can be more relaxed. Furthermore, the distributionof other clusters are in similar proportions to each other.
The global managers in cross-border agriculture industry can take advantage ofirrigated land area, competitive labour cost, F.D.I., and export market opportunity tofurther develop the export competitiveness of the agriculture industry from emergingmarkets. The global managers also need to be cautious on strategic decisions inexpansion of agriculture in global market, and the spatial disturbances in market con-ditions can have a negative effect on the competitiveness of agriculture from emerg-ing markets. It is further suggested that global managers should be adaptive toindustrial conditions in competition at global market.
5. Conclusion
The development of economy in emerging markets has been providing an importantdriven power to the international trade business in the global market. The exportcompetitiveness of agricultural is important to the enhanced international involve-ment of emerging markets. The relationship between export competitiveness and geo-graphic factors that influence it can be a functional result of the system ofconnections between markets. The R.C.A. approach is employed to define the exportcompetitiveness of agricultural industries in emerging markets.
This research further reveals the relationship of export competitiveness and geo-graphic economics factors by analysing the spatial connections of country nodes inemerging markets. The Mahalanobis distance is measured to identify the closeness ofcountry nodes in the spatial connections of emerging markets, on the basis of theirexport competitiveness and geographic economic factors, including wage of emergingmarkets, irrigated land area of emerging markets, price index of agricultural productsin emerging markets, consumer demand, F.D.I., export of the agriculture industry, andexchange rate. The transformed spatial connections of countries in emerging marketsare visualised in this research, based on their export competitiveness of the agricultureindustry and geographic economic factors by using genetic algorithm. The data visual-isation based on transformed spatial interconnections of emerging markets furtherreveals the segmentation of emerging markets in a two dimensional vision, based onexport competitiveness and geographic economic factors. The geographic economic fac-tors have effects on the export competitiveness of the agriculture industry, and the rela-tionship between geographic economic factors and the export competitiveness of theagriculture industry has been revealed in the spatial connections of emerging markets.
This research finds a spatial disturbances effect of geographic economics factors onexport competitiveness of the agriculture industry from emerging markets based onthe diamond model framework. It also found that emerging markets with a higherlevel of irrigated land, a lower level of wage cost, a higher level of F.D.I., a higherlevel of agricultural export have a higher level of export competitiveness, by
ECONOMIC RESEARCH-EKONOMSKA ISTRA�ZIVANJA 2437
concerning the spatial effect across the emerging markets. The findings of thisresearch can offer support to global managers in better understanding the effect ofgeographic economics factors on export competitiveness of the agriculture industryfrom emerging markets. A higher level of irrigated land, a lower level of wage cost, ahigher level of F.D.I., a higher level of agricultural exports offer emerging markets ahigher level of export competitiveness in the agriculture industry.
The fuzzy cluster analysis further shows the segmentation of emerging markets.Different factors that have influence on the export of agriculture and the relationshipbetween determinants and the export competitiveness of agricultural business havebeen revealed. This research finds that clusters with a higher level of export competi-tiveness have a higher level of agricultural export, a lower level of domestic consump-tion, a lower level of price index, a lower level of exchange rate to U.S. dollars, and alower level of income. In addition, it is found that clusters with a lower level ofexport competitiveness have a higher level of domestic consumption, a higher level ofprice index, and a higher level of wage cost.
Markov Chain analysis is further performed to identify the stationary solution oftransitions across clusters in emerging markets. It is found that the emerging marketswith higher level of export competitiveness can be more concentrated in cluster withlower level of proportion in stationary solution. It is also found that the emergingmarkets with lower level of export competitiveness can be more relaxed in clusterswith higher levels of proportion in stationary solutions. Emerging markets involvedin other clusters are in similar distribution from each other.
This research offers support to global managers in their future decisions regardingthe export competitiveness of agricultural business from emerging markets. The glo-bal managers can further take advantage of these geographic economics factors atinvolvement in competition of the agriculture industry from emerging markets. Also,global managers should be cautious on negative spatial disturbances effect of inter-connections of resources, and should be adaptive to different industrial conditions inmaking decisions based on the export competitiveness of the agriculture industryfrom emerging markets.
This research is focused on the export competitiveness of the agriculture industryfrom emerging markets. The research of competitive industries from emerging mar-kets can be further developed in the future. Also the research of export competitive-ness from both emerging markets and other country clusters can be furtherdeveloped. This research studied the macro-level explanation to export competitive-ness of the agriculture industry from emerging markets, and micro-level explanationscan be further developed.
Disclosure statement
No potential conflict of interest was reported by the authors.
Funding
The authors thank Central University of Finance and Economics for the support of thisresearch. The authors thank National Social Science Foundation of China General Project
2438 D. HUO ET AL.
(15BJL025), Research Base of Beijing Social Science Foundation General Project (14JDJGB046),National Social Science Foundation of China Key Project (14AZD118), Ministry of Educationof China Key Project (15JZD022), National Natural Science Foundation of China GeneralProject (71573023), and Capital Normal University Research Project (ICS-2019-B-06) for thesupport to this research. The authors thank Professor Joseph Brennan for editing this paper.
References
Anselin, L., Bongiovanni, R., & Lowenberg-DeBoer, J. (2004). A spatial econometric approachto the economics of site-specific nitrogen management in corn production. AmericanJournal of Agricultural Economics, 86(3), 675–687. doi:10.1111/j.0002-9092.2004.00610.x
Antle, J. M., & Stoorvogel, J. J. (2006). Predicting the supply of ecosystem services from agri-culture. American Journal of Agricultural Economics, 88(5), 1174–1180. doi:10.1111/j.1467-8276.2006.00929.x
Balassa, B. (1987). Comparative advantage, trade policy and economic development. New York,NY: Harvester Wheatsheaf.
Bowen Jr, J. T., & Leinbach, T. R. (2009). Competitive advantage in global production net-works: Air freight services and the electronics industry in Southeast Asia. EconomicGeography, 82(2), 147–166. doi:10.1111/j.1944-8287.2006.tb00294.x
Burianova, J., & Belova, A. (2012). The competitiveness of agricultural foreign trade commod-ities of the CR assessed by way of the Lafay index. AGRIS on-Line Papers in Economics andInformatics, 4(4), 27–36.
Cao, S., Feng, L., & Zhang, J. (2011). Export competitiveness of agri-products between Chinaand Central Asian countries: A comparative analysis. Canadian Social Science, 7(5),129–134.
Cliff, A. D., & Ord, J. K. (1981). Spatial processes, models and applications. London: Pion.Coates IV, J. C. (2015). Cost-benefit analysis of financial regulation: Case studies and implica-
tions. The Yale Law Journal, 124(4), 882–1011.Esterhuizen, D., Rooyen, J. V., & Haese, L. D. (2006). An evaluation of the competitiveness of
the agribusiness sector in South Africa. Competition Forum, 4(1), 72–86.Fitriani, R., & Sumarminingsih, E. (2015). Determination of spatial extent of land use in the
fringe of Jakarta metropolitan: A semivariogram analysis. Theoretical and EmpiricalResearches in Urban Management, 10(1), 43–54.
Grant, R. M. (1991). Porter’s ‘competitive advantage of nations’: An assessment. StrategicManagement Journal, 12(7), 535–548. doi:10.1002/smj.4250120706
Kamath, S., Agrawal, J., & Chase, K. (2012). Explaining Geographic Cluster Success-TheGEMS Model. The American Journal of Economics and Sociology, 71(1), 184–214. doi:10.1111/j.1536-7150.2011.00819.x
Kathuria, L. M. (2013). Analyzing competitiveness of clothing export sector of India andBangladesh: Dynamic Revealed Comparative Advantage Approach. Competitiveness Review,23(2), 131–157.
Krautheim, S. (2013). Export-supporting FDI. Canadian Journal of Economics/RevueCanadienne D’�economique, 46(4), 1571–1605. doi:10.1111/caje.12061
Krugman, P. R. (1980). Scale economies, product differentiation, and the pattern of trade.American Economic Review, 70(5), 950–959.
Lado, N., Martinez-Ros, E., & Valenzuela, A. (2004). Identifying successful marketing strategiesby export regional destination. International Marketing Review, 21(6), 573–597. doi:10.1108/02651330410568024
Lin, C. C., & Lin, J. (2008). Capitalism in contemporary China: Globalization strategies, oppor-tunities, threats, and cultural issues. Journal of Global Business Issues, 2(1), 31–40.
Liu, X., & Revell, B. J. (2009). Competitiveness changes in China’s quality vegetable exportspost-WTO. Journal of Chinese Economic and Foreign Trade Studies, 2(2), 86–101. doi:10.1108/17544400910966068
ECONOMIC RESEARCH-EKONOMSKA ISTRA�ZIVANJA 2439

Manova, K., & Zhang, Z. (2012). Export prices across firms and destinations. The QuarterlyJournal of Economics, 127(1), 379–436. doi:10.1093/qje/qjr051
Mceachern, M. G., & Seaman, C. (2005). Consumer perceptions on meet production:Enhancing the competitiveness of British agriculture by understanding communication withthe consumer. British Food Journal, 107(8), 572–593. doi:10.1108/00070700510610986
Mwansakilwa, C., Tembo, G., & Mugisha, J. (2013). Growth and competitiveness of non-traditionalagricultural exports in Zambia. Modern Economy, 04(11), 794–808. doi:10.4236/me.2013.411085
Ortega, O. V. D., & Valencia, J. B. (2011). International competitiveness of agro-industrialproducts of the state of Michoacan. Competition Forum, 9(1), 150–157.
Porter, M. E. (1980). Competitive strategy. New York, NY: Free Press.Porter, M. E. (1981). The contributions of industrial organization to strategic management.
The Academy of Management Review, 6(4), 609–620. doi:10.2307/257639Porter, M. E. (1990). The competitive advantage of nations. New York, NY: The Free Press.Snowdon, B., & Stonehouse, G. (2006). Competitiveness in a globalised world: Michael Porter
on the microeconomic foundations of the competitiveness of nations, regions, and firms.Journal of International Business Studies, 37(2), 163–175. doi:10.1057/palgrave.jibs.8400190
Shiralashetti, A. S., & Hugar, S. S. (2009). Foreign direct investment and economic develop-ment of India: A diagnostic study. IUP Journal of Managerial Economics, 7(1), 54–69.
Sufri, M. (2012). Development of competitiveness of farm commodity at Selayar RegencySouth Sulawesi Province. International Journal of Business and Management, 2(1), 59–74.
Venables, A. J. (2016). Using natural resources for development: Why has it proven so diffi-cult? Journal of Economic Perspectives, 30(1), 161–183. doi:10.1257/jep.30.1.161
Xie, X. L., & Beni, G. A. (1991). A Validity Measure for Fuzzy Clustering Algorithm, IEEETransactions on Pattern Analysis & Machine Intelligence, 8, 841–846.
Zhang, Y., Li, H., Li, Y., & Zhou, L.-A. (2010). FDI spillovers in an emerging market: The roleof foreign firms’ country origin diversity and domestic firms’ absorptive capacity. StrategicManagement Journal, 31(9), 969–989. doi:10.1002/smj.856
Zhang, G., Xu, L., & Wu, O. (2006). Empirical analysis on the international competitiveness ofShannxi agricultural product. Canadian Social Science, 2(5), 70–76.
Appendix
Table A1. Spatial effect of geographic economics factors on export competitiveness from emerg-ing markets.
Model1 Model2 Model3 Model4 Model5 Model6 Model7
Export 0.00023��� 0.00026��� 0.00028��� 0.00031��� 0.00031��� 0.00032��� 0.00032���Consume –7.39e–06��� –9.28e–06��� –14.3e–06��� –23e–06��� –25e–06��� –23.7e–06���Wage –0.00015��� –0.00013��� –0.00014��� –0.00014��� –0.00014���Land 24e–06��� 31e–06��� 35e–06��� 33.2e–06���F.D.I. 41.7e–06��� 47.5e–06��� 44e–06���Exchange 55.3e–06 52.4e–06Price –0.00013lambda –0.00075 –0.00064 –0.0005 –0.00047 –0.00041 –0.00044 –0.0004rho –0.00194 –0.00238 –0.00315 –0.0028 –0.0151��� –0.0148��� –0.015���N 240 240 240 240 240 240 240���P< 0.005.Source: Authors’ own estimations.
Table A2. Xie–Beni index of fuzzy cluster analysis for emerging markets in agriculture export.Cluster number 2 3 4 5 6 7 8
X-B Index 0.3125 0.1466 0.1141 0.1748 0.1637 0.1507 0.1043Cluster Number 9 10 11 12 13 14 15X-B Index 0.0972 0.1224 0.1447 0.1125 0.1117 0.1793 0.2115
Source: Authors’ own estimations.
2440 D. HUO ET AL.
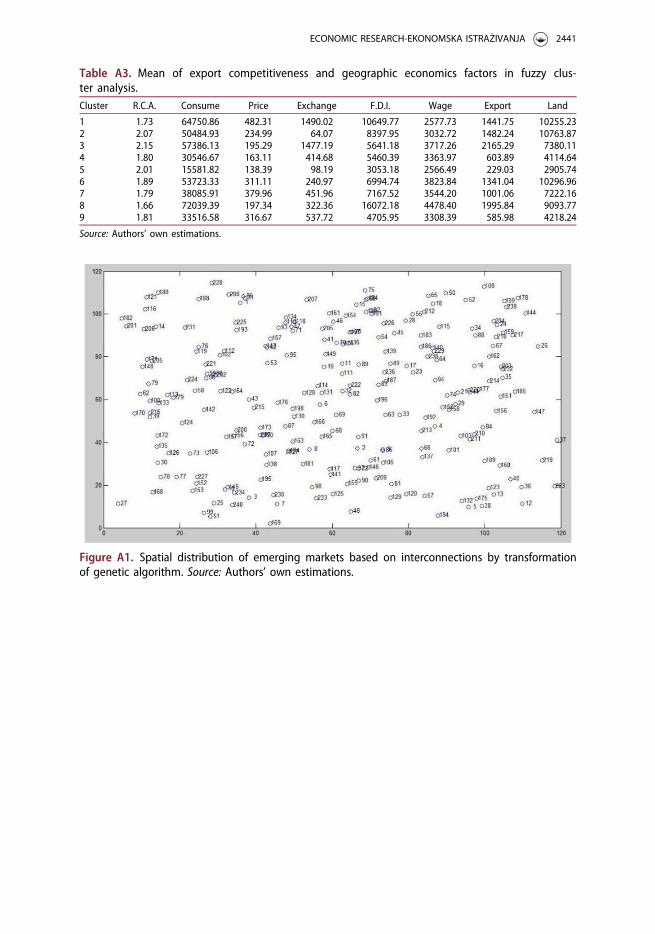
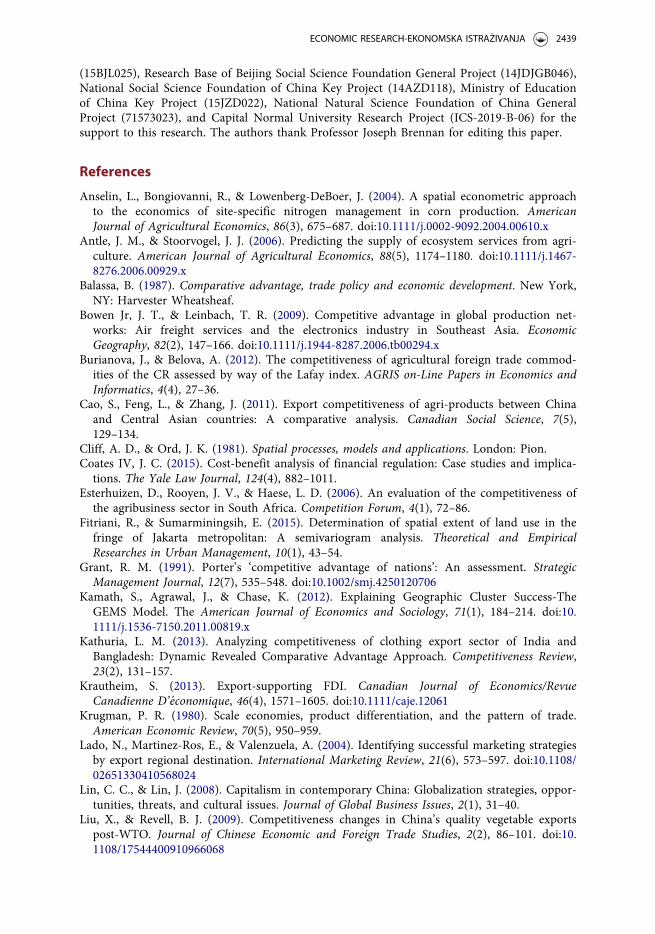
Table A3. Mean of export competitiveness and geographic economics factors in fuzzy clus-ter analysis.Cluster R.C.A. Consume Price Exchange F.D.I. Wage Export Land
1 1.73 64750.86 482.31 1490.02 10649.77 2577.73 1441.75 10255.232 2.07 50484.93 234.99 64.07 8397.95 3032.72 1482.24 10763.873 2.15 57386.13 195.29 1477.19 5641.18 3717.26 2165.29 7380.114 1.80 30546.67 163.11 414.68 5460.39 3363.97 603.89 4114.645 2.01 15581.82 138.39 98.19 3053.18 2566.49 229.03 2905.746 1.89 53723.33 311.11 240.97 6994.74 3823.84 1341.04 10296.967 1.79 38085.91 379.96 451.96 7167.52 3544.20 1001.06 7222.168 1.66 72039.39 197.34 322.36 16072.18 4478.40 1995.84 9093.779 1.81 33516.58 316.67 537.72 4705.95 3308.39 585.98 4218.24
Source: Authors’ own estimations.
Figure A1. Spatial distribution of emerging markets based on interconnections by transformationof genetic algorithm. Source: Authors’ own estimations.
ECONOMIC RESEARCH-EKONOMSKA ISTRA�ZIVANJA 2441

Figure A2. Fitness of genetic algorithm for transformation of interconnections across emergingmarkets. Source: Authors’ own estimations.
Figure A3. Visualisation of fuzzy cluster analysis for emerging markets in export of agriculture.Source: Authors’ own estimations.
2442 D. HUO ET AL.

Figure A4. Result of fuzzy cluster analysis for emerging markets in agriculture export. Source:Authors’ own estimations.
ECONOMIC RESEARCH-EKONOMSKA ISTRA�ZIVANJA 2443