Embed Size (px)
Citation preview

Diamond Anvil Cell Manual
Cell Preparation, ac Susceptibility and electrical Resistivity Measurements,
Accessory Equipment
(version: November 2011)
Washington University Physics
Schilling High Pressure Lab
March 24, 2014
Contents
1 Operation of the Diamond Anvil Cell 8
1.1 Description of the Diamond Anvil Cell . . . . . . . . . . . . . 8
1.2 Checklist for Performing a DAC Experiment . . . . . . . . . . 8
1.3 Care of the Diamond Anvil Cell . . . . . . . . . . . . . . . . . 11
1.3.1 Diamond Care and Installation of New Diamonds . . . 11
1.3.2 Diamond Alignment . . . . . . . . . . . . . . . . . . . 13
1.3.3 Backing Pieces . . . . . . . . . . . . . . . . . . . . . . 18
1.3.4 Cleaning the Diamond Anvil Cell . . . . . . . . . . . . 22
1.3.5 Gasket Preparation . . . . . . . . . . . . . . . . . . . . 23
1.4 Using the Apparatus . . . . . . . . . . . . . . . . . . . . . . . 30
1.4.1 Preparing the DAC for a Measurement . . . . . . . . . 30
1.4.2 Initial Procedures . . . . . . . . . . . . . . . . . . . . . 33
1.4.3 Cooling Down . . . . . . . . . . . . . . . . . . . . . . . 37
1.4.4 Controlling Temperature . . . . . . . . . . . . . . . . . 45
1.4.5 Preparing the Cell for Loading with Liquid He . . . . . 47
1.4.6 Loading the Cell with Liquid He . . . . . . . . . . . . . 48
1.4.7 Changing Pressure . . . . . . . . . . . . . . . . . . . . 50
1

2 Measurements 53
2.1 Measuring Susceptibility . . . . . . . . . . . . . . . . . . . . . 53
2.2 Measuring Pressure using Ruby Fluorescence . . . . . . . . . . 56
2.2.1 Ruby Fluorescence . . . . . . . . . . . . . . . . . . . . 56
2.2.2 Measurement . . . . . . . . . . . . . . . . . . . . . . . 57
2.2.3 Lasers . . . . . . . . . . . . . . . . . . . . . . . . . . . 59
2.2.4 Optical System . . . . . . . . . . . . . . . . . . . . . . 60
2.3 Measuring Pressure using the Raman Diamond Vibron . . . . 64
2.4 Measuring the Diamond Separation . . . . . . . . . . . . . . . 67
2.5 Problems with Ruby Measurements . . . . . . . . . . . . . . . 69
3 Problems with the Equipment and Maintenance Info 71
3.1 Laser Power Supply Board . . . . . . . . . . . . . . . . . . . . 71
3.2 Photomultiplier Tube . . . . . . . . . . . . . . . . . . . . . . . 71
3.3 Pickup Coil . . . . . . . . . . . . . . . . . . . . . . . . . . . . 72
3.4 Capillary Line Connection . . . . . . . . . . . . . . . . . . . . 72
3.5 Thermometers . . . . . . . . . . . . . . . . . . . . . . . . . . . 73
3.6 Laser Power . . . . . . . . . . . . . . . . . . . . . . . . . . . . 73
4 The Coil System 75
4.1 Winding the Tissen Side-by-Side Coil System . . . . . . . . . 75
4.2 Winding the Cornelius/Klotz Coil System . . . . . . . . . 82
4.2.1 Cornelius/Klotz Secondary (Pickup) Coils . . . . . . . 82
4.2.2 Cornelius/Klotz Primary (Field) Coil . . . . . . . . . . 85
4.2.3 Miniaturized Coils (Andy) . . . . . . . . . . . . . . . . 85
2

4.2.4 Epoxies . . . . . . . . . . . . . . . . . . . . . . . . . . 86
4.3 Common Pitfalls . . . . . . . . . . . . . . . . . . . . . . . . . 86
5 Micro Spot Welder Guide 88
5.1 Overview . . . . . . . . . . . . . . . . . . . . . . . . . . . . . . 88
5.2 Components . . . . . . . . . . . . . . . . . . . . . . . . . . . . 88
5.2.1 Power Supply . . . . . . . . . . . . . . . . . . . . . . . 89
5.2.2 Tungsten Electrode . . . . . . . . . . . . . . . . . . . . 89
5.2.3 Lower Electrode . . . . . . . . . . . . . . . . . . . . . . 90
5.2.4 Gold/Platinum Wire . . . . . . . . . . . . . . . . . . . 90
5.3 Preparations . . . . . . . . . . . . . . . . . . . . . . . . . . . . 90
5.4 Welding . . . . . . . . . . . . . . . . . . . . . . . . . . . . . . 93
5.5 References . . . . . . . . . . . . . . . . . . . . . . . . . . . . . 95
6 Quick Guide for using the Current Ramping Control Unit 96
6.1 Overview . . . . . . . . . . . . . . . . . . . . . . . . . . . . . . 96
6.2 Connections . . . . . . . . . . . . . . . . . . . . . . . . . . . . 96
6.3 Start up tutorial . . . . . . . . . . . . . . . . . . . . . . . . . 96
6.4 Controls . . . . . . . . . . . . . . . . . . . . . . . . . . . . . . 99
6.4.1 Max Output Dial . . . . . . . . . . . . . . . . . . . . . 99
6.4.2 Rate Dial . . . . . . . . . . . . . . . . . . . . . . . . . 99
6.4.3 Sweep Toggle Switch . . . . . . . . . . . . . . . . . . . 99
6.4.4 Set Button . . . . . . . . . . . . . . . . . . . . . . . . . 99
6.4.5 Start Button . . . . . . . . . . . . . . . . . . . . . . . 100
6.4.6 Pause Button . . . . . . . . . . . . . . . . . . . . . . . 100
3
6.5 Dial Position Values . . . . . . . . . . . . . . . . . . . . . . . 100
6.6 Programming . . . . . . . . . . . . . . . . . . . . . . . . . . . 101
7 Vickers Hardness Indenter 102
7.1 Background . . . . . . . . . . . . . . . . . . . . . . . . . . . . 102
7.2 Instructions . . . . . . . . . . . . . . . . . . . . . . . . . . . . 102
7.3 Results: . . . . . . . . . . . . . . . . . . . . . . . . . . . . . . 104
8 Copper Plating 107
9 Resistivity Measurments in the DAC 109
10 Making an Insulated Gasket 121
10.1 Insulating the Gasket . . . . . . . . . . . . . . . . . . . . . . . 121
10.2 Making a Sample Chamber . . . . . . . . . . . . . . . . . . . . 121
10.3 Making the electrodes . . . . . . . . . . . . . . . . . . . . . . 124
10.4 Putting electrodes on the gasket . . . . . . . . . . . . . . . . . 125
10.5 Making insulation materials for resistance measurements in DAC127
10.5.1 Diamond powder + Epoxy glue . . . . . . . . . . . . . 127
10.5.2 Other Materials . . . . . . . . . . . . . . . . . . . . . . 128
4

List of Figures
1.1 Diamond Anvil Cell components . . . . . . . . . . . . . . . . . 9
1.2 Jigs for supporting diamonds during gluing process. . . . . . . 14
1.3 Jig used for removing the backing pieces. . . . . . . . . . . . . 19
1.4 PPMS measurement on gasket and backing piece materials. . . 20
1.5 PPMS measurements on the WC sample from Kennametal . . 21
1.6 Gasket punch . . . . . . . . . . . . . . . . . . . . . . . . . . . 25
1.7 Oxford “flow” cryostat. . . . . . . . . . . . . . . . . . . . . . . 38
1.8 Oxford “flow” cryostat. . . . . . . . . . . . . . . . . . . . . . . 39
1.9 New liquid He tranfer tube . . . . . . . . . . . . . . . . . . . . 40
1.10 The old liquid He transfer tube . . . . . . . . . . . . . . . . . 42
1.11 Plot of membrane vs. sample pressure . . . . . . . . . . . . . 51
2.1 Original DAC optical setup. . . . . . . . . . . . . . . . . . . . 61
2.2 Schematic of modified optical setup. . . . . . . . . . . . . . . . 63
2.3 Raman scattering . . . . . . . . . . . . . . . . . . . . . . . . . 65
2.4 Raman measurement setup . . . . . . . . . . . . . . . . . . . . 66
2.5 Raman diamond vibron spectrum . . . . . . . . . . . . . . . . 68
2.6 Helium density . . . . . . . . . . . . . . . . . . . . . . . . . . 69
4.1 Side-by-side coil system . . . . . . . . . . . . . . . . . . . . . . 76
4.2 Coil form for winding side-by-side coil . . . . . . . . . . . . . . 77
5
4.3 Exploded view of the coil winding sprig. . . . . . . . . . . . . 77
4.4 Coil winding configuration . . . . . . . . . . . . . . . . . . . . 78
4.5 Spark welding circuit . . . . . . . . . . . . . . . . . . . . . . . 81
4.6 Typical delrin coil form used for winding pickup coils. . . . . . 83
5.1 Micro spot welding power supply and micromanipulator. . . . 89
5.2 Pulse profiles for micro spot welder . . . . . . . . . . . . . . . 90
5.3 Flattened tip of the gold wire . . . . . . . . . . . . . . . . . . 91
5.4 Layout of components for bonding wires to small samples . . . 92
5.5 Welded gold wires . . . . . . . . . . . . . . . . . . . . . . . . . 94
5.6 Examples of samples wired with the micro spot welding unit. . 95
6.1 Controls for current ramping device . . . . . . . . . . . . . . . 97
6.2 One of the power supplies used with the current ramping device. 98
7.1 Vickers hardness indenter . . . . . . . . . . . . . . . . . . . . 103
7.2 Diamond indentation for measuring hardness. . . . . . . . . . 103
7.3 Steel hardness conversion table for Vickers HV 0.5 . . . . . . . 105
8.1 Setup for copper plating the DAC piston. . . . . . . . . . . . . 108
9.1 Hole drilled in Rhenium gasket with EDM. . . . . . . . . . . . 110
9.2 The insulation tape cur out in the preindented area. . . . . . . 111
9.3 Diamond powder filled in the preindented area. . . . . . . . . 112
9.4 Insulation layer after being pressed. . . . . . . . . . . . . . . . 113
9.5 Crazy glue on the perimeter of the preindented circle. . . . . . 114
9.6 Sample chamber . . . . . . . . . . . . . . . . . . . . . . . . . . 115
6

9.7 Initial electrode position. . . . . . . . . . . . . . . . . . . . . . 116
9.8 Resistivity measurement electrode arrangement . . . . . . . . 117
9.9 Resistivity sample space under pressure . . . . . . . . . . . . . 118
9.10 Final position of the electrodes over the hole. . . . . . . . . . . 119
9.11 Clamp in resistivity measurements . . . . . . . . . . . . . . . 120
10.1 Preparation of insulating gasket . . . . . . . . . . . . . . . . . 122
10.2 Insulating powder for insulating gaskets . . . . . . . . . . . . . 122
10.3 Insulating layer of powder on gasket . . . . . . . . . . . . . . . 122
10.4 Sample space for non-hydrostatic measurements . . . . . . . . 123
10.5 Electrodes and sample chamber . . . . . . . . . . . . . . . . . 123
10.6 Resistivity measurement sample chamber . . . . . . . . . . . . 124
10.7 Cutting platinum electrodes . . . . . . . . . . . . . . . . . . . 125
10.8 Culet and pre-indendented area with electrodes . . . . . . . . 126
10.9 Placing electrodes . . . . . . . . . . . . . . . . . . . . . . . . . 126
10.10Pressing electrodes . . . . . . . . . . . . . . . . . . . . . . . . 127
10.11Keeping electrodes in place . . . . . . . . . . . . . . . . . . . . 128
10.12Gasket with electrodes in place . . . . . . . . . . . . . . . . . 129
10.13Gasket and wires on the gasket holder. . . . . . . . . . . . . . 130
10.14Diamond powder and epoxy mixture . . . . . . . . . . . . . . 131
7
1. Operation of the Diamond Anvil Cell
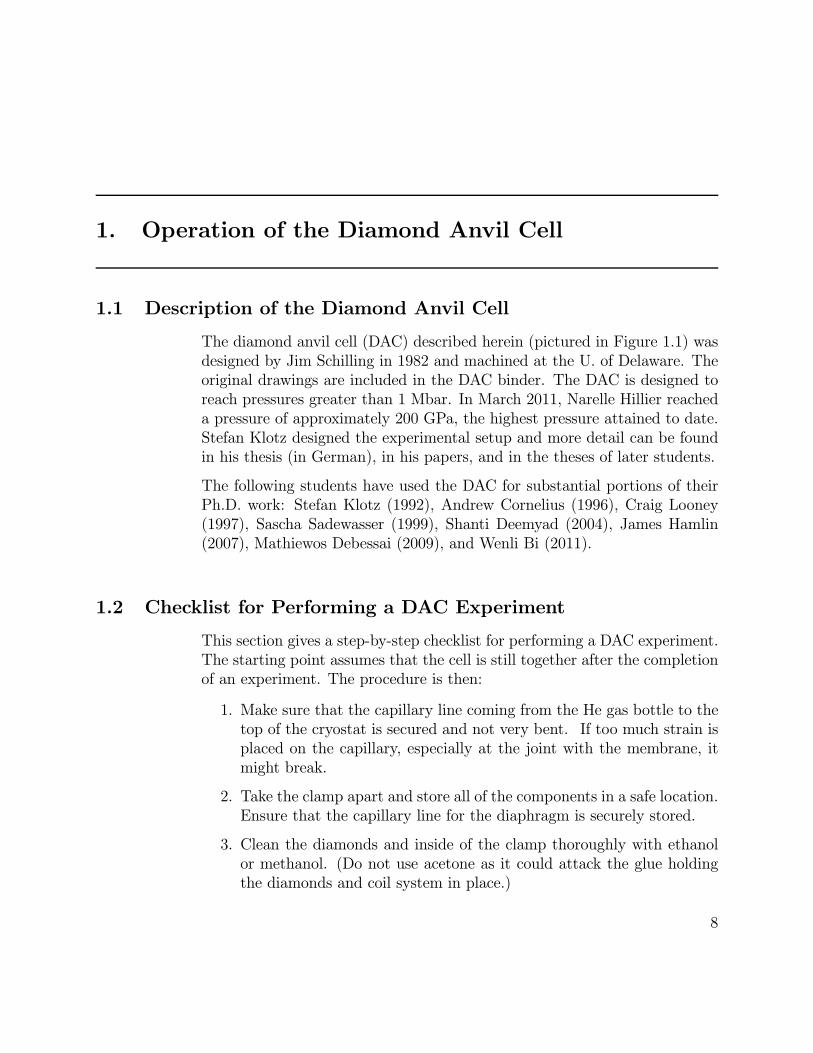
1.1 Description of the Diamond Anvil Cell
The diamond anvil cell (DAC) described herein (pictured in Figure 1.1) was
designed by Jim Schilling in 1982 and machined at the U. of Delaware. The
original drawings are included in the DAC binder. The DAC is designed to
reach pressures greater than 1 Mbar. In March 2011, Narelle Hillier reached
a pressure of approximately 200 GPa, the highest pressure attained to date.
Stefan Klotz designed the experimental setup and more detail can be found
in his thesis (in German), in his papers, and in the theses of later students.
The following students have used the DAC for substantial portions of their
Ph.D. work: Stefan Klotz (1992), Andrew Cornelius (1996), Craig Looney
(1997), Sascha Sadewasser (1999), Shanti Deemyad (2004), James Hamlin
(2007), Mathiewos Debessai (2009), and Wenli Bi (2011).
1.2 Checklist for Performing a DAC Experiment
This section gives a step-by-step checklist for performing a DAC experiment.
The starting point assumes that the cell is still together after the completion
of an experiment. The procedure is then:
1. Make sure that the capillary line coming from the He gas bottle to the
top of the cryostat is secured and not very bent. If too much strain is
placed on the capillary, especially at the joint with the membrane, it
might break.
2. Take the clamp apart and store all of the components in a safe location.
Ensure that the capillary line for the diaphragm is securely stored.
3. Clean the diamonds and inside of the clamp thoroughly with ethanol
or methanol. (Do not use acetone as it could attack the glue holding
the diamonds and coil system in place.)
8

Figure 1.1: The DAC. In addition to the piston and body, the force plate
(which sits on top of the diaphragm, not shown), the retaining ring, and
the torquing tool for the retaining ring are pictured from left to right in the
foreground.
9

4. Ensure that the diamonds are still aligned.
5. Punch out a gasket and pre-indent to the desired thickness.
6. Drill the hole in the gasket. Make sure that the hole is centered on both
sides!!!!! This is also an indication of how well the diamonds are aligned
and whether the piston is wobbling at all. If required (for hydrostatic
measurements), sputter gold onto the gasket.
7. If you have previously removed the coil system (usually this is not
necessary) or are installing a new one, mount the coil system in the cell
if you have not already done so.
8. Check coil system contacts. For the present (2011) side-by-side coil
system, for which the primary and pick-up coils are both wound with
60 m Cu wire, the resistance values should be about 23 Ohms for each
coil (primary or pick-up), so the total resistance of the balanced coils
will be about 46 Ohms. The resistance of the primary coil should be
slightly larger than that of the pick-up.
9. Place an ∼100 m MgB2 sample in the compensation coil. It can oftenbe placed in a small piece of tape, making it easy to remove at a later
time.
10. It has been found that the low temperature background of the suscep-
tibility is better (i.e. flatter) when the position of the dummy gasket in
the compensation coil is adjusted so as to give the best compensation.
To do this, measure the susceptibility of the body part of the DAC
with no gaskets. Place the dummy gasket (same material as the real
gasket) on a piece of clay in the compensation coil and balance the real
(pre-indented and drilled) gasket on the body diamond - no clay is nec-
essary. Adjust the height of the dummy gasket until the susceptibility
signal is as close as possible to the original signal with no gaskets. It is
easiest to rest the dummy coil on top of the clay in the compensation
gasket and to gradually push it down further into the clay until the
desired signal is achieved.
11. Put the (pre-indented and drilled) gasket onto the piston diamond,
securing it in place with a small amount of clay. Be sure that no clay
gets onto the diamond culet. If the sample is air sensitive and needs
10

to be loaded in the glove box, a small amount of UHU epoxy may be
mixed with the clay so that the gasket will not be accidentally knocked
off in the glove box.
12. Obtain a suitably sized sample and place it, along with a ruby piece
(or pieces), on the piston diamond.
13. Put cell together and put in cryostat.
14. Check all electrical connections for the DAC and the thermometry.
Make sure that the correct resistance is measured and that there are
no ground contacts.
15. Pump on the cryostat insulation and the diaphragm membrane line
before the first cooldown. (The insulation should be pumped on each
time the system is cooled, while the diaphragm line should be pumped
during every cooling prior to the application of pressure.)
16. Make sure that the ruby -lines are visible.
17. Obtain a zero pressure measurement and make sure that the transition
and background noise are as expected.
18. Load He pressure medium if performing a hydrostatic measurement
19. Normally measurements are made by increasing pressure in the tem-
perature range 130-160K. Pressure can, however, be increased at any
temperatures as long as the temperature is above the melting curve of
He in the diaphragm.
20. When done, release the pressure very slowly (1 bar of diaphragm pres-
sure per 15-30 minutes).
1.3 Care of the Diamond Anvil Cell
1.3.1 Diamond Care and Installation of New Diamonds
It is important that the diamonds are cleaned thoroughly before proceeding
with any step involving the clamp. The diamonds are cleaned with ethanol
or methanol using either Q-Tips or Kimwipes wrapped around tweezers. (If
11
the diamonds are still mounted in the cell, do not use acetone, as it attacks
the glue holding the diamonds and the coil system in place.)
Every so often, one or both diamonds need to be replaced in the clamp. If
only the piston diamond needs to be replaced, no disassembly is required
(other than removing the piston from the cell). If the diamond in the cell
body needs to be replaced, the CuBe backing plate must be removed to
allow easy access. Any new diamond should be cleaned thoroughly in the
fume hood prior to mounting in the cell. (Trichloromethane and ultrasound
will clean the diamonds well. Chloroform also works well, and acetone can
also be used.)
A thin (25 ) disc of zirconium foil sits between each diamond and its back-
ing plate. If the diamond needs to be replaced, the zirconium foil probably
needs to be replaced as well. To punch out a zirconium disc, secure a piece
of 25 zirconium foil between two thin sheets of, for example, brass; the
25 foil is too thin to be punched out by itself. Put the “zirconium sand-
wich” in the gasket punch (see subsequent section on gaskets) and punch out
the disc the same way you would punch out a gasket. Remove the zirconium
from the middle and press it by hand between two hard flat surfaces in order
to smooth it out. Next, center the disc over the hole in the backing piece
(WC, B4C, or Russian alloy [NiCrAl]), and poke a hole in the disc, pushing
the foil against the insides of the hole in the backing. Previously, the extra
material was gently sanded away. More recently, however, the excess mate-
rial is simply left in the hole. As long as the excess foil is pushed up flush
against the sides of the hole so that optical access will not be hindered, this
will not cause a problem.
The clean diamond is then placed on the zirconium foil, centered over the
hole. When placing diamonds, it is best to position the facets such that
the diamonds will be in relative rotational alignment with each other. Make
sure that the foil can be seen coming out from underneath the diamond
on all sides. It should be possible to center the diamond within 250
of the center of the optical hole in the backing; the closer to the center
the better. To hold the diamond and foil in place while the glue dries, a
modest load should be placed on the diamond. Andy cobbled together a
simple device for this purpose, consisting of a plexiglas piece that fits over
the piston and the lower (cell) diamond support plate (the same diameter
12

plexiglas works in either case) and a cylindrical metal piece that fits snugly
in the plexiglas and puts the diamonds under a modest load, with a piece of
aluminum foil between the metal piece and the diamond for cushioning. The
lab now has more sophisticated “gluing jigs,” shown in Figure 1.2, which
effectively immobilize the diamonds while a modest force is applied by a
cylinder of plexiglas. The body (aka “lower”) diamond and its backing plate
fit inside the jig on the left, while the jig on the right bolts securely onto the
piston. For both jigs, tightening the screws on the top pushes the plexiglas
cylinder onto the respective diamond faces, thereby moving the diamond
slightly. To view the centering, place the gluing jigs upside down on top of
the light source so that the light passes through the plexiglass before reaching
the diamonds. Once the diamonds are well-centered, they may be glued to
the backing pieces by placing glue around the base of the diamond (using
a needle, for example). The glue is made by mixing Stycast 2850FT black
epoxy with 7.5% wt. of an epoxy resin hardener Catalyst 24LV. Be sure to
mix it well (about 10 minutes) to ensure that the catalyst starts working
and that the mixture is homogenous. The glue radius should extend beyond
the zirconium foil. No glue goes under the foil or between the diamond
and the foil. Be careful not to put too much glue around the diamond, as
it may get in the way of placement of the coil. After gluing the diamond
in place, allow the epoxy to harden slightly at 75C for about 20 minutes.
The diamonds should then be aligned. Afterwards, the gasket should be
pre-indented, as explained in a later section. Typically, this is just a rough
pre-indentation, as the diamonds may still shift slightly. It is also a good
way to check the alignement. Leaving the cell closed, the glue should then
be allowed to harden completely by leaving it at 75C overnight. Note that
it is important that the facets of the diamonds are in reasonable rotational
alignment before the glue dries because the bottom plate can only be moved a
couple of degrees — see section on diamond alignment. Also note, if replacing
the bottom (body) diamond, make sure there is a piece of ruby on the inner
edge of the optical hole in the backing plate. This serves as the “reference”
ruby for the pressure measurement (see section on measuring the pressure).
1.3.2 Diamond Alignment
After replacement of one or both of the diamonds, the diamond alignment
procedure must be performed. In addition, the diamond alignment must be
13

Figure 1.2: Jigs for supporting diamonds during gluing. The cell-body
backing plate sits in the jig on the left, while the jig on the right slides over
(and can be securely fastened to) the piston.
14

checked following each experiment (before gasket pre-indention), and cor-
rected if necessary. Most often, the cause of broken diamonds is misalign-
ment. There are 3 types of alignment: translational, rotational, and planar,
and the beginner should perform them all under the high-powered Nikon
metallurgical microscope. Later, when one can confidently and smoothly
move the piston in the cylinder (this takes some practice), it is possible to do
all of this under the stereo microscope. Using the high-powererd Nikon mi-
croscope may still be preferred, however, for very small culets, as it is easier
to tell whether they are properly aligned. Just keep in mind, however, that
both the X and Y directions are reversed in the metallurgical microscope.
Translational Alignment:
In translational alignment, the centers of the diamond culets are aligned.
First, bring the diamonds close together without touching. The safest way
to do this is to place the piston on the teflon support piece and slowly lower
the cell body over the piston. Make sure that the piston and cell body are in
the correct rotational orientation with respect to each other. The two brass
spacers should be alongside the teflon piece. Their height, and the height
of the teflon piece, is designed such that when the cell body is resting on
the spacers, the diamonds will not be in contact with each other. With the
spacers still in place, put the retaining screws in place and lower the side
screws so that the piston is held firmly in place. The brass spacers can then
be removed. Slowly bring the diamonds closer together by slowly loosening
the side screw, all the while gently pushing the cell body down. This is to
ensure that the piston is moving smoothly and continuously. If it gets stuck,
it could slip, allowing the diamonds to hit each other suddenly, which might
cause damage. It is usually a good idea to observe the diamonds through the
microscope while lowering the cell body over the piston. Gradually decrease
the separation of the diamonds until you can toggle between views of one
culet or the other by slightly adjusting the focus. If the coil system is out of
the cell, it is possible to observe the diamonds through the side holes in the
body of the cell - this can be useful in alignment, as it will be apparent if the
alignment is way off, and some adjustments may be made before performing
the final alignment using the microscope. The CuBe plate (on which the
body diamond is mounted) is held in place by two screws on the bottom of
the cell. These must be loosened slightly to allow the plate (and thus the
15

diamond) to be moved. There are three additional screws on the side of the
clamp that allow the bottom plate to be moved horizontally. To tighten one
of the screws, one or both of the other screws often needs to be loosened
first. Move the screws until the centers of the diamond faces are aligned. Be
patient, and make small adjustments to the position of the diamonds, so as
not to accidentally make it worse by adjusting it too far.
Rotational Alignment:
Note that this next step is often not necessary if care is taken while mount-
ing the diamonds to align the facets. The procedures is still included, how-
ever, for when such adjustment is required. Rotational alignment is done by
slightly loosening the two screws (previously mentioned) at the bottom of
the cell that secure in place the CuBe plate to which the bottom diamond
is attached. The holes for these screws have been made in such a way that
the CuBe plate can be rotated by a couple of degrees. It will probably be
necessary to slightly loosen the 3 translational adjustment screws (on the
side of the pressure cell, mentioned above) to allow the plate to rotate. Since
the facets are not perfect on the diamonds, a perfect alignment cannot be ob-
tained, but it should be possible to align most of the facets to within 5%-10%
of the length of a facet-side. After the rotational alignment is performed, it
will probably be necessary to go back and fine tune the translational align-
ment. Repeat both procedures until both the translational and rotational
alignment are satisfactory.
Planar Alignment: Beginner’s Procedure
Next, the planar alignment procedure is performed to make sure that the
faces of the diamonds are parallel. Place a large amount of salt on the upper
diamond and GENTLY put the piston in the clamp. Do not put the top
plate on the clamp during the alignment procedure so the three screws that
move the rocker (on the piston) can be accessed without taking the plate
off every time. Replace the bottom lamp on the high-power Nikon with the
Na lamp. The Na lamp requires a couple of minutes to warm up. Under
the microscope, manually apply force until the Na rings become visible. The
fringes occur due to the thickness of the Na layer. If pressure is applied more
than a couple of times, it is necessary to put on more salt as the salt layer will
16

become too thin (and the lines can be distorted, even when the alignment
is perfect!) Make sure that the rings are centered on the diamonds by using
the lines on the eyepiece. Simply count the number of fringes from the
center to each edge. The upper diamond is on a rocker, and it is adjusted
so the pattern is centered and the diamond faces are parallel. There are
three screws that move the rocker. If the center of the pattern is completely
off the diamonds, a decent amount of movement of the rocker is necessary.
First, remove the force on the diamonds. Loosen two of the screws (10)and then tighten the third screw. (Tighten the screw or screws where the
fringes are densest. Tightening a screw pulls the rocker up, thus increasing
the diamond separation in the area of the screw. Note that both X and Y
directions are reversed under the metallurgical microscope. Also remember
that the clamp is upside down when under the microscope, but right-side-
up when tightening/loosening the rocker screws. Thus, one must be careful
about keeping track of the DAC orientation so as not to worsen the alignment
with an adjustment!) If the alignment becomes so bad that the center of the
pattern is not even on the diamonds, take the piston out of the cell and
adjust the screws until the CuBe plate appears (to the naked eye) to be level
with respect to the rest of the piston. This should at least get you in the
ballpark. Once the center of the pattern is near the center of the diamonds,
it is often adequate to tighten one screw without loosening the other two
screws. Clean off the salt with methanol or ethanol (it may be necessary to
first use the sandpaper which is on the end of the screw tool to remove the
compressed salt), and the diamonds are ready.
Planar Alignment: Advanced Procedure - (Caution: Do not use this procedure unless you
are VERY comfortable working with the cell, and have 5 or more successful measurements
under your belt.)
Assuming the translational and rotational alignments have been performed,
the diamonds are brought close together, as in the above description of the
translational alignment procedure. The cell is oriented so that the piston is
on the bottom (on the Teflon cylinder) and the body is on the top, so that
the diamonds can be viewed through the microscope (binocular or metal-
lurgical). The diamonds are then slowly brought all the way together and
allowed to touch, by (for example) slowly backing off the safety screws. It
is essential that the cell slides down very slowly and smoothly and gently.
17

The mildest of sudden movements could damage the diamonds. When the
diamonds are all the way together, and the cell body is resting on the piston
with its own weight, interference lines will be visible where there is a gap
between the planar surfaces. The planes are closer together where the lines
are closest together. Another way to tell where there is a gap between the
diamonds is to observe the appearance of the interference fringes as the dia-
monds are gently brought into contact. Fringes will first appear on the side
where diamonds the diamonds touch and will move toward the side where
the diamonds are farthest apart. After separating the diamonds, make the
appropriate adjustments using the three screws that hold the hemisphere in
place. Tightening a screw pulls the rocker on that side, therby increasing the
diamond separation on that side. Then bring the diamonds back together
to check the alignment. If the fringes have gotten farther apart, you are on
the right track; if they have gotten closer together you have made things
worse. Repeat this procedure until the fringes disappear. After completing
the planar alignment, it may be necessary to readjust the translation align-
ment. Keep alternating these alignment procedures until both translational
and planar alignment are satisfactory.
1.3.3 Backing Pieces
Originally the diamonds were backed with B4C, but tungsten carbide (WC)
and a Russian Alloy (RA) are currently being used (since 2003 for WC and
since 2006 for RA). These are less prone to cracking. Note that the Russian
Alloy is Ni(Cr 39-41%)(Al 3-4%). More recently (2010), we have obtained
some RA and WC backing pieces with a 15half-angle cone in them. This
improves viewing and optical measurements.
It is not uncommon for there to be tiny cracks in the backing pieces (to which
the diamonds are glued). Very often, the cracks might not even be visible
because they are obscured by the glue used for attaching the diamonds.
Tiny cracks that do not cause any upheaval of the surface are probably OK.
However, if the cracks grow so large that they have caused the diamond to pop
off (due to an unlevel surface), then the backer must be replaced. Damage to
the surface, including scratches and gouges from breaking diamonds should
be removed using the diamond sandpaper on the grinder / polisher in the
lab. Secure the loose backing piece to the holder using a small amount of
18

Figure 1.3: Picture of the jig (made by C. Looney) for removing the backing
from the CuBe backing plate. The backing plate is placed upside down on
the disc on the left, and the cylinder on the right is placed over the top. The
dowel in the foreground is placed through the hole in the top of the cylinder
and is used to press out the backing, with help of the hydraulic press. If
using the backing pieces with the 15cone, make sure the appropriate-cone-
shaped dowel is used to remove the backing piece so that the force is evenly
distributed and the backing piece doesn’t break.
molten wax. Make sure that the backing piece is perfectly level.
Before removing the damaged backer, any glue holding it to the CuBe plate
should be removed. Putting the backer/CuBe assembly into chloroform with
ultrasound for a couple of hours should be sufficient. (Trichloromethane
should also work; acetone also attacks the glue but is not as effective.) Next,
press the damaged backer out of the CuBe using the hydraulic press and the
jig made by Craig Looney (see Figure 1.3). Usually the backer comes out
with the application of less than 100 lbs. under pressure. If removing a
backing piece with the 15half-angle cone, be sure to use the dowel with the
cone on the end.
When the backers are slightly undersized, they need to be glued in place
using the following procedure. Before putting in the new backer, make sure
19

Figure 1.4: PPMS measurements on various gasket and backing piece mate-
rials show magnetization versus temperature.
both its surfaces and that of the backing plate are clean. Mix the UHU
epoxy, and put a thin film of it in the cavity of the CuBe backing plate. Put
in the backer, making sure that the taper is in the proper direction. Also,
make sure that the glue does not cover the optical hole in the backer. Put
the assembly in a vice and heat with a heat gun to cure the epoxy, being
careful not to exceed 200C or the hardness of the CuBe may diminish. See
Table 4.1 for curing information for the UHU epoxy.
The WC and RA backers currently being used fit snugly into the CuBe
backing plate and should be pressed into place using the hydraulic press (up
to ∼1 ton). No glue is needed. Be careful to place the backing piece in the
20

Figure 1.5: PPMS measurements on a cylinder sample of WC (ROCTEC
500) from Kennametal (from Wenli Bi’s thesis).
21

backing plate or hemisphere with the 1taper in the correct direction. Before
inserting the cleaned backing pieces, place a small amount of molykote on
the (clean) inside surface of the backing plate. This helps the backing piece
to slide in smoothly and makes it easier to remove later.
It is important that both gasket and backing piece materials are non-magnetic,
otherwise a large temperature-dependent background will be present in sus-
ceptibility measurements. Mathew Devessai performed PPMS measurements
on various materials to test their magnetic properties. The results can be
seen in Figure 1.4.
The WC backing pieces with the 15half-angle cone were made by Ken-
nametal. Before having the new pieces manufactured, the magnetic proper-
ties of a small piece of the material (ROCTEC 500) were measured in the
PPMS. There is a very small ferromagnetic impurity at room temperature,
but the temperature dependence is small, as seen in Figure 1.5. Refer to
Wenli Bi’s thesis for more details. In subsequent susceptibility measurements,
the temperature-dependent background has proven to be small.
The Russian Alloy backing pieces with the 15half-angle cone were made
in the department machine shop. First, a disk of the appropriate thickness
was cut from one of the several rods of Russian Alloy material belonging to
the lab. Next, the disk was cut into three pieces of the same size. These
pieces were annealed and homogenized in the oven for 1 hour at 1200C and
then water quenched. The resulting material is very soft. It is from this
material that the backing piece with the 15half-angle cone were cut, with
the exception of the 1cone on the outside. The outer diameter was also left
very slightly larger. These pieces were then hardened in the oven at 750
C for 2 hours. The dimensions may change very slightly upon hardening,
hence the reason why the 1cone on the outside was not cut earlier - this
dimension is very critical. The machine shop technicians then able to cut
the 1cone on the hardened backing pieces.
1.3.4 Cleaning the Diamond Anvil Cell
After each experiment, the clamp is taken apart. Clean all parts of the DAC,
especially the piston and cylinder, to make sure that it is easy to put the
piston in and out. Make sure the wires are all okay. It is a good idea to
22

use the multimeter to make sure all of the connections are good. The radial
connectors to the BNC cables have, on occasion, had the ground short out
the normal connection. They become stressed at the point where the DAC
ends and often break. A small amount of time when checking things out
can save a lot later. It may be necessary to clean the back of the upper
diamond to insure that the light through the fiber optic cable reaches the
cell. The cleanliness of the diamond can be checked by looking at the piston
through the stereo microscope; it is possible to focus on the back of the
diamond from above. Simply focus on the culet like normal and then move
the focus down. The bottom of the diamond will then become visible. If
the back needs cleaning, find some of the thin walled hollow tubes (colored
heat-shrink tubing) and cut a piece of the appropriate length. Wedge a small
piece of Kimwipe in the tube and wet with methanol. (Do not use acetone,
which will erode the glue and can cause the diamond to come off – this
happened to C. Looney). Gently twist the tube on the back of the diamond.
Make sure the wedge is firmly in place or it might come out on the diamond,
and it is very hard to get it out. (It took Andy a day and a half to get a
piece out once - he finally got it out by using a syringe to get it unjammed
and one of the tubes with a small piece of chewing gum to remove it.)
1.3.5 Gasket Preparation
A gasket (∼2.8 mm diameter) with a central bore (size will vary depending
on the culet size) constitutes the pressure cell into which the sample, pressure
medium, and ruby are placed. Various materials have been used as gaskets in
high pressure experiments. Gasket materials must be both hard and ductile.
In addition, for susceptibility measurements it is important that they are
non-magnetic and non-superconducting. Materials which have been used
include:
• Ta(W 10%)
• W(Re 25%) ... superconducts at ∼ 5 K• Re ... superconducts at ∼ 5 K under strain• Ni(Cr 39-41%)(Al 3-4%) ... Russian Alloy• Ni(Mo 15.3%) ... from V. Tissen
23

• CuBe ... annealed at 315C for 3 hoursA new gasket must be made for each experiment. The gasket sheet needs
to be rolled down if the thickness is greater than desired. Currently, gaskets
are approximately 250 - 300 m thick (but gaskets up to 500 m have been
successfully used). Andy rolled out his gaskets (which were 90% Ta and
10% W) using a roller from the machine shop (located in the sheet metal
room). The gasket material can damage (and has damaged) the rollers, so
care needs to be taken. Roll down the metal slowly, and make sure the rollers
are clean in the area that you will be rolling the metal. Always roll in the
same direction and note that the edge that goes through the roller first will
be quite a bit thinner than the rest of the gasket material. Due to this large
gradient in the metal thickness, Andy only rolled enough to make one row
of gaskets at a time. Because of the difficulties with the Physics Department
rollers, subsequent (90-10 TaW) gasket material was rolled out by David
Kralik on 7/8/96 using the rollers in room Jolley 103 of the Mechanical
Engineering building. He successfully rolled a 1 mm thick disk down to
about 300 m. Although the group has moved to different gasket materials
in recent years (most notably rhenium for higher pressures) and has been
able to purchase such material in sheets of the appropriate thickness 250
m, the above information might still prove to be useful if it is necessary to
roll out gaskets for any gasket material.
Once the material has been rolled out to (or purchased at) the proper starting
thickness, the gasket blanks are made using a special tool that punches out
3 mm diameter disks, shown in Figure 1.6. Take the time to maximize
the usage of the gasket material. Sharply pound the tool to insure a clean
edge on the gasket. After punching the gasket, you will need to flatten it
with the hydraulic press (∼1/2 ton). Sand off any rough edges. Make asmall mark on the edge of the gasket using a scalpel. This is done so that it
will be possible to orient the gasket. The gaskets are small and easy to lose,
so extras should probably be scotch taped to a sheet of paper, with a note
regarding their thickness, etc. The gaskets need to be preindented before
an experiment can be done. First, make sure the diamonds are aligned.
Next, note the thickness of the gasket using the Tesatronic which reads in
m (take the difference of the values with and without the gasket between
the pointers). Mount the gasket on the piston diamond using, for example,
24

Figure 1.6: Gasket punch
25

a small amount of vacuum grease or clay to temporarily keep it in place.
Place the scalpel mark in a direction that can be remembered so the same
orientation can be kept, and make sure the gasket is centered as well as
possible on the diamond culet. Set the piston (with mounted gasket) on
the Teflon cylinder, and CAREFULLY lower the cell body over the piston.
Alternately, if you are confident the gasket will not fall off when the piston is
inverted, the piston (with mounted gasket) can be carefully lowered into the
body of the cell using the tool that screws into the back of the piston. Either
way, take care to insure that the guide dots on the piston and body coincide
(this guarantees a consistent orientation) and that the screw holes in the
piston align exactly with the guide slots. (Note: usually the coil system will
obscure any view of the diamonds, but if the coil system has been removed,
you can view the diamonds and gasket through the holes in the sides of the
cell body.) Before the diamonds press against the gasket, make sure one of
the guide screws is properly in place to insure that the piston does not rotate
once both diamonds are touching the gasket. GENTLY allow the diamonds
to touch the gasket, and then put the other guide screw in place. Place the
top plate, screw ring, and the torque wrench on the cell. (If you have lowered
the cell body onto the piston, you will of course have to carefully return the
cell to an upright orientation first.) To avoid any impulsive forces to the
diamond, when putting on the top plate, gently lower it on the piston by
putting a screwdriver in the hole of the top plate. The gasket is now ready
to be pre-indented.
The final gasket will be pre-indented to a thickness which depends on the
culet size being used. For a 500 m culet, this is generally 60-90 m. Typi-
cally, the gasket thickness should be about 1/3 of the hole diameter. There
is approximately 25 m backlash when force is applied manually. Therefore,
you take the thickness of the gasket, add 25 m, then subtract 60 m (as-
suming that is the desired thickness after pre-indentation) from this value.
This is how much the gasket needs to be indented. From past use, we found
that 1 of manual force corresponds to indenting 3.47 m. For example, if
the gasket is 282 m thick, then 282 + 25 (backlash) - 60 (desired thickness)
= 247 m needs to be indented, which corresponds to an angle of 71.2. Ifpolar graph paper is mounted on the force table, the angular displacement
of the handles of the torquing tool can easily be determined by eye. The
force should be increased by applying it a few degrees at a time and then
26

completely removing it. (Stefan once broke a diamond by applying the force
all at once). This prevents the diamond from cold-welding to the gasket.
When the desired angular displacement has been achieved, take the gasket
out of the cell to measure its thickness; if necessary, continue this procedure
(with the cell and torquing tool mounted in the same orientation as when
removed) until a thickness in the desired range is achieved. When finished,
note the total angular displacement (all subsequent gaskets of this material
pre-indented to this angular displacement will have nearly the same thick-
ness). Clean off the grease, or whatever else was used to keep the gasket on
the piston diamond, and sand off any edges on the gasket.
Next, a hole must be drilled in the gasket. The diameter of this hole, which
will contain the sample, rubies, and pressure medium, is typically 1/3 to 1/2
of the culet diameter. Presently the holes are drilled by means of a small
Electrical Discharge Machining (EDM) rig right in the lab. For detailed
operation instructions, consult the EDM manual. In the experience of this
author (C. Looney), the EDM drilling represents a substantial improvement
over previous drilling methods. (Among other things, it is easier to learn
and use, results in better centered and cleaner holes, and often takes less
time.) For a few years prior to the purchase of the EDM rig, the holes were
drilled using a special drill in Anne Hofmeister’s lab in the Department of
Earth and Planetary Sciences. Prior to that (1992 - 1998) the holes were
drilled on the watchmaker’s lathe in our lab. So that the reader can ap-
preciate the improvement in the drilling procedure, or in case it becomes
necessary (due to a failure of the EDM rig, for example) to once again use
the watchmaker’s lathe for drilling gaskets, the instructions for drilling the
gaskets on the watchmaker’s lathe have been preserved below. After drilling
(by any method), any resulting ridges around the gasket hole should be re-
moved or smoothed out as much as possible (using a pointer, for example).
However, be careful not to introduce any deep scratches on the flat surface
that could keep the gasket from sealing! Thoroughly clean off any grease,
glue, or whatever else may have been used to secure the gasket in whatever
drilling procedure was used.
A note on thicknesses, diameters, and centering criterion: Andy performed
simulations that showed that a thinner gasket allows a higher maximum
pressure. To compensate for the volume loss due to the thinner gaskets, the
hole diameter was increased to 330 m. However, care should be taken in
27

using the thin (60 m) gaskets, as it is possible for the final thickness to be as
low as 20 m or even less (depending on how much the diameter decreases)
because of the compressibility of helium. See page 67 for more details.
A note on centering: Craig’s rule of thumb was that the width of the flat
ring around the hole should not vary by more than 25%. He never had a
gasket fail (in a total of 5 applications of pressure), although it should be
noted that he never attempted to go beyond about 70 kbar of pressure.
Drilling Gaskets with the Watchmaker’s Lathe
First, a small indentation is made at the center of the diamond indentation
using a sharpened pointer to guide the drill bit. Make sure that the pointer
is sharp. Center this as well as possible. It is much easier to do this pro-
cedure if the 0.5x objective is used on the stereo microscope, because the
working distance is then large enough to do this while observing through the
microscope. It is also a good idea to superglue the gasket to an object that
can be firmly held, so as to prevent slippage. If the initial mark is off-center,
it can be moved slightly by placing the pointer in the hole and pushing in
the direction of the center. Do not apply too much force or the pointer will
break. Take the 150 m drill bit and rotate it by hand in the indentation to
see if the hole will start on center. If it does not, move the hole some more
and check again. When the starting indentation is satisfactory, the gasket is
mounted on the watchmaker’s lathe with vacuum grease and centered as well
as possible with the eye. Looking at a dentist’s mirror on a stack of books
through the stereo microscope, the gasket is gently moved until the drill is
properly centered with the pointer mark. A small amount of super glue is
applied around the edge of the gasket very gently and allowed to dry. Andy
found it much easier to do this through the microscope without looking at
the mirror. Allow the super glue to dry thoroughly. A smaller hole, with a
diameter of 100-200 m, is first drilled. The #10 (#6) holder of the lathe
holds the 150-250 (330) m bits. A little bit of Balzers vacuum oil placed on
the bit makes the drilling easier. Only a small amount of force is necessary
to drill the hole. Excessive or impulsive force will break the bit! One can
easily observe when the bit goes through the gasket. The gasket should then
be removed from the lathe and the hole checked for appropriate centering.
If this starter hole is off center, use the pointer tool to enlarge and center it
28

(checking with the appropriate sized drill bit). The final hole is then drilled.
If the final hole is insufficiently centered (check it under the microscope after
removing it from the lathe), discard the gasket and start over. To obtain high
pressures, it is of utmost importance that the final hole is centered. Note
again that only a very SMALL amount of force is required for drilling both
the (smaller) guide hole and the final hole.
Gold Sputtering the Gasket
For hydrostatic measurements, it is important that a thin layer of gold
be sputtered onto the both sides of the gasket both before and after pre-
indentation. This helps to esure that the gasket seals, trapping the helium
in the sample hole. To do this, first make sure that the gasket has not
scratches and that it is very clean. For gaskets that must be hardened, how-
ever, it is important that the gaskets be pre-indented BEFORE carrying out
the hardening procedure. To clean both sides of the gaskets after harden-
ing, use the Ar-etch feature on the hummer unit. Then proceed to sputter
gold on both sides. In this case the gasket is not sputtered with gold before
pre-indentation. To proceed sputter gold on the gasket, place the gasket in
the sample chamber of the sputtering device (Anatech, Ltd. Hummer VI-A).
Close the lid and turn on the power. Flush out the sample space with Argon
by opening the knob with the “1” all the way counterclockwise. The sample
space should seal, i.e. you should not be able to lift up the lid anymore.
After it has been pumping out for about 20 minutes, the pressure should be
about 20 milliTorr. Close the “1” valve and briefly open the Argon bottle to
fill the line with Argon. Open the valve again and flush the sample space.
Repeat several times. After the sample space has been flushed out with
Argon, close valve “1” all the way and open the Argon bottle. Slowly open
the valve until a pressure of 60-80 milliTorr is reached (it should be stable).
Basically, you want a flow of argon in the sample chamber when you are
sputtering. The settings should be on “Manual”, “pulse OFF”, and “plate
DC”. Turn on the voltage control and increase the dial until the current is 10
mA. Set the timer to about 12 minutes, and switch to “Automatic”. This
will ensure that the sputtering turns off after the desired time has elapsed.
You should see a purple glow when the sputtering is taking place. You will
probably want to keep an eye on it so that the pressure and current (via the
voltage) can be regulated. After sputtering gold on one side, turn off the
29

device, and allow the pressure in the sample space to reach an atmosphere
so that you can open the lid. Flip the gasket over and repeat the same
procedure for the other side.
1.4 Using the Apparatus
1.4.1 Preparing the DAC for a Measurement
After each measurement is completed, certain procedures must be followed.
It is necessary to carefully follow these procedures, because once they have
been done, it is often impossible to correct mistakes without having to start
completely over. It is worthwhile taking the time to do each step very care-
fully and not to rush anything. Make a note of any observations or values
that might seem important. You cannot take too much data.
After the gasket, sample, etc. from the previous measurement have been
removed, the diamonds and the clamp should be cleaned with ethanol or
methanol (administered using Q-tips or Kimwipes wrapped around tweezers,
for example). It might be necessary to use the sandpaper on the end of the
screw tool to remove the gunk from the diamond (worry about the face of
the diamonds and not so much about the sides). The sandpaper is simply
attached with epoxy, so it is easy to replace when it loses its effectiveness.
Make sure there is no vacuum grease remaining. If you have removed the
coil system, or are installing a new one, it can be placed in the cell at this
time. Whatever the case, make sure that the wires on the coil system are
intact (check contacts: resistance should be about 23-24 Ohms for each coil
[primary or secondary] in the present [2003] side-by-side configuration wound
with 60 m wire) and secured in place and that the solder leads will not come
in contact with the screws that hold the coil system in place. More recently,
the coil holder is glued to the bottom of the cell to hold it in place. This
eliminates the need for screws. The primary and secondary coils should be
brought out of the cell on opposite sides and then threaded through the teflon
screws which will be screwed into the sides of the cell. Note that the wires
from the coil should be soldered to the small circuit boards on the side of
the cell using Cd solder. If lead solder is used, the coils will pick up the
superconducting transition from lead at around 7K.
Before an experiment, the inside wall of the cell body (where the piston goes)
30
and the outside of the piston should be cleaned with acetone to remove any
dirt or grease. Spray the piston with TFL spray. After allowing it to dry,
wipe off any excess with a Kimwipe. After cleaning the piston, be careful
not to touch it, as grease from your hands will prevent smooth movement of
the piston at low temperatures. It is best to wear gloves to avoid this.
The gasket, sample, and ruby (or rubies) are now mounted by one of the
following two methods.
Method 1 (Andy): Lowering Piston into the DAC body
The gasket is placed on the piston diamond in the proper orientation. To
make sure the gasket is on properly, gently tap the piston: the gasket should
gently rock back and forth. If it continues to move in the same direction, it
is not on properly. If this problem persists, check to make sure any ridges
on the bottom of the gasket have been sufficiently removed. (Such ridges
are much less of a problem now that the gasket holes are drilled by EDM.)
After placing the piston on the Teflon cylinder, the clamp body is gently slid
onto the piston. On cell I, there are dots on the two halves of the clamp
that need to be aligned (on the top of the clamp). On cell II, there are two
faint arrows that should be aligned. Before the diamonds press against the
gasket, put one of the screws in the clamp. Slowly lower the cell body until
both diamonds touch the gasket. Turn the cell over while gently pressing
the teflon cylinder. This will ensure that the diamonds remain against the
gasket. Remove the piston and make sure the gasket is properly on the lower
diamond.
Make sure that the upper diamond is clean, and once it is, do not touch it
with anything besides the sample and ruby. Find a sample of suitable size.
If it is expected that the signal will be easy to see, a sample with dimensions
(70 x 70 x 20 m) should easily avoid being squashed by the walls of any
gasket starting with a hole diameter of 200 m. If it is necessary to boost
the signal size, you can try using a sample with a longest dimension of up
to half the initial hole diameter and a thickness of up to 30 m; however, be
aware that by pushing the limits of the sample size you greatly increase the
likelihood that the walls of the gasket will press on the sides of the sample
or that the diamonds will press directly on the sample, thereby introducing
an undesirable non-hydrostatic component to the pressure. In such a case
31

it is essential to monitor the space around the sample after every change in
the pressure (take photographs with the digital camera if necessary), and to
measure the gasket thickness at the end of the experiment to insure that it
is greater than that of the sample. There are generally two ways of making
the sample the right size: for sinters, the sample can usually be scraped and
a piece the right size can be found among the shavings; for single crystals,
the samples are usually very small and a portion of the sample can be cut to
the needed size using a good scalpel (this should be done in a container with
walls using vacuum grease because the sample is bound to fly around when
cut). A scalpel should be kept and used solely for this purpose. The sample
is placed on the upper diamond with a very small amount (or none if the
sample will stay on the diamond) of vacuum grease to insure that it stays on.
Use only a very small amount of grease or it may obscure the ruby pieces.
Try to put the sample on the diamond so the sample will be in the center of
the gasket hole. Sometimes there is a faint outline of the hole that remains
on the upper diamond to make this easier. Ruby, typically a single piece, is
then placed alongside the sample. The ruby will stick against the diamond
electrostatically so grease is not necessary. Try not to get the ruby too close
to the sample because it might press against the sample. One should try to
make the ruby slightly taller than the sample. This is because the 1-line is
extremely sensitive to non-hydrostatic conditions (it broadens significantly,
see Andy0s thesis). If non-hydrostatic conditions exist for the ruby, they
might also exist for the sample. Finally, the piston (with sample and ruby
mounted) is lowered into the cell body and secured against rotation.
Method 2 (Shanti): Lowering Cell Body Over the Piston
The upper (piston) diamond is cleaned, and then the gasket is attached (in
the appropriate orientation) using, for example, clay or the 2-component
(clear) UHU epoxy. The sample (of appropriate size, see comments above)
and piece or pieces of ruby are then placed on the diamond inside the gasket
hole. Shanti has never found it necessary to use vacuum grease to secure the
sample or the ruby pieces. The piston is then placed on the Teflon cylinder,
and the body of the DAC is carefully lowered onto the piston. Make sure the
orientation dots are aligned, and screw in the guide screws well before the
cell diamond reaches the gasket. Engage the safety screws to prevent the cell
diamond from touching the gasket. Slowly loosen the side scrws to lower the
32

cell body over the piston until both diamonds touch the gasket. Turn the
DAC over so that it stands upright, securely holding both top and bottom
to prevent any movement during this process. The DAC is now ready for the
next step.
A Note Regarding the Rubies
Originally, Stefan used multiple ruby pieces. On the other hand, Andy used
a single ruby piece, with a thickness greater than that of the sample, in
order to test for non-hydrostatic conditions (the 1 ruby line should broaden
noticeable if the diamond presses on it directly.) Shanti again reverted to the
multiple ruby technique, with a new twist: the rubies were specially grown in
a strain-free environment, and as a result, there are supposedly no variations
between ruby pieces in the fluorescence spectrum. This advantage probably
outweighs the advantages of the single ruby method (especially in light of
the fact that it is now possible to accurately monitor changes in the gasket
diameter, from which the height of the gasket can be estimated, by means
of the digital camera). The small ruby spheres currently (2008) used have a
3000 ppm chromium concentration. For more information, refer to: Chevrin,
Canny, and Mancinelli. High Pressure Research, 2001, Vol. 21, pp. 305-314.
A Note Regarding Non-Hydrostatic Measurements
Note that for non-hydrostatic measurements (typically with very small culets),
the hole in the gasket is completely filled with sample to ensure that a large
enough signal is attained.
1.4.2 Initial Procedures
Certain things need to be done at the very beginning of a measurement.
These include checking contacts and pumping various lines.
First, the resistances of each pair of coils, primary (field) and secondary
(pick-up) should be checked; the resistance should be about 23-24 Ohms for
each pair in the present (2003) side-by-side configuration wound with 60 m
Cu wire. Next, make sure that there is no electrical contact between the field
and pickup coils and that both coils are electrically isolated from the body
of the cell.
33

Once the sample has been properly mounted and the piston has been inserted,
the membrane is placed underneath the top plate and gently lowered onto the
piston. Put a small amount of molykote on the bottom side of the membrane.
Also put a small amount on the underside of the retaining ring. Do NOT put
any between the membrane and the top plate. It used to be important to
carefully orient the diaphragm line so that it could pass through the holes in
the support and the baffles. (Andy took special care to align the diaphragm
line with the hole for primary coil leads, which were always brought out
through the same hole.) Now, however, the orientation is not so critical,
since slots have been cut into the baffles and (more importantly) into the
support plate. Nevertheless, take care not to stress the diaphragm capillary
line, especially near the membrane. Make sure the protection screws are
slightly loosened (turned counter-clockwise) to insure that the piston can
move down. These screws are on the clamp to insure that the diamonds will
not touch each other if there is a gasket failure, but many students have not
used them (see below). These screws also help to protect the coil in the case
of diamond failure.
With the torquing tool in place, torque the tightening ring until it no longer
turns easily by hand (using the knurled rim, not the bars.) From this point,
the piston is backed off to create an ∼30 m gap between the diamond and
the gasket, which will insure that helium can easily enter the cell during
the cryogenic loading procedure. Since a 1 rotation of the torquing toolcorresponds to 3.47 m of piston motion, the torquing tool needs to be backed
off by about 8.6 to give the desired gap. This corresponds to a distance
of about ∼0.45 cm on the outer rim of the DAC. This procedure used to be
done under the metallurgical microscope to determine when the diamonds
had sufficiently pressed the gasket, but it has been found that working “by
feel” (as described above) works just as well, and it greatly reduces the risk
of damaging the diaphragm capillary, which had to be threaded through the
microscope support. Note that special care has to be taken if an air sensitive
sample is being measured: backing off the piston by too much may allow the
sample to oxidize. It will be necessary to get the cell into the cryostat and
flushed with He as quickly as possible.
If you wish to use the safety screws, here is the procedure (modified from
the original procedure somewhat due to the fact that the metallurgical mi-
croscope is no longer used). Just before backing off with the torquing tool to
34

create the gap, screw in the safety screws as far as they will go with “gentle”
torquing. (Don’t crank them down, or you will push the diamonds apart
slightly and thereby introduce errors into the screw adjustment. Just go as
far as you can using, say, only your thumb and middle finger on the screw-
driver.) At this point the screws will prevent the diamonds from coming any
closer together, because the motion of the piston is inhibited. The thread
on the side screws is 4-48, so 1 of the safety screw rotation corresponds to1.47 m of piston travel. Keeping this in mind, you can figure out how much
to back off the screws to prevent the diamonds from touching each other in
the event of a gasket failure without limiting the ultimate pressure of the
experiment. Previous editions of this manual have suggested backing the
protection screws off by 1/8 of a turn, which would allow 66 m of piston
travel. This is a bit simplistic: if the (pre-indented) thickness of the gasket
is (say) 50 m, the diamonds can still touch in the event of gasket failure;
on the other hand, if the (pre-indented) thickness of the gasket is 90 m, the
screws will prevent further motion of the piston when the gasket has been
compressed to a thickness of about 24 m. This could bring a premature
end to the experiment, since the final gasket thickness may reach less than
20 m. (The final gasket thickness depends on numerous factors including
original thickness, original diameter of hole, ultimate pressure, and how much
pressure fluid escapes during the initial pressure application). Perhaps the
best advice is to calculate the number of degrees the screws must be backed
off to give 10 m of clearance in the case of gasket failure. You will of course
need to accurately know the gasket thickness (which you should already have
measured and recorded) in order to do this. Note that even with this cri-
terion, a 20 m error either way could either allow the diamonds to touch
(in the event of gasket failure) or bring a premature end to the experiment
by limiting the ultimate pressure. That is why this author (C. Looney) al-
ways made sure they were well out of the way. It is also likely that (even if
properly set) the safety screws will not prevent damage to the diamonds in
the event of a typical gasket failure involving a “side-blowout”; that is, the
safety screws give no protection from lateral forces.
It is now time to screw the DAC onto the cryostat insert. Push the fiber optic
cable up so it will not interfere with the DAC. The DAC should be oriented
so that the hole where the pickup coil comes out of the DAC is nearest the
radial connectors on the insert. Previously, there were three thermometers
35
in the DAC: an Rh-Fe resistor near the cryostat heating element, and Pt
and Ge resistors mounted in a missile-shaped holder that screws into the
back of the piston. (The fiber optic cable also goes into this holder.) The
Pt thermometer was never calibrated but used the standard Pt-curve. The
Ge sensor (N2G) was recalibrated in 1995 by Craig Looney. The original
manufacturer’s calibration from the 1970s was found to have a couple of cali-
bration points with errors on the order of tenths of Kelvins. [Note: Any such
errors, in any thermometer calibration, can cause a kink in the DAC suscep-
tibility data that can be (and has been!) mistaken for the signal from the
sample.] Calibration charts and circuit diagrams for the DAC thermometers
should be kept handy in the DAC folder. The N2G low calibration was used
for the Germanium resistor. In August 2011, the Rh-Fe resistor was also
replaced with an Allen-Bradley carbon resistor that has a room temperature
resistance of ∼50 Ω. The Pt and Ge thermometers were also repaced witha single Cernox thermometer that can be used over the entire temperature
range during measurements. This thermometer is placed in the same holder
that previously held the Pt and Ge resistors. Be careful when screwing the
thermometer holder into the clamp. Andy liked to hold the clamp upside
down (before attaching it to the cryostat insert) to screw in the thermometer
holder in order to minimize torques on the thermometer wires. Check again
to be sure that there are no ground contacts in the thermometry. Slowly
lower the fiber optic cable into the hole in the thermometer holder. The
male thermometer connection on the holder is then attached to the female
counterpart on the insert. Thermometer contacts should then be checked
again.
After the cell has been attached to the cryostat insert, the capillary line
should be connected (tight enough to prevent a leak, but not so tight as to
damage the connection and put you out of business for a week or more), and
everything placed in the cryostat, make a final check of all the contacts. Also,
make sure that the cell (both sample and ruby) can be seen clearly through
the eyepiece when illuminated via the fiber-optic cable. If the diamonds are
dirty or there is too much grease, the sample and/or ruby may be obscured.
If this is the case, it is better to remount the sample after thoroughly cleaning
the diamonds. (You should really should have taken care of this earlier, but
if not, it is better to do it now than to start an experiment and not be able
to measure the pressure.) Make sure the ruby fluorescence line is visible at
36
room temperature and of a sufficient magnitude to be useful.
There are two valves on the He gas membrane system. One of the valves opens
the He to the membrane and the other opens the system to the outside to
remove pressure from the membrane. The diaphragm line should be pumped
on for at least 15 minutes with P ∼10−2 torr on the Pirani gauge on the turbopump. The valves may need to be opened slowly for the pumping to work
properly. It is a good idea to flush the membrane at least once with one bar
of pressure. (Note that the zero of the analog diaphragm pressure gauge has
a zero of -2 bar.) As of 2009, we have a new digital gauge for the membrane.
With an excitation voltage of approximately 20 V, the membrane pressure
(in bars) is given by
= 1 + 2059( − 1002)where is the voltage output of the gauge.
1.4.3 Cooling Down
An Oxford “flow” cryostat, shown in Figures 1.7 and 1.8 is used to cool
the DAC down. First, the cryostat insulation (aka OVC or “outer vacuum
chamber”) should be pumped down using a turbo pump or diffusion pump.
In the meantime, the transfer tube is placed in the liquid He dewar. With
the current transfer tube from Cryo Industies of America (seen in Figure ??),
the cold valve should be opened 1/2 a turn before inserting the transfer tube
into the dewar. This is to allow helium to flow through the transfer tube
and prevent it from getting clogged. The transfer tube should be lowered
into the dewar slowly (∼5 min) so that the pressure in the dewar remainsless than 1 psi. Make sure that the transfer line is clean and dry. Make
sure that the transfer tube is at least half an inch off the bottom of the
dewar so that it doesn’t freeze to the bottom. After the transfer tube
has been inserted, the cold valve may be closed. Always note the value
on the more sensetive of the two He gas meters and the He level in the
dewar before and after an experiment. Using the fact that 27 ft3 of He gas
corresponds to 1 liter of liquid, keep track of the He recovery rate (it is usually
in the 80 % range). It takes 1.5-2 hours to cool from room temperature
to helium temperatures. These values were obtained using the maximum
vacuum reading possible without causing fluctuations in the VC 30 vacuum
gauge needle. The actual cooling rate can be adjusted by supplying less
37

Figure 1.7: Oxford “flow” cryostat. (left) outer case with quartz window;
(middle) heat shield with quartz window; (right) sample tube with sapphire
window and copper gasket seal. Heater and Rh-Fe thermometer are in holes
in two of the three copper blocks on the bottom of the sample tube.
38

Figure 1.8: Oxford “flow” cryostat. (left) outer case with quartz window;
(middle) heat shield with quartz window; (right) sample tube with sapphire
window and copper gasket seal. Heater and Rh-Fe thermometer are in holes
in two of the three copper blocks on the bottom of the sample tube.
39
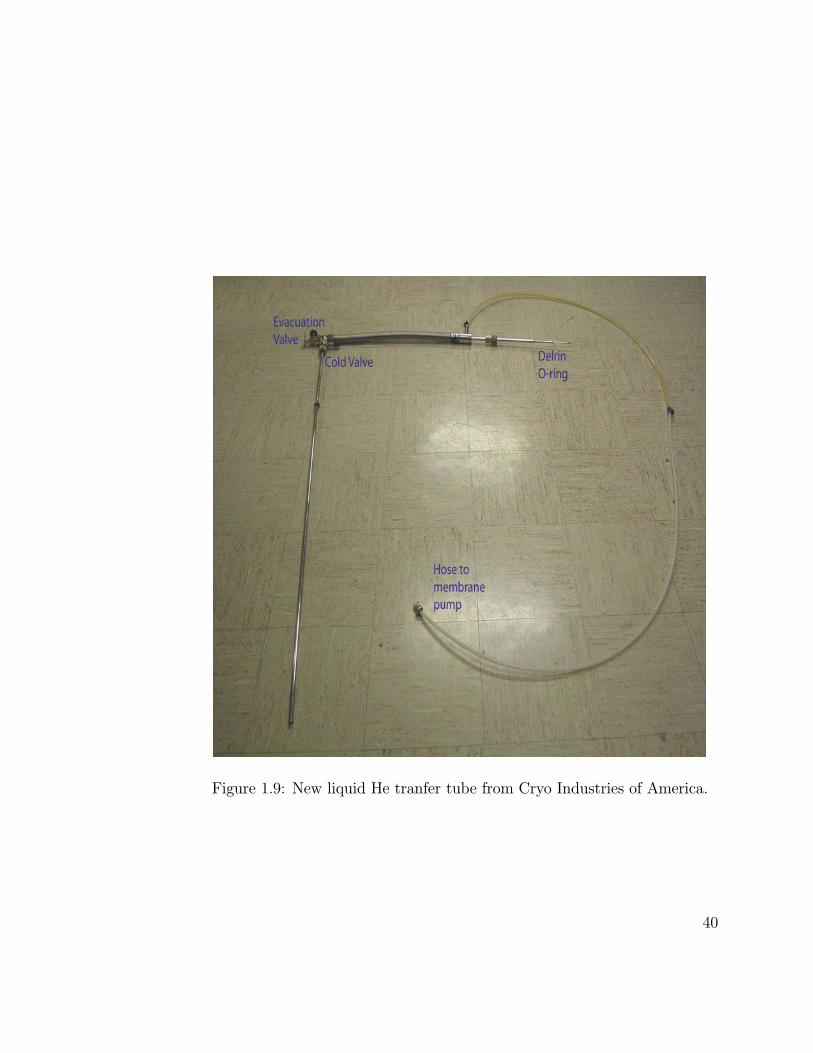
Figure 1.9: New liquid He tranfer tube from Cryo Industries of America.
40

underpressure with the membrane pump or by adjusting the needle valve on
the stem of the transfer tube shown in ??.
Original Cooldown Procedure: (old transfer tube)
In the “original” cooldown procedure (as described in the Oxford cryostat
manual), the old transfer tube, seen in Figure 1.10, is inserted all the way
into the cryostat arm but the connector is only tightened a couple of turns (it
is NOT tightened down). This will allow the helium to escape to the recovery
line without going into the cryostat, so that the transfer tube can be rapidly
and efficiently cooled when the membrane pump is turned on. (Consult
the cryostat manual, a copy of which can be found in the blue binder, for
details on the path taken by the helium.) When a sufficient vacuum has been
attained, open the transfer line valve on the wall and turn on (that is, plug
in) the He (membrane) pump when P∼5 x 10⁻² torr. The He needle on theflow control box will read about -0.7 bar (on the outside scale) until He starts
to go through the transfer line. When the reading goes down, the noise that
the He pump makes will change due to He coming through the line and going
through the plastic tubing. When this happens, the transfer tube connection
to the cryostat should be tightened firmly by hand to make the He go into
the cryostat. The tube should be closed but not too firmly. Only a Teflon
seal is used and it could be damaged if the tube is closed too tightly. Note:
the small Teflon piece marked in Fig. 1.10 sometimes comes off (when the
transfer tube is pulled out of the cryostat) and needs to be removed from the
arm of the cryostat. Continue pumping on cryostat with the turbo pump
until the cryostat begins to cool. Close the valve to the cryostat and remove
the turbo pump. As the temperature decreases, the transfer line should
be tightened as the Teflon contracts. If this is not done, the arm to the
cryostat will excessively frost up. Note that when the cooldown is started
from lower temperatures (70 K), the system will generally warm up a bit
(as much as 30 K if the cooldown is begun at 20 K) before cooling begins.
When you have cooled the system to the desired temperature, unplug the
pump and make sure that the helium gas can escape from the sample tube
to the recovery line. At the time of this writing (July 2003), the gas can
escape through an internal (not visible from outside) relief valve, installed so
that the “Alternate Cooldown Procedures” described below could be used.
Previously, it was necessary to open a valve by hand to connect the sample
41

Figure 1.10: The old liquid He transfer tube from Oxford
42
tube to the Helium recovery line.
To make the system more self-contained, Andy Cornelius performed tests to
see if a rotary pump was sufficient for pumping on the OVC. The pump was
allowed to run for a minute or so with the valve closed. The valve was then
opened and allowed to run for 5 minutes. The same procedure as used for
the turbo pump was then used. To use the rotary pump to cool down, simply
follow this procedure. Open the ball valve to pump on the OVC line. Make
sure that the ball valve for the cryostat is closed. This is important because
the OVC line is used to pump on vacuum, while the cryostat line will be
pumping on He. Do not allow the vacuum line to become contaminated with
He. Always make sure that vacuum parts are labelled vacuum or He and
never use one marked He to pump on a vacuum.
Alternate Cooldown Procedure: (old transfer tube)
This cooldown procedure (ca. 2003) has been devised to prevent potential
problems associated with a small leak in the membrane pump that could
result in blockages due to frozen air (presumably the water vapor component)
during cooldowns that begin at lower temperatures. In this procedure, the
cryostat insulation (OVC) and the diaphragm capillary are pumped down as
before. The flow valve on the VC30 flow control box is completely closed
and the sample tube is evacuated and backfilled to slight over pressure with
Helium gas, so that no air gets in when the He can is connected. The transfer
tube (already fully inserted into the He can) is then inserted into the cryostat
arm and (here is a major difference!) the connection is fully tightened. The
cooldown is then initiated by pumping on the sample chamber with the large
rotary pump; this pulls helium out the dewar through the transfer tube and
into and through the cryostat. When the temperature starts to go down
(the Rh-Fe thermometer in the heating element will react before those in the
DAC), the rotary pump is valved off and shut down, the membrane pump
is turned on (by plugging it in), and the flow valve on the VC30 box is
opened (in that order). [If the VC30 valve is opened before turning on the
membrane pump, air could leak into the system.] As the system cools, you
should check to make sure that the transfer tube connection is still tight (it
generally needs to be tightened eventually). When you have cooled down to
the desired temperature, close the VC30 valve and then unplug the membrane
43

pump.
New Cooldown Procedure: (new transfer tube)
A new transfer tube (see in Figure ??) was purchased from in early 2005
from Cryo Industries of America. This transfer tube has less problems with
sealing, and is superior in that there is more pre-cooling of the Helium gas.
The cooldown procedure is completed as follows. Place the delrin o-ring on
the end of the transfer tube arm. Make sure that the wheels on the dewar
are aligned so that it rolls in a straight line, making it easy to insert the
transfer tube into the cryostat arm. At this point, the (already flushed)
sample space should be filled with helium, and the balloon will be inflated.
Right before inserting the transfer tube into the arm of the cryostat, plug
in the membrane pump and open the flow valve for the membrane pump
by turning the knob on the VC30 flow control box counter-clockwise all the
way. You do not want to pump on air for longer than absolutely necessary.
If you put your finger near the hole on the arm of the transfer tube, you
will be able to feel that it is pumping. Remove the rubber stopper from
the cryostat arm, and quickly insert the transfer tube. To prevent air from
getting into the sample space, have somebody gently squeeze the balloon so
that there is a flow of helium out of the sample space. If noone is available to
help, it is possible to slightly open the helium bottle (that was used to flush
out the sample space) to obtain a flow of helium out of the sample space
when the stopper is removed. The transfer tube should be inserted all the
way into the cryostat arm. Make sure that it goes in properly. Tighten
the connection between the cryostat and transfer tube. Once the transfer
tube is in the arm of the cryostat, the balloon will rapidly deflate, since the
sample space is now being pumped on by the membrane pump. If you had
the helium gas bottle open, close it now. Close the black valve at the top
of the cryostat that connects the sample space to the line from the helium
bottle in order to prevent leaks and because the rubber hose line is very
dirty. Open the cold valve on the transfer tube 4 turns to allow cold helium
gas to flow into the sample space. After ∼3 minutes, you should see theindicator on the membrane pump flow gauge start bouncing up and down.
After ∼12 minutes, it should stabilize at a rate of ∼1.5-2 L/hr. At this
point, the cell should start cooling down. Note that if cooldown is begun at
lower temperatures (say less than ∼70 K), the cryostat will generally warm
44

up a bit (perhaps as much as 20-25 K) before it starts cooling. As the cell
cools, and the teflon o-ring contracts, periodically check that the connection
between the transfer tube and cryostat is tight so that no air can get into
the sample space. If it takes longer to start cooling, or seems to be cooling
more slowly than normal, it is possible that the transfer tube is clogged. In
this case, it will be necessary to turn off the membrane pump, disconnect
the transfer tube from the cryostat, and then romove it from the dewar. It
should be allowed to reach room temperature to remove any clogs. It is
possible to speed up this process by blowing COOL air from the hot air gun
on the transfer tube. Do NOT use hot air, as it could melt some of the
rubber parts in the transfer tube.
Using LN2 as Cryogenic Liquid
If the transition being measured occurs at high enough temperatures, liquid
nitrogen (LN2) can be used as the cryogenic liquid. The same general proce-
dures used for liquid He are used for LN2. A few differences do exist. First,
the turbo pump or a diffusion pump must be used to pump on the OVC
(LN2 does not cryopump as well as He). Also, the transfer tube needs to be
pumped on weekly. This is done by pumping on the evacuation valve shown
in Fig. 1.10. The evacuation valve is removable and is kept with the DAC
parts. If using He, the transfer tube needs to be pumped every six months
or so. The transfer tube is then placed in the LN2 dewar and everything
proceeds in a similar manner to using He.
1.4.4 Controlling Temperature
Sophisticated temperature control is generally not necessary for routine mea-
surements. The cooling rate can be reduced or increased by adjusting the
vacuum at the VC30 gauge. For slow cooling (during the measurement of
magnetic susceptibility) the vacuum should be reduced so that the needle
lines up with the black pen mark. For warming measurements, turn off the
membrane pump (pull the plug) at a temperature 10-30 degrees below the
temperature of the expected transition and open the system to the helium
recovery line.
Measurements below 4 K (both warming and cooling) are made by first
loading several inches of LHe into the cryostat (see Section 1.4.6) and then
45

pumping on the sample space to reduce the pressure, and hence the temper-
ature. To take measurements while cooling, turn on the rotary pump and
very slowly open the two-stage valve to bring the temperature down slowly.
Keep an eye on the temperature while you open this valve. It will probably
take a bit of practice to get used to doing this so that you have good control
over the temperature. Using the rotary pump, temperatures as low as ∼1.55K can be reached in this way. To reach lower temperatures (as low as ∼1.3K), it is necessary to turn on the large roots pump. This should be turned
on at ∼1.7-1.8 K. After it has been running for about a minute, open theball valve betweeen the pump and the cryostat. Be sure to hook up an
exhaust hose (we generally connect a additional blue hose to the hose which
is usually connected to the pump for the glove box. For slow, controlled
warming measurements in this temperature range, slowly close the two-stage
vavle while monitoring the temperature. By ∼2 K (or at least before the
-point of LHe at 2.19K), the valve should be completely closed. At this
point, you may close the ball valve to the roots pump (if it was being used)
and turn it off. Be sure to immediately vent the roots pump after turning it
off - if you don’t, you will hear it start to make noises. The temperature will
continue to increase naturally as LHe gradually boils off and the pressure
increases. Make as many cooling and warming measurements as desired, or
until you run out of LHe in the cryostat. It is important that the LHe be
above the top of the cell for measurements at low temperature so that there
is good thermal coupling between the sample and the thermometer.
Currently (2011), most measurements above 4K are performed while warming
naturally, i.e. by turning off the membrane pump and allowing the temper-
ature to drift upwards through the transition. For temperatures ∼3.5-5 K,however, any LHe that is boiling off can cause anomalies in susceptibility
measurements which could be mistaken for transitions. One way to avoid
this is to perform slow cooling measurements by using simultaneous heating
and cooling. Heating is provided by applying a current to a heater in the
cryostat (40 V, maximum). A power supply is connectedt o the current
ramping device designed by James Hamlin (see Section 6). Adjust the cold
valve (open ∼ 12− 1 turn) so that the temperature is stable, at say 10 K,
when a set current is applied. As the current is decreased using the current
ramping device, the temperature will slowly decrease. For slow cooling mea-
surements in the temperature range 3.5 - 10 K, it has been found that using
46

setting max = 027 A (V = 5.7) and using rate #8 on the current ramping
device gives good slow cooling measurements (the current will decrease at
∼ 54 mA/min).In some cases, it might be necessary to hold the system at an exact tem-
perature. Rough control can be obtained by reducing the underpressure (at
the VC30 gauge) and/or by throttling the transfer tube needle valve. For
stability, however, it is necessary to have the potential for both heating and
cooling. The Oxford ITC4 (or some other temperature controller) can be
hooked up for this purpose. Previously, the temperature sensor monitored
by the temperature controller was a Rhodium-Iron resistor, which was very
closely coupled to the cryostat and to the heater. Note that the thermome-
ters in the DAC are not closely coupled to the heater and thus should NOT
be used for temperature control. The temperature controller applies power
to the heater when necessary to maintain a constant temperature. The tem-
perature controller can also be used to “sweep” over a temperature range at
a programed rate by steadily increasing the heater power. In 2011, the Rh-
Fe resistor was replaced with an Allen-Bradley carbon resistor. The ITC4
temperature controller does not contain the calibration for this resistor, so it
cannot easily be used for temperature control.
The temperature controller or a manual heater can be used to rapidely warm
the system to room temperature. However, it is crucial that the Allen-
Bradley resistor (previously Rh-Fe) be used for monitoring the temperature.
(Since the cell thermometers can lag the Allen-Bradley (Rh-Fe) thermometer
by 50 K or more when heaters are applied, using them to monitor the tem-
perature during rapid warm-up can result in serious overheating of cryostat
components.) Before using the ITC4 (or any other temperature controller)
with the system, be sure to read the manuals for both the temperature con-
troller and the cryostat.
1.4.5 Preparing the Cell for Loading with Liquid He
To use liquid He as pressure medium in a hydrostatic pressure experiment,
it is necessary to successfully bring superfluid He into the sample chamber
of the gold-plated metal gasket. To achieve this, the following procedure
should be followed once the sample and ruby spheres have been properly
loaded inside the gasket hole onto the culet of the diamond anvil on the
47

piston. The body of the DAC should be carefully lowered onto the piston
which is propped up by a Teflon cylinder. Rotate the two small, vertical
safety screws so as to prevent the diamond anvil in the DAC body from
touching the gasket. Slowly loosen the safety screws to lower the DAC body
over the piston until both diamond anvils just touch the gasket as viewed
under the stereo microscope. Do not loosen further! Now turn the DAC body
upside down, insert the membrane with capillary, the top plate, and retaining
ring. Rotate the retaining ring until it is finger tight. The safety screws will
keep the anvils from pressing into the gasket, thus possibly preventing the
liquid He from entering the sample space. This is an important procedure to
ensure that liquid He can flow into the sample space when the entire DAC is
submerged in liquid He in the Oxford flow cryostat.
After the cell has been attached to the cryostat insert, make sure the protec-
tion screws are slightly loosened (0.13 mm corresponds to 1/4-turn of screw)
so that the opposing anvils can push into the gasket and generate very high
pressures. In case one diamond anvil fails, the safety screws will prevent
or reduce possible damage to the other anvil and/or the coil system (This
precedure was modified March 2014 by N. Forouzani).
1.4.6 Loading the Cell with Liquid He
Liquid He is used as a pressure medium in the DAC. He is the best possible
pressure medium to ensure a hydrostatic or nearly hydrostatic environment.
The liquid is allowed to accumulate in the cryostat where it is trapped in the
cell by applying pressure to the membrane.
The cell is cooled as normal. Make sure the transfer tube is kept tightened.
Use the Cernox resistor (or whatever low temperature sensor happens to be
installed) for the low temperatures, with the appropriate excitation current
(consult thermometer calibration chart). The membrane pump should give
a sufficient under-pressure in the cryostat to allow liquid to accumulate. If
no liquid is accumulating or if it is very slow, it is possible to use the rotary
pump to pump directly on the cryostat (this is the method previously used
regularly). This is not ideal, however. The preferred method (if necessary) is
to add a slight overpressure (∼2 psi) to the dewar. Using only the membranepump is best, as the vacuum in the cryostat can be read directly from the
VC30 gauge and a slight drop in the height of the flow rate indicator signals
48

that liquid has started to accumulate. The sample should become blurred
once He starts to accumulate in the cell. At this point, continue to pump at
the same level, adjusting the flow control valve if necessary, until a sufficient
amount of He has accumulated; generally this takes about 20 minutes, but
it can take longer. It is best to keep an eye on the helium recovery line
while loading LHe. Originally, it was necessary to pump for half an hour and
“hope for the best”, but during Shanti Deemyad’s tenure on the apparatus,
a He level meter was installed. As LHe starts to accumulate above the top
of the cell, the voltage across the level meter will decrease as the resistance
decreases. Using an excitation current of 70-75 mA, calculate the change in
the resistance in order to determine the LHe level. The resistance decreases
by 11.6 Ω/in. 5-6 inches of LHe should be sufficient. Do not leave the current
on the level meter on for longer than necessary, and be careful not to turn it
on when the sample space is under vacuum, as this can damage the sensor.
Turning it on while pumping on the sample space is alright as long as LHe
is present. For more information, read the manual that came with the
level meter. Note that, with an excitation current of 75 mA, the voltage is
approximately 10.8 V when no LHe is present. Once the desired amount of
He has accumulated in the cryostat, the temperature is lowered by pumping
on the helium until the temperature is below the point (2.19 K at 0.0508
atm and 1.8 K at 30 atm) where He becomes superfluid and will easily flow
into the sample chamber. In preparation for this, the VC30 valve is closed,
the membrane pump is shut off, and the rotary pump is valved off if it was
being used. (The rotary pump may be left on, because it will soon be used
again.) Let a slight overpressure build up (or hasten the process by supplying
helium gas), and then remove the transfer tube rapidly and steadily. Don’t
stop or the tip is likely to freeze in the arm from the cryostat. (It is highly
recommended that you get somebody to help you move the helium can so
that you can focus on removing the transfer tube.) Place the appropriate
plug in the arm of the cryostat to seal it off. If the transfer tube will not
be used again for cooling that day, remove it from the dewar. Pump on the
cryostat again by opening the 2-stage valve from the roatary pump. Pump
on the He for about 10 min while watching the temperature. When the He
becomes superfluid, it will be possible to see the sample clearly.
Once the He is superfluid, slowly open the valve to let the He gas enter the
membrane (do so slowly because room temperature gas is being allowed to
49

enter a region at 1.7 K). Apply the appropriate membrane pressure one bar
at a time while monitoring the gasket. [Roughly 10 bars for TaW and 16-17
bars for Rhenium]. While superfluid He is flowing into the sample space,
you may see some movement of the sample. As pressure is being applied,
the hole size should shrink somewhat. When the hole size stabilizes and the
sample stops moving, the gasket should be sealed. Take pictures with the
digital camera every few bars or so to record the changes in the gasket hole.
Monitor the pressure in the sample space using ruby fluorescence (see 2.2).
Once the sample space is sealed, the pressure should start to increase. After
you are done applying pressure, valve off and shut off the rotary pump, and
make sure the He has a path to the recovery line. The system will take a
while to warm up with all the liquid He that needs to boil off. It is probably
not a good idea to use the heater to warm up the system while there is still
liquid He in the cryostat because there could be a large pressure buildup.
1.4.7 Changing Pressure
The pressure in the DAC is increased by carefully opening the valve between
the gas bottle and the diaphragm capillary. One bar on the capillary gauge
will correspond to different pressures in the DAC depending on the culet size.
You can estimate the pressure by taking a ratio of the membrane area to the
culet area. While performing an experiment, it is always always a good idea
to keep a plot of membrane vs. sample pressure, as this can give and early
indication of problems. Figure 1.11 shows a plot of typical membrane vs
sample pressure for various culet sizes. It is vital that the pressure always
be increased at temperatures above the melting curve of the helium in the
membrane.
At the end of an experiment, the pressure is released slowly by opening the
venting valve. Andy typically released the pressure at room temperature at a
rate of 1 bar of diaphragm pressure every 15-30 minutes. However, in certain
circumstances it may be desirable to release the pressure at low temperatures.
Craig has released pressure at 6K at the rate of 1 bar of diaphragm pressure
every 10 minutes. When releasing pressure at low temperatures, be sure that
the temperature is high enough that the helium in the diaphragm line is not
frozen.
It is possible to partially release the pressure by releasing some, but not all,
50

Figure 1.11: Plot of membrane vs. sample pressure for various culet sizes.
Data in each case, excluding that marked W(Re25%) was taken with Re
gaskets. The 0.180 mm culets are beveled from 0.350 mm, and the 0.100
mm are beveled from 0.300 mm. Taken partially from James’ Hamiln’s thesis.
51

of the pressure in the diaphragm line. There will very likely be no pressure
change in the DAC until a couple of diaphragm bars have been released.
Note that releasing pressure in this manner requires the escape of some of
the pressure fluid from the gasket bore. Thus, there will be less space for the
sample/ruby for a given pressure.
52
2. Measurements
2.1 Measuring Susceptibility
A Stanford Research SR830 Lock-In Amplifier is used in conjunction with the
coil system (field and pick-up coils) and the measurement program to mea-
sure AC susceptibility as a function of temperature. A sinusoidal alternating
current is supplied to the primary coil by the SR830’s internal oscillator (via
the “SINE OUT” located right below the big knob), or by a high quality ex-
ternal oscillator or function generator. If an external source is used, it needs
to be connected to the “REF IN” terminal (which is next to the “SINE OUT”
terminal), so that the SR830 can phase-lock to it. The secondary (pick-up)
coils are connected to the inputs (terminal A or B or both, at the bottom
left of the front panel). As of this writing (2003), the secondary coil output
is actually fed to a preamplifier (SR554), and the output of the preamplifier
is connected to terminal A. However, there are many ways to use the lock-in
amplifier, and the setup may be modified several times before the next revi-
sion of this manual. [Just the other day (7/25/03) a signal subtracter was
removed from the measurement circuit because it was found to attenuate
the sample signal and cause temperature dependent phase shifts. If I had
included THAT device in this description, it would already be out of date...]
The best way to arm yourself is to dive into the lock-in amplifier manual and
familiarize yourself with the lock-in’s specifications and principles of opera-
tion. In particular, you should read the section of the SR830 manual entitled
“What is a Lock-in Amplifier?” (See also section 7.1 in Andy’s Cornelius’s
dissertation for discussion of the theory of a lock-in amplifier.) You probably
won’t understand everything at first, but you should periodically return for
more study until you understand why the system is set up the way it is. At
that point, you will be able to make improvements if necessary.
Without being overly specific, here is a general outline of how to make a mea-
surement. First, you need to set the oscillator voltage (internal or external)
to generate the appropriate magnetic field with the coil system. Actually,
53

what is really important is the CURRENT in the primary coil, but gener-
ally it is the VOLTAGE that is adjustable. An external resistor is generally
placed in series with primary coil to reduce the temperature dependance of
the current. You should measure the current that a given voltage produces
at the desired measurement current, and you should check to see that it
agrees with what you would have calculated based on the impedances in the
circuit. Don’t forget to include the output impedance of the source. Note:
the current might be frequency dependent because inductive impedances are
frequency dependent; whether or not frequency makes a big difference de-
pends on the inductance of the coil ... calculate it and see! In the present
configuration (2011), with a frequency of 1023 Hz, the inductance is not im-
portant, but the coil system might be changed substantially before the next
revision of this manual. Of course, you will also need to know B as a function
of I for the primary coil (which can be calculated using the short solenoid
formula from the number of turns and the diameter of each layer), as well
as the impedance of the circuit. Thus, with a knowledge of the actual cur-
rent, and B as a function of I, you can calculate the current that gives you
the desired magnetic field, and you can then adjust the source voltage (of
whatever oscillator is driving the coil) to give you the desired current. [Note:
be sure to include an external resistor in series with the primary coil that
has a substantially larger resistance than that of the primary coil; otherwise
the temperature dependence of the primary coil resistance will cause a large
temperature dependence in the applied magnetic field.]
Next, set the frequency of the oscillator (SR830 or external, whichever you
are using) to the desired value. Currently (2011) a ferequency of 1023 Hz is
used for ac susceptibility. Choose an appropriate measurement range to give
you the maximum sensitivity without the risk of going off-scale (overload
will not damage the lock-in but it will ruin your measurement), and set the
time constant to a value large enough to smooth out the bulk of the noise
but small enough to keep from compromising the response of the lock-in to
real changes in the signal. (Ranges between 1 sec and 10 sec have typically
been used, for example.) In the region of interest, you may have to use
the offset and expand functions of thelock-in amplifier to avoid digitization
of the signal. See the lock-in manual for an explanation of how this works.
Make sure the appropriate thermometer is selected for the temperature range
in which the measurement will be made. Then start up the measurement
54
program (set it to take data every [say] 0.001 K in the temperature range of
interest), cool down or terminate your cooldown (whichever is appropriate),
and you are in business. To date, the best measurements have been made by
warming “naturally” through the transition, no cooling or heating. You can
speed things up by ramping with the temperature controller. You can also
cool slowly through the transition by adjusting the flow control valve on the
VC30 box. [There is substantially more noise during cooling, perhaps from
the pump or maybe from the turbulence of the flowing helium, but if your
signal is relatively large you still might be able to get a ballpark measurement
that will help you locate the transition.]
Before starting the measurement, you should also set the “phase” (on the
SR830) so that a ferrite sample (with only a “real” susceptibility part) placed
in the coil system changes the voltage in only ONE channel of the lock-in
(x or y, but not both). If the phase of your coil system has an appreciable
temperature dependence, you will need to account for this. Note that you
only need to do the ferrite test when you are installing a new coil system (or
if you suspect that you have measured it incorrectly before, or if you have
added a new component to the pick-up circuit, like a preamplifier or signal
subtracter).
The measurement program currently being used was written in LabVIEW
by Mathiewos Debessai. Previously, a measurement program written in
QuickBasic by Jost Diederichs (with some assistance from Craig Looney) in
1992-93 was used. A description of how to use each of these programs may
be found in the “Computer Programs” manual.
After an experiment, the raw data includes background from the clamp and
the gasket that needs to removed to clearly see the desired transition. A
description of the various background components is given in Andy’s thesis.
Andy used to fit a polynomial (usually quadratic or cubic) to the data, and
then subtract it from the data, in the hope that only the signal from the
sample’s transition would remain. However, anything beyond a 1st order
(linear) fit can introduce wiggles that can easily be mistaken for a transition.
It is probably better to subtract a straight line from different regions of the
measurement until the signal is found. (In Origin, one can perform a linear
fit to a selected portion of the data, and then subtract this curvefit from the
data.) Another method (developed by Shanti Deemyad that can work very
55

well is to subtract the data from two data sets obtained under similar mea-
surement conditions (field, frequency, rate of warmup, etc.). The background
contributions will largely cancel, leaving the two transitions (one from each
measurement). This is fairly easy to do using the Origin plotting program,
which has a built in algorithm for interpolating between data points. When
practical, this method is perhaps the best of all.
2.2 Measuring Pressure using Ruby Fluorescence
(This section was modified December 2001 by J.S. Schilling and September
2011 by N. Hillier)
2.2.1 Ruby Fluorescence
At ambient pressure and temperature the1 and2 fluorescence lines of ruby
are located at 6942.4 A (Angstrom) and 6929 A, respectively (in both Stefan’s
and Andy’s theses the order is reversed!). Although the 2 line is comparable
in size to the 1 line at ambient temperature, at helium temperatures the
2 line is very weak. Under pressure both lines shift initially at the rate
of +3.646 A/GPa to longer wavelengths. This pressure dependence remains
constant to liquid helium temperatures, even though the lines themselves
shift by approximately 8 A to shorter wavelengths as the temperature is
decreased from 300 K to 100 K; below 100 K there is little temperature
shift. There are many references dealing with the nearly linear shift of 1with pressure (see Section 6.2 of Andy’s thesis). One is excellent reference
is a review paper by K. Syassen (“Ruby under pressure”, High Pressure
Research, Vol. 28, No. 2, June 2008, 75-126). For the pressure dependence
of the wavelength of the 1 line into the megabar region we initially used
the following expression from p. 228 of a 1988 publication by Mao, Simple
Molecular Systems at very high density (see enclosures in this manual). The
following expression given therein is valid under hydrostatic pressure to about
50 GPa.
() =1904
7665
⎡⎣Ã1 + ∆(A)
69424
!7665− 1
⎤⎦ At low pressures this expression reduces to the above rate (+3.646 A/GPa).
From 2005 onwards, we have been using
56

() =1876
1071
⎡⎣Ã1 + ∆(A)
69424
!1071− 1
⎤⎦ which is valid to about 150 GPa [A.D. Chijioka (Silvera), J. App. Phys. 98,
114905 (2005)]. Currently, we are using ruby spheres obtained from Paris
[J.C. Chervin et al. High Pressure Research, 21, 305 (2001)].
Because 1 depends on temperature, it is necessary to measure pieces of ruby
both inside the pressure cell (at high pressure) and outside the pressure cell
(at ambient pressure) to obtain the pressure-induced shift ∆(A). Because
of the differing optical paths and angle of incidence into the monochromator,
the1 fluorescence lines from the sample and reference ruby pieces at ambient
pressure are not measured at exactly the same wavelength; the 1 line from
the reference ruby is normally located at approximately 0.3 - 0.7 A greater
wavelength than that from the sample ruby, but this shift changes when the
reference ruby is exchanged.
2.2.2 Measurement
The pressure is determined using a simple 1/4-wave monochromator (Jarrell
Ash Monospec 25) to measure the shift under pressure of the 1 fluorescence
line of ruby. The monochromator has two holographic plates with 30,000
lines/inch (blazed to 500 nm) and 60,000 lines/inch (blazed to 280 nm);
we use the 500 nm blaze. In front of the monochromator is a self-made 35
micron wide collimator which results in a resolution of 3-5 A. A driving motor
(SPEX 1673) set at 0.2 nm/s varies the wavelength of the monochromator.
Because the monochromator is not accurately calibrated, it is necessary to
measure the well documented spectrum from a neon lamp together with the
ruby lines using one of three recording methods listed below. The neon
lines normally measured are located at 7032.413 A, 7024.050 A, 6929.467 A,
6717.043 A, and 6678.276 A, respectively. The second line at 7024.050 A is
barely visible in our measurement (same result from Jodl’s group in Kaiser-
slautern), and can thus be neglected. The separation between the 1 ruby at
ambient pressure and the neon lines and between the neon lines themselves
should be regularly checked to insure that the pressure measurement system
is operating properly.
57

The detector connected to the monochrometer is either a photomultiplier
(PMT) or CCD detector. Currently (2011), the CCD is being used, but
a description of how to use the PMT tube has been preserved here in case
it ever becomes necessary to revert back. It is advised that you read this
section even if you will be using the CCD
Photomultiplier
The photomultiplier used is model R128 from Hamamatsu Photonics which
has a high sensitivity near 700 nm. A self-made two-stage preamplifier con-
verts the output current (typically 100 nA) into a voltage of approximately
1 V. A 1 kV power supply (Knottelektronik) supplies the necessary high-
voltage to the photomultiplier.
The output from the photomultiplier preamplifier may be recorded in three
different ways: (1) using the Linseis X-t plotter on the time range 1 mm/s,
or (2) using the chart recorder (Fischer Recordall series 5000) at the speed
9 cm/min, or (3) using the standard measurement program set to take data
every 0.1 second. The third method avoids possible errors in the pressure
estimate arising from variations in the mechanical plotter or chart recorder
speed. The monochromator is set at the desired starting value and placed on
the 0.2 nm/sec setting (note that this rate is not calibrated - look on the wall
for the proper calibration measurement). Using the two neon lines above
(7032.413 A and 6678.276 A), we obtain for the above settings that for the
X-t plotter 1 mm = 1.74 A, for the chart recorder 1 mm = 0.382 A, and for
the computer 0.667 A between measurements taken 0.1 seconds apart.
After the two ruby lines have been observed, turn on the neon lamp and put
the proper mirror in place. The power switch for the Ne lamp is near the mi-
croscope behind the optical setup board. Andy always made sure the height
of the neon line was 0.4 V on the DMM (this value changes dramatically
as the aperture is opened and closed - it will often need adjusting). Make
sure that the lamp is off and the mirror is moved back during the actual
measurement of the ruby lines because neon also has a line that coincides
with the ruby lines and the mirror will cut down on the intensity of the ruby
lines. After the ruby lines have been recorded, move the mirror (Halbdurchl,
Platte 2 in Figure 2.1) into place to allow the neon line to be recorded.
58

This procedure is repeated for the reference ruby that sits just below the
bottom diamond on the backing plate. If the clamp is always put in the same
way, the reference ruby will also be in the same place. Since the reference
ruby is much larger than the ruby pieces in the cell, it is much easier to find.
The peak location for 1 and the neon peak are determined by the location
of the center of the half-peak (half of the distance from the baseline to the
peak) and not the maximum of the peak.
Previously, when the driving motor was used, the ruby lines sometimes looked
unusual. This was due to the fact that the motor sometimes drove at an
incorrect speed. When it did this, the reverse button tended to make the
wavelength go back very quickly. The problem could almost always be solved
by turning the power off and on a couple of times on the driver. This is no
longer a problem with the new stepper motor and controller. If the ruby lines
are good, and if the driver is performing consistently, it is possible measure
the pressure to an accuracy of ±1.5 kbar by using the 0.2 cm/s setting onthe plotter. Always take at least two spectra to make sure the data is
reproducible.
CCD Detector
Measurements can also be made with a two-stage cooled CCD detector
(Hamamatsu HC 236-1007) which is connected to the monochromator. To
measure a spectrum, first turn on the CCD and open the LabVIEW pro-
gram “Hamamatsu Demo Kit.vi”. Select the correct camera/device from
the drop-down list (32-1007) and choose the desired exposure time. Align
the optics to maximize the ruby signal, and then save the spectrum. We
usually save several spectra and then average them together. Be sure to
also measure the reference ruby to determine the shift. Periodically check
that the calibration, set using the Neon lamp, is correct. This is especially
necessary if the monochrometor has been moved or if the center wavelength
of the monochromator has been changed.
2.2.3 Lasers
Three lasers have been used as various times for optical measurements.
• An argon-ion Laser (Ion Laser Technology, Salt Lake City, model 5425A)
59

with a maximum output power of approximately 150 mW outputs light
at two main wavelengths — 488 nm and 514 nm. This laser was ini-
tially used for measuring ruby fluorescence in the cryostat, but at high
pressure the 514 nm line is too low in energy to sufficiently pump the
ruby fluorescence, and the signal from the ruby will decrease. Cur-
rently (2011), it is used for Raman and ruby measurements outside of
the cryostat (through the metallurgical microscope).
• A He-Cd laser (441.6 nm) was used for measuring ruby fluorescence
inside the cryostat until it stopped working in December 2009. The
lower wavelength (and hence higher energy) meant that ruby fluroes-
cence could be measured to higher pressures.
• A diode laser with a wavlength of 445 nm (Coherent, CUBE laser)
was purchased in February 2010 to replace the He-Cd laser. It has an
output of 40 mW. It is currently (2011) being used for ruby fluorescence
measurements in the cryostat.
2.2.4 Optical System
Over time, the optical setup used to make ruby fluorescence measurements
inside the cryostat has changed as modifications have been made, but the
basic idea is still the same — a laser is focused onto a ruby in the sample
space using various optical components, and then the resulting spectrum is
measured to determine the pressure.
Stefan’s paper and thesis give diagrams of the original optical system setup,
as shown in Figure 2.1.
1. Spiegel 1: a mirror that adjusts the Ar laser beam toward the DAC.
2. Polfilter 1: a polarization filter which serves to reduce the intensity of
the linearly polarized laser beam.
3. Kantenfilter 1: this filter (BG 18, Schott) suppresses all light with
wavelength above 550 nm. At high power the laser generates some
unwanted radiation in this region.
4. Blende 1: a circular aperture to limit the beam diameter
60

Figure 2.1: Original DAC optical setup.
61

5. Filter 1: function?
6. Halbdurchl. Platte 1: this was replaced in the year 2001 with a small
6 mm dia. to direct the laser beam upward into the cryostat.
7. Objektiv: an adjustable objective lens with 88 mm focal length to focus
the laser onto the cell.
8. Filter 2: this filter cuts out all light with wavelength shorter than 665
nm, in particular scattered laser light, from entering the monochroma-
tor, thus allowing the measurement of the very weak ruby fluorescence
lines.
9. Klappspiegel: this is a rotating mirror that allows light to be sent into
the monochromator or the eye (the microscope setup includes Linse 3
Spiegel 2 and Okular).
10. Glimmlampe: the neon lamp, which is used as a reference line. The
movable mirror (Halbdurchl Platte 2) is used to allow the neon light
into the monochromator.
Improvements to the optical system were made by James Hamlin, who mod-
ified the optical setup slightly. Figure 2.2 shows a schematic of this modified
optical setup. More details can be found in his thesis.
In 2010, the 6 mm mirror (M3) was replaced with a dichroic filter.
The following two paragraphs contain a description of how Stefan’s setup
could be used to measure ruby fluorescence in conjunction with the PMT,
but much of the description is valid even when using the CCD.
First, the equipment is turned on and allowed to warm up. Make
sure that the low pass filter (Filter 2 cuts out wavelengths below
665 nm) is in place to cut out the laser light from entering either
the microscope or photomultiplier!!!!!! Next, focus on the sample with
your eye using light through the fiber optic cable and center the gasket hole
in the field of view. Make sure that the laser light is centered on the circular
aperture. Note the gasket hole diameter to insure that the experiment is
going properly. Lower the laser intensity as much as possible with the
polarizer and remover the filter to allow the laser into the field of view. Move
the laser spot so that it coincides with the gasket hole. Put the filter back
62

Figure 2.2: Schematic of modified optical setup.
63
in place and turn the intensity to its maximum. Find the maximum in the
spectra using the monochromator (note the readings on the monochromator
for different temperatures and pressures). Readings are taken on the digital
multimeter in the DC volts setting. GENTLY move the cryostat with the
screws to better center the laser spot and maximize the voltage. Adjusting
the polarizer can also increase the signal. You should always try to obtain 0.4
V for the maximum (this value might be unobtainable at room temperature
for the ruby in the cell if a small ruby is used).
When the pressure measurement is done, make sure that all of the equipment
is turned off. Turn of the high power switch on the 1 kV power supply first
and allow a couple of minutes for it to cool off before turning off the other
switch. The laser cooling fan will continue to be operational even after the
laser has been turned off. Make sure that the Ne lamp switch is turned off
(this is easy to leave on).
2.3 Measuring Pressure using the Raman Diamond Vibron
At pressures above 100 GPa, measurement of pressure using ruby fluorescence
becomes increasingly difficult (see James Hamlin’s thesis for an explanation
of why). For this reason, at Mbar pressures, it becomes necessary to find an
alternate method for determining pressure. Raman measurements of the high
pressure diamond vibron provide an accurate measure of pressure. Raman
scattering is the inelastic scattering of photons. When light is scattered from
an atom or molecule, most of the scattered photons have the same energy
as the incident photons (Rayleigh scattering). A small fraction (approx-
imately 0.1 ppm), however, are scattered back inelastically with a slightly
higher (Anti-Stokes) or lower (Stokes) energy, as seen in Figure 1.11. Under
pressure, the vibrational levels in diamond shift, so measuring the Stokes
scattering from the diamond allows pressure of the sample to be determined.
Presently (2011), Raman measurements are performed at room temperature
outside of the cryostat with the metallurgical microscope using the setup
seen in Figure 2.4. Light from the laser is directed via a beam steerer to a
lens that focuses the laser onto the sample space. It is then focused onto
the back focal point of the objective and travels to the spectrometer via a
fiber optic cable. There are two filters - the first eliminates all of the laser
lines other than the 514 nm line from the laser, while the second filter, di-
64

Figure 2.3: Most of the light scattered back from an atom or molecule has the
same energy as the incident photons (Rayleigh scattering), but a small frac-
tion (approximately 0.1 ppm) is scattered back inelastically with a slightly
higher (Anti-Stokes) or lower (Stokes) energy.
65

Figure 2.4: Optical setup for measuring Raman diamond vibron using the
metallurgical microscope.
rectly before the fiber optic cable, is an edge filter that cuts out the laser
line so that only the Raman signal reaches the spectrometer. An Ocean
Optics spectrometer (QE65000), purchased in 2009, enables measurement of
the Raman spectrum. Since the position of Raman lines is determined by
a frequency shift, the wavelength at which the diamond vibron line appears
will depend on the laser being used. The Ocean Optics spectrometer can
measure wavelength in the range 515 - 615 nm and is specifically designed to
be used with the Argon-ion laser, which has a wavelength of ∼ 514 nm. TheOcean Optics spectrometer should be used in conjunction with the Spectra-
Suite software on the computer to measure the Raman spectrum. See the
SpectraSuite manual for more details.
Pressure is determined using the calibration by Akahama and Kawamura (J.
66

Appl. Phys. 100 043516, 2006), where the pressure is given by
(GPa) =
∆
∙1 +
1
2( 0
− 1)∆
¸
Here ∆is the relative frequency change, = 547(11) GPa, and 0
=
375(20). At ambient pressure the diamond vibron Raman edge frequency is
= 1334 cm−1. Most of the diamond is at or near ambient pressure, so even
when the laser is focused on the sample space, a large ambient pressure peak
will be seen. This peak broadens, however, as the pressure at the diamond
culet (and hence the sample pressure) increases. The high frequency edge of
the Raman line (seen in Figure 2.5) will correspond to the maximum pressure
where the laser beam is focused.
2.4 Measuring the Diamond Separation
Using the knowledge of the gasket diameter, pressure and compressibility of
He, it is possible to estimate the diamond separation (or gasket thickness)
at a given pressure. The density of He is shown in Fig. 2.6 from Poolian
& Grimsditch, Europhys. Letters 3, 849 (1986). The initial density is
the liquid value (0.125 g/cm3 at 4.2K, 0.145 g/cm3 at 2.2K) since liquid is
trapped in the gasket for pressure medium. This is done by knowing that
the ratio of the volume of the DAC to that of its original volume is the same
as the ratio of the volume of the He at the given pressure to its zero pressure
value, and assuming mass conservation of the pressure fluid. So the height h
at a given pressure is
=
22
where the subscripts denote the zero pressure values, is the density of
He, is the radius of the gasket hole and is the height of the gasket hole
(the diamond separation). Always check that this number is greater than
the sample thickness or you might be pressing directly on the sample with
the diamonds.
Alternately, the diamond separation can be measured optically, using the
optics provided by the ruby fluorescence measurement apparatus. This
can be done by observing the interference spectra produced by white light
67

Figure 2.5: Raman diamond vibron spectrum. When the laser beam is
focused on the sample space, the high frequency edge gives the pressure.
68

Figure 2.6: The density of He at 300 K. The initial density in the DAC
measurement is the liquid value of 0.125 g/cm3.
illumination of the hole in the gasket. For a detailed explanation of the
method and theory, see James Hamlin’s thesis, pages 60-63.
2.5 Problems with Ruby Measurements
This section is meant to be a review of the problems that can arise when doing
a measurement and the precautions that need to be taken. The following is
a troubleshooting list giving the problem and possible solutions.
Ruby lines look bad
1. Ensure the filters and apertures are in place.
2. Make sure that the separation of the 1-line and the neon line of all of
the scans agree.
3. The cryostat or optics may have moved and realignment is necessary.
4. After measuring the neon line, turn off the neon lamp (this is very easy
to overlook, so check twice).
69

5. Always make sure the filter is in place when light is allowed into the
photomultiplier (if not, bad things can happen - see Problems With
the System section).
6. When the aperture near the cutoff filter is not in place (Blende 2 in
Fig. 2.1), multiple reflections may occur, causing the reference line be
unusually broad and causing an abnormally large difference between
the neon line and R1-line. To make sure a “good” value is obtained,
always check it with a known value for the temperature.
7. If the fluorescence signal is not big enough, make sure that the optics
are clean, there is no visible grease in the cell and the laser specs. The
Ar-ion laser power can be measured on the laser directly. Two jacks
give a DC voltage than can be converted to the laser power with the
relation 0.05 V = 1 mW laser power. Typically, values near 60 mW
were obtained.
70

3. Problems with the Equipment and Maintenance
Info
This chapter gives a running log of problems (and solutions) until 1997.
3.1 Laser Power Supply Board
3/27/92. The power supply board for the Ar-ion laser cooling fans malfunc-
tioned. The same problem occurred to Stefan and was fixed by getting an
identical board for replacement of the faulty board. The service representa-
tive said the board was incorrectly designed and was completely redesigned
nine months earlier. A replacement board was sent free of charge. The com-
pany is:
Ion Laser Technology, 263 Jimmy Doolittle Road, Salt Lake City, UT 84116.
Tel: (801)537-1587 or (800)272-7375
3.2 Photomultiplier Tube
4/2/92. The Ar-ion laser was allowed to enter the photomultiplier without
the cutoff filter in place for 1 to 2 minutes. Afterward, the photomultiplier
tube appeared to have no dark current. All connections were tested and no
problem was found. A new tube was ordered for $353 on Friday afternoon
and arrived Tuesday morning. That same morning, the dark current was
checked and found to be about normal (1-2 nA). John Gilmour, the tech-
nical representative, said this behavior was possible, but it was extremely
coincidental that the dark current was the same afterwards. The problem
could have simply been a bad connection. The tube has functioned prop-
erly ever since, and the replacement tube was sent back to Hamamatsu on
4/21/92. The company is: Hamamatsu, 360 Foothill Road, PO Box 6910,
Bridgewater, NJ 08807. Tel: (908) 231-0960 or Tech: (800) 524-0504.
71

3.3 Pickup Coil
7/—/92. The pickup coil stopped functioning in the middle of an experiment
(P ∼30 kbar). When the coil was checked, the inner coil was found to notwork. The exact reason for the failure could not be determined. The coil
was made by Stefan in 1/92 and went through approximately 50-100 thermal
cycles.
2003 update: The last of Andy’s coils (based on Stefan’s design) broke around
1998. Several different designs have been used since then. The most recent
design (courtesy of V. Tissen) sports a side-by-side design in which both
the primary and secondary coilsystems are each wound from 60 micrometer
(diameter) copper wire and have a resistance of approximately 23 Ohms.
3.4 Capillary Line Connection
9/26/92. The capillary line on the diaphragm has a piece on the end that is
hard soldered on. This piece is the right size to accommodate the Swagelock
fittings (∼1/16 in.). The piece was originally made by Stefan. Andy foundthat a 16 gauge hypodermic needle has a 65 mil outer diameter and a 45
mil inner diameter and is made of stainless steel. He obtained some of this
material from the engineering workshop in the Cupples II basement (they
are moving to the medical school very soon). He talked to: John Kreitler,
5-6186, Engineering Technical Services Shop. He was very helpful.
Andy also tried the cyclotron shop: Jim Linders, 5-6559, Cyclotron Shop.
They had some stainless steel tubing but none of a useful size. Andy used
the pointer sharpener to reduce the outer diameter so the Swagelock fitting
of 63 mil diameter would fit on the end. The shop hard soldered this piece
on. This sanding, however, was unnecessary as the fittings did fit on without
sanding (a small edge on the end of the hypodermic needle piece originally
did not allow the fittings to slide on).
10/5/92. Andy: “I thought there would be enough room on the line to put
the new fitting on so the capillary line was flush with the fitting. I was wrong,
however, and the fitting had to be removed and a new longer one was put on.
Todd (head of the physics machine shop) said that there is a good chance
that, when a hard solder joint is removed on the thin capillary line, the line
72

will fail. An extended fitting, however, was successfully soldered on.”
3.5 Thermometers
10/10/92. The wires to the Pt3 thermometer, one voltage and one current,
broke. They were replaced by soldering the broken wires together with the
non-superconducting solder. Epoxy was then put on the solder joints for
mechanical stability and to insulate the connection.
10/95. It was observed that the calibration data for the K24 carbon resistor
had some “lumps” (calibration points off by a couple hundred milliKelvin)
that caused wiggles in the spline interpolation that can often look like a
transition. (The calibration errors have been traced back to typographical
errors of the original calibration table of the N2G germanium resistor, which
was used to calibrate the K24). A polynomial function, used by Stefan Klotz,
was used for calculating temperature and satisfactorily removed the wiggles.
6/96. A quick and dirty recalibration by C. Looney showed that the calibra-
tion of K24 had changed by over a degree at 40K from the original calibration.
2003: The K24 resistor was subsequently replaced with the N2G resistor.
The 1995 recalibration by C. Looney should be used, which corrects a couple
of (probably typographical) errors in the original manufacturer’s calibration.
2011: The Pt and Ge (N2G) resistors were replaced with a Cernox resistor
that can be used over the entire temperature range
2011: The Rh-Fe thermometer in the cryostat was replaced with an Allen
Bradley thermometer.
3.6 Laser Power
1/18/93. The Ar-ion laser was found to only be giving off ∼10 mW. Themirrors were aligned (alignment procedure is given in the laser manual) and
the power returned to 60 mW.
2/19/93. The laser power could not be increased above 5 mW. It was sent
to the company: Ion Laser Technology, 3828 S Main St., Salt Lake City, UT
84115.
73

2/26/93. The repaired laser was returned. A seal between the laser tube and
the optics was found to be broken and the optics were cleaned. Total cost
was $144.14. A new tube runs $2680, while a refurbished one costs $1800.
The tech was: (Don Zanelli, 1-(800)-272-7375).
10/—/07. New laser tube purchased for Ar-ion laser from Midwest Laser for
$4,300. Should readjust periodically and not use more power than necessary.
74

4. The Coil System
4.1 Winding the Tissen Side-by-Side Coil System
The side-by-side coil system shown in Figure 4.1 is currently being used for
AC-Susceptibility measurements. It was developed and brought to our lab
by Vladimir Tissen during one of his visits from Russia.
We have developed a simple sprig, shown in Figure 4.2, for winding the coils.
Before starting, be sure that the stainless steel tube and Teflon disks are
cleaned thoroughly. To assemble the sprig, first insert the brass pin through
the Teflon disks, stainless steel tube, and brass holder in the order shown
in Figure 4.3. After assembling the sprig, spray it once with a lubricant
such as TFL 50 dry lube. Once the pin is inserted, simply thread the wire
through the slits in the side of the brass holder and then pass it through one
of the slits on the Teflon disk to start winding it on the stainless steel tube.
Depending on the desired inner diameter of the coil, either a 2.7 mm or 3.0
mm outer diameter tube may be used. The free end of the wire should be
wound around the brass holder several times and held in place using scotch
tape (see Figure 4.4). The brass holder should be placed in the lathe to start
winding the coil manually. Do not use the lathe motor! The winding should
be very tight - a small loop of solder may be placed on the wire between the
coil and the spool to pick up the slack. After each layer, place some “Russian
glue” diluted with methanol (about 50-50) on the coil. The “Russian glue” is
a brown, semi-transparent glue similar to the “Gorilla glue” sold in America.
The secondary coil, which is wound first, should contain 6 layers of 60-64 m
copper wire with 30 turns per layer. Note that the newer Russian glue (since
2009) does not work as well, so instead GE varnish diluted with methanol
has been used.
After winding the secondary coil, pass the wire through the same slit on the
Teflon disk through which the wire was first inserted. Wind it for a few turns
on the brass holder, cut it, and hold it in place using a piece of scotch tape.
75

Figure 4.1: The Tissen side-by-side coil system, pictured mounted in the
DAC.
76

Figure 4.2: The coil form used for winding the side-by-side coil system.
Figure 4.3: Exploded view of the coil winding sprig.
77

Figure 4.4: Configuration for winding a coil for the Tissen side-by-side coil
system.
78

To wind the primary coil directly on top of the secondary coil, repeat the
above procedure. The primary coil also uses 6 layers of wire with 30 turns
per layer, and should be wound in the same direction. It is best to start
winding the primary coil from the opposite slit in the Teflon disk.
Once the winding is complete, leave the coil for about 2 days so that the
glue dries inside and the coil becomes firm. Alternately, one can anneal the
coil at 70C for a few hours. Remove the scotch tape and unwind the wirefrom the brass holder. Unscrew the brass pin and gently remove the Teflon
disks. When removing the disk with slits, be sure that the wires are not
inside the slit, otherwise they can be cut or damaged. Look at the coil under
the microscope and put some glue on top and bottom of it without letting
the glue touch the tube in the middle. Wait another day for the glue to dry.
Hold the stainless steel pin from the DAC box vertically in a vise - the pin’s
diameter is larger than the inner diameter of the stainless steel tube, but
smaller than the outer diameter of the tube. Place some tissue around the
pin and put the coil on top of the pin. Using a Teflon plate that has a hole
with exactly the same diameter as the outer diameter of the tube and which
is very well centered with respect to the coil and pin, push carefully but
firmly on the coil so that the coil is removed from the tube. This procedure
is best performed under a microscope or a big lens so that you can make sure
that no wire is on the tube and that you do not damage the coil. Under a
microscope, put a thin layer of glue on the inner side or the coil and let it
dry for one day (or anneal it). Unwind the first and last turns of the coil -
one belongs to the pick-up coil and the other to the field coil. Place the coil
in a safe location and repeat the procedure to make a second coil.
When both pairs of coils are ready, cut the extended wires on each coil
to the same length (about 5-6cm), and connect the primary and secondary
wires of one of them to two coaxial cables. Connect the primary side to
the generator of the lock-in amplifier and the secondary side to Channel A.
Adjust the phase angle so that one channel reads 0V, while the other reads
some constant number. Record that number and its sign. To test whether
the coil is working properly, you can insert a stainless steel bar inside the
coil and observe the signal changes. Now connect the other coil in series to
this coil and the coaxial cables. The lock-in amplifier channel that used to
read 0V should still display 0V, while the other channel, assuming the coils
79
are identical, shows either a smaller number close to 0V with respect to the
previous measurement or a number twice the previous measurement.
1. If the number is close to 0V, the coils have been connected correctly
and compensate for each other. The final connections should be made
in the same way.
2. If the number is twice the previous measurement, then either the sec-
ondary or primary wires of one of the coils should be reversed.
3. If the number is neither closer to 0 nor twice the previous measurement,
then you will need to decrease the number of primary turns on one of
the coils. In order to determine which coil to do this on, again insert the
s.s. bar inside both coils. Turns should be unwound on the coil whose
signal has the opposite sign of the original signal. You can alternatively
add a few windings on one of the coils and see whether the signal gets
better or worse. To determine the number or turns that should be
unwound, simply calculate the total number of turns for the primary
coil. Then, the total number of turns to unwind is simply given by
(total # of turns on primary x original signal x 2) ÷ (difference in
signal from original and both coils). Always decrease the turns from
the last turns of the primary. The reason for this is that these turns
are farthest from the sample. It is best to recheck signal after removing
a few turns rather than removing them all at once realizing that you
have unwound too many.
Typically, for the side-by-side coils, you should be able to balance the coils to
about 1% of the signal from a single coil. After the coils have been balanced
— the total signal from the coils should now be close to zero (about a few
Vs) — it is time to connect the coils.
Mark the ends of the primary and secondary coils that should be connected
together (you can do this by cutting these wires 1cm shorter). On each
coil, gently twist the primary wires together counter-clockwise for 5mm from
the coil. Repeat with the secondary wires. Hint: to twist the wires tightly
together you will need to keep them about 180 apart while you are twisting
them. Measure 1.5cm on all the wires that have been marked and cut the
rest of these wires off. Remove 5mm of insulation from the end of the shorter
wires. Twist two shorter secondary wires of the coils together for 5mm from
80

Figure 4.5: Circuit for spark welding wires together on side-by-side coil sys-
tem.
the end and spark weld them together at the end. Repeat the same procedure
with the shorter primary wires. Twist the longer secondary wires together
and leave 5mm of the coils untwisted so that the coils have 1cm distance
between each other. Then twist the twisted long and short secondary together
and primaries together.
Spark welding the wires together provides a strong, durable connection be-
tween the wires and also avoids the need to put any solder (with possible
magnetic signal) near the coil system. The circuit for spark welding the
wires together is shown in Figure 4.5.
In 2010, we acquired a power supply from UCSD that is specifically designed
for spot welding. More details can be found on the power supply itself and
in the manual (Chapter 5). The power supply can also be used for spark
welding Cu wires. The basic procedure is the same as for our home-made
spark welder. Isaiah Lim found that the best settings for spark welding Cu
wires are as follow:
• 60-100 Cu wire ...80 V and an 8 x 300 pulse with a 250
tungsten wire
• 30 Cu wire ...70 V and a 7 x 300 pulse with a 100 tungsten
wire
• Welding 16 and 60 Cu wire together ...70 V and a 7 x 300
81

pulse with a 100 tungsten wire
4.2 Winding the Cornelius/Klotz Coil System
This coil system was used by Stefan Klotz and Andy Cornelius. Stefan de-
veloped the winding technique, which was further refined by Andy Cornelius.
This coil system, which utilizes tiny 16 m wire for the concentric pickup
coils and 30 m wire for the field coil, has since been replaced by a side-by-
side design wound from 60 m wire for both primary and secondary coils.
The theoretical loss of sensitivity (larger diameter wire means fewer turns are
possible) has been largely countered by the improved compensation afforded
by the side by side design. The use of a more reliable (and easier to use)
lock-in, the Stanford SR830, has further countered any loss of sensitivity.
Finally, it is much easier to wind coil systems with larger wire. [60 m wire
is relatively easy (anyone could learn to do it) and 30 m wire is more dif-
ficult and tedious but still within the capabilities of most experimentalists.
16 m wire, on the other hand, is horrible; it took Andy one whole summer
to wind his first 16 m wire coil, and another student spent a whole summer
trying to wind such a coil without success.] Nevertheless, it may be necessary
for somebody in the group to wind a coil system with very small diameter
wire, so the sections relating to winding the Cornelius/Klotz coil systems are
provided below. Andy’s description of the winding technique follows.
The pick-up coils consist of two compensated coils wound concentrically in
an opposite manner so that the amount of flux (Φ = NBA, where Φ is the
flux, N is the number of windings on a coil, B is the magnetic field, and A is
the area of the coil) in each coil is the same. A typical secondary coil-system
has 1000 turns (∼3 mm i.d.) on the inner coil and ∼442 turns (4.6 mmi.d.) for the outer coil. The inner pickup coil needs to be at least 3.0 mm is
diameter to avoid the gasket (3.2 mm gives reasonable clearance). It is best
that the field coil has an inner radius less than ∼5.2 mm to easily fit on the
coil holder in the clamp.
4.2.1 Cornelius/Klotz Secondary (Pickup) Coils
The pick-up coils were wound with 16 m and the field coil with 30 m wire,
using the non-motorized coil winder. The coils used in the theses studies
82
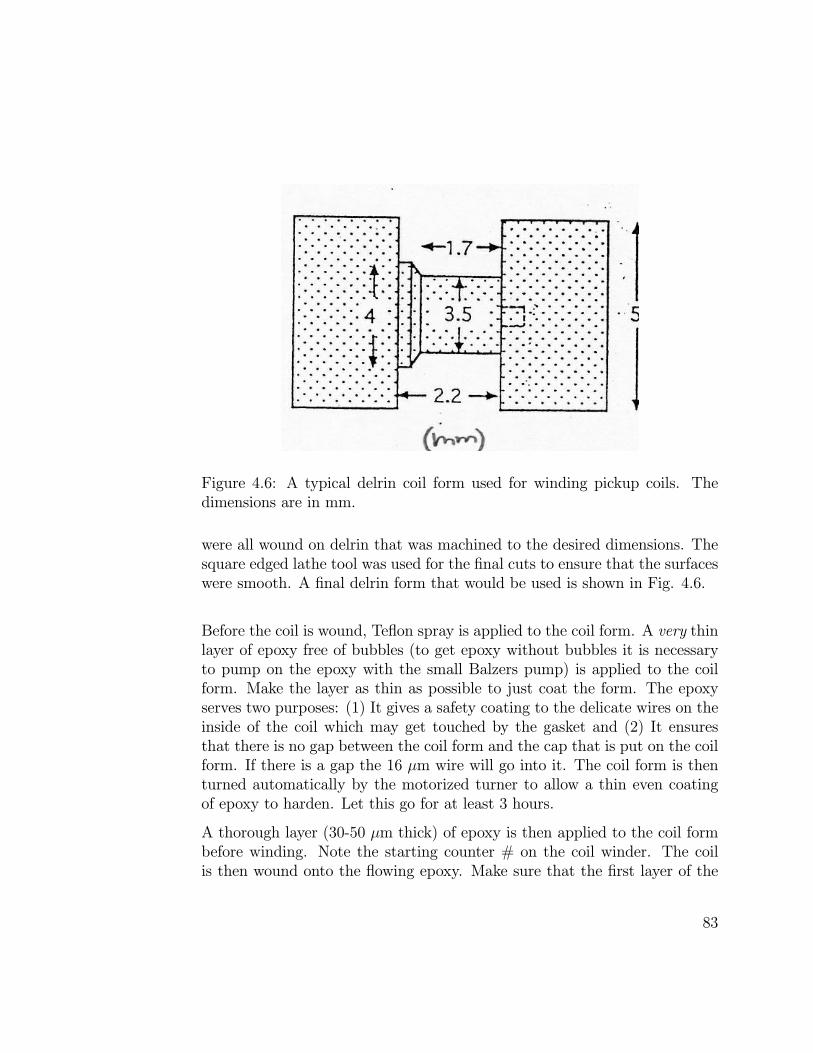
Figure 4.6: A typical delrin coil form used for winding pickup coils. The
dimensions are in mm.
were all wound on delrin that was machined to the desired dimensions. The
square edged lathe tool was used for the final cuts to ensure that the surfaces
were smooth. A final delrin form that would be used is shown in Fig. 4.6.
Before the coil is wound, Teflon spray is applied to the coil form. A very thin
layer of epoxy free of bubbles (to get epoxy without bubbles it is necessary
to pump on the epoxy with the small Balzers pump) is applied to the coil
form. Make the layer as thin as possible to just coat the form. The epoxy
serves two purposes: (1) It gives a safety coating to the delicate wires on the
inside of the coil which may get touched by the gasket and (2) It ensures
that there is no gap between the coil form and the cap that is put on the coil
form. If there is a gap the 16 m wire will go into it. The coil form is then
turned automatically by the motorized turner to allow a thin even coating
of epoxy to harden. Let this go for at least 3 hours.
A thorough layer (30-50 m thick) of epoxy is then applied to the coil form
before winding. Note the starting counter # on the coil winder. The coil
is then wound onto the flowing epoxy. Make sure that the first layer of the
83

coil is done especially well (the turns of the wire should be touching at all
points). Making the first layer good makes the entire winding process easier.
At the end of each layer, make sure the epoxy is spread over the top of the
entire layer. It may not be necessary to add epoxy as it usually builds up at
the end of a layer and can be spread back over the top of the windings. When
the proper number of turns have been achieved, the first coil is finished. The
ends of the coil are then soldered to 64 m diameter wire. It is necessary
to remove the lacquer from all wire ends. This is accomplished by dipping a
pipette into concentrated nitric acid (HNO3). Be careful with this acid - it
can burn you and discolors the tables (just look at the subbasement tables).
If you look at this process under the microscope, you will eventually (15-30
sec for 16-30 m wire and ∼1 min for 64 m wire) see the lacquer coming offthe wire. Use tweezers to remove any remaining bits of lacquer. Carefully
wrap ends of 16 m wire around 64 m with the tweezers. Apply some of the
acid flux to the area to be soldered and let sit for a minute. Make sure that
no extra flux can drop on the coil or coil form. The non-superconducting
solder is then used.
After the 64 m wires have been soldered to the 16 m wires, it is necessary
to secure the solder connections. I found the best way to do this was to use
a couple of turns of 16 m wire to hold the connections in place. A large
amount of epoxy is then applied and the coil is rotated until the epoxy is
hardened.
After the epoxy has dried, the end cap is removed. The epoxy is then hard-
ened. After hardening, the outer layer is machined to the desired ending
diameter. Make sure the coil form is centered properly on the lathe. Using
the square edged lathe tool, cut the epoxy where the other coil is desired.
Very slowly cut the groove (the width of the lathe tool is exactly the desired
width of the coil. Periodically stop and measure the radius until the final
radius is reached. If there are any visible air bubbles on the epoxy where the
outer coil will be wound, fill them with epoxy and let it harden.
The second coil (outer secondary coil) is wound in a same manner as the
first. Add about 20 more windings then you expect to need. Measure the
value of the susceptibility for this configuration. Remove two windings a few
times and you will be able to estimate the total number of turns necessary
for minimizing the background signal. When finished, put a thorough layer
84
of epoxy on top of the coil and rotate while drying.
Reharden the epoxy. The coil is removed from the delrin form by placing the
coil and form in LN2. Let them get to LN2 temperatures and remove the
coil form. Use a pair of tweezers to gently push coil off delrin. If it does not
come off immediately, rotate the delrin piece any try again.
4.2.2 Cornelius/Klotz Primary (Field) Coil
The primary coil should be wound before the secondary coil. This is because
the primary coil is needed in order to do the compensation of the secondary.
The process of winding the primary coil is very similar to winding the sec-
ondary coil. First, a coil form is machined to the desired dimensions. (I,
Andy, used 5.2 mm i.d. for my coil and a height of 2.0 mm.) I first put
a thin layer of glue on the form as mentioned in the secondary coil section.
After this hardens, the primary coil is wound with 32 m wire. I used 600
turns. The 32 m wire is strong enough to use the motorized winder, if
desired. The 32 m wire is then soldered to 64 m wire as was done for the
secondary coil. Enough epoxy is then applied to cover the coil. The coil is
rotated to ensure even setting of the epoxy. The epoxy is then hardened as
it was for the secondary coil. The primary coil that is to be put in the DAC
with a given secondary coil should be used for the compensation process. If
the coils are machined well enough, the secondary should fit snugly inside
the primary. If one of the two coils should become damaged, it would then
only be necessary to replace the damaged coil. However, I found it necessary
to epoxy the coils (primary and secondary) I used together because the sec-
ondary coil did NOT fit snugly inside the primary. This led to a great deal
of noise since the secondary could move inside the primary.
4.2.3 Miniaturized Coils (Andy)
The miniaturized coils were wound very similarly to the coils just mentioned.
Instead of the coil form being all delrin, a piece of tungsten wire is placed in
a hole drilled onto delrin. A cap is then slid onto the tungsten wire. Teflon
is sprayed onto the tungsten wire and epoxy is placed on the wire. Andy
started winding the coil immediately onto the flowing epoxy. The rest of
the winding of these small coils is done in a manner similar to those already
85

Temp (C) Time Hardness (kg/cm2)
20 12 hours 120
40 3 hours 180
70 45 min 200
100 10 min 250
180 5 min 300
Table 4.1: Physical properties of UHU epoxy used in the winding of the
Cornelius/Klotz coil system.
described. See Andy’s thesis for the details of the performance tests of the
miniaturized coils.
4.2.4 Epoxies
The UHU Endfast epoxy was used for all of the coils prior to implementation
of the side-by-side coil system. The hardness of the UHU epoxy after it has
been heat treated at various temperatures for a given time is given in Table
4.1.
A drawback of the UHU epoxy is the very large difference in the thermal con-
traction of the epoxy relative to the copper wire used for the coils. During
a thermal cycle, there will be stress on the copper wire due to the difference
in the thermal expansion coefficients. This makes the coils have a finite life-
time as the stress will eventually cause the coil to break. Andy Cornelius
attempted to use glues from Tri-pac which had coefficients of thermal expan-
sion very near that of copper. The “black” glue was the least viscous and
flowed for the longest period of time. It machined easily and dried well. The
epoxy contained small particles (up to ∼ 10 in size) that made winding
a coil with the 16 wire very difficult. Because of these problems, this
epoxy was no longer used.
4.3 Common Pitfalls
Some of the many problems that occurred while winding coils that ruined
them are listed in this section. The main things to worry about are:
86

1. The acid used to strip the lacquer off of the copper wires and the acid
flux used for the non-superconducting solder quickly destroy the delrin
forms.
2. Try to use short delrin forms as longer ones bend easily when machined.
3. Ensure that the coil form is well centered when machining the epoxy
down. This is very important for a good coil system.
4. Do not overheat the coil on the coil form when hardening the epoxy.
The delrin warps at temperature of 90C and above.
5. Do not let the soldering iron get too close to the delrin coil form.
87

5. Micro Spot Welder Guide
(James J. Hamlin, April 14, 2010)
5.1 Overview
The micro spot welding power supply was designed and built by George
Kassabian at the University of California, San Diego, Department of Physics
electronics shop, and is based on designs described in several articles [1, 2,
3, 4]. The power supply was designed such that it can roughly reproduce
the pulse shapes shown in reference [3]. The principles of making small spot
welded joints are described nicely in the above papers, which should be read
before attempting a weld. Note that it takes some practice to make successful
weld joints and even with practice it is possible to destroy the sample while
attempting to weld. Therefore, extreme caution is recommended in cases
where you do not have some extra pieces of sample to practice on. It is
very helpful to have a logbook in which to record the “voltage level”, “pulse
width”, sample, sample size, and wire diameter which led to successful welds.
5.2 Components
The micro spot welding system is made up of the power supply, a thin tung-
sten wire electrode, a micromanipulator for positioning the tungsten elec-
trode, and a copper plate which forms the lower electrode. The leads that
connect the power supply to the two electrodes should be composed of rather
thick braided copper wire (see right of Figure 5.1) since they will carry a sig-
nificant amount of current. The micromanipulator has a magnetic base which
is mounted onto a steel plate. The surface of the steel plate should be smooth
so that the micromanipulator does not wobble around when you adjust the
dials. Of course, a sample and some small diameter wire to attach to the
sample is also necessary. A multimeter connected to the “Puls & Voltage”
88

Figure 5.1: (left) Micro spot welding power supply and foot switch. (right)
Micromanipulator with magnetic base, mounted on a steel plate. The tung-
sten wire electrode is taped to the micromanipulator.
terminal is useful for determining whether a good electrical connection ex-
ists between the electrodes and sample prior to welding. In general, the red
output connector on the power supply should be connected to the tungsten
electrode and the black output connect to the copper plate electrode. How-
ever, in certain cases, better weld joints can be obtained by reversing this
polarity.
5.2.1 Power Supply
The power supply can be adjusted to control the pulse voltage level and the
pulse width. Figure 5.2 shows a schematic view of how changes in these
settings effect the voltage profile across the internal capacitor.
5.2.2 Tungsten Electrode
The requirements for an effective electrode and possible designs are discussed
in detail in Reference [1]. We built an extremely simple tungsten electrode
assembly by soldering a thin tungsten wire (70 m diameter) onto the end of
a braided copper lead which attaches directly to the red “output” connector
on the power supply. The copper lead was then taped in place on the tip
of the micromanipulator and then bent to a convenient angle (see right of
Figure 5.1). The tip of the tungsten wire can be ground to an appropriate
angle using a Dremel tool.
89
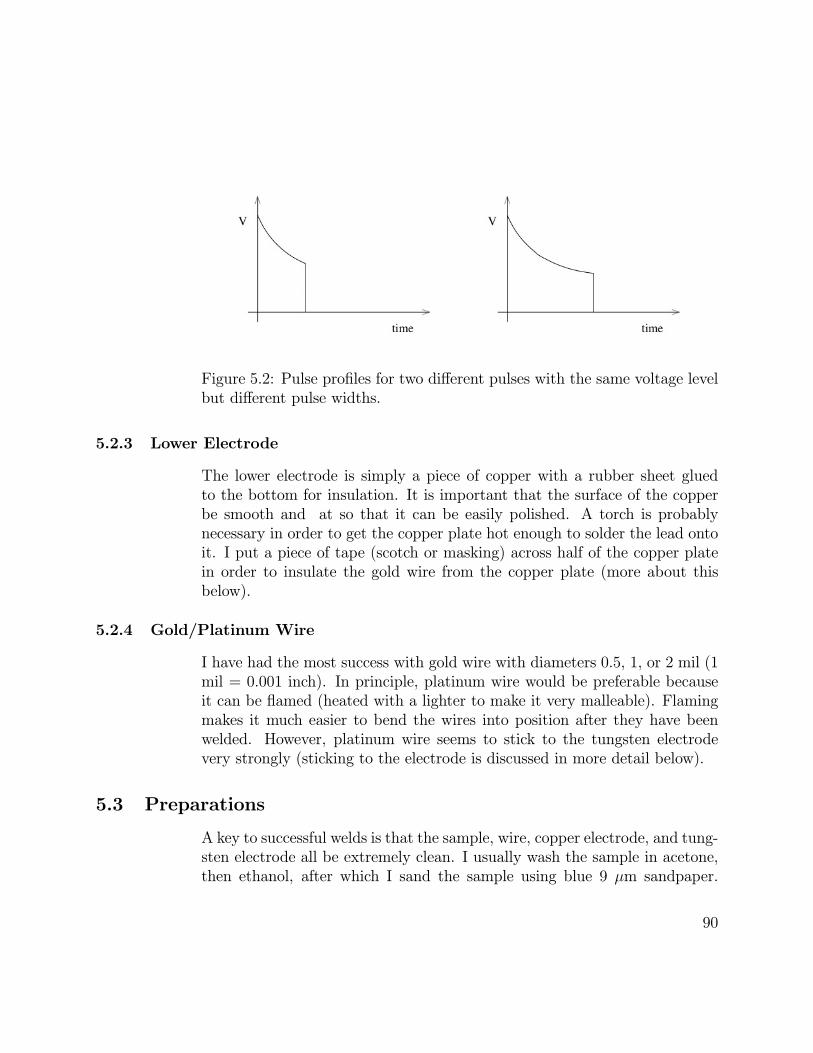
Figure 5.2: Pulse profiles for two different pulses with the same voltage level
but different pulse widths.
5.2.3 Lower Electrode
The lower electrode is simply a piece of copper with a rubber sheet glued
to the bottom for insulation. It is important that the surface of the copper
be smooth and at so that it can be easily polished. A torch is probably
necessary in order to get the copper plate hot enough to solder the lead onto
it. I put a piece of tape (scotch or masking) across half of the copper plate
in order to insulate the gold wire from the copper plate (more about this
below).
5.2.4 Gold/Platinum Wire
I have had the most success with gold wire with diameters 0.5, 1, or 2 mil (1
mil = 0.001 inch). In principle, platinum wire would be preferable because
it can be flamed (heated with a lighter to make it very malleable). Flaming
makes it much easier to bend the wires into position after they have been
welded. However, platinum wire seems to stick to the tungsten electrode
very strongly (sticking to the electrode is discussed in more detail below).
5.3 Preparations
A key to successful welds is that the sample, wire, copper electrode, and tung-
sten electrode all be extremely clean. I usually wash the sample in acetone,
then ethanol, after which I sand the sample using blue 9 m sandpaper.
90

Figure 5.3: The tip of the gold wire is flattened with a metal rolling pin and
then cut to length.
Both the surface that bonds to the wire and the surface that touches the
copper plate should be sanded. Reference [3] describes an alternative way
of cleaning samples when sanding is not practical. I also sand the copper
plate before each use (using the same type of sandpaper). After sanding the
copper plate I clean the surface with acetone followed by ethanol. The same
treatment is given to the tungsten electrode. I also make sure to grind down
the tip of the tungsten wire enough that there is no chance of contamination
from the previous sample. Note that Apiezon N-grease (which is often used
to mount samples) can only be washed off with xylene (which is highly toxic
and should only be used in a hood). After washing with xylene be sure to
wash away the xylene with ethanol so that you don’t inhale xylene fumes
during the welding process. Acetone, unlike ethanol, nearly always leaves a
thin film of dissolved material behind and therefor should never be used as
the final wash.
I found that attening the tips of the gold wire results in stronger weld joints.
I flatten the tip by placing the wire on a glass slide and then rolling with
a smooth metal cylinder. Be sure that the cylinder is also clean so that is
doesn’t dirty the wire. After rolling, I cut the flattened part of the wire to a
length appropriate to the sample I will weld to (see Figure 5.3).
Now you can put together all of the components as shown in Figure 5.4.
First the sample is placed on the copper plate near to the tape. Next the
gold wire is layed on top of the crystal. The other end of the gold wire
91

Figure 5.4: Layout of components for bonding wires to small samples. Note
that the gold wire does not touch the copper electrode, so that the current
must travel through the contact point between the sample and the gold wire.
should rest on the tape rather than the copper plate. This prevents the
current from traveling through the length of the gold wire into the plate
and either breaking the gold wire or bonding it to the plate. Rather, you
want to make sure that the current travels through the junction between the
gold wire and the sample. Next bring the tungsten electrode down on top
of the gold wire and sample so that it presses frmly down on the assembly
and touches only the gold wire. Make sure that there is some tension on the
tungsten wire by continuing to lower the electrode a bit after it touches down
on the sample. This is important so that when the current pulse melts the
junction, the electrode springs down to maintain contact. Too little tension
in the tungsten electrode can lead to undesired spark formation.
At this point, you can check if you have a good contact by reading the voltage
on a multimeter connected to the“Puls & Voltage” terminal on the power
supply. If this voltage is fluctuating then you do not have good continuity
and will not be able to obtain a good weld joint. With good continuity, you
will measure a stable voltage which is proportional to the “voltage level”
dial. Attempting to weld with poor continuity can result in spark formation
which will often vaporize part of the sample. If you can’t get a stable voltage
on the multimeter by pressing down rmly with the electrode, then you may
need to further clean/sand the sample, electrodes, or wire.
92

5.4 Welding
Roughly, one can think of the voltage level dial as determining the maximum
temperature that the junction will reach, while the pulse width dial deter-
mines the spacial extent over which this temperature obtains. A longer pulse
width will lead to a larger portion of the sample being heated. It is best to
use the minimum necessary pulse width so that the sample is not modi ed in
any signi cant way. A switch provides two pulse width ranges, 30 s and 300
s. The pulse width dial allows one to multiply the range by a factor from
1-10. This provides a total range of pulse widths from 30 s up to 3 ms.
The safest way to determine the required voltage and pulse width is to start
from the minimum settings and gradually increase them until bonding occurs.
The pulse is triggered with the foot switch. After each pulse is triggered, wait
until the voltage on the multimeter returns to the set value before triggering
the next pulse. Note that the capacitor takes some time to charge so you may
have to wait several seconds between each pulse. A good sign that bonding
has occurred is that the sample/wire will move slightly when you trigger the
pulse. If you don’t observe any movement on triggering the pulse then it is
likely that no bonding has occurred and you can increase the voltage and or
pulse width and try again. If the voltage and/or pulse width is set too high,
the sample or wire may vaporize, or in the case of single crystals, the crystal
may cleave.
Often, the tungsten wire will bond to the gold wire. I found that this issue
is more problematic when using platinum wire. Separating the tungsten
electrode from the gold wire without separating the gold wire from the sample
is probably the trickiest part of the process. If you simply pull on the crystal,
usually the crystal will break away from the gold wire and the gold wire will
remain stuck to the tungsten electrode. I found a simple procedure that
usually can separate the tungsten from the gold. After applying a pulse, lift
the micromanipulator tip a fraction of a millimeter. If bonding has occurred
and the gold wire is stuck to the electrode, both the sample and gold wire
will be lifted. Now, by pushing on the edge of the sample that is furthest
from the electrode, rotate the sample around (see left of Figure 5.5). Often,
rotating the sample a half a turn is sufficient to break the weld between the
gold wire and the electrode, though sometimes I have to do 2-3 full rotations.
When the voltage level and pulse width dials are set exactly correctly, the
93
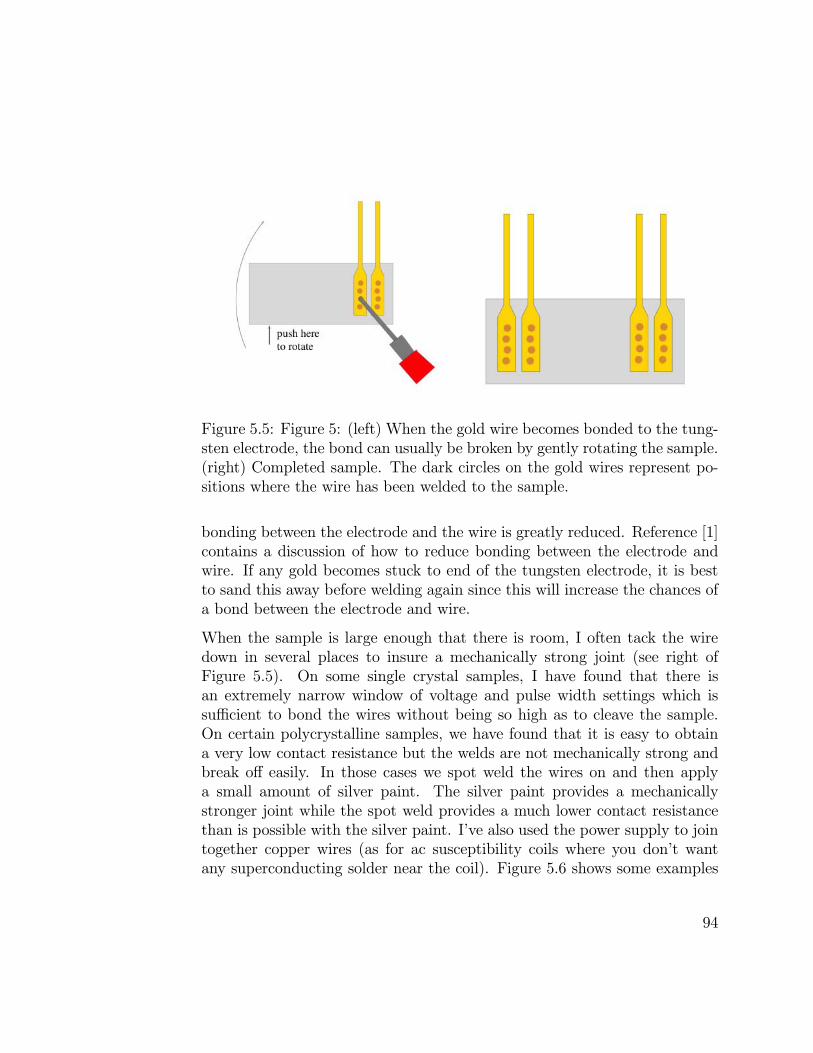
Figure 5.5: Figure 5: (left) When the gold wire becomes bonded to the tung-
sten electrode, the bond can usually be broken by gently rotating the sample.
(right) Completed sample. The dark circles on the gold wires represent po-
sitions where the wire has been welded to the sample.
bonding between the electrode and the wire is greatly reduced. Reference [1]
contains a discussion of how to reduce bonding between the electrode and
wire. If any gold becomes stuck to end of the tungsten electrode, it is best
to sand this away before welding again since this will increase the chances of
a bond between the electrode and wire.
When the sample is large enough that there is room, I often tack the wire
down in several places to insure a mechanically strong joint (see right of
Figure 5.5). On some single crystal samples, I have found that there is
an extremely narrow window of voltage and pulse width settings which is
sufficient to bond the wires without being so high as to cleave the sample.
On certain polycrystalline samples, we have found that it is easy to obtain
a very low contact resistance but the welds are not mechanically strong and
break off easily. In those cases we spot weld the wires on and then apply
a small amount of silver paint. The silver paint provides a mechanically
stronger joint while the spot weld provides a much lower contact resistance
than is possible with the silver paint. I’ve also used the power supply to join
together copper wires (as for ac susceptibility coils where you don’t want
any superconducting solder near the coil). Figure 5.6 shows some examples
94

Figure 5.6: Examples of samples wired with the micro spot welding unit.
(left) Asingle crystal of Yb2Fe12P7 with length 1 mm. (right) A 370 m long
single crystal of unknown composition grown with U, Fe, and P in a Sn flux.
of successful welds obtained with this system.
5.5 References
1. I. R.Walker and C. J. Moss. Spot welder for making small electrical
contacts. Review of Scientific Instruments, 69(7):27472756, 1998.2. Takeshi Hiraoka. The simple spot-welding apparatus. Review of Sci-
entific Instruments, 69(7):28082809, 1998.3. I. R. Walker and C. J. Moss. Further considerations on the prepara-
tion of small electrical contacts by spot welding. Review of Scientific
Instruments, 71(5):22282232, 2000.4. I. R. Walker and C. J. Moss. Erratum: “Spot welder for making small
electrical contacts” [Rev. Sci. Instrum. 69, 2747 (1998)]. Review of
Scientific Instruments, 71(11):43444344, 2000.
95

6. Quick Guide for using the Current Ramping
Control Unit
6.1 Overview
This unit, seen in Figure 6.1 is designed to be connected to our Kepco
ATE 55-20DM power supply. This unit will allow the output current of the
ATE 55-20DM to be ramped from 0 to 20 amps at a variety of different rates.
The remote control unit outputs 0-1 volts. The ATE 55-20DM has a control
voltage input that allows the output voltage to be controlled by a 0-1 volt
control signal. One volt at the control voltage inputs allows the power supply
to output as much as 20 amps.
6.2 Connections
Make sure that both the ATE 55-20DM and the remote control unit
are plugged into the wall for power. Remember that turning on the ATE
55-20DM may blow the circuit that the power supply is connected to. If
possible, connect the ATE 55-20DM to a different breaker that the one that
the measurement equipment is connected to. Connect the output voltage
connector on the remote control unit to the control voltage inputs at the
back of the ATE 55-20DM, making sure that red goes to red and black goes
to black. Connect the current output of the ATE 55-20DM to a load such as
our water-cooled electromagnet.
6.3 Start up tutorial
Before powering up the ATE 55-20DM turn the voltage dial all the way up
(clockwise) and the current dial all the way down. Also, check that the switch
on the connector block at the back of the supply is set to ‘local’, as seen in
Figure 6.2. Power up the ATE 55-20DM.
96
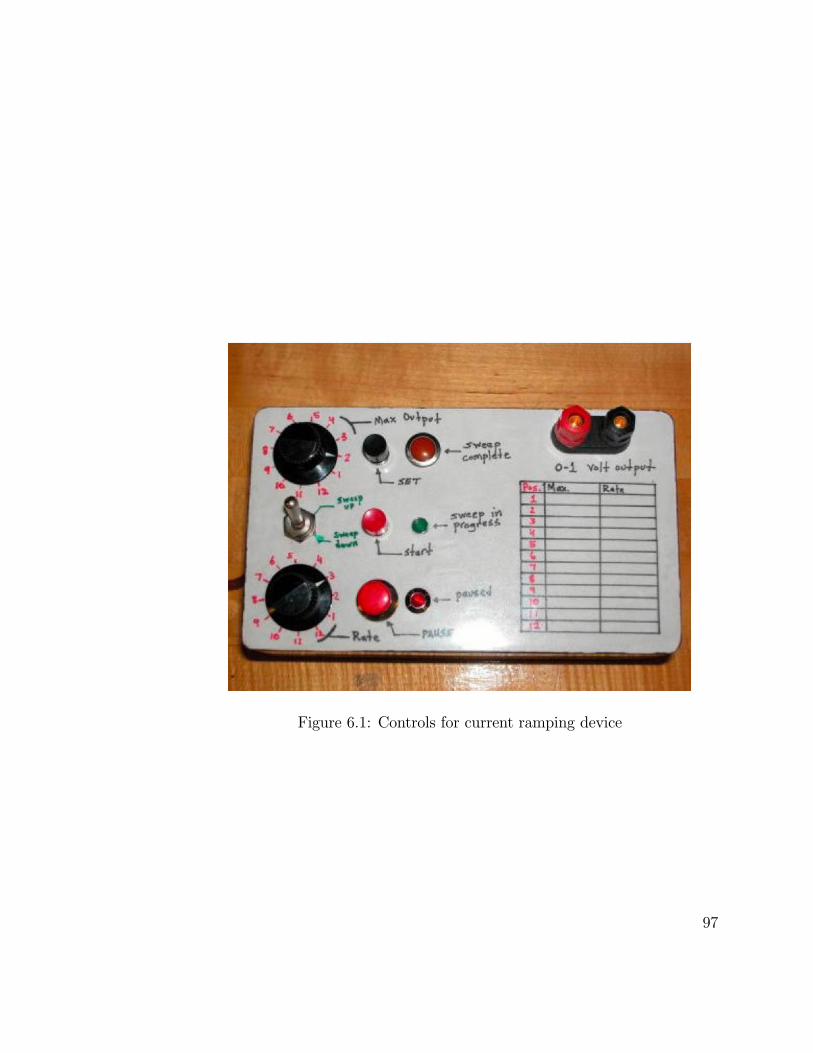
Figure 6.1: Controls for current ramping device
97

Figure 6.2: Back of one of the power supplies that may be used with the
current ramping device.
When the switch is set to ‘local’ the dials on the front of the supply will
control the output current. When the switch is set to ‘remote’ the output
current will be controlled by the control voltage, which is provided by the
remote control unit. However the dials on the front of the ATE 55-20DM
still have the effect of determining the maximum voltage and current that
the supply will allow at its output. For example, set the switch to ‘local’
and then dial the current up to 3 amps. Now turn the switch to ‘remote’.
Set the ‘Max Output’ dial of the remote control unit to position 1 which
corresponds to 1 amp. Set the sweep toggle switch to ‘sweep up’ and press
the ‘set’ button. Notice that the output of the ATE 55-20DM goes to one
amp. Now set the maximum output of the remote control unit to 4 amps
and press the ‘set’ button. Notice that the ATE 55-20DM does not allow the
current to increase beyond 3 amps. This is a useful safety feature and should
be used to make sure that mistakes in using the remote control unit do not
result in too much current being sent to the load.
98
6.4 Controls
6.4.1 Max Output Dial
This dial controls the maximum voltage that will be present at the voltage
output of the remote control unit. Sweeps will start or stop at the value
determined by the position of the Max Output Dial (see Table on next page).
Position 12 corresponds to 1V which will cause the ATE 55-20DM to output
20 amps (provided that the voltage and current dials on the ATE 55-20DM
allow this high of an output; see tutorial). The values in the table on the
right of the remote control unit are listed in amps (as produced when the
remote control unit is connected to the ATE 55-20DM).
6.4.2 Rate Dial
This dial controls the rate at which the voltage output is linearly varied once
a sweep has been initiated by pressing the “Start” button (see Table on next
page).
6.4.3 Sweep Toggle Switch
This toggle switch controls whether the sweep will be an increasing or de-
creasing sweep.
If the Sweep Toggle is set to “Down” and the “Start” button is pressed, the
voltage will sweep from the Max Output to zero. If the Sweep Toggle is set
to “Up” and the “Start” button is pressed, the voltage will sweep from zero
to the Max Output.
If the Sweep Toggle is set to “Down” and the “Set” button is pressed, the
output voltage will be set to zero. If the Sweep Toggle is set to “Up” and the
“Set” button is pressed, the output voltage will be set to the Max Output.
6.4.4 Set Button
This button sets the output of the remote control unit to zero (Sweep Toggle
set to “Down”) or Max Output (Sweep Toggle set to “Up”).
99
6.4.5 Start Button
This button initiates a sweep from zero to Max Output (Sweep Toggle set to
“Up”) or from Max Output to zero (Sweep Toggle set to “Down”). While
the sweep is in progress the green “Sweep in Progress” indicator will light
up. When the sweep is finished, the orange “Sweep Complete” indicator will
light up.
6.4.6 Pause Button
Pressing this button once while a sweep is in progress causes the sweep to
pause and the red “Paused” indicator will light up. Pressing the Pause
Button again will allow the sweep to continue.
It is important to note that settings such as the sweep direction, max output
and sweep rate can be changed during a sweep only by first pausing the sweep
with the pause button, making the changes and then un-pausing the sweep.
6.5 Dial Position Values
The values for each position of the “Max Output” and “Rate” dials
are listed on a table on the right of the remote control unit. These values
are written on top of the transparency covering the unit so that the values
entered on the table may be changed (see the next section for information
about changing dial values).
At the time of the writing of this guide (May 18, 2005) the values of
the dials are those shown in the table below. The values are listed in Amps
(Max Output) and Amps/minute (Rate) assuming that the remote control
unit is hooked up to the ATE 55-20DM. Simply divide these values by 20 to
get the values in Volts and Volts/minute at the output of the remote control
unit.
100
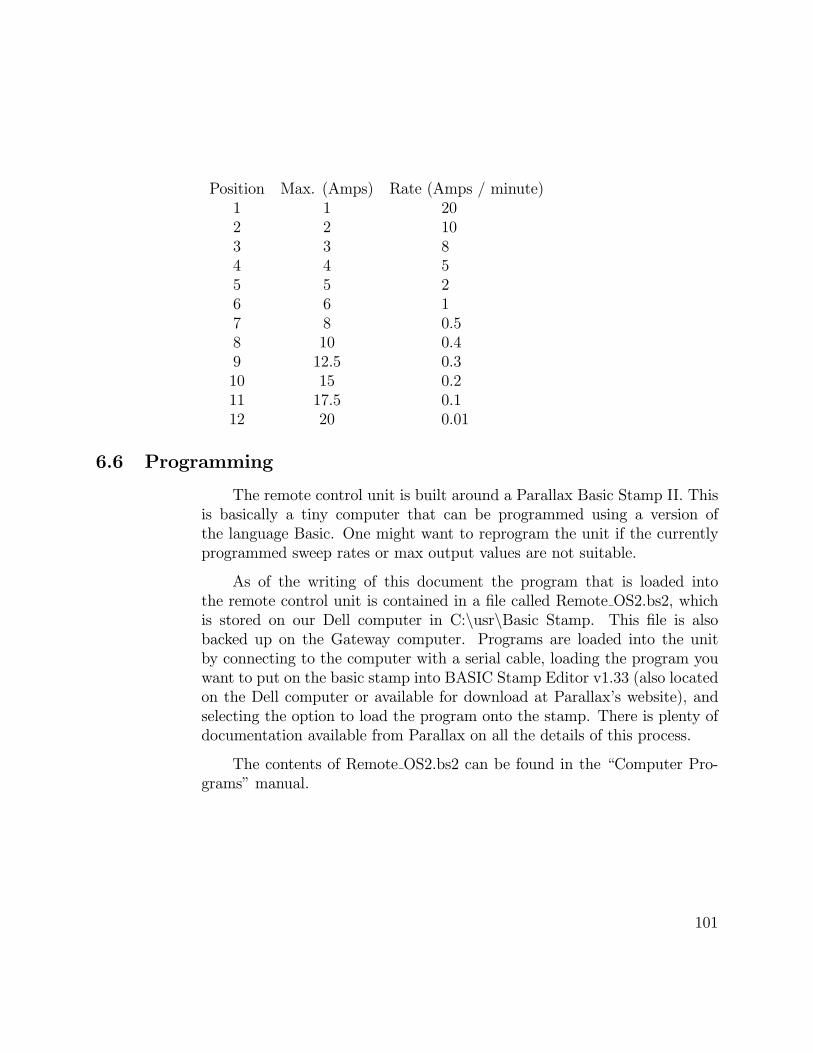
Position Max. (Amps) Rate (Amps / minute)
1 1 20
2 2 10
3 3 8
4 4 5
5 5 2
6 6 1
7 8 0.5
8 10 0.4
9 12.5 0.3
10 15 0.2
11 17.5 0.1
12 20 0.01
6.6 Programming
The remote control unit is built around a Parallax Basic Stamp II. This
is basically a tiny computer that can be programmed using a version of
the language Basic. One might want to reprogram the unit if the currently
programmed sweep rates or max output values are not suitable.
As of the writing of this document the program that is loaded into
the remote control unit is contained in a file called Remote OS2.bs2, which
is stored on our Dell computer in C:\usr\Basic Stamp. This file is also
backed up on the Gateway computer. Programs are loaded into the unit
by connecting to the computer with a serial cable, loading the program you
want to put on the basic stamp into BASIC Stamp Editor v1.33 (also located
on the Dell computer or available for download at Parallax’s website), and
selecting the option to load the program onto the stamp. There is plenty of
documentation available from Parallax on all the details of this process.
The contents of Remote OS2.bs2 can be found in the “Computer Pro-
grams” manual.
101

7. Vickers Hardness Indenter
7.1 Background
The Vickers Hardness test can be applied to different materials across a
very wide range of hardness. The Vickers test uses a square-based diamond
pyramid with a 136 point angle. The load (usually 50 kg, but could be 5,
10, 20, 30, or 120 kg) is applied via the pyramid against the smooth, firmly
supported, flat surface of the test specimen for 30 seconds. The resulting
hardness reading depends on the load and the area of the diamond pyramid
impression, in accordance with the formula
=Load (kgf)
Area of the Pyramidal Impression (mm2)
=1854 ∗ 05 kg
diagonal 1 * diagonal 2 (mm2)
The Vickers Hardness Indenter used is pictured in Figure 7.1.
7.2 Instructions
Before using the indenter, the specimen must be thoroughly polished; it is
recommended to use one-micron 3M imperial lapping film. Then place the
specimen level on the platform and raise or lower it until the pivot arm is
parallel with the baseplate when the diamond tip rests on the specimen.
Raise the pivot arm with the height adjuster so that the diamond tip no
longer rests on the specimen.
Move the specimen horizontally to the desired position. Very slowly
lower the height adjuster until the diamond tip contacts the specimen and
takes up the full weight of the pivot arm. Let the load rest on the specimen
for 30 seconds, and then slowly use the height adjuster to raise the diamond
102

Figure 7.1: The Vickers hardness indenter used for measuring hardness. It
uses a 0.5 kg load.
Figure 7.2: Diamond indentation. The depth of the indentation, as deter-
mined from the length of the diagonals, will indicate the hardness of the
material being measured.
103

tip up off the specimen. Multiple measurements should be taken at different
locations.
The specimen should then be placed under a microscope to view the
indentations, seen in Figure 7.2. Under a high magnification, measure the
lengths of the two diagonals. Use the equation above to determine the Vickers
Hardness HV 0.5 (for a 0.5 kg load). The Vickers Hardness can be converted
by going to http://www.efunda.com/units/hardness/convert hardness.cfm?
cat=Steel&HD=HV or by using the conversion table shown in Figure 7.3.
7.3 Results:
Non-magnetic Tungsten carbide:
• 1524 HV 0.5• Standard deviation: 163
Rhenium:
• 514 HV 0.5• Standard deviation: 9• HRC: 50
Russian Steel (non-annealed):
• 469 HV 0.5• Standard Deviation: 15• HRC: 47 (near center 51, near perimeter 46, determined 5/11/05 For-rest)
Russian Steel (annealing # 1):
• Annealing procedure: 600C for 712hours. Oven turned off and allowed
to cool to 280C. Sample then removed from oven and air-cooled
• 565 HV 0.5
104
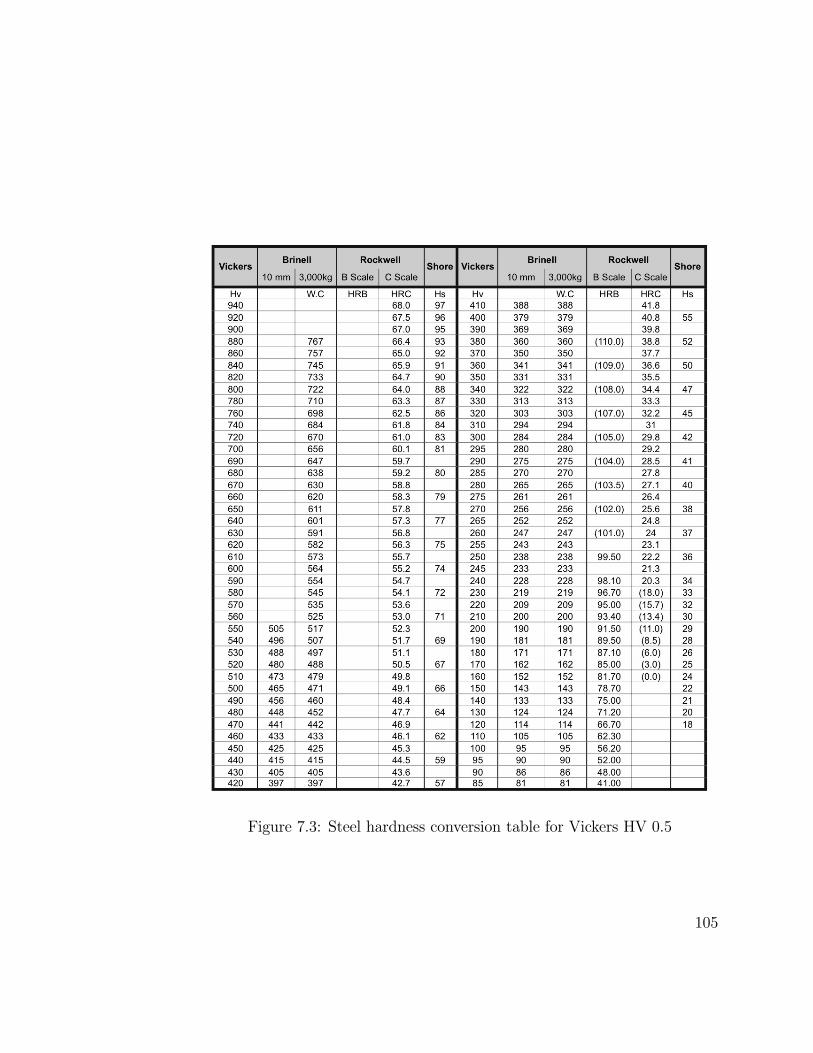
Figure 7.3: Steel hardness conversion table for Vickers HV 0.5
105
• Standard Deviation: 23• HRC: 53
Russian Steel (annealing # 2):
• Annealing procedure: 700C for 2 hours and 10 minutes and then im-mediately removed from oven and air-cooled.
• 547 HV 0.5• Standard Deviation: 13• HRC: 52
Comparison Measurements:
• Tungsten carbide: 1440 HV 0.5— With standard deviation: 50
— Percent difference: 5.83 %
• Russian Steel (annealing # 1): 559 HV 0.5
— With standard deviation: 14
— Percent difference: 1.07 %
106

8. Copper Plating
An electrolytic solution was prepared with 200 grams of CuSO45H2O and 25
mL of concentrated H2SO4. Distilled / deionised water was then added to
make it the whole solution 1 L. The piston was cleaned thoroughly and the
insulation of the Cu anode (1 mm thick) was removed by a razor blade. The
wire was formed into a circle 1.5 inches in diameter and placed around the
piston as shown in Figure 8.1. The electric connection was made as shown
below and the current was 1.5A with net deposition rate of ∼1 /min. Thedeposition was made for four minutes and to secure uniform deposition the
piston was rotated every minute by 90. If the system is working properly
then a faint glow will be visible in the anode region.
The piston was sanded clean with 0.5 diamond powder and a Kim
wipe to remove the softly adhered copper. The same powder was used to fit
the piston in to the cylinder by applying a small amount to the piston and
then moving the piston back and forth in the cylinder
107

Figure 8.1: Setup for copper plating the DAC piston. Note that the circular
wire should be placed around the center of the piston, making sure that it
does not touch it.
108

9. Resistivity Measurments in the DAC
(M. Debessai, 14 March 2007)
This was documented when Takahiro was preparing his cell for a measure-
ment of CaLi2 with lithium 5% deficient in March 2007.
• Gasket - Rhenium, 10 mm by 10 mm by 0.25 mm
• Anvils - 0.3 mm yellow diamond (from Japan)
The gasket was preindented to 30 - 40 and a 150 hole was drilled
using the EDM (see Figure 9.1).
Attach the gasket to the board with double sided tape. The board should
be kept in place so that the gasket will be in the same orientation as it was
during preindentation. Cover the whole gasket with scotch tape - this will
act as insulation between the platinum electrode and the gasket outside of
the sample chamber. Clean the surface of the tape using ethanol (ethyl
alcohol). Cut the insulation tape on the preindented part as seen in Figure
9.2.
Make a very sharp tooth pick and use it to put a very tiny pit of diamond
powder to almost cover the entire preindented area, as seen in Figure 9.3. If
using Al2O3, be sure to use a bit more powder since it is more compressible
than diamond.
Apply pressure up to 20 GPa so that the insulation material will be pressed
against the diamond and takes the shape of the preindented gasket. Since
the metal gasket is more compressible than the diamond, the preindented
gasket material will further decrease its thickness. A circular ring across the
culet edge through the perimeter (see Figure 9.4) is an indication that the
system has been pressurized. If there is some diamond powder left around
the culet which falls down after the diamonds are taken apart, use a sharp
tooth pick to clean them up.
109

Figure 9.1: Hole drilled in Rhenium gasket with EDM.
110

Figure 9.2: The insulation tape cur out in the preindented area.
111

Figure 9.3: Diamond powder filled in the preindented area.
112

Figure 9.4: Insulation layer after being pressed.
113

Figure 9.5: Crazy glue on the perimeter of the preindented circle.
To keep the insulation material in place, put a very tiny bit of crazy glue on
the edges of the preindentation (see Figure 9.5)using a sharp kim wipe and
let it dry for one or two minutes. Make sure that nothing gets toward the
faces of the preindented area, specially toward the culet. If so, try to dig it
out. Clean out the extra crazy glue that flows out of the preindented edge
to the outside of the gasket that is covered by the tape.
At the center of the diamond insulation, poke a cylindrical 100 hole (13
of the culet diameter) using a very sharp blade, followed by a tungsten wire
or needle (see Figure 9.6).
Prepare four platinum electrodes. Platinum has been found to be more stable
as compared to copper at high pressures. Gold and palladium have also
been used in Shmitzu’s group. A new blade has to be used for cutting the
electrode. To cut the electrode, use a cutting board. Clean the platinum
with ethanol and make sure it is flat on the board. Hold the electrode with
114

Figure 9.6: Sample chamber.
115

Figure 9.7: Initial electrode position.
a very small piece of scotch tape and place it on the gasket so that it passes
over the preindented area and the tip is close to the edge of the hole, as seen
in Figure 9.7.
Align and push the electrodes towards the center of the hole using a sharp
tooth pick. Rearrange the electrodes by pulling them if they are too long
or changing their orientation by positioning small pieces of scotch tape (see
Figure 9.8). Care has to be taken in rearranging the electrode as they can
be easily broken.
Push the electrodes with a diamond very slowly and watch the position of
the electrodes very closely. If the electrodes seem to be out of order, then
rearrenge them. As soon as you touch the insulation layer there should be
a color change in the facets. The applied pressure shouldn’t be too much to
distort the shape of the sample chamber. This step might take as long as
116
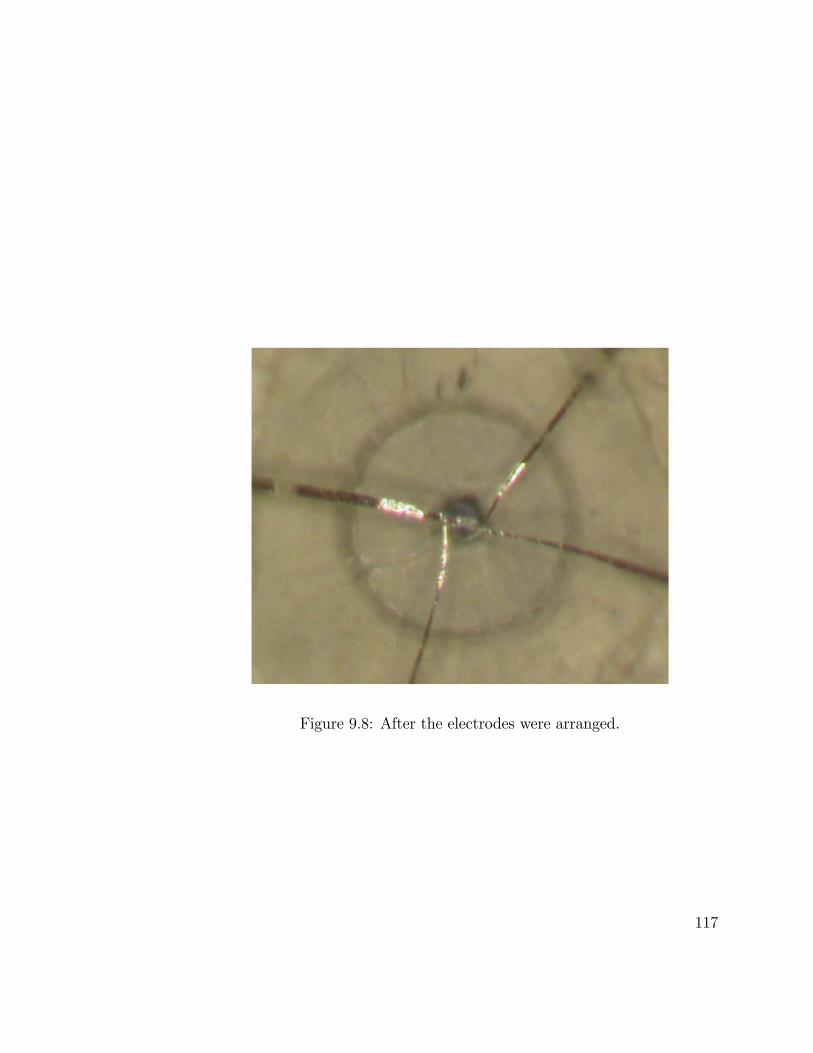
Figure 9.8: After the electrodes were arranged.
117

Figure 9.9: Picture taken through the top diamond when it was under pres-
sure.
5 hours. Keep the clamp under pressure for about 30 minutes so that the
electrodes take the shape of the diamond facets (see Figure 9.9)
Release the pressure. This experiment is set for a pseudo four point resistivity
measurement. The final appearance of the sample chamber and the electrodes
can be seen in Figure 9.10.
Put a small amount of crazy glue on the small pieces of tape that hold
the electrodes on the gasket. Use 140 copper wire for extending the
electrodes. Take the insulation out and solder it onto the board and then
to the electrode at right angles. At the edge of the board, the copper wires
should be taped and glued to the board. Figure 9.11 shows a final view of
the clamp.
118

Figure 9.10: Final position of the electrodes over the hole.
119

Figure 9.11: Final picture of the clamp.
120

10. Making an Insulated Gasket
(Takahiro Matsuoka, Feb 2007, 1 edition, small modificationsby M. Debessai)
Steps for making an insulated gasket (used for resistivity measurements in
the DAC system) are given below.
10.1 Insulating the Gasket
1. Pre-indent a metal gasket and drill a hole. The thickness of the prein-
dentation depends on the culet diameter of the diamond anvil being
used. From previous experience, if is the culet diameter, is the
preindented thickness of the metal gasket, and is the diameter of the
sample chamber (i.e. the hole drilled in the center of the gasket), then
13 and 1
3.
Due to technical problems, for resistance measurements above 20 GPa,
highly non-hydrostatic pressure conditions cannot be avoided.
For instructions on drilling a hole in the gasket, see the EDM manual.
2. Cover the entire gasket with scotch tape and hollow out a region over
the preindentation, as seen in Figure 10.1.
Fill the pre-indent hole with powder insulation material, as seen in
Figure 10.2.
3. Pressurize in a clamp to several GPa. After the anvils are released, a
the layer is made on the culet surface and on the lateral side of gasket,
as seen in Figure 10.3. Put crazy glue on the rim of the hole.
10.2 Making a Sample Chamber
1. Case I - Stiff crystal or powder sample with no pressure medium
121

Figure 10.1: Cover the gasket with scotch tape (yellow in figure) and then
remove a section above the preindentation.
Figure 10.2: Preindentation region filled with an insulating powder.
Figure 10.3: After being pressed using the clamp, the powder forms an insu-
lating layer around the gasket.
122

Figure 10.4: A shallow bowl-shaped hole in the insulation material is used
for non-hydrostatic measurements. Electrodes are shown in blue.
Figure 10.5: For quasi-hydrostatic measurements, a hole a sample chamber
is made at the center of the culet. Electrodes are shown in blue. The sample
chamber is filled with powder (green).
• Dig a shallow bowel on the insulation without making a hole (seeFigure 10.4).
• Put on electrodes2. Case II — For quasi-hydrostatic / less-non hydrostatic pressure medium
• Make a sample chamber on the center of culet, as seen in Figure10.5).
• Fill the sample chamber with powder or NaCl crystal up to 80 -85 % in volume.
123

Figure 10.6: Sample chamber when using a soft or fluid sample with no
pressure medium. Electrodes are shown in blue.
• Press the anvils together to press / fill NaCl in sample chamber.CAUTION: Using too much NaCl powder can be the reason for
the NaCl and sample flowing out of the sample chamber during
compression.
• Put on electrodes3. Case III - Sample is soft or fluid and no pressure medium is used (see
Figure 10.6).
• Make a sample chamber at the center of the culet• Put on electrodesCAUTION: When putting on the electrodes, be sure to push the
electrodes with the diamond anvil very gently so as not to destroy
the sample chamber.
10.3 Making the electrodes
Cut platinum foil, using a shaving lather, on a cutting board which is made
of something like circuit board. To obtain the sharp tip of electrodes, you
can make small angle as seen in Figure 10.7). TRICK: The shaving lather
must be very sharp each time you cut Pt foil, so change blades every 10-15
cuttings.
124

Figure 10.7: Cut electrodes from a piece of platinum foil, making sure to
obtain a sharp tip.
10.4 Putting electrodes on the gasket
1. Cut a small (as small as the tip of tweezers), piece of scotch tape.
2. Stick the fore-section of an electrode using the small piece of tape.
3. Fix electrode on the gasket to make the tip directly at the center of
culet, as seen in Figures 10.8 and 10.9.
4. Follow same procedure for other 3 electrodes.
5. Gently press electrodes onto the culet using the other diamond anvil,
as seen in Figure 10.10. Make sure that the electrodes go to the desired
positions when they are pushed onto the gasket. Prepare drawings of
desired configuration of sample chamber and electrodes. Push elec-
trodes down to the anvil and see the movement of electrodes. You can
predict the configuration of electrodes with current geometry of elec-
trodes and scotch tapes. If the predicted configuration is that which is
desired, you can gently push them onto the gasket. If not, you must lift
the diamond up and adjust the positions of electrodes by changing the
angle and length of the electrodes. Repeat pressing and adjustment
of electrodes until the desired configuration is reached. Be patient!!!
Matsuoka spent a minimum of 3 hours on this procedure.
After pushing electrodes on the gasket, leave it for several minutes,
then lift diamond anvil up. If electrodes don’t stay on the gasket, but
125

Figure 10.8: Top view of culet and preindented area as electrodes are put in
place.
Figure 10.9: Schematic drawing of anvils gasket, gasket holder, and elec-
trodes.
126
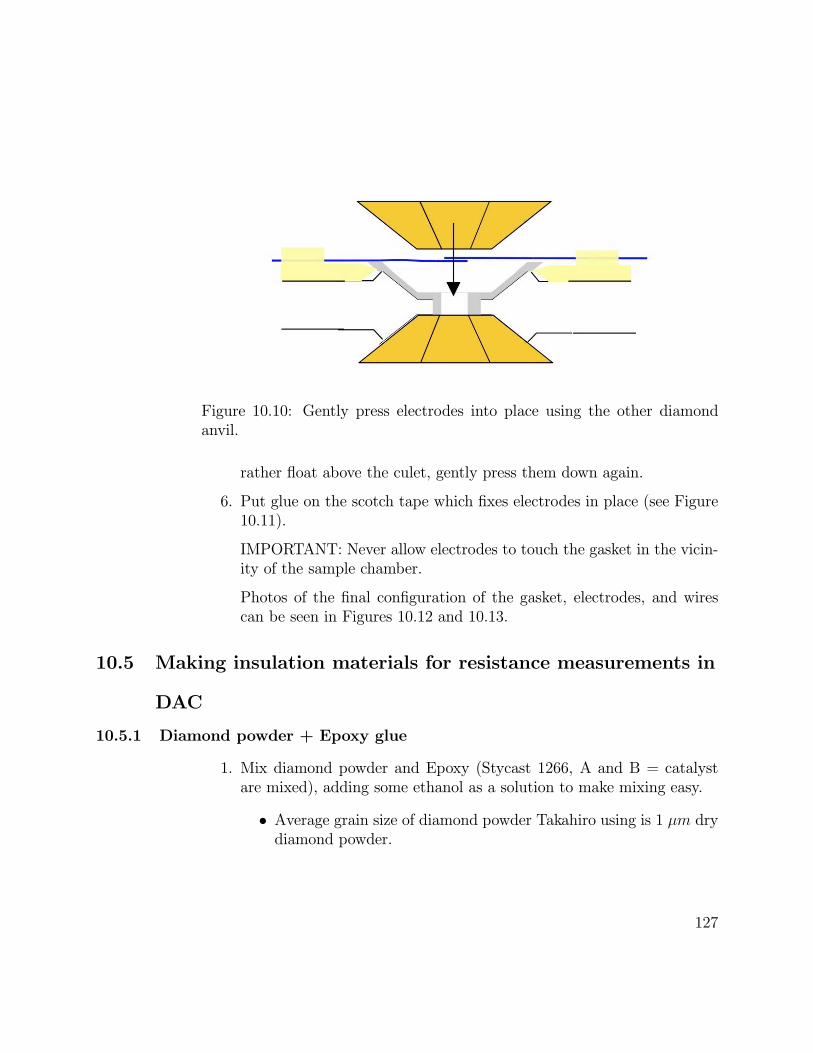
Figure 10.10: Gently press electrodes into place using the other diamond
anvil.
rather float above the culet, gently press them down again.
6. Put glue on the scotch tape which fixes electrodes in place (see Figure
10.11).
IMPORTANT: Never allow electrodes to touch the gasket in the vicin-
ity of the sample chamber.
Photos of the final configuration of the gasket, electrodes, and wires
can be seen in Figures 10.12 and 10.13.
10.5 Making insulation materials for resistance measurements in
DAC
10.5.1 Diamond powder + Epoxy glue
1. Mix diamond powder and Epoxy (Stycast 1266, A and B = catalyst
are mixed), adding some ethanol as a solution to make mixing easy.
• Average grain size of diamond powder Takahiro using is 1 dry
diamond powder.
127

Figure 10.11: Place glue on the scotch tape.
• Diamond powder used for polishing backing materials containssome kind of solution, so it cannot be used ... want to avoid
chemical reactions with reactive samples.
• Stycast 2850FT is black and mixed with Al2O3. This black stycastmight contain some magnetic materials. (I’m not sure)
2. The ratio is diamond powder 4 : epoxy 1 in weight.
3. Wait until the epoxy dries.
4. Slice and grind the mixture to fine powder.
Epoxy glue works as a bonding material for powder. Think of it this way ...
epoxy glue coats the diamond powder. By applying force, the epoxy spreads
and fills the cavities between the diamond powder, as shown in Figure 10.14.
10.5.2 Other Materials
Other materials such as cBN and Al2O3 can be mixed with epoxy using the
same procedure.
Al2O3 can be used without epoxy.
128

Figure 10.12: Gasket with electrodes in place. Anvil is 300
129

Figure 10.13: Gasket and wires on the gasket holder. The gasket is fixed to
the gasket holder using double sided tape.
130
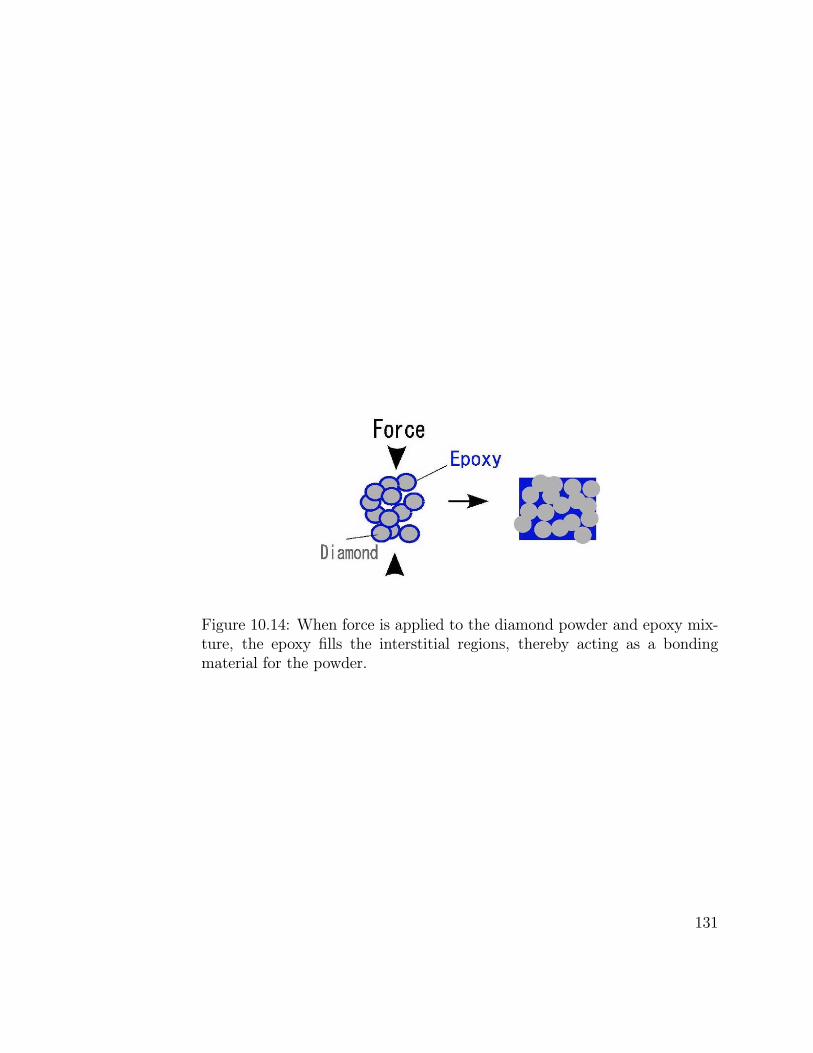
Figure 10.14: When force is applied to the diamond powder and epoxy mix-
ture, the epoxy fills the interstitial regions, thereby acting as a bonding
material for the powder.
131


![Densification dependent yield criteria for sodium silicate ...molnar-research.com/articles/Molnar_2016_AM.pdf · such as diamond anvil [28], pillar compression [26] or indentation](https://img.pdfslide.us/doc/110x75/601ca66d05bebb6aac22c16a/densification-dependent-yield-criteria-for-sodium-silicate-molnar-such-as-diamond.jpg)


![[Anvil Christopher] Anvil, Christopher - Interstel(BookFi)](https://img.pdfslide.us/doc/110x75/577c7f1a1a28abe054a33ed5/anvil-christopher-anvil-christopher-interstelbookfi.jpg)