Embed Size (px)
Citation preview
Dialog Axiata PLCSri Lanka's Premier Connectivity Provider
Q4 2018 / FY 2018 Results
an axiata company
divi/doc title/ author initials -dd-mm-yy 2company confidential
Dialog Group Performance
Dialog Axiata Company Performance
Subsidiary Performance
2
33
Dialog Group Performance Highlights – Q4 2018 / FY 2018
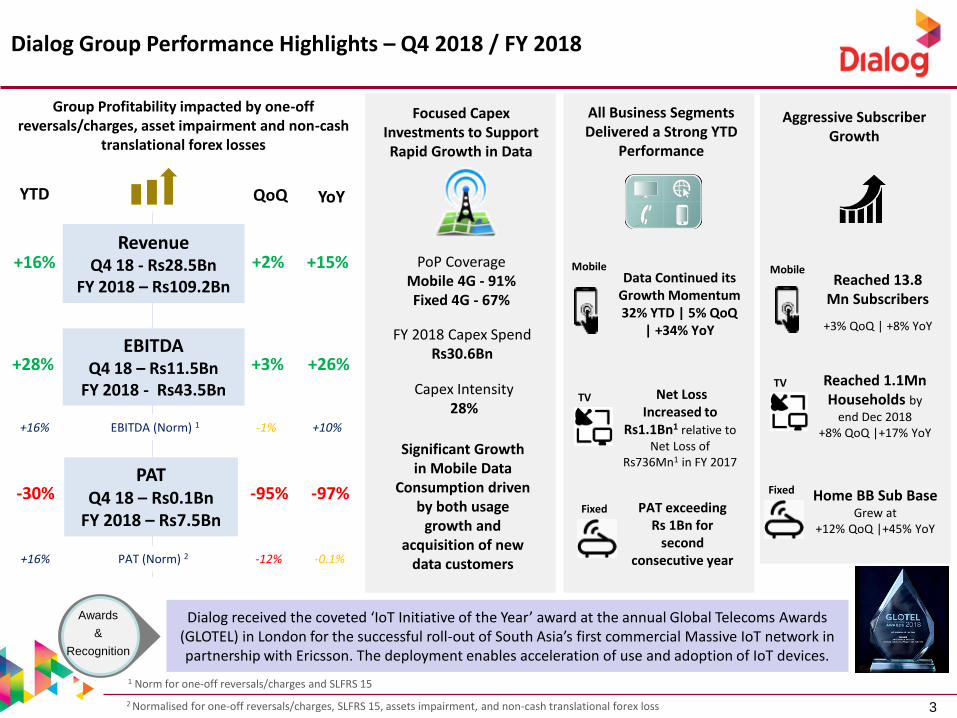
Group Profitability impacted by one-off reversals/charges, asset impairment and non-cash
translational forex losses
QoQYTD
+2%+16%
+3%+28%
-95%-30%
Focused Capex Investments to Support Rapid Growth in Data
All Business Segments Delivered a Strong YTD
Performance
Aggressive Subscriber Growth
Data Continued its Growth Momentum 32% YTD | 5% QoQ
| +34% YoY
Fixed
TV
PAT exceeding Rs 1Bn for
second consecutive year
Net Loss Increased to
Rs1.1Bn1 relative to Net Loss of
Rs736Mn1 in FY 2017
Mobile
Fixed
TV
MobileReached 13.8
Mn Subscribers
+3% QoQ | +8% YoY
Reached 1.1Mn Households by
end Dec 2018 +8% QoQ |+17% YoY
Home BB Sub Base Grew at
+12% QoQ |+45% YoY
RevenueQ4 18 - Rs28.5Bn
FY 2018 – Rs109.2Bn
EBITDA Q4 18 – Rs11.5Bn
FY 2018 - Rs43.5Bn
PATQ4 18 – Rs0.1Bn
FY 2018 – Rs7.5Bn
1 Norm for one-off reversals/charges and SLFRS 15
+16%
+16% -12%
3
FY 2018 Capex SpendRs30.6Bn
Capex Intensity28%
PoP Coverage Mobile 4G - 91%Fixed 4G - 67%
EBITDA (Norm) 1 -1%
PAT (Norm) 2
Significant Growth in Mobile Data
Consumption driven by both usage
growth and acquisition of new
data customers
YoY
+15%
+26%
-97%
-0.1%
+10%
Dialog received the coveted ‘IoT Initiative of the Year’ award at the annual Global Telecoms Awards (GLOTEL) in London for the successful roll-out of South Asia’s first commercial Massive IoT network in partnership with Ericsson. The deployment enables acceleration of use and adoption of IoT devices.
Awards
&
Recognition
2 Normalised for one-off reversals/charges, SLFRS 15, assets impairment, and non-cash translational forex loss
4
Group Financial Summary
44
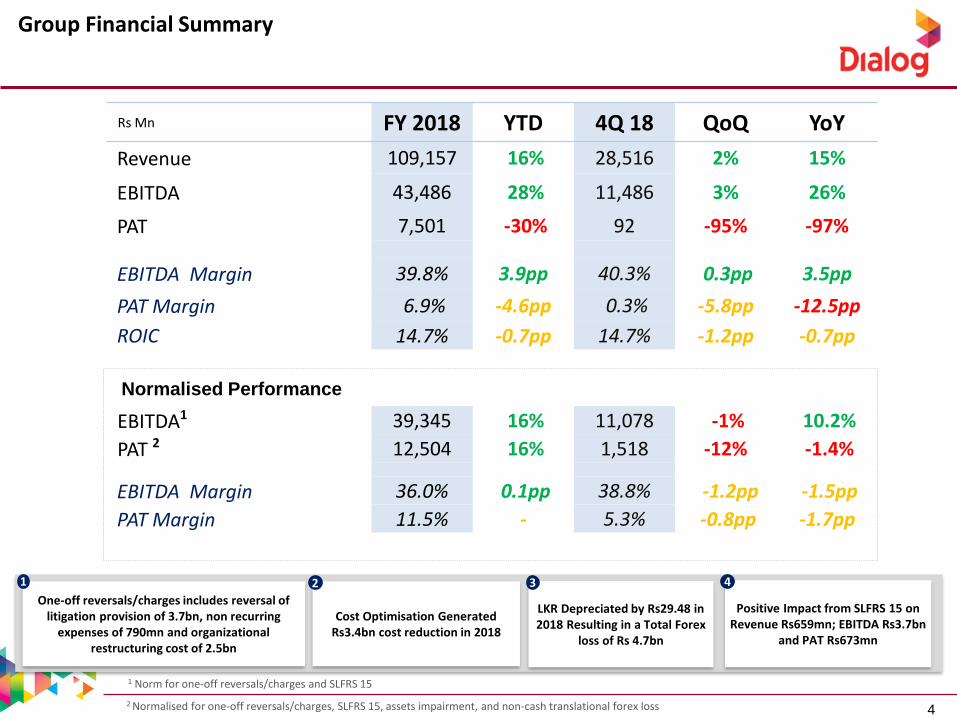
Rs Mn FY 2018 YTD 4Q 18 QoQ YoY
Revenue 109,157 16% 28,516 2% 15%
EBITDA 43,486 28% 11,486 3% 26%
PAT 7,501 -30% 92 -95% -97%
EBITDA Margin 39.8% 3.9pp 40.3% 0.3pp 3.5pp
PAT Margin 6.9% -4.6pp 0.3% -5.8pp -12.5pp
ROIC 14.7% -0.7pp 14.7% -1.2pp -0.7pp
EBITDA1 39,345 16% 11,078 -1% 10.2%
PAT 2 12,504 16% 1,518 -12% -1.4%
EBITDA Margin 36.0% 0.1pp 38.8% -1.2pp -1.5pp
PAT Margin 11.5% - 5.3% -0.8pp -1.7pp
Normalised Performance
1 Norm for one-off reversals/charges and SLFRS 15
2 Normalised for one-off reversals/charges, SLFRS 15, assets impairment, and non-cash translational forex loss
One-off reversals/charges includes reversal of litigation provision of 3.7bn, non recurring
expenses of 790mn and organizational restructuring cost of 2.5bn
Positive Impact from SLFRS 15 on Revenue Rs659mn; EBITDA Rs3.7bn
and PAT Rs673mn
LKR Depreciated by Rs29.48 in 2018 Resulting in a Total Forex
loss of Rs 4.7bn
1 3
Cost Optimisation Generated Rs3.4bn cost reduction in 2018
2 4
5
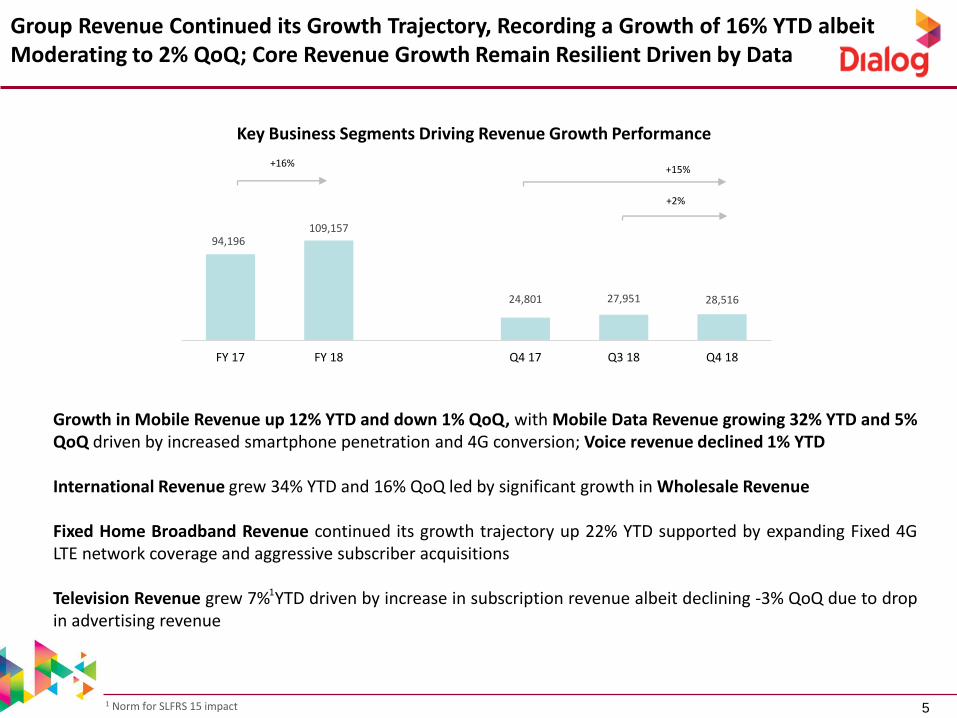
Group Revenue Continued its Growth Trajectory, Recording a Growth of 16% YTD albeitModerating to 2% QoQ; Core Revenue Growth Remain Resilient Driven by Data
5
+2%
Key Business Segments Driving Revenue Growth Performance
+15%
Growth in Mobile Revenue up 12% YTD and down 1% QoQ, with Mobile Data Revenue growing 32% YTD and 5%QoQ driven by increased smartphone penetration and 4G conversion; Voice revenue declined 1% YTD
International Revenue grew 34% YTD and 16% QoQ led by significant growth in Wholesale Revenue
Fixed Home Broadband Revenue continued its growth trajectory up 22% YTD supported by expanding Fixed 4GLTE network coverage and aggressive subscriber acquisitions
Television Revenue grew 7% YTD driven by increase in subscription revenue albeit declining -3% QoQ due to dropin advertising revenue
94,196109,157
24,801 27,951 28,516
0
20,000
40,000
60,000
80,000
100,000
120,000
FY 17 FY 18 Q4 17 Q3 18 Q4 18
+16%
1
1 Norm for SLFRS 15 impact
6
QoQ Group PAT
QoQ Group EBITDA
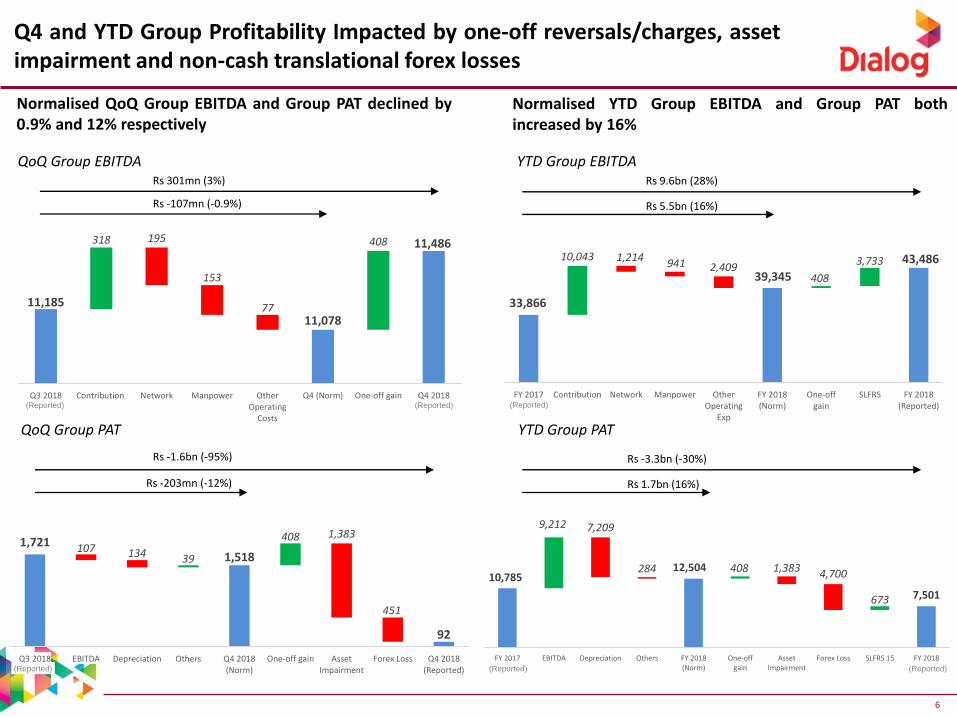
Q4 and YTD Group Profitability Impacted by one-off reversals/charges, assetimpairment and non-cash translational forex losses
Normalised QoQ Group EBITDA and Group PAT declined by0.9% and 12% respectively
Normalised YTD Group EBITDA and Group PAT bothincreased by 16%
YTD Group EBITDA
YTD Group PAT
Rs -107mn (-0.9%)
Rs 301mn (3%)
Rs -203mn (-12%)
Rs -1.6bn (-95%)
Rs 5.5bn (16%)
Rs 9.6bn (28%)
Rs 1.7bn (16%)
Rs -3.3bn (-30%)
11,185
11,078
11,486318 408195
153
77
Q3 2018 Contribution Network Manpower OtherOperating
Costs
Q4 (Norm) One-off gain Q4 2018
33,866
39,345
43,48610,043
408
3,7331,214941 2,409
FY 2017 Contribution Network Manpower OtherOperating
Exp
FY 2018(Norm)
One-offgain
SLFRS FY 2018(Reported)
10,78512,504
7,501
9,212
408
673
7,209
284 1,383 4,700
FY 2017 EBITDA Depreciation Others FY 2018(Norm)
One-offgain
AssetImpairment
Forex Loss SLFRS 15 FY 2018
1,7211,518
92
39
408107 134
1,383
451
Q3 2018 EBITDA Depreciation Others Q4 2018(Norm)
One-off gain AssetImpairment
Forex Loss Q4 2018(Reported)
(Reported) (Reported) (Reported)
(Reported)(Reported)(Reported)
7
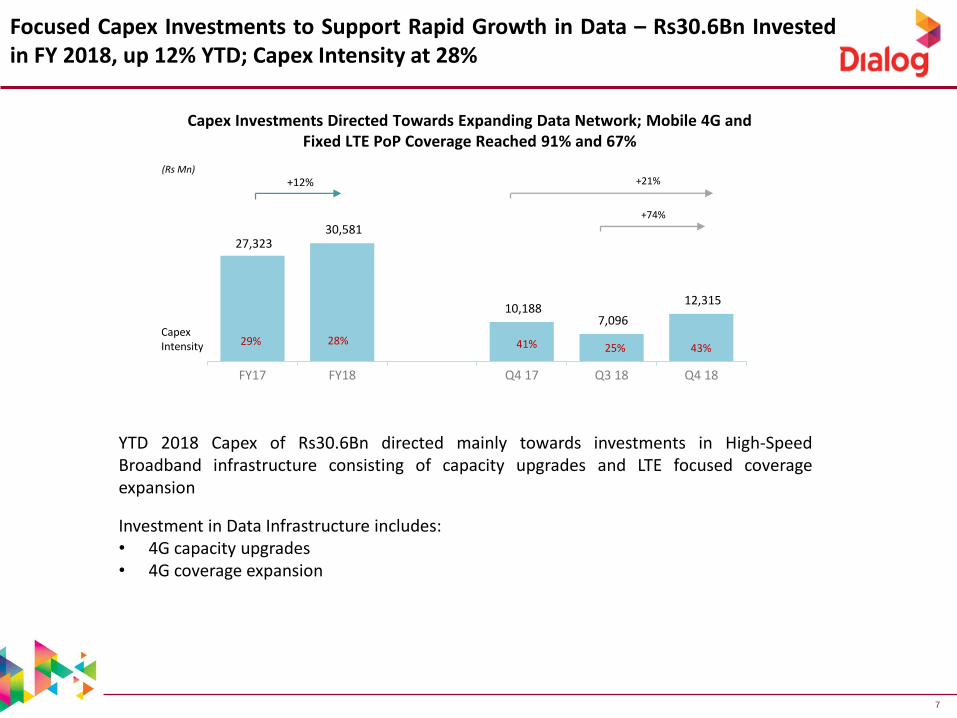
Focused Capex Investments to Support Rapid Growth in Data – Rs30.6Bn Investedin FY 2018, up 12% YTD; Capex Intensity at 28%
Capex Investments Directed Towards Expanding Data Network; Mobile 4G and Fixed LTE PoP Coverage Reached 91% and 67%
27,323 30,581
10,188 7,096
12,315
-
5,00 0
10,0 00
15,0 00
20,0 00
25,0 00
30,0 00
FY17 FY18 Q4 17 Q3 18 Q4 18
29% 28% 41% 25% 43%
CapexIntensity
(Rs Mn)
+12%
YTD 2018 Capex of Rs30.6Bn directed mainly towards investments in High-SpeedBroadband infrastructure consisting of capacity upgrades and LTE focused coverageexpansion
Investment in Data Infrastructure includes:• 4G capacity upgrades• 4G coverage expansion
+74%
+21%
8
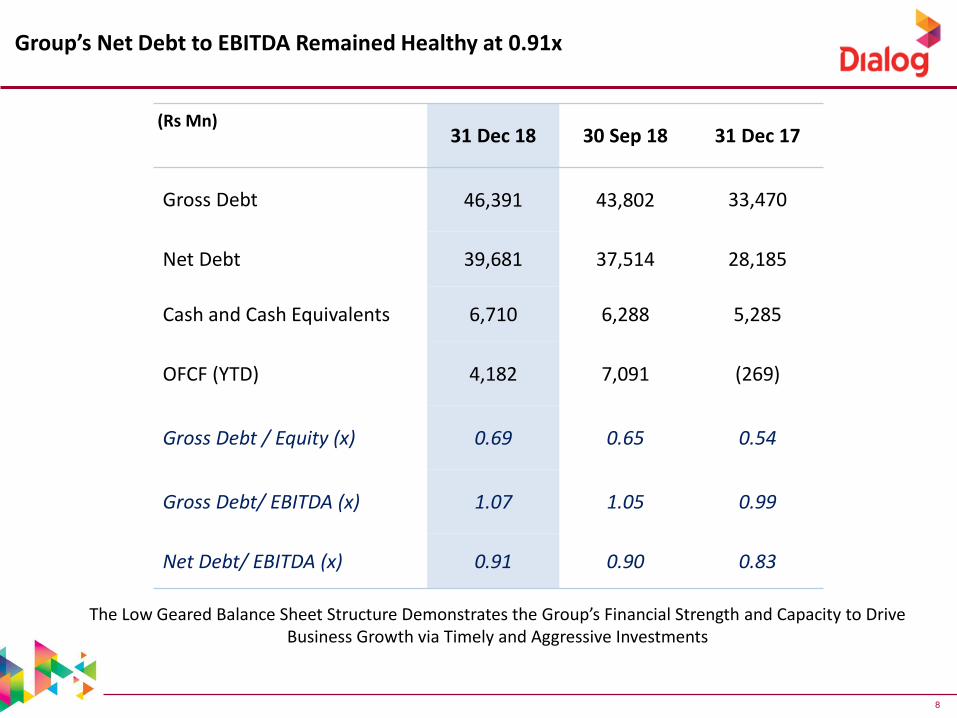
Group’s Net Debt to EBITDA Remained Healthy at 0.91x
(Rs Mn)31 Dec 18 30 Sep 18 31 Dec 17
Gross Debt 46,391 43,802 33,470
Net Debt 39,681 37,514 28,185
Cash and Cash Equivalents 6,710 6,288 5,285
OFCF (YTD) 4,182 7,091 (269)
Gross Debt / Equity (x) 0.69 0.65 0.54
Gross Debt/ EBITDA (x) 1.07 1.05 0.99
Net Debt/ EBITDA (x) 0.91 0.90 0.83
The Low Geared Balance Sheet Structure Demonstrates the Group’s Financial Strength and Capacity to Drive Business Growth via Timely and Aggressive Investments
9
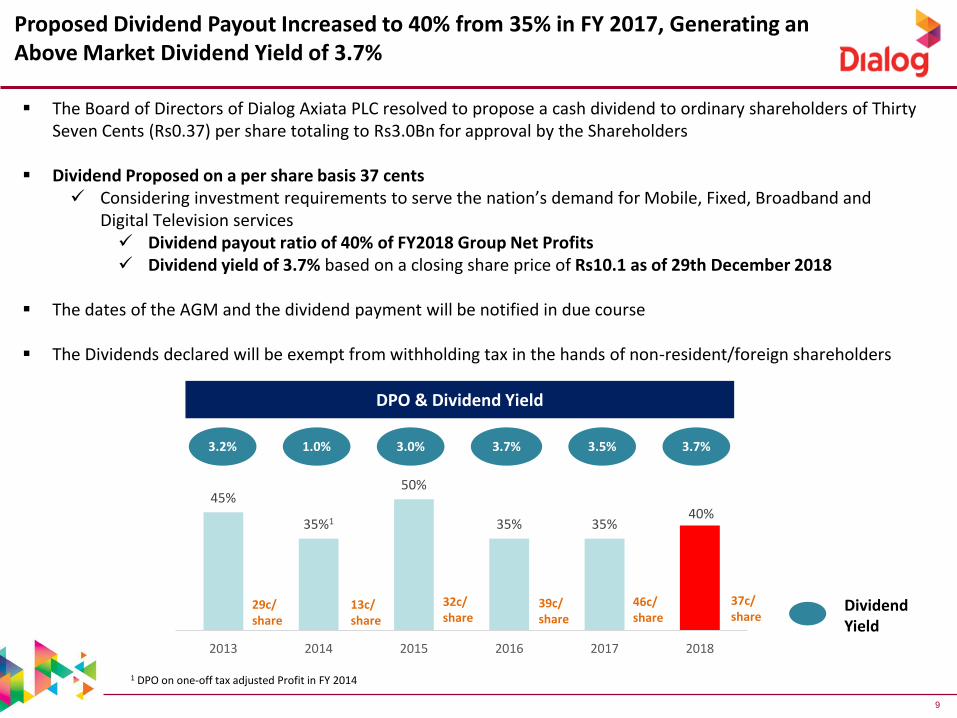
Proposed Dividend Payout Increased to 40% from 35% in FY 2017, Generating anAbove Market Dividend Yield of 3.7%
▪ The Board of Directors of Dialog Axiata PLC resolved to propose a cash dividend to ordinary shareholders of ThirtySeven Cents (Rs0.37) per share totaling to Rs3.0Bn for approval by the Shareholders
▪ Dividend Proposed on a per share basis 37 cents✓ Considering investment requirements to serve the nation’s demand for Mobile, Fixed, Broadband and
Digital Television services✓ Dividend payout ratio of 40% of FY2018 Group Net Profits✓ Dividend yield of 3.7% based on a closing share price of Rs10.1 as of 29th December 2018
▪ The dates of the AGM and the dividend payment will be notified in due course
▪ The Dividends declared will be exempt from withholding tax in the hands of non-resident/foreign shareholders
DPO & Dividend Yield
Dividend Yield
1 DPO on one-off tax adjusted Profit in FY 2014
3.5%3.7%3.0%1.0%3.2% 3.7%
45%
35%1
50%
35% 35%40%
0
10
20
30
40
50
60
2013 2014 2015 2016 2017 2018
29c/share
13c/share
32c/share
39c/share
46c/share
37c/share
10
Dialog Group Performance
Dialog Axiata PLC - Company Performance
Subsidiary Performance
11
11,498 11,671 11,870 12,001 12,406
1,299 1,356 1,340 1,368 1,385
Q4 17 Q1 18 Q2 18 Q3 18 Q4 180
2,0 00
4,0 00
6,0 00
8,0 00
10, 000
12, 000
Postpaid Subs Prepaid Subs
Normalised YTD EBITDA and PAT improved 17% and 19% Respectively whilst on QoQ basis, EBITDA declined by 3%
and PAT improved by 3%
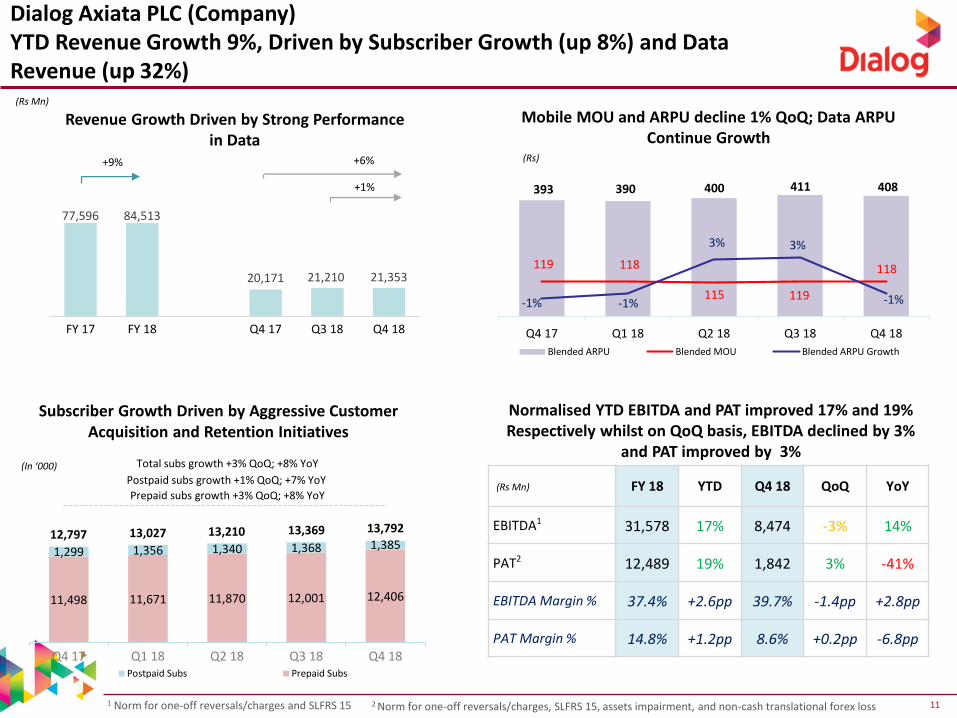
Dialog Axiata PLC (Company)YTD Revenue Growth 9%, Driven by Subscriber Growth (up 8%) and DataRevenue (up 32%)
Subscriber Growth Driven by Aggressive Customer Acquisition and Retention Initiatives
13,02712,797 13,210 13,369 13,792
Total subs growth +3% QoQ; +8% YoY
Postpaid subs growth +1% QoQ; +7% YoY
Prepaid subs growth +3% QoQ; +8% YoY
Mobile MOU and ARPU decline 1% QoQ; Data ARPU Continue Growth
393 390 400 411 408
119 118
115 119
118
-1% -1%
3% 3%
-1%-3%
-1%
1%
3%
5%
7%
9%
-
50
100
150
200
250
300
350
400
450
Q4 17 Q1 18 Q2 18 Q3 18 Q4 18
Blended ARPU Blended MOU Blended ARPU Growth
Revenue Growth Driven by Strong Performance in Data
(Rs Mn)
+6%
+1%
77,596 84,513
20,171 21,210 21,353
FY 17 FY 18 Q4 17 Q3 18 Q4 18
+9% (Rs)
(Rs Mn)
(In ‘000)
FY 18 YTD Q4 18 QoQ YoY
EBITDA1 31,578 17% 8,474 -3% 14%
PAT2 12,489 19% 1,842 3% -41%
EBITDA Margin % 37.4% +2.6pp 39.7% -1.4pp +2.8pp
PAT Margin % 14.8% +1.2pp 8.6% +0.2pp -6.8pp
1 Norm for one-off reversals/charges and SLFRS 15 2 Norm for one-off reversals/charges, SLFRS 15, assets impairment, and non-cash translational forex loss
12
Dialog Group Performance
Dialog Axiata Company Performance
Subsidiary Performance
13
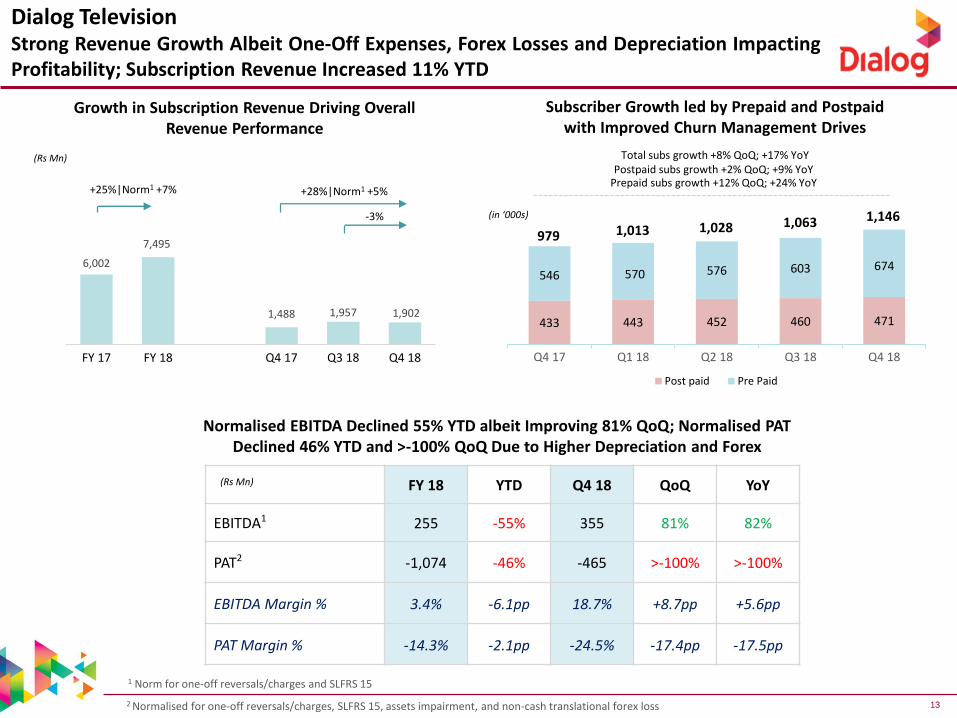
Dialog TelevisionStrong Revenue Growth Albeit One-Off Expenses, Forex Losses and Depreciation ImpactingProfitability; Subscription Revenue Increased 11% YTD
433 443 452 460 471
546 570 576 603 674
Q4 17 Q1 18 Q2 18 Q3 18 Q4 18
Post paid Pre Paid
Subscriber Growth led by Prepaid and Postpaid with Improved Churn Management Drives
Total subs growth +8% QoQ; +17% YoYPostpaid subs growth +2% QoQ; +9% YoY
Prepaid subs growth +12% QoQ; +24% YoY
1,0281,0139791,063 1,146(in ‘000s)
Growth in Subscription Revenue Driving Overall Revenue Performance
Normalised EBITDA Declined 55% YTD albeit Improving 81% QoQ; Normalised PAT Declined 46% YTD and >-100% QoQ Due to Higher Depreciation and Forex
(Rs Mn)
-3%
6,002
7,495
1,488 1,957 1,902
0
1,000
2,000
3,000
4,000
5,000
6,000
7,000
8,000
FY 17 FY 18 Q4 17 Q3 18 Q4 18
+25%|Norm1 +7% +28%|Norm1 +5%
(Rs Mn) FY 18 YTD Q4 18 QoQ YoY
EBITDA1 255 -55% 355 81% 82%
PAT2 -1,074 -46% -465 >-100% >-100%
EBITDA Margin % 3.4% -6.1pp 18.7% +8.7pp +5.6pp
PAT Margin % -14.3% -2.1pp -24.5% -17.4pp -17.5pp
1 Norm for one-off reversals/charges and SLFRS 15
2 Normalised for one-off reversals/charges, SLFRS 15, assets impairment, and non-cash translational forex loss
14
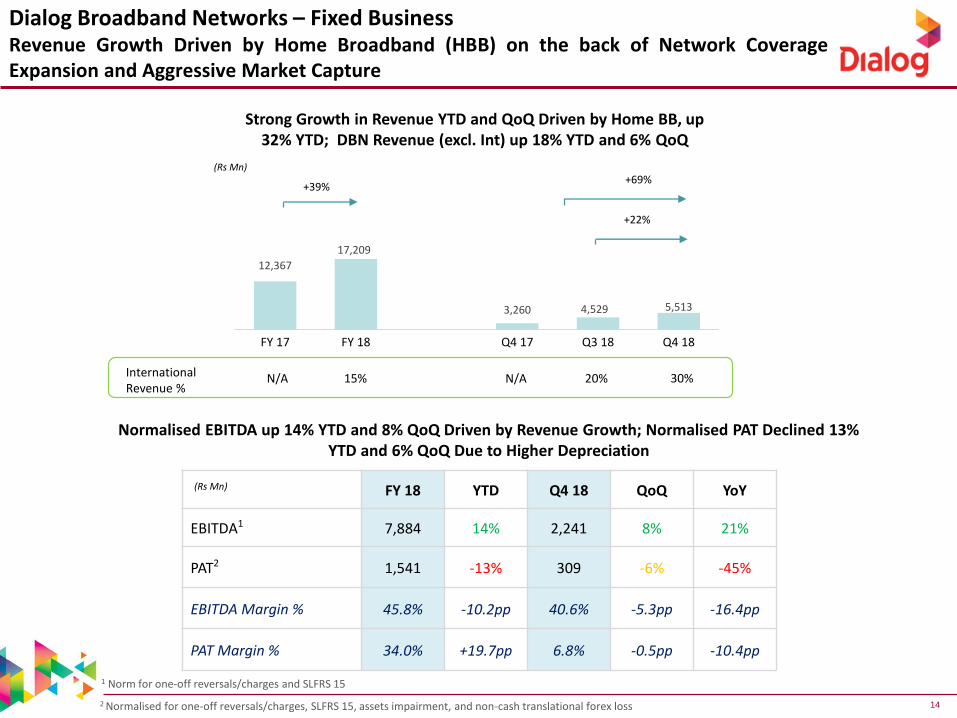
Dialog Broadband Networks – Fixed BusinessRevenue Growth Driven by Home Broadband (HBB) on the back of Network CoverageExpansion and Aggressive Market Capture
(Rs Mn)
(Rs Mn)+69%
+22%
12,367
17,209
3,260 4,529 5,513
2,000
4,000
6,000
8,000
10,000
12,000
14,000
16,000
18,000
FY 17 FY 18 Q4 17 Q3 18 Q4 18
+39%
FY 18 YTD Q4 18 QoQ YoY
EBITDA1 7,884 14% 2,241 8% 21%
PAT2 1,541 -13% 309 -6% -45%
EBITDA Margin % 45.8% -10.2pp 40.6% -5.3pp -16.4pp
PAT Margin % 34.0% +19.7pp 6.8% -0.5pp -10.4pp
Normalised EBITDA up 14% YTD and 8% QoQ Driven by Revenue Growth; Normalised PAT Declined 13% YTD and 6% QoQ Due to Higher Depreciation
1 Norm for one-off reversals/charges and SLFRS 15
2 Normalised for one-off reversals/charges, SLFRS 15, assets impairment, and non-cash translational forex loss
International Revenue %
N/A 15% N/A 20% 30%
Strong Growth in Revenue YTD and QoQ Driven by Home BB, up 32% YTD; DBN Revenue (excl. Int) up 18% YTD and 6% QoQ
15
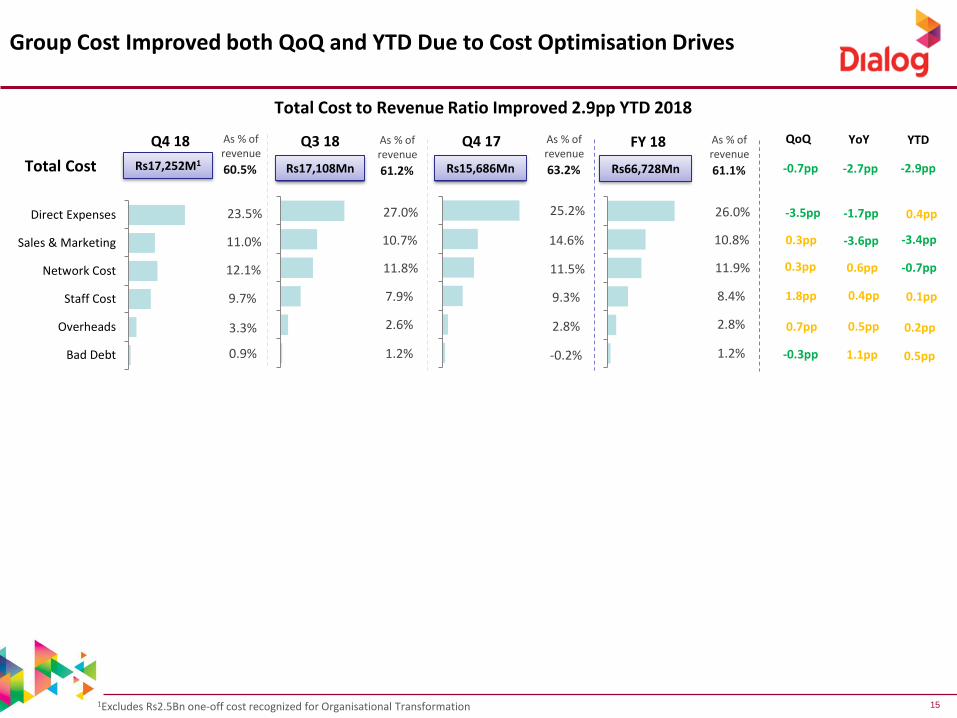
Total Cost to Revenue Ratio Improved 2.9pp YTD 2018
Group Cost Improved both QoQ and YTD Due to Cost Optimisation Drives
Q4 18
Rs17,252M1Total Cost
3.3%
As % of revenue
23.5%
11.0%
12.1%
9.7%
0.9%
60.5%
Bad Debt
Overheads
Staff Cost
Network Cost
Sales & Marketing
Direct Expenses
Q3 18
Rs17,108Mn
As % of revenue
27.0%
10.7%
11.8%
7.9%
1.2%
2.6%
61.2%
Q4 17
Rs15,686Mn
As % of revenue
25.2%
14.6%
11.5%
9.3%
-0.2%
2.8%
63.2%
YoY
-1.7pp
-3.6pp
0.6pp
0.4pp
1.1pp
-2.7pp
0.5pp
QoQ
-3.5pp
0.3pp
0.3pp
1.8pp
0.7pp
-0.7pp
-0.3pp
FY 18
Rs66,728Mn
As % of revenue
26.0%
10.8%
11.9%
8.4%
1.2%
2.8%
61.1%
YTD
0.4pp
-3.4pp
0.1pp
0.5pp
-2.9pp
0.2pp
-0.7pp
1Excludes Rs2.5Bn one-off cost recognized for Organisational Transformation