Embed Size (px)
Citation preview
University of PennsylvaniaScholarlyCommons
Publicly Accessible Penn Dissertations
Winter 12-22-2009
Dialect Boundaries and Phonological Change inUpstate New YorkAaron J. DinkinUniversty of Pennsylvania, [email protected]
Follow this and additional works at: http://repository.upenn.edu/edissertations
Part of the Anthropological Linguistics and Sociolinguistics Commons, and the Phonetics andPhonology Commons
This paper is posted at ScholarlyCommons. http://repository.upenn.edu/edissertations/79For more information, please contact [email protected].
Recommended CitationDinkin, Aaron J., "Dialect Boundaries and Phonological Change in Upstate New York" (2009). Publicly Accessible Penn Dissertations.79.http://repository.upenn.edu/edissertations/79
Dialect Boundaries and Phonological Change in Upstate New York
AbstractThe eastern half of New York State is a dialectologically diverse region around which several dialect regionsconverge—the Inland North, New York City, Western New England, and Canada. These regions differ withrespect to major parameters of North American English phonological variation; and therefore the interfacebetween them is of interest because the location and structure of their boundaries can illuminate constraintson phonological changes and their geographic diffusion. In this dissertation, interviews with 119 speakers inNew York State are conducted and phonetically analyzed in order to determine the dialect geography of thisregion in detail.
The sampled area is divisible into several dialect regions. The Inland North fringe contains communities thatwere settled principally from southwestern New England; here the Northern Cities Shift (NCS) is present,but not as consistently as in the Inland North proper. In the core of the Hudson Valley, there is clear influencefrom New York City phonology. The Hudson Valley fringe, between the Hudson Valley core and the InlandNorth, exhibits some NCS features, but no raising of /æ/ higher than /e/; this is attributed to the effect of thenasal /æ/ system in blocking diffusion of full /æ/-raising. The North Country, in the northeastern corner ofthe state, is the only sampled region where the low back merger is well advanced, but the merger is in progressover the long term in the other regions except for the Hudson Valley core; this illustrates that the NCS doesnot effectively prevent merger.
General theoretical inferences include the following: (potentially allophonic) segments, not phonemes, arethe basic unit of chain shifting, and one allophone can prevent another from being moved into its phoneticspace; the effect of diffusion of a phonemic merger from one region to another may merely be a slow trend inthe recipient region toward merger; and isoglosses for lexically-specific features may correspond better topopular regional boundaries than do phonological isoglosses. Finally, a definition of dialect boundaries asobstacles to diffusion is introduced.
Degree TypeDissertation
Degree NameDoctor of Philosophy (PhD)
Graduate GroupLinguistics
First AdvisorWilliam Labov
Second AdvisorGillian Sankoff
This dissertation is available at ScholarlyCommons: http://repository.upenn.edu/edissertations/79

Third AdvisorDonald Ringe
Keywordssociolinguistics, dialectology, phonology, phonetics
Subject CategoriesAnthropological Linguistics and Sociolinguistics | Linguistics | Phonetics and Phonology
This dissertation is available at ScholarlyCommons: http://repository.upenn.edu/edissertations/79
DIALECT BOUNDARIES AND PHONOLOGICAL CHANGE IN
UPSTATE NEW YORK
Aaron Joshua Dinkin
A DISSERTATION
in
Linguistics
presented to the faculties of the University of Pennsylvania in partial fulfillment of the requirements for the degree of Doctor of Philosophy
2009
Supervisor of dissertation: ________________________ William Labov, Fassit Professor of Linguistics Chair of graduate group: ________________________ Eugene Buckley, Associate Professor of Linguistics Dissertation committee: William Labov, Fassit Professor of Linguistics Gillian Sankoff, Professor of Linguistics Donald Ringe, Kahn Term Professor in Linguistics
ii
Acknowledgements
There are innumerable ways in which this dissertation would have been
impossible without the contributions of my advisor, Bill Labov. Most obviously,
as a glance at my bibliography will demonstrate, my research is founded upon
more than 45 years of Bill’s methodological, empirical, and theoretical
innovations; I depended upon Bill’s work for the techniques I used for collecting
my data, the conceptual tools for analyzing it, and the context in which to
interpret it. Beyond those, I am grateful to Bill as an advisor for many thought-
provoking conversations on the issues discussed herein, his always helpful and
prompt comments on my drafts, his encouraging enthusiasm about my results,
and the funding he was able to dig up to help support my fieldwork.
Gillian Sankoff has been a constant and welcome source of support to me,
always seeming willing to share her thoughts on whatever topic I sought her
advice on. Thanks are due to Don Ringe not only for his contribution of his
expertise in looking at language change from a slightly different perspective but
also for being willing to join my committee on short notice. Other senior
researchers, at Penn and beyond, to whom I am indebted for helpful discussions,
sharing of valuable references, and timely assistance of various sorts include
Sherry Ash, Gene Buckley, Tony Kroch, Mark Liberman, Donna Jo Napoli,
Dennis Preston, Sali Tagliamonte, Gerard Van Herk, and Jiahong Yuan. Sue
Sheehan and Amy Forsyth, of course, deserve the credit for helping my essential
paperwork navigate the labyrinth of Penn bureaucracy.
iii
Ariel Diertani has dedicated many hours of her time to reading and
helping edit my intermediate drafts, listening to me talk through complicated
issues, and discussing abstract theories of language change with me; but she has
earned more than enough gratitude simply for her much-needed emotional
support and encouragement that helped me through the pressure of dissertation-
writing. Keelan Evanini and Michael Friesner have been working on related
topics during the period I’ve been working on this dissertation, and my work has
benefited a great deal from collaborating and sharing ideas with them. Other
graduate-school contemporaries of mine at Penn to whom I owe thanks for
advice and discussions which ultimately benefited this dissertation include Joe
Fruehwald, Daniel Ezra Johnson, Laurel MacKenzie, Hilary Prichard, Suzanne
Evans Wagner, and (last but not least) the entirety of my first-year class from
when I began graduate school: Łukasz Abramowicz, Carmen Del Solar Valdés,
the aforementioned Michael Friesner, Damien Hall, Maya Ravindranath, Tanja
Scheffler, and Joel Wallenberg were an invaluable source of support through the
early stages of my linguistic career, and remain the Best Cohort Ever.
Additional credit for keeping me sane over the past two and a half years,
and indeed over the past six and a half years, goes to my friends from outside of
linguistics (notwithstanding which, some of whom are in fact linguists
themselves) and to my family. I am always flattered by my family’s confidence in
me, and glad that Philadelphia is near enough to home that I can be back often.
To thank all of the friends who have helped me through the past six and a half
years would take all day; they include, but are scarcely limited to, Elisabeth
Cohen and Warren Tusk, Rebecca Ennen, Ben George and Chelsea Rosenthal,

iv
Lark-Aeryn and David Speyer, Emily Morgan, and the members of the
Underground Shakespeare Company.
I would have no dissertation at all, of course, without the 120-odd
anonymous residents of Upstate New York (many of them anonymous even to
me) whose vowels are discussed in these pages. Thanks are due in particular to
the individuals identified pseudonymously within as Amanda F., Carol G., Jack
K., Sarah L., and Terri M., as well as to Janet Graham (not herself one of my
interview subjects), all of whom aided my research by putting me in contact with
additional willing interview subjects when I needed to increase my sample.
Finally, I would like to recognize the three individuals who bear specific
responsibility for sending me down the path that led me to graduate school in
linguistics. Claire Hoult, who taught me Latin and History of the English
Language in high school, was the first person to make me think about language
change in a structured way. John Lawler, whom I knew for years only as a name
behind text in a Usenet newsgroup, was the first linguistics professor with whom
I had contact, and thus he made me aware of linguistics as an academic
discipline; his perspicuous explanations of phenomena in English grammar first
made me think that linguistics as a field was something I wanted to learn more
about. Bert Vaux was the closest I had to a linguistics advisor as an
undergraduate; when I decided that I wanted to apply to graduate school in
linguistics, but knew nothing about any universities’ linguistics programs, it was
Bert who suggested I should apply to Penn. Not only to these three but to all of
the people mentioned or inadvertently omitted in this note, I express my deep
gratitude; I couldn’t have come this far without you.
v
ABSTRACT
DIALECT BOUNDARIES AND PHONOLOGICAL CHANGE
IN UPSTATE NEW YORK
Aaron Joshua Dinkin
Supervisor: William Labov
The eastern half of New York State is a dialectologically diverse region
around which several dialect regions converge—the Inland North, New York
City, Western New England, and Canada. These regions differ with respect to
major parameters of North American English phonological variation; and
therefore the interface between them is of interest because the location and
structure of their boundaries can illuminate constraints on phonological changes
and their geographic diffusion. In this dissertation, interviews with 119 speakers
in New York State are conducted and phonetically analyzed in order to
determine the dialect geography of this region in detail.
The sampled area is divisible into several dialect regions. The Inland
North fringe contains communities that were settled principally from
southwestern New England; here the Northern Cities Shift (NCS) is present, but
not as consistently as in the Inland North proper. In the core of the Hudson
Valley, there is clear influence from New York City phonology. The Hudson
Valley fringe, between the Hudson Valley core and the Inland North, exhibits
some NCS features, but no raising of /æ/ higher than /e/; this is attributed to

vi
the effect of the nasal /æ/ system in blocking diffusion of full /æ/-raising. The
North Country, in the northeastern corner of the state, is the only sampled region
where the low back merger is well advanced, but the merger is in progress over
the long term in the other regions except for the Hudson Valley core; this
illustrates that the NCS does not effectively prevent merger.
General theoretical inferences include the following: (potentially
allophonic) segments, not phonemes, are the basic unit of chain shifting, and one
allophone can prevent another from being moved into its phonetic space; the
effect of diffusion of a phonemic merger from one region to another may merely
be a slow trend in the recipient region toward merger; and isoglosses for
lexically-specific features may correspond better to popular regional boundaries
than do phonological isoglosses. Finally, a definition of dialect boundaries as
obstacles to diffusion is introduced.
vii
Table of contents
Acknowledgements……………………………………………………………………..ii
Abstract…………………………………………………………………………………..v
List of tables…………………………………………………………………………….xii
List of figures…………………………………………………………………………..xiii
List of maps…………………………………………………………………………….xv
Chapter 1: Introduction
1.1. Nature of dialect boundaries…………………………………………………..1
1.2. New York State………………………………………………………………….8
1.3. The features of interest
1.3.1. The Northern Cities Shift……………………………………………….12
1.3.2. Short-a and short-o systems…………………………………………….14
1.3.3. Elementary………………………………………………………………...17
1.4. Previous work other than Telsur…………………………………………….18
1.5. General issues………………………………………………………………….25
Chapter 2: Methodology
2.1. Overview of methodological goals…………………………………………..28
2.2. Selection of specific communities……………………………………………30
2.3. Interview methodology
2.3.1. In-person interviews…………………………………………………….35
2.3.2. Telephone interviews…………………………………………………...39
2.3.3. Selection of speakers for analysis……………………………………...42
2.3.4. Evaluation of sampling methods………………………………………45
viii
2.4. Phonetic measurements………………………………………………………51
Chapter 3: The Northern Cities Shift and Settlement History
3.1. The nature of the Inland North’s eastern boundary………………………59
3.2. Results: categorical NCS criteria
3.2.1 Overall findings…………………………………………………………..62
3.2.2. Classifying communities………………………………………………..66
3.2.3. Change in apparent time……………………………………………….75
3.2.4. Summary of results from NCS scores………………………………...79
3.3. The EQ1 index
3.3.1 Definition and motivation………………………………………………80
3.3.2 Results of the EQ1 index………………………………………………...83
3.3.3. Change in apparent time……………………………………………….88
3.4. Mapping the results
3.4.1. Summary of classification………………………………………………93
3.4.2. The Hudson Valley……………………………………………………...95
3.4.3. Boundaries and communication patterns…………………………….97
3.5. Settlement of the communities in the sample
3.5.1 Historians’ descriptions of settlement patterns……………………...101
3.5.2. Communication patterns and villages……………………………….109
3.5.3. Interpreting the boundary between Ogdensburg and Canton……110
3.5.4. Settlement history and the Hudson Valley………………………….116
3.6. Absence of the NCS in Southwestern New England
3.6.1. The problem…………………………………………………………….118
3.6.2. The distribution of individual NCS features………………………..120
ix
3.6.3. The origin of the NCS…………………………………………………124
3.7. Adding in the communities with small samples…………………………132
3.8. Conclusion……………………………………………………………………140
Chapter 4: Short-A Phonology and the Structure of the Vowel Space
4.1. ANAE’s classification of /æ/ systems……………………………………..144
4.2. The diffused New York City /æ/ system
4.2.1. Structure of the diffused system……………………………………...151
4.2.2. Dialectology of the diffused system………………………………….163
4.3. Short-a systems and the Northern Cities Shift
4.3.1. The NCS raised continuous /æ/ system…………………………….168
4.3.2. The raised nasal /æ/ system………………………………………….176
4.3.3. The nasal and continuous systems overall…………………………..187
4.3.4. Phonological structure, /æ/ systems, and the NCS………………..192
4.4. The syllable-boundary pilot experiment
4.4.1. NCS /æ/ as a long and ingliding phoneme………………………...203
4.4.2. Description of the syllable-boundary experiment………………….206
4.4.3. Results from Ogdensburg and Canton……………………………...208
4.4.4. Subsystem ambiguity of low monophthongs………………………214
4.5. Triangular and quadrilateral vowel systems
4.5.1. Background……………………………………………………………..216
4.5.2. Clear vowel system shapes in the current sample………………….224
4.5.3. Evidence for diffusion into the Inland North fringe……………….227
4.5.4. Vowel system shapes in Oneonta and Amsterdam………………..230
4.6. Diffusion of allophony………………………………………………………235
x
4.7. Conclusion……………………………………………………………………239
Chapter 5: The Low Back Merger
5.1. Expansion and resistance……………………………………………………243
5.2. Minimal-pair judgments…………………………………………………….246
5.3. The caught-cot merger in F1/F2 space and apparent time
5.3.1. The full sample…………………………………………………………264
5.3.2. The North Country…………………………………………………….266
5.3.3. Cooperstown and Sidney……………………………………………...276
5.3.4. The Inland North core and fringe…………………………………….277
5.3.5. The Hudson Valley…………………………………………………….291
5.3.6. Sudden sound change?………………………………………………..294
5.4. Phonological transfer before preconsonantal /l/
5.4.1. Mechanisms of merger………………………………………………...306
5.4.2. Definition and motivation of (olC)…………………………………...310
5.4.3. Overall results…………………………………………………………..314
5.4.4. Phonological transfer by region………………………………………316
5.5. Cooperstown and Sidney……………………………………………………323
5.6. Stable resistance reevaluated………………………………………………..328
5.7. Conclusion……………………………………………………………………334
Chapter 6: Secondary Stress on -mentary
6.1. The structure of -mentary variation………………………………………...338
6.2. Results from interview data
6.2.1. Overall results…………………………………………………………..344
6.2.2. Geographical results…………………………………………………...353
xi
6.2.3. Analysis of geographical results……………………………………...359
6.2.4. The reduced-antepenult variant……………………………………...363
6.3. Moving beyond the current sample………………………………………..367
6.4. The rapid and anonymous school-district telephone survey……………371
6.5. Analysis of isoglosses………………………………………………………..379
6.6. Conclusion……………………………………………………………………390
Chapter 7: Conclusions
7.1. Defining dialect boundaries………………………………………………...392
7.2. Western New England………………………………………………………405
7.3. The objects of diffusion
7.3.1. Is diffusion taking place?……………………………………………...410
7.3.2. What is an observable element of language?………………………..413
7.3.3. Phonemic mergers vs. allophonic mergers………………………….416
7.3.4. The two principles of diffusion……………………………………….419
7.4. Unanswered dialectological questions
7.4.1. Gaps in the sample……………………………………………………..422
7.4.2. Glens Falls and vicinity………………………………………………..423
7.4.3. St. Lawrence County…………………………………………………...427
7.5. Overall wrapup and synopsis………………………………………………429
Appendix: Index of sampled speakers……………………………………………...436
References.……………………………………………………………………………..442
xii
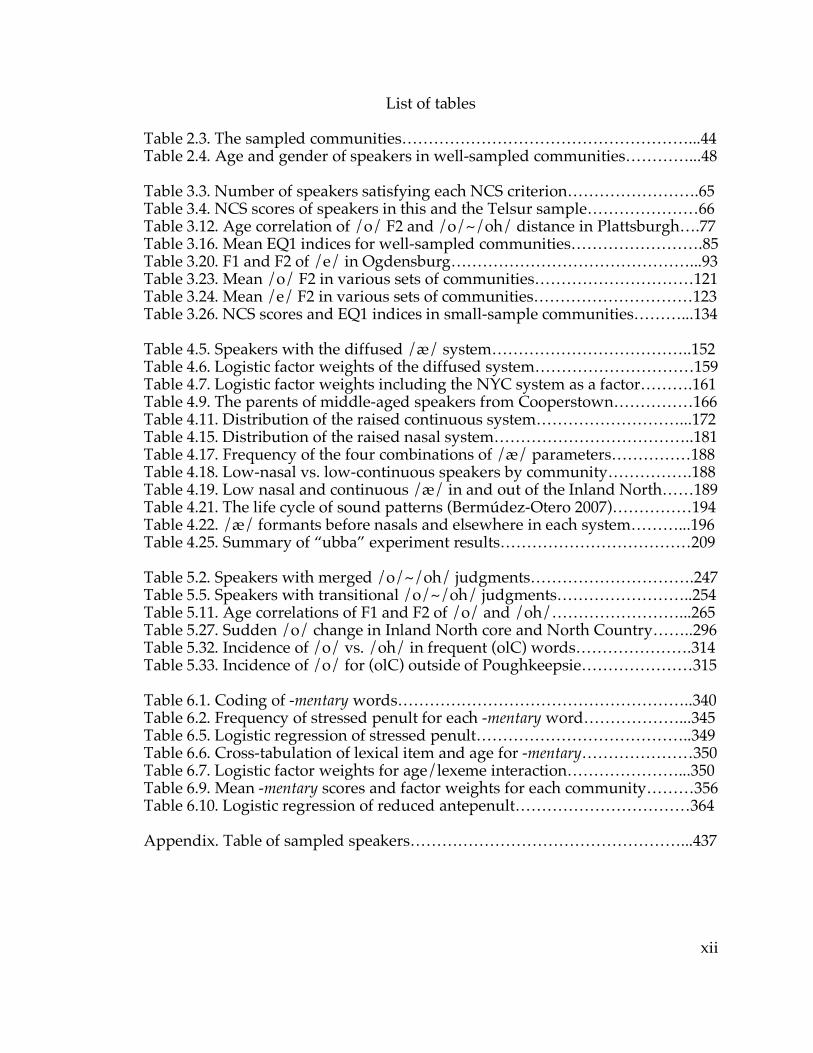
List of tables
Table 2.3. The sampled communities………………………………………………...44 Table 2.4. Age and gender of speakers in well-sampled communities…………...48 Table 3.3. Number of speakers satisfying each NCS criterion…………………….65 Table 3.4. NCS scores of speakers in this and the Telsur sample…………………66 Table 3.12. Age correlation of /o/ F2 and /o/~/oh/ distance in Plattsburgh….77 Table 3.16. Mean EQ1 indices for well-sampled communities…………………….85 Table 3.20. F1 and F2 of /e/ in Ogdensburg………………………………………...93 Table 3.23. Mean /o/ F2 in various sets of communities…………………………121 Table 3.24. Mean /e/ F2 in various sets of communities…………………………123 Table 3.26. NCS scores and EQ1 indices in small-sample communities………...134 Table 4.5. Speakers with the diffused /æ/ system………………………………..152 Table 4.6. Logistic factor weights of the diffused system…………………………159 Table 4.7. Logistic factor weights including the NYC system as a factor……….161 Table 4.9. The parents of middle-aged speakers from Cooperstown……………166 Table 4.11. Distribution of the raised continuous system………………………...172 Table 4.15. Distribution of the raised nasal system………………………………..181 Table 4.17. Frequency of the four combinations of /æ/ parameters……………188 Table 4.18. Low-nasal vs. low-continuous speakers by community…………….188 Table 4.19. Low nasal and continuous /æ/ in and out of the Inland North……189 Table 4.21. The life cycle of sound patterns (Bermúdez-Otero 2007)……………194 Table 4.22. /æ/ formants before nasals and elsewhere in each system………...196 Table 4.25. Summary of “ubba” experiment results………………………………209 Table 5.2. Speakers with merged /o/~/oh/ judgments………………………….247 Table 5.5. Speakers with transitional /o/~/oh/ judgments……………………..254 Table 5.11. Age correlations of F1 and F2 of /o/ and /oh/……………………...265 Table 5.27. Sudden /o/ change in Inland North core and North Country……..296 Table 5.32. Incidence of /o/ vs. /oh/ in frequent (olC) words………………….314 Table 5.33. Incidence of /o/ for (olC) outside of Poughkeepsie…………………315 Table 6.1. Coding of -mentary words………………………………………………..340 Table 6.2. Frequency of stressed penult for each -mentary word………………...345 Table 6.5. Logistic regression of stressed penult…………………………………..349 Table 6.6. Cross-tabulation of lexical item and age for -mentary…………………350 Table 6.7. Logistic factor weights for age/lexeme interaction…………………...350 Table 6.9. Mean -mentary scores and factor weights for each community………356 Table 6.10. Logistic regression of reduced antepenult……………………………364 Appendix. Table of sampled speakers……………………………………………...437
xiii
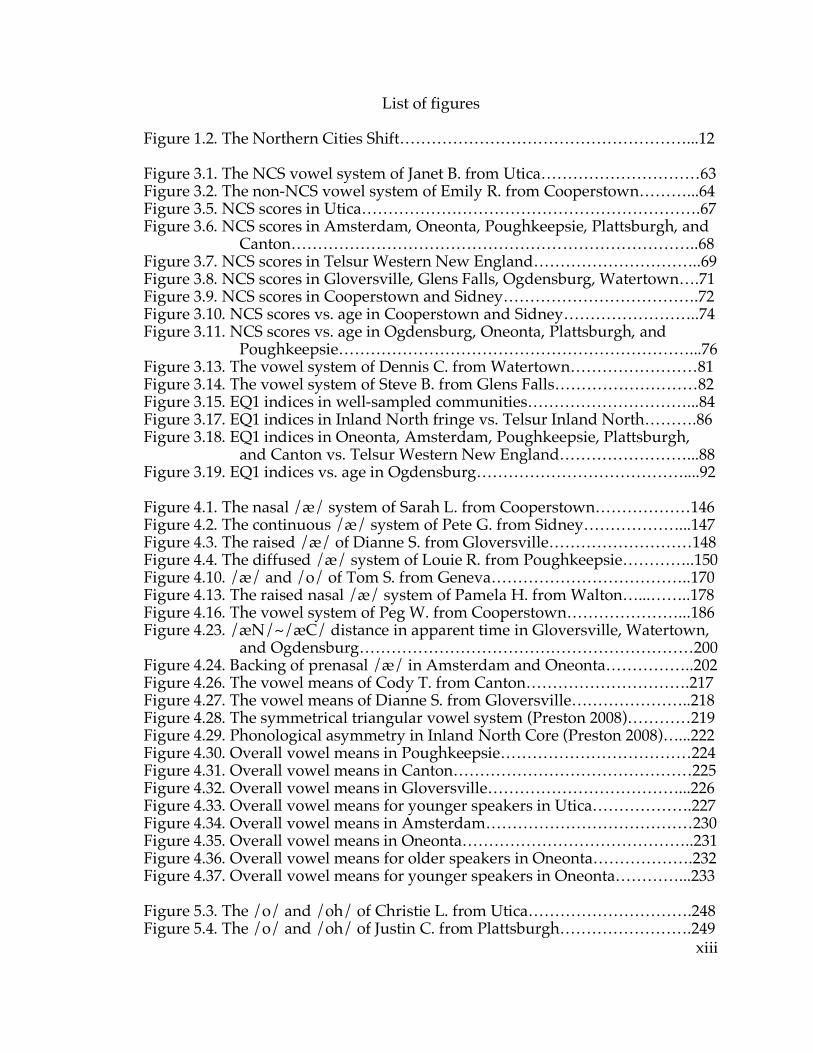
List of figures
Figure 1.2. The Northern Cities Shift………………………………………………...12 Figure 3.1. The NCS vowel system of Janet B. from Utica…………………………63 Figure 3.2. The non-NCS vowel system of Emily R. from Cooperstown………...64 Figure 3.5. NCS scores in Utica……………………………………………………….67 Figure 3.6. NCS scores in Amsterdam, Oneonta, Poughkeepsie, Plattsburgh, and
Canton…………………………………………………………………..68 Figure 3.7. NCS scores in Telsur Western New England…………………………..69 Figure 3.8. NCS scores in Gloversville, Glens Falls, Ogdensburg, Watertown….71 Figure 3.9. NCS scores in Cooperstown and Sidney……………………………….72 Figure 3.10. NCS scores vs. age in Cooperstown and Sidney……………………..74 Figure 3.11. NCS scores vs. age in Ogdensburg, Oneonta, Plattsburgh, and
Poughkeepsie…………………………………………………………...76 Figure 3.13. The vowel system of Dennis C. from Watertown……………………81 Figure 3.14. The vowel system of Steve B. from Glens Falls………………………82 Figure 3.15. EQ1 indices in well-sampled communities…………………………...84 Figure 3.17. EQ1 indices in Inland North fringe vs. Telsur Inland North……….86 Figure 3.18. EQ1 indices in Oneonta, Amsterdam, Poughkeepsie, Plattsburgh,
and Canton vs. Telsur Western New England……………………...88 Figure 3.19. EQ1 indices vs. age in Ogdensburg…………………………………....92 Figure 4.1. The nasal /æ/ system of Sarah L. from Cooperstown………………146 Figure 4.2. The continuous /æ/ system of Pete G. from Sidney………………...147 Figure 4.3. The raised /æ/ of Dianne S. from Gloversville………………………148 Figure 4.4. The diffused /æ/ system of Louie R. from Poughkeepsie…………..150 Figure 4.10. /æ/ and /o/ of Tom S. from Geneva………………………………..170 Figure 4.13. The raised nasal /æ/ system of Pamela H. from Walton…...……..178 Figure 4.16. The vowel system of Peg W. from Cooperstown…………………...186 Figure 4.23. /æN/~/æC/ distance in apparent time in Gloversville, Watertown,
and Ogdensburg………………………………………………………200 Figure 4.24. Backing of prenasal /æ/ in Amsterdam and Oneonta……………..202 Figure 4.26. The vowel means of Cody T. from Canton………………………….217 Figure 4.27. The vowel means of Dianne S. from Gloversville…………………..218 Figure 4.28. The symmetrical triangular vowel system (Preston 2008)…………219 Figure 4.29. Phonological asymmetry in Inland North Core (Preston 2008)…...222 Figure 4.30. Overall vowel means in Poughkeepsie………………………………224 Figure 4.31. Overall vowel means in Canton………………………………………225 Figure 4.32. Overall vowel means in Gloversville………………………………...226 Figure 4.33. Overall vowel means for younger speakers in Utica……………….227 Figure 4.34. Overall vowel means in Amsterdam…………………………………230 Figure 4.35. Overall vowel means in Oneonta……………………………………..231 Figure 4.36. Overall vowel means for older speakers in Oneonta……………….232 Figure 4.37. Overall vowel means for younger speakers in Oneonta…………...233 Figure 5.3. The /o/ and /oh/ of Christie L. from Utica………………………….248 Figure 5.4. The /o/ and /oh/ of Justin C. from Plattsburgh…………………….249
xiv
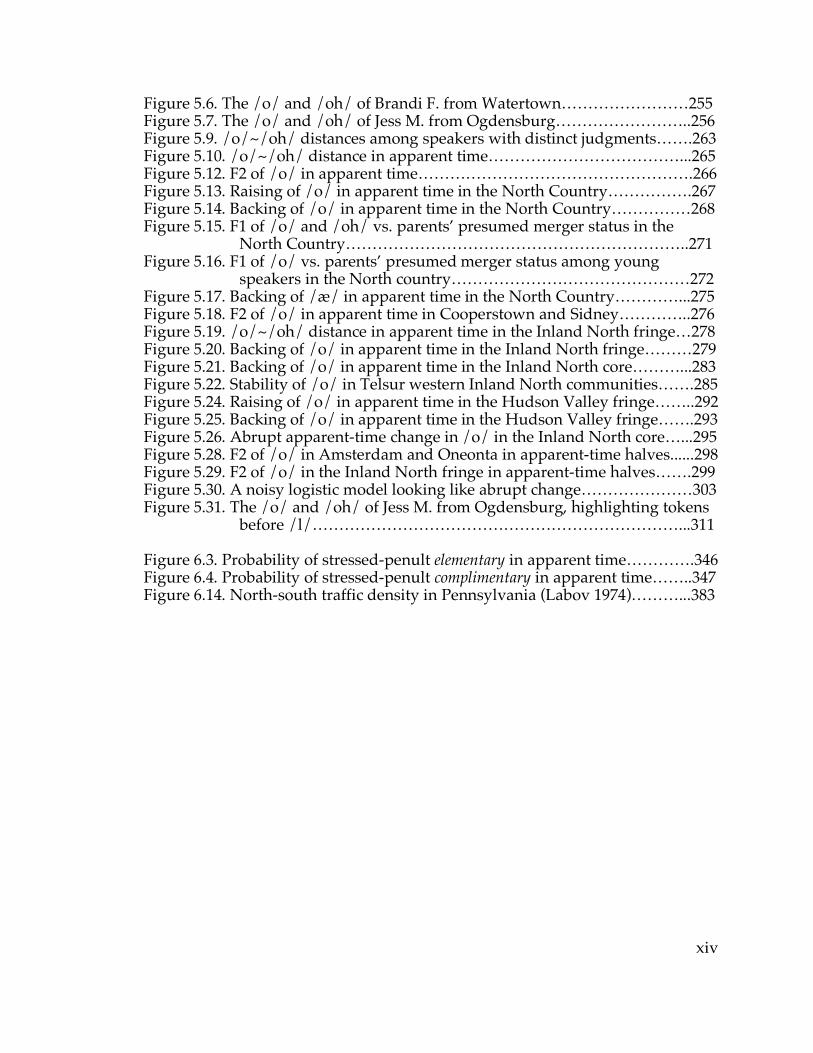
Figure 5.6. The /o/ and /oh/ of Brandi F. from Watertown……………………255 Figure 5.7. The /o/ and /oh/ of Jess M. from Ogdensburg……………………..256 Figure 5.9. /o/~/oh/ distances among speakers with distinct judgments…….263 Figure 5.10. /o/~/oh/ distance in apparent time………………………………...265 Figure 5.12. F2 of /o/ in apparent time…………………………………………….266 Figure 5.13. Raising of /o/ in apparent time in the North Country…………….267 Figure 5.14. Backing of /o/ in apparent time in the North Country……………268 Figure 5.15. F1 of /o/ and /oh/ vs. parents’ presumed merger status in the
North Country………………………………………………………..271 Figure 5.16. F1 of /o/ vs. parents’ presumed merger status among young
speakers in the North country………………………………………272 Figure 5.17. Backing of /æ/ in apparent time in the North Country…………...275 Figure 5.18. F2 of /o/ in apparent time in Cooperstown and Sidney…………..276 Figure 5.19. /o/~/oh/ distance in apparent time in the Inland North fringe…278 Figure 5.20. Backing of /o/ in apparent time in the Inland North fringe………279 Figure 5.21. Backing of /o/ in apparent time in the Inland North core………...283 Figure 5.22. Stability of /o/ in Telsur western Inland North communities…….285 Figure 5.24. Raising of /o/ in apparent time in the Hudson Valley fringe……..292 Figure 5.25. Backing of /o/ in apparent time in the Hudson Valley fringe…….293 Figure 5.26. Abrupt apparent-time change in /o/ in the Inland North core…...295 Figure 5.28. F2 of /o/ in Amsterdam and Oneonta in apparent-time halves......298 Figure 5.29. F2 of /o/ in the Inland North fringe in apparent-time halves…….299 Figure 5.30. A noisy logistic model looking like abrupt change…………………303 Figure 5.31. The /o/ and /oh/ of Jess M. from Ogdensburg, highlighting tokens
before /l/……………………………………………………………...311 Figure 6.3. Probability of stressed-penult elementary in apparent time………….346 Figure 6.4. Probability of stressed-penult complimentary in apparent time……..347 Figure 6.14. North-south traffic density in Pennsylvania (Labov 1974)………...383
xv
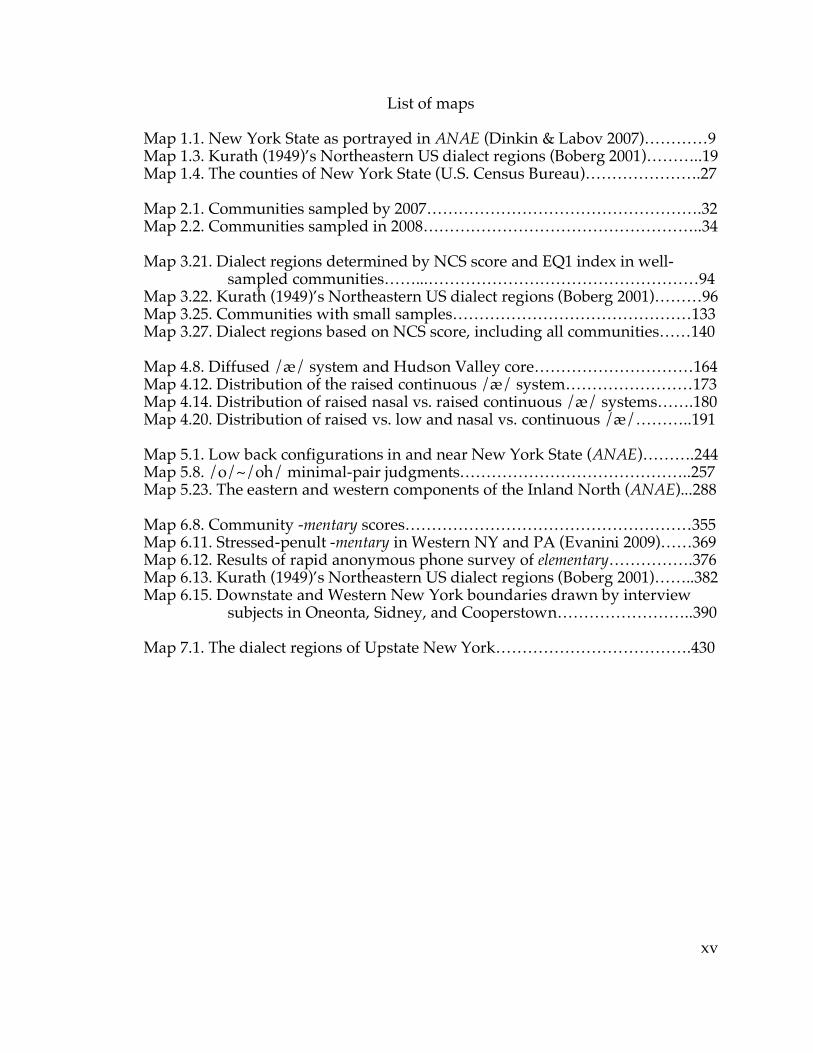
List of maps
Map 1.1. New York State as portrayed in ANAE (Dinkin & Labov 2007)…………9 Map 1.3. Kurath (1949)’s Northeastern US dialect regions (Boberg 2001)………..19 Map 1.4. The counties of New York State (U.S. Census Bureau)………………….27 Map 2.1. Communities sampled by 2007…………………………………………….32 Map 2.2. Communities sampled in 2008……………………………………………..34 Map 3.21. Dialect regions determined by NCS score and EQ1 index in well-
sampled communities……...……………………………………………94 Map 3.22. Kurath (1949)’s Northeastern US dialect regions (Boberg 2001)………96 Map 3.25. Communities with small samples………………………………………133 Map 3.27. Dialect regions based on NCS score, including all communities……140 Map 4.8. Diffused /æ/ system and Hudson Valley core…………………………164 Map 4.12. Distribution of the raised continuous /æ/ system……………………173 Map 4.14. Distribution of raised nasal vs. raised continuous /æ/ systems…….180 Map 4.20. Distribution of raised vs. low and nasal vs. continuous /æ/………..191 Map 5.1. Low back configurations in and near New York State (ANAE)……….244 Map 5.8. /o/~/oh/ minimal-pair judgments……………………………………..257 Map 5.23. The eastern and western components of the Inland North (ANAE)...288 Map 6.8. Community -mentary scores………………………………………………355 Map 6.11. Stressed-penult -mentary in Western NY and PA (Evanini 2009)……369 Map 6.12. Results of rapid anonymous phone survey of elementary…………….376 Map 6.13. Kurath (1949)’s Northeastern US dialect regions (Boberg 2001)……..382 Map 6.15. Downstate and Western New York boundaries drawn by interview
subjects in Oneonta, Sidney, and Cooperstown……………………..390 Map 7.1. The dialect regions of Upstate New York……………………………….430
1
Chapter 1
Introduction
1.1. Nature of dialect boundaries
A dialect region can be roughly defined, in general, as any more or less
geographically compact set of communities that share some linguistic feature or
set of features that is not generally shared by communities beyond the limits of
the region; a dialect boundary would then merely be the geographical boundary
between two or more such regions. The most comprehensive study undertaken
to date of the dialect regions of the United States and Canada is the Atlas of North
American English (henceforth ANAE: Labov, Ash, & Boberg 2006). It analyzes data
from speakers in the principal cities in every English-speaking region of North
America to divide the continent up into some dozen or so major dialect regions
based on the patterns of phonological and phonetic change that predominate in
each area.1
Since these regions are defined in terms of the major cities they contain,
the boundaries between them lie in most cases in less densely populated regions
between the large cities. Therefore ANAE does not address the question of to
what degree the smaller cities and towns outside the major urban areas share the
linguistic features on whose basis the region as a whole is defined. Moreover, it
provides little information as to where in the intercity territory the boundary lies.
1 The data for ANAE was collected through a program of telephone interviews called the Telsur project. The corpus of phonetic measurements of the vowel systems of 446 speakers generated through this project and used in ANAE will be referred to in this dissertation as “the Telsur corpus”.
2
Only in the fairly rare case that two cities that are very close to each other are
classified by ANAE as belonging to different dialect regions (e.g., the adjacent
cities of Detroit, Mich, and Windsor, Ont., in the extreme case) can the
boundaries between the regions be located with much confidence. Cities
belonging to two different dialect regions may be located hundreds of miles
away from each other, while data on the territory between them may be entirely
lacking; in that case the boundary between the two regions may lie anywhere in
the intervening area. Therefore the dialectological status of communities close to
the boundary remains in most cases unknown. There are at least four general
possibilities for the status of such communities:
• A sharp boundary line. Communities on each side of the boundary
line have all the linguistic features on whose basis the region is
defined, to the same extent that communities distant from the border
do. This is the situation which obtains at the border between the Inland
North and Canadian regions at Detroit and Windsor (ANAE), and
Johnson (2007) suggests that the same is or was the case at the border
between the dialect regions of Eastern Massachusetts and Rhode
Island.
• A gradual boundary; regional features fade out near the boundary.
Communities close to the boundary exhibit the characteristic features
of one region or the other to a weaker degree: either the sound changes
are less advanced, or only a minority of speakers show their effects, or
both; but each community can still be classified as belonging to one of
the two regions.
3
• An overlapping boundary area. There is an area between the cities
around which the two regions are defined in which the diagnostic
linguistic features of both regions are found—either there are speakers
who possess linguistic features characteristic of both regions, or some
speakers show the linguistic pattern of one region and some show the
other. Bigham (2006) suggests that the area in southern Illinois
between the South and the so-called St. Louis Corridor (a corridor
through central Illinois connecting Chicago and St. Louis, which
exhibits dialect features associated with the North) may be such a
region.
• A null boundary; regions do not meet. There is an area between the
two dialect regions that does not participate in the characteristic sound
changes of either region. This intermediate area may have a more
conservative system that is in principle structurally open to the sound
changes of one or both of the regions adjacent to it, or it may possess
sound changes of its own that are distinct from those of the major
dialect regions surrounding it (and thus constitute a third and perhaps
previously undetected dialect region). In a case such as this, the
existence of a boundary at all between the two original regions of
interest was merely an illusion caused by the lack of data in the
intervening area.
Obviously these configurations are not all necessarily mutually exclusive.
For example, a single dialect boundary may be simultaneously sharp and
gradual if, for example, there is a well-defined (sharp) line separating one set of

4
dialect features from another set, but the communities close to that sharp line on
one or the other side (or both) possess relatively diluted manifestations of those
features, while in communities farther from the boundary the distinctive regional
features are present more strongly. In the case of a null boundary, where two
dialect regions are separated by a third with distinctive features of its own, or a
conservative region with no distinctive features, the two regions’ boundaries
with the third region may be either sharp or gradual. If a region is defined in
terms of more than one distinctive linguistic feature, its boundaries may be sharp
with respect to some features and gradual with respect to others. Other
combinations are possible as well.
Identifying the status of communities in the intermediate zones between
the major cities sampled by ANAE, and thus the nature of the boundaries
between the regions defined by those cities, can shed light on the manner by
which linguistic innovations originate and propagate across regions. For
example, we may propose a model where dialect boundaries are based entirely
on original settlement patterns, and a sound change begins simultaneously in
precisely the region that was originally settled by a population whose linguistic
system was favorable to that change; communities settled from other sources by
populations less favorable to the change were simply not subject to it. In a
situation like that, we should expect a sharp boundary—however close a
community may be to the regional boundary should not prevent it from
undergoing the characteristic changes of the region to the same extent that all
other communities subject to the change do. If we expect dialect features to
diffuse from location to location, however, so that a linguistic change originates
5
in an urban center, and then spreads to nearby cities and regions along lines of
communication, in the pattern observed by Trudgill (1974), Callary (1975), and
others, we should expect gradual boundaries: the boundary appears where it
does merely because the innovation has only spread so far to date, and has only
recently reached the outlying areas. Under this model, a null boundary may be
merely a less advanced stage of a gradual boundary, in which the advancing
wave of the diffusing sound change has not yet reached very far into the territory
between cities. Overlapping dialect areas may exist if the characteristic sound
changes of two regions are not linguistically incompatible with each other and
therefore are able to spread into the same region without blocking each other’s
movement, or represent different salient social meanings to the population of the
intermediate region, in such a way that some speakers choose to affiliate
themselves with one adjacent dialect region and some with the other.
Alternatively, overlapping dialect regions may merely be a result of population
movement bringing speakers from both the dialect regions on either side into the
intermediate territory. In each case, the particular status of the boundaries
between dialect regions can offer some insight into how the difference between
the regions arose and how the boundaries came to be where they are.
The existence, status, and distribution of dialect boundaries, especially
sharp dialect boundaries, is also a valuable source of information on the
mechanisms of and constraints upon linguistic change. The reason for this is
fairly simple: ordinarily, communities located close to each other are
linguistically fairly similar; any linguistic difference between such communities
is therefore unexpected and in need of some explanation. There are three broad
6
categories of reasons why such communities may exhibit different linguistic
features:
• A linguistic change may be in the process of expanding from the
region in which it originated to new communities, and (at the time of
data collection) has reached one of the two communities of interest but
not the other. In this case, the location of the apparent dialect
boundary is merely a consequence of the time at which data was
collected—some years or decades later, the innovation will have
spread to the second community as well and the linguistic difference
between the two communities will be eliminated. So the difference that
exists synchronically is basically accidental.
• There may be some social or cultural factor that prevents one
community from participating in the linguistic changes of the other. A
basic possibility is that there is simply a low degree of communication
between the two communities (and the regions that contain them),
despite their proximity; for example, this is the interpretation Labov
(1974) gives to the North-Midland dialect boundary in northern
Pennsylvania. More interesting is the possibility that speakers in one
community may resist the linguistic changes of the other for
ideological reasons—e.g., out of a desire to avoid being culturally
identified with the other community or region. This scenario is
suggested by Labov (to appear: ch. 10) for the North-Midland
boundary west of Pennsylvania. In these cases, the location of the
dialect boundary is determined by social factors.
7
• There may be some pre-existing fact about the linguistic system of one
community with which the innovations of the neighboring community
are incompatible: i.e., the boundary is determined by internal linguistic
factors. This explanation may seem circular—it seems to be saying that
the reason adjacent communities differ linguistically is because they
already differed linguistically. However, the preexisting linguistic
differences may be founded upon one of the other two reasons,
incomplete diffusion or (past or present) social obstacles, and still
create a linguistic incompatibility for some new feature. For example, if
different (yet incompatible) innovations originate simultaneously in
two adjacent communities, then by the time one is advanced enough in
its home community to begin diffusing to the other community, the
other community’s incompatible change is advanced enough to block
it. It may also be the case that the communities were not, so to speak,
originally adjacent—i.e., the two communities were originally settled
by founding populations with different dialects, and the pre-existing
structural incompatibilities prevented the diffusion the features of one
community into the other.
It is in the third case, a dialect boundary determined by linguistic
constraints, that the nature of the dialect boundary can inform us about the
structural systems underlying linguistic change. Since the linguistic constraint
preventing the innovative feature on one side of the boundary from spreading to
the other side of the boundary is feature-specific, we would expect other
linguistic innovations to have succeeded in spreading across the boundary;
8
otherwise this scenario is indistinguishable from dialect boundaries of the
socially-motivated or accidental types. In this case, it should be possible to
compare the innovations that have succeeded in diffusing across the boundary
with those that have been blocked in order to determine what the nature of the
constraints blocking the latter are—what aspects of the existing dialect of one
community are incompatible with the innovations from the other community. In
this way, locating and studying dialect boundaries is useful not only for
illuminating the geographic and historical factors that cause the boundaries to be
located in particular places, but also the nature of the underlying structures that
are involved in linguistic changes and dictate their direction.
1.2. New York State
The state of New York provides an ample laboratory for the study of
dialect boundaries, in that at least five of the major dialect regions defined by
ANAE intersect in or near New York State; these are displayed in Map 1.1. The
western and central parts of the state are part of the Inland North dialect region,
the home of the Northern Cities Shift. New York City, in the southeastern corner
of the state, has a dialect region more or less to itself. The city of Albany is
assigned by ANAE to the Western New England dialect region—specifically,
Southwestern New England—although it is noted by Labov (2007) that Albany
displays some features borrowed from New York City that other Western New
England communities lack. Moreover, there are several other dialect regions
adjacent to New York State whose boundaries with New York City, the Inland
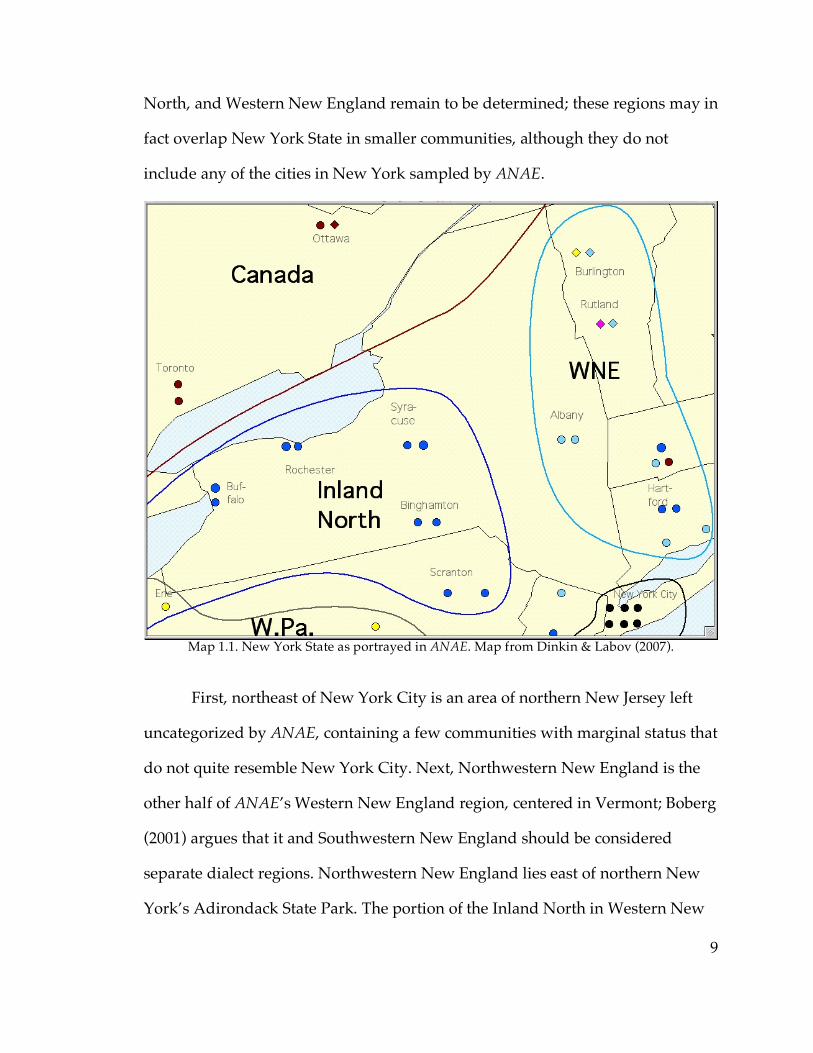
9
North, and Western New England remain to be determined; these regions may in
fact overlap New York State in smaller communities, although they do not
include any of the cities in New York sampled by ANAE.
Map 1.1. New York State as portrayed in ANAE. Map from Dinkin & Labov (2007).
First, northeast of New York City is an area of northern New Jersey left
uncategorized by ANAE, containing a few communities with marginal status that
do not quite resemble New York City. Next, Northwestern New England is the
other half of ANAE’s Western New England region, centered in Vermont; Boberg
(2001) argues that it and Southwestern New England should be considered
separate dialect regions. Northwestern New England lies east of northern New
York’s Adirondack State Park. The portion of the Inland North in Western New

10
York borders the Western Pennsylvania dialect region on its south side. And
finally, the Canadian dialect region is adjacent to New York State both to the
north and to the west—indeed, there are communities in northern New York that
are closer to Canadian cities such as Ottawa and Montréal than they are to any
American city sampled by ANAE. So a detailed dialectological study of New
York State affords numerous opportunities for locating and examining the status
of phonological change at a variety of types of dialect boundaries.
This dissertation will focus on dialect boundaries in the eastern part2 of
Upstate New York3, in the large area between New York City, the Inland North,
Canada, and Northwestern and Southwestern New England—a region at least
120 miles wide from east to west and 250 miles from north to south in which no
data was collected by ANAE, and within which lie the interfaces between four or
five distinct dialect regions. These dialect regions, although close together, are
distinguished from one another by a variety of linguistic features. The Inland
North and Canada are both marked by distinctive chain shifts operating in
opposite directions to each other, with the Canadian Shift backing both /e/ and
/o/4 while the Northern Cities Shift in the Inland North fronts both (along with
other changes). New York City has one of the most well-known and stigmatized
American dialects, and possesses unusual features such as a phonemic split of
/æ/, a highly raised and tensed /oh/, and variable non-rhoticity. Western New
England is a relatively linguistically unmarked region, having few distinctive
2 The dialect boundary at the western edge of New York State, between the Inland North and Western Pennsylvania in the vicinity of Erie, Penna., is also of interest; fortunately, that boundary is discussed in depth by Evanini (2009). 3 I use the term “Upstate” in its relatively broad sense to encompass any portion of the state north or northwest of the general New York City metropolitan area. 4 I use the notation of ANAE for vowel phonemes.
11
sound changes of its own; as mentioned above, however, it is divided into two
parts, as described by Boberg (2001) and touched upon in ANAE as well.
Northwestern New England is based in Vermont and distinguished by the
completed low-back merger of /oh/ and /o/, which it shares with Canada.
Southwestern New England is based in Western Massachusetts and Connecticut
and is argued by Boberg to be phonologically the same as the Inland North but
lacking the full raising of /æ/ above /e/ that initiates the Northern Cities Shift.
The aims of this dissertation are twofold. First, with the linguistic data I
have collected from the large area unsampled by ANAE, I will be able to provide
a more detailed dialectological picture of New York State. And second, by
learning about the relationships and boundaries between those dialect regions, I
will be able to draw some general inferences about the mechanisms and
constraints on the diffusion of linguistic change, and phonological change in
particular. My analysis in this dissertation will focus upon a small number of
systematic phonological features which I will explore in depth: the Northern
Cities Shift (henceforth NCS), the phonological treatment of /æ/, and the low
back vowels /o/ and /oh/. In addition to these systematic features, I will also
examine what I take to be an analogical change in the pronunciation of words
like elementary, documentary, etc.
12
1.3. The features of interest
1.3.1. The Northern Cities Shift
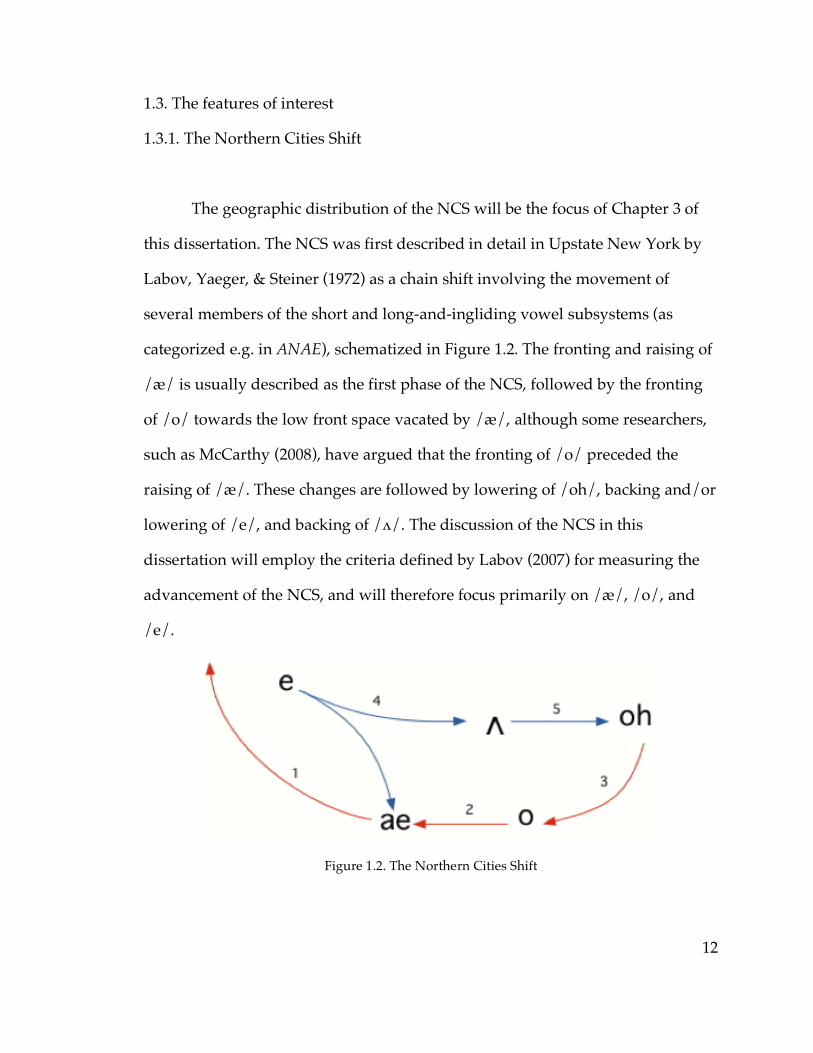
The geographic distribution of the NCS will be the focus of Chapter 3 of
this dissertation. The NCS was first described in detail in Upstate New York by
Labov, Yaeger, & Steiner (1972) as a chain shift involving the movement of
several members of the short and long-and-ingliding vowel subsystems (as
categorized e.g. in ANAE), schematized in Figure 1.2. The fronting and raising of
/æ/ is usually described as the first phase of the NCS, followed by the fronting
of /o/ towards the low front space vacated by /æ/, although some researchers,
such as McCarthy (2008), have argued that the fronting of /o/ preceded the
raising of /æ/. These changes are followed by lowering of /oh/, backing and/or
lowering of /e/, and backing of /ʌ/. The discussion of the NCS in this
dissertation will employ the criteria defined by Labov (2007) for measuring the
advancement of the NCS, and will therefore focus primarily on /æ/, /o/, and
/e/.
Figure 1.2. The Northern Cities Shift
13
ANAE confirms that the NCS is dominant in its sampled cities in western
and central New York, as well as in northern Ohio, Michigan, northern Illinois,
and eastern Wisconsin—two geographically distinct components that share the
designation “Inland North” but are separated by the NCS-free city of Erie,
Pennsylvania. Boberg (2001) argues that Southwestern New England also
exhibits features of the NCS, albeit to a reduced degree compared to the Inland
North proper. One of the Telsur corpus’s four speakers in Northwestern New
England shows an NCS-like vowel system as well. Therefore one of the chief
aims of Chapter 3 will be to locate the boundary between the Inland North and
Western New England, in order to determine the relationship between the two
regions and the eastern extent of the full NCS.
Labov (2007) and Preston (2008) argue that the NCS will show different
synchronic and apparent-time profiles in communities in which it originated
than in those to which the it spread through dialect diffusion. Labov suggests
that in communities to which the NCS has diffused, there will not be a clear
apparent-time trend toward more advanced NCS among younger speakers;
meanwhile, Preston proposes that communities that have acquired the NCS
through diffusion will have a more symmetric distribution of vowel phonemes in
phonetic space than communities to which it has diffused. These arguments will
be relevant in Chapters 3 and 4 when hypotheses about the origin and spread of
the NCS in New York State are discussed.
14
1.3.2. Short-a and short-o systems
ANAE describes the status of the caught-cot merger and the status of /æ/
as the two factors upon which “the dynamics of a North American vowel
system” depend. Both of /æ/ and the relationship between /o/ and /oh/ are
intimately tied up with the NCS, inasmuch as raising of /æ/ and fronting of /o/
away from /oh/ are the two changes that have been claimed to be the earliest
stage of the NCS. For these reasons, examining the status of /æ/ and of the
caught-cot merger in eastern New York State is essential for determining the
dialectological status of the communities in the intermediate zone between the
five established dialect regions, and in determining the phonological structure of
the NCS in particular.
The status of /æ/ will be the starting point for the discussion in Chapter
4. The regions surrounding the area of interest in eastern New York show great
variety in /æ/ systems in the Telsur data. While the Inland North, of course, is
dominated by the general raising of /æ/ that is part of the NCS, in Western New
England the majority of Telsur speakers show the sharp nasal allophonic pattern,
in which /æ/ is raised, fronted, and tensed before nasal consonants but not
substantially raised in other environments. In the nearby Canadian cities in the
Telsur sample—Montréal, Ottawa, and Arnprior—there is substantially less
raising of /æ/ even before nasals, and for a couple of speakers it is /g/, not
nasals, that triggers the greatest amount of raising in a preceding /æ/. New York
City, of course, is dominated by a phonemic split in /æ/, with the raised and
tensed phoneme /æh/ occurring usually before voiced stops, voiceless fricatives,

15
and non-velar nasals; and Labov (2007) notes that a monophonemic pattern with
superficial similarities to the New York City biphonemic pattern is found in
Albany.
Studying the phonology of /æ/ is of great importance for determining the
origin of the NCS in particular. Labov, Yaeger, & Steiner (1972) introduce the
suggestion that the raising of /æ/ in the NCS represents not a mere phonetic
change in the surface manifestation of the /æ/ phoneme but a structural change
on a deeper level, from a short vowel phoneme /æ/ to an underlyingly long
/æh/. ANAE carries this idea forward, and hypothesizes that this structural
phonological change in /æ/ was brought about as the result of dialect contact
among speakers with a variety of different /æ/ systems in western and central
New York in the early 19th century, when migration into the region boomed as a
result of the construction of the Erie Canal. The plausibility of this hypothesis can
be tested by looking in more detail at the phonology of /æ/ in New York State,
especially in the area where the Inland North’s general /æ/-raising comes into
contact with the /æ/ systems of neighboring regions.
The low back or caught-cot merger was described at least as early as by
Kurath (1939) in Eastern New England and Kurath & McDavid (1961) in Western
Pennsylvania, and alluded to5 by Avis (1956) in Ontario. According to ANAE, the
earliest nationwide study of the caught-cot merger was a telephone survey
conducted by William Labov in 1966, confirming the presence of the merger in 5 Avis writes, in a description of the vowel phonology of his own Ontarian speech, “/ɑ/ bot (also bought in my speech), /ɒ/ bog, /ɔ/ law (these last three vowels are probably not phonemically distinctive in my dialect)”. In other words, Avis alludes to the caught-cot merger as a probable feature of his own speech as a native of Ontario, but does not refer to it as a general feature of Ontario speech; his article is not concerned with the inventory of phonemic contrasts in Ontario in general, but rather with phonemic incidence in individual words.
16
Eastern New England and Western Pennsylvania as well as virtually all of the
western United States. The earliest discussion of the merger in Northwestern
New England appears to be that of Boberg (2001), although it was already quite
advanced by that time; Boberg also notes the southward progress of the merger
into western Massachusetts. Important and detailed studies of the spread of the
merger to new communities include Herold (1990) and Johnson (2007); they both
found merger taking place relatively suddenly (in apparent time) in communities
undergoing intensive dialect contact.
The opposite of the caught-cot merger is the phonemic distinction between
/o/ and /oh/, typically maintained in North America (by communities that
maintain it) at least by means of having /o/ unrounded and /oh/ rounded.
Labov (to appear: ch.7) observes that the unrounding of /o/ had been noted in
New York State by 1832. ANAE describes certain regions as specifically
“resistant” to the merger, in that the phonetic difference between /o/ and /oh/
(the “margin of security”, in the sense of Martinet 1952) is greater than merely a
difference in rounding: in the South, /oh/ has developed a back upglide; in the
Inland North, /o/ is substantially fronted away from /oh/ as part of the NCS;
and in a collection of Northeastern cities including New York City (and Albany,
as noted by Labov 2007), /oh/ is raised and further backed. In other words, the
region of eastern New York State selected for analysis in this dissertation is
bordered by two regions where the merger is complete or nearly so (Canada and
Northwestern New England), and at least two regions that are described as being
actively resistant to the merger as a result of other sound changes (the Inland
North, New York City, and Albany). This makes eastern New York State an ideal
17
location for studying the effect of dialect boundaries on the caught-cot merger and
the ontological status of the “resistance” referred to in ANAE. This will be the
focus of Chapter 5.
1.3.3. Elementary
An unexpected finding in the early stages of the research for this
dissertation had to do with the pronunciation of words such as elementary,
sedimentary, and rudimentary—i.e., words with the suffix -ary following -ment,
which in standard American English carry primary stress on -ment. These were
added to the initial word list at the suggestion of William Labov (p.c.). Words of
this type were found very frequently in early data collection to be pronounced
with secondary stress on the penultimate syllable, leading to a stress clash
between the primary-stressed antepenultimate and the secondary-stressed
penultimate, thus: eleméntàry. This feature is discussed in Chapter 6, in order to
contrast the dialectological behavior of what appears to be a morpheme-specific
analogical change with the behavior of the systematic structural features of the
phonological system discussed in the earlier chapters. To the best of my
knowledge, no prior research has been done on this feature, either inside or
outside Upstate New York, although Evanini (2009) collected data on it in
northwestern Pennsylvania and the adjacent portion of Western New York
simultaneously with my research in the eastern half of New York. Since carrying
out the research discussed in Chapter 6, there have been brought to my attention
anecdotal reports of the eleméntàry pronunciation in such locations as Cincinnati
18
and New Orleans6, perhaps indicating that a broader national study of this
feature will be in order some time in the future.
1.4. Previous work other than Telsur
The Telsur project collected no data from the region of interest in this
dissertation—the eastern half of Upstate New York—apart from two speakers in
Albany. The Linguistic Atlas of New England (LANE) and Linguistic Atlas of the
Middle and South Atlantic States (LAMSAS) projects (Kurath 1939, 1949; Kurath
& McDavid 1961), on the other hand, did collect data from speakers in a large
variety of communities throughout New York and adjacent states, interviewed in
the 1930s and 1940s. On the basis of this data, Kurath (1949) drew a map of the
dialect regions of the eastern United States, including New York State; Boberg
(2001)’s reproduction of Kurath’s northern dialect regions is shown as Map 1.3.
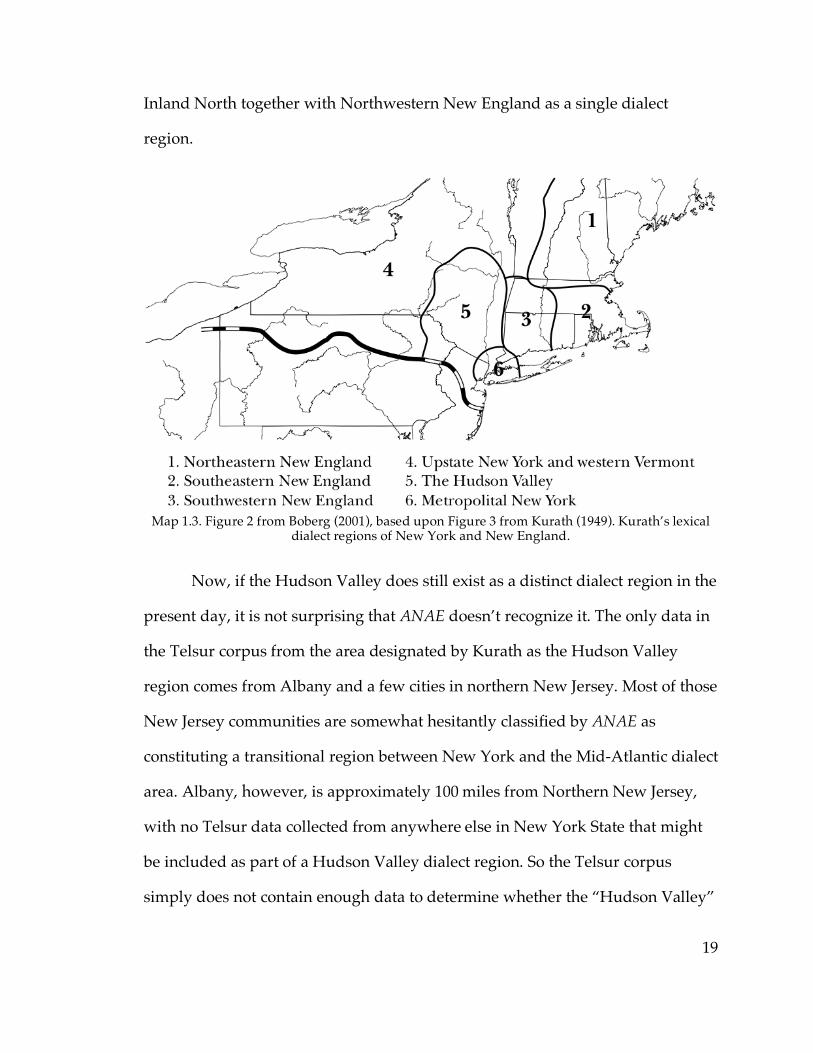
The LAMSAS regions differ substantially from the dialect regions defined
by ANAE in New York State. Although New York City still has a dialect region
more or less to itself, between New York City and Southwestern New England
on the one hand and the Inland North on the other hand lies a large region
encompassing most of the southeastern third of New York State that is identified
as the “Hudson Valley” 7 region, which is completely absent from ANAE’s
analysis. At the same time, Kurath groups what would become known as the
6 For the time being I regard it as merely a coincidence that these are the same cities in which Labov (2007) finds the diffused version of the New York City /æ/ system beyond New York State and New Jersey. 7 Despite the name, Kurath’s Hudson Valley region is not restricted to the area around the Hudson River; it also includes most of the lower Mohawk and upper Delaware River areas, as well as the Catskill Mountains in between.
19
Inland North together with Northwestern New England as a single dialect
region.
Map 1.3. Figure 2 from Boberg (2001), based upon Figure 3 from Kurath (1949). Kurath’s lexical
dialect regions of New York and New England.
Now, if the Hudson Valley does still exist as a distinct dialect region in the
present day, it is not surprising that ANAE doesn’t recognize it. The only data in
the Telsur corpus from the area designated by Kurath as the Hudson Valley
region comes from Albany and a few cities in northern New Jersey. Most of those
New Jersey communities are somewhat hesitantly classified by ANAE as
constituting a transitional region between New York and the Mid-Atlantic dialect
area. Albany, however, is approximately 100 miles from Northern New Jersey,
with no Telsur data collected from anywhere else in New York State that might
be included as part of a Hudson Valley dialect region. So the Telsur corpus
simply does not contain enough data to determine whether the “Hudson Valley”
20
dialect region still exists today, or if so whether its boundary with the Inland
North is in the same place as it was when the LAMSAS data was collected. Map
1.3 suggests, then, that this dissertation may find a “null boundary” between the
Inland North and Southwestern New England—i.e., the Inland North and
Southwestern New England do not in fact border each other, but are separated
by a third region, the Hudson Valley, that escaped the notice of ANAE.
The boundaries between the Hudson Valley and Inland North in Map 1.3,
however, were drawn by Kurath (1949) based upon lexical features. The same
map of regions and boundaries is reproduced by Kurath & McDavid (1961) in
their discussion of phonological features in the LAMSAS data, but there seems to
be relatively little justification for defining a Hudson Valley dialect region based
upon phonological features alone. Eyeballing dialect maps based on phonetic
transcriptions by fieldworkers is of course not an extremely reliable method of
analysis (especially dialect maps that do not have boundaries drawn on them);
however, from Kurath & McDavid’s phonological maps it does not appear that
there is any systematic feature capable of reliably distinguishing the Hudson
Valley from Southwestern New England. Moreover, in their discussion of
“cultivated speech” by region, they write, “The cultivated speech of Upstate New
York and adjoining parts of Western New England is remarkably uniform in
phonemic structure, in the phonic characteristics of the vowel phonemes, and
even in the incidence of the phonemes.” So it may be that the Hudson Valley
never existed as a distinct phonological dialect region, and ANAE, whose regions
are based on phonetic and phonological features, was correct in grouping Albany
with Western New England. This dissertation, in using instrumental phonetic

21
measurements to examine speakers from communities in the vicinity of where
Kurath draws the Hudson Valley–Inland North boundary, will be able to test for
the authenticity of the “Hudson Valley” as a dialect region in phonetic and
phonological terms.
The LAMSAS and LANE data were collected before some of the key
phonological changes in these regions had been noticed, which means that they
are of limited relevance for answering the principal questions in this dissertation.
For example, while in the Telsur data the caught-cot merger is nearly complete in
Northwestern New England (Boberg 2001), the LANE data does not find the
merger in that region.8 Similarly, although the raising of /æ/ is both widely
regarded as the earliest stage in the NCS and arguably the most auditorily
noticeable, no clear sign of it or any other NCS change is visible in the LAMSAS
data. Kurath & McDavid (1961) do mark a few speakers in Upstate New York as
having an allophone of /æ/ in sack and ashes with a raised offglide ([æɛ] or [æɨ]),
which is at least conceivable as an ancestor of the NCS raised realization.
However, the majority of LAMSAS speakers in what would today be recognized
as the Inland North do not exhibit that allophone; moreover, it appears more
frequently in New Hampshire, where the NCS does not exist today, than in
Upstate New York. Likewise the LAMSAS data shows little apparent difference
between central and western New York’s /o/ and the /o/ of other regions
where the caught-cot merger is not found, except for a possibly somewhat lower
8 Moulton (1968)’s point that the LANE fieldworkers did not collect explicit minimal-pair data in any location on /o/ and /oh/ (or any other potential merger in progress) and were “hopelessly and humanly incompetent at transcribing phonetically the low and low back vowels” is well taken here, although Kurath (1939) does rate Bernard Bloch, the LANE fieldworker who collected data in Northwestern New England, as a relatively accurate transcriber.
22
frequency of the somewhat backer allophone [ɑ>] relative to the fronter
allophones.
There is some early evidence for movement toward the NCS in Upstate
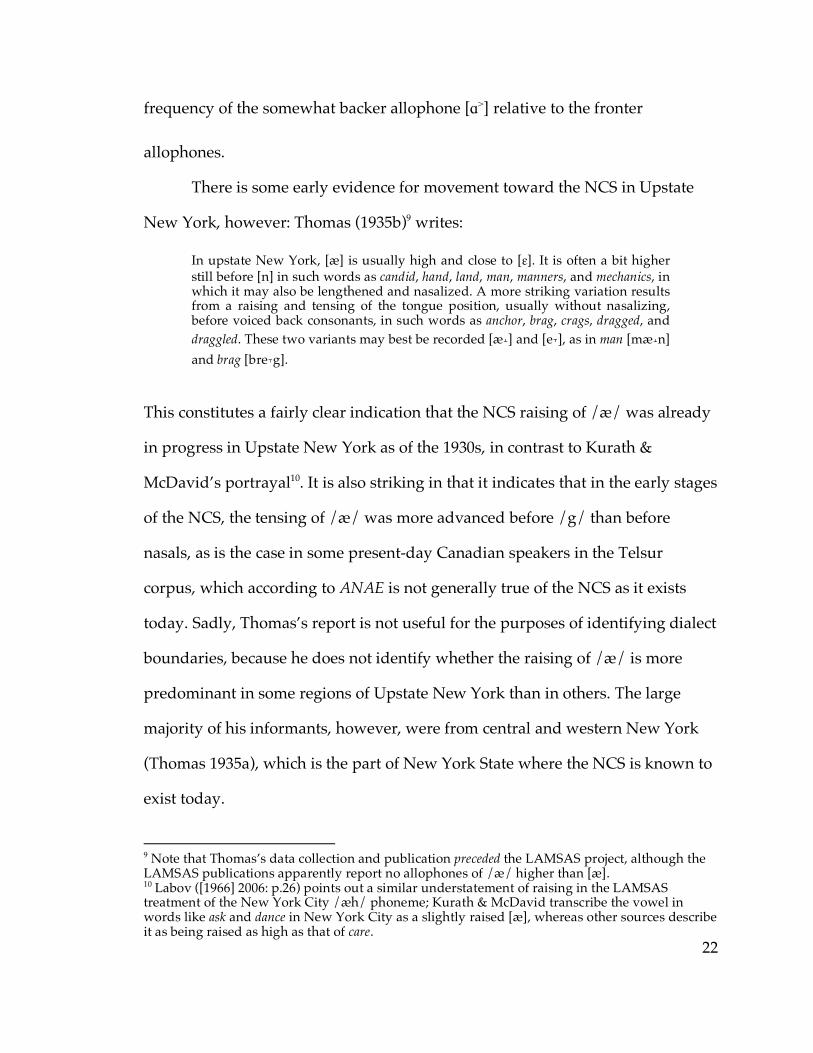
New York, however: Thomas (1935b)9 writes:
In upstate New York, [æ] is usually high and close to [ɛ]. It is often a bit higher still before [n] in such words as candid, hand, land, man, manners, and mechanics, in which it may also be lengthened and nasalized. A more striking variation results from a raising and tensing of the tongue position, usually without nasalizing, before voiced back consonants, in such words as anchor, brag, crags, dragged, and draggled. These two variants may best be recorded [æ˔] and [e˕], as in man [mæ˔n] and brag [bre˕g].
This constitutes a fairly clear indication that the NCS raising of /æ/ was already
in progress in Upstate New York as of the 1930s, in contrast to Kurath &
McDavid’s portrayal10. It is also striking in that it indicates that in the early stages
of the NCS, the tensing of /æ/ was more advanced before /g/ than before
nasals, as is the case in some present-day Canadian speakers in the Telsur
corpus, which according to ANAE is not generally true of the NCS as it exists
today. Sadly, Thomas’s report is not useful for the purposes of identifying dialect
boundaries, because he does not identify whether the raising of /æ/ is more
predominant in some regions of Upstate New York than in others. The large
majority of his informants, however, were from central and western New York
(Thomas 1935a), which is the part of New York State where the NCS is known to
exist today.
9 Note that Thomas’s data collection and publication preceded the LAMSAS project, although the LAMSAS publications apparently report no allophones of /æ/ higher than [æ]. 10 Labov ([1966] 2006: p.26) points out a similar understatement of raising in the LAMSAS treatment of the New York City /æh/ phoneme; Kurath & McDavid transcribe the vowel in words like ask and dance in New York City as a slightly raised [æ], whereas other sources describe it as being raised as high as that of care.

23
The only relatively recent dialectological study of which I am aware in the
area of interest in this dissertation is that of Novak (2004) in Ballston Spa, a
village in Saratoga County11, some 30 miles north of Albany. Novak reports the
NCS to be present in Ballston Spa, but decreasing in apparent time. This is
substantially further east than the eastern boundary of the NCS in ANAE.
However, Novak’s phonetic measurements are not normalized in any way,
which makes it hard to make comparisons either between the speakers in
Novak’s sample or between Novak’s sample and ANAE. So it is difficult to say
how advanced the NCS in Ballston Spa is in comparison to the Inland North
ANAE communities.
A small amount of work I’m already aware of has addressed the
relationships between the dialect regions surrounding the eastern half of New
York State, which is the main focus of this dissertation. Boberg (2001), as noted
above, argues that Southwestern New England and the Inland North are
essentially the same region, with the phonological system of Southwestern New
England being, he argues, merely a less advanced form of the NCS. Kurath
(1949), on the other hand, has the Hudson Valley intervening between the Inland
North and Southwestern New England, but regards Northwestern New England
as part of the same dialect region as the Inland North. Boberg’s categorization is
based on phonology and Kurath’s on lexical items—and Boberg argues that
Kurath’s data does not strongly justify drawing a boundary between
Northwestern and Southwestern New England at all, while the present-day
distribution of the caught-cot merger may. However, it is in Northwestern New
11 Map 1.4 below shows the counties of New York State.

24
England—specifically Rutland, Vt.—that the most striking example of an NCS
speaker in the Western New England Telsur data appears, slightly supporting
Kurath’s implication of a closer relationship between Northwestern New
England and the Inland North.
Although Albany is classified as part of Southwestern New England in
ANAE, presumably due to lack of data from any other nearby communities to
compare it with, Labov (2007) assigns Albany a more special status. Albany is
seemingly subject to a heavy degree of dialect diffusion from New York City—as
mentioned above, in the Telsur data Albany exhibits both a simplified though
recognizable variant of the New York City /æ/ pattern and the raised /oh/ that
is characteristic of New York and other coastal Northeastern cities. This
distinguishes Albany from the other communities assigned to Southwestern New
England in ANAE, some of which have raising of /oh/ but none of which show
the distinctive New York City tensing of /æ/ before voiced stops and voiceless
fricatives.
The dialectological relationship between the Inland North and Canada has
been studied more or less extensively, although not to my knowledge in the
specific area that will be relevant in this dissertation (i.e., the border between far
northern New York and eastern Ontario or western Quebec). Boberg (2000) finds
the phonological boundary to be extremely sharp between the Inland North city
of Detroit, Mich., and the Canadian city of Windsor in southwestern Ontario,
notwithstanding that the two cities are directly adjacent to each other on
opposite sides of the border and are intensely connected by communication and
commerce. Slightly closer to the current region of interest, Chambers (1994) finds
25
some very sharp lexical boundaries between western New York and the “Golden
Horseshoe” region of Ontario that borders New York across the Niagara River.
On the other hand, both Chambers (1998) and Boberg (2000) find evidence that
some lexical features have begun to diffuse across the boundary from the Inland
North to Canada—so the international border may constitute a fairly sharp
linguistic boundary, but not an impenetrable one.
1.5. General issues
The dialect features I have chosen to focus on in this dissertation include a
variety of different types of phonological change: the NCS is a chain shift; the
New York City /æ/ system is a phonemic split; the “nasal” /æ/ system is an
allophonic alternation; the caught-cot merger is, of course, a merger; and the
stress shift on words of the elementary type is a change in the phonological
content of a particular morpheme or set of lexical items. Thus comparing the
geographical distributions of each of these features can give us some insight into
to what extent different types of phonological change are subject to different
geographical constraints.
One of the chief dialectological concepts I will focus on (though by no
means the only one) is that of diffusion as defined in detail by Labov (2007): the
propagation of linguistic change from one community to another through contact
between adults, in contrast to the incrementation of change within a community
through transmission of the change to children, or the intermediate situation of
change propagated by contact between children whose parents have different
26
native dialects as discussed by Johnson (2007). Since diffusion takes place among
adults, whose grammars are less malleable than children’s, Labov argues that
there are limits to how faithfully a complex linguistic change can be reproduced
in a community to which it diffuses. The nature of these limits and how they
affect the features of interest will be explored over the course of this dissertation.
Chapter 7 will draw upon the discussion of the earlier chapters to compared the
effects of diffusion on the different features under examination, in an attempt to
produce a unified account of the theory of diffusion as it affects phonological
changes of different types. Patterns of diffusion will also be used to motivate a
more formal definition of the concept of dialect boundaries, to replace the loose
definition that introduced this chapter.
My approach to phonological change is shaped by the model discussed by
Bermúdez-Otero (2007). This model, which is explained in detail in Chapter 4,
assumes a modular feed-forward architecture for phonology—in other words,
the underlying phonological features and attributes that exist in underlying
representations of lexical items have discrete values and are lacking in fine-
grained phonetic detail; and there are multiple “stages” in the synchronic
derivation of phonetic implementation from underlying representations, such
that the rules applying at each stage have access only to the output of the
preceding stage. Bermúdez-Otero’s model describes a “life cycle” through which
phonological rules can progress, developing from phonetic implementation rules
to allophonic alternations to phonemic splits. Since all of these life-cycle phases
are present in the various patterns of /æ/ in New York State, it will be possible
to use this dissertation’s data to test the usefulness of the life-cycle model for
27
changes in progress. The relevance of this model for explaining chain shifts and
mergers and for explaining patterns of diffusion will be explored as well.
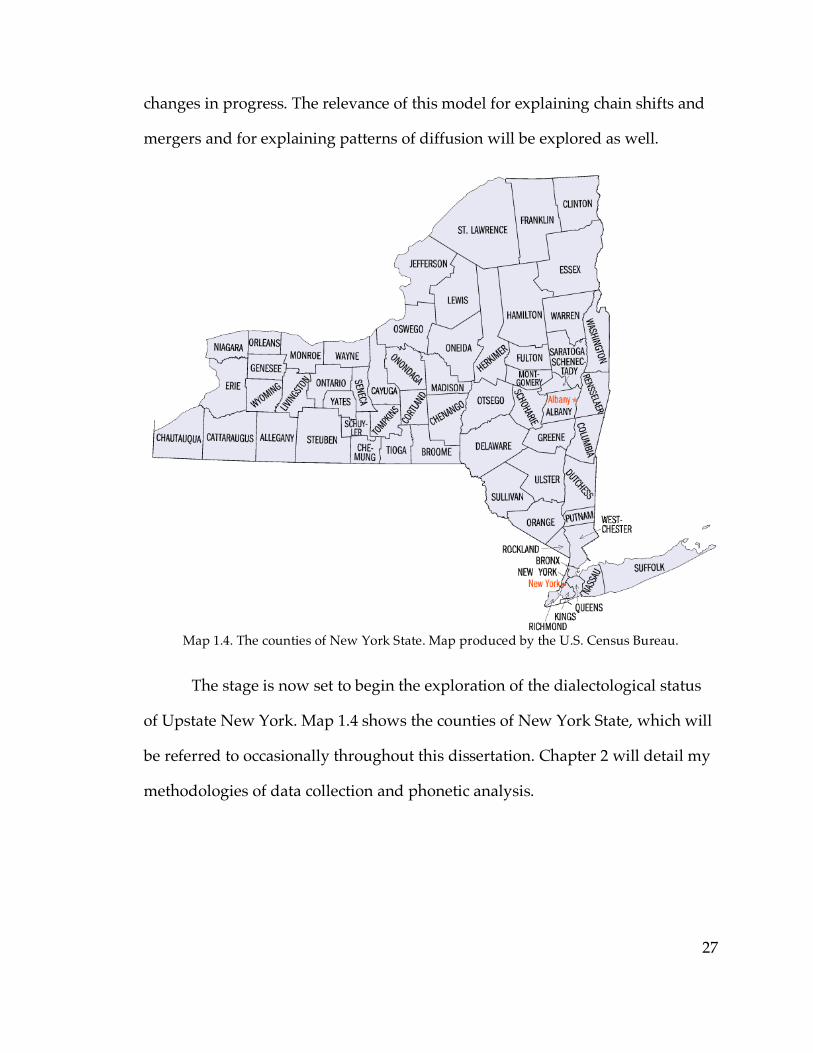
Map 1.4. The counties of New York State. Map produced by the U.S. Census Bureau.
The stage is now set to begin the exploration of the dialectological status
of Upstate New York. Map 1.4 shows the counties of New York State, which will
be referred to occasionally throughout this dissertation. Chapter 2 will detail my
methodologies of data collection and phonetic analysis.
28
Chapter 2
Methodology
2.1. Overview of methodological goals
The goals of the selection of communities to be sampled in this
dissertation were twofold: first, to cover a wide area of eastern New York State;
and second, to obtain data from communities very close to the boundaries
between dialect regions. Covering a wide area makes it possible to broadly
divide up eastern New York into dialect regions, in much the way ANAE divides
North America as a whole into dialect regions, and to get a general sense of the
factors influencing the dialect geography of Upstate New York. Identifying and
sampling communities on opposite sides of dialect boundaries will allow
inferences to be drawn about the nature of the boundaries and thus the overall
relationships between the dialects and regions as a whole.
It would be beyond the scope of this project to carry out an in-depth
sociolinguistic study of every targeted community. On the other hand, ANAE’s
approach of sampling only two speakers from most communities, while
sufficient for the goal of drawing a relatively broad dialect map, would be
unsuitable for the current project. A more detailed picture of the dialectological
status of each community is necessary in order to compare communities in
different parts of the same dialect region (say, those nearer to and farther from
the dialect boundary) than would be necessary to merely define the overall
29
linguistic features of the region as a whole. This means a somewhat larger
sample is necessary in each community.
The telephone-interview method used in ANAE is very efficient for
sampling a large set of communities, avoiding the inconvenience and time-
consuming travel that is necessary for carrying out field research in each targeted
community—especially when it is not yet clear what communities will be of
particular interest. However, when a relatively large number of speakers are to
be interviewed in a single community, in-person fieldwork becomes more
efficient: the Short Sociolinguistic Encounter methodology (Ash 2002), as
described below, takes less time to carry out than a telephone interview and is
sufficient for collecting the same number of vowel tokens; and it is usually easier
to find willing participants for interviews by approaching them in person than
by cold-calling telephone numbers. To allow the efficiencies of field research to
cancel out the inefficiencies of telephone interviews and vice versa, the following
hybrid methodology was developed1:
• conducting in-person interviews first in selected medium-sized cities
in order to narrow the gaps left by ANAE's sample of large cities;
• then conducting telephone interviews to attempt to zero in on the exact
locations of dialect boundaries;
• and then conducting additional in-person interviews in certain
communities which the results of the telephone interviews suggested
might be closest to dialect boundaries or otherwise of interest.
1 The specifics of the methods of data collection, the in-person and telephone interviews, are detailed in later sections of this chapter.
30
This methodology allowed both goals—sampling both a geographically broad
set of communities, and communities near dialect boundaries in particular—to
be efficiently satisfied, while collecting seven or more interviews in each of
twelve key communities.
2.2. Selection of specific communities
Overall, the communities selected for study were chosen with the aim of
estimating the locations of dialect boundaries as closely as possible using the best
information that was available at each phase of research. Although in succeeding
chapters of this dissertation data from all communities sampled will be
presented together, as if all communities had been sampled and analyzed
simultaneously, in actuality the research proceeded in stages, with the data from
the speakers interviewed at each stage having being fully or partially analyzed
before the selection of communities for the next stage began. Thus the selection
of communities sampled later depended in some respects on the dialectological
status of the communities sampled earlier. This means that the process of the
selection of communities discussed in this section will necessarily make reference
in some places to the dialectological findings discussed in later chapters of this
dissertation.
The research project that led to this dissertation began as a pilot study of
the eastward extent of the NCS and the location of the boundary between
ANAE's Inland North and Western New England regions. The westernmost city
assigned to the Western New England region is Albany, and the easternmost
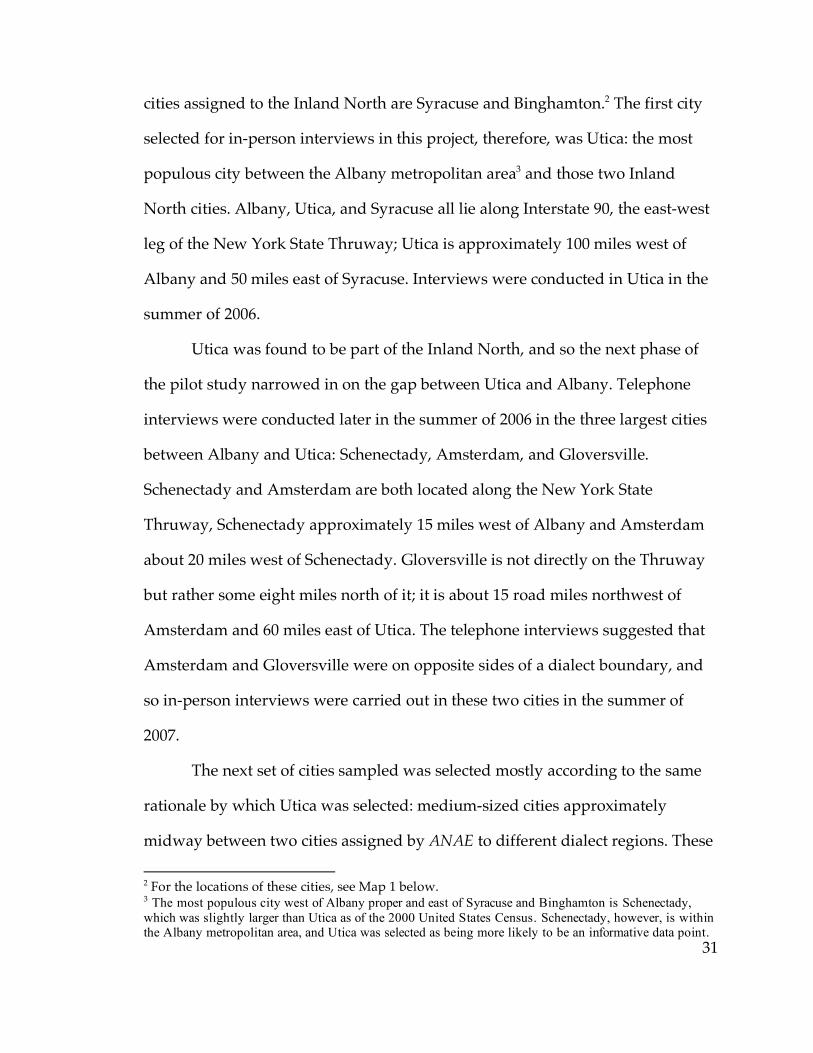
31
cities assigned to the Inland North are Syracuse and Binghamton.2 The first city
selected for in-person interviews in this project, therefore, was Utica: the most
populous city between the Albany metropolitan area3 and those two Inland
North cities. Albany, Utica, and Syracuse all lie along Interstate 90, the east-west
leg of the New York State Thruway; Utica is approximately 100 miles west of
Albany and 50 miles east of Syracuse. Interviews were conducted in Utica in the
summer of 2006.
Utica was found to be part of the Inland North, and so the next phase of
the pilot study narrowed in on the gap between Utica and Albany. Telephone
interviews were conducted later in the summer of 2006 in the three largest cities
between Albany and Utica: Schenectady, Amsterdam, and Gloversville.
Schenectady and Amsterdam are both located along the New York State
Thruway, Schenectady approximately 15 miles west of Albany and Amsterdam
about 20 miles west of Schenectady. Gloversville is not directly on the Thruway
but rather some eight miles north of it; it is about 15 road miles northwest of
Amsterdam and 60 miles east of Utica. The telephone interviews suggested that
Amsterdam and Gloversville were on opposite sides of a dialect boundary, and
so in-person interviews were carried out in these two cities in the summer of
2007.
The next set of cities sampled was selected mostly according to the same
rationale by which Utica was selected: medium-sized cities approximately
midway between two cities assigned by ANAE to different dialect regions. These
2 For the locations of these cities, see Map 1 below. 3 The most populous city west of Albany proper and east of Syracuse and Binghamton is Schenectady, which was slightly larger than Utica as of the 2000 United States Census. Schenectady, however, is within the Albany metropolitan area, and Utica was selected as being more likely to be an informative data point.
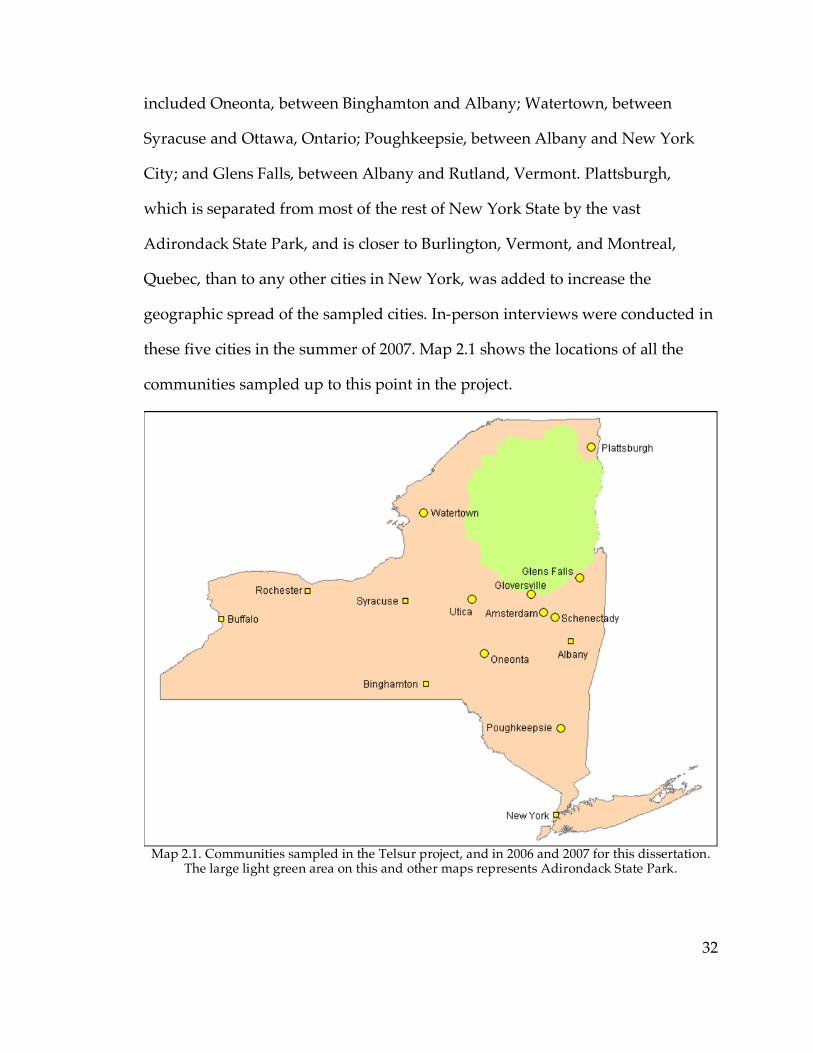
32
included Oneonta, between Binghamton and Albany; Watertown, between
Syracuse and Ottawa, Ontario; Poughkeepsie, between Albany and New York
City; and Glens Falls, between Albany and Rutland, Vermont. Plattsburgh,
which is separated from most of the rest of New York State by the vast
Adirondack State Park, and is closer to Burlington, Vermont, and Montreal,
Quebec, than to any other cities in New York, was added to increase the
geographic spread of the sampled cities. In-person interviews were conducted in
these five cities in the summer of 2007. Map 2.1 shows the locations of all the
communities sampled up to this point in the project.
Map 2.1. Communities sampled in the Telsur project, and in 2006 and 2007 for this dissertation.
The large light green area on this and other maps represents Adirondack State Park.
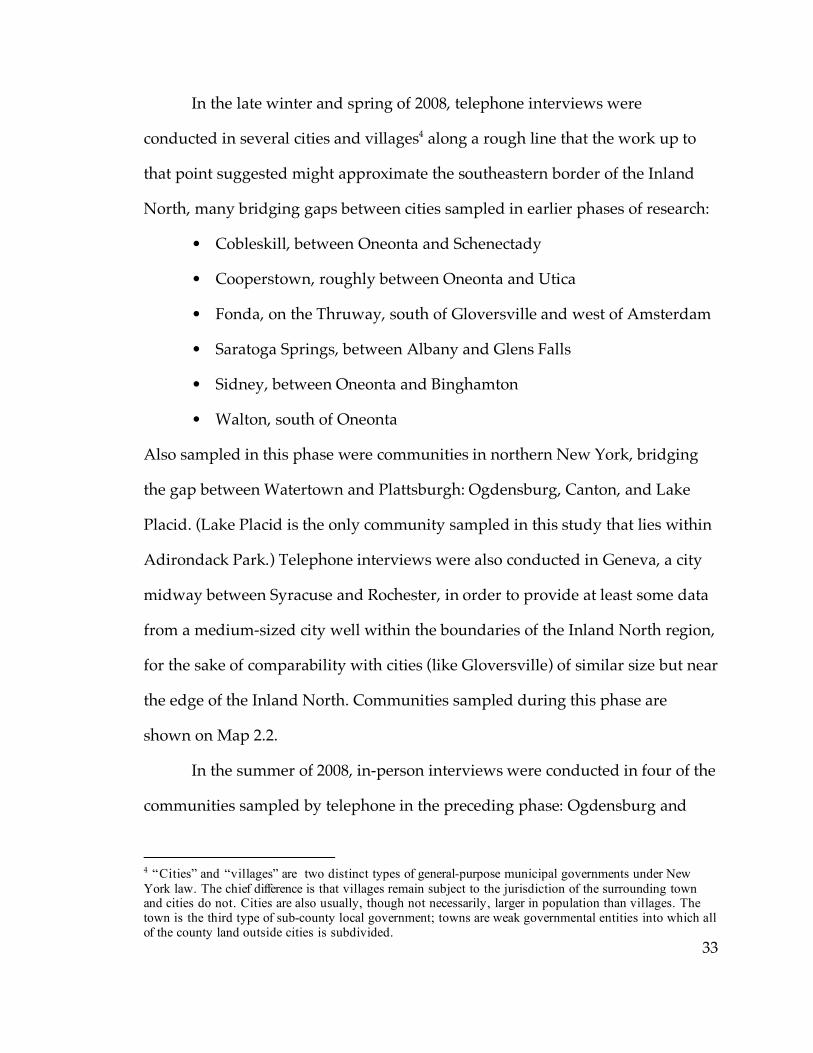
33
In the late winter and spring of 2008, telephone interviews were
conducted in several cities and villages4 along a rough line that the work up to
that point suggested might approximate the southeastern border of the Inland
North, many bridging gaps between cities sampled in earlier phases of research:
• Cobleskill, between Oneonta and Schenectady
• Cooperstown, roughly between Oneonta and Utica
• Fonda, on the Thruway, south of Gloversville and west of Amsterdam
• Saratoga Springs, between Albany and Glens Falls
• Sidney, between Oneonta and Binghamton
• Walton, south of Oneonta
Also sampled in this phase were communities in northern New York, bridging
the gap between Watertown and Plattsburgh: Ogdensburg, Canton, and Lake
Placid. (Lake Placid is the only community sampled in this study that lies within
Adirondack Park.) Telephone interviews were also conducted in Geneva, a city
midway between Syracuse and Rochester, in order to provide at least some data
from a medium-sized city well within the boundaries of the Inland North region,
for the sake of comparability with cities (like Gloversville) of similar size but near
the edge of the Inland North. Communities sampled during this phase are
shown on Map 2.2.
In the summer of 2008, in-person interviews were conducted in four of the
communities sampled by telephone in the preceding phase: Ogdensburg and
4 “Cities” and “villages” are two distinct types of general-purpose municipal governments under New York law. The chief difference is that villages remain subject to the jurisdiction of the surrounding town and cities do not. Cities are also usually, though not necessarily, larger in population than villages. The town is the third type of sub-county local government; towns are weak governmental entities into which all of the county land outside cities is subdivided.
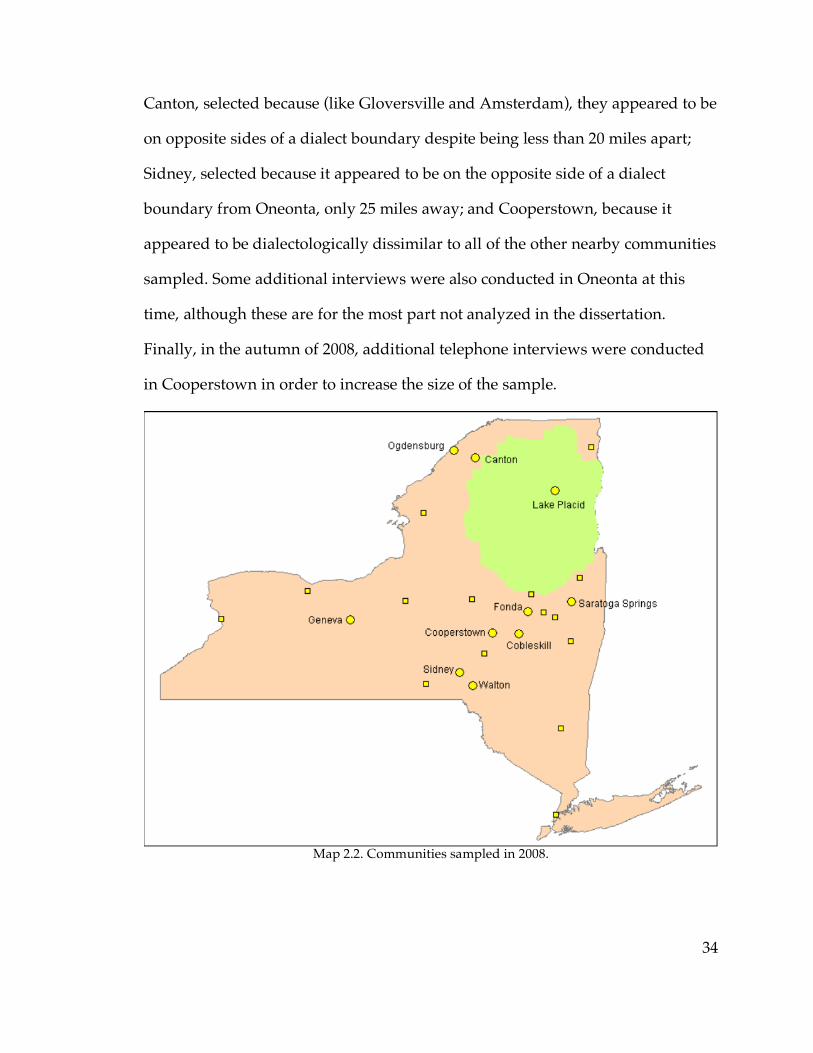
34
Canton, selected because (like Gloversville and Amsterdam), they appeared to be
on opposite sides of a dialect boundary despite being less than 20 miles apart;
Sidney, selected because it appeared to be on the opposite side of a dialect
boundary from Oneonta, only 25 miles away; and Cooperstown, because it
appeared to be dialectologically dissimilar to all of the other nearby communities
sampled. Some additional interviews were also conducted in Oneonta at this
time, although these are for the most part not analyzed in the dissertation.
Finally, in the autumn of 2008, additional telephone interviews were conducted
in Cooperstown in order to increase the size of the sample.
Map 2.2. Communities sampled in 2008.
35
2.3. Interview methodology
2.3.1. In-person interviews
The in-person interviews were carried out mostly following the Short
Sociolinguistic Encounter (SSE) protocol described by Ash (2002). These are semi-
anonymous interviews of usually 10–25 minutes in length for which the
researcher recruits subjects by approaching them in publicly-accessible places
such as parks, swimming pools, street corners, cafés, and shops. Little
demographic information is requested, and no personally identifying
information such as names or telephone numbers, although on rare occasions
subjects volunteered their contact information at the conclusion of the interview.
Subjects were recruited purely by availability, and little to no attempt was
made to balance the sample by gender, age, or socioeconomic class. In this
respect my in-person interview methodology echoed that of ANAE’s Telsur
project, from which a detailed dialectological portrait of North America was
achieved with no demographic control of the sample. Moreover, as discussed
above, the chief advantage of conducting in-person interviews over telephone
interviews is to efficiently maximize the size of the sample in any given
community. Excluding potential interview subjects on the grounds that they
were too demographically similar to individuals I had already interviewed, with
no guarantee that I would be able to locate willing subjects with greater
demographic diversity, could in many cases easily have significantly reduced my
total number of interviews. In most communities, I was able to conduct
approximately 10 interviews over the course of a 24-hour visit; as will be

36
discussed below, however, in many cases some of those interviews were
excluded from analysis, and in the greatest number of cities visited I ended up
with seven usable in-person interviews.
Not all interviewed subjects were directly approached by me in the
standard SSE protocol: Some were referred to me or introduced to me by other
subjects after I had interviewed them, or by potential subjects I had approached
who were unwilling or ineligible to be interviewed themselves, as people they
knew and thought might be interested in participating in my research. Also, in a
small number of cases, I made appointments several days in advance with
subjects who had been referred to me by an existing contact in the community;
these include two speakers in Poughkeepsie (Fred M. and Natalie I.5) referred to
me by an acquaintance, three speakers in Sidney (Lisa S., George S., and Keith
M.) referred to me by a previous interview subject, and all of the additional
speakers interviewed in Oneonta in 2008. The same interview methodology was
employed with all speakers, regardless of whether I approached them directly or
had them referred to me by other contacts.
Potential subjects were asked if they would be willing to help me out with
a research project on communication patterns in New York State; if they
answered that they were, they were asked if they had grown up in the
community in which they were being interviewed. If a subject answered in the
affirmative, and gave permission for me to record their voice, the interview
began with a request for the demographic information that was being recorded:
5 All names used for individual speakers in this dissertation are pseudonyms.
37
age6, occupation, education, residential history, and languages spoken. Subjects
were then asked about their travel patterns between their home community and
each of several other nearby cities or regions—“How often do you or people in
your family go to” e.g., Utica, Albany, New York City, western New York, New
England, Canada, the Adirondacks, “and for what reasons?”—as well as their
vacation habits. These questions were followed by free conversation on general
topics about life in the community: the local economy, their own recreational and
commercial habits, whether the community had changed since they were
younger. Many speakers were asked about their opinions of the community:
older speakers, for example, were often asked if they thought the community
was a good place to raise children; younger speakers if they planned to move
away from the community once they finished their education or found a better
job. Spontaneous conversation with most subjects lasted between five and ten
minutes, which (as will be seen below) was in all or almost all cases a sufficient
volume of speech to produce a detailed portrait of each subject’s vowel system.
The principal phonetic feature being studied, the advancement of the
NCS, has been found (Ash 1999) not to be substantially influenced by the
speaker’s relative degree of carefulness or casualness of speech. For this reason,
obtaining a large range of style-shifting between careful and casual styles was
6 Some speakers stated their age, and some their year of birth. For comparability between speakers, all age data has been converted into year of birth; this will have resulted in errors for speakers who reported age and were born in the second half of the year or so. Since this will not have created any errors of greater magnitude than one year, and because with samples of the size used in this dissertation differences between people born in consecutive years would be unlikely to be noticeable anyhow, this fact is regarded as unimportant in general and will be noted when it may be relevant. Two speakers—Dennis C. from Watertown and Vic R. from Poughkeepsie—declined to state their exact years of birth; in apparent-time analyses I use my estimates of 1952 and 1932 for them, respectively.
38
not a priority in conducting these interviews; and style will in most cases not be
analyzed in this dissertation.
Near the end of each interview, I told interviewees that the focus of my
research was specifically linguistic differences between different parts of New
York, and asked them whether they themselves were aware of differences in
accent between their own community and other nearby communities or regions.
Interviews concluded with a set of formal data-elicitation methods meant to
focus on variables of interest. These always included a set of “semantic
differential” questions, a written word list, and elicitation of explicit judgments
of “same” or “different” on minimal or near-minimal written pairs of words. In
each community, the minimal pairs investigated included two related to the
caught-cot merger (cot vs. caught and dawn vs. dawn), two related to a potential
phonemic split of /ay/ (spider vs. lighter and fire vs. higher), and two related to
mergers which were expected to be complete throughout most of the region but
might show variation near the extreme edges (bother vs. father and merry vs.
Mary).
The “semantic differential” method consists of asking subjects to explore
the difference in meaning between pairs of words, such as “What would you say
is the difference between a bed and a cot?” The aim of this method is to elicit
pronunciations of the targeted words without alerting the subject to the fact that
pronunciation (rather than meaning) is the feature of interest to the researcher,
and the method was found by Labov (1989) in a study of the /æ/ system of
Philadelphia to yield results very similar to those from spontaneous speech.
39
Other formal methods were employed only in certain phases of the research, and
will be discussed as they become relevant in later chapters.
In all communities except Utica, in-person interviews were recorded
directly in .wav format using an M-Audio Microtrack II with a lavaliere
microphone. In Utica, interviews were recorded on a Sony minidisc recorder.
2.3.2. Telephone interviews
Telephone interviews were conducted mostly according to the
methodology of the Telsur project as described in ANAE. Once a community was
selected, I consulted the data from the 2000 United States Census7 to determine
the most-represented ancestry groups in the community. For instance, in
Watertown, the most frequently reported ancestry in the 2000 Census was Irish
(18% of Census respondents), followed by German (13%) and Italian (12%). I
then selected two letters randomly, and used WhitePages.com to generate a
telephone directory of households in the chosen community whose names began
with the selected letters. Starting from the beginning of that directory, I would
then call the first telephone number on the list that was associated with a name
that appeared characteristic of one of the top few ancestry groups in that
community. If I failed to record an interview with a subject at that number, I
would move on to the next name fitting the same ancestry qualification. If in this
way I exhausted the directory generated by my randomly-chosen pair of letters
without recording an interview, I selected a new pair of letters and began again.
7 Available at http://factfinder.census.gov.

40
After conducting an interview, I selected a new pair of letters immediately to
begin a new directory to recruit my next interview subject, rather than
completing the directory in which the previous subject was found.8 My target
was to complete two usable telephone interviews in each community.
When a person answered the phone at any of these numbers, I introduced
myself by reading the following script, based on the script used for the
interviews reported in ANAE:
Hi there; my name is Aaron Dinkin and I’m a researcher at the University of Pennsylvania, in Philadelphia. We’re doing some research here on communication between different parts of New York, and so we’re looking for people who grew up in certain places to help us out by telling us a little bit about how people say things in each area. Did you grow up in _________? If yes: Do you think you could you take a few minutes now to answer some questions about it?
If a speaker answered affirmatively that they had grown up in the community of
interest, and was willing to participate in the research, then after getting
permission to make a recording of the conversation I began the interview.
The subjects of the last two telephone interviews in Cooperstown (Nellie
M. and Sally B.), conducted in the late summer of 2008, were recruited not by
cold-calling numbers listed with randomly-chosen initial letters, as above, but
through referrals by a previous interview subject acquainted with them. These
interviews were conducted at appointed times planned several days in advance.
The same interview methodology was employed in the interviews with these
subjects as with the cold-called speakers.
8 According to this methodology, people for whom the third letters of their surnames are near the beginning of the alphabet may be overrepresented in my telephone-interview sample. I am, however, unable to convince myself that this is important.
41
Telephone interviews began, following the Telsur model, with general
questions about the subject’s travel experience and familiarity with regional
dialect diversity, and moved on to free spontaneous conversation about the same
topics addressed in the in-person interviews: everyday life in the community, the
local economy, and so on. After five to ten minutes of free spontaneous speech, I
moved on to formal elicitation methods. These formal methods, like those used
in the in-person interviews, included a set of semantic-differential questions.
Since written word lists and minimal-pair lists are impossible over the
telephone9, they were replaced with requests for general classes of words (such
as “Name all the articles of clothing you can think of”) and elicitations of specific
words and pairs of words through targeted questions. A typical minimal-pair
elicitation would proceed as follows:
What kind of animal runs in the Kentucky Derby? (horse) What do you call it when your throat feels scratchy and sore and you can’t speak very
well? (hoarse) Do you think those two words sound the same or different? Would you say them both again, and tell me which is which?
At the end of the telephone interviews, subjects were asked for the same
demographic information requested in the Telsur project—age, occupation,
parents’ occupations, education, and ethnicity. Subjects were also asked whether
they would be willing to be contacted again in case I needed more information
about their community. Almost all subjects were willing to be contacted again; it
was through my telephone interview subjects in Sidney and in Cooperstown that
I arranged my pre-appointed interviews with speakers in those villages. 9 In some of the telephone interviews conducted in 2006, I followed the ANAE methodology of mailing (or e-mailing) subjects a word list to read and then calling them back at a later date to record them reading it. This method was abandoned in later interviews in the interest of saving time.
42
Telephone interviews typically lasted between 20 and 35 minutes. The
laboriousness of the word-elicitation questions contributed heavily to their
length, typically about ten minutes longer than an in-person interview.
2.3.3. Selection of speakers for analysis
With the exception of two communities to be mentioned below, phonetic
analysis was carried out on all white speakers who said that they had lived in the
community in which they were interviewed from before starting school through
adolescence (although many of them had moved away for shorter or longer
periods of time after high school). In the case of villages, subjects who said that
they had lived outside the village limits in their youth but attended school in the
village were also included.
The only two non-white speakers interviewed in the course of this project
were two African-American women from Poughkeepsie; they are excluded from
analysis because of the lack of a baseline of comparison. Poughkeepsie is atypical
in this set of communities in that its population, as of the 2000 Census, is 36%
African-American and only 53% white. Of the other communities in which in-
person interviews were conducted, none is less than 79% white or more than 13%
African-American.
In two communities, there were one or more speakers whose interviews
were not phonetically analyzed, in the interest of saving time and on the grounds
that they were deemed not to substantially deepen the sample beyond the
previously analyzed speakers from their communities. The five additional
43
interviews carried out in Oneonta in the summer of 2008 were not analyzed,
because the nine Oneonta speakers already interviewed and analyzed in 2007
satisfied my target sample size. Similarly, after the first two telephone-interview
subjects conducted in Schenectady turned out to both be over 67 years old, a
third interview was conducted in the hope of broadening the age range of the
sample. The third interview subject, as it happened, was also over 67 years old,
and her interview was not analyzed. Since the bulk of the data presented in this
dissertation is derived from the acoustic analysis of interview speech, these six
speakers—one from Schenectady and five from Oneonta—will be for the most
part ignored. In a few specified places, however, data will be presented from
some of the formal elicitation tasks carried out with these speakers.
A few speakers who were not natives of the communities in which they
were interviewed have been analyzed as well—typically individuals who said at
first that they were natives of the communities being studied, but then clarified
after the interview had already begun that they had actually grown up in another
nearby community. These include one speaker from Yorkville, adjacent to Utica,
and one from Morrisonville, near Plattsburgh. The largest set of such speakers
were interviewed in Glens Falls and include two from Queensbury, the town
immediately north of Glens Falls, and three from South Glens Falls, the village
immediately (appropriately) to the south. Since several of the cities and villages
sampled in this study are adjacent to or part of towns of the same name10, it is
also possible that some of the subjects who described themselves as natives of
(for example) Oneonta are actually natives of the town rather than the city of 10 This is true of Amsterdam, Canton, Cobleskill, Oneonta, Plattsburgh, Poughkeepsie, Sidney, Walton, and Watertown.
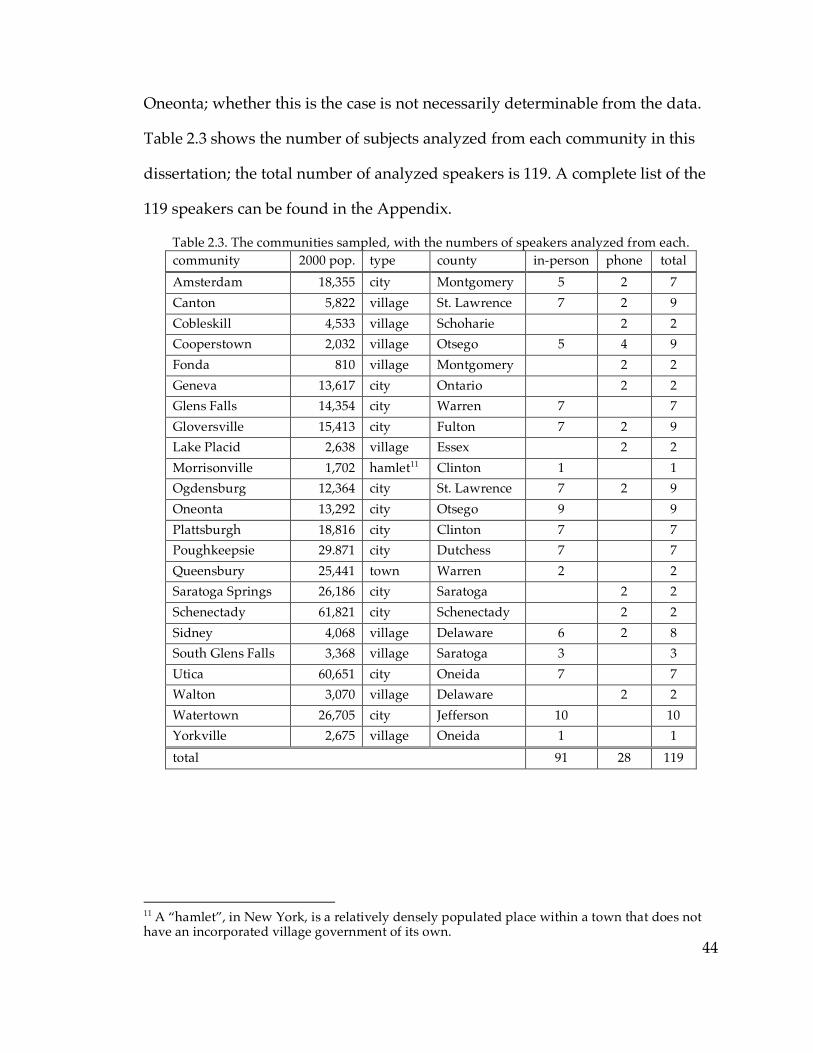
44
Oneonta; whether this is the case is not necessarily determinable from the data.
Table 2.3 shows the number of subjects analyzed from each community in this
dissertation; the total number of analyzed speakers is 119. A complete list of the
119 speakers can be found in the Appendix.
Table 2.3. The communities sampled, with the numbers of speakers analyzed from each. community 2000 pop. type county in-person phone total Amsterdam 18,355 city Montgomery 5 2 7 Canton 5,822 village St. Lawrence 7 2 9 Cobleskill 4,533 village Schoharie 2 2 Cooperstown 2,032 village Otsego 5 4 9 Fonda 810 village Montgomery 2 2 Geneva 13,617 city Ontario 2 2 Glens Falls 14,354 city Warren 7 7 Gloversville 15,413 city Fulton 7 2 9 Lake Placid 2,638 village Essex 2 2 Morrisonville 1,702 hamlet11 Clinton 1 1 Ogdensburg 12,364 city St. Lawrence 7 2 9 Oneonta 13,292 city Otsego 9 9 Plattsburgh 18,816 city Clinton 7 7 Poughkeepsie 29.871 city Dutchess 7 7 Queensbury 25,441 town Warren 2 2 Saratoga Springs 26,186 city Saratoga 2 2 Schenectady 61,821 city Schenectady 2 2 Sidney 4,068 village Delaware 6 2 8 South Glens Falls 3,368 village Saratoga 3 3 Utica 60,651 city Oneida 7 7 Walton 3,070 village Delaware 2 2 Watertown 26,705 city Jefferson 10 10 Yorkville 2,675 village Oneida 1 1 total 91 28 119
11 A “hamlet”, in New York, is a relatively densely populated place within a town that does not have an incorporated village government of its own.
45
2.3.4. Evaluation of sampling methods
The usefulness of the data derived from these 119 speakers will, of course,
depend on their representativeness as a sample of the population of the different
regions of upstate New York being studied. Even in this project’s best-sampled
communities, seven to ten speakers still does not constitute an in-depth
sociolinguistic sample of a speech community. However, it is still possible to
examine how reliable a picture of each community the sampling processes
detailed above give us.
The issue of sample reliability can be evaluated on the small scale by
consideration of the communities in which both telephone and in-person
interviews were conducted—Amsterdam, Canton, Cooperstown, Gloversville,
Ogdensburg, and Sidney. In each of these communities, the preliminary findings
from two telephone interviews were sufficiently striking to prompt further
research to attempt to confirm or disconfirm these first impressions. In four of
those six communities, the first impressions from the telephone interviews were
confirmed by the follow-up in-person research. As later chapters will
demonstrate, Gloversville was found to demonstrate a moderate degree of NCS;
in Ogdensburg the NCS is in progress; in Amsterdam, there is no clear sign of
the NCS; and in Canton the NCS is absent and the caught-cot merger well
underway; and in all of these communities, the two telephone-interview subjects
give the same general impression of the status of the community as the larger
sample does.

46
In Cooperstown and Sidney, however, the initial telephone interviews
gave only a small and possibly misleading portion of the picture, which was
substantially deepened by in-person research. The telephone interviews
suggested that Sidney was a highly advanced NCS community; however, none
of the in-person interview subjects displayed NCS as advanced as the two
telephone subjects, and many of them showed very weak or even absent NCS.
Conversely, the initial telephone interviews in Cooperstown suggested a village
that lacked the NCS entirely and was overall dissimilar to all the other
communities sampled in southeastern and central New York; but in-person
interviews found NCS features in some speakers, and in others a general
phonological profile that was overall in keeping with the region.
The difference between Sidney and Cooperstown on the one hand and
Amsterdam, Canton, Gloversville, and Ogdensburg on the other hand lies in the
accidental degree of difference or similarity between the two telephone-interview
subjects. In Sidney and Cooperstown, the two initial telephone-interview subjects
happened to be demographically very similar: in Sidney, both were middle-class
women in their 50s who had completed some college; in Cooperstown, both were
college-educated women in their 20s who were planning to start graduate school
in the next few years. So coincidentally interviewing two speakers with similar
demographic profiles in one community gave a misleading picture of a
community in which there is substantial variation between demographic
groups—in these two villages in particular, between age groups. In each of
Amsterdam, Canton, Gloversville, and Ogdensburg, however, the two
telephone-interview subjects differed in age by at least 20 years, and in some
47
cases differed in socioeconomic class as well. (By coincidence, in all four
communities the two telephone-interview subjects are the same gender.) So we
can have more confidence in the telephone interviews to present a reliable sketch
of a community’s dialectological situation, especially in cases of potential change
in progress, if the two speakers interviewed differ substantially in age and other
demographic features.
There are seven communities in which only telephone interviews were
conducted: Cobleskill, Fonda, Geneva, Lake Placid, Saratoga Springs,
Schenectady, and Walton. In all of these but Lake Placid and Schenectady, the
two speakers analyzed differ by more than 25 years in age, as well as in gender,
education, occupational class, or some combination of those factors. In
Schenectady, the two speakers (one female and one male) were born in 1929 and
1938, and are both retired from white-collar jobs. In Lake Placid, the two
speakers (likewise one male and one female) are both college students born in
the 1980s. So the results presented in this dissertation for Lake Placid and
Schenectady should probably be taken with a relatively large grain of salt, at
least insofar as they might be taken as a sketch of the communities’
dialectological status. The data from Cobleskill, Fonda, Geneva, Saratoga
Springs, and Walton, on the other hand, might be a bit more reliable as a first
impression of the dialectological situation in those communities, inasmuch as
they each have two data points from somewhat different demographics.
Similarly, the two speakers interviewed from Queensbury are both
apparently lower-middle-class males born in 1989 and 1990, and so do not
constitute a sample from which generalizations about the town of Queensbury
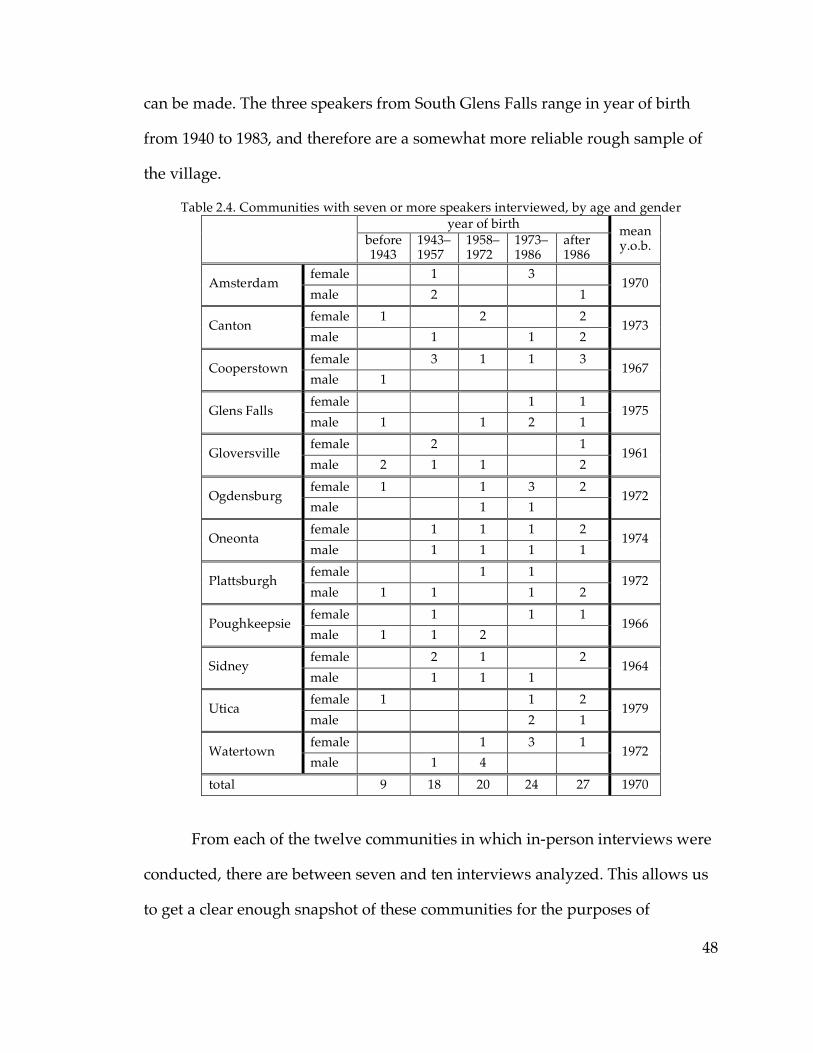
48
can be made. The three speakers from South Glens Falls range in year of birth
from 1940 to 1983, and therefore are a somewhat more reliable rough sample of
the village.
Table 2.4. Communities with seven or more speakers interviewed, by age and gender year of birth
before 1943
1943–1957
1958–1972
1973– 1986
after 1986
mean y.o.b.
female 1 3 Amsterdam male 2 1
1970
female 1 2 2 Canton male 1 1 2
1973
female 3 1 1 3 Cooperstown male 1
1967
female 1 1 Glens Falls male 1 1 2 1
1975
female 2 1 Gloversville male 2 1 1 2
1961
female 1 1 3 2 Ogdensburg male 1 1
1972
female 1 1 1 2 Oneonta male 1 1 1 1
1974
female 1 1 Plattsburgh male 1 1 1 2
1972
female 1 1 1 Poughkeepsie male 1 1 2
1966
female 2 1 2 Sidney male 1 1 1
1964
female 1 1 2 Utica male 2 1
1979
female 1 3 1 Watertown male 1 4
1972
total 9 18 20 24 27 1970
From each of the twelve communities in which in-person interviews were
conducted, there are between seven and ten interviews analyzed. This allows us
to get a clear enough snapshot of these communities for the purposes of

49
assigning them to dialect regions, but is not enough to get a detailed
sociolinguistic picture of variation within each of these communities. The
amount of sociolinguistic detail that can be extracted from each depends on the
amount of demographic diversity within each community’s sample. Table 2.4
displays the ages and genders of the speakers interviewed in these twelve
communities.
It is clear from Table 2.4 that the Short Sociolinguistic Encounter method,
at least as practiced by me, skews the sample toward younger subjects. That
means that when an overall mean value of any particular linguistic feature is
computed for these communities, the value will tend to skew towards the value
favored by younger speakers in cases of change in progress. The four
communities with the highest mean ages—Gloversville, Sidney, Poughkeepsie,
and Cooperstown, with mean dates of birth in the 1960s—have the most even
distribution of speakers across age groups, and thus in those the data mean will
be less skewed away from the community mean.
Most of the communities sampled show a wide enough distribution of
ages that, if language change is fairly active in any one community, it should be
visible in apparent time. Utica is the main exception to this: the sample from
Utica included six speakers born between 1979 and 1989 and one older outlier
born in 1942, which is not sufficient to convincingly establish a long-term trend.
In Watertown, all of the male subjects are older than all but one of the female
subjects, which means that there is the potential for confusion between change in
apparent time and stable gender-based variation. In Cooperstown, the only male

50
subject is also the oldest by a margin of 31 years; he may or may not be strictly
comparable to the six female speakers younger than him as well.
There are few enough speakers sampled in any one community that it is
unlikely that any gender-based variation within a single community can be
isolated. However, males and females are both well-represented in the overall
sample, and so once communities are grouped into regions it will become
possible to meaningfully compare male and female speakers within each region.
The SSE method does not skew the gender makeup of the sample; of the 91
speakers interviewed in person, 47 are male and 44 are female. The telephone
interview is skewed toward female speakers; the 28 telephone-interview subjects
include 20 females and only eight males. However, the in-person interviews
outnumber the telephone interviews by enough that the overall gender
breakdown of the full sample, 64 females and 55 males, is still reasonably
balanced. Oddly, among the oldest speakers the sample is skewed heavily
toward males: among speakers born before 1943 there are eleven males (eight
interviewed in person, three by telephone) and only four females (two in person,
two telephone).
My attempt at supplementing SSEs with more in-depth, scheduled
interviews in targeted communities must be regarded as a failure. My plan had
been that, once I had identified communities of interest from my 2008 telephone
interviews to target for in-person interviews, I would re-connect with those of
my telephone-interview subjects who had expressed willingness to help with my
further research, and ask for their assistance in contacting more speakers in their
communities to schedule in-person interviews with. The communities I selected

51
for this approach were Sidney, Ogdensburg, and Canton.12 In Sidney the
approach met with moderate success: my telephone-interview subjects in Sidney
were able to put me in contact with three more natives of Sidney with whom I
scheduled and conducted in-person interviews (as well as one speaker from the
adjacent town of Masonville, unanalyzed in this dissertation). These three
speakers, however, were not sufficient to bring my Sidney sample size to seven,
and so it was necessary for me to conduct SSEs in Sidney in addition to the
scheduled interviews. In Ogdensburg and Canton, it was a complete failure—I
was not even able to reestablish contact with my telephone-interview subjects
from those communities. In one case, when I dialed the number at which I had
conducted one of my interviews in Ogdensburg and asked for my contact by the
name she had given, the person who answered the telephone then didn’t even
recognize the name. For this reason all of my in-person interviews in
Ogdensburg and Canton are SSEs, although I incorporated into them a few
formal methods that I had intended to employ in longer scheduled interviews.
2.4. Phonetic measurements
The full vowel system of each selected speaker was measured, using the
general methodology described in ANAE in order to ensure comparability with
data from ANAE. For each speaker, first and second formant (F1 and F2) values
were extracted for about 400–600 vowel tokens wherever possible. For 22 more
12 In Oneonta this approach—through recontacting SSE subjects whose contact information I possessed—was somewhat more successful; but it was also much less essential inasmuch as nine speakers from Oneonta had already been interviewed.
52
reticent speakers with relatively short interviews, the number of measurable
vowel tokens was less than 400; for a single speaker (Jake V. from Gloversville)
only 190 vowel tokens were measurable. However, with the possible exception of
Jake V., even the speakers with the fewest measurable tokens are sampled at
least as thoroughly as most speakers in ANAE, in which the mean number of
tokens measured per speaker was 305. 10 speakers have more than 600 vowel
tokens measured; the mean number of vowel tokens measured per speaker is
483, yielding a total corpus of 57,464 vowel measurements across the 119
analyzed interviews. This is approximately 40% of the size of the corpus of vowel
measurements used in ANAE.
Only vowels with at least secondary stress were measured; reduced
vowels and unstressed syllables were ignored. Vowels preceded immediately by
the glides /w/ or /y/ were also not measured. In nearly all cases, measurement
of vowels began at the beginning of the recorded interview and proceeded
forward one token at a time from there until the end of the interview or until the
target number of measurements (500) was being approached; when the number
of measurements was approaching 500, I would skip to the formal methods near
the end of the interview. All tokens elicited through semantic differentials, the
telephone-interview word-elicitation questions, word lists, or minimal-pair lists
were always measured (except when excluded for the reasons listed at the
beginning of this paragraph). When multiple tokens (usually three or more) of
the same word had been measured in the same interview, additional tokens of
that word would often be skipped in order to avoid oversampling a particular
phonetic environment for that vowel phoneme; however, I did not do this
53
systematically, and there are several interviews in which the same word is
measured five or six times. In the rare case that it was impossible for me to
determine what phoneme a particular vowel token represented, of course I did
not measure it. In the case of place names with which I was unfamiliar, if I found
it difficult to identify a particular vowel token I referred to De Camp (1944)’s list
of phonetically transcribed Upstate New York place names for a suggestion.
Measurements of F1 and F2 were extracted using Praat 4. Each vowel
token was measured at a single point selected by hand as being characteristic of
the central tendency of the vowel nucleus, following the method described in
ANAE. (Offglides of diphthongs were in general not measured.) For
monophthongal vowels and upgliding diphthongs such as /ay/, /ey/, /aw/,
/ow/, the measurement was taken at or near the point of maximum F1 within
the nucleus, indicating the phonetically lowest point in the articulation of the
vowel. For front vowels preceding /l/, particularly tense front vowels preceding
/l/, the measurement was taken at the point of maximum F2, indicating the
frontest point in the articulation of the vowel before beginning the glide back
towards /l/. Likewise, the formants were measured at the F2 maximum (or,
respectively, minimum) point for ingliding front (respectively, back) vowels,
indicating the frontest or backest point in the production of the vowel before the
glide into the center. Vowels either before or after /r/ were measured during the
period of maximum F3; while syllabic /r/ itself (as in bird) was measured at the
point of minimum F3. In cases of ambiguity—for example, when there was more
than one local F1 maximum in the formant track—preference was given to points
closer to the point of greatest sound amplitude.
54
In all cases, points that were selected for measurement were checked by
ear before the formant measurements were recorded to ensure that the selected
point was actually within the vowel nucleus. If, for example, the off-glide was
clearly audible when listening to an excerpt that ended with the selected point,
that point would be deemed not clearly within the nucleus and an earlier point
would be selected if possible. The general guideline I followed here in
determining whether the selected point was within the nucleus was that the
vowel nucleus itself should be audible when either the segment ending with the
selected point or the segment beginning with it was played, but the off-glide and
syllable coda should not be audible when listening only to the segment ending
with the selected point, and the syllable onset should not be audible when
listening only to the segment beginning with the selected point. In rare cases the
vowel nucleus was short enough that it was impossible to find a point which
satisfied these (seemingly fairly lax) constraints; in those cases I merely
attempted to find whatever point within the visible formant structure was at an
F1 maximum (or F2 or F3 maximum or minimum, depending on the
circumstance, as outlined above).
The vowel phoneme /æ/ required special care in choosing a point to
measure. One of the key questions to be addressed in this dissertation, of course,
is which speakers in the sample display the NCS and which do not; and one of
the key features of the NCS is that, under the NCS, particularly in its advanced
forms, /æ/ develops a clear and distinct inglide, in contrast to the presumably
monophthongal /æ/ of other dialects. The characteristic of /æ/ that will be used
in this dissertation in determining whether any given speaker is subject to the
55
NCS will be the height of /æ/ in F1, rather than the presence or absence of an
off-glide specifically; this is to maintain comparability with ANAE, in which /æ/
height is used. However, whether or not any particular token of /æ/ is ingliding
is essential in determining how to measure its F1, simply because the method
outlined above for choosing a point for measurement differs according to
whether the vowel is monophthongal or ingliding. In order to avoid prejudging a
speaker or community’s status with respect to the NCS, it was necessary to judge
on a case-by-case basis whether each token of /æ/ was to be regarded as
ingliding or not—or at least, each token whose F1 maximum and F2 maximum
occurred at different points in time. A token was judged as possessing or not
possessing an inglide both by inspection of the formant trajectories and by ear. A
token that exhibited a very sharp F2 decline, or whose F1 maximum was during
the period of F2 minimum, was judged as ingliding. In the more challenging
cases, where F2 showed a moderate decline and the F1 maximum was merely
somewhat later than the F2 maximum, ingliding status was judged by ear: if the
portion of the vowel after the F1 maximum had a perceptibly different vowel
quality than the portion before the F1 maximum, it was judged to be an inglide
and the formants were measured at the F2 maximum. For several tokens of /æ/
that displayed the form of ingliding identified as “northern breaking” by
ANAE—a nucleus and inglide target with formant steady states of comparable
length, each with its own amplitude peak—the token was often noted as a case of
breaking and the formants of the second component were measured as well.
Note that, although the status of tokens of /æ/ as ingliding or not was not
used directly to influence a speaker or community’s classification as a participant
56
or non-participant in the NCS, the judgments described in the foregoing
paragraph still influenced speakers’ classification. Speakers’ NCS status, as
discussed in later chapters, will be established with reference to mean height of
/æ/; and the F1 height measured for any given token of /æ/ was influenced by
whether that token was judged to be ingliding or not: non-ingliding tokens were
measured at the F1 maximum, while ingliding tokens were measured at some
point with lower F1. Therefore, speakers for whom a larger fraction of tokens of
/æ/ were judged as ingliding will show up in the analyses as having mean /æ/
higher in the vowel space than they would if those same tokens had been
measured as if they were not ingliding. Since the mean height of /æ/ is a
component in establishing speakers NCS status, therefore the distinction in
measurement technique between monophthongal and ingliding tokens of /æ/
means that speakers for whom a large number of tokens were judged as
ingliding are more likely to be considered participants in the NCS. This is
consistent with the intuition that the NCS is distinguished in part by the high
frequency of ingliding /æ/, even though the inglide itself is not used directly in
categorizing speakers with respect to the NCS.
For each speaker, the mean F1 and F2 for each vowel phoneme were
computed in Plotnik 8. Prior to computing the means, apparent outliers were
double-checked by hand. For each vowel phoneme in a given speaker’s vowel
system, I viewed the F1/F2 plot of all measured tokens of that vowel; if any
token appeared impressionistically to be well outside the distribution of other
tokens of the same phoneme, I returned to Praat to check for possible errors in
the measurement (or recording of the measurement) of that token’s formants. If I

57
found that the original recorded formant values were correct, I let them stand; if I
found substantially different formant values upon re-measuring the token, I
would replace the measurements before computing the means.
In computing means, Plotnik deliberately ignores vowel tokens in certain
phonetic environments as being non-representative of the default phonetic target
for a particular phoneme—in particular, tokens before sonorants or after
obstruent+liquid clusters are disregarded in calculating means. For some
phonemes, Plotnik operating under its default settings computes the means
separately for two classes of phonetic environments. Thus, for example, the mean
F1 and F2 of /ey/ before a consonant on the one hand and before a word
boundary or vowel on the other hand are computed as if they were two distinct
phonemes. Plotnik makes occasional errors in determining the phonetic
environments of vowel tokens, and therefore (for example) a few tokens before
sonorants may have inadvertently not been discarded in computing means, or a
few tokens of /ey/ before vowels may have been incorporated into their
speakers’ means for preconsonantal /ey/ rather than prevocalic /ey/. I have for
the most part accepted the phonetic environment– dependent means as
computed by Plotnik, without looking for errors; although when I have noticed
individual errors in Plotnik’s phonetic-environment determinations I have
corrected them.
For inter-speaker comparability, all speakers’ vowel measurements were
log-mean normalized in Plotnik, using the same group norm used in ANAE.
Numerical formant values, means, differences, and so on mentioned within this
dissertation will all be normalized numbers, unless noted otherwise.

58
When a vowel’s mean F1 or F2 for an entire community is presented, all
speakers are weighted equally. For example, the mean F1 of /e/ in Gloversville
is 691 Hz. This is the mean of the nine (normalized) F1 means of /e/ of
Gloversville speakers as calculated in Plotnik, not the mean of all of the
individual measured tokens of /e/ among those nine speakers.
All interview recordings and F1/F2 measurements used in this
dissertation will be archived at the Linguistics Lab of the University of
Pennsylvania.
59
Chapter 3
The Northern Cities Shift and Settlement History
3.1. The nature of the Inland North’s eastern boundary
Identifying the eastern extent of the Northern Cities Shift is a topic of
major interest because of conflicting characterizations in the literature of the
relationship between the Inland North and Western New England dialect
regions. Although all sources agree that Western New England is an essential
part of the Inland North’s history, predictions differ on whether a boundary
exists between them in the present day and, if so, what the nature of that
boundary will be.
Kurath (1949) defines a “Hudson Valley” dialect region located between
the Inland North and Southwestern New England. However, examining the
maps of Kurath & McDavid (1961) fails to reveal any phonological difference
between the Hudson Valley and Southwestern New England. Albany, the only
city in the Telsur corpus that might be within Kurath’s Hudson Valley region, is
grouped with Southwestern New England by ANAE, which weakly implies that
the Hudson Valley is to be considered part of Southwestern New England for
present-day dialectological purposes. If a boundary between the Inland North
and Western New England exists, it may pass through Kurath’s Hudson Valley,
or coincide with one of the Hudson Valley’s boundaries.
Boberg (2001) concludes that Southwestern New England is a “subtype of
the Inland North”, differing from the Inland North proper not in phonological
60
structure but rather only in phonetic detail—specifically, “the relative
advancement of the Northern Cities Shift”. In other words, in Boberg’s analysis,
Southwestern New England is essentially an eastern extension of the Inland
North region, which is just as open to the NCS as communities in the Inland
North proper are; it just happens not to have undergone the shift yet. If this is the
case, we would not expect to see a sharp discontinuity between the Inland North
and Southwestern New England. Rather, if the only difference between them is
that the NCS is more advanced in the Inland North proper and less advanced in
Southwestern New England, we might expect to find NCS features with an
intermediate degree of advancement in the intermediate area between Syracuse
and Binghamton on the one hand and Connecticut and Albany on the other.
Boberg is one of ANAE’s authors, and the text of ANAE echoes the point
of his (2001) paper in saying that “the basic configuration underlying the NCS
can be found among Western New England speakers.” It goes on, however, to
present a different interpretation of the phonological status of the Inland North,
arguing that the cause of the NCS depended upon the unique settlement history
of western and central New York. The argument hinges on the fact that the
largest NCS cities in Upstate New York—Buffalo, Rochester, and Syracuse—all
lie along the Erie Canal, whose construction spurred the population growth of
the region:
The native-born settlers moving into New York State came from a variety of dialect areas in New England, including Maine, New Hampshire, Providence, and western Connecticut. In addition, the great expansion of New York City after the [Erie] Canal was completed ensured a flow of workers, passengers, and entrepreneurs from outside of New England, up the Hudson River and westward to Buffalo. […] These settlers would have a variety of different and incompatible short-a systems: the nasal system of Eastern New England, the continuous nasal pattern of Western New England, the broad-a pattern of
61
Boston, and the short-a split of New York City. The end result in New York State was none of these, but the general raised short-a pattern of the NCS. (ANAE: 214)
In other words, as Upstate New York’s settlement was driven by the construction
of the Erie Canal in the 1820s, the combination of multiple incompatible
phonological treatments of /æ/ from different regional origins gave rise to the
NCS’s distinctive raising of /æ/. This account makes different predictions about
the relationship between the Inland North and Western New England than
Boberg (2001) does. Under the ANAE interpretation, the NCS is phonologically
distinct on a qualitative level from the vowel systems of the dialect regions that
contributed to the region’s settlement, and it could not have arisen in one of
these regions alone. If this is the case, we would expect to see a sharp boundary
between the Inland North and the surrounding regions, whether Western New
England or Hudson Valley: communities that share the distinctive Inland North
settlement history, driven by the Erie Canal, will share the Inland North
phonology and undergo the NCS; communities with a different early settlement
history won’t be subject to the NCS; and in principle such communities could be
arbitrarily close to each other.
Thus by identifying and examining the linguistic status of communities
near the edge of the Inland North—if such an edge exists—we can attempt to
determine the nature of the boundary and the phonological relationship between
the NCS and Southwestern New England, and elucidate the status of the Hudson
Valley as a dialect region. A gradual transition eastward from the Inland North
would suggest that, as Boberg (2001) argues, Southwestern New England’s
vowels are phonologically no different from the NCS, and that the Hudson
Valley should not be distinguished as a separate dialect region; a sharp boundary
62
would suggest that the presence of the NCS constitutes a substantive
phonological difference between the Inland North and whatever region is
adjacent. Thus, examining the status of the NCS in the sampled communities will
allow us to draw a general map of the major present-day dialect boundary of
Upstate New York, determine what constraints control the distribution of the
NCS, and get a hint of the underlying phonological issues involved. Chapter 4
will go further into the phonological status of /æ/ in particular.
3.2. Results: categorical NCS criteria
3.2.1 Overall findings
Great variation was found across the full sample of 119 speakers with
respect to the presence or absence of the NCS. The most advanced NCS was
found in the vowel system of Janet B., a 64-year-old bookstore clerk from Utica,
depicted in Figure 3.1. Janet’s /æ/ is extremely high and front, with only three
tokens lower than the midline of her vowel space; her mean /e/ is so back, and
her mean /o/ so front, that both line up along the center line; and her /ʌ/ is far
to the back of the vowel space. By contrast, Emily R, a 21-year-old college student
from Cooperstown, shows no NCS at all: /æ/ remains in low front position, not
even on average as far front as /e/; /o/ is some distance back of center; and /e/
and /ʌ/ are about the same distance front and back of center respectively. Her
vowel system is shown in Figure 3.2.
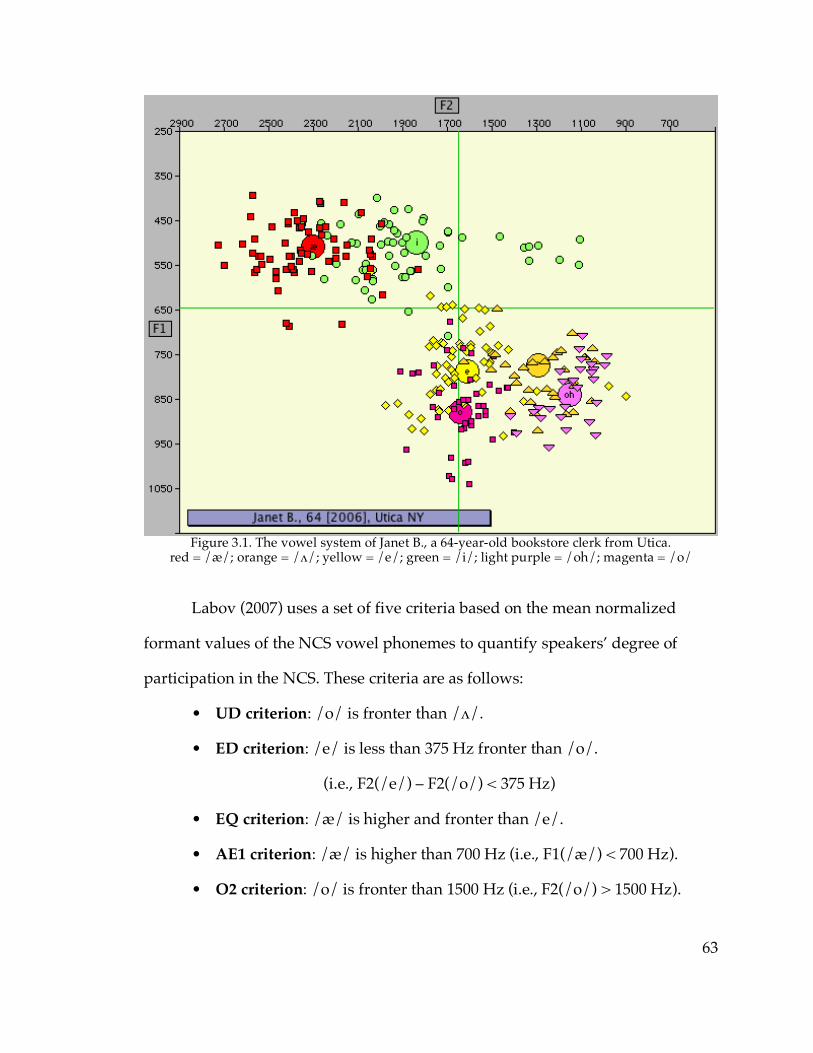
63
Figure 3.1. The vowel system of Janet B., a 64-year-old bookstore clerk from Utica.
red = /æ/; orange = /ʌ/; yellow = /e/; green = /i/; light purple = /oh/; magenta = /o/
Labov (2007) uses a set of five criteria based on the mean normalized
formant values of the NCS vowel phonemes to quantify speakers’ degree of
participation in the NCS. These criteria are as follows:
• UD criterion: /o/ is fronter than /ʌ/.
• ED criterion: /e/ is less than 375 Hz fronter than /o/.
(i.e., F2(/e/) – F2(/o/) < 375 Hz)
• EQ criterion: /æ/ is higher and fronter than /e/.
• AE1 criterion: /æ/ is higher than 700 Hz (i.e., F1(/æ/) < 700 Hz).
• O2 criterion: /o/ is fronter than 1500 Hz (i.e., F2(/o/) > 1500 Hz).
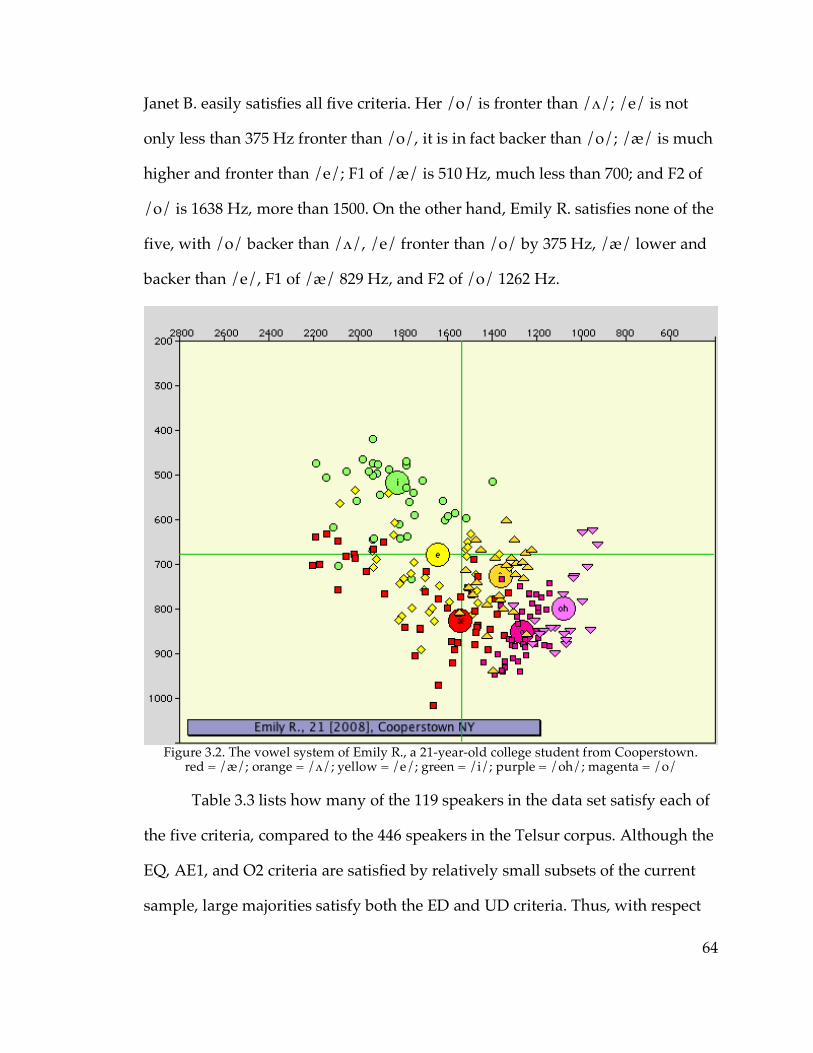
64
Janet B. easily satisfies all five criteria. Her /o/ is fronter than /ʌ/; /e/ is not
only less than 375 Hz fronter than /o/, it is in fact backer than /o/; /æ/ is much
higher and fronter than /e/; F1 of /æ/ is 510 Hz, much less than 700; and F2 of
/o/ is 1638 Hz, more than 1500. On the other hand, Emily R. satisfies none of the
five, with /o/ backer than /ʌ/, /e/ fronter than /o/ by 375 Hz, /æ/ lower and
backer than /e/, F1 of /æ/ 829 Hz, and F2 of /o/ 1262 Hz.
Figure 3.2. The vowel system of Emily R., a 21-year-old college student from Cooperstown.
red = /æ/; orange = /ʌ/; yellow = /e/; green = /i/; purple = /oh/; magenta = /o/
Table 3.3 lists how many of the 119 speakers in the data set satisfy each of
the five criteria, compared to the 446 speakers in the Telsur corpus. Although the
EQ, AE1, and O2 criteria are satisfied by relatively small subsets of the current
sample, large majorities satisfy both the ED and UD criteria. Thus, with respect
65
to ED and UD, the New York State speakers in this study overall basically
resemble the Inland North speakers from the Telsur corpus. But with respect to
the other three criteria, the speakers in this study are overall more like the non–
Inland North Telsur speakers.
Table 3.3. The number of speakers satisfying the five NCS criteria in the current sample (n = 119), compared with ANAE’s Inland North region (n = 61) and the rest of the Telsur corpus (n = 385).
criterion % NYS speakers % ANAE IN speakers % other Telsur UD 84% 93% 15% ED 85% 84% 13% EQ 18% 66% 3% AE1 26% 84% 17% O2 18% 46% 5%
It is not expected, of course, that the speakers in this dissertation’s data set
will overall resemble the Inland North in all respects; the sampled communities
were chosen with the aim of being located on both sides of the eastern border of
the Inland North. But it is noteworthy that, instead of being intermediate
between Inland North and non–Inland North distributions of all five criteria,
they match the Inland North quite closely in two of the five. This means, in all
likelihood, that even the communities which are found to be outside the Inland
North will show Inland North–like ED and UD features. The Telsur corpus
contains thirteen Western New England speakers; of those, nine satisfy the UD
criterion, but only five the ED criterion. So it is not surprising that a set of
speakers straddling the Inland North–Western New England border satisfies UD
to a very high degree; but the high rate of ED in the New York State corpus is
characteristic of the Inland North but not Western New England.
In addition to how many speakers in the sample satisfy each of the five
NCS criteria, we can ask how many speakers satisfy any number of criteria—that

66
is, how many speakers satisfy all five criteria, how many satisfy four, and so on.
The number of criteria satisfied by any given speaker will be referred to as that
speaker’s score (or NCS score). These figures are displayed in Table 3.4. Whereas a
large majority of Telsur speakers outside the Inland North meet none of the five
criteria, and a plurality of Telsur Inland North speakers meet all five, in the New
York corpus fairly few speakers meet either zero or five; a plurality of them meet
exactly two. These results are unsurprising: Table 3.3 shows that two of the five
criteria are met by large majorities of the New York corpus, while the other three
are satisfied by relatively small minorities; thus it is expected that the most
frequent score in the New York corpus would be two. However, Table 3.4 shows
more clearly than Table 3.3 how the New York corpus sits in between the Inland
North and non–Inland North Telsur subsets with respect to the five criteria.
Table 3.4. The NCS scores of speakers in this study’s New York State data set, compared with ANAE’s Inland North region and the rest of the Telsur corpus.
# criteria % NYS speakers % ANAE IN speakers % other Telsur 5 3% 36% 1% 4 18% 26% 1% 3 14% 16% 3% 2 42% 16% 9% 1 13% 5% 21% 0 8% 0% 66%
3.2.2. Classifying communities
In order to determine the location and nature of the Inland North–
Western New England boundary, it is necessary to look at the sampled
communities one at a time rather than in the aggregate, so that they can each
individually be assigned to the Inland North, to Western New England, or to
some other category. The bulk of this chapter will focus on the twelve
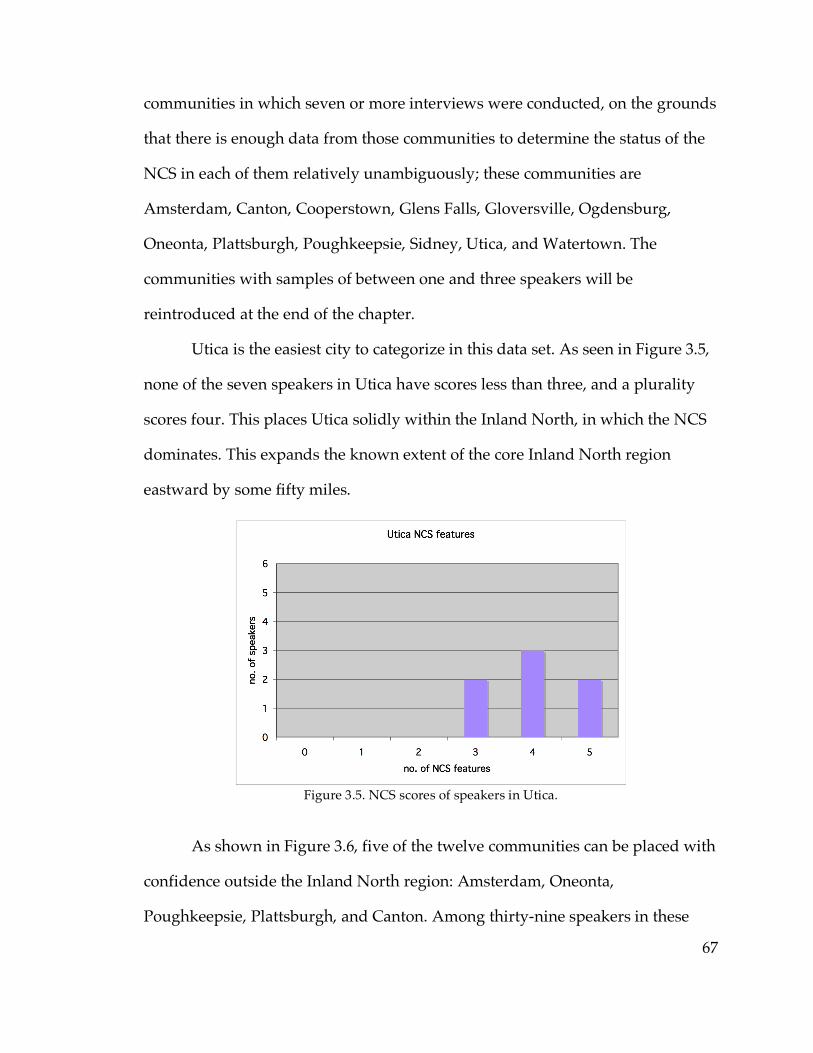
67
communities in which seven or more interviews were conducted, on the grounds
that there is enough data from those communities to determine the status of the
NCS in each of them relatively unambiguously; these communities are
Amsterdam, Canton, Cooperstown, Glens Falls, Gloversville, Ogdensburg,
Oneonta, Plattsburgh, Poughkeepsie, Sidney, Utica, and Watertown. The
communities with samples of between one and three speakers will be
reintroduced at the end of the chapter.
Utica is the easiest city to categorize in this data set. As seen in Figure 3.5,
none of the seven speakers in Utica have scores less than three, and a plurality
scores four. This places Utica solidly within the Inland North, in which the NCS
dominates. This expands the known extent of the core Inland North region
eastward by some fifty miles.
Figure 3.5. NCS scores of speakers in Utica.
As shown in Figure 3.6, five of the twelve communities can be placed with
confidence outside the Inland North region: Amsterdam, Oneonta,
Poughkeepsie, Plattsburgh, and Canton. Among thirty-nine speakers in these
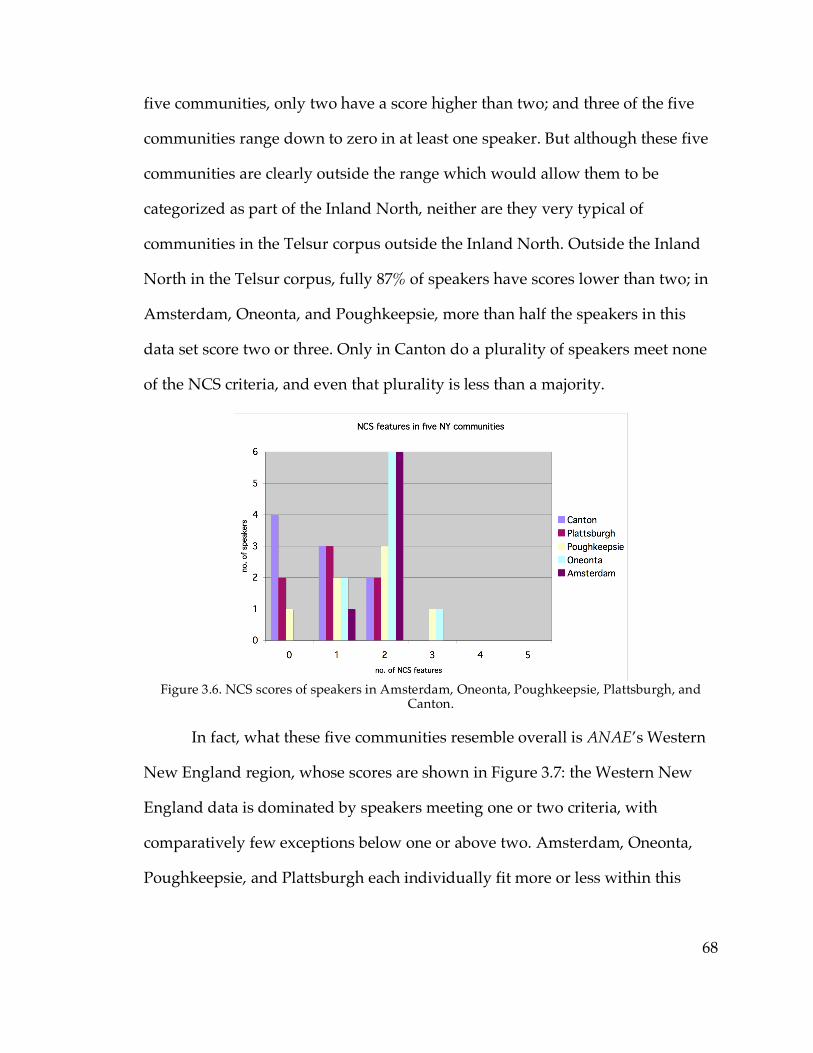
68
five communities, only two have a score higher than two; and three of the five
communities range down to zero in at least one speaker. But although these five
communities are clearly outside the range which would allow them to be
categorized as part of the Inland North, neither are they very typical of
communities in the Telsur corpus outside the Inland North. Outside the Inland
North in the Telsur corpus, fully 87% of speakers have scores lower than two; in
Amsterdam, Oneonta, and Poughkeepsie, more than half the speakers in this
data set score two or three. Only in Canton do a plurality of speakers meet none
of the NCS criteria, and even that plurality is less than a majority.
Figure 3.6. NCS scores of speakers in Amsterdam, Oneonta, Poughkeepsie, Plattsburgh, and
Canton.
In fact, what these five communities resemble overall is ANAE’s Western
New England region, whose scores are shown in Figure 3.7: the Western New
England data is dominated by speakers meeting one or two criteria, with
comparatively few exceptions below one or above two. Amsterdam, Oneonta,
Poughkeepsie, and Plattsburgh each individually fit more or less within this
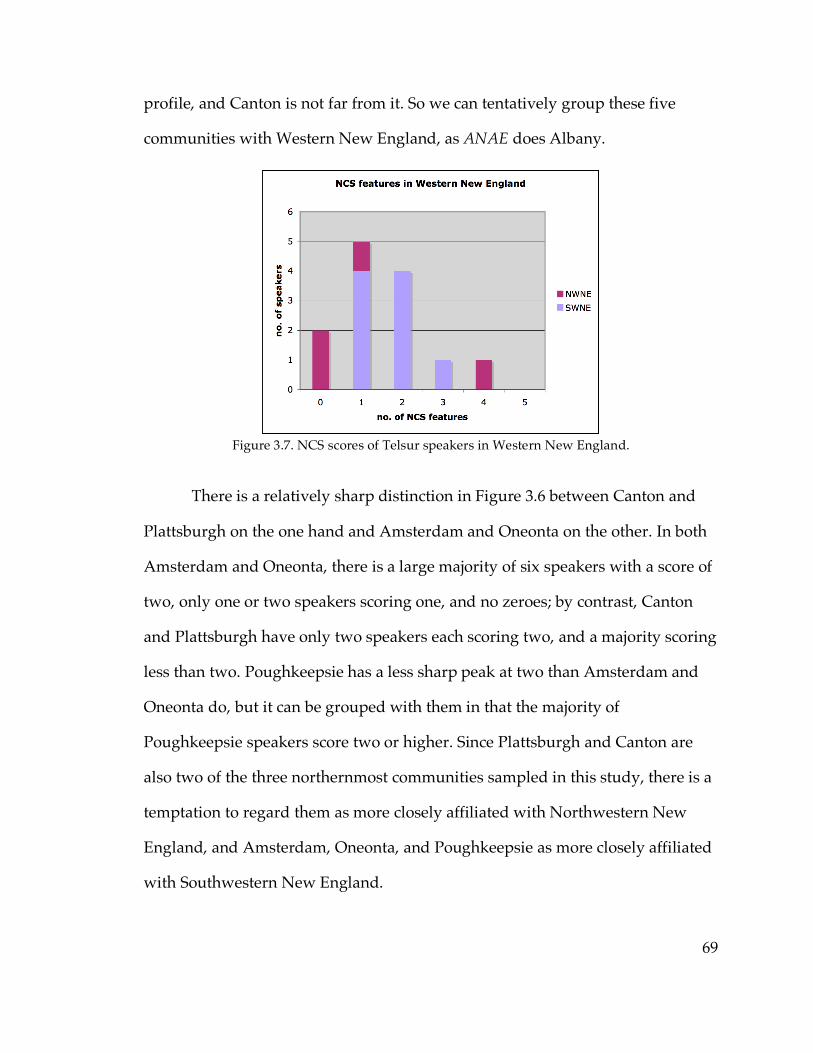
69
profile, and Canton is not far from it. So we can tentatively group these five
communities with Western New England, as ANAE does Albany.
Figure 3.7. NCS scores of Telsur speakers in Western New England.
There is a relatively sharp distinction in Figure 3.6 between Canton and
Plattsburgh on the one hand and Amsterdam and Oneonta on the other. In both
Amsterdam and Oneonta, there is a large majority of six speakers with a score of
two, only one or two speakers scoring one, and no zeroes; by contrast, Canton
and Plattsburgh have only two speakers each scoring two, and a majority scoring
less than two. Poughkeepsie has a less sharp peak at two than Amsterdam and
Oneonta do, but it can be grouped with them in that the majority of
Poughkeepsie speakers score two or higher. Since Plattsburgh and Canton are
also two of the three northernmost communities sampled in this study, there is a
temptation to regard them as more closely affiliated with Northwestern New
England, and Amsterdam, Oneonta, and Poughkeepsie as more closely affiliated
with Southwestern New England.
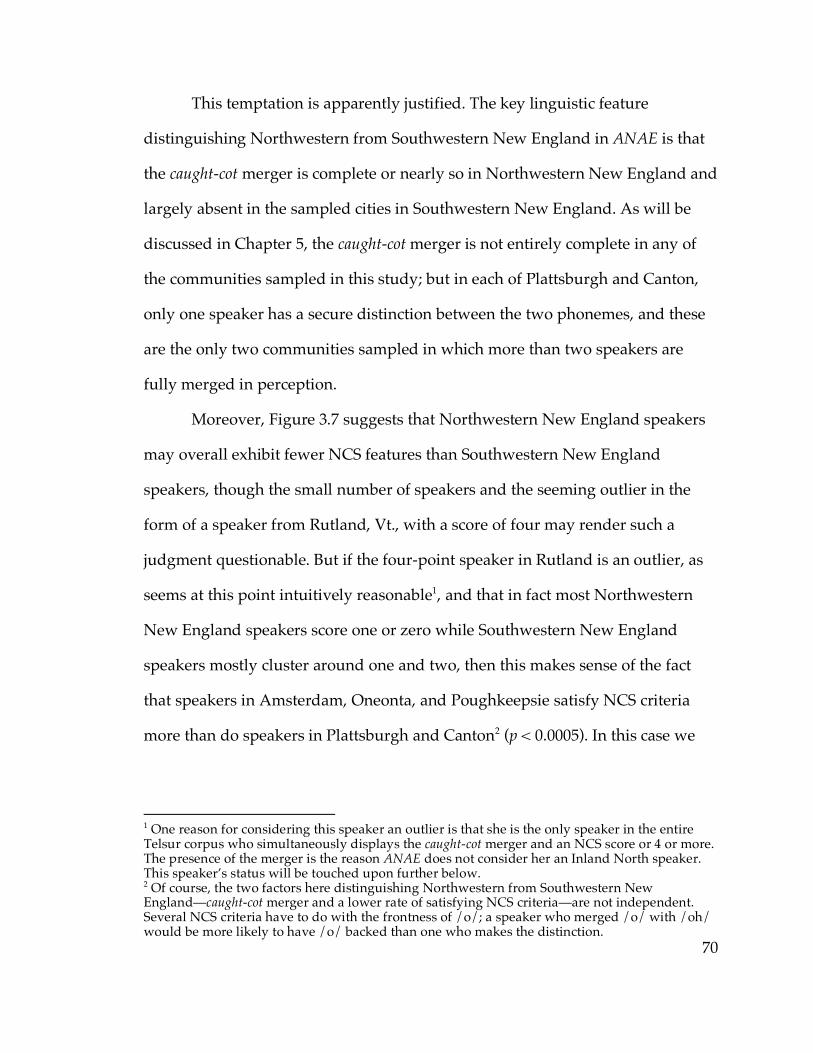
70
This temptation is apparently justified. The key linguistic feature
distinguishing Northwestern from Southwestern New England in ANAE is that
the caught-cot merger is complete or nearly so in Northwestern New England and
largely absent in the sampled cities in Southwestern New England. As will be
discussed in Chapter 5, the caught-cot merger is not entirely complete in any of
the communities sampled in this study; but in each of Plattsburgh and Canton,
only one speaker has a secure distinction between the two phonemes, and these
are the only two communities sampled in which more than two speakers are
fully merged in perception.
Moreover, Figure 3.7 suggests that Northwestern New England speakers
may overall exhibit fewer NCS features than Southwestern New England
speakers, though the small number of speakers and the seeming outlier in the
form of a speaker from Rutland, Vt., with a score of four may render such a
judgment questionable. But if the four-point speaker in Rutland is an outlier, as
seems at this point intuitively reasonable1, and that in fact most Northwestern
New England speakers score one or zero while Southwestern New England
speakers mostly cluster around one and two, then this makes sense of the fact
that speakers in Amsterdam, Oneonta, and Poughkeepsie satisfy NCS criteria
more than do speakers in Plattsburgh and Canton2 (p < 0.0005). In this case we
1 One reason for considering this speaker an outlier is that she is the only speaker in the entire Telsur corpus who simultaneously displays the caught-cot merger and an NCS score or 4 or more. The presence of the merger is the reason ANAE does not consider her an Inland North speaker. This speaker’s status will be touched upon further below. 2 Of course, the two factors here distinguishing Northwestern from Southwestern New England—caught-cot merger and a lower rate of satisfying NCS criteria—are not independent. Several NCS criteria have to do with the frontness of /o/; a speaker who merged /o/ with /oh/ would be more likely to have /o/ backed than one who makes the distinction.

71
can tentatively assign the former three cities to Southwestern New England, at
least by ANAE’s standards, and the latter two to Northwestern New England.
Figure 3.8. NCS scores of speakers in Gloversville, Glens Falls, Ogdensburg, and Watertown.
Figure 3.8 shows the scores of speakers in Gloversville, Glens Falls,
Ogdensburg, and Watertown. There are no speakers in the data from any of
these cities scoring zero or five. In each of the four cities, speakers’ scores range
between two and four, with the only exception being a single speaker in
Ogdensburg with a score of one. This distribution matches neither the Inland
North pattern (dominated by fives and fours with very few speakers below four)
nor the Western New England pattern (mostly between zero and two with very
few speakers above two); it seems to occupy a position intermediate between the
two patterns. Although there appear to be differences between these four cities—
Gloversville has a majority of speakers scoring four, and fewer scoring three or
two, while Watertown shows a majority of twos and fewer threes and fours—
these differences do not reach the level of statistical significance. These four cities
do, however, differ at the p < 0.05 level both from Utica and from the five
communities assigned above to the Western New England region. So it appears
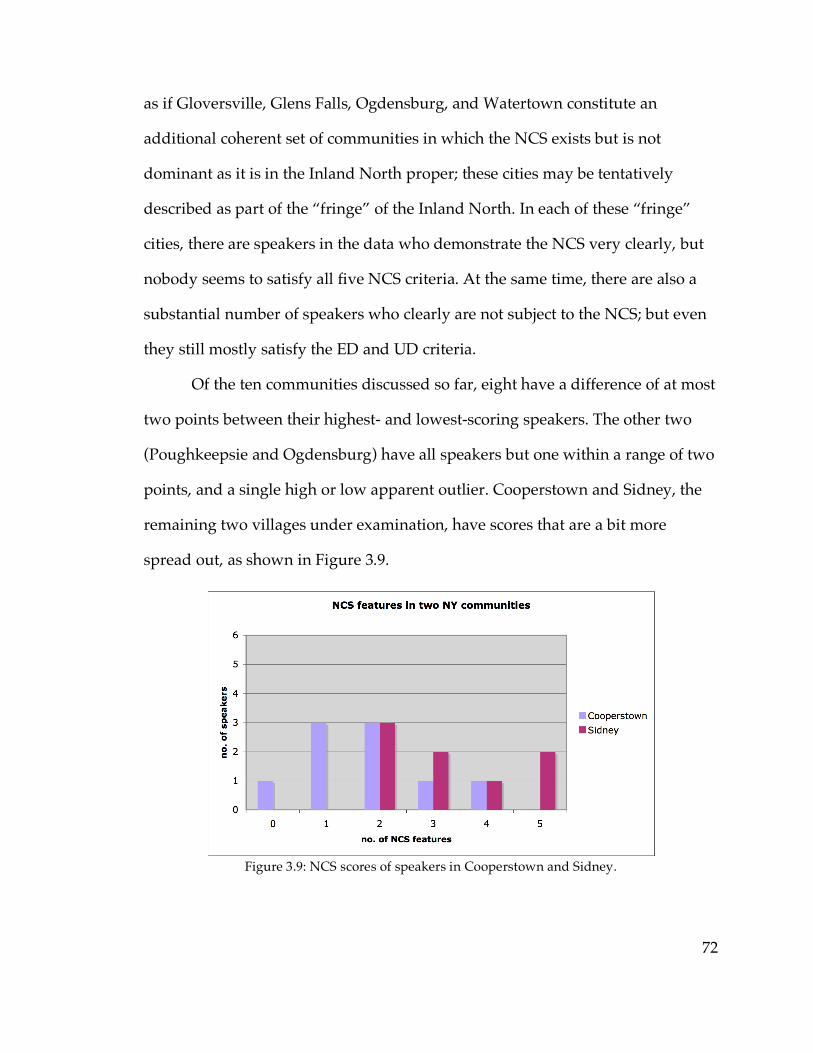
72
as if Gloversville, Glens Falls, Ogdensburg, and Watertown constitute an
additional coherent set of communities in which the NCS exists but is not
dominant as it is in the Inland North proper; these cities may be tentatively
described as part of the “fringe” of the Inland North. In each of these “fringe”
cities, there are speakers in the data who demonstrate the NCS very clearly, but
nobody seems to satisfy all five NCS criteria. At the same time, there are also a
substantial number of speakers who clearly are not subject to the NCS; but even
they still mostly satisfy the ED and UD criteria.
Of the ten communities discussed so far, eight have a difference of at most
two points between their highest- and lowest-scoring speakers. The other two
(Poughkeepsie and Ogdensburg) have all speakers but one within a range of two
points, and a single high or low apparent outlier. Cooperstown and Sidney, the
remaining two villages under examination, have scores that are a bit more
spread out, as shown in Figure 3.9.
Figure 3.9: NCS scores of speakers in Cooperstown and Sidney.
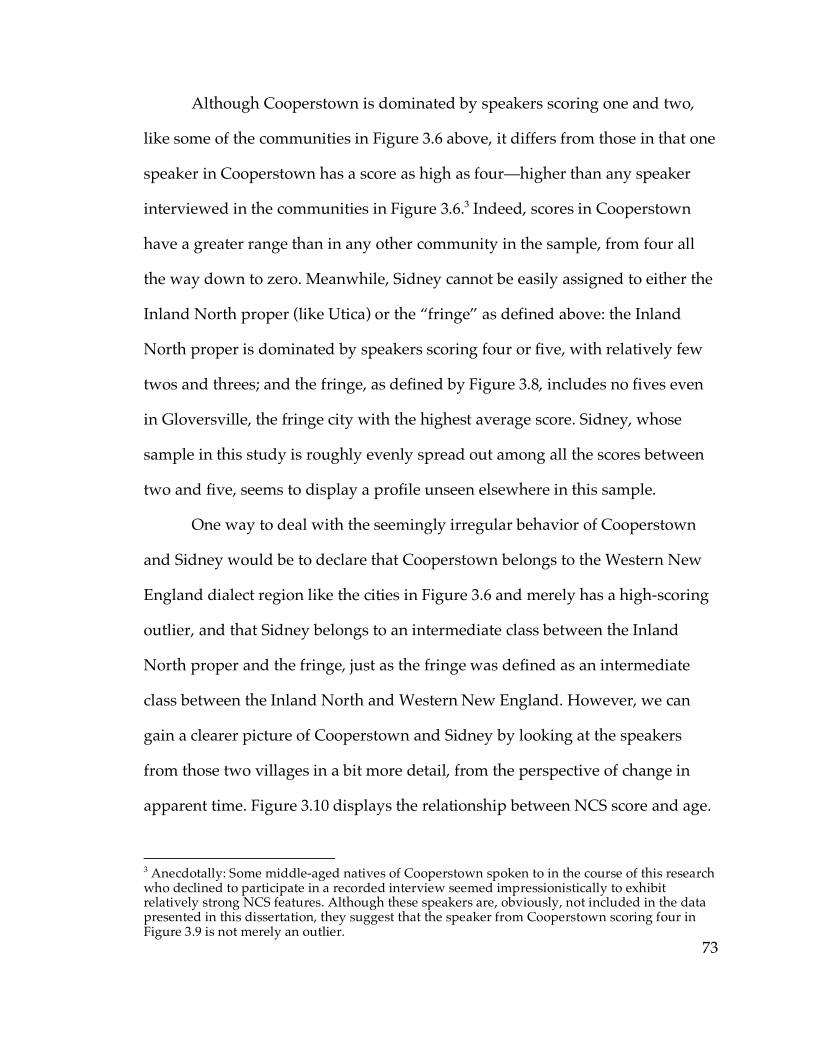
73
Although Cooperstown is dominated by speakers scoring one and two,
like some of the communities in Figure 3.6 above, it differs from those in that one
speaker in Cooperstown has a score as high as four—higher than any speaker
interviewed in the communities in Figure 3.6.3 Indeed, scores in Cooperstown
have a greater range than in any other community in the sample, from four all
the way down to zero. Meanwhile, Sidney cannot be easily assigned to either the
Inland North proper (like Utica) or the “fringe” as defined above: the Inland
North proper is dominated by speakers scoring four or five, with relatively few
twos and threes; and the fringe, as defined by Figure 3.8, includes no fives even
in Gloversville, the fringe city with the highest average score. Sidney, whose
sample in this study is roughly evenly spread out among all the scores between
two and five, seems to display a profile unseen elsewhere in this sample.
One way to deal with the seemingly irregular behavior of Cooperstown
and Sidney would be to declare that Cooperstown belongs to the Western New
England dialect region like the cities in Figure 3.6 and merely has a high-scoring
outlier, and that Sidney belongs to an intermediate class between the Inland
North proper and the fringe, just as the fringe was defined as an intermediate
class between the Inland North and Western New England. However, we can
gain a clearer picture of Cooperstown and Sidney by looking at the speakers
from those two villages in a bit more detail, from the perspective of change in
apparent time. Figure 3.10 displays the relationship between NCS score and age.
3 Anecdotally: Some middle-aged natives of Cooperstown spoken to in the course of this research who declined to participate in a recorded interview seemed impressionistically to exhibit relatively strong NCS features. Although these speakers are, obviously, not included in the data presented in this dissertation, they suggest that the speaker from Cooperstown scoring four in Figure 3.9 is not merely an outlier.
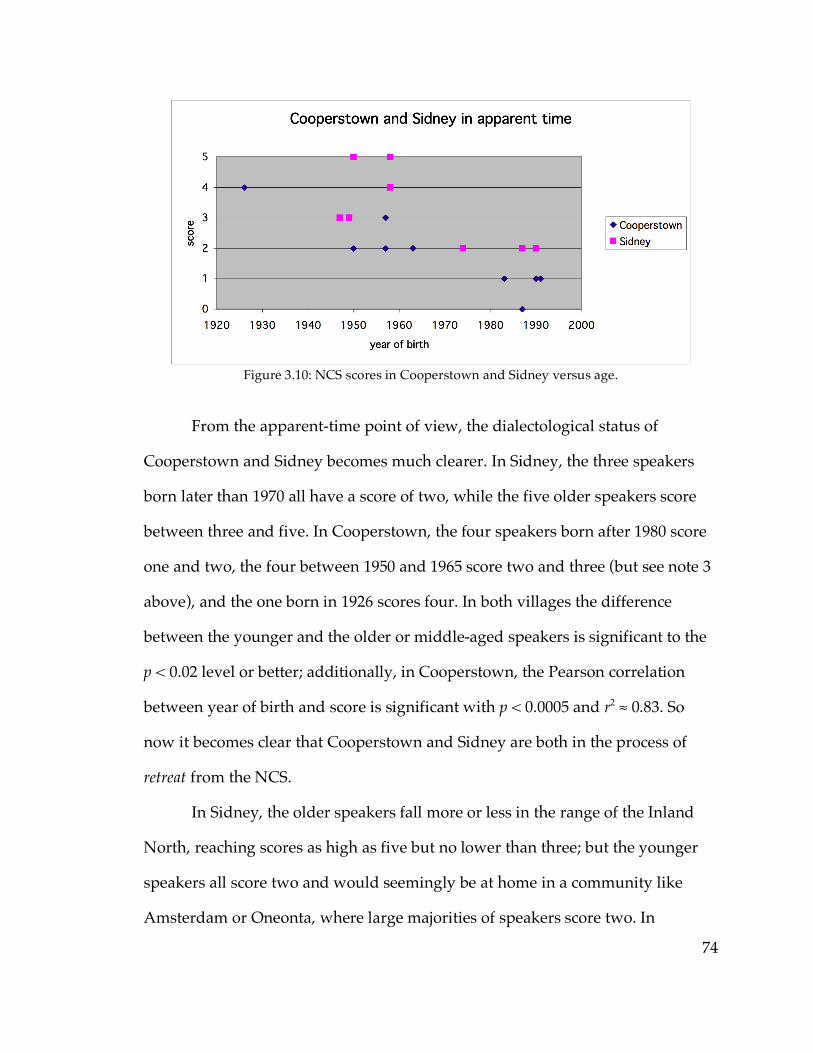
74
Figure 3.10: NCS scores in Cooperstown and Sidney versus age.
From the apparent-time point of view, the dialectological status of
Cooperstown and Sidney becomes much clearer. In Sidney, the three speakers
born later than 1970 all have a score of two, while the five older speakers score
between three and five. In Cooperstown, the four speakers born after 1980 score
one and two, the four between 1950 and 1965 score two and three (but see note 3
above), and the one born in 1926 scores four. In both villages the difference
between the younger and the older or middle-aged speakers is significant to the
p < 0.02 level or better; additionally, in Cooperstown, the Pearson correlation
between year of birth and score is significant with p < 0.0005 and r2 ≈ 0.83. So
now it becomes clear that Cooperstown and Sidney are both in the process of
retreat from the NCS.
In Sidney, the older speakers fall more or less in the range of the Inland
North, reaching scores as high as five but no lower than three; but the younger
speakers all score two and would seemingly be at home in a community like
Amsterdam or Oneonta, where large majorities of speakers score two. In
75
Cooperstown, the older speakers seem from this data to belong to an Inland
North fringe community, like Watertown, with scores between two and four; the
younger speakers all score below two, and in this respect are most similar to
places like Canton and Plattsburgh, which were assigned above to the
Northwestern New England region. The younger speakers in Cooperstown also
agree with Canton and Plattsburgh in showing direct effects of the caught-cot
merger; these three are the only communities in the sample in which more than
one speaker judged all /o/~/oh/ minimal pairs as the same. Meanwhile, the
merger is absent from the older speakers in Cooperstown; this will be discussed
in more detail in Chapter 5.
3.2.3. Change in apparent time
Now that change in progress has been found in Cooperstown and Sidney,
two villages with exceptionally spread-out score profiles, it is necessary to ask
whether change in apparent time exists in the other ten communities in this
study, and whether it should affect their categorization if change in progress is
found. All communities sampled have a range between oldest and youngest
speaker of at least 37 years (the smallest range is in Watertown), which is a wide
enough span that generational differences might be visible even in these small
samples. However, in Utica, if the oldest speaker is excluded, the remaining six
speakers only have a range of 10 years in age4; so with the age distribution of
4 Glens Falls is the next closest from this perspective: excluding the oldest speaker, the remaining six have an age range of 24 years.
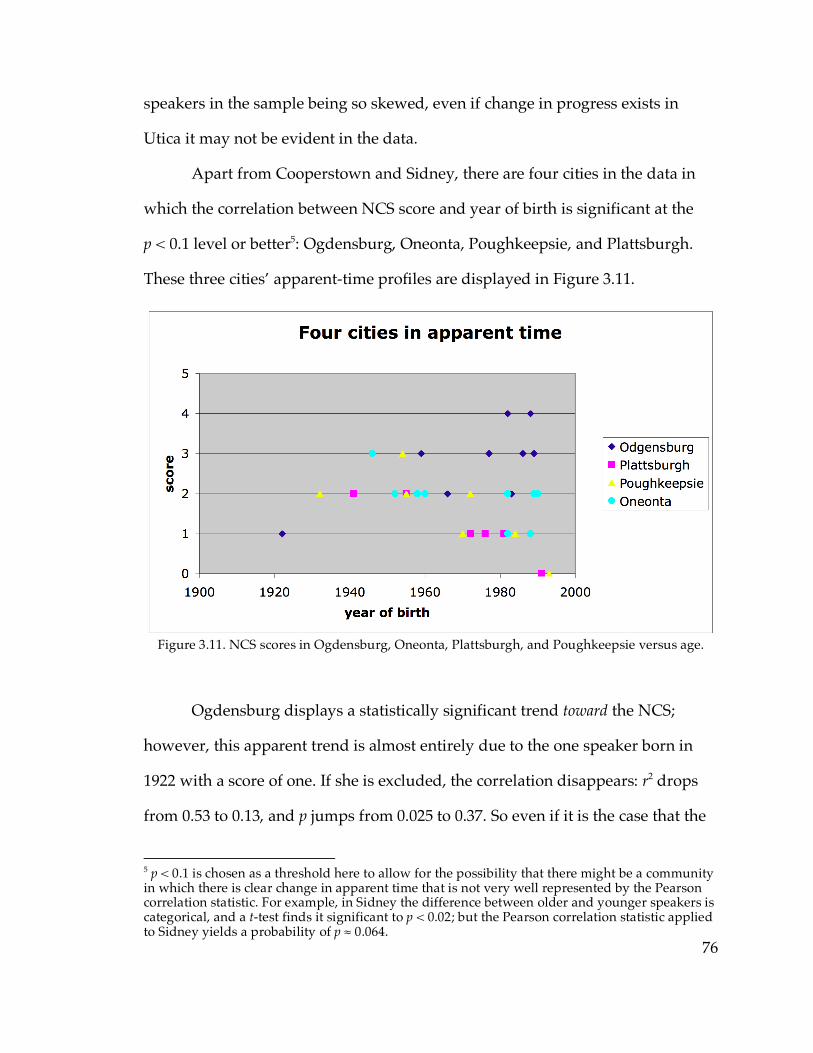
76
speakers in the sample being so skewed, even if change in progress exists in
Utica it may not be evident in the data.
Apart from Cooperstown and Sidney, there are four cities in the data in
which the correlation between NCS score and year of birth is significant at the
p < 0.1 level or better5: Ogdensburg, Oneonta, Poughkeepsie, and Plattsburgh.
These three cities’ apparent-time profiles are displayed in Figure 3.11.
Figure 3.11. NCS scores in Ogdensburg, Oneonta, Plattsburgh, and Poughkeepsie versus age.
Ogdensburg displays a statistically significant trend toward the NCS;
however, this apparent trend is almost entirely due to the one speaker born in
1922 with a score of one. If she is excluded, the correlation disappears: r2 drops
from 0.53 to 0.13, and p jumps from 0.025 to 0.37. So even if it is the case that the
5 p < 0.1 is chosen as a threshold here to allow for the possibility that there might be a community in which there is clear change in apparent time that is not very well represented by the Pearson correlation statistic. For example, in Sidney the difference between older and younger speakers is categorical, and a t-test finds it significant to p < 0.02; but the Pearson correlation statistic applied to Sidney yields a probability of p ≈ 0.064.
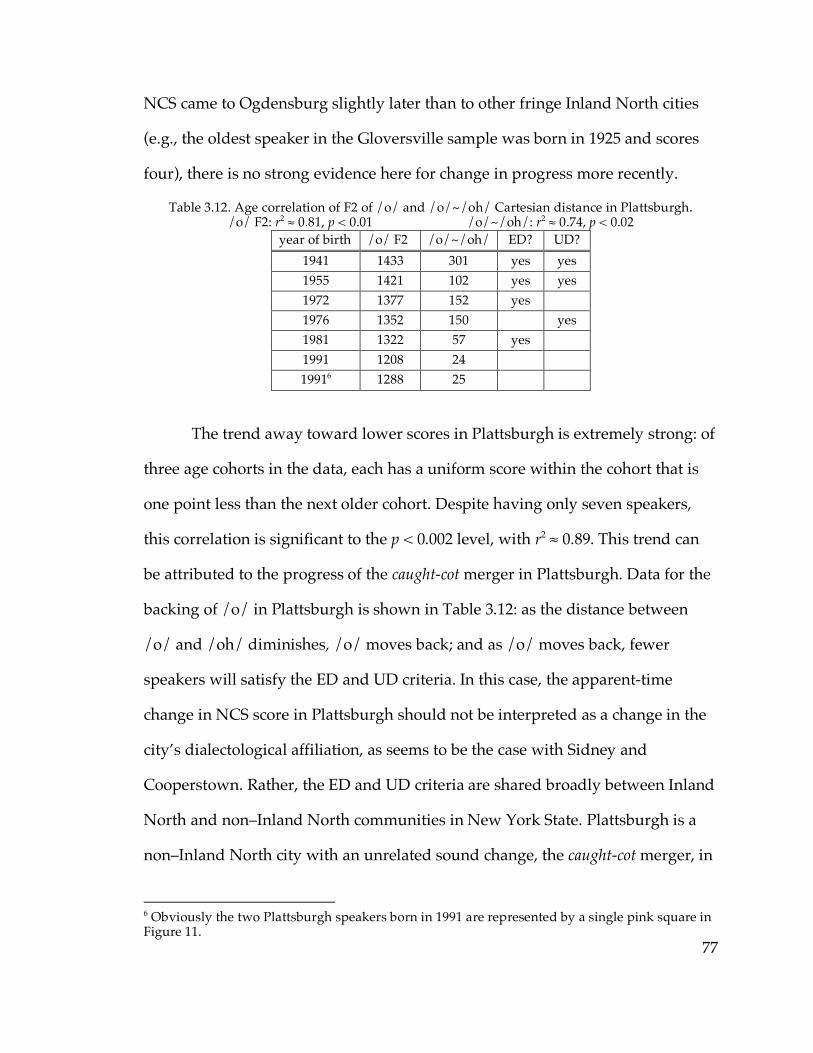
77
NCS came to Ogdensburg slightly later than to other fringe Inland North cities
(e.g., the oldest speaker in the Gloversville sample was born in 1925 and scores
four), there is no strong evidence here for change in progress more recently.
Table 3.12. Age correlation of F2 of /o/ and /o/~/oh/ Cartesian distance in Plattsburgh. /o/ F2: r2 ≈ 0.81, p < 0.01 /o/~/oh/: r2 ≈ 0.74, p < 0.02
year of birth /o/ F2 /o/~/oh/ ED? UD? 1941 1433 301 yes yes 1955 1421 102 yes yes 1972 1377 152 yes 1976 1352 150 yes 1981 1322 57 yes 1991 1208 24 19916 1288 25
The trend away toward lower scores in Plattsburgh is extremely strong: of
three age cohorts in the data, each has a uniform score within the cohort that is
one point less than the next older cohort. Despite having only seven speakers,
this correlation is significant to the p < 0.002 level, with r2 ≈ 0.89. This trend can
be attributed to the progress of the caught-cot merger in Plattsburgh. Data for the
backing of /o/ in Plattsburgh is shown in Table 3.12: as the distance between
/o/ and /oh/ diminishes, /o/ moves back; and as /o/ moves back, fewer
speakers will satisfy the ED and UD criteria. In this case, the apparent-time
change in NCS score in Plattsburgh should not be interpreted as a change in the
city’s dialectological affiliation, as seems to be the case with Sidney and
Cooperstown. Rather, the ED and UD criteria are shared broadly between Inland
North and non–Inland North communities in New York State. Plattsburgh is a
non–Inland North city with an unrelated sound change, the caught-cot merger, in
6 Obviously the two Plattsburgh speakers born in 1991 are represented by a single pink square in Figure 11.
78
an advanced state of progress; the merger, while affecting the ED and UD
criteria, does not really affect the city’s relationship (or lack thereof) to the Inland
North.
The correlation between year of birth and NCS score in Poughkeepsie
does not quite reach the level of statistical significance, with p ≈ 0.057, although r2
is a fairly high 0.55. Unlike in Sidney, a t-test does not find the difference
between the older and younger speakers’ scores to be statistically significant
either: the best result, comparing the three older with the four younger speakers,
yields p ≈ 0.052. Moreover, only one statistically significant age pattern emerges
from the individual NCS criteria and vowels: the two Poughkeepsie speakers
(out of seven) who do not satisfy the UD criterion are the youngest, born in 1984
and 1993; the other five speakers were born between 1932 and 1972. The age
difference between speakers satisfying and not satisfying UD in Poughkeepsie is
significant to p < 0.02. However, unlike in Plattsburgh, F2 of /o/ does not
display a significant correlation with age; neither does /ʌ/. Therefore, there is no
convincing reason to claim that Poughkeepsie in the process of changing its
dialectological status.
Oneonta has slightly more reason for us to suspect a change in apparent
time away from the NCS. Like in Poughkeepsie, older speakers’ scores range
between two and three, while younger speakers’ scores are two and below; but
the correlation between age and NCS score does not reach the level of statistical
significance (p ≈ 0.078), and t-tests do not find significant differences between
older and younger speakers either (best result: p ≈ 0.11). However, F2 of /o/ is
significantly correlated with age and backing in apparent time. Moreover,
79
although there is not a statistically significant Pearson correlation between age
and F1 of /æ/, a t-test finds that the three speakers with the highest /æ/ (i.e., the
lowest F1) are on average older than the speakers with lower /æ/ at the p ≈ 0.01
level. So there is some weak evidence for movement away from the NCS in
apparent time in Oneonta, resembling the somewhat more convincing trend
visible in the nearby village of Sidney; conceivably Oneonta is merely more
advanced in such a trend away from the NCS than Sidney is. However, this
evidence is not altogether convincing; the lowest /æ/ in Oneonta belongs to the
second-oldest speaker in the sample, and the backing of /o/ may, like in
Plattsburgh, have an independent cause. So for the time being I shall continue to
regard Oneonta as a non–Inland North community, but keep in mind the
possibility that it is merely in a late stage of abandonment of the NCS.
3.2.4. Summary of results from NCS scores
To sum up, then, according to the five NCS criteria used by Labov (2007),
the twelve cities examined so far can be categorized as follows: Utica belongs to
the Inland North, fully subject to the NCS. Amsterdam, Oneonta, Poughkeepsie,
Plattsburgh, and Canton are not subject to the NCS, although the UD and ED
criteria are frequently satisfied in them (unlike most non-NCS communities).
These five resemble ANAE’s Western New England region to an extent—
Amsterdam, Oneonta, and Poughkeepsie grouping with Southwestern New
England, and Plattsburgh and Canton with Northwestern New England.
Gloversville, Glens Falls, Ogdensburg, and Watertown belong to the “fringe” of
80
the Inland North: the NCS is present in these communities, but inconsistently so.
Cooperstown and Sidney are undergoing change in progress away from the
NCS: Sidney from a core Inland North community to one more like Amsterdam
and Oneonta; and Cooperstown from an Inland North fringe community to one
with less conformance to the NCS than any other in this study.
3.3. The EQ1 index
3.3.1 Definition and motivation
The five NCS criteria are a fairly blunt instrument for measuring the
participation of a speaker or community in the NCS. This is because they are
categorical criteria: for instance, the UD criterion is satisfied whenever mean /o/
is fronter than /ʌ/, regardless of how much fronter it is. In fact, ANAE and
Labov (2007) do not even appear to take note of whether the F2 difference
between /o/ and /ʌ/ is statistically significant when deciding whether a speaker
meets one of the five criteria; and for that reason, neither does the analysis
presented above.
To see why this is important, consider the vowel system of Dennis C., a
man in his 50s from Watertown who works as a museum caretaker, presented in
Figure 3.13. Dennis C. easily satisfies the ED, UD, and O2 criteria. However, his
mean F1 for /e/ is 697 Hz, and his mean F1 for /æ/ is 701 Hz—meaning he
misses satisfying the EQ and AE1 criteria by only 4 Hz and 1 Hz, respectively. It
is evident that Dennis C.’s /æ/ is quite raised, and no one would mistake it for a
low vowel. It is not raised as far as it could go—some NCS speakers have /æ/
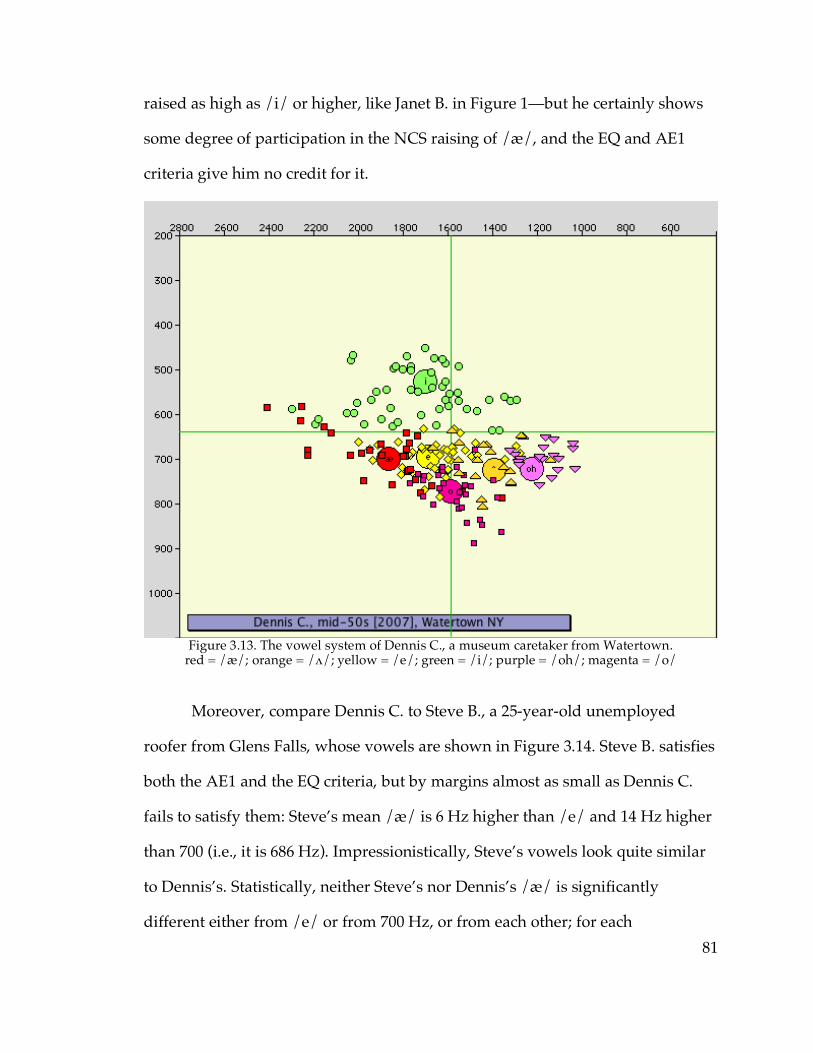
81
raised as high as /i/ or higher, like Janet B. in Figure 1—but he certainly shows
some degree of participation in the NCS raising of /æ/, and the EQ and AE1
criteria give him no credit for it.
Figure 3.13. The vowel system of Dennis C., a museum caretaker from Watertown.
red = /æ/; orange = /ʌ/; yellow = /e/; green = /i/; purple = /oh/; magenta = /o/
Moreover, compare Dennis C. to Steve B., a 25-year-old unemployed
roofer from Glens Falls, whose vowels are shown in Figure 3.14. Steve B. satisfies
both the AE1 and the EQ criteria, but by margins almost as small as Dennis C.
fails to satisfy them: Steve’s mean /æ/ is 6 Hz higher than /e/ and 14 Hz higher
than 700 (i.e., it is 686 Hz). Impressionistically, Steve’s vowels look quite similar
to Dennis’s. Statistically, neither Steve’s nor Dennis’s /æ/ is significantly
different either from /e/ or from 700 Hz, or from each other; for each
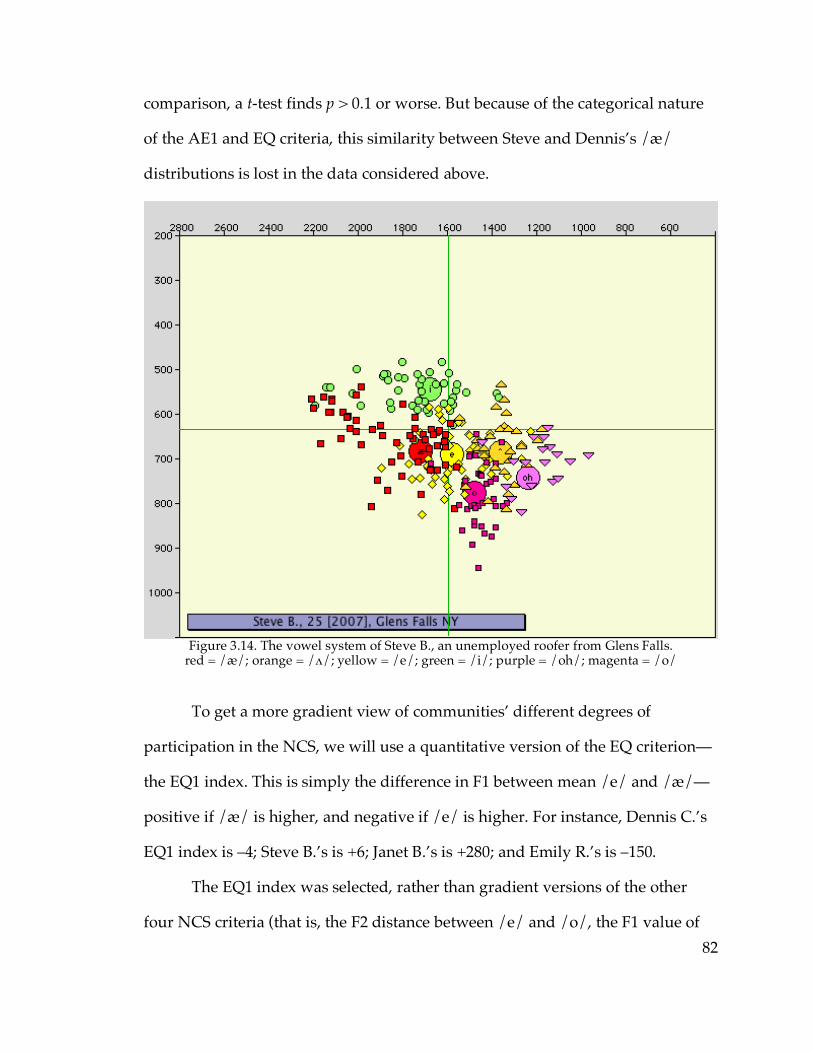
82
comparison, a t-test finds p > 0.1 or worse. But because of the categorical nature
of the AE1 and EQ criteria, this similarity between Steve and Dennis’s /æ/
distributions is lost in the data considered above.
Figure 3.14. The vowel system of Steve B., an unemployed roofer from Glens Falls.
red = /æ/; orange = /ʌ/; yellow = /e/; green = /i/; purple = /oh/; magenta = /o/
To get a more gradient view of communities’ different degrees of
participation in the NCS, we will use a quantitative version of the EQ criterion—
the EQ1 index. This is simply the difference in F1 between mean /e/ and /æ/—
positive if /æ/ is higher, and negative if /e/ is higher. For instance, Dennis C.’s
EQ1 index is –4; Steve B.’s is +6; Janet B.’s is +280; and Emily R.’s is –150.
The EQ1 index was selected, rather than gradient versions of the other
four NCS criteria (that is, the F2 distance between /e/ and /o/, the F1 value of
83
/æ/, and so on), for several reasons. First, the raising and tensing of /æ/ is often
described (by ANAE, for example) as the first stage of the NCS. If this is the case,
the presence of /æ/-tensing will be the most important diagnostic of the NCS: if
a community participates in the NCS at all, it ought to show some degree of
raising of /æ/. Moreover, if a speaker or community is still in an incipient stage
of the NCS, they may show a small degree of raising of /æ/ that might escape
coarse measures like the EQ and AE1 criteria but be visible quantitatively.
The distance in F1 between /æ/ and /e/ also shows greater variability
from community to community than do the quantitative equivalents of the other
four NCS criteria. According to an ANOVA analysis, the EQ1 index has an F
ratio greater than 10—that is to say, the differences in EQ1 index from
community to community are overall more than ten times as great as the
variation found within the individual communities. The other four quantitative
equivalents have F ratios between approximately 3 and 8, and therefore the EQ1
index does the best job of distinguishing between the communities sampled.7
Since the aim of this chapter is to group the communities into dialectological
categories, it will be most illuminating to focus on the index that makes the
sharpest distinctions between communities.
3.3.2 Results of the EQ1 index
Figure 3.15 displays the EQ1 indices of all 98 speakers in the twelve
communities being examined; Table 3.16 shows the mean EQ1 index for each 7 All of these F ratios are statistically significant at the p < 0.001 level or better—that is to say, there are significant differences between communities in all five gradient NCS criteria.

84
community. It is fairly clear from Figure 3.15 that the twelve communities in the
data are divided by the EQ1 index into two sets of six. In the six communities on
the left side of Figure 3.15—Utica, Gloversville, Sidney, Watertown, Glens Falls,
and Ogdensburg—all speakers in the data have EQ1 indices greater than –88. On
the right, in Oneonta, Cooperstown, Amsterdam, Canton, Poughkeepsie, and
Plattsburgh, all speakers in the data except one have EQ1 indices less than –37.
The average of these two limits is –62.5, which can serve as a rough boundary
between a “high” range of EQ1 indices, –62 and up, and a “low” range, –63 and
below. In the six communities on the left side of Figure 3.15, only six speakers
have low EQ1 indices; in the six communities on the right, only five speakers
have high EQ1 indices. This means a total of only eleven of these 92 speakers fall
on the “wrong” side of the –62.5 line between the high-EQ1 communities and the
low-EQ1 communities. So the distinction between the high- and low-EQ1
communities is a fairly clear one.
Figure 3.15. EQ1 indices for all speakers in communities with 7 or more speakers sampled. Communities are ordered from left to right by mean EQ1 index; within each community,
speakers are ordered by age, with the youngest on the left.
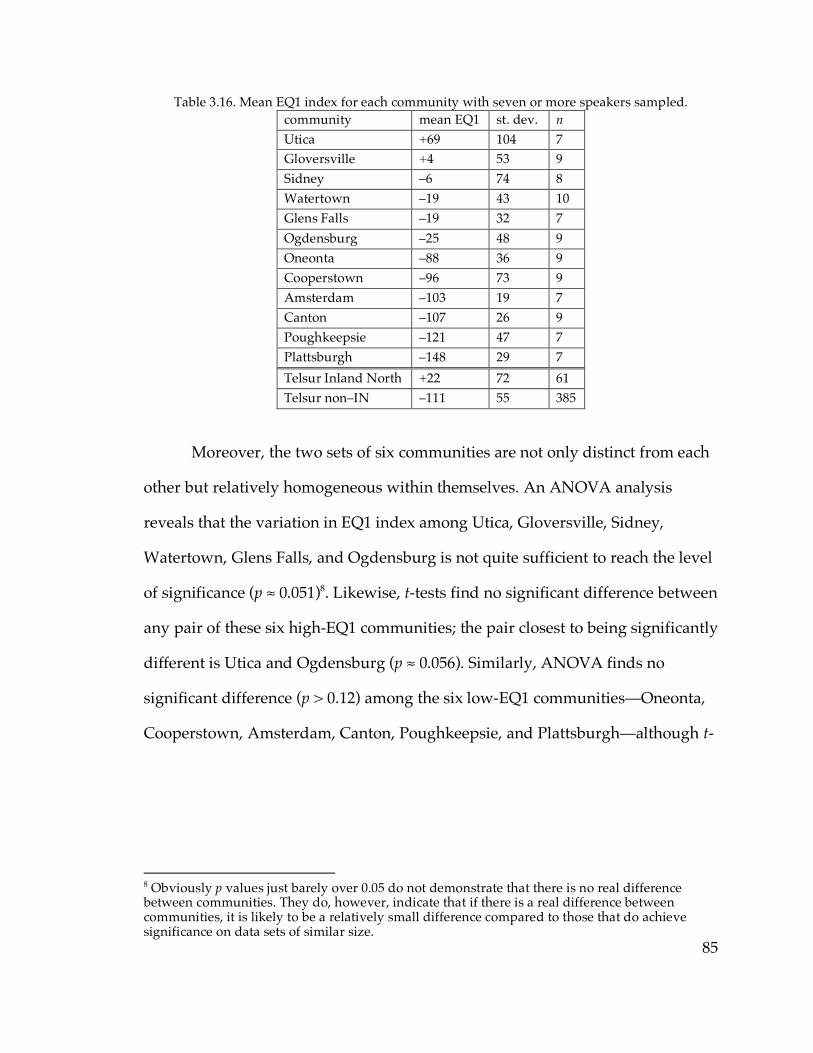
85
Table 3.16. Mean EQ1 index for each community with seven or more speakers sampled. community mean EQ1 st. dev. n Utica +69 104 7 Gloversville +4 53 9 Sidney –6 74 8 Watertown –19 43 10 Glens Falls –19 32 7 Ogdensburg –25 48 9 Oneonta –88 36 9 Cooperstown –96 73 9 Amsterdam –103 19 7 Canton –107 26 9 Poughkeepsie –121 47 7 Plattsburgh –148 29 7 Telsur Inland North +22 72 61 Telsur non–IN –111 55 385
Moreover, the two sets of six communities are not only distinct from each
other but relatively homogeneous within themselves. An ANOVA analysis
reveals that the variation in EQ1 index among Utica, Gloversville, Sidney,
Watertown, Glens Falls, and Ogdensburg is not quite sufficient to reach the level
of significance (p ≈ 0.051)8. Likewise, t-tests find no significant difference between
any pair of these six high-EQ1 communities; the pair closest to being significantly
different is Utica and Ogdensburg (p ≈ 0.056). Similarly, ANOVA finds no
significant difference (p > 0.12) among the six low-EQ1 communities—Oneonta,
Cooperstown, Amsterdam, Canton, Poughkeepsie, and Plattsburgh—although t-
8 Obviously p values just barely over 0.05 do not demonstrate that there is no real difference between communities. They do, however, indicate that if there is a real difference between communities, it is likely to be a relatively small difference compared to those that do achieve significance on data sets of similar size.
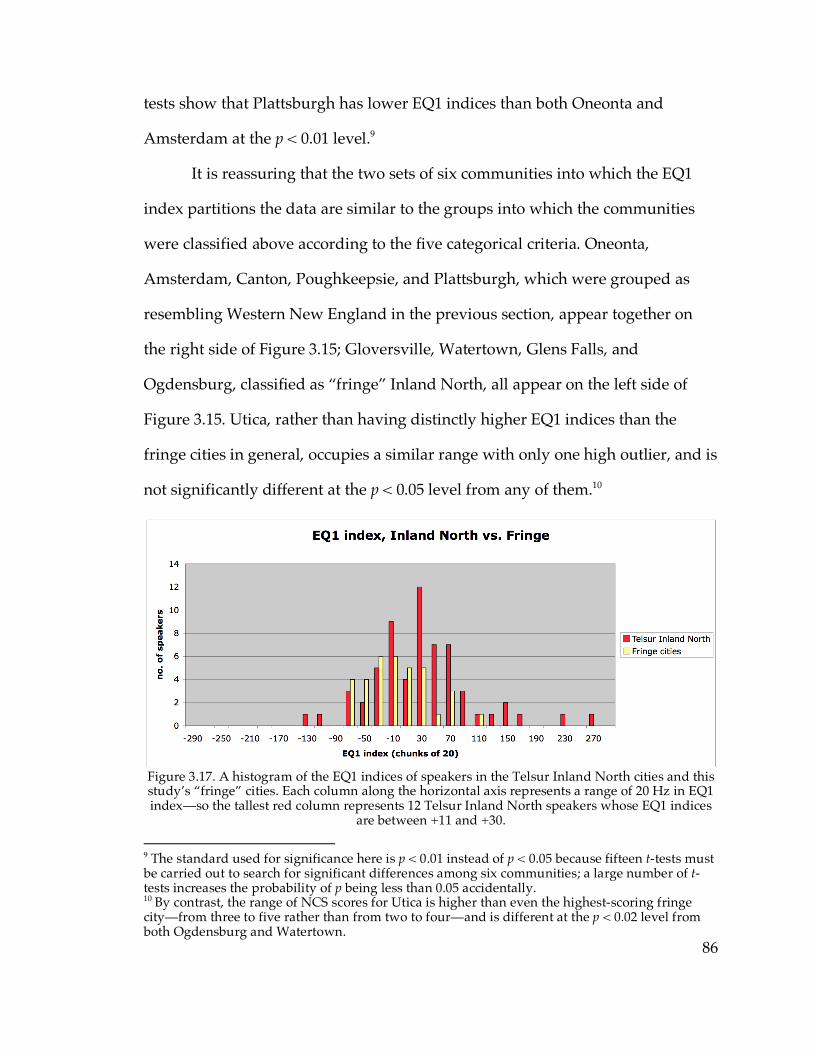
86
tests show that Plattsburgh has lower EQ1 indices than both Oneonta and
Amsterdam at the p < 0.01 level.9
It is reassuring that the two sets of six communities into which the EQ1
index partitions the data are similar to the groups into which the communities
were classified above according to the five categorical criteria. Oneonta,
Amsterdam, Canton, Poughkeepsie, and Plattsburgh, which were grouped as
resembling Western New England in the previous section, appear together on
the right side of Figure 3.15; Gloversville, Watertown, Glens Falls, and
Ogdensburg, classified as “fringe” Inland North, all appear on the left side of
Figure 3.15. Utica, rather than having distinctly higher EQ1 indices than the
fringe cities in general, occupies a similar range with only one high outlier, and is
not significantly different at the p < 0.05 level from any of them.10
Figure 3.17. A histogram of the EQ1 indices of speakers in the Telsur Inland North cities and this study’s “fringe” cities. Each column along the horizontal axis represents a range of 20 Hz in EQ1 index—so the tallest red column represents 12 Telsur Inland North speakers whose EQ1 indices
are between +11 and +30. 9 The standard used for significance here is p < 0.01 instead of p < 0.05 because fifteen t-tests must be carried out to search for significant differences among six communities; a large number of t-tests increases the probability of p being less than 0.05 accidentally. 10 By contrast, the range of NCS scores for Utica is higher than even the highest-scoring fringe city—from three to five rather than from two to four—and is different at the p < 0.02 level from both Ogdensburg and Watertown.
87
The fringe cities’ EQ1 indices justify identifying them as basically
affiliated with the Inland North region, rather than merely being an intermediate
category between the Inland North and Western New England that is not more
closely associated with either one. Figure 3.17 shows that, although the mean
EQ1 index of the fringe cities is slightly below that of the Telsur Inland North
sample, they are well within the general EQ1 distribution of the Inland North
overall; in fact, the mean EQ1 index of the fringe cities is –15, only half a
standard deviation below the mean of the Telsur Inland North speakers. So the
fringe cities can be identified as a set of communities which basically pattern as
part of the Inland North, but are slightly less advanced in its key NCS features
than the core Inland North region defined in ANAE.
Likewise, the five communities that were classified above as fitting more
or less within ANAE’s Western New England region in their NCS scores
resemble Western New England in EQ1 index as well. Figure 3.18 demonstrates
how the EQ1 indices of Oneonta, Amsterdam, Canton, Poughkeepsie, and
Plattsburgh (mean: –112) match the range of those of the thirteen Telsur speakers
from Western New England (mean: –88); although Western New England
appears to have a slightly higher mean, the difference is not significant. From
comparing Figures 3.17 and 3.18, whose horizontal axes are drawn to the same
scale, it is also clear that Western New England and these five cities in New York
do not lie within the general range of the Inland North. Indeed, the distribution
of EQ1 indices in Oneonta, Amsterdam, Canton, Poughkeepsie, and Plattsburgh
is typical of non–Inland North communities—the mean EQ1 index of the 373

88
Telsur speakers outside the Inland North and Western New England is –111,
almost exactly the same as these five New York communities.
Figure 3.18. A histogram comparing the EQ1 indices of the Telsur speakers in Western New
England with Oneonta, Amsterdam, Canton, Poughkeepsie, and Plattsburgh collectively.
3.3.3. Change in apparent time
Sidney and Cooperstown, the two villages identified above as undergoing
change in apparent time away from the NCS based on their NCS scores, do not
clearly exhibit the same behavior in the EQ1 index. Neither Sidney nor
Cooperstown exhibits a statistically significant Pearson correlation of EQ1 index
with year of birth or t-test contrast of EQ1 index between older and younger
speakers. In particular, in Sidney, all of the three speakers with positive EQ1
indices were born before 1960; but the t-test comparing older and younger
speakers’ EQ1 indices yields p ≈ 0.084. This does not necessarily indicate that
retreat from the raising of /æ/ over /e/ is not part of Sidney’s retreat from the
NCS as a whole. Indeed, there is a statistically significant difference between the
older and younger speakers’ F1 of /æ/ (p ≈ 0.03): the three younger speakers
89
average 785 Hz, and the five older speakers average 677 Hz. So the NCS raising
of /æ/ does appear to be being reversed in Sidney. However, the sparseness of
the data makes it difficult to get a clear picture of the status of the NCS in Sidney.
The younger speakers in Sidney have EQ1 indices between –32 and –80 and all
have NCS scores of 2, making them resemble the low end of the Inland North
fringe speakers and the high end of the Western New England–like communities;
the speakers are therefore not obviously classifiable between the two categories.
In Cooperstown, where the apparent-time change in progress of NCS
scores is much clearer than in Sidney, that change in NCS scores still doesn’t
translate into a significant correlation between EQ1 index and age. Cooperstown
does differ from the other low-EQ1 communities on the right side of Figure 3.15
in the presence of a high outlier: Cooperstown and Utica are the only
communities in the data to feature a speaker with an EQ1 index more than two
standard deviations away from the community mean; and Cooperstown is the
only one of the low-EQ1 communities to have a speaker with a positive EQ1
index (at +75, the fifth-highest EQ1 index in the entire 119-speaker data set,
outside the EQ1 range of non–Inland North communities and even on the high
side for the Inland North). Moreover, not only is the highest EQ1 index on the
right side of Figure 3.15 in Cooperstown, but the second-highest is as well, at –38.
So Cooperstown does appear to have more participation in NCS /æ/ raising
than the other low-EQ1 communities. Although there is no significant correlation
between age and EQ1 index in Cooperstown (r2 ≈ 0.33; p ≈ 0.11), there is a strong
correlation between height of /æ/ and age (r2 ≈ 0.73; p < 0.005). So in
Cooperstown, like in Sidney, there is change in progress away from the raising of
90
/æ/ which is not reflected to a statistically reliable degree in the EQ1 index—
perhaps because of noise introduced by random variation in F1 of /e/ (which,
however, is not itself visibly undergoing change in progress in either village.)
Cooperstown was described above as undergoing a change away from
being an Inland North fringe community like Watertown, on the basis that its
older speakers’ scores ranged between two and four. This diagnosis is less clear
from the perspective of the EQ1 index, however: While the older Cooperstown
speakers who score three and four have the two highest EQ1 indices (+75 and –
38, as mentioned above), the EQ1 indices of the three speakers who score two are
all below –95, well outside the range of even the lowest fringe city. This suggests
that by 30 years ago Cooperstown might already have not been a typical Inland
North fringe community; it had a much lower range of EQ1 indices even then. It
may have been a village mixed between NCS and non-NCS communities, or one
whose phonological system was already in flux. The strange status of
Cooperstown will be discussed further in Chapter 5.
It was conjectured above that Oneonta might be undergoing change in
away from the NCS, based upon some ambiguous apparent-time statistical
results for NCS score, F2 of /o/, and F1 of /æ/. In keeping with that conjecture,
Oneonta has the highest mean EQ1 index of any of the low-EQ1 communities on
the right side of Figure 3.15, and a statistically significant difference in mean age
(p < 0.005) between the four speakers with EQ1 indices below –100 and the five
above –100.11 The higher end of the range of EQ1 indices in Oneonta roughly
overlaps with the lower end of the ranges of Sidney and other high-EQ1
11 But not a significant difference in EQ1 index between older and younger speakers.
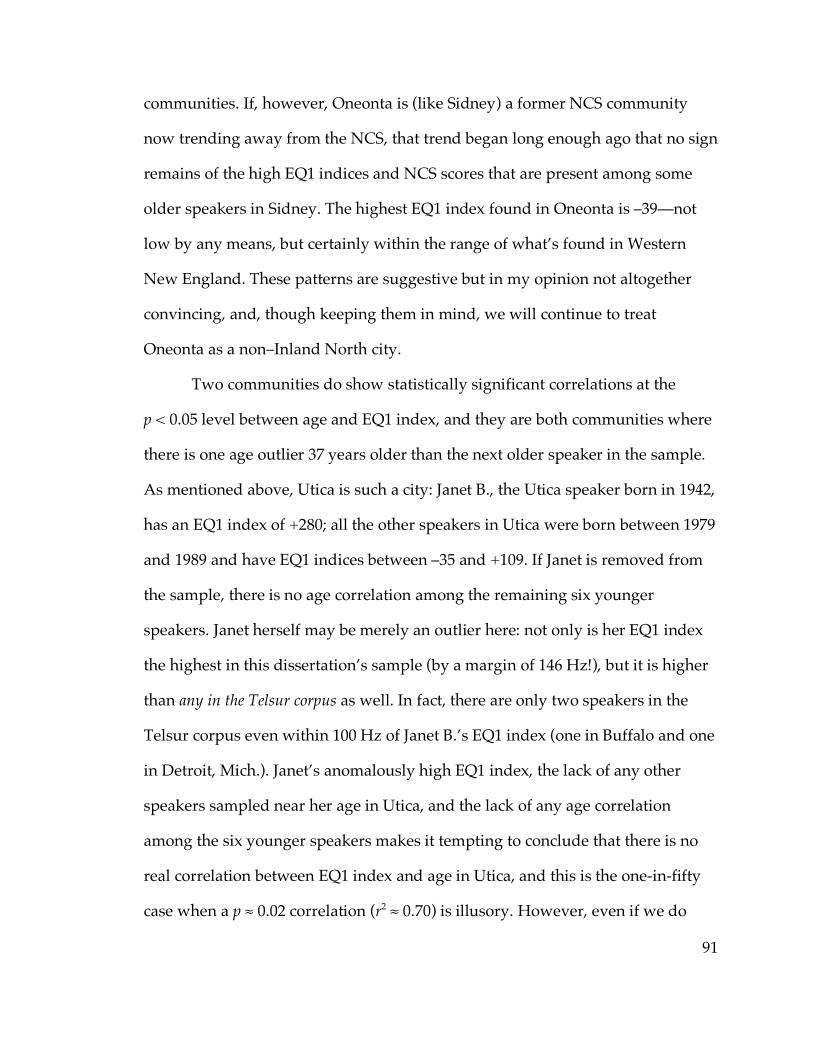
91
communities. If, however, Oneonta is (like Sidney) a former NCS community
now trending away from the NCS, that trend began long enough ago that no sign
remains of the high EQ1 indices and NCS scores that are present among some
older speakers in Sidney. The highest EQ1 index found in Oneonta is –39—not
low by any means, but certainly within the range of what’s found in Western
New England. These patterns are suggestive but in my opinion not altogether
convincing, and, though keeping them in mind, we will continue to treat
Oneonta as a non–Inland North city.
Two communities do show statistically significant correlations at the
p < 0.05 level between age and EQ1 index, and they are both communities where
there is one age outlier 37 years older than the next older speaker in the sample.
As mentioned above, Utica is such a city: Janet B., the Utica speaker born in 1942,
has an EQ1 index of +280; all the other speakers in Utica were born between 1979
and 1989 and have EQ1 indices between –35 and +109. If Janet is removed from
the sample, there is no age correlation among the remaining six younger
speakers. Janet herself may be merely an outlier here: not only is her EQ1 index
the highest in this dissertation’s sample (by a margin of 146 Hz!), but it is higher
than any in the Telsur corpus as well. In fact, there are only two speakers in the
Telsur corpus even within 100 Hz of Janet B.’s EQ1 index (one in Buffalo and one
in Detroit, Mich.). Janet’s anomalously high EQ1 index, the lack of any other
speakers sampled near her age in Utica, and the lack of any age correlation
among the six younger speakers makes it tempting to conclude that there is no
real correlation between EQ1 index and age in Utica, and this is the one-in-fifty
case when a p ≈ 0.02 correlation (r2 ≈ 0.70) is illusory. However, even if we do
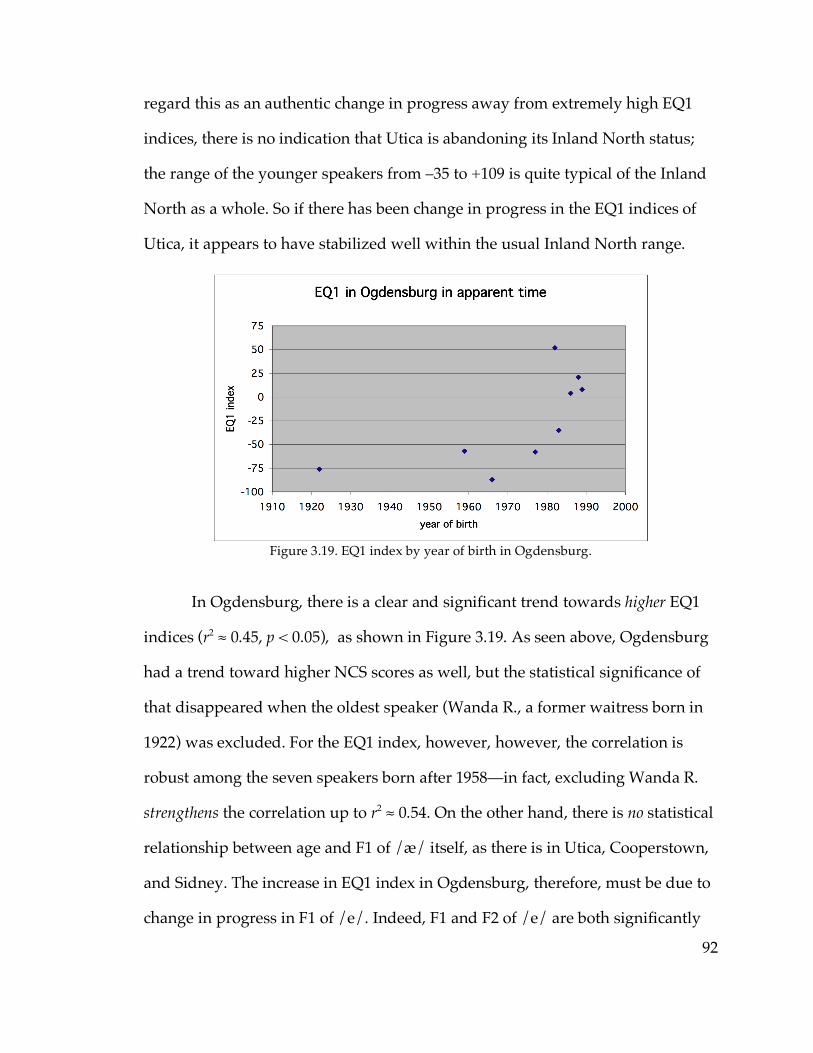
92
regard this as an authentic change in progress away from extremely high EQ1
indices, there is no indication that Utica is abandoning its Inland North status;
the range of the younger speakers from –35 to +109 is quite typical of the Inland
North as a whole. So if there has been change in progress in the EQ1 indices of
Utica, it appears to have stabilized well within the usual Inland North range.
Figure 3.19. EQ1 index by year of birth in Ogdensburg.
In Ogdensburg, there is a clear and significant trend towards higher EQ1
indices (r2 ≈ 0.45, p < 0.05), as shown in Figure 3.19. As seen above, Ogdensburg
had a trend toward higher NCS scores as well, but the statistical significance of
that disappeared when the oldest speaker (Wanda R., a former waitress born in
1922) was excluded. For the EQ1 index, however, however, the correlation is
robust among the seven speakers born after 1958—in fact, excluding Wanda R.
strengthens the correlation up to r2 ≈ 0.54. On the other hand, there is no statistical
relationship between age and F1 of /æ/ itself, as there is in Utica, Cooperstown,
and Sidney. The increase in EQ1 index in Ogdensburg, therefore, must be due to
change in progress in F1 of /e/. Indeed, F1 and F2 of /e/ are both significantly

93
correlated with age in Ogdensburg, as shown in Table 3.20. So the aspect of the
NCS that is still robustly in progress in Ogdensburg is not the raising of /æ/, but
the lowering and backing of /e/; the raising of /æ/ has apparently already gone
to completion. Ogdensburg is the only single community in the data in which F1
or F2 of /e/ is correlated with age at the p < 0.05 level.
Table 3.20. F1 and F2 of /e/ in Ogdensburg. F1: r2 ≈ 0.52, p < 0.03 F2: r2 ≈ 0.76, p < 0.005
year of birth /e/ F1 /e/ F2 1922 631 1968 1959 664 1721 1966 664 1601 1977 641 1744 1982 734 1582 1983 731 1493 1986 714 1566 1988 685 1643 1989 713 1464
3.4. Mapping the results
3.4.1. Summary of classification
To sum up, the NCS scores and EQ1 indices together allow us to
categorize the twelve communities with seven or more speakers sampled as
follows. The Inland North region, where the NCS has a major presence, can be
subdivided (in upstate New York, anyhow) into “core” and “fringe” areas. In the
core, all or nearly all speakers score three or more, while in the fringe, almost all
speakers score between two and four, placing the fringe intermediate in score
between the Inland North core and Western New England. The fringe agrees
with the Inland North core, however, in its distribution of EQ1 indices.
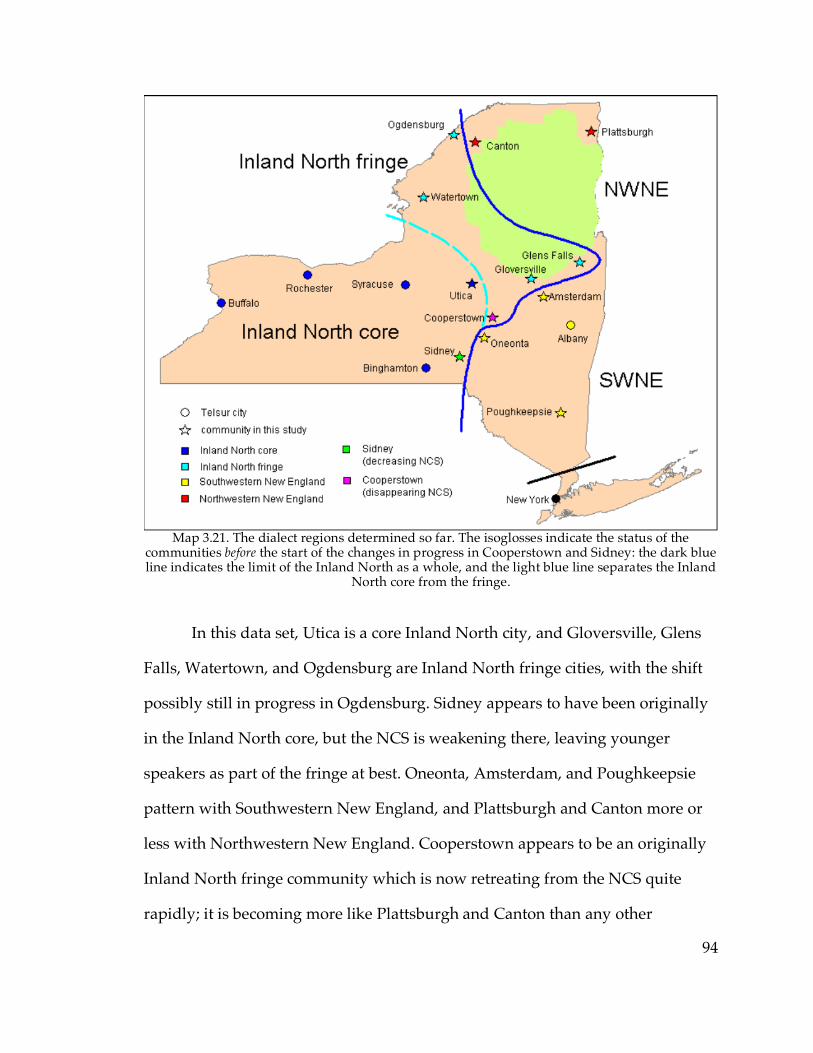
94
Map 3.21. The dialect regions determined so far. The isoglosses indicate the status of the
communities before the start of the changes in progress in Cooperstown and Sidney: the dark blue line indicates the limit of the Inland North as a whole, and the light blue line separates the Inland
North core from the fringe.
In this data set, Utica is a core Inland North city, and Gloversville, Glens
Falls, Watertown, and Ogdensburg are Inland North fringe cities, with the shift
possibly still in progress in Ogdensburg. Sidney appears to have been originally
in the Inland North core, but the NCS is weakening there, leaving younger
speakers as part of the fringe at best. Oneonta, Amsterdam, and Poughkeepsie
pattern with Southwestern New England, and Plattsburgh and Canton more or
less with Northwestern New England. Cooperstown appears to be an originally
Inland North fringe community which is now retreating from the NCS quite
rapidly; it is becoming more like Plattsburgh and Canton than any other
95
communities in this study, although it is not near the northern border of New
York like they are. Map 3.21 displays the dialect regions of Upstate New York as
determined by this analysis.
3.4.2. The Hudson Valley
ANAE does not identify any other dialect regions between the Inland
North and Western New England. The discussion so far in this chapter has more
or less agreed with that position, finding Amsterdam, Oneonta, and
Poughkeepsie to be relatively similar to Southwestern New England and Canton
and Plattsburgh relatively similar to Northwestern New England. However, the
southeastern boundary of the combined Inland North fringe and core regions on
Map 3.21, separating Sidney, Cooperstown, Gloversville, and Glens Falls on the
one hand from Oneonta and Amsterdam on the other hand, seems to correspond
roughly to the northeastern boundary of the Hudson Valley region determined
by Kurath (1949). Map 3.22 (previously shown as Map 1.3 in Chapter 1) is a copy
of Boberg (2001)’s reconstruction of the boundaries Kurath assigns to his Hudson
Valley dialect area and adjacent regions. The general location of the boundary
between regions 5 and 4 on Map 3.22 does indeed seem, impressionistically,
fairly similar to that of the boundary on Map 3.21 between the communities
associated with Southwestern New England so far in this chapter and those
assigned to the Inland North core or fringe. This suggests, of course, that it is the
same boundary; the lexical boundary of the 1940s has become a phonetic or
phonological boundary by the 2000s.
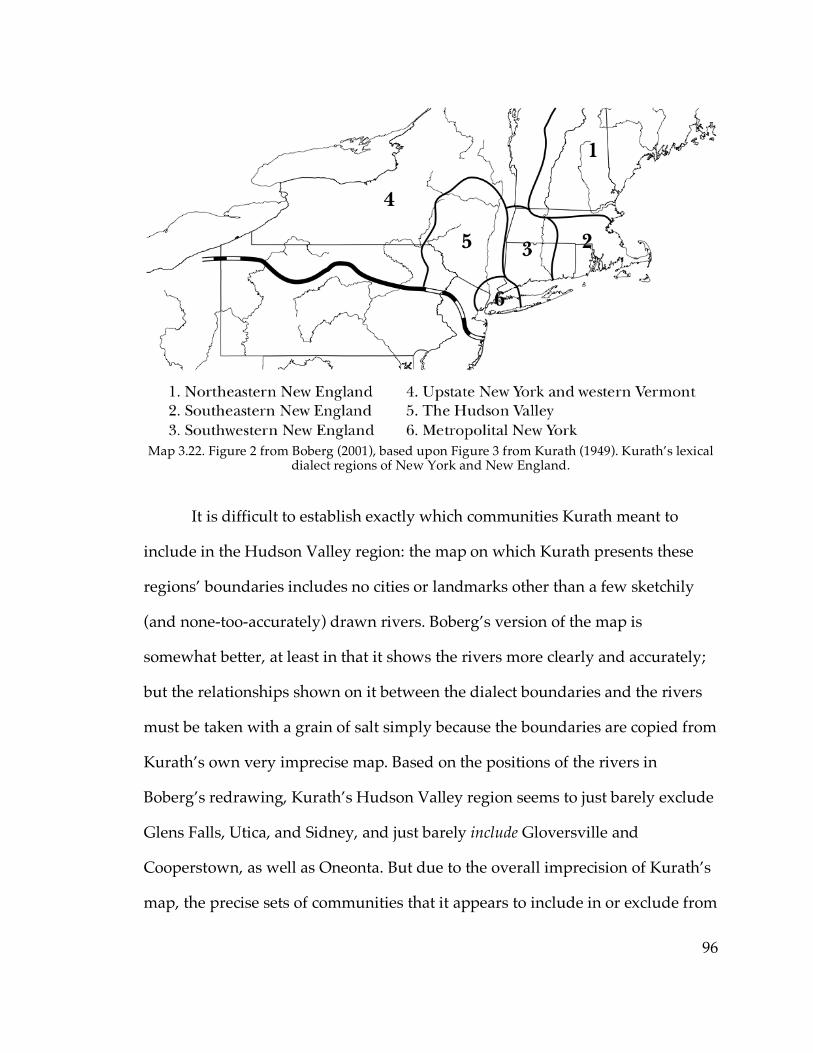
96
Map 3.22. Figure 2 from Boberg (2001), based upon Figure 3 from Kurath (1949). Kurath’s lexical
dialect regions of New York and New England.
It is difficult to establish exactly which communities Kurath meant to
include in the Hudson Valley region: the map on which Kurath presents these
regions’ boundaries includes no cities or landmarks other than a few sketchily
(and none-too-accurately) drawn rivers. Boberg’s version of the map is
somewhat better, at least in that it shows the rivers more clearly and accurately;
but the relationships shown on it between the dialect boundaries and the rivers
must be taken with a grain of salt simply because the boundaries are copied from
Kurath’s own very imprecise map. Based on the positions of the rivers in
Boberg’s redrawing, Kurath’s Hudson Valley region seems to just barely exclude
Glens Falls, Utica, and Sidney, and just barely include Gloversville and
Cooperstown, as well as Oneonta. But due to the overall imprecision of Kurath’s
map, the precise sets of communities that it appears to include in or exclude from

97
the Hudson Valley region are of less importance than the fact that the Hudson
Valley region seems to correspond fairly well as a general region to the area in
southeastern New York excluded from the Inland North fringe and core on Map
3.21, based on the communities sampled in this study.
These communities, of course, were found above to be overall relatively
similar to the ANAE Southwestern New England communities with respect to
the NCS features being examined; and so the question of whether a present-day
dialect boundary exists between the Hudson Valley and Southwestern New
England has yet to be answered. However, the similarity of Kurath’s Hudson
Valley boundary to the boundary on Map 3.21 suggests giving Kurath the benefit
of the doubt. In that spirit, we will take a cue from Kurath, and identify the
region containing Poughkeepsie, Amsterdam, and Oneonta—defined generally
as the area of New York state north of the New York City dialect region and
southeast of the Inland North fringe, showing NCS scores mostly around 2 and
relatively low EQ1 indices—as the Hudson Valley.
3.4.3. Boundaries and communication patterns
At first glance, Map 3.21 seems to indicate that there is a gradual
transition between the Inland North and Hudson Valley—from, for example,
Utica (core Inland North, full NCS) eastward to Gloversville (fringe Inland
North) to Amsterdam (non–Inland North, but with relatively high scores for a
non–Inland North city) to Albany and Western New England proper; or from
Binghamton (core) to Sidney (diminishing NCS) to Oneonta (weak indications of
98
diminishing NCS), and so on. Given the observations above that the Hudson
Valley appears phonologically similar to Southwestern New England, this is
consistent with Boberg (2001)’s conclusion that there is no phonological
difference between the Inland North and Southwestern New England. Thus the
Hudson Valley should be regarded as basically an extension of the Inland North
that the NCS hasn’t had its full effect on. But there are irregularities and
discontinuities in this picture which suggest that a gradual transition is not the
whole story.
Most noticeable is the irregularity in the border itself—the Inland North
fringe extends almost all the way to the Vermont border at Glens Falls; but
further north or south, at Plattsburgh, Albany, or Poughkeepsie, the NCS is not
found anywhere near so far east. Now, there’s no reason at all for a gradual
transition between the Inland North, the Hudson Valley, and Western New
England to imply that the outer boundary of the NCS must be at a uniform
distance from the edge of New York State at every latitude; but it still seems in
need of some explanation that at Glens Falls the fringe extends so much further
from the Inland North core than it seems to anywhere else. If the Inland North
fringe, as Boberg’s analysis might suggest, is merely the advancing expansion of
the NCS towards the Western New England territory that is open to it, then we
would expect the fringe to extend furthest from the core along the major routes
of communication and travel between the Inland North core and the Hudson
Valley—much as, in Illinois, NCS features are expanding outside of the Inland
North via the communities along Interstate 55 between Chicago and St. Louis
(Labov 2007).
99
In the case of the Inland North fringe, the chief route of east-west
communication and travel is either the New York State Thruway (Interstate 90)
or—if we allow for the eastward spread of NCS-like features earlier than the
NCS was first reported—the Erie Canal and Mohawk River, and the railroads
that follow the Canal. However, neither the Thruway nor the Erie Canal and
Mohawk River quite follow the direction of eastern extent of the Inland North
fringe. While the Thruway, Canal, and Mohawk, heading east from Utica, pass
through Amsterdam and Albany, the Inland North fringe bypasses both
Amsterdam and Albany and includes Gloversville and Glens Falls, both some
distance to the north. So the eastern edge of the Inland North does not support
the hypothesis of NCS features spreading from the east through a dialect
continuum that is phonologically open to it.
Another aspect of the relationship between Gloversville, Amsterdam, and
Albany seems to call into question the importance of present-day communication
patterns in determining the boundary of the Inland North. Gloversville and
Amsterdam are quite close together—less than 15 miles apart by road, with three
or four sparsely-populated towns in between them—and yet the difference
between them in this data set is fairly stark: Gloversville has the highest mean
score of any Inland North fringe city, while Amsterdam has no speakers scoring
above two; and the two cities’ EQ1 indices don’t overlap at all (Gloversville’s
lowest is –61 and Amsterdam’s highest is –75). Even more important than the
two cities’ mere proximity is their regional orientation, as reflected by the
interview subjects’ responses to questions about their local travel habits.
Gloversville and Amsterdam are both regionally affiliated with the Albany area:
100
residents of both cities watch television channels that broadcast out of Albany12,
read newspapers from Schenectady (which is midway between Albany and
Amsterdam on the Thruway), and travel to Albany and Schenectady to go
shopping. Each of the twelve in-person interview subjects in Amsterdam and
Gloversville reported frequent trips to Albany, Schenectady, or both.13 But
although Amsterdam and Gloversville are both part of the greater metropolitan
area of Albany and subject to Albany’s regional influence, Amsterdam is part of
the same general “Southwestern New England” dialect group as Albany and
Gloversville isn’t. Similarly, Oneonta appears to be regionally more oriented
toward Binghamton than toward Albany, and receives Binghamton and Utica
television stations, but does not appear to be subject to the NCS as Binghamton
and Utica are. So the present-day regional affiliations and communication
patterns of small and medium-sized Upstate New York cities are not a good
predictor of which will are included in the Inland North region and which aren’t;
the spreading of the NCS does not seem to be effectively determined merely by
channels of communication.
12 For example, the Time Warner Cable web site at timewarnercable.com lists almost the exact same set of channels available in Gloversville as in Amsterdam; all of the broadcast channels listed are licensed to Schenectady, Albany, or points even further east, except for one local station licensed to Gloversville. 13 By contrast, all but two said they very rarely or never go to Utica, the next closest larger city and the nearest known Inland North core community.
101
3.5. Settlement of the communities in the sample
3.5.1 Historians’ descriptions of settlement patterns
Kurath (1949) states that “there can be no doubting the fact that the major
speech areas of the Eastern States coincide in the main with settlement areas and
the most prominent speech boundaries run along the seams of these settlement
areas.” A striking example of this in Kurath (1939)’s work is the linguistic and
settlement boundary between Eastern and Western New England. As for the
topic of the current study, ANAE and Boberg (2001) contend that the settlement
history of upstate New York is important in explaining the origin of the NCS:
Boberg focuses on the role of western New England as a “staging ground” for
the Anglophone settlement of the Inland North to explain the phonological
similarity between the two regions, and ANAE argues that the tensing of /æ/
was made possible by the settlement boom drawn into central and western New
York by the construction of the Erie Canal. This suggests that the early settlement
history of the twelve communities examined so far in this chapter could
illuminate the distribution of dialect boundaries.
What is now New York State was founded in the 1620s as a Dutch colony
named New Netherland, and only came under English control in 1664. During
the New Netherland period, the Dutch founded towns along the Hudson River
that still exist today, including not only New York City (then called New
Amsterdam) but as far north as Schenectady and Albany (then called
Beverwyck). Even after the English gained control of the colony and changed its
name and that of its chief city to New York, the Dutch population remained
102
mobile and new towns were founded by Dutch settlers and their descendants.
Poughkeepsie is one such: it was first settled by Dutch families in the 1680s, and
Dutch was the main language of Dutchess County14, of which it is the seat, until
almost the 1770s (Platt [1905] 1987).
Amsterdam, although founded much later than the period of Dutch
colonial dominance, was another community subject to Dutch influence and
settled by the descendants of Dutch settlers, as its name suggests. Amsterdam
was founded in the late 18th century (Farquhar & Haefner 2006), and Dutch
families such as the Vedders and Hagamans were leaders of the community for
several decades (Donlon 1980). At the time when the name of the town was
changed from Veddersburg to Amsterdam in 1804, out of recognition for the
strong Dutch influence in the community, “the hamlet had acquired a
considerable population, with an almost equal proportion of Dutch and
Yankees” (Frothingham 1892b).
How, then, does Gloversville differ from Amsterdam? After the American
Revolutionary War in the 1770s, the location which would become Gloversville
was basically depopulated. The settlement which led to the present-day city was
not composed of descendants of the original Dutch New Netherland settlers, but
rather by westward migrants from New England: Frothingham (1892a) writes:
“The immigration was largely of Anglo-Saxon elements. The Dutch and Germans
of the Mohawk Valley were already dwelling upon richer lands. The New
Englander, however, was naturally restless.” In particular, “among the early
14 Despite the spelling, the name “Dutchess” has nothing to do with the Dutch; the county was named by the English in honor of the Duchess of York. The counties of New York State are shown on Map 1.4 in Chapter 1.

103
settlers the Connecticut influence seems to have been strongest. A large element
of the population came from the neighborhood of Hartford, and especially from
West Hartford.” So the difference between Gloversville and Amsterdam is in
their sources of settlement: while Amsterdam, like Albany and Poughkeepsie,
had from its earliest days a large and influential Dutch population, Gloversville
had very little influence from the early Dutch settlements of New York; its
population was derived mostly from New England in general and Connecticut in
particular. This supports Boberg’s conclusion that settlement from Western New
England supplied the necessary preconditions for the NCS in the Inland North—
in Gloversville, a city settled from Southwestern New England, the NCS is
present; in Amsterdam, with little or less Western New England settlement
history and substantial New Netherland Dutch influence, the NCS is absent.
This pattern can be tested on the other communities. The area that would
become Glens Falls was first settled in 1763 and 1783 by Quakers from Quaker
Hill in the present-day town of Pawling in Dutchess County (Brown 1963).
Although Dutchess County was part of the original Dutch settlement area, the
Quakers of Quaker Hill had settled there after migrating from New Milford and
Danbury, Connecticut (Hyde 1936). Moreover, beginning in 1784, Glens Falls had
additional settlers originating from Connecticut in addition to the Quaker Hill
Quakers, according to the Glens Falls Historical Association (1978): “Joining the
Quakers were Yankees, many from Connecticut, in a migration that went on
unabated until nearly 1850. For many of these sojourners, residence here was
temporary as families continued a westward trek” to western New York and
Michigan; this was the start of a “surge of growth” of the community. In other
104
words, Glens Falls was not only settled by people from Southwestern New
England, but those very same Southwestern New Englanders who would go on
from there to populate the core of the Inland North.
Utica was first settled in the 1790s, and by 1800 the population was “in
main part from New England” (Roberts 1911). Utica lies on the eastern edge of
Oneida County (of which it is the seat), and was part of the town of Whitestown
before it was incorporated as a separate town; Whitesboro, the town center of
Whitestown, lies three miles west of what is now the center of Utica. According
to Ryan (1983), “almost 90% of the pioneer families of Whitestown came from
Connecticut or Massachusetts.” Moreover, Durant (1878) suggests that the line
that became the eastern boundary of Utica and of Oneida County was drawn
deliberately in such a way as to exclude the nearby Dutch-origin settlements:
It is recorded by Dr. Bagg that, when Whitestown was erected into a separate township, the east line was located with the view of cutting off the Dutch inhabitants of Deerfield, leaving them still in the original district of German Flats. The line was located through the influence of Whitestown, which was settled by Yankees. When Oneida County was organized in 1798, the east line was located where it is at the present time.
So the earliest settlers of Oneida County in general were on the Yankee side of
the line separating the Yankees of Whitestown from the Dutch of German Flatts,
in Herkimer County.
Watertown, on the Black River in Jefferson County, was first settled in
1800 (Gould 1969), not long after Whitestown, Utica, and Oneida County
themselves were founded. The first landowners in Watertown came “mostly
from Oneida County” (Hough 1854), meaning Watertown’s early population
likewise came principally from the Southwestern New England Yankee side of

105
the Oneida-Herkimer county line. The web site of the city of Watertown15
describes the city as having been settled by “New England pioneers”.
The available information on Ogdensburg is slightly less detailed.
Merriam (1907) writes the following:
Between 1802–1807, the tide of emigration from New England poured into the Black and St. Lawrence River valleys, which, especially the former, settled with a rapidity seldom equalled[…]. A few of the first settlers with their families entered by the tedious and expensive waterway up the Mohawk to Fort Stanwix, now Rome, thence by canal through Wood Creek, Oneida River and Lake, Oswego River, Lake Ontario and the St. Lawrence to their destination. Others by the equally toilsome and more dangerous route from Lake Champlain up the St. Lawrence.
This does not state exactly what part of New England the preponderance of
Ogdensburg’s settlers came from. On the one hand, the migration via Rome, in
Oneida County, up the Mohawk River, suggests that those settlers were part of
the same stream of migration as that which settled Oneida County itself. Indeed,
Merriam seems to suggest that the St. Lawrence and Black River valleys were
settled as part of the same flow of population movement; with Ogdensburg on
the St. Lawrence and Watertown on the Black, this is consistent with the idea that
Ogdensburg, like Watertown, was settled largely by Southwestern New
England–origin populations. On the other hand, Merriam also mentions settlers
coming to Ogdensburg via Lake Champlain, on the Vermont–New York border,
which suggests migration from Northwestern New England. However, there is
at least some plausible evidence for Southwestern New England origins in
Ogdensburg’s population.
Thus Ogdensburg, Watertown, Utica, Glens Falls, and Gloversville—all of
the cities categorized in this paper as linguistically part of the Inland North core 15 http://www.citywatertown.org/index.asp?NID=411 , viewed on 19 December 2008.
106
or fringe—appear to have been settled predominantly from New England, and
most probably Southwestern New England. The communities which are
undergoing change in apparent time away from the NCS appear to be the same.
With respect to Cooperstown, Cooper (1838) himself writes “During the summer
of 1787, many more emigrants arrived, principally from Connecticut, and most of
the land on the patent was taken up.”
Sidney is located on the Susquehanna River at the northwestern corner of
Delaware County, and was part of the town of Franklin until it was incorporated
separately in 1801 (History of Delaware County 1880). Although Sidney is not
mentioned by name, in Murray (1898) we read the following:
The great mass of the early settlers in Delaware county were from New England.... From the earliest times there was a continuous stream of emigration from the colonies and states of New England, first into eastern New York, then into western New York, and still later into Ohio, Indiana, Illinois and farther west. There was a time, just subsequent to the Revolutionary war, when many of these restless and adventurous New Englanders sought homes near the headwaters of the Susquehanna and the Delaware rivers. The immense town of Franklin which at its organization contained thirty thousand acres of land was largely settled by New Englanders. Sluman Wattles the first settler came thither from Connecticut in 1785 accompanied by his brothers and sisters, and followed by numerous friends who rapidly built up a thriving and intelligent community.... This auspicious beginning led many other New England families who were seeking new homes to come into the valleys of the Delaware and the Susquehanna.
So Delaware County in general was settled from New England. As for Sidney in
particular, the History of Delaware County (1880) lists the names of 29 pioneer
settlers and settler families of Sidney, and mentions the origins of seven of them.
Although one early Sidney family, the Sliters, was descended from the New
Netherland Dutch, four of the seven are described as having come from
Connecticut. One of the remaining two, Jonathan Carley, is described as having
come from Dutchess County; however, the Delaware County Genealogy and
107
History web site displays a transcript of his 1832 war pension application16
describing him as a native of Wilton, Connecticut before he moved to Dutchess
County. The seventh, Isaac Hodges, is described as having come from the town
of Florida in Montgomery County, New York, near Amsterdam; but a posting17
on the genealogy web site Ancestry.com indicates that he was born in Connecticut
as well. Among the 22 named settlers of Sidney whose geographical origins are
not mentioned in the History of Delaware County, one is described as a cousin of
the above-mentioned Sluman Wattles, who was from Connecticut; another is
Jacob Bidwell, the first permanent settler of Sidney Center, who is listed on
another genealogy web site18 as a native of Connecticut. So it seems that we can
state with some confidence that the earliest settlers of Sidney, like those of
Cooperstown, were predominantly from Connecticut.
So, all of the communities in which the NCS is found in this study derived
their early settlement primarily from New England, probably Southwestern New
England. Among the non-NCS communities, Poughkeepsie and Amsterdam are
both discussed above; Poughkeepsie was settled by Dutch families and
Amsterdam was at least half Dutch in its early population. Plattsburgh’s early
settlers, as listed by Hurd (1880), seem to have been principally from Long
Island. Of Oneonta, Campbell (1906) writes “The first settlers were mostly
German Palatinates from Schoharie and the Mohawk”; the web site of the city of
Oneonta19 agrees with Campbell but adds the Dutch, saying “The first settlers to
16 http://www.dcnyhistory.org/milpensioncarleyjonathan.html, viewed on 21 December 2008. 17 http://archiver.rootsweb.ancestry.com/th/read/HODGE/2006-01/1138520071, viewed on 21 December 2008. 18 http://familytreemaker.genealogy.com/users/k/i/r/Kristen-Kirk-vantassle-IL/GENE3-0009.html, viewed on 21 December 2008. 19 http://www.oneonta.ny.us/oneonta/historic.asp, viewed on 21 December 2008.
108
make this area their home were Palatine Germans and Dutchmen from the
Schoharie and Mohawk Valleys.” Neither source lists New England as a major
origin for the settlers of Oneonta, although a few of the individual Oneonta
pioneers listed by Campbell have New England origins (just as one of the
principal pioneers of Sidney has a Dutch background).
Canton is the fifth non-NCS community in this study, but unlike the four
discussed in the preceding paragraph, it in fact was settled from New England.
In particular, Hough (1853) writes of Canton that “in 1802, the town began to
settle rapidly[…] most of them with families, and from Vermont”. It is
unsurprising to find that Canton was settled from Vermont, of course; Canton
has been assigned in this chapter to the Northwestern New England dialect
region, which to date has been described (Boberg 2001) as consisting essentially
of western Vermont. So, unlike the preponderance of Inland North communities,
which were clearly settled from Southwestern New England, Canton’s settlement
was derived principally from Northwestern New England. So, although the
status of Ogdensburg is slightly unclear from the historical data, if we make the
plausible conjecture that Southwestern New England was the principal basis of
its settlement20, we find the boundary of the NCS corresponds to the boundary of
Southwestern New England settlement.
20 The issue of Ogdensburg will be revisited below.

109
3.5.2. Communication patterns and villages
Inasmuch as the settlement described in the previous subsection took
place in the early 19th century, 150 years before the NCS was first described, it is
remarkable how stable the outer boundary of the Inland North must have been
since that time, especially in the face of communication patterns crossing the
boundary. However, the boundary is not completely stable; we can see
communities in the data in which the NCS appears to be clearly receding in
apparent time. Of the seven communities examined so far in this chapter where
the NCS is attested, there are two where this trend is clear: Cooperstown and
Sidney, both villages of less than 6,000 people. The other NCS communities are
all cities of at least 12,000 people (Ogdensburg is the smallest).
This suggests a possibility that the Northern Cities Shift, as its name
suggests, is only stable in cities, and villages in general retreat from it. This
hypothesis per se seems extremely implausible—why should a hypothetical
village in the middle of the Inland North core region, with no substantial contact
with communities outside the Inland North, be expected to spontaneously
abandon the NCS? Fortunately, there is a more plausible explanation for Sidney
and Cooperstown’s retreat from the NCS than merely that they are villages: they
are both within 25 miles of Oneonta, which for both villages functions as the
nearest city to which people travel for shopping, entertainment, and so on. 21 So it
may be that while regional affiliation and contact with a major city does not
visibly diminish the NCS in a medium-sized city (like Gloversville with respect 21 The NCS has clearly diminished more rapidly and completely in Cooperstown than in Sidney; the difference between these two villages will be explored further in Chapter 5.
110
to Albany), contact with a medium-sized city like Oneonta can diminish the NCS
in small villages that are regionally affiliated with it. To put it another way,
regional affiliation can affect the NCS on the narrow local level of villages
dependent upon nearby cities for commerce and the like, but not on the broader
level of regional contacts between communities with their own commercial
development. A small city may be more easily able to exert its dialectological
influence on villages that are dependent on it than a large city can on smaller
cities within its general region.
3.5.3. Interpreting the boundary between Ogdensburg and Canton
If the linguistic boundary is to match up entirely with the settlement
history, what must be shown is that Ogdensburg was also settled principally
from Southwestern, rather than Northwestern (or conceivably Eastern), New
England. Sadly, the available data does not appear to clearly indicate what part
of New England the preponderance of the settlers of Ogdensburg came from.
The circumstantial evidence of the route via Oneida County suggests that
Southwestern New England played at least some role. The route via Lake
Champlain suggests migration from Vermont as well, like that in the settlement
of Canton; however, the relative magnitudes of these two paths to Ogdensburg is
not discussed by Merriam (1907). Moreover, the Lake Champlain path is also in
principle consistent with migration from Southwestern New England—it would
be a plausible path for a migrant from Connecticut to Ogdensburg to first go
north to Lake Champlain and then turn west towards Ogdensburg.

111
The long campaign discussed by Hough (1853) to get a road built to
connect Ogdensburg with Oneida County is not probative in either direction: the
settlers of Ogdensburg might have wanted a road connection to Oneida County
because heavy migration from Oneida County to Ogdensburg made it desirable
to make the route easier to travel; or because travel between Oneida County and
Ogdensburg had been so difficult as to have prevented substantial migration up to
that point. So there appears to be no clear evidence of whether Ogdensburg was
principally settled from northwestern or southwestern New England. Hough
(1853) reports that an 1839 fire at Ogdensburg destroyed the town records, which
may contribute to the difficulty here.
Ogdensburg is less than twenty miles from Canton; both are in St.
Lawrence County. The nearest larger city in New York22 to both of them is
Watertown, about 60 miles away from each; residents of Ogdensburg and
Canton report roughly the same travel patterns to Watertown and the nearby St.
Lawrence County villages of Potsdam and Massena, much as Gloversville and
Amsterdam display roughly the same travel patterns to Albany and
Schenectady. Given that, there are two explanations for the linguistic difference
between Ogdensburg and Canton that would be easily consistent with the other
cities considered in this study. The first is merely that Ogdensburg was in fact
principally settled from Southwestern New England, and the difference in
settlement history accounts for the presence of the NCS in Ogdensburg (like in
22 Ottawa, in the Canadian province of Ontario, is about the same distance from Ogdensburg as Watertown is, and slightly farther from Canton. The population of Ottawa is about 34 times that of Watertown.
112
the other Southwestern New England–settled communities) and its absence in
Canton.
The other plausible explanation is that Ogdensburg, like Canton, was
settled from Northwestern New England, and both Northwestern and
Southwestern New England–origin settlements are both potentially subject to the
NCS; but Canton either lost the NCS at some point too early to be detected while
Ogdensburg retained it, or never developed it in the first place while
Ogdensburg did. One argument for the plausibility of this hypothesis is the close
dialectological and historical relationship between Northwestern and
Southwestern New England. Boberg (2001) argues that the pre-ANAE
dialectological research on New England shows no robust linguistic distinction
between Northwestern and Southwestern New England at all; and he goes on to
find the current boundary between the two regions (defined by the relatively
recent expansion of the caught-cot merger) to be a gradual one. Indeed, according
to Kurath (1939), Northwestern New England was itself principally settled from
Southwestern New England, during the same time frame as the settlement of
northeastern and central New York, which suggests that attempting to draw a
distinction between settlement from Northwestern and Southwestern New
England during that period may be somewhat artificial.
If settlement history does not motivate the difference between Canton and
Ogdensburg, what does? One possibility is differences in community size. It was
observed above that small villages whose settlement history places them within
the Inland North, such as Sidney and Cooperstown, can retreat from the NCS;
perhaps Canton—another village of less than 6,000—has already done the same.
113
Alternatively, according to the “cascade” model of the spread of linguistic
change, which Callary (1975) found to apply to the NCS raising of /æ/ in
northern Illinois, change in progress will reach larger cities first; perhaps the
NCS, having spread to far northern New York only recently, reached
Ogdensburg first and has not made it to Canton yet.
Neither of the two possibilities raised in the foregoing paragraph seems
extremely convincing, however, chiefly because of the starkness of Ogdensburg
and Canton’s linguistic differences. The boundary between the two communities
is quite sharp: Although in Ogdensburg some aspects of the NCS are still in
progress, all the Ogdensburg speakers in the data except the very oldest score at
least two, making it solidly an Inland North fringe community; while Canton has
the lowest mean score of all the cities sampled, with only two out of nine
speakers scoring as high as two. The communities also differ with respect to the
caught-cot merger, as will be discussed in Chapter 5: in Canton, three of the nine
speakers have /oh/ and /o/ merged, and five have them “close” or
intermediate, while Ogdensburg has only three speakers intermediate and none
fully merged. Meanwhile, although Ogdensburg is a city and Canton a village,
Ogdensburg has scarcely more than twice Canton’s population (12,364 and 5,882
respectively, as of the 2000 United States Census). Ogdensburg and Canton have
roughly the same degree of contact with Watertown, the nearest larger NCS
community, and they are relatively close in population; for this reason it seems
likely that if the NCS were simply spreading to St. Lawrence County according
to the cascade model, by the time it had reached a significant degree of
advancement in Ogdensburg there would be at least some evidence of its
114
progress in Canton. But there’s basically no sign of NCS influence in Canton; if
anything, it shows less NCS than other non-NCS communities, such as Oneonta
and Amsterdam, that are the same distance from NCS cities as Canton is.
The hypothesis that Canton, like Sidney and Cooperstown, has retreated
from the NCS is not much more satisfying. This explanation of Cooperstown and
Sidney’s retreat from the NCS does not support the hypothesis that Canton has
abandoned the NCS as well. The two nearest small to medium-sized cities in
New York to Canton are Ogdensburg and Watertown; as discussed above,
Ogdensburg and Canton share a regional affiliation toward Watertown.
Plattsburgh is the nearest city in New York that Canton resembles
dialectologically, but Canton is not regionally oriented toward Plattsburgh;
residents of Canton report little to no travel there for everyday purposes. Canton
also bears some dialectological similarity to Canada, in that it lacks the NCS and
shows effects of the caught-cot merger; Brockville, the nearest medium-sized
Canadian city, is more populous than Ogdensburg and closer to Canton than
Watertown is, and Ottawa and Kingston are both large cities substantially closer
than any large American city. But again, Canton does not seem to have a
substantial regional orientation towards these Canadian cities (although both
Canton and Ogdensburg receive some Canadian radio and television
broadcasts). Moreover, Ogdensburg is the site of the only United States–Canada
border crossing within 40 miles in either direction, while Canton is some 20 miles
southeast of the national border. If Canton is regionally oriented toward Canada
on a local enough level for the NCS to have been obliterated in Canton as a result
of Canadian influence, then surely Ogdensburg, being much closer to Canada
115
and only about twice the population of Canton, would show at least some local-
level regional influence. There is no evidence of such influence on Ogdensburg;
especially the younger speakers there show NCS features as much as the
sampled speakers in, say, Watertown or Glens Falls. So overall, it seems
improbable that Canton was at one time subject to the NCS and lost it totally
under influence from Canada or other non-NCS areas, at the same time as it was
being initiated in Ogdensburg.
One obvious difference between Canton and Ogdensburg is that Canton is
a college town, home to St. Lawrence University and a campus of the State
University of New York (SUNY). It is conceivable that the universities’ role in
attracting people from other regions to move to Canton and settle there might
have eliminated the NCS there or prevented it from developing in the first place
when it otherwise would have. At first glance this account seems promising,
perhaps even as an alternative to the New England settlement explanation of the
distribution of the NCS: there are no institutions of higher education above the
community-college level located in Ogdensburg, Watertown, Glens Falls,
Gloversville, Sidney, or Cooperstown, in all of which the NCS is attested;
Plattsburgh and Oneonta each contain a SUNY campus and Poughkeepsie is
home to Vassar College. Utica is the only NCS community sampled in this study
to contain a college, but it is also by far the largest (over 60,000 as of the 2000
Census); and obviously the larger a community is the less dialectological
influence on it population attracted by a college can have—the four Inland North
cities in the Telsur sample of New York State also all contain universities.
However, Amsterdam, a non-NCS city, does not contain a college or university.

116
This means that the presence of institutions of higher education cannot be the
chief factor in determining whether a small-to-medium-sized community in
eastern New York is subject to the NCS; Southwestern New England settlement
matches the dialectological categorization better. This argument does not
demonstrate that SUNY Canton and St. Lawrence University are not responsible
for the absence of NCS in Canton, but neither is there really a good reason to
suppose that they are. It is more parsimonious from the available data to suppose
that Northwestern New England settlement history is insufficient to make a
community open to the NCS, and Ogdensburg was settled mainly from
Southwestern New England.
So the best available conclusion is that, insofar as clear reports of settlement
history can be found, all the communities where the NCS is observed in this data
set were settled principally by populations of Southwestern New England origin,
while the other communities were not. Of the various possibilities raised, it
seems more likely that Ogdensburg conforms to this pattern than that it does not.
3.5.4. Settlement history and the Hudson Valley
The patterns of settlement further justify identifying Poughkeepsie,
Amsterdam, and Oneonta in this study with Kurath’s Hudson Valley region.
Where the communities of the Inland North all drew settlers from Western New
England, Amsterdam, Oneonta, and Poughkeepsie instead all drew settlers from
117
the original Dutch New Netherland population23. Meanwhile, although Kurath
draws a dialect boundary between Southwestern New England and
Northwestern New England, Boberg (2001) argues that that boundary is not
justified by Kurath’s data. As Boberg implies, if that boundary is ignored on Map
3.22, all the areas ultimately settled from Southwestern New England—
southwestern and northwestern New England as well as northern, central, and
western New York—are united in a single dialect region, while the Hudson
Valley area is separate. Kurath likewise describes westward migration from
Western New England as having set the stage for the linguistic status of Upstate
New York. So it makes sense to interpret Kurath’s Hudson Valley region as
constituting “the region not settled by Western New Englanders”, and in
particular the region in which Dutch influence was stronger than New England
influence. Thus in the first half of the 20th century as well, the dialect regions
were found to correlate well with settlement patterns, and the Hudson Valley
was considered to be a linguistic region distinct from Southwestern New
England. In this light, let us examine the present-day relationships between the
Inland North, the Hudson Valley, and Southwestern New England.
23 Conceivably, the ever-so-slightly more ambiguous status that Oneonta exhibits with respect to the NCS may be related to the fact that the New Netherland Dutch appear to have been a smaller part of the founding population of Oneonta.

118
3.6. Absence of the NCS in Southwestern New England
3.6.1. The problem
The fact that the distribution of the NCS in central and eastern New York
State appears to be determined by settlement from Southwestern New England
seems to support Boberg (2001)’s general argument: that Southwestern New
England shares the same phonological system as the Inland North, and the
settlement of the Inland North from Southwestern New England is the source of
the phonological preconditions for the NCS. Despite Boberg’s contention that
Southwestern New England is phonologically identical to the Inland North, it is
still the case that according to the criteria used in this chapter, Southwestern
New England does not really show the NCS. This is an apparent paradox: if
settlement from Southwestern New England determines whether a community
in central and eastern New York is subject to the NCS, why is present-day
Southwestern New England itself not subject to the NCS?
A possible response to this paradox is that Southwestern New England is
subject to the NCS, but to a lesser degree than the Inland North proper; this is the
position Boberg takes. It is true to an extent, in that the seven Telsur speakers in
southwestern New England proper (i.e., Connecticut and western
Massachusetts) show higher NCS scores than the rest of the Telsur corpus
outside of the Inland North (p ≈ 0.005): three of them score 1, three 2, and one 3,
whereas outside the Inland North in general, 66% of speakers score 0. Moreover,
the NCS did not take place simultaneously in every community in the Inland

119
North; this is clear from Ogdensburg, in which apparently the NCS is still in
progress after going to completion in the other communities in this study.
Perhaps, then, the NCS originated in central or western New York, and
then spread northward and eastward into the communities that now constitute
the Inland North fringe. Under this scenario, even if Southwestern New England
is in principle open to the NCS, the eastward spreading of the full NCS was
never able to reach Southwestern New England, simply because Southwestern
New England shares no geographical borders with the Inland North core or
fringe; the Hudson Valley intervenes. This scenario appears to be supported by
the presence of the one Telsur speaker with an NCS score of four in Rutland,
Vermont, who was previously dismissed as an outlier: The nearest community to
Rutland of more than 14,000 people is Glens Falls, some 50 miles to the
southwest, which is the easternmost known point of the Inland North fringe. So,
according to this scenario, the reason the NCS has not expanded into
Southwestern New England is just because the Inland North does not come very
near Southwestern New England; but where the Inland North fringe approaches
Northwestern New England (which was also originally settled from Southwestern
New England), the NCS has been able to make a bit of eastward progress into
Rutland.
But this is not a fully satisfactory resolution to the paradox, for two
reasons. First, if the NCS can spread into Northwestern New England after all,
we are left again with the question of why Ogdensburg displays the NCS and
Canton does not. Second, and more important, the seven Telsur speakers in
southwestern New England show approximately the same (p > 0.83) distribution
120
of NCS scores as the speakers from the three Hudson Valley cities in the current
sample. As in the Hudson Valley, the two most frequently satisfied NCS criteria
in Southwestern New England are UD and ED. The mean EQ1 index of the
Telsur corpus’s Connecticut and western-Massachusetts speakers is –80, perhaps
slightly higher than the mean –102 of Poughkeepsie, Amsterdam, and Oneonta
but certainly not to a statistically significant degree (p > 0.34). So not only does
Southwestern New England not display the NCS to the same degree that places
that were settled from Southwestern New England do, but it is very similar (using
the measures employed in this chapter) to places that were not settled from
Southwestern New England. So: why should the Hudson Valley, which was not
settled from Southwestern New England, bear a closer linguistic resemblance to
Southwestern New England than communities that were? Or to put it another
way, if Southwestern New England is in principle open to the NCS, what is it
that makes Southwestern New England different from the Hudson Valley, which
shows no evidence of being open to the NCS? If the Hudson Valley were as open
to the NCS as Southwestern New England is supposed to be, then surely there
would be more evidence of it in Amsterdam, for example.
3.6.2. The distribution of individual NCS features
As mentioned above, large majorities of speakers sampled in the Hudson
Valley cities in this study satisfy the ED and UD criteria (19 out of 23 for both ED
and UD), while at most two satisfy any of the other NCS criteria. Of the seven
Telsur speakers in southwestern New England, six satisfy UD, while three satisfy
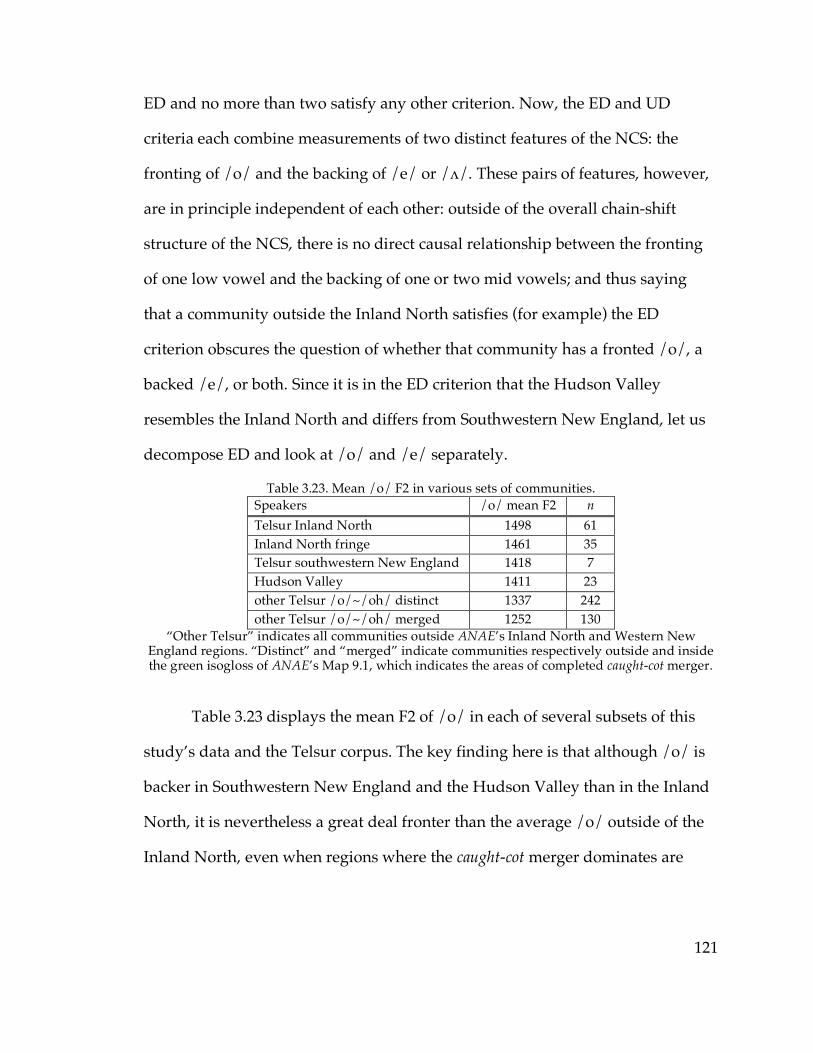
121
ED and no more than two satisfy any other criterion. Now, the ED and UD
criteria each combine measurements of two distinct features of the NCS: the
fronting of /o/ and the backing of /e/ or /ʌ/. These pairs of features, however,
are in principle independent of each other: outside of the overall chain-shift
structure of the NCS, there is no direct causal relationship between the fronting
of one low vowel and the backing of one or two mid vowels; and thus saying
that a community outside the Inland North satisfies (for example) the ED
criterion obscures the question of whether that community has a fronted /o/, a
backed /e/, or both. Since it is in the ED criterion that the Hudson Valley
resembles the Inland North and differs from Southwestern New England, let us
decompose ED and look at /o/ and /e/ separately.
Table 3.23. Mean /o/ F2 in various sets of communities. Speakers /o/ mean F2 n Telsur Inland North 1498 61 Inland North fringe 1461 35 Telsur southwestern New England 1418 7 Hudson Valley 1411 23 other Telsur /o/~/oh/ distinct 1337 242 other Telsur /o/~/oh/ merged 1252 130
“Other Telsur” indicates all communities outside ANAE’s Inland North and Western New England regions. “Distinct” and “merged” indicate communities respectively outside and inside the green isogloss of ANAE’s Map 9.1, which indicates the areas of completed caught-cot merger.
Table 3.23 displays the mean F2 of /o/ in each of several subsets of this
study’s data and the Telsur corpus. The key finding here is that although /o/ is
backer in Southwestern New England and the Hudson Valley than in the Inland
North, it is nevertheless a great deal fronter than the average /o/ outside of the
Inland North, even when regions where the caught-cot merger dominates are
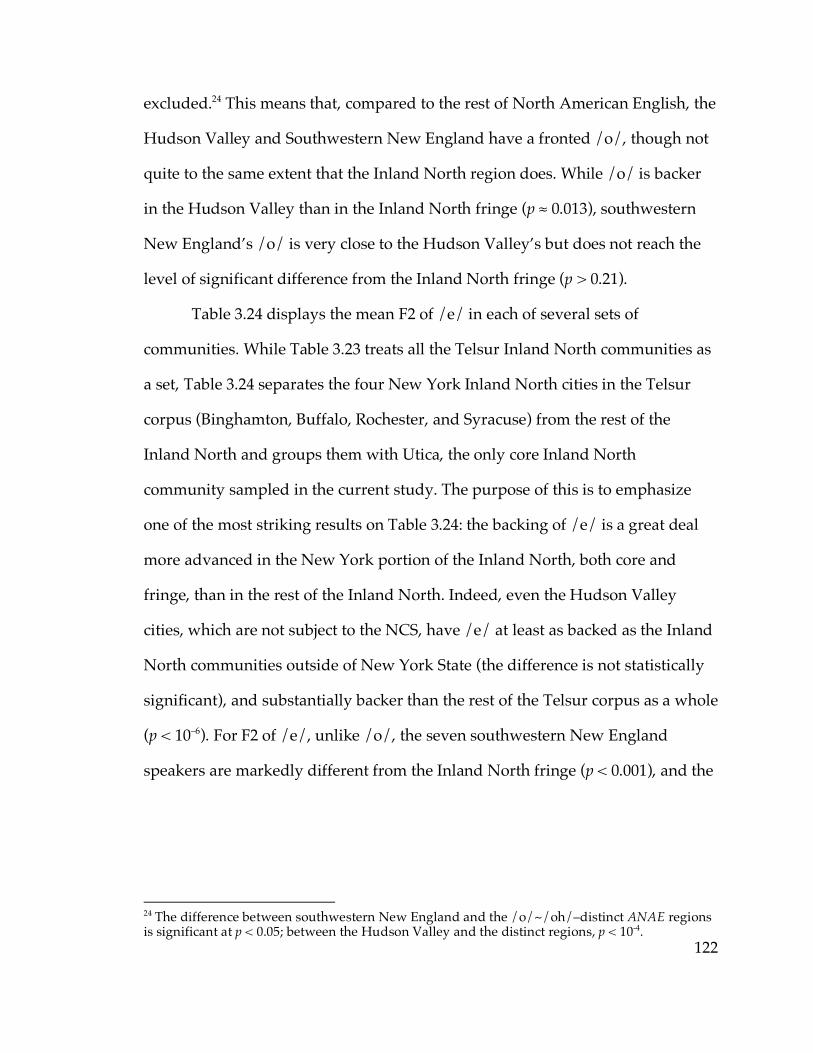
122
excluded.24 This means that, compared to the rest of North American English, the
Hudson Valley and Southwestern New England have a fronted /o/, though not
quite to the same extent that the Inland North region does. While /o/ is backer
in the Hudson Valley than in the Inland North fringe (p ≈ 0.013), southwestern
New England’s /o/ is very close to the Hudson Valley’s but does not reach the
level of significant difference from the Inland North fringe (p > 0.21).
Table 3.24 displays the mean F2 of /e/ in each of several sets of
communities. While Table 3.23 treats all the Telsur Inland North communities as
a set, Table 3.24 separates the four New York Inland North cities in the Telsur
corpus (Binghamton, Buffalo, Rochester, and Syracuse) from the rest of the
Inland North and groups them with Utica, the only core Inland North
community sampled in the current study. The purpose of this is to emphasize
one of the most striking results on Table 3.24: the backing of /e/ is a great deal
more advanced in the New York portion of the Inland North, both core and
fringe, than in the rest of the Inland North. Indeed, even the Hudson Valley
cities, which are not subject to the NCS, have /e/ at least as backed as the Inland
North communities outside of New York State (the difference is not statistically
significant), and substantially backer than the rest of the Telsur corpus as a whole
(p < 10–6). For F2 of /e/, unlike /o/, the seven southwestern New England
speakers are markedly different from the Inland North fringe (p < 0.001), and the
24 The difference between southwestern New England and the /o/~/oh/–distinct ANAE regions is significant at p < 0.05; between the Hudson Valley and the distinct regions, p < 10-4.
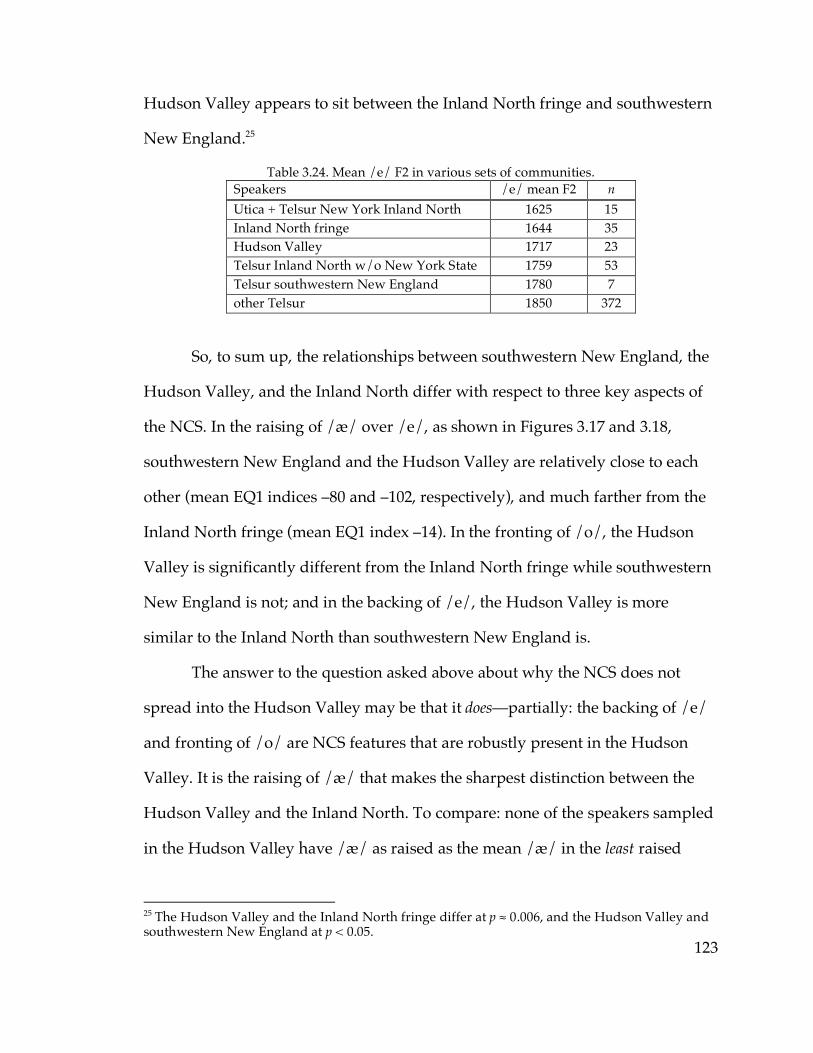
123
Hudson Valley appears to sit between the Inland North fringe and southwestern
New England.25
Table 3.24. Mean /e/ F2 in various sets of communities. Speakers /e/ mean F2 n Utica + Telsur New York Inland North 1625 15 Inland North fringe 1644 35 Hudson Valley 1717 23 Telsur Inland North w/o New York State 1759 53 Telsur southwestern New England 1780 7 other Telsur 1850 372
So, to sum up, the relationships between southwestern New England, the
Hudson Valley, and the Inland North differ with respect to three key aspects of
the NCS. In the raising of /æ/ over /e/, as shown in Figures 3.17 and 3.18,
southwestern New England and the Hudson Valley are relatively close to each
other (mean EQ1 indices –80 and –102, respectively), and much farther from the
Inland North fringe (mean EQ1 index –14). In the fronting of /o/, the Hudson
Valley is significantly different from the Inland North fringe while southwestern
New England is not; and in the backing of /e/, the Hudson Valley is more
similar to the Inland North than southwestern New England is.
The answer to the question asked above about why the NCS does not
spread into the Hudson Valley may be that it does—partially: the backing of /e/
and fronting of /o/ are NCS features that are robustly present in the Hudson
Valley. It is the raising of /æ/ that makes the sharpest distinction between the
Hudson Valley and the Inland North. To compare: none of the speakers sampled
in the Hudson Valley have /æ/ as raised as the mean /æ/ in the least raised
25 The Hudson Valley and the Inland North fringe differ at p ≈ 0.006, and the Hudson Valley and southwestern New England at p < 0.05.

124
Inland North fringe city; but fully 30% (7 out of 23) of the Hudson Valley
speakers meet the corresponding threshold for /e/, and 30% have /o/ fronter
than the mean of all Inland North fringe speakers.
Labov (2007) argues that it is easier for changes in individual phonemes to
expand past their original isoglosses than for an entire chain shift to spread in the
same manner as it originally occurred. So what we see here may be construed as
NCS sound changes spreading beyond the Inland North into the Hudson Valley,
but the different NCS features do not show uniform behavior across boundary.
To begin to explain these different behaviors, let us consider the relative
chronology of the different phases of the NCS.
3.6.3. The origin of the NCS
There is disagreement in the literature about the earliest stages of the
NCS. As mentioned above, Labov and his collaborators (as exemplified in, e.g.,
ANAE) generally describe the raising and tensing of /æ/ as the first stage of the
NCS, creating a pull chain in which /o/ is fronted in order to fill the space left in
the low front position by the raising of /æ/. McCarthy (2008), on the other hand,
argues that the fronting of /o/ was the first stage of the shift; her argument is
based on data from several speakers born in Chicago before 1900, who display
fronting of /o/ but little to no raising of /æ/.
McCarthy’s contention that /o/-fronting preceded /æ/-raising is
consistent with the behavior of /o/ observed in this study. Southwestern New
England is the origin of the settlement of the Inland North, and it resembles the
125
Inland North in that its /o/ is markedly fronter than the /o/ of non–Inland
North communities in the Telsur corpus. It does not closely resemble the Inland
North with respect to /æ/. This suggests that the fronting of /o/ began early in
the history of the NCS, before the present-day Inland North diverged from
Southwestern New England speech; thus when the settlers of the Inland North
region migrated westward, they already carried with them a somewhat fronted
/o/. The Hudson Valley communities that were not settled by New Englanders
did not necessarily, under this scenario, already have a fronted /o/, but the
fronting of /o/ would have spread to them at a later date from both directions.
The backing of /e/ is a much newer change, as indicated by the fact that it
is still in progress in Ogdensburg (and in the Inland North fringe data as a
whole, though not in any of the other individual cities) while raising of /æ/ and
fronting of /o/ are not. This change apparently originated in the New York State
component of the Inland North after it had already diverged from Southwestern
New England, unlike fronting of /o/; for this reason, southwestern New
England’s /e/ is much less backed than New York’s Inland North communities
while its /o/ is comparable to at least the Inland North fringe. Like /o/-fronting,
/e/-backing appears to have spread from the Inland North to the Hudson
Valley; and then it must have advanced from there to southwestern New
England as well. Thus those two regions have an /e/ that is substantially backer
than North American English as a whole, but still not as backed as in the Inland
North in New York State.
According to this approach, the raising of /æ would (like /e/-backing)
have originated in the Inland North after it had diverged from Southwestern
126
New England; but then, unlike /e/-backing, /æ/-raising never expanded
substantially into the Hudson Valley or, for the most part, New England beyond
it. The raising of /æ/ may also have allowed the Inland North to develop a
fronter /o/ than its Western New England predecessor system, by opening up
additional phonetic space for /o/ to move forward into. But why should the
raising of /æ/ fail to spread while the backing of /e/ and fronting of /o/
apparently spread easily into the Hudson Valley? To attempt to answer this, let
us return to ANAE’s account of the origin of the NCS.
To review, ANAE argues that the tensing of /æ/ originated when the
construction of the Erie Canal drew settlers from a variety of dialect regions, with
a variety of phonological /æ/ patterns, into the same area. This account at face
value does not fully account for the distribution of /æ/-tensing in New York
State. Several NCS communities in this study are not located near the Erie Canal
and did not benefit directly from the increased settlement it drew, but may have
benefited from related Canal projects. Of Ogdensburg, for example, Hough
(1853) writes that “the Erie canal hindered the growth of this portion of the
state,” but the Oswego Canal, which opened five years after the Erie Canal was
complete and connected the Erie Canal to Lake Ontario “was the first public
work that conferred a benefit upon Ogdensburgh, or St. Lawrence county, as
they thus gained a direct avenue to market.” Similarly, Glens Falls is not located
on or near the Erie Canal, but it is on the Hudson River, which connects to the
Erie Canal, and close to the Champlain Canal that connected the Erie Canal to
Lake Champlain. On the other hand, Amsterdam is located along the Erie Canal
and was founded and settled in the same general time frame as the NCS
127
communities in this study; but the presence of the Erie Canal was not sufficient
to cause the NCS there.
Combining the Erie Canal explanation with this study’s findings of
southwestern New England–origin settlement yields a consistent dialectological
picture. Under such a combined explanation, the general raising of /æ/ under
the NCS would have been not merely the result of a koineization of multiple
incompatible /æ/ systems in one place. Rather, it is the effect of multiple
incompatible /æ/ systems coming into contact with the original /æ/ system of
Southwestern New England, in communities that were founded by Southwestern
New Englanders but subject to increased migration thereafter as part of the Erie
Canal population boom. This explains why Southwestern New England itself did
not undergo /æ/-tensing—it did not (at least, at the relevant time) have an
inrush of settlers from existing communities with different /æ/ systems. It
explains why communities such as Amsterdam that are on the Erie Canal but
were not originally settled mostly by southwestern New Englanders did not
undergo /æ/-tensing: these communities did not have the same Southwestern
New England–derived /æ/ system as the base pattern, and thus did not respond
to the phonological pressure of the incoming /æ/ systems in the same way.
Under this analysis, the outcome of the influence of diverse /æ/
phonologies on the underlying Southwestern New England /æ/—i.e., the Inland
North general tensing of /æ/—differs in basic phonological structure from the
/æ/ found in the Hudson Valley, rather than being merely a different phonetic
manifestation of the same phonological features. This hints at why the general
tensing of /æ/ did not spread to communities without Southwestern New
128
England settlement the way /o/-fronting did: although individual surface-level
sound changes can diffuse from community to community with relative ease, it
is more difficult for a change at the more abstract phonological level to spread
directly. The nature of this phonological difference in /æ/, and the nature of the
phonological change that would have had to spread into the Hudson Valley in
order for full /æ/-tensing to appear there, will be the subject of Chapter 4.
On the other hand, it is still possible for communities in Upstate New
York that did not directly experience the Erie Canal population boom but were
founded by Southwestern New Englanders to have been affected by /æ/-
tensing. These communities would have started with the same Southwestern
New England–derived /æ/ system that was the substrate for the development of
general tensing in the Erie Canal Inland North cities. By virtue of being in
Upstate New York, many of them along major trade routes that connected to the
Erie Canal, they would have been in more or less regular linguistic contact with
communities with a greater variety of /æ/ systems, including the Erie Canal
communities themselves. Even if these communities did not experience the kind
of intense influence from varied /æ/ systems that the cities on the Erie Canal
did, their lesser degree of contact could have been sufficient to bring /æ/-tensing
to them in a less general and consistent fashion—i.e., in the fashion characteristic
of the communities described in this paper as the Inland North fringe.
A possible fault in this speculative scenario is that it requires
Southwestern New England and the Hudson Valley to have had distinct /æ/
systems in the period when the Inland North was beginning to be settled, and
there is no direct evidence that they did. Likewise, it does not appear to be the
129
case that Southwestern New England and the Hudson Valley have distinct /æ/
systems now, nor is there evidence in the data of Kurath & McDavid (1961) that
they did in the first half of the 20th century. However, it is far from implausible
to suppose that such was the case in the late 18th and early 19th centuries. The
settlement of the Hudson Valley, as discussed above, was in large part derived
from non–English-speaking populations, either the original Dutch settlers of
New Netherland, or more recent Dutch and German immigrants. Indeed, as
mentioned above, Dutch was a principal language of Poughkeepsie until only a
couple of decades before the migration from southwestern New England into the
Inland North began (Platt 1987); and Campbell (1906) writes that in the early
years of Oneonta’s settlement, around the turn of the 19th century, “German was
the language of common conversation.” So during the decades after the
completion of the Erie Canal in the 1820s, much of the Hudson Valley was at best
fairly recently English-speaking. It is highly probable that these second-language
English speech communities at that time had substantially different phonologies,
influenced by the very recent Dutch and German substrates, from those of the
long-standing English-speaking communities of western New England.
The sticking point of this speculative scenario is, as usual, the border
between Ogdensburg and Canton. Even if Ogdensburg was settled from
southwestern New England and Canton from Vermont, why should that prevent
/æ/-tensing from spreading to Canton as well? Most of Vermont itself was
settled from southwestern New England, and Boberg (2001) argues that the
present-day dialectological differences between Southwestern and Northwestern
130
New England are quite recent in origin, so in all probability26 the communities in
Vermont from which Canton’s settlers originated had the same /æ/ phonology
as the Southwestern New England origins of the Inland North. This is all the
more in need of explanation if we take seriously the speaker in Rutland with a
score of 4 as evidence of the NCS extending eastward beyond the Glens Falls
area into Vermont, as described above. One possible explanation for the
difference between Ogdensburg and Canton is degree of contact with mixed and
varied /æ/ systems at the relevant time. Ogdensburg is located on the St.
Lawrence River, and as mentioned above it commercially benefited from the
Oswego Canal connecting the St. Lawrence to trade from the Erie Canal area;
Hough (1853) also mentions the intense importance given at the time to the
construction of a road from Ogdensburg to the Mohawk Valley. Canton, on the
other hand, is not located on any major trade routes connected to more central
parts of New York. If this explanation is the correct one, it may not matter
whether Ogdensburg was predominantly settled from Northwestern or
Southwestern New England. What matters in this case was that, at the time of
the Erie Canal boom, Ogdensburg was in enough contact with the trade boom for
its /æ/ system to be affected, and Canton wasn’t. Then the raised /æ/ was not
able to spread to Canton from Ogdensburg for the same reason it never spread to
Amsterdam: underlying phonological changes do not spread as easily as surface- 26 What Hough (1853) says about the settlers of Canton in general is merely that they were from Vermont; he does not mention what part of Vermont. So it is possible that the preponderance of them came from the eastern part of Vermont, which according to Kurath (1939) was settled more from the Eastern New England dialect region and therefore may have had a different /æ/ phonology than Southwestern New England. (This boundary within Vermont can be seen on Map 22.) This is not a very likely scenario, however, both because the most populous areas of Vermont (and thus the most likely sources of migrants) are in the western part of the state, and because the two Canton pioneers whose towns of origin Hough does identify were both from the western part of Vermont.
131
level phonetic changes. This explanation is not entirely satisfactory in that it still
does not really account for the speaker in Rutland, but it is perhaps the best than
can be done with the limited data available.
This scenario reconciles the two accounts of the “initial stages” of the
NCS. As McCarthy (2008) argues, the fronting of /o/ was the first step in the
NCS, in the sense that it began earlier than any of the other sound changes
thought of as being part of the NCS, before the divergence of the Inland North
from Southwestern New England. On the other hand, as ANAE argues, the
tensing of /æ/ was the triggering event of the NCS in the sense that that appears
to be the change which uniquely distinguishes the NCS and the Inland North
from the surrounding regions and their phonological systems.
It also, of course, resolves the conflicts between the accounts of the nature
of the relationship between the Inland North and Western New England given
by Boberg (2001) and in ANAE. Like ANAE, this chapter contends that the NCS
raising of /æ/ is a unique phonological feature that is distinct from the
phonology of Southwestern New England, and would not have happened in an
area that did not have the demographic history of New York State. However, the
Southwestern New England phonology is also essential to the history of the
NCS, to the extent that communities in central and northern New York that were
not settled from southwestern New England did not develop it, even if in other
respects they resemble the communities that did. Where Boberg’s analysis seems
to predict a gradual boundary between the Inland North and Southwestern New
England, and the ANAE analysis seems to predict a sharp boundary, this chapter
finds a null boundary: the Inland North and Southwestern New England do not
132
actually meet, but are separated by the Hudson Valley. However, few
phonological differences are observed between the Hudson Valley and
Southwestern New England, none of them very large or statistically very robust;
from that point of view, the Hudson Valley can be considered to be
dialectologically united with Southwestern New England in the present day.27 In
that respect, the key feature distinguishing the Inland North from the Hudson
Valley / Southwestern New England region is the tensing of /æ/. The boundary
appears to be a combination of the gradual and sharp types: between the Inland
North core and Hudson Valley is the Inland North fringe, where /æ/ is certainly
higher than in the Hudson Valley and the other NCS features are more
advanced, but less homogeneously so than in the Inland North core; however,
the difference between communities immediately on opposite sides of the
boundary can be quite abrupt.
3.7. Adding in the communities with small samples
The discussion above took into account only the twelve communities in
which seven or more speakers were sampled; this constitutes 98 speakers out of
the full sample of 119. The remaining 21 speakers are from a total of eleven
different communities. Now that the general patterns of dialect diversity in
Upstate New York have been established in the foregoing sections, this section
27 The following chapters will discuss a dialect division within the Hudson Valley region: the communities closest to the Hudson itself, specifically Poughkeepsie and Albany, exhibit some influence from New York City in both their /æ/ system and their raised /oh/. Amsterdam and Oneonta, however, do not exhibit these features and therefore resemble southwestern New England proper more closely than Poughkeepsie and Albany do, despite being more distant from it.

133
will attempt to classify these eleven communities, based on the limited data
available for them, in terms of the features used to classify the communities with
deeper samples. The locations of these communities are shown in Map 3.25;
Table 3.26 lists the EQ1 indices and NCS scores of the speakers interviewed in
each of them.
Map 3.25. The locations of communities with one to three speakers sampled, whose
dialectological status is to be determined.
Some of these communities are easier to assign to dialectological groups
than others, on the basis of geography and the data in Table 3.26. In Geneva,
which is west of Syracuse and geographically well within the core Inland North
region, both speakers interviewed have NCS scores of four and EQ1 indices close
to zero; we can describe Geneva with no qualms as a core Inland North
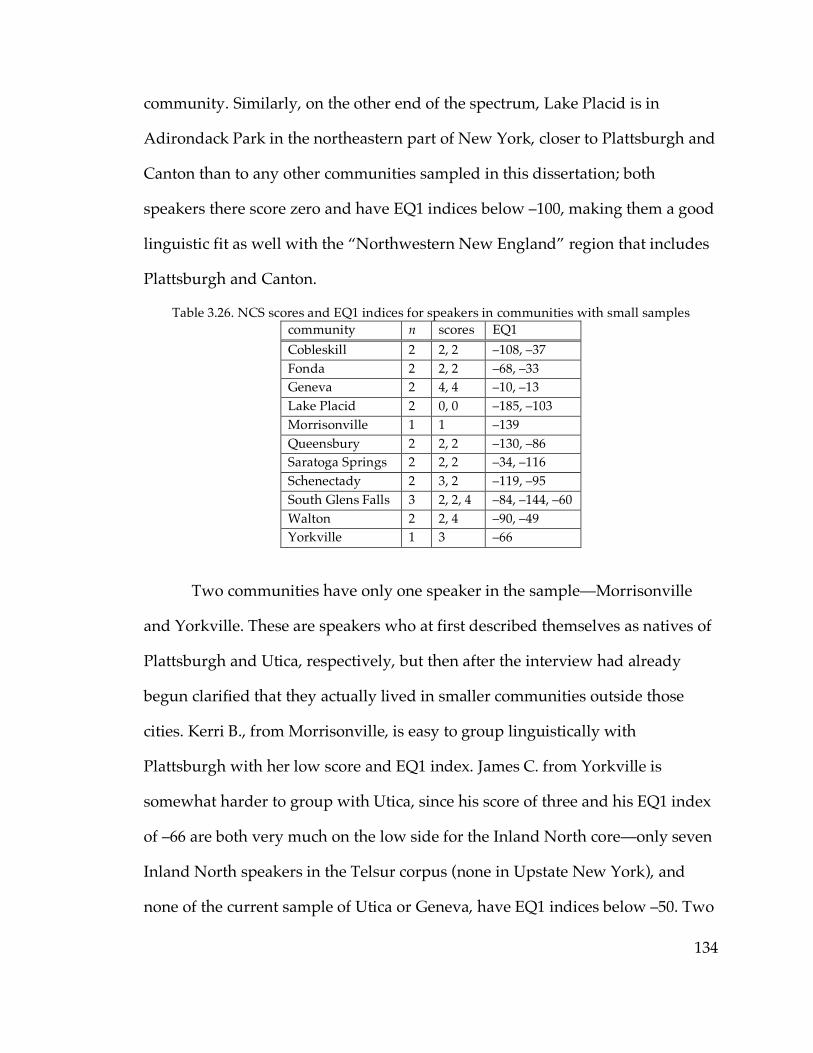
134
community. Similarly, on the other end of the spectrum, Lake Placid is in
Adirondack Park in the northeastern part of New York, closer to Plattsburgh and
Canton than to any other communities sampled in this dissertation; both
speakers there score zero and have EQ1 indices below –100, making them a good
linguistic fit as well with the “Northwestern New England” region that includes
Plattsburgh and Canton.
Table 3.26. NCS scores and EQ1 indices for speakers in communities with small samples community n scores EQ1 Cobleskill 2 2, 2 –108, –37 Fonda 2 2, 2 –68, –33 Geneva 2 4, 4 –10, –13 Lake Placid 2 0, 0 –185, –103 Morrisonville 1 1 –139 Queensbury 2 2, 2 –130, –86 Saratoga Springs 2 2, 2 –34, –116 Schenectady 2 3, 2 –119, –95 South Glens Falls 3 2, 2, 4 –84, –144, –60 Walton 2 2, 4 –90, –49 Yorkville 1 3 –66
Two communities have only one speaker in the sample—Morrisonville
and Yorkville. These are speakers who at first described themselves as natives of
Plattsburgh and Utica, respectively, but then after the interview had already
begun clarified that they actually lived in smaller communities outside those
cities. Kerri B., from Morrisonville, is easy to group linguistically with
Plattsburgh with her low score and EQ1 index. James C. from Yorkville is
somewhat harder to group with Utica, since his score of three and his EQ1 index
of –66 are both very much on the low side for the Inland North core—only seven
Inland North speakers in the Telsur corpus (none in Upstate New York), and
none of the current sample of Utica or Geneva, have EQ1 indices below –50. Two
135
of the seven Utica speakers in the sample score three, so James is in moderately
good company there, at least. Despite his low EQ1 index, James (and therefore
Yorkville) will be considered to be part of the Inland North core because his NCS
score is at least within the range of Utica’s scores, and because Yorkville is not
only directly adjacent to Utica but also on Utica’s west side (i.e., in the direction
of the rest of the Inland North core, not in the direction of the fringe and the
Hudson Valley), so there is no other candidate region to assign the village to.
James C. is also older than any of the speakers in the sample from Utica proper
(he was born in 1931, whereas Janet B. was born in 1942 and all other
interviewed Utica speakers are 1979 or later) and male, which might merely
indicate that he represents a less advanced form of the NCS; but with Janet B.
being the most advanced NCS speaker in the sample and no other source of
apparent-time data on Utica, this must remain conjecture.
The other seven communities in Table 3.26 are harder to categorize. As
Map 3.25 shows, most of them are more or less between the Inland North fringe
and Hudson Valley regions established in the previous sections and displayed on
Map 3.21; and their scores and EQ1 indices are generally mixed, intermediate, or
inconsistent. Schenectady is the easiest to classify; it is between Amsterdam and
Albany, both Hudson Valley cities, and both speakers have very low EQ1
indices. Even though one’s NCS score is three, which is high for the Hudson
Valley, scores of three are found in both Poughkeepsie and Oneonta as well. So
Schenectady can be classified as a Hudson Valley community.
Cobleskill, Fonda, Saratoga Springs, and Walton are somewhat more
confusing. The scores of the speakers in Walton are two and four; this suggests

136
that the village should be included in the Inland North fringe, which was first
defined as a set of communities whose scores were mostly between two and four.
However, their NCS scores are quite low for an Inland North fringe community,
and seem more typical of Oneonta than of any of the four fringe cities established
so far; Daniel H., a 23-year-old Air Force serviceman with an EQ1 index of –90,
would have the lowest EQ1 index in the Inland North fringe sample if Walton
were included in the fringe.
Cobleskill, Fonda, and Saratoga Springs are the opposite of Walton in this
respect. All the speakers sampled in these communities score two; by the
methodology employed earlier in this chapter, on the basis of that score these
three communities would be assigned to the Hudson Valley with Oneonta and
Amsterdam. However, in each of these three communities one speaker has an
EQ1 index around –35, higher than that of any speaker in the Hudson Valley
communities discussed above.28 In Cobleskill and Saratoga Springs, the second
speaker’s EQ1 index is below –100, deep within the Hudson Valley range; in
Fonda, the second speaker’s EQ1 index is –68, within the area of overlap between
the high EQ1 indices of the Hudson Valley and the low EQ1 indices of the Inland
North fringe.
It is noteworthy but not astonishing that these four communities seem
hard to classify, mixed, or intermediate between the Inland North fringe and the
Hudson Valley in terms of their scores and EQ1 indices—to begin with, as noted
above, they are all geographically intermediate between the Inland North fringe
28 Not much higher: the highest EQ1 index in Oneonta is –39, and these communities’ EQ1 indices are –33, –34, and –37. But the point here is that each of Cobleskill, Fonda, and Saratoga Springs has one speaker with an EQ1 index that would be very high for the Hudson Valley.
137
communities and Hudson Valley communities determined earlier in this chapter.
Moreover, Cobleskill, Fonda, and Walton are villages. From the observation
above that the villages of Cooperstown and Sidney (both also along the general
boundary between Inland North fringe and Hudson Valley) are losing the NCS
in apparent time, it was hypothesized that villages near this boundary might be
less stable in their dialectological status than cities in the same area. That
hypothesis would predict that other villages along that boundary might show
inconsistent or intermediate behavior with respect to NCS features—and so they
do. In fact, in all three of the villages, it is the older of the two speakers sampled
who exhibits more NCS-like features (i.e., the higher EQ1 index, and in Walton
the higher score); this is consistent with the same retreat from the NCS that
Sidney shows. Similarly, Novak (2004) found NCS features diminishing in
apparent time in Ballston Spa, a village just outside Saratoga Springs.
Unlike Cobleskill, Fonda, and Walton (and Ballston Spa), Saratoga Springs
is a city, and here it is the younger speaker who shows the higher EQ1 index. So
Saratoga Springs’ dialectological status seems to be hard to define based on the
data available; two speakers is certainly not enough to establish an apparent-time
trend toward the NCS without a suggestion of a similar result from better-
sampled comparable communities. Saratoga Springs is also by far the fastest-
growing city in the state, having seen a 31.5% increase in population from 1970 to
2000 while the other eleven cities sampled in this dissertation saw on average a
17.4% decline29, and the five Upstate cities in the Telsur corpus declined by an
average of 26.3%; it is the only city it the state to have increased in population
29 This ranges from 33.8% in Utica to an increase of 0.5% in Plattsburgh.
138
every decade since 1950 (Population Trends 2004). Saratoga Springs’ atypical
demographic status makes it hard to predict what dialectological status it might
be expected to have.
The two communities adjacent to Glens Falls—the town of Queensbury,
which borders it on the north, and the village of South Glens Falls, which borders
it on the south—are similarly problematic. South Glens Falls resembles Walton,
in that its NCS scores range up to four but its EQ1 indices are all less than –50;
and like Walton and the other villages, it is the oldest speaker interviewed from
South Glens Falls who has the highest EQ1 index and score. If Queensbury were
not immediately adjacent to an Inland North fringe city, it would seem to be very
clearly a non–Inland North community; both speakers have EQ1 indices less than
–85 and NCS scores of two. It is possible for there to be dialect boundaries within
individual communities or between closely related communities, especially
when they have separate elementary schools30; but the sharply reduced presence
of NCS features in these communities, which one might have expected to be in
the same speech community as Glens Falls, is nevertheless troubling.
It was hypothesized above that Sidney is retreating from the NCS under
the influence of the nearby non-NCS city of Oneonta; but the city with the
greatest linguistic influence on South Glens Falls must surely be Glens Falls.
Queensbury and Glens Falls were originally a single town; Glens Falls only
became a separate city in 1908. The difference between Glens Falls and the
adjacent communities here may be an effect of community size and population
30 Johnson (2007)’s discovery that half of the city of Attleboro, Mass., is in the Rhode Island dialect area while the other half is dialectologically grouped with the rest of eastern Massachusetts is a striking example.
139
density, if we interpret Inland North fringe cities to be those to which the NCS
diffused at a later date from the Inland North core. The cascade model predicts at
least that, all else being equal, a linguistic change undergoing diffusion will reach
larger communities before smaller communities; and Glens Falls on the one hand
and South Glens Falls on the other may well be regarded as a case where all else
is equal if there ever was one.31 However, this explanation doesn’t account for
why it is the older speaker in South Glens Falls who has the most NCS-like
features. A solid explanation for the difference between Glens Falls and the
communities adjacent to it may have to wait until more data is available from
this area.
For the sake of having every community in a category when communities
are grouped for dialectological analysis in later chapters, I will use the NCS
scores of each of these intermediate-seeming or confusing communities to
classify them. Thus Walton and South Glens Falls, whose scores range up to four,
will be considered Inland North fringe communities, while Saratoga Springs,
Fonda, and Cobleskill will be considered Hudson Valley communities (although
with the caveats detailed above). Queensbury is not included as an Inland North
fringe community by this criterion, but it will not be considered part of the
Hudson Valley either because it is north of Glens Falls; Queensbury will be
included only when “miscellaneous communities” are grouped. Map 3.27 shows
the full set of dialectological assignments and isoglosses.
31 Queensbury is strictly speaking not a “smaller community” than Glens Falls, since it has a larger population; however, cities and towns in New York State are not strictly comparable to each other in this respect. Queensbury has a larger population, but it is much less urbanized than Glens Falls and has approximately one tenth Glens Falls’ population density.
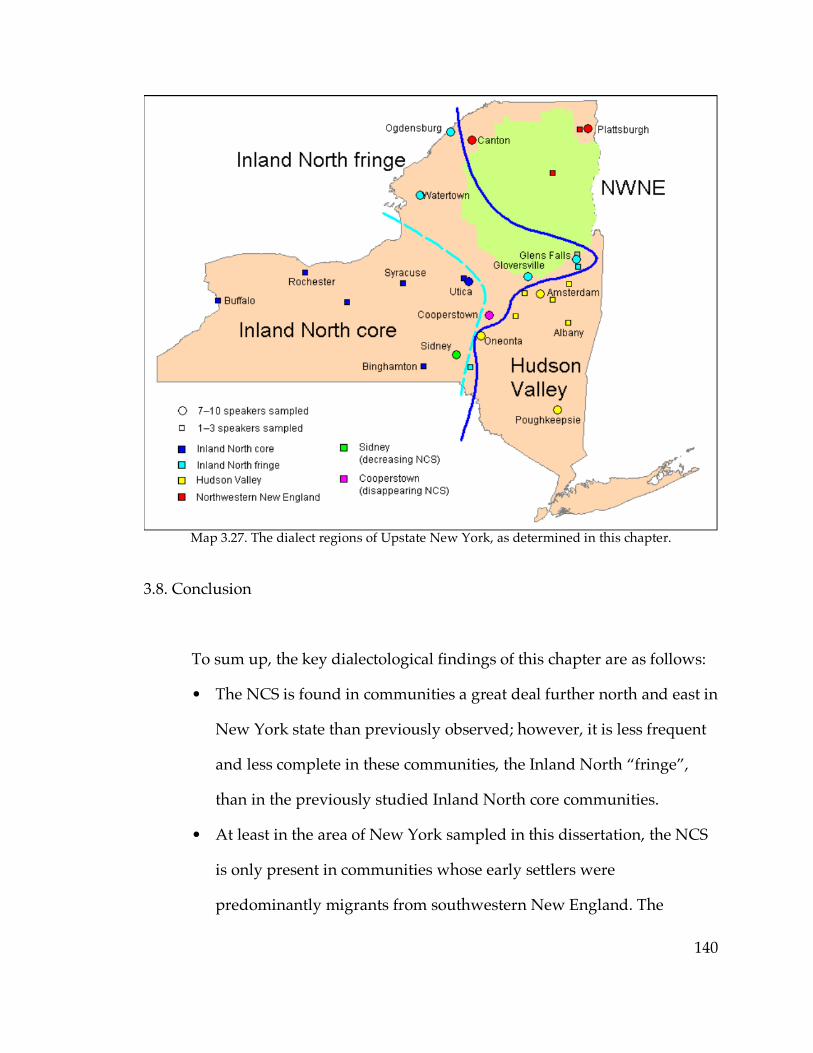
140
Map 3.27. The dialect regions of Upstate New York, as determined in this chapter.
3.8. Conclusion
To sum up, the key dialectological findings of this chapter are as follows:
• The NCS is found in communities a great deal further north and east in
New York state than previously observed; however, it is less frequent
and less complete in these communities, the Inland North “fringe”,
than in the previously studied Inland North core communities.
• At least in the area of New York sampled in this dissertation, the NCS
is only present in communities whose early settlers were
predominantly migrants from southwestern New England. The

141
persistence of the early-19th-century settlement patterns in the present-
day linguistic boundaries is striking; however:
• Small villages can lose the NCS if the nearest city to which they are
regionally oriented does not possess the NCS. This does not appear to
occur on a broader regional level—small cities do not lose the NCS if
their most influential nearby large city lacks it.
• In Upstate New York, even communities which do not have the NCS
show some features typically associated with it, such as backing of /e/
and modest fronting of /o/, although to a lesser extent than in New
York’s Inland North fringe or core communities. However, substantial
raising of /æ/, the most distinctive hallmark of the NCS, is not
generally present in such communities.
These findings are interpreted as indicating that the fronting of /o/
originated in Southwestern New England and was brought into Upstate New
York by the settlers of the Inland North, but the raising of /æ/ originated in the
Inland North, as suggested by ANAE, as a result of the population and economic
growth of the region brought by the construction of the Erie Canal. This NCS
raising of /æ/ failed to successfully spread beyond the Inland North fringe,
while other NCS features such as fronting of /o/ and backing of /e/ succeeded
in expanding southeastward into the region designated here as the Hudson
Valley. Labov (2007)’s argument that it is easier for individual phonetic changes
to spread beyond their region of origin than abstract structural changes suggests
that NCS /æ/-raising depends upon a categorical difference in the underlying
142
phonological structure of the phoneme; the nature of this phonological difference
will be explored in the next chapter.
The geographical findings reaffirm the primacy of early settlement
history, rather than present-day communication patterns, in determining the
location of the boundaries of major dialect features, with only minor alteration
around the edges in places like Cooperstown and Sidney. Overall, the boundary
between the Inland North and the Hudson Valley appears to be of the gradual
type: shading from the Inland North core to the fringe, where NCS features are
clearly present but not uniform; to a series of boundary villages such as Walton,
Sidney, Fonda, and Cobleskill, where the status of the NCS appears to be
intermediate or in flux; to the Hudson Valley, where the NCS shows little
advancement. The next chapters will show further differentiation within the
Hudson Valley. But considered merely in terms of cities, the boundary appears
much clearer, with for example Gloversville sharply distinct from Amsterdam
and Binghamton from Oneonta, while the villages in between may change their
affiliation in response to influence from the cities. The boundary also appears
quite sharp, for reasons that the current sample is not deep enough to explicate
fully, in northern New York between the Inland North fringe and the dialect
region including Canton, Lake Placid, and Plattsburgh, which seems to be allied
with Northwestern New England.
The issue that introduced this chapter was the nature of the boundary
between the Inland North and Southwestern New England. That boundary turns
out to be null, of course: the Hudson Valley intervenes between the two regions.
ANAE did not distinguish between the Hudson Valley and Southwestern New
143
England; and indeed, until there is a larger sample of dialectological data from
Southwestern New England, it remains to be seen whether there is a meaningful
present-day linguistic difference between the two regions. But the historical
distinction between them turns out to be very important for describing the
distribution of the NCS.
The next chapter will use the dialect regions established in this chapter to
look in detail at the phonology of /æ/ and how it differs between the Inland
North and non-Inland North communities in the sample.
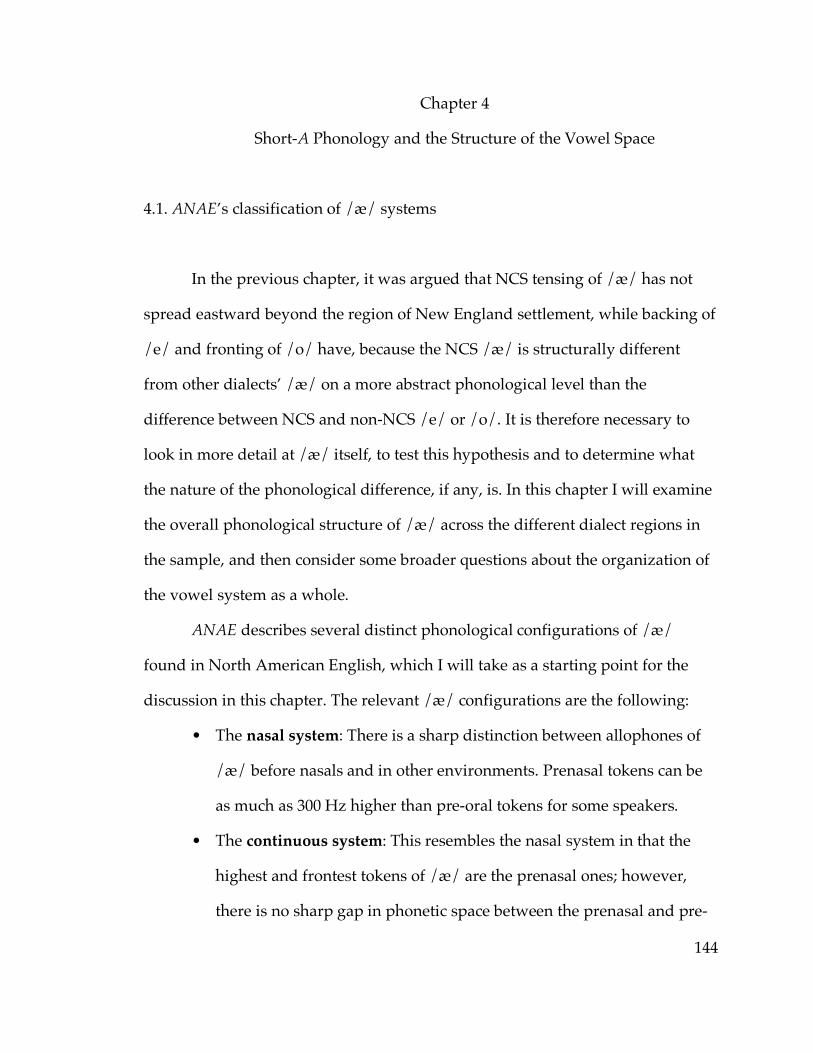
144
Chapter 4
Short-A Phonology and the Structure of the Vowel Space
4.1. ANAE’s classification of /æ/ systems
In the previous chapter, it was argued that NCS tensing of /æ/ has not
spread eastward beyond the region of New England settlement, while backing of
/e/ and fronting of /o/ have, because the NCS /æ/ is structurally different
from other dialects’ /æ/ on a more abstract phonological level than the
difference between NCS and non-NCS /e/ or /o/. It is therefore necessary to
look in more detail at /æ/ itself, to test this hypothesis and to determine what
the nature of the phonological difference, if any, is. In this chapter I will examine
the overall phonological structure of /æ/ across the different dialect regions in
the sample, and then consider some broader questions about the organization of
the vowel system as a whole.
ANAE describes several distinct phonological configurations of /æ/
found in North American English, which I will take as a starting point for the
discussion in this chapter. The relevant /æ/ configurations are the following:
• The nasal system: There is a sharp distinction between allophones of
/æ/ before nasals and in other environments. Prenasal tokens can be
as much as 300 Hz higher than pre-oral tokens for some speakers.
• The continuous system: This resembles the nasal system in that the
highest and frontest tokens of /æ/ are the prenasal ones; however,
there is no sharp gap in phonetic space between the prenasal and pre-
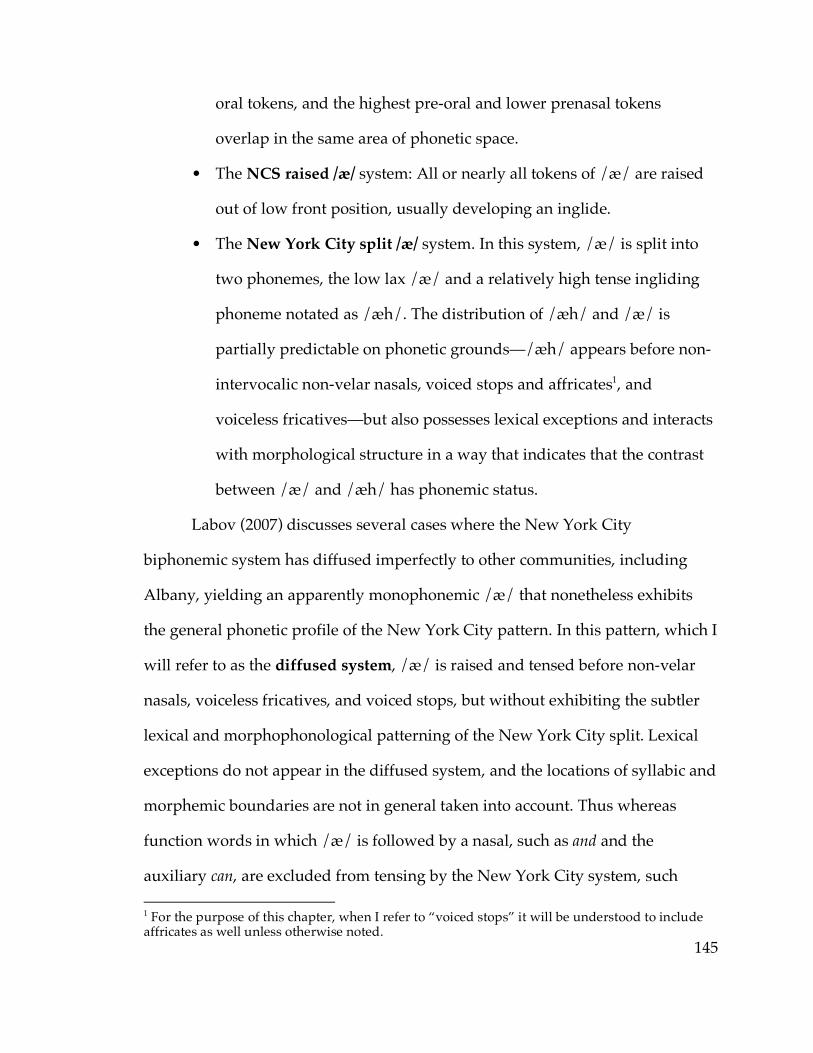
145
oral tokens, and the highest pre-oral and lower prenasal tokens
overlap in the same area of phonetic space.
• The NCS raised /æ/ system: All or nearly all tokens of /æ/ are raised
out of low front position, usually developing an inglide.
• The New York City split /æ/ system. In this system, /æ/ is split into
two phonemes, the low lax /æ/ and a relatively high tense ingliding
phoneme notated as /æh/. The distribution of /æh/ and /æ/ is
partially predictable on phonetic grounds—/æh/ appears before non-
intervocalic non-velar nasals, voiced stops and affricates1, and
voiceless fricatives—but also possesses lexical exceptions and interacts
with morphological structure in a way that indicates that the contrast
between /æ/ and /æh/ has phonemic status.
Labov (2007) discusses several cases where the New York City
biphonemic system has diffused imperfectly to other communities, including
Albany, yielding an apparently monophonemic /æ/ that nonetheless exhibits
the general phonetic profile of the New York City pattern. In this pattern, which I
will refer to as the diffused system, /æ/ is raised and tensed before non-velar
nasals, voiceless fricatives, and voiced stops, but without exhibiting the subtler
lexical and morphophonological patterning of the New York City split. Lexical
exceptions do not appear in the diffused system, and the locations of syllabic and
morphemic boundaries are not in general taken into account. Thus whereas
function words in which /æ/ is followed by a nasal, such as and and the
auxiliary can, are excluded from tensing by the New York City system, such 1 For the purpose of this chapter, when I refer to “voiced stops” it will be understood to include affricates as well unless otherwise noted.
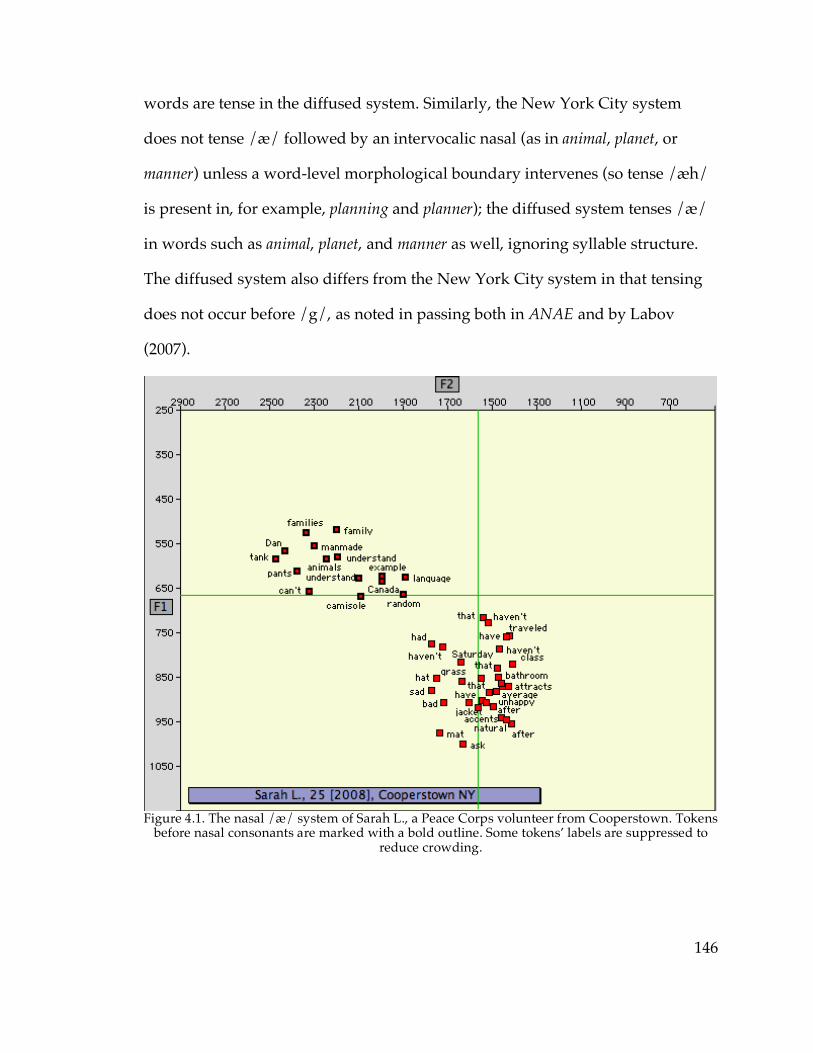
146
words are tense in the diffused system. Similarly, the New York City system
does not tense /æ/ followed by an intervocalic nasal (as in animal, planet, or
manner) unless a word-level morphological boundary intervenes (so tense /æh/
is present in, for example, planning and planner); the diffused system tenses /æ/
in words such as animal, planet, and manner as well, ignoring syllable structure.
The diffused system also differs from the New York City system in that tensing
does not occur before /g/, as noted in passing both in ANAE and by Labov
(2007).
Figure 4.1. The nasal /æ/ system of Sarah L., a Peace Corps volunteer from Cooperstown. Tokens
before nasal consonants are marked with a bold outline. Some tokens’ labels are suppressed to reduce crowding.
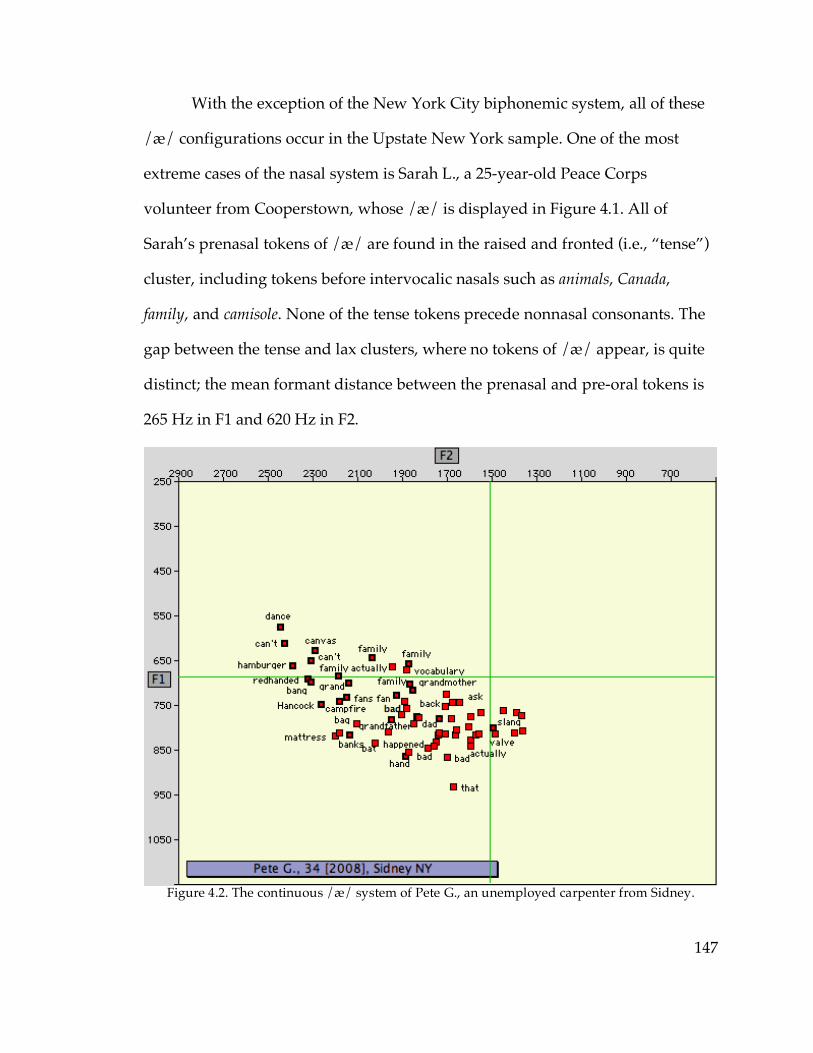
147
With the exception of the New York City biphonemic system, all of these
/æ/ configurations occur in the Upstate New York sample. One of the most
extreme cases of the nasal system is Sarah L., a 25-year-old Peace Corps
volunteer from Cooperstown, whose /æ/ is displayed in Figure 4.1. All of
Sarah’s prenasal tokens of /æ/ are found in the raised and fronted (i.e., “tense”)
cluster, including tokens before intervocalic nasals such as animals, Canada,
family, and camisole. None of the tense tokens precede nonnasal consonants. The
gap between the tense and lax clusters, where no tokens of /æ/ appear, is quite
distinct; the mean formant distance between the prenasal and pre-oral tokens is
265 Hz in F1 and 620 Hz in F2.
Figure 4.2. The continuous /æ/ system of Pete G., an unemployed carpenter from Sidney.
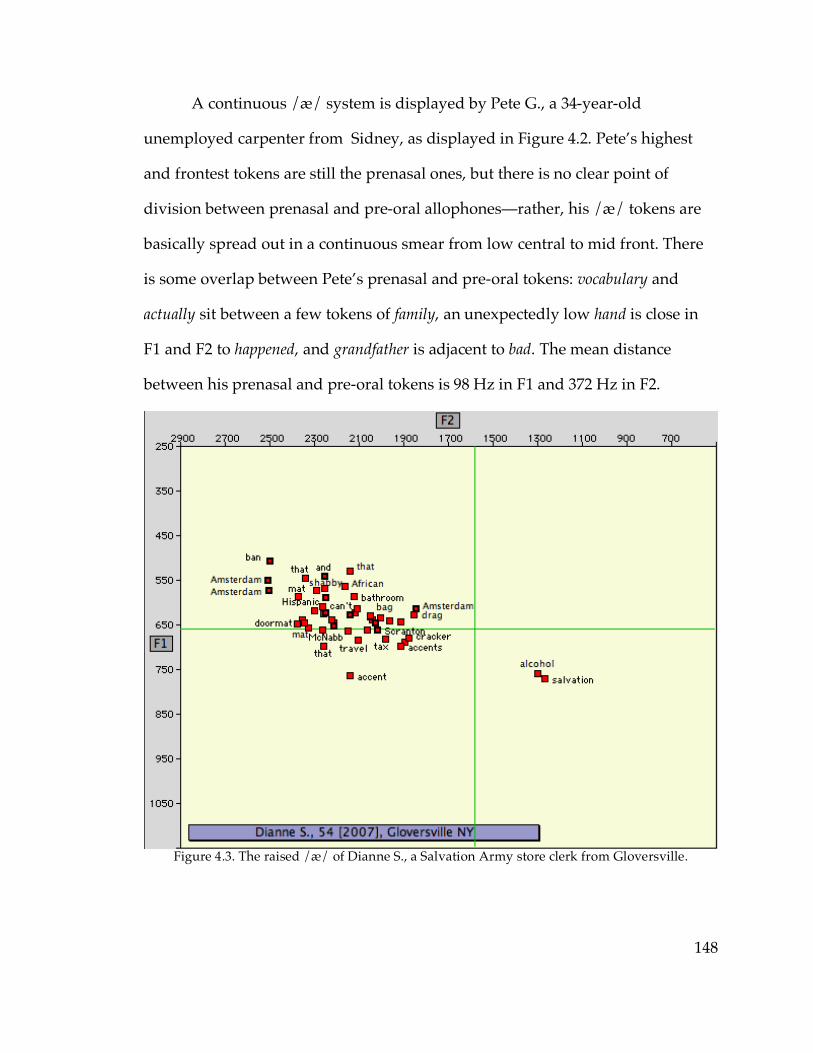
148
A continuous /æ/ system is displayed by Pete G., a 34-year-old
unemployed carpenter from Sidney, as displayed in Figure 4.2. Pete’s highest
and frontest tokens are still the prenasal ones, but there is no clear point of
division between prenasal and pre-oral allophones—rather, his /æ/ tokens are
basically spread out in a continuous smear from low central to mid front. There
is some overlap between Pete’s prenasal and pre-oral tokens: vocabulary and
actually sit between a few tokens of family, an unexpectedly low hand is close in
F1 and F2 to happened, and grandfather is adjacent to bad. The mean distance
between his prenasal and pre-oral tokens is 98 Hz in F1 and 372 Hz in F2.
Figure 4.3. The raised /æ/ of Dianne S., a Salvation Army store clerk from Gloversville.

149
An extreme example of the NCS raised /æ/ pattern is found in Dianne S.,
a 54-year-old Salvation Army store clerk from Gloversville, as shown in Figure
4.3. With the exception of two extremely back tokens before /l/ (alcohol and
salvation), all of her tokens of /æ/ are raised into the phonetic range that, for
speakers such as Sarah L., is occupied by only the prenasal tokens. So extreme is
Dianne S.’s raising that there is basically no distinction between her prenasal and
pre-oral tokens—prenasal tokens, marked with a bold outline in Figure 4.3, are
scattered more or less evenly throughout the whole /æ/ cluster. Her sole
concession, as it were, to the general cross-dialectal pattern of having prenasal
/æ/ tenser than pre-oral /æ/ is the fact that her three frontest tokens of /æ/ are
all prenasal—two tokens of Amsterdam and one of ban—but even then, her
backest token of /æ/ apart from the ones before /l/ is Amsterdam also.
Louie R., a 53-year-old retired retail worker from Poughkeepsie, seems to
exhibit the diffused system fairly clearly; his /æ/ tokens are shown in Figure 4.4.
Although there is not a large discrete gap between tense and lax, it is possible to
draw a line across Figure 4.4 to separate Louie’s /æ/ tokens into tenser and laxer
groups almost exactly according to the criteria predicted for the diffused system.
All of the prenasal tokens of /æ/ are above the red line except bang, in which
/æ/ precedes a velar nasal. Above the line are found tokens of /æ/ not only
before coda nasals (ban, Danbury, hand) regardless of function-word status (and,
can) but also before intervocalic nasals (Janet, family, manager) regardless of
morphological structure (planning and planners alongside planet and manners).
Similarly, with very few exceptions, tokens of /æ/ before voiceless fricatives and
voiced stops appear above the line (half, laugh, last, basketball, cashew; bad, cab)—
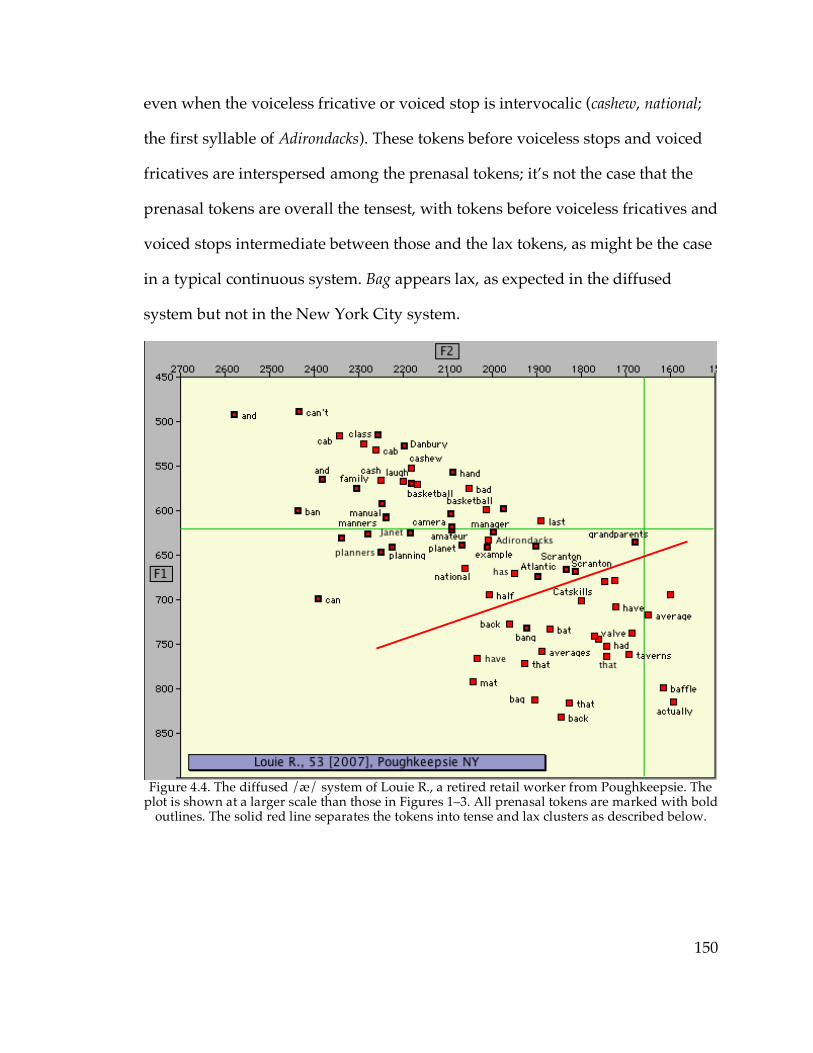
150
even when the voiceless fricative or voiced stop is intervocalic (cashew, national;
the first syllable of Adirondacks). These tokens before voiceless stops and voiced
fricatives are interspersed among the prenasal tokens; it’s not the case that the
prenasal tokens are overall the tensest, with tokens before voiceless fricatives and
voiced stops intermediate between those and the lax tokens, as might be the case
in a typical continuous system. Bag appears lax, as expected in the diffused
system but not in the New York City system.
Figure 4.4. The diffused /æ/ system of Louie R., a retired retail worker from Poughkeepsie. The
plot is shown at a larger scale than those in Figures 1–3. All prenasal tokens are marked with bold outlines. The solid red line separates the tokens into tense and lax clusters as described below.
151
Three unexplained exceptions to the expected diffused-system pattern
remain in Louie’s data: has, with a voiced fricative, is above the line2; and had and
baffle, with a voiced stop and a voiceless fricative, are below the line. These
exceptions are somewhat striking, especially baffle (about which more will be
said below); but Labov (2007) reports some degree of variability among speakers
of diffused /æ/ systems in several communities. I will discuss the diffused
system in detail first, before moving on to the relationship of the other /æ/
configurations to the geographic distribution of the NCS.
4.2. The diffused New York City /æ/ system
4.2.1. Structure of the diffused system
To judge whether a speaker displays the diffused /æ/ system, it is
certainly too strict to demand that they conform to its outlines (tense before
nonvelar nasals, voiced stops, and voiceless fricatives; lax elsewhere) in every
token of every word. Such a requirement would obviously exclude even speakers
who conform to the diffused system exactly as described but whose measured
/æ/ tokens appear to include a few exceptions—which could be speech errors,
measurement errors, or style-shifting or hypercorrection as easily as actual
phonological exceptions. Moreover, it’s useful also to allow some leeway for
variability between speakers: the system being described is the result of diffusion
of the New York City /æ/ system to other communities, and so we should allow
for the possibility that some speakers will represent earlier or later stages in the 2 Although tensing before voiced fricatives sometimes occurs in New York City, it has not been reported for the diffused system.
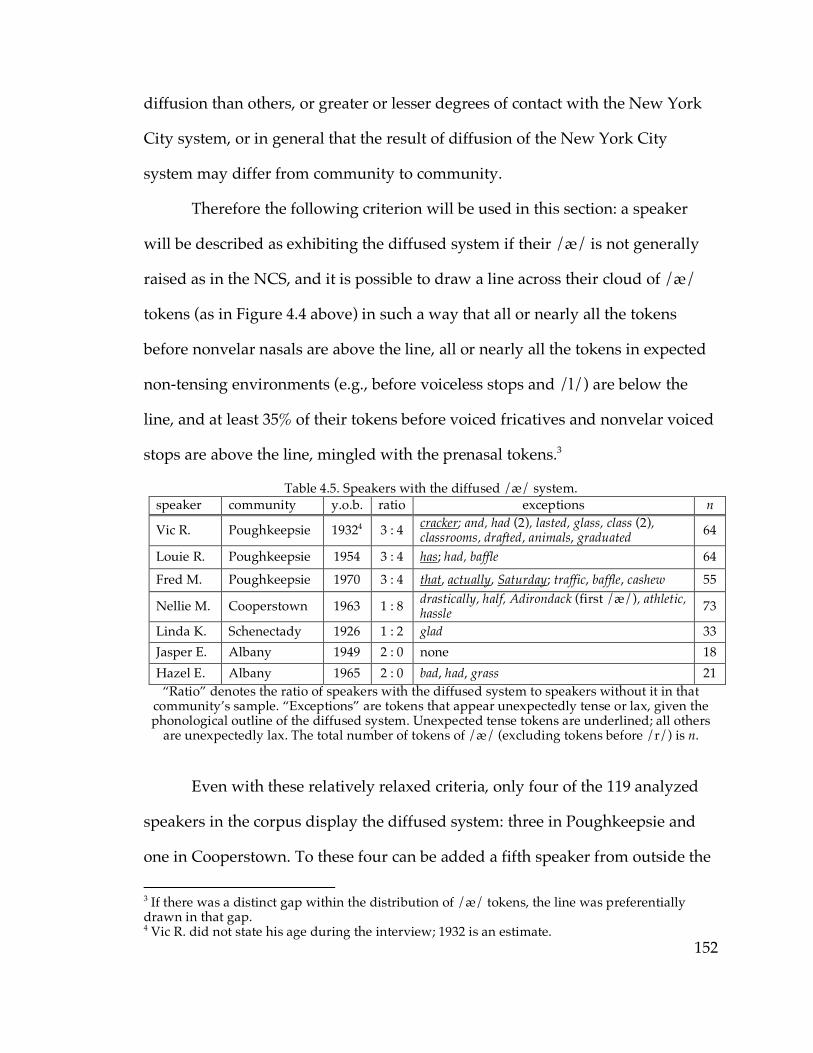
152
diffusion than others, or greater or lesser degrees of contact with the New York
City system, or in general that the result of diffusion of the New York City
system may differ from community to community.
Therefore the following criterion will be used in this section: a speaker
will be described as exhibiting the diffused system if their /æ/ is not generally
raised as in the NCS, and it is possible to draw a line across their cloud of /æ/
tokens (as in Figure 4.4 above) in such a way that all or nearly all the tokens
before nonvelar nasals are above the line, all or nearly all the tokens in expected
non-tensing environments (e.g., before voiceless stops and /l/) are below the
line, and at least 35% of their tokens before voiced fricatives and nonvelar voiced
stops are above the line, mingled with the prenasal tokens.3
Table 4.5. Speakers with the diffused /æ/ system. speaker community y.o.b. ratio exceptions n
Vic R. Poughkeepsie 19324 3 : 4 cracker; and, had (2), lasted, glass, class (2), classrooms, drafted, animals, graduated 64
Louie R. Poughkeepsie 1954 3 : 4 has; had, baffle 64 Fred M. Poughkeepsie 1970 3 : 4 that, actually, Saturday; traffic, baffle, cashew 55
Nellie M. Cooperstown 1963 1 : 8 drastically, half, Adirondack (first /æ/), athletic, hassle 73
Linda K. Schenectady 1926 1 : 2 glad 33 Jasper E. Albany 1949 2 : 0 none 18 Hazel E. Albany 1965 2 : 0 bad, had, grass 21 “Ratio” denotes the ratio of speakers with the diffused system to speakers without it in that
community’s sample. “Exceptions” are tokens that appear unexpectedly tense or lax, given the phonological outline of the diffused system. Unexpected tense tokens are underlined; all others
are unexpectedly lax. The total number of tokens of /æ/ (excluding tokens before /r/) is n.
Even with these relatively relaxed criteria, only four of the 119 analyzed
speakers in the corpus display the diffused system: three in Poughkeepsie and
one in Cooperstown. To these four can be added a fifth speaker from outside the
3 If there was a distinct gap within the distribution of /æ/ tokens, the line was preferentially drawn in that gap. 4 Vic R. did not state his age during the interview; 1932 is an estimate.
153
main corpus: Linda K., an 80-year-old woman from Schenectady, whose full
vowel system was not analyzed but whose /æ/ wordlist tokens were. The Telsur
corpus’s two speakers in Albany both display the diffused system as well.5 This
makes a total of seven known speakers of the diffused system in Upstate New
York, as summarized in Table 4.5.
The exceptions to the predicted realizations of /æ/ in these speakers’
productions can give us a bit more insight into the phonological parameters of
the diffused system. First of all—and not mentioned in Table 4.5—these seven
speakers confirm the observation that /æ/ is not tensed before /g/ in the
diffused system, even though /g/ is as regular a tensing environment as any
other in the New York City biphonemic pattern. Only ten tokens of /æg/ were
produced by these seven speakers, but not a single one was tensed.6 Labov (2007)
writes the following in noting that tensing before /g/ is absent in the diffused
system:
In the four cases of diffusion of the NYC short-a pattern presented above, phonetic conditioning by the following segment is the common thread, though the phonetic pattern is not perfectly transmitted. The voiced velars are excepted from the voiced stops, and tensing before voiceless fricatives is sometimes generalized to voiced fricatives. But the most regular differences are found at a more abstract level.
The “more abstract level” to which Labov refers is the function-word constraint,
and interaction with syllabic and morphemic structure; the diffused system
eliminates those more abstract constraints, simplifying the phonemic split to a
5 For one of the two Telsur speakers from Albany, Hazel E., the data on /æ/ is very sparse and ambiguous enough that it could be interpreted either as a somewhat weak diffused system or a continuous system; it is being construed here as a diffused system because Labov (2007) construes it as such, and because the fact that the other speaker from Albany, Jasper E., clearly has a diffused system biases me in favor of interpreting Hazel’s system as the same. 6 To be fair, Vic R. from Poughkeepsie did produce one token of bag fairly high and quite near the boundary I drew between the tense and lax clusters.
154
regular allophonic pattern. However, the exclusion of /g/ from tensing
environments can be understood as an example of a similar kind of phonological
simplification, rather than merely imperfect diffusion of the phonological
conditioning.
Even considered merely as a set of phonological environments, and
ignoring the lexical, morphological, and other effects, the New York City tensing
system is not phonologically natural. The environments in which tensing
occurs—nasals, voiced stops, and voiceless fricatives—have little in common and
don’t constitute a well-defined natural class. Attempts to succinctly categorize
the tensing environments are muddled even more by the fact that velar voiced
stops are included but velar nasals are excluded: not only is there a haphazard
collection of manners of articulation, but the different manners of articulation
don’t even act the same way at different places of articulation. Excluding velar
voiced stops from the tensing environment makes for a simpler phonological
rule in the diffused system: although the collection of manners of articulation is
still fairly miscellaneous, the behavior of places of articulation is at least
consistent; speakers don’t have to learn to treat velars differently depending on
whether they are stops or nasals.
This observation gives us some clearer insight into the constraints on
diffusion. Labov argues that the loss of the function-word and syllable-structure
constraints is evidence that “the main agents in diffusion are adults who are less
likely to observe and replicate abstract features of language structure,” and
instead only replicate the superficial phonetic patterning. But the case of /g/
shows that they do not replicate the phonetic pattern exactly either. Instead, at
155
the same time as the abstract structural features are ignored and the lexical
exceptions are eliminated, the surface phonetic pattern is streamlined and
simplified—the diffused pattern is more phonologically symmetrical. This is
reminiscent of Preston (2008)’s account of diffusion in the NCS, which will be
discussed more in Section 4.4 below: instead of mimicking the exact phonetic and
phonological distribution of the target system, the diffused system reworks it
into something more symmetrical. So when dialect features undergo diffusion,
it’s not only the abstract structural features that get dropped in favor of the more
obvious surface-level features; the surface-level features are structurally
simplified as well. The agents of diffusion modify the system to be not only more
transparent and more lexically regular, but also more phonologically regular. To
put it another way, not only does the diffused system eliminate lexical exceptions
(such as New York City’s tense avenue, while cavern is lax); it also eliminates
phonological exceptions (such as New York City’s tensing before /g/, while /ŋ/
is lax).
Although the seven speakers in Table 4.5 show overall relatively few
exceptions to the expected diffused pattern—a total of 30 exceptions among 328
tokens of /æ/, or about 9%—we can make some observations about the kind of
exceptions we see. For example, most of the exceptions are lax tokens of words
that the phonological description of the diffused system would predict to be
tense; only five out of thirty exceptions are apparently tense tokens of /æ/ in
expected non-tensing environments (cracker, has, that, actually, Saturday). This is
unsurprising: the diffused system has tensing in, for the most part, a strictly
larger set of words than either the nasal system or the New York City split
156
system. Therefore, to the extent that the diffused system is influenced by other
/æ/ systems, that influence is more likely to take the form of laxing in expected
tensing environments than the reverse. Similarly, only two of the 25
exceptionally lax tokens are prenasal, while the other 23 are before voiced stops
and voiceless fricatives. In other words, almost all of the speakers of the diffused
system are categorical in their tensing before nonvelar nasals, but almost all are
more or less variable in the other tensing environments of the diffused system.
Again, this is unsurprising: all of these speakers live in communities (conceivably
with the exception of Albany) in which the nasal system is also present among
native speakers. Speakers growing up in a community in which both the nasal
system and the diffused system are present will have more consistent
reinforcement for tensing before nasals than for tensing in other environments.
The existence of exceptions to the expected tensing pattern, including
exceptions which appear multiple times in Table 4.5, such as had and baffle, raises
the specter of lexical exceptions to what is argued above to be a regular
allophonic rule, diffused by a process that is supposed to eliminate the
possibility of lexical exceptions. However, a closer look at the data reduces the
likelihood that the words which appear as exceptions in Table 4.5 are actually
lexical exceptions to the tensing rule. Many of these word types occur both as
exceptions and as non-exceptions, frequently within the same speaker. For
example, Fred M. has one tense and one lax token of actually; Nellie M. has one
tense and one lax token of half; Vic R. has one tense and one lax token of and; and
Hazel E. has one lax and two tense tokens of bad. Baffle (a word list item) appears
lax for Louie R. and Fred M., but tense for Vic R. So what appears to be going on
157
is not that there are lexical exceptions to a categorical /æ/-tensing rule, but
rather either that these exceptions are sporadic speech errors or cases of
indistinct recording, or that the tensing rule is variably applied.
If tensing in the diffused /æ/ system is actually a variable, we should
expect to see systematic constraints influencing the probability of tensing or
laxing in different environments. At a first glance at Table 4.5, at least one such
possible constraint pops out: of the 23 unexpectedly lax tokens before voiced
stops and voiceless fricatives, as many as ten (43%) are preceded by obstruent-
liquid clusters: glass, drafted, graduated, traffic, drastically, glad, grass, classrooms,
and two tokens of class. These seven speakers produce fully 80 tokens of /æ/
before nonvelar voiced stops and voiceless fricatives, of which only 14 are
preceded by obstruent-liquid clusters. So, to put it another way, ten out of
fourteen tokens (71%) with obstruent-liquid cluster onsets are unexpectedly lax,
while only 13 out of 66 such tokens (20%) with other onsets (or no onsets) are lax.
In other words, a token of /æ/ has a relatively high probability of being
lax if it is preceded by an obstruent-liquid cluster, even if on the basis of the
following consonant it would be predicted to be tense. This constraint in itself is
not surprising: preceding obstruent-liquid clusters are regularly one of the most
disfavoring environments for raising of /æ/ across dialects of American English,
in both NCS /æ/ raising and the continuous /æ/ system (ANAE: p.177, 180). But
it might have been supposed that, in the diffused system, the obstruent-liquid
tokens of /æ/ would merely have appeared among the lowest members of the
tense class, as they do in the /æ/ systems of speakers from Trenton, N.J. and
Baltimore, Md. displayed in ANAE; instead, in the diffused system, these tokens
158
appear within the lax class, and often among the lowest lax tokens.7 And yet
obstruent-liquid onsets do not categorically block tensing in the diffused system,
the way following /g/ appears to; there are still four tokens with obstruent-
liquid onsets and voiceless-fricative codas that are tense in these speakers’ data
(class for Louie R. and Fred M., demographics for Fred M., and grass for Nellie M.).
Meanwhile, none of the 19 prenasal tokens of /æ/ with obstruent-liquid onsets
are lax. The general pattern here appears to be one of robustly interacting
constraints favoring and disfavoring the application of a variable rule.
A logistic regression of the effects of phonological factors8 on tensing of
/æ/ for these seven speakers yields the results shown in Table 4.6, which do not
include many surprises. The near-categorical tensing before nasals and near-
categorical laxing before voiceless stops, voiced fricatives, and velars were
remarked upon above; most of the variation is in tokens before non-velar voiced
stops and voiceless fricatives. An obstruent-liquid cluster in the onset suppresses
tensing with a factor weight of 0.277: strong enough to outweigh the relatively
weak tensing effect of a voiceless fricative or voiced stop, but not strong enough
to prevent tensing before a nasal. On the observation that baffle, hassle, and athletic
were all among the exceptions listed in Table 4.5, the presence of /l/ as the
second consonant after /æ/ was added to the analysis; its effect was found to be
7 This is reminiscent of the effect of preceding obstruent-liquid clusters on the Great Vowel Shift of Early Modern English, as described by Labov (1994). In the change from Middle English /ɛ:/ to Modern English /iy/, several words with obstruent-initial onsets were left behind as /ey/ (great, break), rather than merely becoming the lowest tokens of /iy/. 8 Social factors such as age, gender, and community were excluded on the grounds that these seven speakers are a very small sample, and therefore probably not a very representative sample, of speakers of the diffused system.
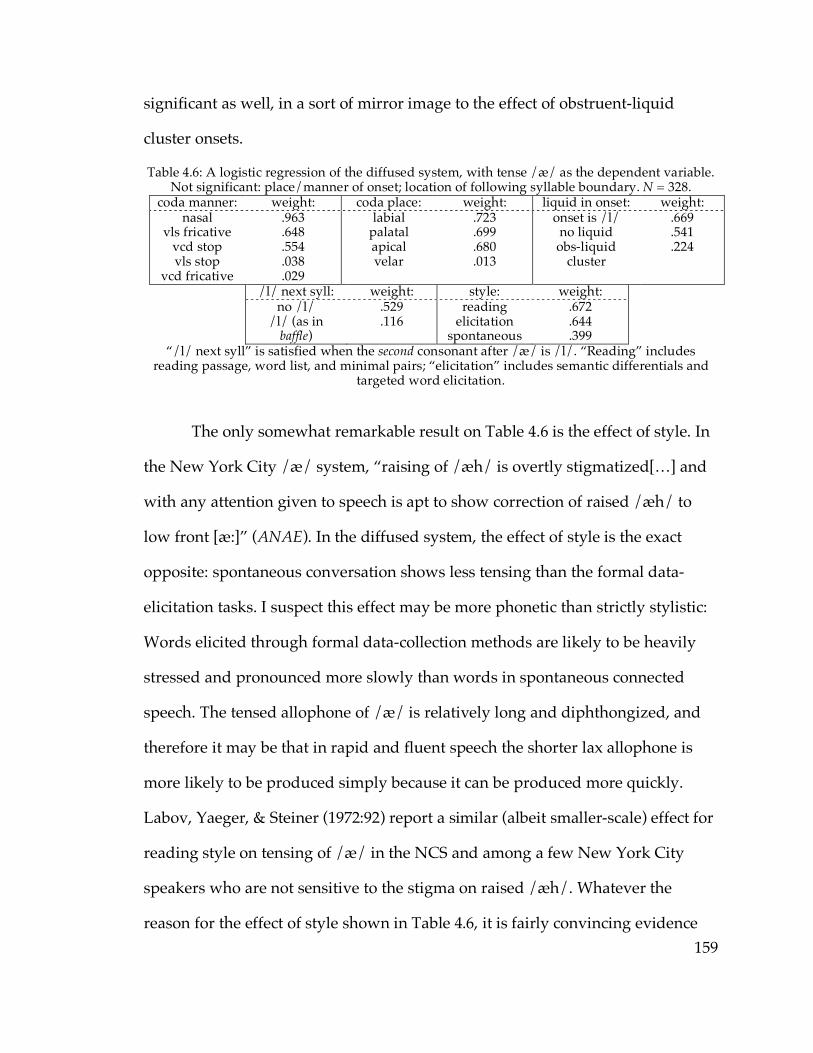
159
significant as well, in a sort of mirror image to the effect of obstruent-liquid
cluster onsets.
Table 4.6: A logistic regression of the diffused system, with tense /æ/ as the dependent variable. Not significant: place/manner of onset; location of following syllable boundary. N = 328.
coda manner: weight: coda place: weight: liquid in onset: weight: nasal
vls fricative vcd stop vls stop
vcd fricative
.963
.648
.554
.038
.029
labial palatal apical velar
.723
.699
.680
.013
onset is /l/ no liquid obs-liquid
cluster
.669
.541
.224
/l/ next syll: weight: style: weight: no /l/
/l/ (as in baffle)
.529
.116 reading
elicitation spontaneous
.672
.644
.399 “/l/ next syll” is satisfied when the second consonant after /æ/ is /l/. “Reading” includes
reading passage, word list, and minimal pairs; “elicitation” includes semantic differentials and targeted word elicitation.
The only somewhat remarkable result on Table 4.6 is the effect of style. In
the New York City /æ/ system, “raising of /æh/ is overtly stigmatized[…] and
with any attention given to speech is apt to show correction of raised /æh/ to
low front [æ:]” (ANAE). In the diffused system, the effect of style is the exact
opposite: spontaneous conversation shows less tensing than the formal data-
elicitation tasks. I suspect this effect may be more phonetic than strictly stylistic:
Words elicited through formal data-collection methods are likely to be heavily
stressed and pronounced more slowly than words in spontaneous connected
speech. The tensed allophone of /æ/ is relatively long and diphthongized, and
therefore it may be that in rapid and fluent speech the shorter lax allophone is
more likely to be produced simply because it can be produced more quickly.
Labov, Yaeger, & Steiner (1972:92) report a similar (albeit smaller-scale) effect for
reading style on tensing of /æ/ in the NCS and among a few New York City
speakers who are not sensitive to the stigma on raised /æh/. Whatever the
reason for the effect of style shown in Table 4.6, it is fairly convincing evidence
160
that the New York City stigmatization of tensed /æh/ is absent from the
diffused system as it exists in Upstate New York. So just as not all of the
phonological and lexical constraints on the New York City /æ/ pattern are
preserved when it undergoes diffusion, neither is the social evaluation.
Several of the lax exceptions in Table 4.5 are not accounted for by the
phonological features selected as significant in the variable-rules analysis
displayed in Table 4.6: and, had (four times), lasted, animals, cashew, half,
Adirondack, and bad. It is to be expected, of course, in a probabilistic grammar
such as the variable-rules model posits, that there might be a few tokens that
defy the constraints on variation and appear unexpectedly lax or tense. In fact,
each of those eight lexical items has at least one tense token9 among the seven
diffused-system speakers. However, it also appears noteworthy that eight out of
those eleven lax tokens—all but lasted, half, and bad—are lax in the New York
City biphonemic system. Indeed, several of the lax exceptions that are accounted
for by the phonetic constraints in Table 4.6 are lax in New York City as well: fully
14 of the 25.
When the status of each word in the New York City system is added to the
variable-rules analysis, it is selected as a significant factor, as shown in Table 4.7.
Including the New York City split /æ/ system as a factor eliminates the effect of
following /l/. This is no surprise: the four lax exceptions with following /l/
(athletic, hassle, and two tokens of baffle) are all lax in the New York City system
as well.
9 With the possible exception of had—the one token of had produced by Fred M. was coded as tense, but was very near the boundary and might have been miscoded. With four lax tokens and one ambiguous, had is the closest there is to a clear categorical lexical exception to tensing in this data.
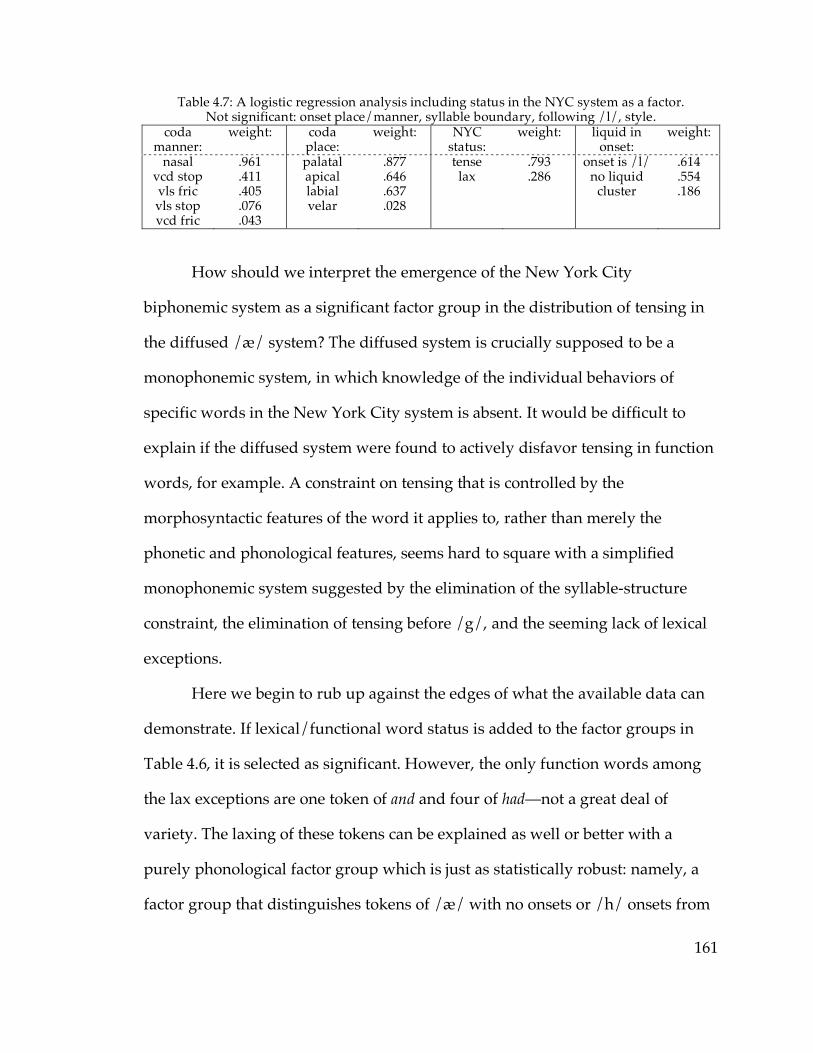
161
Table 4.7: A logistic regression analysis including status in the NYC system as a factor. Not significant: onset place/manner, syllable boundary, following /l/, style.
coda manner:
weight: coda place:
weight: NYC status:
weight: liquid in onset:
weight:
nasal vcd stop vls fric vls stop vcd fric
.961
.411
.405
.076
.043
palatal apical labial velar
.877
.646
.637
.028
tense lax
.793
.286
onset is /l/ no liquid
cluster
.614
.554
.186
How should we interpret the emergence of the New York City
biphonemic system as a significant factor group in the distribution of tensing in
the diffused /æ/ system? The diffused system is crucially supposed to be a
monophonemic system, in which knowledge of the individual behaviors of
specific words in the New York City system is absent. It would be difficult to
explain if the diffused system were found to actively disfavor tensing in function
words, for example. A constraint on tensing that is controlled by the
morphosyntactic features of the word it applies to, rather than merely the
phonetic and phonological features, seems hard to square with a simplified
monophonemic system suggested by the elimination of the syllable-structure
constraint, the elimination of tensing before /g/, and the seeming lack of lexical
exceptions.
Here we begin to rub up against the edges of what the available data can
demonstrate. If lexical/functional word status is added to the factor groups in
Table 4.6, it is selected as significant. However, the only function words among
the lax exceptions are one token of and and four of had—not a great deal of
variety. The laxing of these tokens can be explained as well or better with a
purely phonological factor group which is just as statistically robust: namely, a
factor group that distinguishes tokens of /æ/ with no onsets or /h/ onsets from
162
tokens of /æ/ preceded by consonants with place features. There’s simply not
enough data to determine whether the fact that and and had are function words
contributes to their appearances with lax /æ/ among the diffused-system
speakers, or whether it is a coincidence due to the fact that the /æ/ in both
words has no consonantal place features preceding it. By the same token, then,
without collecting more data it will be difficult to tell if the emergence of the
New York City system as a significant factor group in Table 4.7 is an unexpected
direct influence of the more abstract constraints of the New York City /æ/
distribution, or just an accident owing to the fact that this set of speakers
happens to have produced several words in which /æ/ is preceded by zero or
/h/, or followed by a voiceless fricative plus /l/.
There are some reasons to accept the direct involvement of the New York
biphonemic system as plausible even despite the usual interpretation of the
diffused system as monophonemic and phonologically regular. These stem
basically from the fact that the set of speakers being examined here is not large
enough to detect systematic differences in the phonology of the diffused system
between demographic groups (age groups, communities, or whatever), and so
out of necessity this discussion has assumed that a single diffused system is
being described. But there may be reasons for some of the speakers in this small
set to have some more direct influence from the New York City system. Fred
M.’s mother was born in New York City, and it is possible that he may have
ended up with a marginal biphonemic system with some traces of New York
City characteristics: although syllable structure was never selected as significant
in any of the variable-rules analyses mentioned in this section, all of Fred’s lax
163
exceptions are words that are lax in New York City on account of syllable
structure (baffle, cashew, traffic). Vic R. could conceivably be one of the agents of
diffusion of the /æ/ system: he is an elderly lifelong Poughkeepsie resident who
made frequent trips to New York City for most of his life, and could conceivably
have picked up sporadic features of the New York City system which were
regularized into the diffused system by the speech community as a whole. But at
this point I have clearly entered the domain of speculation far beyond what this
sparse data set on the structure of the diffused system can tell me, and had best
move on.
4.2.2. Dialectology of the diffused system
The communities in which the diffused /æ/ system is found in at least
one speaker are marked on Map 4.8. Given that the diffused system was already
known to be present in Albany, it is unsurprising to find it also attested in
Poughkeepsie and Schenectady. Poughkeepsie is located approximately halfway
between Albany and New York City; the northern terminus of one of New York
City’s Metro-North commuter train lines is in Poughkeepsie. The presence of this
/æ/ system in Albany is thought to be the result of imperfect diffusion of New
York City’s biphonemic system, and since Poughkeepsie is substantially closer to
New York City than Albany and has direct commuter access to it, it seems
reasonable to expect the presence of diffused features from New York City to be
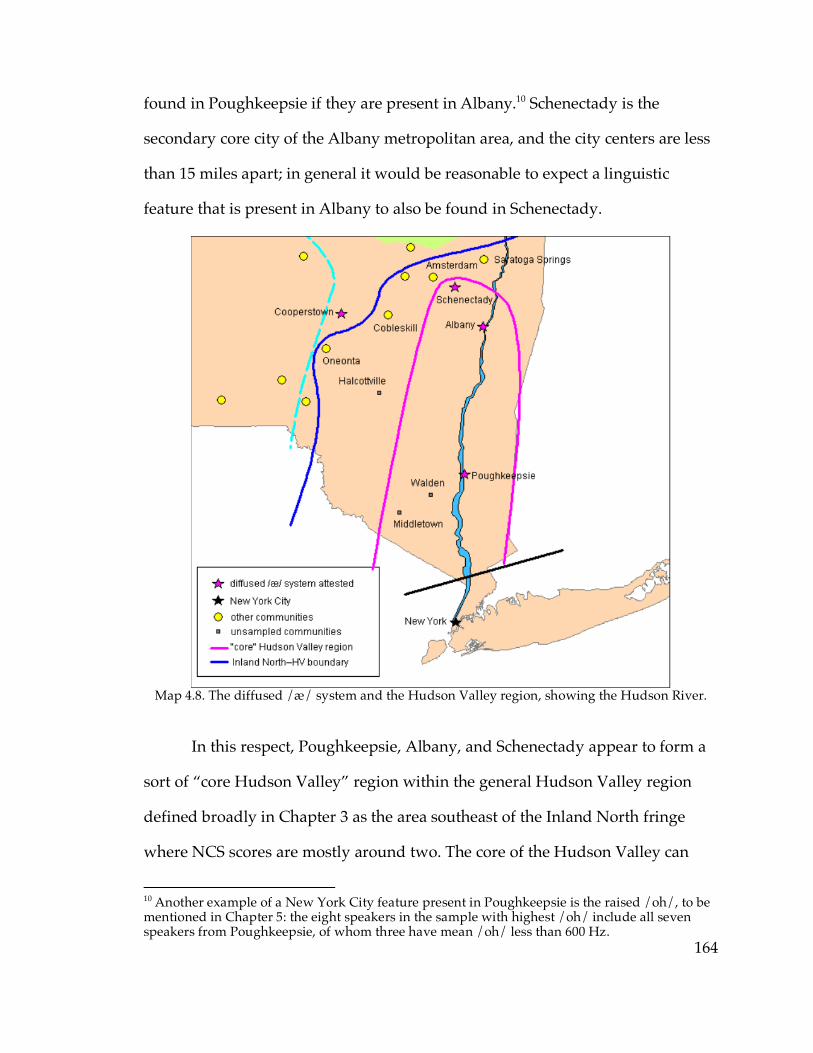
164
found in Poughkeepsie if they are present in Albany.10 Schenectady is the
secondary core city of the Albany metropolitan area, and the city centers are less
than 15 miles apart; in general it would be reasonable to expect a linguistic
feature that is present in Albany to also be found in Schenectady.
Map 4.8. The diffused /æ/ system and the Hudson Valley region, showing the Hudson River.
In this respect, Poughkeepsie, Albany, and Schenectady appear to form a
sort of “core Hudson Valley” region within the general Hudson Valley region
defined broadly in Chapter 3 as the area southeast of the Inland North fringe
where NCS scores are mostly around two. The core of the Hudson Valley can
10 Another example of a New York City feature present in Poughkeepsie is the raised /oh/, to be mentioned in Chapter 5: the eight speakers in the sample with highest /oh/ include all seven speakers from Poughkeepsie, of whom three have mean /oh/ less than 600 Hz.
165
thus be defined as the area, apparently on the whole close to the Hudson itself11,
in which NCS scores are around two and there is evidence of the influence of
New York City phonological features such as the diffused /æ/ system. From this
perspective, Amsterdam and Oneonta, within the broad “Hudson Valley” region
but without apparent influence from New York City features, can be regarded as
part of a transitional region, between the Inland North fringe and the core of the
Hudson Valley, as shown on Map 4.8.
The presence of the diffused system in Cooperstown is somewhat more
remarkable. Although Cooperstown’s phonology is moving in apparent time
away from the NCS, it appears to be at least historically part of the Inland North
fringe, not the Hudson Valley. Cooperstown does not appear to share any other
unexpected features with New York City; unlike Poughkeepsie and Albany, it
doesn’t have a particularly high /oh/ and is in fact trending toward the caught-
cot merger. It does not appear to have a particularly close historical link with
New York City. Since only one speaker in Cooperstown out of nine exhibits the
diffused system, however, it may be informative to look at her particular history.
Nellie M. describes her parents as having been born and raised in
Middletown and Walden. These two communities (shown on Map 4.8) are in
Orange County, roughly 100 miles south of Cooperstown, approximately the
same distance from New York City as Poughkeepsie is, and within 25 miles of
the Hudson River; Middletown is served by the Metro-North railroad. Although
I do not possess any direct dialectological information about Middletown and
Walden, based on those geographical features they seem likely to be within the 11 Albany and Poughkeepsie are located on the Hudson River, and Schenectady is obviously less than 15 miles from it.
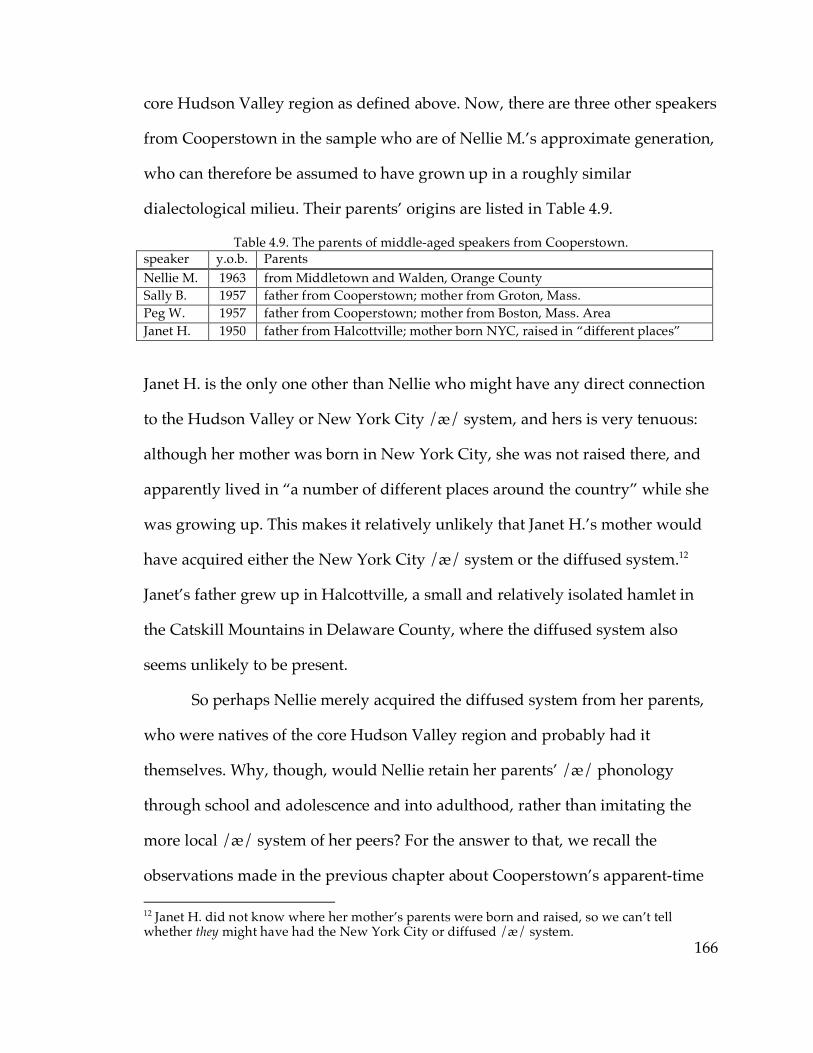
166
core Hudson Valley region as defined above. Now, there are three other speakers
from Cooperstown in the sample who are of Nellie M.’s approximate generation,
who can therefore be assumed to have grown up in a roughly similar
dialectological milieu. Their parents’ origins are listed in Table 4.9.
Table 4.9. The parents of middle-aged speakers from Cooperstown. speaker y.o.b. Parents Nellie M. 1963 from Middletown and Walden, Orange County Sally B. 1957 father from Cooperstown; mother from Groton, Mass. Peg W. 1957 father from Cooperstown; mother from Boston, Mass. Area Janet H. 1950 father from Halcottville; mother born NYC, raised in “different places”
Janet H. is the only one other than Nellie who might have any direct connection
to the Hudson Valley or New York City /æ/ system, and hers is very tenuous:
although her mother was born in New York City, she was not raised there, and
apparently lived in “a number of different places around the country” while she
was growing up. This makes it relatively unlikely that Janet H.’s mother would
have acquired either the New York City /æ/ system or the diffused system.12
Janet’s father grew up in Halcottville, a small and relatively isolated hamlet in
the Catskill Mountains in Delaware County, where the diffused system also
seems unlikely to be present.
So perhaps Nellie merely acquired the diffused system from her parents,
who were natives of the core Hudson Valley region and probably had it
themselves. Why, though, would Nellie retain her parents’ /æ/ phonology
through school and adolescence and into adulthood, rather than imitating the
more local /æ/ system of her peers? For the answer to that, we recall the
observations made in the previous chapter about Cooperstown’s apparent-time 12 Janet H. did not know where her mother’s parents were born and raised, so we can’t tell whether they might have had the New York City or diffused /æ/ system.
167
behavior with respect to the NCS. In the previous chapter, Cooperstown was
interpreted as originally part of the Inland North dialect region, perhaps the
Inland North fringe, but more recently moving away from the NCS. Of the four
speakers listed in Table 4.9, one (Peg W.) has an EQ1 index13 of +75—quite high
even for the Inland North fringe—while the other three (including Nellie M.)
have EQ1 indices of –99 or lower, lower than any speaker sampled in the Inland
North fringe proper. (The younger Cooperstown speakers’ EQ1 indices are lower
still.) So the picture that seems to emerge is that, in the 1950s and 1960s,
Cooperstown was not a typical Inland North fringe community in the sense that,
say, Watertown or Glens Falls is today, in which some speakers have the full
NCS but even those who don’t have a relatively high EQ1 index; rather, it was a
speech community already in flux, including both NCS speakers and low-EQ1
Hudson Valley–type speakers, and there were children acquiring both systems.14
Into that mix come Nellie M.’s parents, with their diffused /æ/ system, which
presumably Nellie acquired from them before starting school. Once she started
school, ordinarily she might have been expected to start acquiring the /æ/
system of her peers, which would overrule that of her parents. But during the
time when Nellie was growing up, it seems as if there wasn’t any general
community norm for the phonology of /æ/—some of her peers might have had
the NCS, with /æ/ generally raised, while others had nasal or continuous
systems. If there was no identifiably coherent community /æ/ system among
13 Recall that the EQ1 index is defined as the difference in Hz in F1 between mean /æ/ and mean /e/—a more positive EQ1 index indicates a greater degree of NCS-like raising. 14 Particularly notable are Sally B. and Peg W., who are the same age and whose parents have the exact same dialectological background; somehow one of them ended up without the NCS and the other with it.

168
Nellie’s peers, then there would be nothing in particular to replace her parents’
diffused system in her own phonology. Thus Nellie’s diffused /æ/ system
constitutes further evidence that, in the 1950s and 1960s, Cooperstown was a
speech community was already in an unsettled and heterogeneous state. The
dialectological history of Cooperstown will be touched upon further in Chapter
5.
Cooperstown’s /æ/ appears to have settled down somewhat since then.
The four younger Cooperstown speakers in my sample, born between 1983 and
1991, all display the nasal /æ/ system and EQ1 indices between –125 and –150—
even Kelly R., whose father is from New Jersey and whose mother is from Long
Island, both likely suspects for the diffused system or New York City split
pattern. It is not surprising that the community settled on the nasal system;
outside the NCS communities, as will be seen below, for the most part the nasal
system dominates in the sample.
4.3. Short-a systems and the Northern Cities Shift
4.3.1. The NCS raised continuous /æ/ system
Criteria for determining whether a speaker exhibits the NCS raised /æ/
system are not stated explicitly in ANAE. We could make the assumption that
any speaker who conforms sufficiently well to the various indices of the NCS
discussed in the foregoing chapter—who has some combination of a sufficiently
high NCS score, sufficiently high EQ1 index, and sufficiently low mean F1 of
/æ/—should be regarded as an example of the raised /æ/ system. However,
169
those indices ignore information about the relationship between allophones of
/æ/, and therefore, as we will see below, obscure differences between the /æ/
phonologies of different speakers of the NCS. Therefore we will not assume that
all speakers who have been described so far as participating in the NCS must ipso
facto display the raised /æ/ system.
Chapter 13 of ANAE mentions two general characteristics of the raised
/æ/ pattern. The first of course, is that it involves “the general tensing, raising,
and fronting of all short-a”; the speaker who is chosen to exemplify the raised
system is described as having a distribution of /æ/ in which “the most
conservative tokens[…] have vacated the low front area and are established in
lower mid position.” The second is that “in the raised /æ/ system the pre-nasal
allophones are not distinctly separated from the rest of the class”; this stipulation
makes the raised system more or less a subspecies of the continuous system,
defined earlier in this chapter. To be more precise, then, we may refer to this /æ/
configuration, identified merely as the “raised” system in ANAE, as the raised
continuous system.
These characteristics suggest some criteria that we can employ to classify a
speaker as possessing the raised continuous system. First, any speaker who
displays a distinct separation between prenasal and pre-oral allophones of /æ/,
characteristic of the nasal system, will be excluded. For each speaker in the
sample, I have judged impressionistically by eye whether such a “distinct
separation” exists, according to the following general guidelines15: A speaker was
judged to have the nasal system if their prenasal and pre-oral allophones, with
15 Tokens before /ŋ/ or /r/ were disregarded in making these judgments.
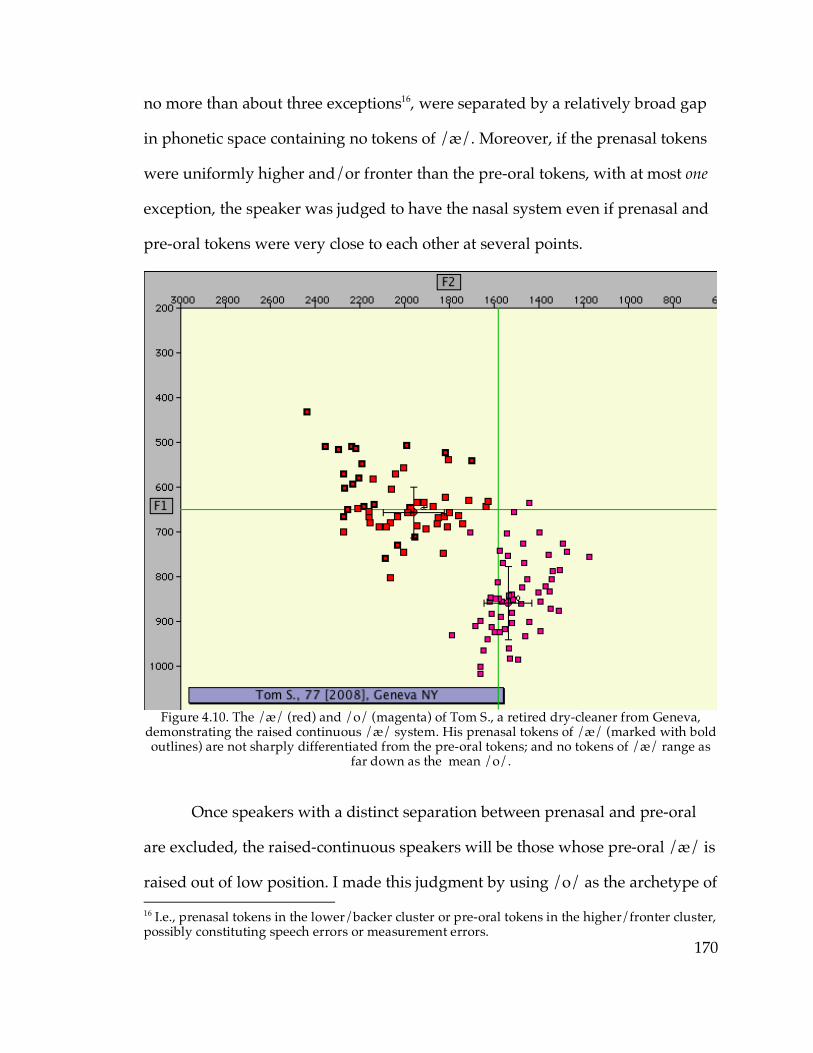
170
no more than about three exceptions16, were separated by a relatively broad gap
in phonetic space containing no tokens of /æ/. Moreover, if the prenasal tokens
were uniformly higher and/or fronter than the pre-oral tokens, with at most one
exception, the speaker was judged to have the nasal system even if prenasal and
pre-oral tokens were very close to each other at several points.
Figure 4.10. The /æ/ (red) and /o/ (magenta) of Tom S., a retired dry-cleaner from Geneva,
demonstrating the raised continuous /æ/ system. His prenasal tokens of /æ/ (marked with bold outlines) are not sharply differentiated from the pre-oral tokens; and no tokens of /æ/ range as
far down as the mean /o/.
Once speakers with a distinct separation between prenasal and pre-oral
are excluded, the raised-continuous speakers will be those whose pre-oral /æ/ is
raised out of low position. I made this judgment by using /o/ as the archetype of 16 I.e., prenasal tokens in the lower/backer cluster or pre-oral tokens in the higher/fronter cluster, possibly constituting speech errors or measurement errors.
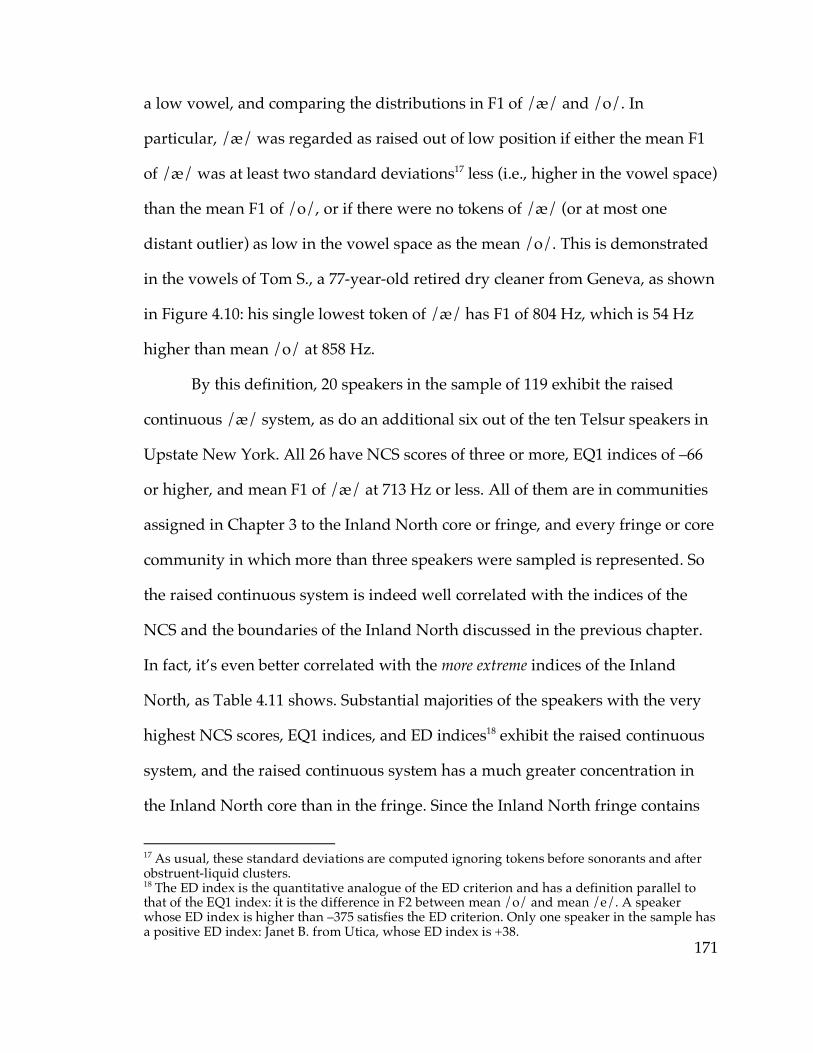
171
a low vowel, and comparing the distributions in F1 of /æ/ and /o/. In
particular, /æ/ was regarded as raised out of low position if either the mean F1
of /æ/ was at least two standard deviations17 less (i.e., higher in the vowel space)
than the mean F1 of /o/, or if there were no tokens of /æ/ (or at most one
distant outlier) as low in the vowel space as the mean /o/. This is demonstrated
in the vowels of Tom S., a 77-year-old retired dry cleaner from Geneva, as shown
in Figure 4.10: his single lowest token of /æ/ has F1 of 804 Hz, which is 54 Hz
higher than mean /o/ at 858 Hz.
By this definition, 20 speakers in the sample of 119 exhibit the raised
continuous /æ/ system, as do an additional six out of the ten Telsur speakers in
Upstate New York. All 26 have NCS scores of three or more, EQ1 indices of –66
or higher, and mean F1 of /æ/ at 713 Hz or less. All of them are in communities
assigned in Chapter 3 to the Inland North core or fringe, and every fringe or core
community in which more than three speakers were sampled is represented. So
the raised continuous system is indeed well correlated with the indices of the
NCS and the boundaries of the Inland North discussed in the previous chapter.
In fact, it’s even better correlated with the more extreme indices of the Inland
North, as Table 4.11 shows. Substantial majorities of the speakers with the very
highest NCS scores, EQ1 indices, and ED indices18 exhibit the raised continuous
system, and the raised continuous system has a much greater concentration in
the Inland North core than in the fringe. Since the Inland North fringe contains
17 As usual, these standard deviations are computed ignoring tokens before sonorants and after obstruent-liquid clusters. 18 The ED index is the quantitative analogue of the ED criterion and has a definition parallel to that of the EQ1 index: it is the difference in F2 between mean /o/ and mean /e/. A speaker whose ED index is higher than –375 satisfies the ED criterion. Only one speaker in the sample has a positive ED index: Janet B. from Utica, whose ED index is +38.
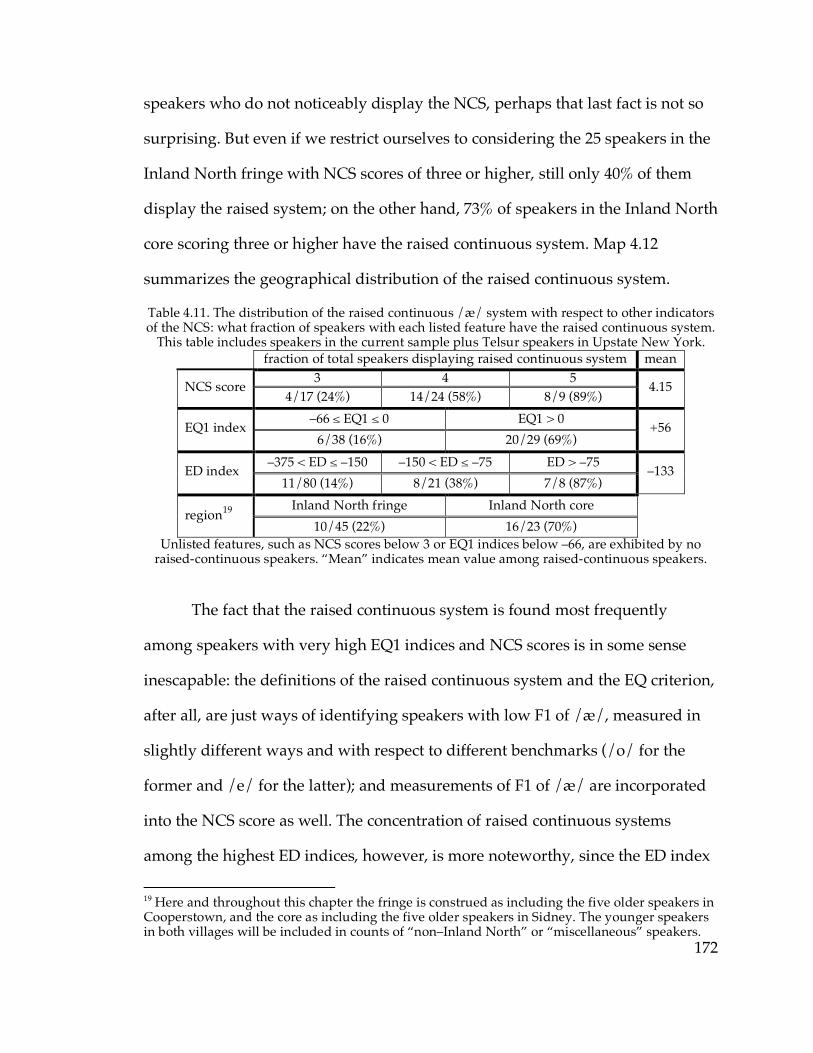
172
speakers who do not noticeably display the NCS, perhaps that last fact is not so
surprising. But even if we restrict ourselves to considering the 25 speakers in the
Inland North fringe with NCS scores of three or higher, still only 40% of them
display the raised system; on the other hand, 73% of speakers in the Inland North
core scoring three or higher have the raised continuous system. Map 4.12
summarizes the geographical distribution of the raised continuous system.
Table 4.11. The distribution of the raised continuous /æ/ system with respect to other indicators of the NCS: what fraction of speakers with each listed feature have the raised continuous system.
This table includes speakers in the current sample plus Telsur speakers in Upstate New York. fraction of total speakers displaying raised continuous system mean
3 4 5 NCS score 4/17 (24%) 14/24 (58%) 8/9 (89%)
4.15
–66 ≤ EQ1 ≤ 0 EQ1 > 0 EQ1 index 6/38 (16%) 20/29 (69%)
+56
–375 < ED ≤ –150 –150 < ED ≤ –75 ED > –75 ED index 11/80 (14%) 8/21 (38%) 7/8 (87%)
–133
Inland North fringe Inland North core region19
10/45 (22%) 16/23 (70%) Unlisted features, such as NCS scores below 3 or EQ1 indices below –66, are exhibited by no
raised-continuous speakers. “Mean” indicates mean value among raised-continuous speakers.
The fact that the raised continuous system is found most frequently
among speakers with very high EQ1 indices and NCS scores is in some sense
inescapable: the definitions of the raised continuous system and the EQ criterion,
after all, are just ways of identifying speakers with low F1 of /æ/, measured in
slightly different ways and with respect to different benchmarks (/o/ for the
former and /e/ for the latter); and measurements of F1 of /æ/ are incorporated
into the NCS score as well. The concentration of raised continuous systems
among the highest ED indices, however, is more noteworthy, since the ED index
19 Here and throughout this chapter the fringe is construed as including the five older speakers in Cooperstown, and the core as including the five older speakers in Sidney. The younger speakers in both villages will be included in counts of “non–Inland North” or “miscellaneous” speakers.
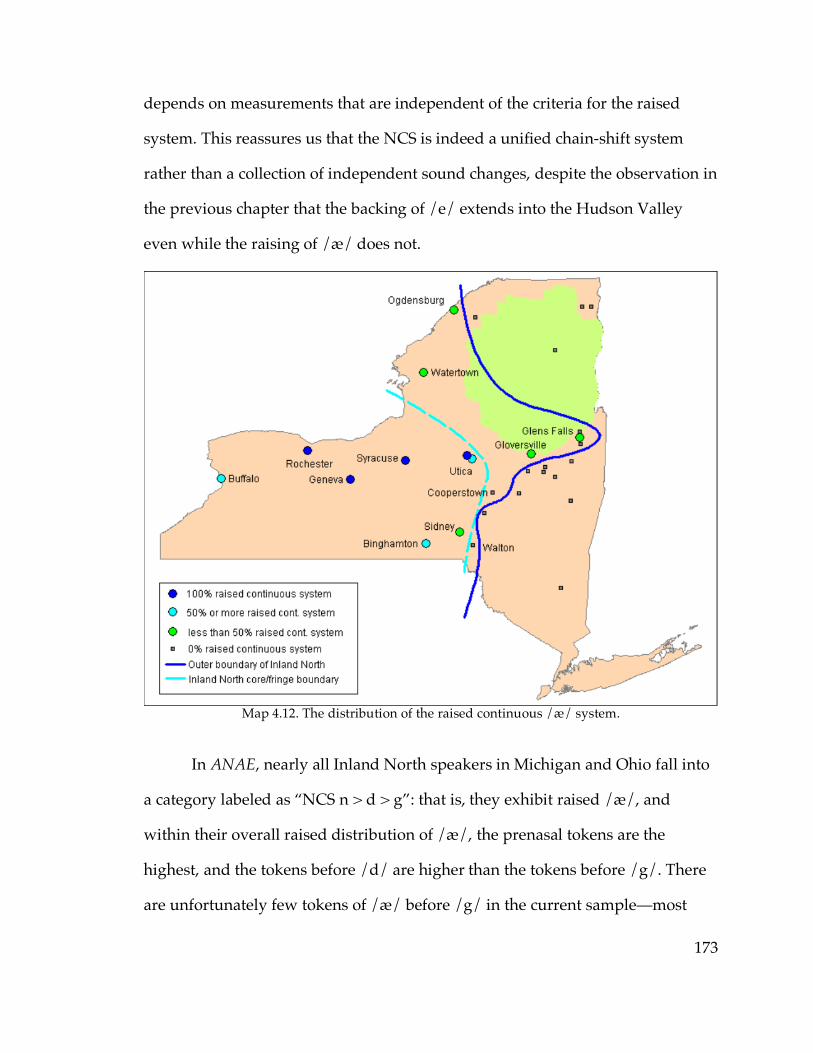
173
depends on measurements that are independent of the criteria for the raised
system. This reassures us that the NCS is indeed a unified chain-shift system
rather than a collection of independent sound changes, despite the observation in
the previous chapter that the backing of /e/ extends into the Hudson Valley
even while the raising of /æ/ does not.
Map 4.12. The distribution of the raised continuous /æ/ system.
In ANAE, nearly all Inland North speakers in Michigan and Ohio fall into
a category labeled as “NCS n > d > g”: that is, they exhibit raised /æ/, and
within their overall raised distribution of /æ/, the prenasal tokens are the
highest, and the tokens before /d/ are higher than the tokens before /g/. There
are unfortunately few tokens of /æ/ before /g/ in the current sample—most
174
speakers have only one, from a word-list token of bag, and some speakers
interviewed by telephone produced none. The distribution of those tokens of
/æg/ that were produced, however, seems to indicate that among raised-
continuous speakers in eastern and central New York, the “n > d > g” system is
not nearly so prevalent. The 20 speakers of the raised continuous system in the
current sample produced a total of 84 measured tokens of /æ/ before /d/ and 21
before /g/. Although /æg/ is on average 44 Hz lower than /æd/ among these
105 total tokens (p < 0.01), this difference is by no means consistent from speaker
to speaker.
Of the 20 raised-continuous speakers, 17 produced at least one measured
token of /æg/ (the exceptions being the two speakers from Geneva and Terri M.
from Sidney). Of these seventeen speakers, five have mean /æg/ higher in the
vowel space than mean /æd/20; another four have at least one token of /æd/
lower than any token of /æg/. The remaining eight have mean differences
between /æg/ and /æd/ ranging between 37 and 74 Hz. But of those eight, four
have their lowest token21 of /æg/ only 21 Hz or less lower than their lowest
token of /æd/. The remaining four are three speakers from Utica plus the one
from Yorkville, whose distance between lowest /æg/ and lowest /æd/ ranges
from 60 to 87 Hz. By contrast, in the Telsur corpus, Alma S. from Binghamton has
108 Hz between her highest /æg/ and lowest /æd/, and Jeanette S. from Buffalo
has fully 200 Hz between highest /æg/ and lowest /æd/; and both have /æg/
as their very lowest tokens of /æ/. None of the raised-continuous speakers in the
20 Obviously none of these individual-speaker figures are statistically significant; after all, most speakers only produced one token of /æg/. 21 Only token, for three of them.
175
current sample have anything like that difference. So in eastern and central New
York, among raised-continuous speakers, the “n > d > g” system is much less
consistent than it appears to be in the central component of the Inland North—
i.e., Michigan and northern Ohio—and, where present, not very robust.
Although all of the raised-continuous speakers fit the criterion of not
having a “distinct separation” between prenasal and pre-oral /æ/, there are
qualitative differences among them with respect to the relationship between
prenasal and pre-oral allophones. Dianne S., whose /æ/ system is displayed in
Figure 4.3 above, and Tom S., displayed in Figure 4.10 above, illustrate the
contrast. Although Tom’s prenasal and pre-oral tokens do not show a distinct
separation, and several of his prenasal tokens are relatively low and/or back and
among pre-oral tokens, it is still the case that most of his prenasal tokens of /æ/
are higher and/or fronter than his pre-oral tokens, and a distinctive cluster of
prenasal tokens is discernible at the high front edge of his /æ/ distribution.
Dianne S. has no such cluster; her prenasal tokens are distributed within the
general cloud of /æ/ tokens and are mostly surrounded by pre-oral tokens. In
other words, not only do the prenasal tokens collectively not form a cluster of the
highest and frontest tokens within the /æ/ distribution, but it is not even
possible to isolate any large cluster of prenasal tokens among the highest and/or
frontest.
Eight of the twenty raised-continuous speakers resemble Dianne in having
no identifiable cluster containing only prenasal tokens at the high or front edge
176
of the /æ/ distribution22: one in Geneva, three in Utica, two in Watertown, and
two in Gloversville. This excludes Glens Falls and Ogdensburg, the two remotest
Inland North fringe communities from the Inland North core. If this is to be
interpreted as a meaningful result, it suggests that having a high degree of
overlap between prenasal and pre-oral tokens of /æ/ in the raised continuous
system is a more advanced feature of the NCS and has not yet reached the most
far-flung communities: as /æ/ raises, prenasal tokens lead the movement, while
pre-oral tokens catch up with them in the latest stages of the shift. However, this
distinction between Glens Falls and Ogdensburg on the one hand and more
centrally located fringe and core communities on the other hand does not reach
the level of statistical significance23, and it is noted here merely for the sake of
completeness in the discussion of the phonological structure of the raised
continuous /æ/ system.
4.3.2. The raised nasal /æ/ system
The raised continuous system was found above to be strongly correlated
with the more extreme manifestations of the NCS, and in particular it was found
to have a stronger presence in the core than in the fringe of the Inland North:
22 This criterion does not exclude the possibility that the prenasal tokens may be on average higher and fronter than the pre-oral tokens; indeed, in all cases they are at least higher or fronter to a statistically significant degree. 23 It actually does achieve significance at the p < 0.05 level if we consider the full set of 19 speakers from Ogdensburg, Glens Falls, and South Glens Falls, and compare them to the 41 speakers in other sampled Inland North fringe and core communities, of whom eight exhibit a raised continuous system with substantial overlap between prenasal and pre-oral tokens. However, this comparison is probably confounded by the fact that, as previously noted, more speakers in the core than in the fringe exhibit the raised continuous system to begin with; a significant result from this comparison may just be reflective of the distribution of the raised continuous system in general rather than of this particular subset of it.
177
only 40% of the speakers with high NCS scores in the Inland North fringe
displayed the raised continuous system. It must be possible, therefore, for a
speaker to be clearly subject to the NCS without displaying the raised continuous
system.
The raised continuous system as defined above has two components, of
course: first, that /æ/ must be substantially higher than /o/ (i.e., raised); and
second, that there not be a distinct separation between prenasal and pre-oral
tokens of /æ/ (i.e., continuous). Although ANAE mentions both these
components in its description of the treatment of /æ/ in the NCS, only the
raising is a necessary part of the NCS’s chain-shift structure. Therefore let us
introduce the raised nasal system: this configuration of /æ/ resembles the raised
continuous system in being raised almost completely out of the low front corner
of the vowel space (as above, the criterion will be that the lowest token of /æ/
excluding distant outliers must be higher than mean /o/), but maintains a sharp
distinction between prenasal and pre-oral allophones. Pamela H., a 51-year-old
former caregiver from Walton, displays this system, as shown in Figure 4.13. Her
lowest token of /æ/ is substantially higher than mean /o/; her /æ/ is clearly
not a low vowel, and its mean pre-oral F1 is 669 Hz, satisfying the AE1 criterion.
But the distinction between prenasal and pre-oral /æ/ is quite clear, with a
relatively broad gap between the two clusters of tokens. Only two prenasal
tokens of /æ/ appear in the lower cluster, in one of which (slang) the nasal is
/ŋ/. Pamela’s NCS score is four; she clearly demonstrates that a sharp nasal /æ/
system can coexist with NCS in a single speaker.
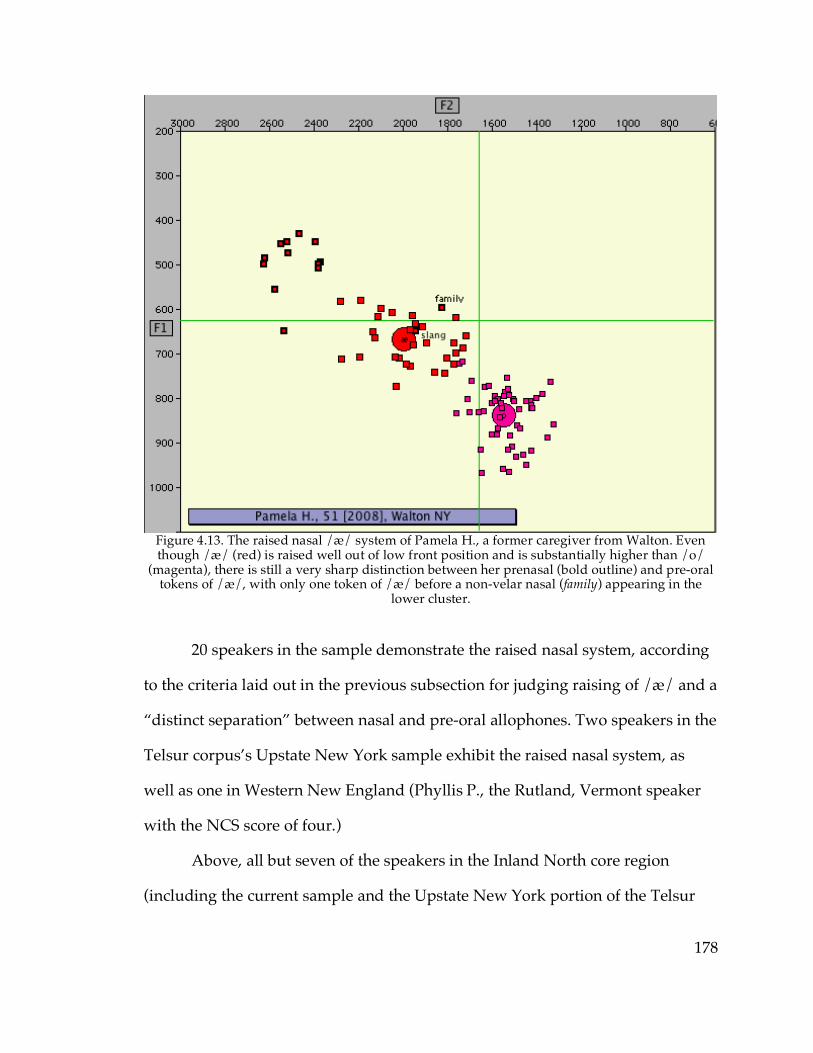
178
Figure 4.13. The raised nasal /æ/ system of Pamela H., a former caregiver from Walton. Even though /æ/ (red) is raised well out of low front position and is substantially higher than /o/
(magenta), there is still a very sharp distinction between her prenasal (bold outline) and pre-oral tokens of /æ/, with only one token of /æ/ before a non-velar nasal (family) appearing in the
lower cluster.
20 speakers in the sample demonstrate the raised nasal system, according
to the criteria laid out in the previous subsection for judging raising of /æ/ and a
“distinct separation” between nasal and pre-oral allophones. Two speakers in the
Telsur corpus’s Upstate New York sample exhibit the raised nasal system, as
well as one in Western New England (Phyllis P., the Rutland, Vermont speaker
with the NCS score of four.)
Above, all but seven of the speakers in the Inland North core region
(including the current sample and the Upstate New York portion of the Telsur
179
corpus) exhibited the raised continuous system. Four of those remaining seven—
two in Utica, and the Telsur speakers in Binghamton and Buffalo—exhibit the
raised nasal system; the remaining three are all in Sidney, which has been found
to be retreating from the NCS in apparent time. In other words, every speaker
sampled in every apparently stable Inland North core community has either the
raised continuous or raised nasal system. It is not a surprise, of course, to find
that speakers in the Inland North exhibit a feature, raising of /æ/, that is
associated with the NCS. But the uniformity is striking: not all of these speakers
satisfy the EQ1 criterion, and one has an NCS score as low as two; some have
nasal and some have continuous /æ/ distributions; but all of them have /æ/
raised at least enough that the bottom of the /æ/ cluster is higher than mean
/o/.
The Inland North core, however, is not what the raised nasal system was
introduced principally to describe; the raised continuous system does a pretty
fair job of summing up the core with only a few exceptions. In the Inland North
fringe, a region where a majority even of speakers with high NCS scores do not
exhibit the raised continuous system, the raised nasal system occurs with slightly
higher frequency than the raised continuous system: five speakers in
Gloversville, four in Ogdensburg, two in Watertown, and both of the two
speakers in Walton. A total of 13 out of 45 speakers in the Inland North fringe
therefore have the raised nasal system, versus 10 with the raised continuous
system.24 Moreover, a few raised-nasal speakers appear just barely outside the
boundaries assigned to the Inland North in the previous chapter: both of the two
24 The remaining 22, of course, have non-raised /æ/.

180
speakers from Cobleskill, one of the two from Fonda, and one of the nine from
Oneonta, as well as one of the three younger (and seemingly non-NCS) speakers
from Sidney. The distribution of the raised nasal system is shown on Map 4.14.
Map 4.14. The distribution of the raised nasal system compared to the raised continuous system.
Unlike the raised-continuous speakers, the raised-nasal speakers do not all
have high NCS scores; in fact, fully 11 of the 23 raised-nasal speakers (including
the Telsur speakers in Buffalo, Binghamton, and Rutland, Vt.) have NCS scores
of two. As Table 4.15 shows, the raised nasal /æ/ system is most frequent among
those subsets of speakers that show moderate degrees of advancement of NCS
features, whereas we saw above that the raised continuous system correlates best
with highly advanced NCS features. That is, among speakers who show the
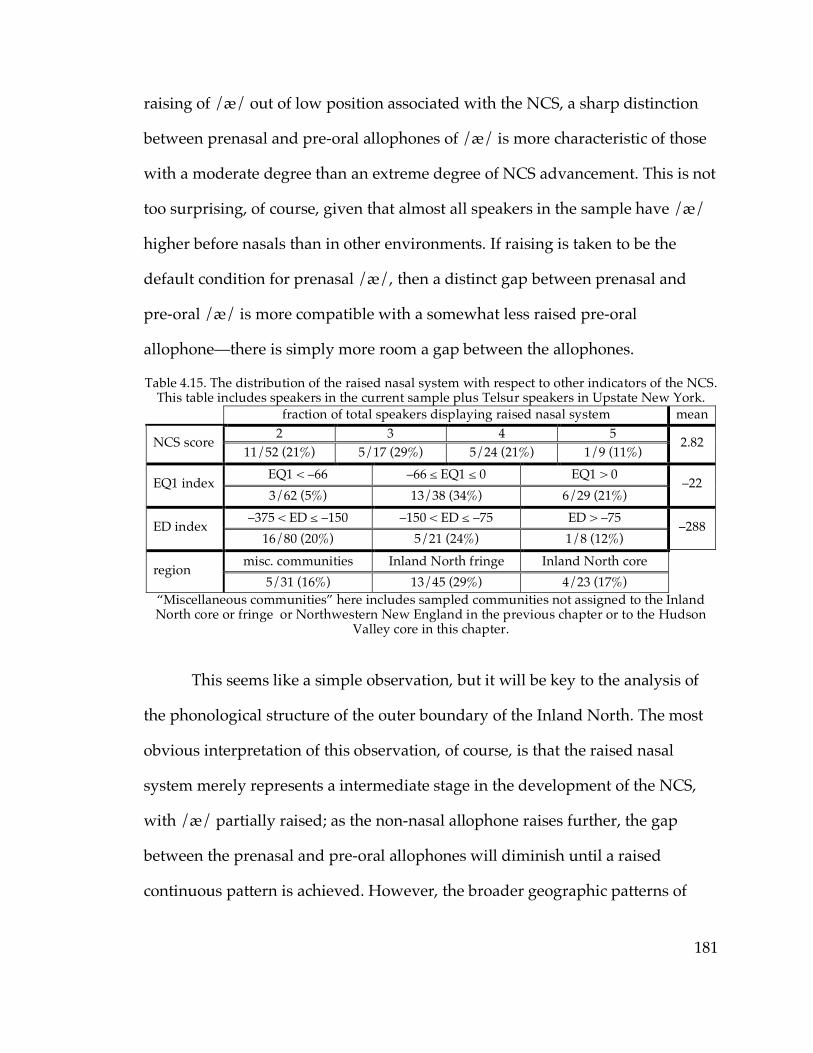
181
raising of /æ/ out of low position associated with the NCS, a sharp distinction
between prenasal and pre-oral allophones of /æ/ is more characteristic of those
with a moderate degree than an extreme degree of NCS advancement. This is not
too surprising, of course, given that almost all speakers in the sample have /æ/
higher before nasals than in other environments. If raising is taken to be the
default condition for prenasal /æ/, then a distinct gap between prenasal and
pre-oral /æ/ is more compatible with a somewhat less raised pre-oral
allophone—there is simply more room a gap between the allophones.
Table 4.15. The distribution of the raised nasal system with respect to other indicators of the NCS. This table includes speakers in the current sample plus Telsur speakers in Upstate New York. fraction of total speakers displaying raised nasal system mean
2 3 4 5 NCS score 11/52 (21%) 5/17 (29%) 5/24 (21%) 1/9 (11%)
2.82
EQ1 < –66 –66 ≤ EQ1 ≤ 0 EQ1 > 0 EQ1 index 3/62 (5%) 13/38 (34%) 6/29 (21%)
–22
–375 < ED ≤ –150 –150 < ED ≤ –75 ED > –75 ED index 16/80 (20%) 5/21 (24%) 1/8 (12%)
–288
misc. communities Inland North fringe Inland North core region 5/31 (16%) 13/45 (29%) 4/23 (17%)
“Miscellaneous communities” here includes sampled communities not assigned to the Inland North core or fringe or Northwestern New England in the previous chapter or to the Hudson
Valley core in this chapter.
This seems like a simple observation, but it will be key to the analysis of
the phonological structure of the outer boundary of the Inland North. The most
obvious interpretation of this observation, of course, is that the raised nasal
system merely represents a intermediate stage in the development of the NCS,
with /æ/ partially raised; as the non-nasal allophone raises further, the gap
between the prenasal and pre-oral allophones will diminish until a raised
continuous pattern is achieved. However, the broader geographic patterns of

182
nasal and continuous /æ/ systems will suggest a different interpretation of the
relationship between the raised continuous and raised nasal systems.
Since the raised continuous /æ/ system is associated with advanced
participation in the NCS, examining the set of speakers who exhibited it told us
little that was new—they were for the most part already speakers who we had a
strong reason to categorize as NCS speakers. The raised nasal system, however,
being more associated with intermediate degrees of the NCS, can give us yet
another way of identifying speakers affected by the NCS who may have escaped
some of the criteria employed in the previous chapter. For example, Table 4.15
shows that fully eleven speakers with NCS scores of only two exhibit the raised
nasal system. If such speakers were located in cities that were excluded from the
Inland North in Chapter 3 because their NCS scores were concentrated around
two, such as Oneonta and Amsterdam, that would constitute grounds for
reconsidering my judgment that those are not NCS-participating cities.
As it turns out, none of these eleven speakers are in such communities as
Amsterdam and Oneonta25, and so their exclusion from the Inland North is not
jeopardized. Fully seven of the eleven are in communities already assigned to the
Inland North fringe or core (two from Gloversville, two from Watertown, one
from Ogdensburg, one from Walton, and one a Telsur speaker from Buffalo), and
therefore help to justify the decision to assign those communities to the Inland
North in spite of the presence of low-scoring speakers within them. One is a
young speaker from Sidney, a community that appears to be retreating from the
25 One raised-nasal speaker is in fact from Oneonta; his NCS score is three. In the previous chapter, a single speaker with an NCS score of three was not deemed sufficient reason to consider Oneonta to be part of the Inland North; the fact that that speaker has the raised nasal /æ/ system is no reason to change that judgment.
183
NCS in apparent time, a judgment not supported by this speaker. The remaining
three, however, may be able to give us a bit more information on a couple of
communities with small samples.
Fonda and Cobleskill are both villages in which two telephone interviews
were conducted, and in both villages both speakers had NCS scores of two. On
the basis of that, both villages seem to be classifiable with Oneonta and
Amsterdam, in the broadly-defined “Hudson Valley” region of Kurath (1949)26,
and excluded from the Inland North fringe; however, both villages in that case
are quite close to the boundary. The EQ1 indices of the speakers in Cobleskill
seem relatively typical of a broad Hudson Valley community; at –37 and –108,
they seem to cover roughly the same range as Oneonta. Fonda’s EQ1 indices, –33
and –68, appear intermediate between the Hudson Valley and the Inland North
fringe, in that they lie between the mean and minimum EQ1 indices of fringe
cities like Ogdensburg and Watertown and very nearly between the mean and
maximum EQ1 of Oneonta27.
The presence of the raised nasal /æ/ system suggests that these
communities near the boundary probably have some degree of influence from
the NCS as well—they might constitute an even fringier fringe of the Inland
North fringe, or they may represent a transitional region between the Inland
North fringe and the Hudson Valley. In Fonda, the one who exhibits the raised
nasal system is the one with the higher EQ1 index; Fonda in fact could easily be a
typical Inland North fringe village in which, just by chance, I happened to
interview two speakers with EQ1 indices and NCS scores on the low side. In 26 Not to be confused with the core Hudson Valley introduced earlier in this chapter. 27 The actual maximum EQ1 of Oneonta is –39.

184
Cobleskill, both speakers have the raised nasal system; Mary R., with her EQ1
index of –108, has the lowest EQ1 index of any raised-nasal (or raised-
continuous) speaker by a margin of 21 Hz; likewise, she is the only raised-nasal
or raised-continuous speaker to have pre-oral /æ/ backer than /e/. Mary R. is
46 years younger than Ronald B., the other speaker from Cobleskill, and appears
less advanced than him on almost every measure of the NCS; it may be that
Cobleskill resembles Sidney and/or Cooperstown in that it has retreated overall
from participation the NCS, but Mary has retained some evidence of her village’s
history in the raised character of her /æ/. Such specific accounts of the
dialectological status of Fonda and Cobleskill are of necessity speculative, of
course, owing to the fact that only two speakers were sampled in each of them;
although ANAE demonstrates that two speakers per community is sufficient to
draw a detailed picture or regional variation, it is certainly not enough to infer
detailed facts about each individual communities. However, the presence of the
raised nasal /æ/ system in these two villages at all does seem to indicate the
presence of some influence of the NCS spilling across the boundary that was
drawn in Chapter 3 on the basis of NCS scores.
It may also be meaningful that both Fonda and Cobleskill, which
collectively show 75% raised nasal /æ/, are villages. Oneonta and Amsterdam,
which appear to be about equally as close to the Inland North fringe as Fonda
and Cobleskill are, are cities; and they collectively show 6% raised nasal /æ/
(one out of nine speakers in Oneonta, none out of seven in Amsterdam). The
example of Sidney and Cooperstown from the previous chapter gives us reason
to believe that villages are likely to be more ambiguous or unstable with respect

185
to their NCS status than cities, at least along the Inland North–Hudson Valley
border. Of six sampled villages along that border, two appear to have changed
their NCS status over the past several decades, two combine NCS scores and EQ1
indices more typical of the Hudson Valley with raised nasal /æ/ systems that
are otherwise almost absent in the Hudson Valley, and two (Walton and South
Glens Falls) have NCS scores that seem typical of the Inland North fringe but
lower EQ1 scores than any sampled Inland North city.
It is worth emphasizing at this point that the raised nasal /æ/ system is
only one of several ways of identifying participation in the NCS, which can
combine to give us a more complete picture; it is not a definitive criterion that
can dictate independently how we assign membership in a dialectological class.
For example, the presence of the raised nasal system in Cobleskill does not
immediately cause us to declare that it ought to be regarded as part of the Inland
North region after all; rather, we combine Cobleskill’s raised nasal system with
its relatively low EQ1 indices and NCS scores and describe it as having an
intermediate or unstable status. On the other hand, the Telsur corpus includes
Doug B., a 28-year-old student from Buffalo with an NCS score of two; the fact
that Doug has the raised nasal system suggests that he is not as extreme an
outlier as his low score would suggest, and reassures us that Buffalo can
continue to be regarded as an Inland North core community.
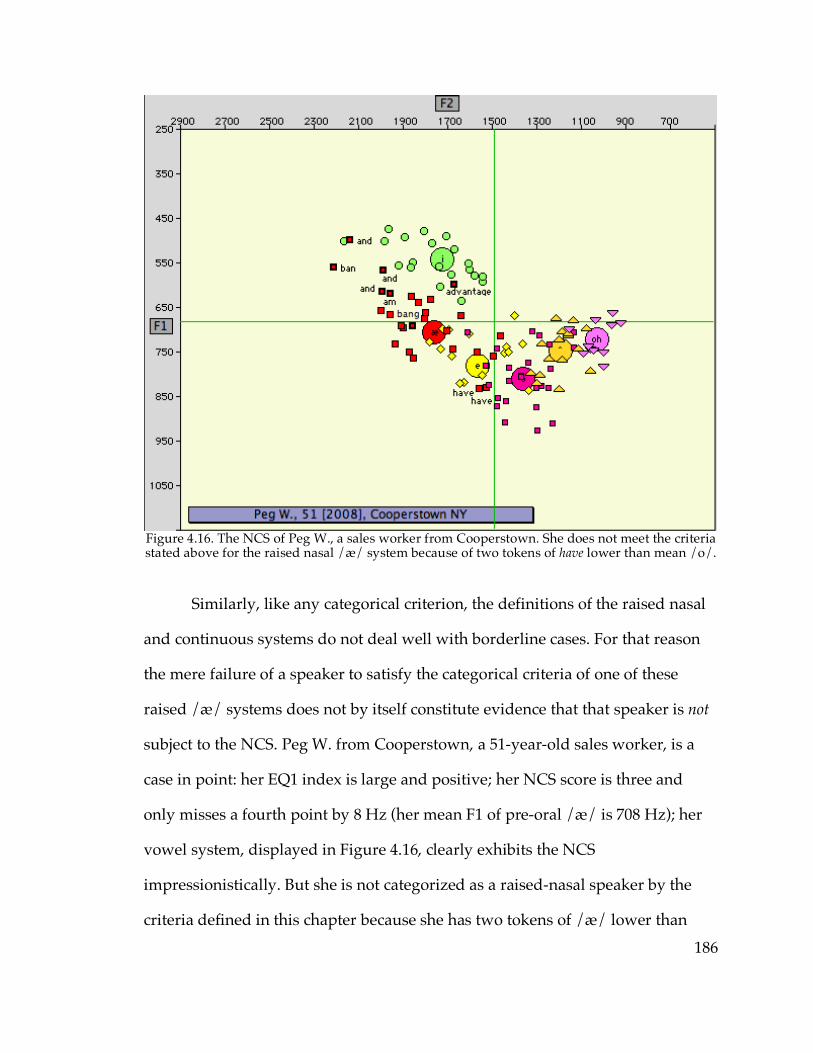
186
Figure 4.16. The NCS of Peg W., a sales worker from Cooperstown. She does not meet the criteria stated above for the raised nasal /æ/ system because of two tokens of have lower than mean /o/.
Similarly, like any categorical criterion, the definitions of the raised nasal
and continuous systems do not deal well with borderline cases. For that reason
the mere failure of a speaker to satisfy the categorical criteria of one of these
raised /æ/ systems does not by itself constitute evidence that that speaker is not
subject to the NCS. Peg W. from Cooperstown, a 51-year-old sales worker, is a
case in point: her EQ1 index is large and positive; her NCS score is three and
only misses a fourth point by 8 Hz (her mean F1 of pre-oral /æ/ is 708 Hz); her
vowel system, displayed in Figure 4.16, clearly exhibits the NCS
impressionistically. But she is not categorized as a raised-nasal speaker by the
criteria defined in this chapter because she has two tokens of /æ/ lower than
187
mean /o/, and the definition stated above allows at most one low outlier. The
disadvantage of occasional mischaracterizations of vowel systems like Peg’s,
however, is outweighed by the advantage of having a reliable objective criterion
for classifying /æ/ systems, which can yield meaningful conclusions when
looked at across a large number of speakers or in combination with other
measures of NCS status.
4.3.3. The nasal and continuous systems overall
In the previous section, it was observed that the status of /æ/ as raised or
unraised is more or less orthogonal to the status of /æ/’s allophonic distribution
as raised or continuous. In other words, whether a speaker has a sharp
distinction between prenasal and pre-oral allophones of /æ/ is in some sense
independent of whether pre-oral /æ/ is raised out of the low front region of the
vowel space. In that case, considering “raised”, “nasal”, and “continuous” to be
three distinct categories of /æ/ configuration, as is done in ANAE and the first
section of this chapter, is somewhat misleading. It makes more sense to consider
“nasal/continuous” and “raised/low” as two parameters that are free to
combine in a two-by-two matrix, as in Table 4.17; more exotic /æ/
configurations, such as the diffused system, the New York and Philadelphia
biphonemic systems, and perhaps the Southern “drawl”, are separate categories
and not part of the matrix.
That said, it is clear that whether a speaker has a nasal or continuous
system is not entirely independent of whether pre-oral /æ/ is low or NCS-
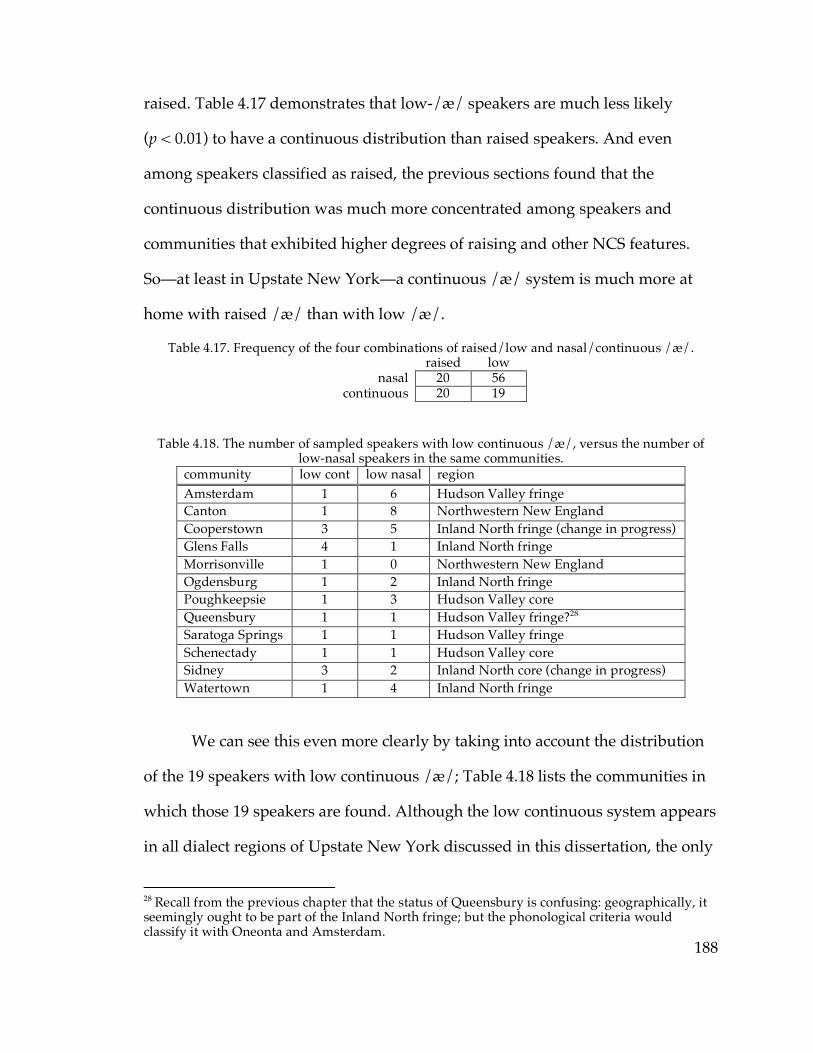
188
raised. Table 4.17 demonstrates that low-/æ/ speakers are much less likely
(p < 0.01) to have a continuous distribution than raised speakers. And even
among speakers classified as raised, the previous sections found that the
continuous distribution was much more concentrated among speakers and
communities that exhibited higher degrees of raising and other NCS features.
So—at least in Upstate New York—a continuous /æ/ system is much more at
home with raised /æ/ than with low /æ/.
Table 4.17. Frequency of the four combinations of raised/low and nasal/continuous /æ/. raised low
nasal 20 56 continuous 20 19
Table 4.18. The number of sampled speakers with low continuous /æ/, versus the number of low-nasal speakers in the same communities.
community low cont low nasal region Amsterdam 1 6 Hudson Valley fringe Canton 1 8 Northwestern New England Cooperstown 3 5 Inland North fringe (change in progress) Glens Falls 4 1 Inland North fringe Morrisonville 1 0 Northwestern New England Ogdensburg 1 2 Inland North fringe Poughkeepsie 1 3 Hudson Valley core Queensbury 1 1 Hudson Valley fringe?28 Saratoga Springs 1 1 Hudson Valley fringe Schenectady 1 1 Hudson Valley core Sidney 3 2 Inland North core (change in progress) Watertown 1 4 Inland North fringe
We can see this even more clearly by taking into account the distribution
of the 19 speakers with low continuous /æ/; Table 4.18 lists the communities in
which those 19 speakers are found. Although the low continuous system appears
in all dialect regions of Upstate New York discussed in this dissertation, the only
28 Recall from the previous chapter that the status of Queensbury is confusing: geographically, it seemingly ought to be part of the Inland North fringe; but the phonological criteria would classify it with Oneonta and Amsterdam.

189
communities in which it is found in more than one speaker are NCS
communities—Cooperstown, Glens Falls, and Sidney. This in itself is not that
informative: there are Inland North communities where low continuous /æ/ is
found in only one speaker (Watertown) or none (Gloversville); and many of the
non–Inland North communities where only one low-continuous speaker is found
are communities where only two speakers were analyzed anyhow. However, if
we are to take seriously the decomposition of nasal, continuous, high, and low
into a two-by-two matrix as in Table 4.17, we shouldn’t be comparing the low
continuous system against all other /æ/ configurations on an even footing;
rather, we should, for example, compare low continuous only against low nasal,
or all continuous speakers against all nasal speakers, varying only one parameter
at a time.
Table 4.19. The total number of sampled speakers with low continuous or low nasal /æ/. continuous nasal Inland North (core or fringe) 11 13 elsewhere 8 43
Table 4.19 shows that the observation above—that only in the Inland
North does the low continuous /æ/ system appear in multiple speakers in a
single community’s sample—was in fact justified: speakers with low /æ/ are
much more likely to have a continuous distribution in the Inland North than
outside it (p < 0.01). This echoes the finding in the previous sections that a
continuous /æ/ distribution appears to be more associated with more advanced
NCS: there it was found that the raised continuous system dominated in the
Inland North core, while the raised nasal system was somewhat more frequent in
the fringe. Analogously, here we find that the low continuous system is found

190
more frequently in the Inland North than outside it, and outside the Inland
North the low nasal system dominates.
Notably, the obvious explanation for the correlation between greater NCS
participation and continuous distribution that seemed to apply to raised /æ/
does not apply equally easily to low /æ/. For raised systems, the obvious
interpretation was that as pre-oral /æ/ raises in its movement toward the NCS,
it closes the distance between itself and prenasal /æ/, and so the raised speakers
with the highest degree of raising would be likely to end up with continuous
distributions for that reason alone. However, if pre-oral /æ/ is not raised
substantially out of the low area of the vowel space to begin with, it’s hard to see
how such an argument would be relevant. There is little or no difference between
the 13 low-nasal speakers and the 11 low-continuous speakers in the Inland
North in EQ1 indices or in F1 of pre-oral /æ/, or between the 43 low-nasal
speakers and the 8 low-continuous speakers outside of the Inland North.29 In
other words, the speakers classified as low nasal don’t have pre-oral /æ/ on the
whole substantially lower than the speakers classified as low continuous; they’re
all about equally low. So the greater frequency of continuous distributions in the
Inland North doesn’t appear to be the result of NCS /æ/ raising creating
continuous distributions. Even among speakers with /æ/ not substantially
raised, a continuous distribution of /æ/ is simply more frequent in the Inland
North than in the Hudson Valley or in the Northwestern New England–like
communities of northern New York.
29 In the Inland North, the mean difference between low nasal and low continuous speakers is only 15 Hz in F1 of pre-oral /æ/ and 9 in EQ1 index. Outside the Inland North, the mean differences are 5 Hz in F1 and 22 in EQ1 index. None of these differences are statistically significant; the closest to significance any of them gets is p > 0.2.

191
Map 4.20. The distribution of nasal vs. continuous /æ/ distributions and raised vs. low pre-oral
/æ/, displayed as two orthogonal features. For the purpose of this map, the diffused /æ/ system is regarded as not raised and not continuous.
The finding that continuous distributions are more prevalent in the Inland
North than elsewhere becomes even more striking once raised /æ/ systems are
admitted back into consideration; this is no surprise, given that all the raised
continuous /æ/ systems in the sample are in the Inland North. Map 4.20 shows
the overall distribution of nasal and continuous /æ/ systems in Upstate New
York. Although there is some nonconformance to the pattern among
communities with smaller samples, in the better-sampled communities the
pattern is strikingly uniform: every community assigned to the Inland North core
or fringe in which seven or more interviews were conducted has at least three
192
continuous-/æ/ speakers, and no community outside the Inland North
boundary has more than one.
Why should continuous /æ/ distributions be so rare in the non–Inland
North regions of Upstate New York, when they are in principle just as
compatible with unraised /æ/ as the nasal distribution is? To answer this
question, we consider the phonological structure of the nasal and continuous
/æ/ distributions.
4.3.4. Phonological structure, /æ/ systems, and the NCS
Bermúdez-Otero (2007) summarizes the life cycle of a “sound pattern”—a
term he uses to encompass phonetic implementation rules, phonological rules,
and lexicalized phonological tendencies, each of which is a stage that any sound
pattern might go through during its evolution. The first phase in a sound
pattern’s life cycle as part of the grammar of the language is as a phonetic
implementation rule: phonetic rules operate regularly (i.e., without the
possibility of lexical exception) and in a gradient manner, involving “a
continuous shift along one or more dimensions in phonetic space, such as the
frequency of the first formant of a vowel” (§21.2). Structurally, such a rule maps
abstract phonological segments to their physical articulatory realizations.
Bermúdez-Otero cites the typical behavior of /æ/ in the Inland North core—i.e.,
the raised continuous distribution—as an example of a phonetic rule, according
to which tokens of /æ/ form an unbroken phonetic continuum from the least
raised to the most raised, influenced by numerous features of the vowel’s

193
phonetic environments. Clearly the low continuous /æ/ system fits this
description as well.
The second phase in a sound pattern’s life cycle is as a phonetically abrupt
and lexically exceptionless phonological rule. Structurally, such a rule maps one
abstract phonological segment to another, rather than mapping a segment to a
realization in physical phonetic space. By “phonetically abrupt”, Bermúdez-
Otero means that, because phonological rules act only on discrete and categorical
representations, the allophones created by a phonological rule may “have widely
separated targets[…] and their tokens occupy discrete, largely nonoverlapping
regions in phonetic space” (§21.2)30. Thus phonetic abruptness of this type can be
used to diagnose a “sound pattern” as being a phonologically specified
allophonic rule, rather than a phonetic implementation rule. From this
description it is clear that nasal /æ/ systems fall within this stage.
The next phase of the evolution of a sound pattern is as a relationship
between two phonemes, rather than two discrete segments that are allophones of
the same phoneme; this introduces the possibility of sensitivity to
morphosyntactic structure and lexical exceptions. At the final phase no
synchronic phonological relationship at all remains between the former
allophones. The New York City biphonemic system inhabits one of these final
two phases. The four phases are summarized in Table 4.21; here I will be
concerned with the first two phases, since those are the phases represented by
the continuous and nasal systems.
30 This quotation is actually from Bermúdez-Otero’s description of the New York City and Philadelphia /æ/ systems, which are of course not at this phase of the life cycle because they are not lexically exceptionless phonological rules. They are, however, phonetically “abrupt” in the sense used here, and this description will serve for the purpose of defining phonetic abruptness.
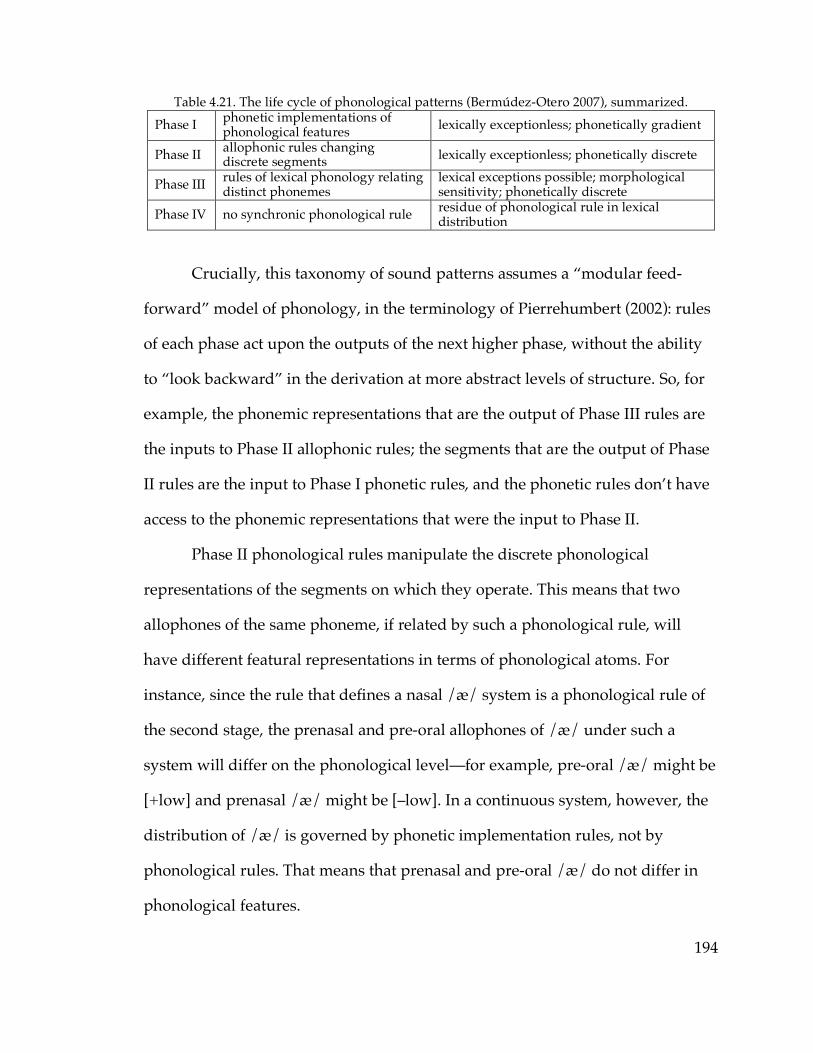
194
Table 4.21. The life cycle of phonological patterns (Bermúdez-Otero 2007), summarized. Phase I phonetic implementations of
phonological features lexically exceptionless; phonetically gradient
Phase II allophonic rules changing discrete segments lexically exceptionless; phonetically discrete
Phase III rules of lexical phonology relating distinct phonemes
lexical exceptions possible; morphological sensitivity; phonetically discrete
Phase IV no synchronic phonological rule residue of phonological rule in lexical distribution
Crucially, this taxonomy of sound patterns assumes a “modular feed-
forward” model of phonology, in the terminology of Pierrehumbert (2002): rules
of each phase act upon the outputs of the next higher phase, without the ability
to “look backward” in the derivation at more abstract levels of structure. So, for
example, the phonemic representations that are the output of Phase III rules are
the inputs to Phase II allophonic rules; the segments that are the output of Phase
II rules are the input to Phase I phonetic rules, and the phonetic rules don’t have
access to the phonemic representations that were the input to Phase II.
Phase II phonological rules manipulate the discrete phonological
representations of the segments on which they operate. This means that two
allophones of the same phoneme, if related by such a phonological rule, will
have different featural representations in terms of phonological atoms. For
instance, since the rule that defines a nasal /æ/ system is a phonological rule of
the second stage, the prenasal and pre-oral allophones of /æ/ under such a
system will differ on the phonological level—for example, pre-oral /æ/ might be
[+low] and prenasal /æ/ might be [–low]. In a continuous system, however, the
distribution of /æ/ is governed by phonetic implementation rules, not by
phonological rules. That means that prenasal and pre-oral /æ/ do not differ in
phonological features.

195
This chapter began by asking what the nature of the phonological
difference is between /æ/ inside the Inland North and outside the Inland North
such that the general raising of pre-oral /æ/ does not substantially expand
eastward into cities in the Hudson Valley, even while other aspects of the NCS
do. The difference between the phonological statuses of the nasal and continuous
systems is a step towards an answer: in the Hudson Valley (and in the northern
New York communities) the nasal system predominates, meaning that pre-oral
/æ/ differs phonologically from its prenasal allophone; whereas in the Inland
North prenasal and pre-oral /æ/ are different phonetic realizations of the same
phonological segment.
Why should a structural difference of this type prevent the NCS raising of
/æ/ from spreading into regions where the nasal system dominates? Consider
first the role of chain shifting in the “life cycle”. Inasmuch as a chain shift (or any
other sound change that might be described as a vowel shift) constitutes a drift of
the phonetic target of a particular phoneme through continuous phonetic space,
it is clear that a chain shift must be a change in Phase I phonetic implementation
rules. According to the modular feedforward model of phonology, Phase I
implementation rules don’t act on phonemes per se—only on the segments that
are the output of the Phase II allophonic rules, regardless of their phonemic
status. In other words, if a phoneme has more than one discrete segmental
allophone, those allophones will act independently of each other in chain
shifting.
This gives a motivation for the non–Inland North regions to react
differently to the NCS raising of /æ/ than to the other NCS shifts which they
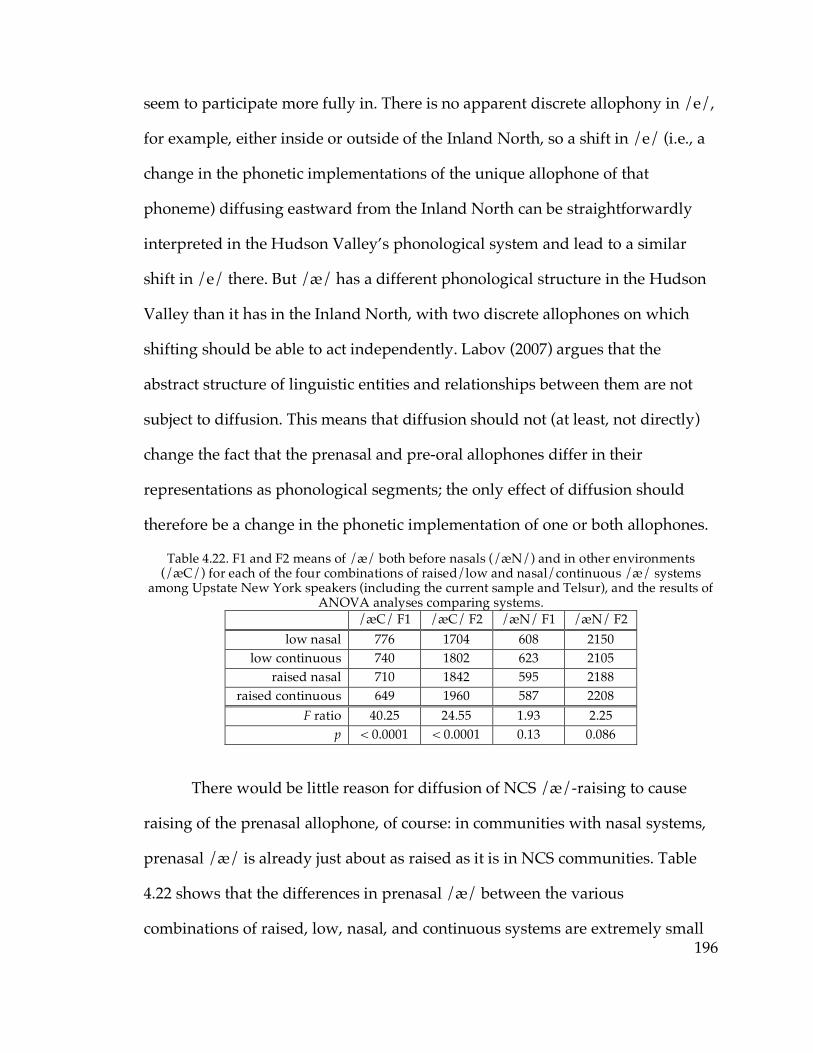
196
seem to participate more fully in. There is no apparent discrete allophony in /e/,
for example, either inside or outside of the Inland North, so a shift in /e/ (i.e., a
change in the phonetic implementations of the unique allophone of that
phoneme) diffusing eastward from the Inland North can be straightforwardly
interpreted in the Hudson Valley’s phonological system and lead to a similar
shift in /e/ there. But /æ/ has a different phonological structure in the Hudson
Valley than it has in the Inland North, with two discrete allophones on which
shifting should be able to act independently. Labov (2007) argues that the
abstract structure of linguistic entities and relationships between them are not
subject to diffusion. This means that diffusion should not (at least, not directly)
change the fact that the prenasal and pre-oral allophones differ in their
representations as phonological segments; the only effect of diffusion should
therefore be a change in the phonetic implementation of one or both allophones.
Table 4.22. F1 and F2 means of /æ/ both before nasals (/æN/) and in other environments (/æC/) for each of the four combinations of raised/low and nasal/continuous /æ/ systems
among Upstate New York speakers (including the current sample and Telsur), and the results of ANOVA analyses comparing systems.
/æC/ F1 /æC/ F2 /æN/ F1 /æN/ F2 low nasal 776 1704 608 2150
low continuous 740 1802 623 2105 raised nasal 710 1842 595 2188
raised continuous 649 1960 587 2208 F ratio 40.25 24.55 1.93 2.25
p < 0.0001 < 0.0001 0.13 0.086
There would be little reason for diffusion of NCS /æ/-raising to cause
raising of the prenasal allophone, of course: in communities with nasal systems,
prenasal /æ/ is already just about as raised as it is in NCS communities. Table
4.22 shows that the differences in prenasal /æ/ between the various
combinations of raised, low, nasal, and continuous systems are extremely small
197
and not statistically significant. So since prenasal /æ/ in even relatively extreme
NCS systems is not substantially different from prenasal /æ/ in the low nasal
system, contact with NCS communities would not be expected to induce any
change in the prenasal allophone in nasal-system communities.
So it is raising of the pre-oral allophone which ought to be subject to
diffusion from the Inland North. In fact, below we will see some evidence that, in
the Hudson Valley, there is some slight effect of the diffusion of raising of the
pre-oral allophone. However, even if it has taken place, diffusion of pre-oral
/æ/-raising has been clearly been far less effective than diffusion of other NCS
features, with a much more substantial difference between Inland North and
non–Inland North communities. The reason for this, I hypothesize, is the
presence of the prenasal allophone itself, occupying the raised space toward
which the pre-oral allophone would be moving. In other words, the existence of
a distinct phonological segment in the target raised position in phonetic space
prevents the pre-oral allophone of /æ/ from moving into that position as well.
Of course it is not in general the case that the existence of one segment in a
particular region of phonetic space is sufficient to prevent another segment from
being moved into that region as a result of dialect diffusion; if that were the case,
it would prevent the diffusion of phonemic merger, which is known to be a very
common phenomenon. In that case, how is the prenasal allophone capable of
preventing the pre-oral allophone from raising into its space, instead of allowing
it to raise and merging with it?
The key fact here is that prenasal and pre-oral /æ/ are allophones of the
same phoneme—i.e., they are related to each other by a synchronic rule in the
198
speaker’s grammar. This synchronic rule is a Phase II rule in the life cycle of
sound patterns; it expresses a relationship between two segments with distinct
featural specifications. Since dialect diffusion does not directly alter the abstract
relationships between linguistic entities, it remains part of the speaker’s
grammatical knowledge that the prenasal and pre-oral allophones of /æ/ have
different representations in terms of phonological features. What this means is
that, if one allophone begins moving toward the other in phonetic space as a
result of diffusion of a sound change, one phonological segment with a particular
set of features is moving towards occupying the same position in phonological
space as a segment with a distinct set of phonological features. However, since
the speaker knows (because of a single synchronic rule in the grammar) that
those two segments have distinct features, that movement is blocked; there is
resistance against two productively distinct phonological entities having the
exact same phonetic realization. The contrast between this situation and
phonemic merger, in which the distinction between the phonological entities is
not synchronically productive, will be discussed in Chapter 7.
Anyhow, this analysis gives us an explanation for the status of the NCS in
the Hudson Valley. The backing of /e/ and fronting of /o/ can spread into the
Hudson Valley from the Inland North because /e/ and /o/ have the same
phonological structure in both regions; however, the raising of pre-oral /æ/ does
not diffuse effectively because the basic unit of vowel shifting is the (potentially
allophonic) segment, not the phoneme, and the already raised prenasal
allophone blocks raising of the pre-oral allophone. Thus, the nasal system
prevents NCS raising from developing.
199
The status of the raised nasal distribution is not accounted for by this
story, but there are a couple of possible easy explanations for it. One possibility is
that a community in which the raised nasal system exists might have had a
raised continuous distribution earlier in its history, and then that continuous
distribution underwent restructuring into a nasal system where prenasal and
pre-oral allophones of /æ/ were distinguished phonologically, although both
were already raised. Another possibility is the opposite: that the raised nasal
system is in fact the result of advanced diffusion of /æ/-raising into
communities with the nasal system, but pre-oral /æ/ isn’t able to be raised quite
as high as prenasal /æ/ because of the effect described above, and remains
distinct from it. It is possible to distinguish these two possibilities: in the first
scenario, non-prenasal /æ/ becomes raised first and then becomes
phonologically differentiated from the prenasal allophone, whereas in the
second, the nasal and prenasal allophones are phonologically distinct before the
prenasal allophone comes to be raised.
The region with the highest frequency in the data of the raised nasal
system is the Inland North fringe. There are three communities in the Inland
North fringe in which both the raised nasal system and at least one other /æ/
distribution are observed: Gloversville, Watertown, and Ogdensburg.31 If the first
account of the origin of the raised nasal system proposed above is accurate, we
would expect to find the raised nasal system to be newer in apparent time in
31 The almost total absence of nasal /æ/ systems in Glens Falls—only one out of seven speakers—is unexplained. This is made all the more confusing by the fact that all three speakers from the adjacent village of South Glens Falls have the low nasal system; indeed, one of them has the second-greatest Cartesian distance between prenasal and pre-oral /æ/ in the entire sample. Despite the small sample, this contrast between Glens Falls and South Glens Falls is statistically significant; p ≈ 0.03.
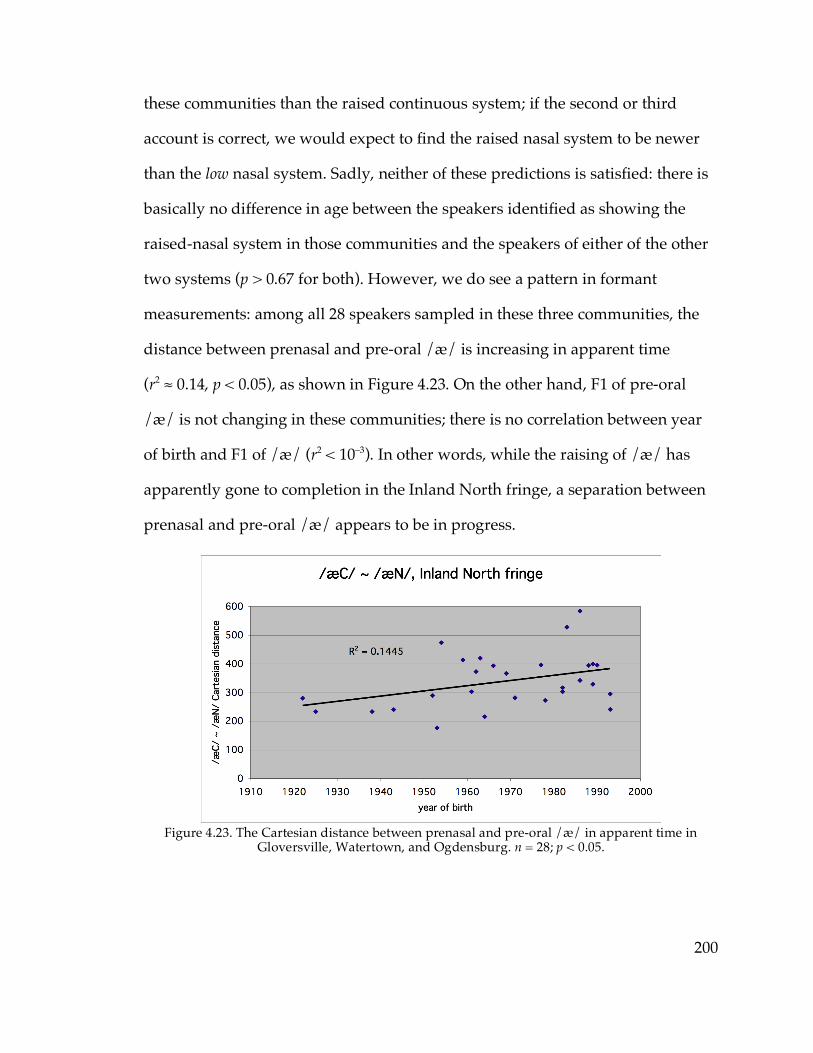
200
these communities than the raised continuous system; if the second or third
account is correct, we would expect to find the raised nasal system to be newer
than the low nasal system. Sadly, neither of these predictions is satisfied: there is
basically no difference in age between the speakers identified as showing the
raised-nasal system in those communities and the speakers of either of the other
two systems (p > 0.67 for both). However, we do see a pattern in formant
measurements: among all 28 speakers sampled in these three communities, the
distance between prenasal and pre-oral /æ/ is increasing in apparent time
(r2 ≈ 0.14, p < 0.05), as shown in Figure 4.23. On the other hand, F1 of pre-oral
/æ/ is not changing in these communities; there is no correlation between year
of birth and F1 of /æ/ (r2 < 10–3). In other words, while the raising of /æ/ has
apparently gone to completion in the Inland North fringe, a separation between
prenasal and pre-oral /æ/ appears to be in progress.
Figure 4.23. The Cartesian distance between prenasal and pre-oral /æ/ in apparent time in
Gloversville, Watertown, and Ogdensburg. n = 28; p < 0.05.
201
Insofar as the Cartesian F1/F2 distance between prenasal and pre-oral
/æ/ can be construed as a proxy for their restructuring into phonologically
distinct allophones—and inasmuch as it seems justifiable to regard the means of
my measurements of formant values as more reliable than my categorization of
speakers /æ/ systems on the basis of admittedly somewhat arbitrary criteria—
this is at least suggestive evidence that the nasal system is newer to the Inland
North fringe than the general raising of pre-oral /æ/. So to the extent that we
may regard one of the hypotheses about the origin of the raised nasal system as
better supported by the data than the other, it is that the nasal system is a
secondary development in a preexisting raised system. This must be at best a
tentative conclusion, of course. If it is true, however, it supports the argument
that the key difference between the Inland North and non–Inland North
communities (in Upstate New York, anyhow) is the status of the relationship
between prenasal and pre-oral /æ/. In the non–Inland North communities, the
low nasal system predominates; in the Inland North, even where nasal systems
are found there is evidence that they are a relatively recent development.
If the nasal system seems to be relatively new in the Inland North fringe—
new enough that the distance between prenasal and pre-oral /æ/ is growing in
apparent time, anyhow—the same does not appear to be the case in communities
where the low nasal system predominates already. There are four communities
in the data with samples of at least seven speakers of whom all but at most one
speaker show the low nasal system: Amsterdam, Oneonta, Canton, and
Plattsburgh. In these cities, the separation between prenasal and pre-oral
allophones of /æ/ appears to have basically gone to completion; the Cartesian
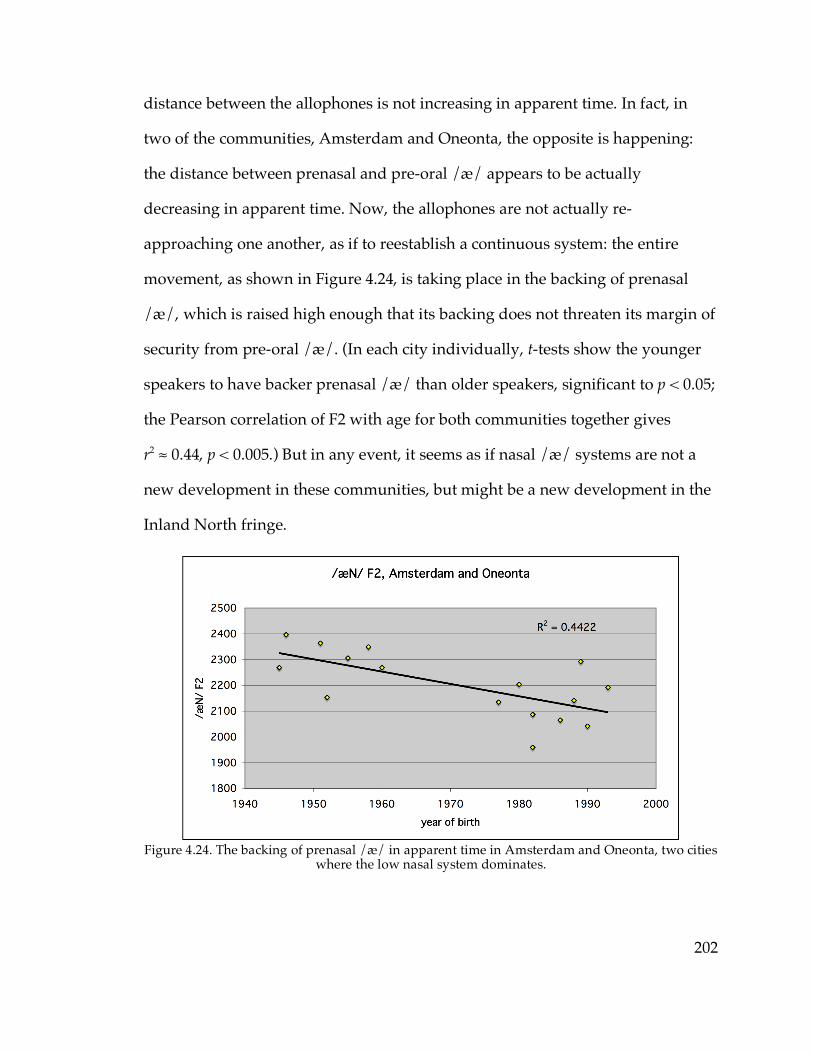
202
distance between the allophones is not increasing in apparent time. In fact, in
two of the communities, Amsterdam and Oneonta, the opposite is happening:
the distance between prenasal and pre-oral /æ/ appears to be actually
decreasing in apparent time. Now, the allophones are not actually re-
approaching one another, as if to reestablish a continuous system: the entire
movement, as shown in Figure 4.24, is taking place in the backing of prenasal
/æ/, which is raised high enough that its backing does not threaten its margin of
security from pre-oral /æ/. (In each city individually, t-tests show the younger
speakers to have backer prenasal /æ/ than older speakers, significant to p < 0.05;
the Pearson correlation of F2 with age for both communities together gives
r2 ≈ 0.44, p < 0.005.) But in any event, it seems as if nasal /æ/ systems are not a
new development in these communities, but might be a new development in the
Inland North fringe.
Figure 4.24. The backing of prenasal /æ/ in apparent time in Amsterdam and Oneonta, two cities
where the low nasal system dominates.
203
So at this point we can hypothetically reconstruct the history of the NCS
in Upstate New York in approximately the following way. To begin with, the
Inland North (i.e., the communities with originally Southwestern New England
settlement and Erie Canal commercial influence) had a continuous /æ/
distribution and the non–Inland North communities had a nasal /æ/
distribution. In the Inland North, /æ/ began to raise, setting off a chain shift
involving other vowel shifts such as the backing of /e/ and the fronting of /o/—
perhaps originating in the Inland North core, and then spreading to the fringe
communities somewhat later. These phonetic changes also spread to some extent
into the Hudson Valley, but the Inland North’s raising of /æ/ was blocked by
the Hudson Valley’s raised prenasal allophone of /æ/. Somewhat later, the
raised nasal system began developing in the Inland North, principally in the
fringe communities (though not in Glens Falls), by phonological restructuring of
the raised continuous system, possibly with influence from the low nasal system
of other communities.
4.4. The syllable-boundary pilot experiment
4.4.1. NCS /æ/ as a long and ingliding phoneme
The most fundamental division among English vowels is the difference
between short and long vowel phonemes (ANAE)—the short vowels being the
class that includes, for example, /i/, /e/, and /ʌ/, and the long vowels
including diphthongs such as /ey/ and /aw/, among others. The most salient
feature of this split into short (or “checked”) and long (or “free”) phonemes, as
204
has been commented on frequently (e.g., by ANAE, Veatch 1991, Wells 1990), is
that a short vowel phoneme must be followed by a consonant wherever it occurs,
whereas long vowels can freely occur with or without following consonants. In
the theory of the structure of American English vowels assumed by ANAE and
defended by Veatch (1991), according to which each vowel consists of a nucleus
plus an optional glide, the short vowels are exactly those phonemes that lack a
glide component. The set of phonemes that share any one glide component
constitute a “subsystem”. The short vowels make up one subsystem because they
share the absence of a glide component; long subsystems include32 one with the
front upglide /y/, one with the back rounded glide /w/, one with the rhotic
glide /r/, and one described as the “long and ingliding” subsystem. In the long
and ingliding subsystem, whose glide component is denoted with the symbol
/h/, phonemes with high and higher-mid nuclei glide inward in a lower-mid-
central direction, while those with lower nuclei either possess inglides or are
long monophthongs.
It was first suggested by Labov, Yaeger, & Steiner (1972) that the /æ/
phoneme in the Inland North belongs to the long and ingliding subsystem, and
thus is better represented as /æh/; this hypothesis is reiterated in ANAE and, as
will be discussed further in the following section, advanced by Preston (2008).
This analysis is fully consistent with the analysis of /æ/ systems presented in the
previous section. Under this hypothesis, /æ/ is long and ingliding/æh/ in the
continuous system that underlies the development of the NCS. In the nasal
system, which is argued above to block the diffusion of the NCS, /æ/ 32 This division into subsystems is a combination of elements from the subsystem sets used by Veatch (1991) and ANAE.

205
underlyingly belongs to the short subsystem. But since the prenasal and pre-oral
allophones of /æ/ have different segmental representations in the nasal system,
the prenasal allophone may be part of the long and ingliding subsystem even
while the pre-oral allophone remains short. If this is the case, the origin of the
NCS and of the nasal system can be reduced to a single sound change originally
shared by both Inland North and non–Inland North communities: a raising of the
long and ingliding allophone of /æ/, in line with the general tendency of long
vowels to rise (Labov, Yaeger, & Steiner 1972; Labov 1994). The difference
between the communities inside and outside the Inland North, in this story,
would be merely that in the Inland North, the long and ingliding allophone of
/æ/ constituted the entire phoneme, while outside the Inland North it included
only the prenasal allophone.
It seems fairly clear that the prenasal allophone in a nasal /æ/
distribution belongs to the long and ingliding subsystem, regardless of the status
of pre-oral /æ/; the prenasal allophone in nasal systems is not only raised and
fronted but also typically possesses the inglide characteristic of the long and
ingliding subsystem. As shown above in Table 4.22, prenasal /æ/ does not differ
substantially between speakers with nasal and continuous /æ/ systems, whether
raised or unraised, while the pre-oral allophones show large and statistically
significant differences between systems. These phonetic facts support the
hypothesis above that there is a greater phonological difference between NCS
and non-NCS representations of pre-oral /æ/ than of prenasal /æ/.
This section will present results of a pilot experiment undertaken during this
dissertation’s fieldwork to test the hypothesis that in the Inland North, pre-oral
206
/æ/ is part of the long and ingliding subsystem, while outside the Inland North
it is part of the short subsystem. As we will see below, the results do not fully
prove that hypothesis; however, they relate to broader questions about the
general structure of low vowels in English.
4.4.2. Description of the syllable-boundary experiment
The key phonotactic difference between short and long vowels, as
mentioned above, is that a short vowel must be followed by a consonant and
long vowels may occur freely with no following consonant. If /æ/ is
phonologically long in the Inland North, it has become so, in some sense,
covertly: there are still no words in which /æ/ occurs without a following
consonant, and so it still has the surface distribution of a short phoneme. But if
/æ/ is in fact phonologically long, it ought to be possible to make its long-vowel
nature emerge via linguistically-innovative behavior. To that end, I carried out a
small pilot experiment to see what happens if speakers are “forced” to attempt to
use /æ/ without a following consonant.
The experiment was formulated as a “language game”, in the sense of
Bagemihl (1995). I introduced subjects to a made-up language game called
“Ubba”, which supposedly operates by adding the infix “ubba” (that is, /ʌbə/)
between the syllables of a two-syllable word. If subjects were relatively willing to
add “ubba” after /æ/, without an intervening consonant—so that, for example,
tattoo became tæ-ubba-too rather than tat-ubba-too or tat-ubba-oo—that might be
taken as indicating that /æ/ is phonologically long for those speakers.
207
I carried out several trial versions of this experiment both on the campus
of the University of Pennsylvania and in Sidney, Oneonta, and Cooperstown,
before arriving at a methodology which produced interpretable results. This
version of the experiment was carried out in Ogdensburg and Canton with Short
Sociolinguistic Encounter subjects who, after the main interview was complete,
were willing and able to take a few more minutes to participate in the
experiment. These were supplemented with a few more speakers with whom full
interviews were not conducted—either those who were unwilling to participate
in a full-length interview but were open to a brief experiment, or those
approached after the target number of interviews had been achieved. Even so, I
was only able to carry out this experiment with a relatively small number of
subjects (six and four respectively, all 26 years old or younger), but the data I did
collect in those communities suggest some interesting results, as will be seen
below. All such speakers provided their ages and confirmed that they had lived
in the community in which I spoke to them since early childhood.
After briefly defining the concept of a language game as a process where
“you change the shape of a word according to some rule”, and giving Pig Latin
as an example (“so in Pig Latin a word like moonlight becomes oonlight-may”), I
explained “Ubba” to them as follows: the only rule is that you add “ubba” to the
middle of each word, so for example moonlight becomes moon-ubba-light. I did not
refer directly to syllables, in order to attempt to minimize the effect of any
preconceived explicit notions subjects might have about the locations of syllable
boundaries—for example, that syllable boundaries coincide with where a word
might be hyphenated at a line break. Likewise, I read aloud the list of words for
208
“Ubba” treatment, rather than giving subjects a written list, in order to attempt to
avoid effects of spelling. Moonlight was chosen as the sample word because it has
a clear syllable boundary, between two consonants and coinciding with a
morpheme boundary. The words that speakers were asked to add “ubba” to
were mostly two-syllable monomorphemes, with either a single consonant
between the two syllables or a cluster that can stand as an onset.
The list of words subjects were given to add “ubba” to in Ogdensburg and
Canton are listed below. These 28 words were sorted randomly once, and then
given in the same order to each speaker. (The vowel in the first syllable will be
referred to as the “key vowel”.)
• fourteen words with /æ/ in the first syllable: address, tattoo, taffy, shallow,
addict, plastic, gather, tablet, haggle, racket, caddy, hassle, master, asset
• six words with /o/ (or /ah/): pocket, toggle, father, fossil, swallow, goblet
• four words with /ey/, /ow/, or /uw/: radar, toupee, program, donate
• four words with /i/ or /e/: feather, Chester, ticket, reggae
4.4.3. Results from Ogdensburg and Canton
Table 4.25 summarizes the results of the “ubba” experiment. First of all,
this methodology does apparently succeed in distinguishing short vowels from
long vowels in general. In 11 out of 16 cases (69%), the four speakers from
Canton inserted “ubba” immediately after the long key vowels in radar, toupee,
program, and donate, leaving those long vowels without following consonants.
The five speakers from Ogdensburg did the same in a very similar 18 out of 24
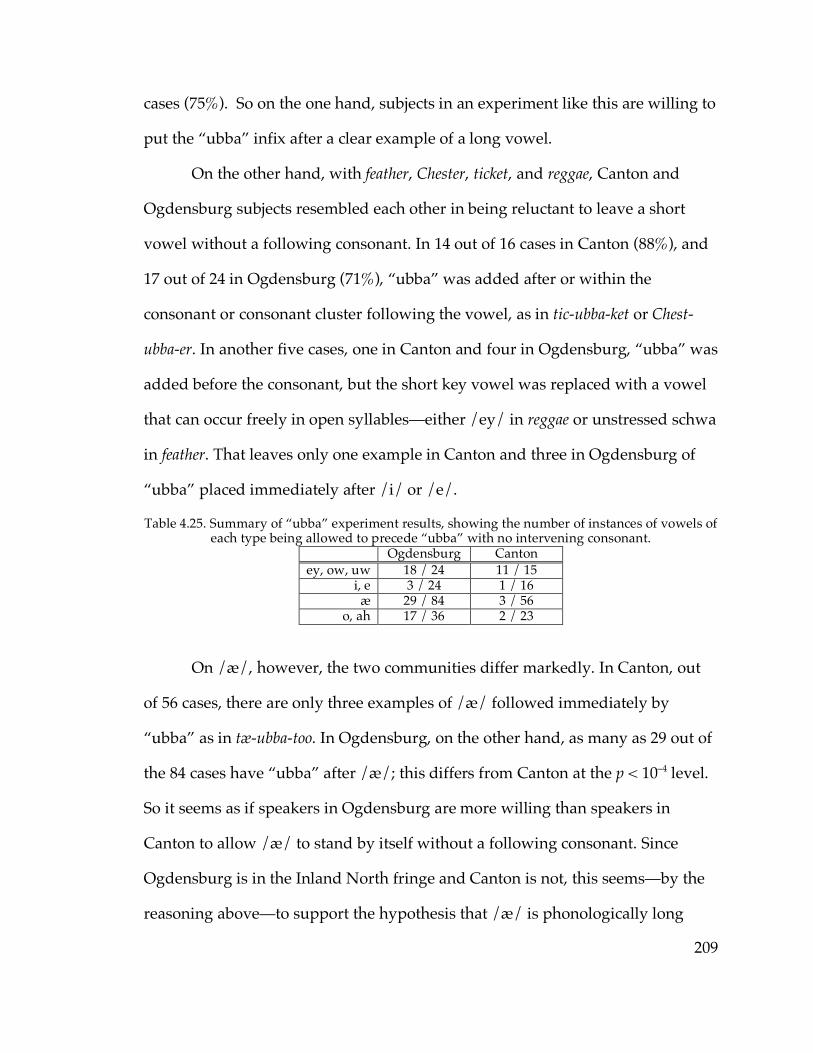
209
cases (75%). So on the one hand, subjects in an experiment like this are willing to
put the “ubba” infix after a clear example of a long vowel.
On the other hand, with feather, Chester, ticket, and reggae, Canton and
Ogdensburg subjects resembled each other in being reluctant to leave a short
vowel without a following consonant. In 14 out of 16 cases in Canton (88%), and
17 out of 24 in Ogdensburg (71%), “ubba” was added after or within the
consonant or consonant cluster following the vowel, as in tic-ubba-ket or Chest-
ubba-er. In another five cases, one in Canton and four in Ogdensburg, “ubba” was
added before the consonant, but the short key vowel was replaced with a vowel
that can occur freely in open syllables—either /ey/ in reggae or unstressed schwa
in feather. That leaves only one example in Canton and three in Ogdensburg of
“ubba” placed immediately after /i/ or /e/.
Table 4.25. Summary of “ubba” experiment results, showing the number of instances of vowels of each type being allowed to precede “ubba” with no intervening consonant.
Ogdensburg Canton ey, ow, uw 18 / 24 11 / 15
i, e 3 / 24 1 / 16 æ 29 / 84 3 / 56
o, ah 17 / 36 2 / 23
On /æ/, however, the two communities differ markedly. In Canton, out
of 56 cases, there are only three examples of /æ/ followed immediately by
“ubba” as in tæ-ubba-too. In Ogdensburg, on the other hand, as many as 29 out of
the 84 cases have “ubba” after /æ/; this differs from Canton at the p < 10–4 level.
So it seems as if speakers in Ogdensburg are more willing than speakers in
Canton to allow /æ/ to stand by itself without a following consonant. Since
Ogdensburg is in the Inland North fringe and Canton is not, this seems—by the
reasoning above—to support the hypothesis that /æ/ is phonologically long
210
within the Inland North and short outside it. The fact that /æ/ was only allowed
to stand in an open syllable in a minority of cases even in Ogdensburg could then
be ascribed to lingering effects of its history as a short vowel—subjects could
have been influenced by the fact that /æ/ is treated like a short vowel in
orthography, and never appears in real words without a following consonant, in
deciding whether to place “ubba” before or after the medial consonant, even
while the phonology permitted them to do either.
Two of the six Ogdensburg subjects actually produced no instances of
“ubba” immediately after /æ/; the remaining four produced between six and ten
each (out of a possible 14). We might compare Ogdensburg and Canton at the
level of speakers, rather than at the level of tokens—that is to say, Canton has
four speakers who put “ubba” after /æ/ twice or less, while Ogdensburg has
two who did so twice or less and four who did six times or more. This difference
as stated between Ogdensburg and Canton does not achieve the level of
statistical significance (p ≈ 0.07). However, one of the two Ogdensburg subjects
who produced no instances of “ubba” immediately after /æ/ in fact produced
only one instance of “ubba” immediately after a vowel at all, and that one was
pro-ubba-gram. Program was (inadvertently) the only word on the list with a first
syllable that is clearly recognizable as a prefix—so in fact this speaker never
divided a monomorpheme by putting “ubba” after a vowel. So, arguably, her
placement of “ubba” gives us no information at all about the phonology of the
vowels in the first syllable. (All other subjects at least divided monomorphemic
toupee as tou-ubba-pee.) If she is excluded as uninformative, the difference
between Ogdensburg and Canton appears significant at p ≈ 0.04.
211
However, assuming that the difference between Ogdensburg and Canton
is meaningful, the results from /o/ call into question the interpretation that /æ/
is phonologically long in Ogdensburg but short in Canton. Of the eighteen
speakers interviewed in Ogdensburg and Canton, only one claimed that father
and bother did not rhyme; and for the one speaker who claimed to have a
distinction, her five tokens of /ah/ are all contained within the F1/F2 range of
/o/, and four of those five tokens are within a single standard deviation of mean
/o/. This indicates that the merger of /o/ and /ah/ appears to be complete in
these communities. As Labov & Baranowski (2006) point out, this means that
/o/ should be regarded as phonologically a long vowel. In Canton, the merger
between /o/ and /oh/ is also in progress, as will be discussed in Chapter 5,
which adds another motivation for regarding /o/ as a long vowel.
If /o/ is a long vowel, it should more or less freely be allowed to occur
without a following consonant—that is, speakers should be relatively willing to
insert “ubba” after it in the “Ubba” game. In Ogdensburg, that’s what we find:
out of 36 possible, there are 17 instances of /o/~/ah/ followed immediately by
“ubba”. A smaller fraction of instances of /o/ are syllable-final in the “Ubba”
game in Ogdensburg than of instances of the upgliding diphthongs in radar,
toupee, program, and donate; but it is substantially larger than the fraction of
syllable-final instances of the short vowels in feather, Chester, ticket, and reggae.33
This is what we would have expected for /o/, based on the findings above for
/æ/ in Ogdensburg: it is a synchronically long vowel and so free to appear
33 Recall that in Ogdensburg there were only three tokens of /e/ or /i/ immediately before “ubba”, out of 20 tokens in which /e/ or /i/ was not replaced with some other phoneme. This rate of 3 out of 20 for /e/ and /i/ differs at the p < 0.02 level from the 17 out of 36 for /o/.
212
syllable-finally, with some historic and orthographic association with the short-
vowel subsystem leading to a somewhat higher rate of open-syllable avoidance
in the “Ubba” task.
In Canton, however—in which the status of /o/ as a long vowel should be
as well-established as in Ogdensburg or more, based on the father-bother and
caught-cot mergers—the results are totally different (p ≈ 0.002). Out of a total of 23
instances of /o/~/ah/34 in the “Ubba” game in Canton, only two were syllable-
final. This very closely resembles the results for /æ/ (3 out of 56) and /e/ and
/i/ (1 out of 16). This leaves two possibilities: either the father-bother merger is
not complete in Canton and /o/ is still phonologically short, or /o/’s status as a
long vowel does not prevent it from being treated the same as short vowels with
respect to the “Ubba” game in Canton.
There is some evidence for the first possibility in that both instances of
/o/~/ah/ followed immediately by “ubba” in Canton are actually instances of
/ah/—i.e., the word father. That is, in Canton, /ah/ has “ubba” immediately
following it in 50% of instances (twice out of four), while /o/ proper never does;
despite the sparsity of the data, this difference is statistically significant at
p < 0.03. There are other interpretations for this result than that /o/ and /ah/ are
unmerged, however. It may, for example, be evidence of an orthographic effect:
father is the only /o/ ~ /ah/ word in the experiment in which the key vowel is
not followed by an orthographic geminate or consonant cluster, which could
have influenced subjects to syllabify the consonant with the preceding vowel.
(Similarly, of the four cases between both communities of an unambiguous short 34 It ought to have been 24, of course; but one speaker did not recognize the word toggle and was unable to give any response at all for it.
213
vowel followed immediately by “ubba”, three are feather.) Moreover, three of the
four “Ubba”-test subjects in Canton were also subjects of full interviews; as
mentioned above, all three stated that father and bother rhymed for them. Two of
the three nevertheless have statistically significant differences in F2 between /o/
and /ah/ in their interview data; but those two are the two who treat father like
the /o/ words, placing “ubba” after the medial consonant. The one of the three
who produced fah-ubba-ther has no significant difference between /ah/ and /o/
in F1 or F2 and has all tokens of /ah/ within one standard deviation of mean
/o/. So it’s not clear that inserting “ubba” after the /ah/ in father but not after
/o/ in other words is related to maintaining a phonemic distinction between
/ah/ and /o/.
That leaves the second possibility—or at least, the second possibility
cannot be ruled out: /o/, despite being phonologically long, is treated like a
short vowel for purposes of the “Ubba” task in Canton. This means that although
the “Ubba” task gives convincing evidence that /æ/ is phonologically long in
Ogdensburg, it doesn’t give convincing evidence that /æ/ is phonologically short
in Canton. That is, /æ/ is treated the same way as /o/ in Canton; and since /o/
is known (or at least suspected) to be a long vowel, that means we can’t strictly
rule out the possibility that /æ/ is long as well. So these results support the
hypothesis that /æ/ in the Inland North is properly considered a member of the
long and ingliding subsystem, which is half of the question that motivated the
experiment; however, we don’t have clear evidence on the other half of the
question, namely whether that constitutes a difference between the Inland North
and non-NCS regions. The findings of this section do, however, unexpectedly
214
relate to other hypotheses on the phonological status of low vowels in English, as
discussed below.
4.4.4. Subsystem ambiguity of low monophthongs
Regardless of whether /æ/ is phonologically long or short in Canton, why
should /o/, which is almost certainly long assuming the merger with /ah/ is as
complete as it seems, behave like a short vowel with respect to the “Ubba”
experiment? In fact, this result is generally consistent with other indications that
the boundary between the short subsystem and the long and ingliding
subsystem is not very stable for low vowels. To begin with, low vowels in the
long and ingliding subsystem are described as monophthongal, differing from
short vowels only in length (see e.g. ANAE p.12, note 6). Labov (to appear, ch.6)
suggests additionally that peripherality, another feature which often serves to
increase the distinctiveness of short and long vowels, is also not defined for low
vowels. This means low short vowels are phonetically a lot closer to long vowels
than are short vowels of other heights, at which long vowels involve a
substantial glide from one point in the vowel space to another; so it might only
take at most a relatively subtle phonetic change to cause a shift of subsystem.
Two very well-known unconditioned phonemic mergers in North
American English are mergers between a low member of the long and ingliding
class and a low short vowel: /oh/ with /o/ (the caught-cot merger) and /ah/
with /o/ (the father-bother merger), respectively. Of all the other mergers
reported in ANAE, the only ones between vowels of different subsystems are
215
those that are conditioned by some following segment that is in the process of
changing its status from consonant to glide: /r/ for the marry-merry-Mary
merger35 and related mergers, and /l/ for a collection of mergers such as the pull-
pool merger and the hill-heel merger. In other words, the only unconditioned
mergers in North American between vowels of different subsystems, and the
only such mergers that occur without a force from outside the syllable tampering
with the glide constituent, are between a short low vowel and a low vowel of the
long and ingliding subsystem. So it seems fairly clear that, among the low
vowels, the barrier between the short subsystem and the long and ingliding
subsystem is at best relatively weak.
The fact that (in Canton) even a low vowel that is known to be part of the
long and ingliding subsystem acts in this experiment like a short vowel supports
the hypothesis that the barriers between the two subsystems are weakened for
low vowels. In fact, perhaps it is possible to make an even stronger hypothesis:
American English phonology, or at least that of certain dialects, does not
distinguish between the short subsystem and the long and ingliding subsystem
among low vowels. Under this model, low monophthongs are free to show some
features of short vowels (such as their behavior in the “Ubba” experiment in
Canton) and some features of long vowels (such as the freedom of merged
/o/~/ah/ to appear without a following consonant).36 Obviously, this is a pretty
35 See Dinkin (2005) for a defense of this analysis of the marry-merry-Mary merger, and Veatch (1991) for a defense of treating /r/ as a glide rather than a consonant in American English phonology. 36 An alternative possibility here is that a difference between subsystems does exist for low vowels, but /o/ has an allophonic alternation that crosses subsystems. In this scenario, merged /o/~/ah/ is underlyingly /ah/, a member of the long and ingliding subsystem, but it has a short allophone (via a Phase II phonological rule, so that the allophones have discretely different segmental representations) that appears in checked syllables. This, together with the fact that in
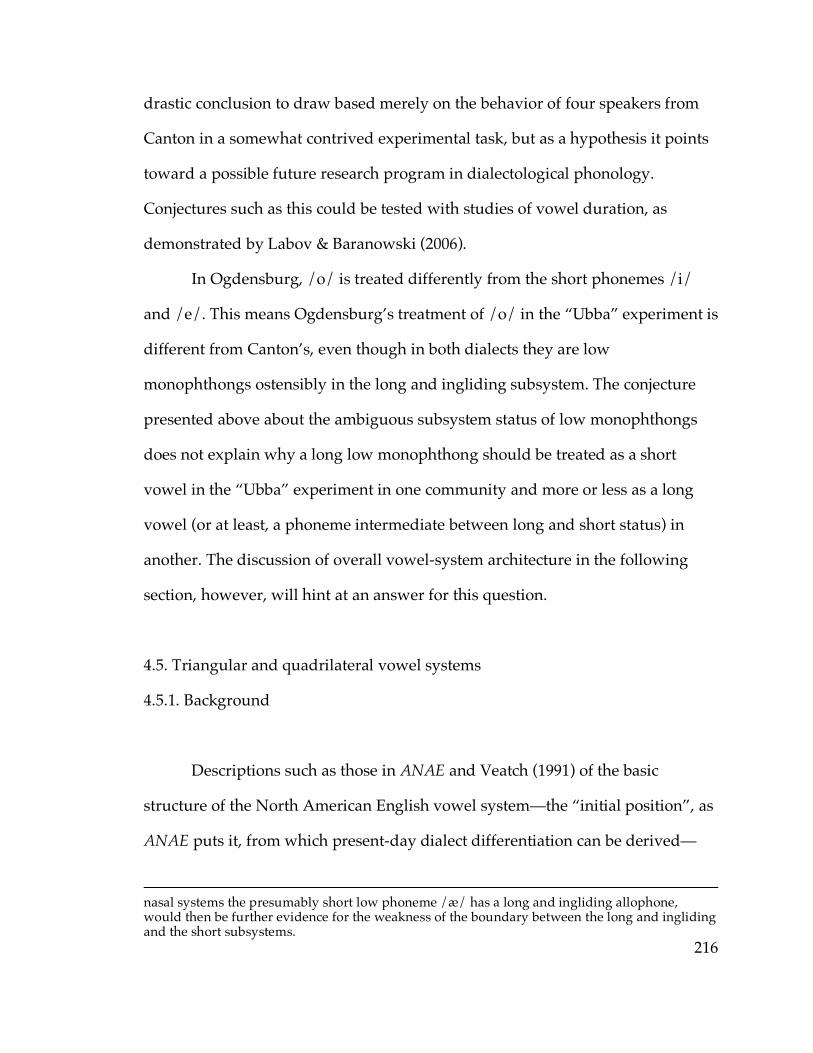
216
drastic conclusion to draw based merely on the behavior of four speakers from
Canton in a somewhat contrived experimental task, but as a hypothesis it points
toward a possible future research program in dialectological phonology.
Conjectures such as this could be tested with studies of vowel duration, as
demonstrated by Labov & Baranowski (2006).
In Ogdensburg, /o/ is treated differently from the short phonemes /i/
and /e/. This means Ogdensburg’s treatment of /o/ in the “Ubba” experiment is
different from Canton’s, even though in both dialects they are low
monophthongs ostensibly in the long and ingliding subsystem. The conjecture
presented above about the ambiguous subsystem status of low monophthongs
does not explain why a long low monophthong should be treated as a short
vowel in the “Ubba” experiment in one community and more or less as a long
vowel (or at least, a phoneme intermediate between long and short status) in
another. The discussion of overall vowel-system architecture in the following
section, however, will hint at an answer for this question.
4.5. Triangular and quadrilateral vowel systems
4.5.1. Background
Descriptions such as those in ANAE and Veatch (1991) of the basic
structure of the North American English vowel system—the “initial position”, as
ANAE puts it, from which present-day dialect differentiation can be derived—
nasal systems the presumably short low phoneme /æ/ has a long and ingliding allophone, would then be further evidence for the weakness of the boundary between the long and ingliding and the short subsystems.
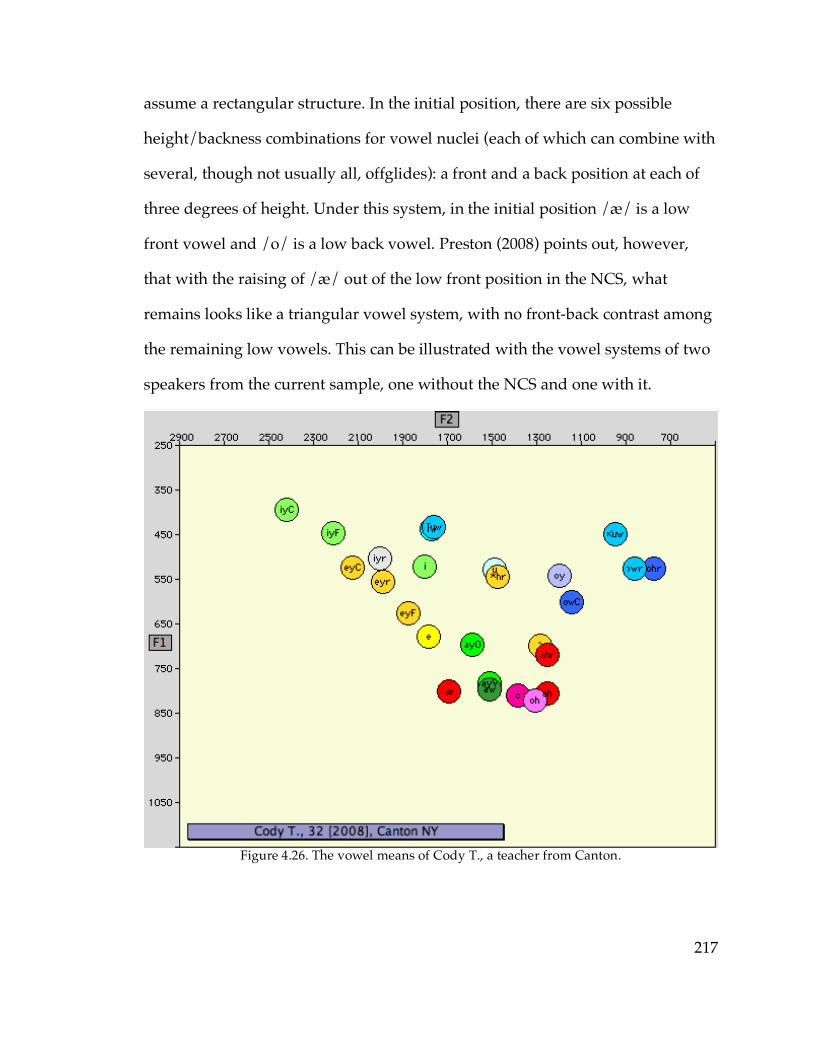
217
assume a rectangular structure. In the initial position, there are six possible
height/backness combinations for vowel nuclei (each of which can combine with
several, though not usually all, offglides): a front and a back position at each of
three degrees of height. Under this system, in the initial position /æ/ is a low
front vowel and /o/ is a low back vowel. Preston (2008) points out, however,
that with the raising of /æ/ out of the low front position in the NCS, what
remains looks like a triangular vowel system, with no front-back contrast among
the remaining low vowels. This can be illustrated with the vowel systems of two
speakers from the current sample, one without the NCS and one with it.
Figure 4.26. The vowel means of Cody T., a teacher from Canton.
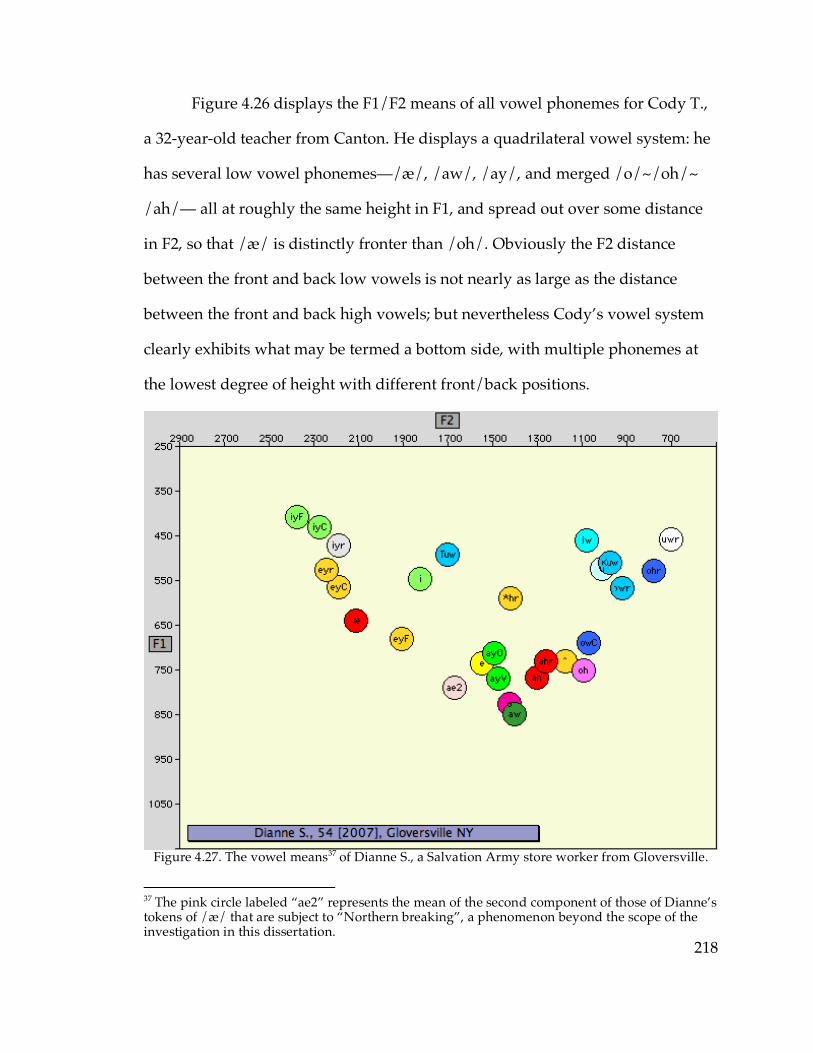
218
Figure 4.26 displays the F1/F2 means of all vowel phonemes for Cody T.,
a 32-year-old teacher from Canton. He displays a quadrilateral vowel system: he
has several low vowel phonemes—/æ/, /aw/, /ay/, and merged /o/~/oh/~
/ah/— all at roughly the same height in F1, and spread out over some distance
in F2, so that /æ/ is distinctly fronter than /oh/. Obviously the F2 distance
between the front and back low vowels is not nearly as large as the distance
between the front and back high vowels; but nevertheless Cody’s vowel system
clearly exhibits what may be termed a bottom side, with multiple phonemes at
the lowest degree of height with different front/back positions.
Figure 4.27. The vowel means37 of Dianne S., a Salvation Army store worker from Gloversville.
37 The pink circle labeled “ae2” represents the mean of the second component of those of Dianne’s tokens of /æ/ that are subject to “Northern breaking”, a phenomenon beyond the scope of the investigation in this dissertation.
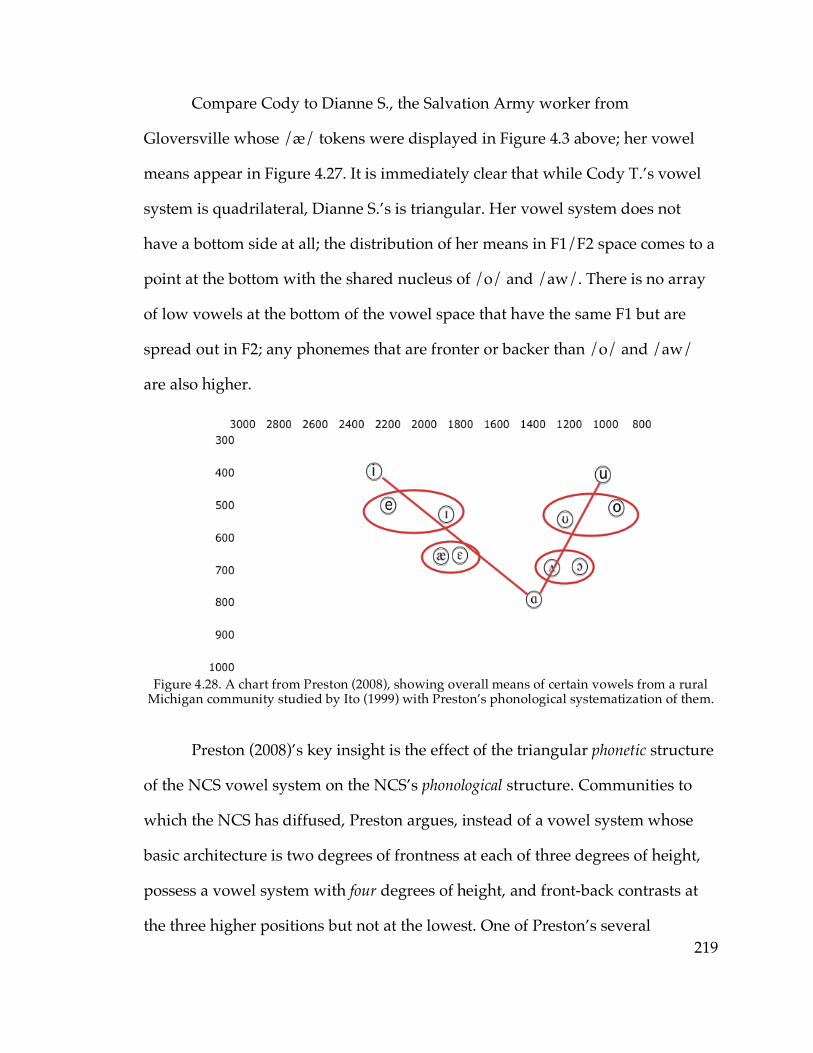
219
Compare Cody to Dianne S., the Salvation Army worker from
Gloversville whose /æ/ tokens were displayed in Figure 4.3 above; her vowel
means appear in Figure 4.27. It is immediately clear that while Cody T.’s vowel
system is quadrilateral, Dianne S.’s is triangular. Her vowel system does not
have a bottom side at all; the distribution of her means in F1/F2 space comes to a
point at the bottom with the shared nucleus of /o/ and /aw/. There is no array
of low vowels at the bottom of the vowel space that have the same F1 but are
spread out in F2; any phonemes that are fronter or backer than /o/ and /aw/
are also higher.
Figure 4.28. A chart from Preston (2008), showing overall means of certain vowels from a rural
Michigan community studied by Ito (1999) with Preston’s phonological systematization of them.
Preston (2008)’s key insight is the effect of the triangular phonetic structure
of the NCS vowel system on the NCS’s phonological structure. Communities to
which the NCS has diffused, Preston argues, instead of a vowel system whose
basic architecture is two degrees of frontness at each of three degrees of height,
possess a vowel system with four degrees of height, and front-back contrasts at
the three higher positions but not at the lowest. One of Preston’s several

220
examples of such a system is shown in Figure 4.28. Preston characterizes this
phonology as having the following features:
• At the three corners of the vowel triangle—the front and back high
positions and the single low position—are long vowels with no short
counterparts. In our notation, there are /iy/, /uw/, and /ah/ (equivalent
to /o/).
• There are four short vowel phonemes, located at the front and back
positions of the two intermediate degrees of height—in our notation, /i/,
/e/, /ʌ/, and /u/.
• The four short vowel phonemes each have a corresponding long phoneme
of the same height and frontness, with a somewhat more peripheral
nucleus and an offglide corresponding in direction to the closest corner of
the vowel triangle: /i/ is paired with /ey/, /e/ with /æh/ (phonemically
long, as discussed in the previous section), /ʌ/ with /oh/, and /u/ with
/ow/.
This system represents a drastic reorganization not only of the overall
structure of the vowel system—from a rectangle with three degrees of height to a
triangle with four degrees of height—but also in the relationships of the various
vowel phonemes to each other. Whereas in the “initial position”, as the notation
suggests, /iy/’s nucleus has the same place features as /i/, /ey/’s as /e/, and
/uw/’s as /u/, in Preston’s triangular model each of those short vowels is
associated with a completely different long vowel. The triangular model is
extremely elegant and symmetric, however. Each short phoneme is very close in
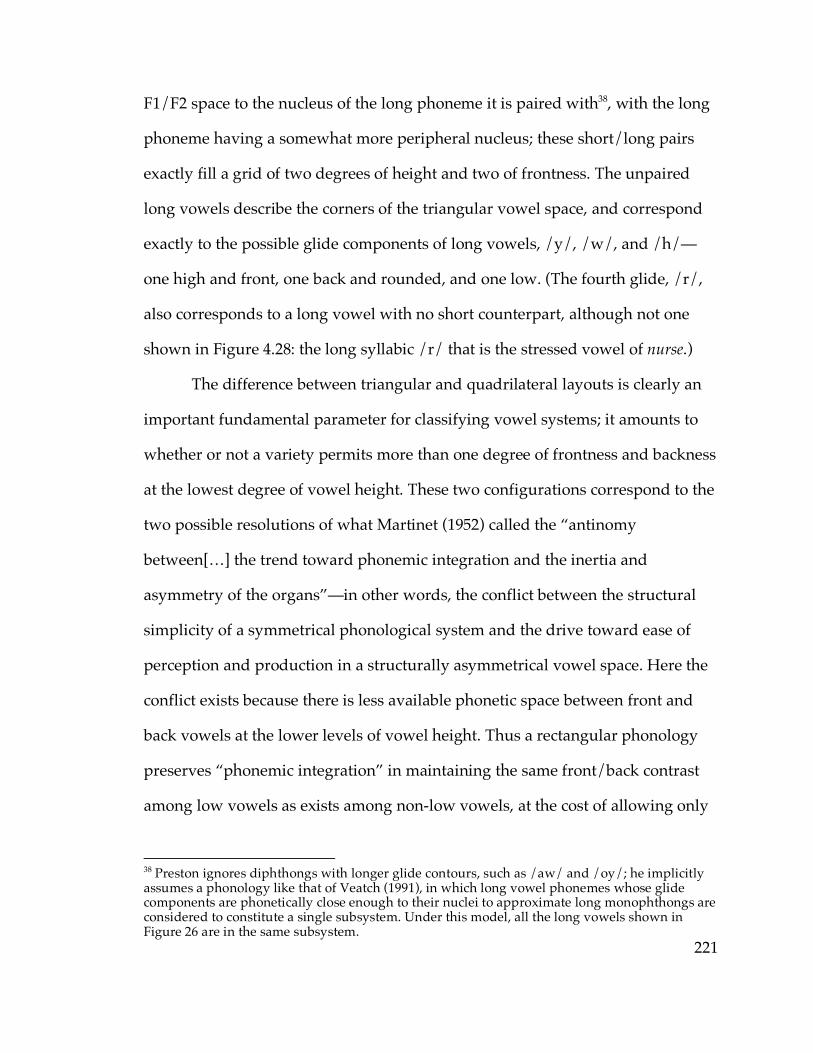
221
F1/F2 space to the nucleus of the long phoneme it is paired with38, with the long
phoneme having a somewhat more peripheral nucleus; these short/long pairs
exactly fill a grid of two degrees of height and two of frontness. The unpaired
long vowels describe the corners of the triangular vowel space, and correspond
exactly to the possible glide components of long vowels, /y/, /w/, and /h/—
one high and front, one back and rounded, and one low. (The fourth glide, /r/,
also corresponds to a long vowel with no short counterpart, although not one
shown in Figure 4.28: the long syllabic /r/ that is the stressed vowel of nurse.)
The difference between triangular and quadrilateral layouts is clearly an
important fundamental parameter for classifying vowel systems; it amounts to
whether or not a variety permits more than one degree of frontness and backness
at the lowest degree of vowel height. These two configurations correspond to the
two possible resolutions of what Martinet (1952) called the “antinomy
between[…] the trend toward phonemic integration and the inertia and
asymmetry of the organs”—in other words, the conflict between the structural
simplicity of a symmetrical phonological system and the drive toward ease of
perception and production in a structurally asymmetrical vowel space. Here the
conflict exists because there is less available phonetic space between front and
back vowels at the lower levels of vowel height. Thus a rectangular phonology
preserves “phonemic integration” in maintaining the same front/back contrast
among low vowels as exists among non-low vowels, at the cost of allowing only
38 Preston ignores diphthongs with longer glide contours, such as /aw/ and /oy/; he implicitly assumes a phonology like that of Veatch (1991), in which long vowel phonemes whose glide components are phonetically close enough to their nuclei to approximate long monophthongs are considered to constitute a single subsystem. Under this model, all the long vowels shown in Figure 26 are in the same subsystem.

222
a relatively small margin of security between them; a triangular phonology
allows a larger margin of security but loses the contrast.
Figure 4.29. A chart taken from Preston (2008) attempting to apply the phonological structure of
Figure 4.28 above to the vowels of young speakers in Inland North core urban areas in southeastern Michigan.
Although the triangular system sacrifices phonological symmetry for
phonetic symmetry, the triangular system displayed in Figure 4.28 shows (as
discussed above) a great degree of structural symmetry both internally and with
respect to the overall structure of the vowel system. Preston specifically
attributes this symmetrical triangular phonological system only to communities to
which the NCS has diffused. In core NCS communities, the phonetic relationships
between the short and long phonemes shown in Figure 4.28 are not nearly so
well organized as they are in each of several communities Preston displays
which have acquired the NCS more recently. Figure 4.29 displays Preston’s
illustration of what it looks like to impose the phonological system of Figure 4.28
on the vowels of young speakers in the Inland North core communities of
southeastern Michigan: the nucleus of /æ/ is closer to /ey/ and /i/ than to /e/;
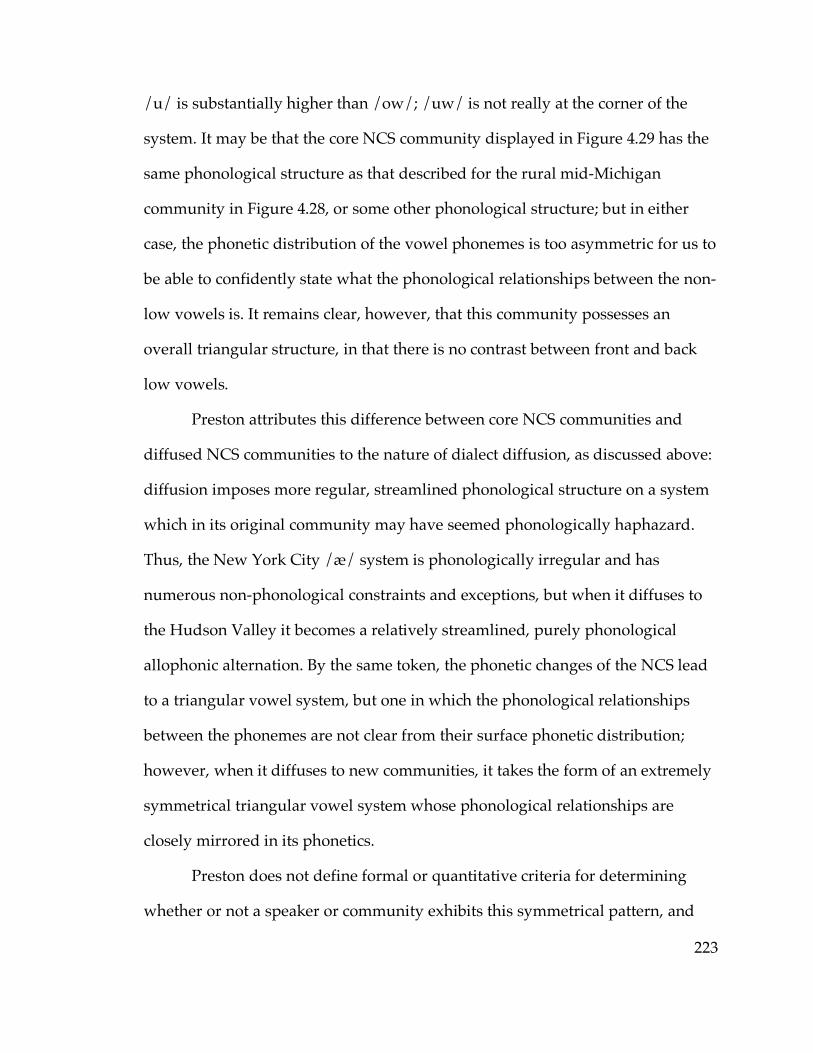
223
/u/ is substantially higher than /ow/; /uw/ is not really at the corner of the
system. It may be that the core NCS community displayed in Figure 4.29 has the
same phonological structure as that described for the rural mid-Michigan
community in Figure 4.28, or some other phonological structure; but in either
case, the phonetic distribution of the vowel phonemes is too asymmetric for us to
be able to confidently state what the phonological relationships between the non-
low vowels is. It remains clear, however, that this community possesses an
overall triangular structure, in that there is no contrast between front and back
low vowels.
Preston attributes this difference between core NCS communities and
diffused NCS communities to the nature of dialect diffusion, as discussed above:
diffusion imposes more regular, streamlined phonological structure on a system
which in its original community may have seemed phonologically haphazard.
Thus, the New York City /æ/ system is phonologically irregular and has
numerous non-phonological constraints and exceptions, but when it diffuses to
the Hudson Valley it becomes a relatively streamlined, purely phonological
allophonic alternation. By the same token, the phonetic changes of the NCS lead
to a triangular vowel system, but one in which the phonological relationships
between the phonemes are not clear from their surface phonetic distribution;
however, when it diffuses to new communities, it takes the form of an extremely
symmetrical triangular vowel system whose phonological relationships are
closely mirrored in its phonetics.
Preston does not define formal or quantitative criteria for determining
whether or not a speaker or community exhibits this symmetrical pattern, and
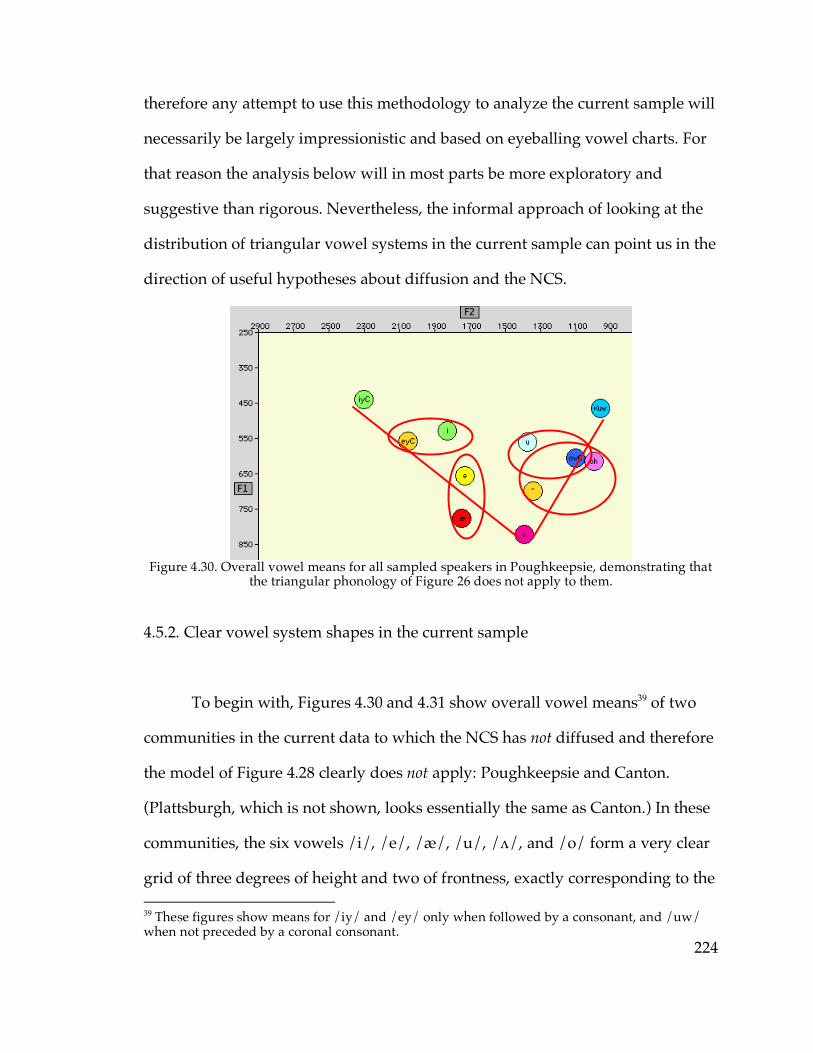
224
therefore any attempt to use this methodology to analyze the current sample will
necessarily be largely impressionistic and based on eyeballing vowel charts. For
that reason the analysis below will in most parts be more exploratory and
suggestive than rigorous. Nevertheless, the informal approach of looking at the
distribution of triangular vowel systems in the current sample can point us in the
direction of useful hypotheses about diffusion and the NCS.
Figure 4.30. Overall vowel means for all sampled speakers in Poughkeepsie, demonstrating that
the triangular phonology of Figure 26 does not apply to them.
4.5.2. Clear vowel system shapes in the current sample
To begin with, Figures 4.30 and 4.31 show overall vowel means39 of two
communities in the current data to which the NCS has not diffused and therefore
the model of Figure 4.28 clearly does not apply: Poughkeepsie and Canton.
(Plattsburgh, which is not shown, looks essentially the same as Canton.) In these
communities, the six vowels /i/, /e/, /æ/, /u/, /ʌ/, and /o/ form a very clear
grid of three degrees of height and two of frontness, exactly corresponding to the 39 These figures show means for /iy/ and /ey/ only when followed by a consonant, and /uw/ when not preceded by a coronal consonant.
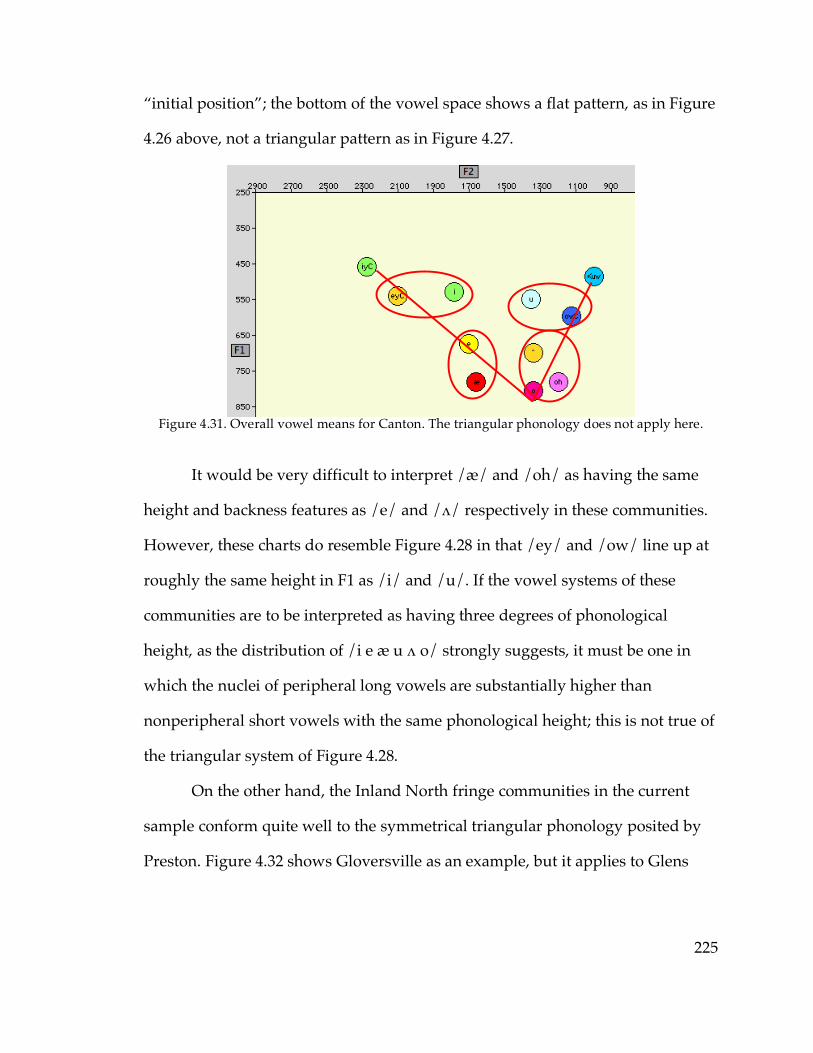
225
“initial position”; the bottom of the vowel space shows a flat pattern, as in Figure
4.26 above, not a triangular pattern as in Figure 4.27.
Figure 4.31. Overall vowel means for Canton. The triangular phonology does not apply here.
It would be very difficult to interpret /æ/ and /oh/ as having the same
height and backness features as /e/ and /ʌ/ respectively in these communities.
However, these charts do resemble Figure 4.28 in that /ey/ and /ow/ line up at
roughly the same height in F1 as /i/ and /u/. If the vowel systems of these
communities are to be interpreted as having three degrees of phonological
height, as the distribution of /i e æ u ʌ o/ strongly suggests, it must be one in
which the nuclei of peripheral long vowels are substantially higher than
nonperipheral short vowels with the same phonological height; this is not true of
the triangular system of Figure 4.28.
On the other hand, the Inland North fringe communities in the current
sample conform quite well to the symmetrical triangular phonology posited by
Preston. Figure 4.32 shows Gloversville as an example, but it applies to Glens
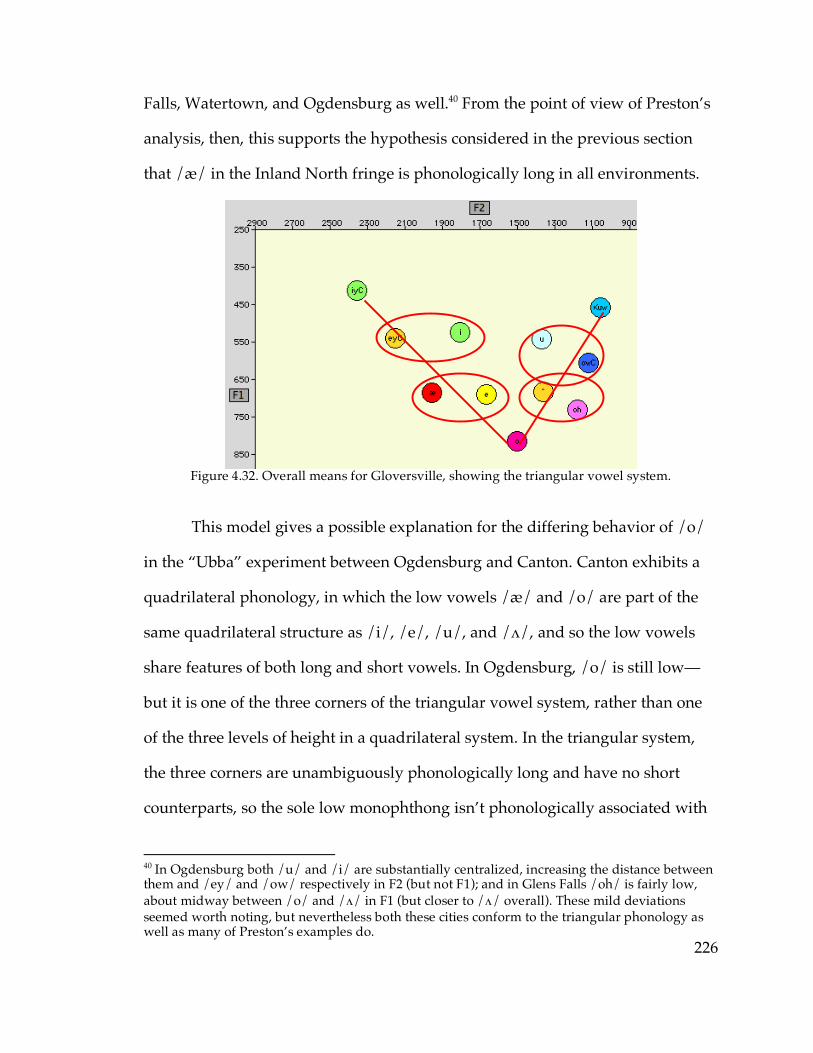
226
Falls, Watertown, and Ogdensburg as well.40 From the point of view of Preston’s
analysis, then, this supports the hypothesis considered in the previous section
that /æ/ in the Inland North fringe is phonologically long in all environments.
Figure 4.32. Overall means for Gloversville, showing the triangular vowel system.
This model gives a possible explanation for the differing behavior of /o/
in the “Ubba” experiment between Ogdensburg and Canton. Canton exhibits a
quadrilateral phonology, in which the low vowels /æ/ and /o/ are part of the
same quadrilateral structure as /i/, /e/, /u/, and /ʌ/, and so the low vowels
share features of both long and short vowels. In Ogdensburg, /o/ is still low—
but it is one of the three corners of the triangular vowel system, rather than one
of the three levels of height in a quadrilateral system. In the triangular system,
the three corners are unambiguously phonologically long and have no short
counterparts, so the sole low monophthong isn’t phonologically associated with
40 In Ogdensburg both /u/ and /i/ are substantially centralized, increasing the distance between them and /ey/ and /ow/ respectively in F2 (but not F1); and in Glens Falls /oh/ is fairly low, about midway between /o/ and /√/ in F1 (but closer to /√/ overall). These mild deviations seemed worth noting, but nevertheless both these cities conform to the triangular phonology as well as many of Preston’s examples do.

227
the short vowels in the way low vowels are in the quadrilateral system. In other
words, the low long vowel /o/~/ah/ in Canton behaves differently in the
“Ubba” test than the low long /o/~/ah/ does in Ogdensburg because the
structure of low vowels is different in the triangular and quadrilateral systems.
Figure 4.33. Overall means for younger speakers in Utica, showing a triangular system without a
clear set of four levels of vowel height.
4.5.3. Evidence for diffusion into the Inland North fringe
The triangular phonologies of the Inland North fringe communities are
consistent, according to Preston’s analysis, with the proposition that the NCS did
not develop naturally in these communities, but rather spread to them (i.e.,
diffused) from the Inland North core. In Inland North core communities, Preston
argues, the overall layout of the vowel system is triangular, but the phonetic
parallelism between long and short vowels is not so clear-cut. This holds true in
Utica, the well-sampled Inland North core community in the current data. Figure
4.33 shows the overall vowel means of the six Utica speakers in the sample who
were born in 1979 or later—i.e., Janet B., who has the highest /æ/ in the entire
228
sample by a considerable margin, is excluded as an outlier. Despite Janet’s
exclusion, the mean Utica /æ/ is still high enough to be closer to /i/ than to /e/.
This leads to an overall less clear set of vowel height tiers than is seen in 4.32 and
4.28. So based on the structure of vowel systems and Preston’s analysis, we get
the impression that while the NCS may have originated in the Inland North core,
it reached the fringe through dialect diffusion. Is there other support for this
hypothesis?
Labov (2007) compares NCS scores in northern Illinois, an area known to
be historically part of the dialectological Inland North, with the “St. Louis
corridor”, a part of the Midland to which the NCS has diffused, including the
city of St. Louis, Mo., and several communities in central Illinois. In both these
regions, Telsur speakers’ scores range between one and five; but Labov finds that
in northern Illinois, NCS score is strongly correlated with age (r2 ≈ 0.55), whereas
in the St. Louis corridor, there is no such correlation (r2 ≈ 0.04). Labov argues that
this difference is the result of the differing historical status of the NCS in the two
regions: in the St. Louis corridor, the presence of the NCS is the result of
diffusion of individual components of the NCS by adult speakers rather than
incrementation of an ongoing chain shift by adolescents, and so it would not be
expected to be systematically more advanced among the youngest speakers.
In the Inland North fringe communities in the current sample, scores
range between 1 and 4, and there is no correlation of score with age for the
region as a whole (r2 < 10–3). 41 The only community in the Inland North fringe
41 The Inland North core communities in the current sample also have no correlation of score with age: r2 ≈ 0.005. However, this need not be taken as evidence that the NCS diffused to the Inland North core also. Where northern Illinois and the St. Louis corridor as discussed by Labov (2007)
229
with a statistically significant correlation between score and year of birth (as
mentioned in the previous chapter) is Ogdensburg, in which the only speaker
with a score of 1—in fact, the only speaker in any of the sampled Inland North
communities with a score of 1—is also the oldest speaker interviewed in
Ogdensburg by a margin of 36 years. Inasmuch as both the apparent-time
profiles of NCS scores and the distribution of phonemes in phonetic space in the
Inland North fringe communities resemble, on the whole, those found by Labov
and Preston respectively in communities to which the NCS is known to have
diffused, these data suggest that the NCS diffused to the Inland North fringe
communities as well, although perhaps more recently to Ogdensburg than to the
others.
In Chapter 3, it was found that in the Hudson Valley communities, in
particular Oneonta and Amsterdam, /e/ is relatively backed and /o/ is
relatively fronted, as in the NCS, but /æ/ is not particularly raised; and, since it
was clear that the NCS as a chain shift was not active in those communities, it
was conjectured that individual components of the NCS had diffused to the
Hudson Valley but that /æ/-raising in particular had not. Now, we find
evidence to suggest that something similar is true in the Inland North fringe
communities; the difference is that all of the components of the NCS have
diffused to the Inland North fringe, including the raising of /æ/. And therefore,
as suggested earlier in this chapter, the difference between Amsterdam and
Oneonta on the one hand and Gloversville, Glens Falls, Watertown, and
both have scores ranging from one to five, the Inland North core in this data ranges only from three to five. So we can take the absence of an age correlation as indicating merely that the change has gone to completion in the Inland North core.

230
Ogdensburg on the other hand is merely their degree of openness to the NCS
raising of /æ/: communities settled from southwestern New England had
continuous /æh/ systems, and Hudson Valley communities had nasal (or
diffused New York City–style) /æ/ systems.
Figure 4.34. Overall vowel means for Amsterdam. Red loops show the vowel pairs according to Preston’s diffused NCS system; the blue box outlines the six key positions of the quadrilateral
vowel system.
4.5.4. Vowel system shapes in Oneonta and Amsterdam
To conclude the treatment of Preston (2008)’s analysis of the triangular
vowel system, let’s look at Amsterdam and Oneonta themselves. Figures 4.34
and 4.35 show that both of these cities are actually somewhat intermediate
between the clear symmetrical triangular structure of the Inland North fringe
cities and the rectangular phonological structure shown in Figures 4.30 and 4.31
for Poughkeepsie and Canton. On the one hand, the phonemes paired by Preston
as having the same place features show a symmetrical distribution, although not
the exact same symmetrical position in Preston’s ideal case: the tense phoneme in
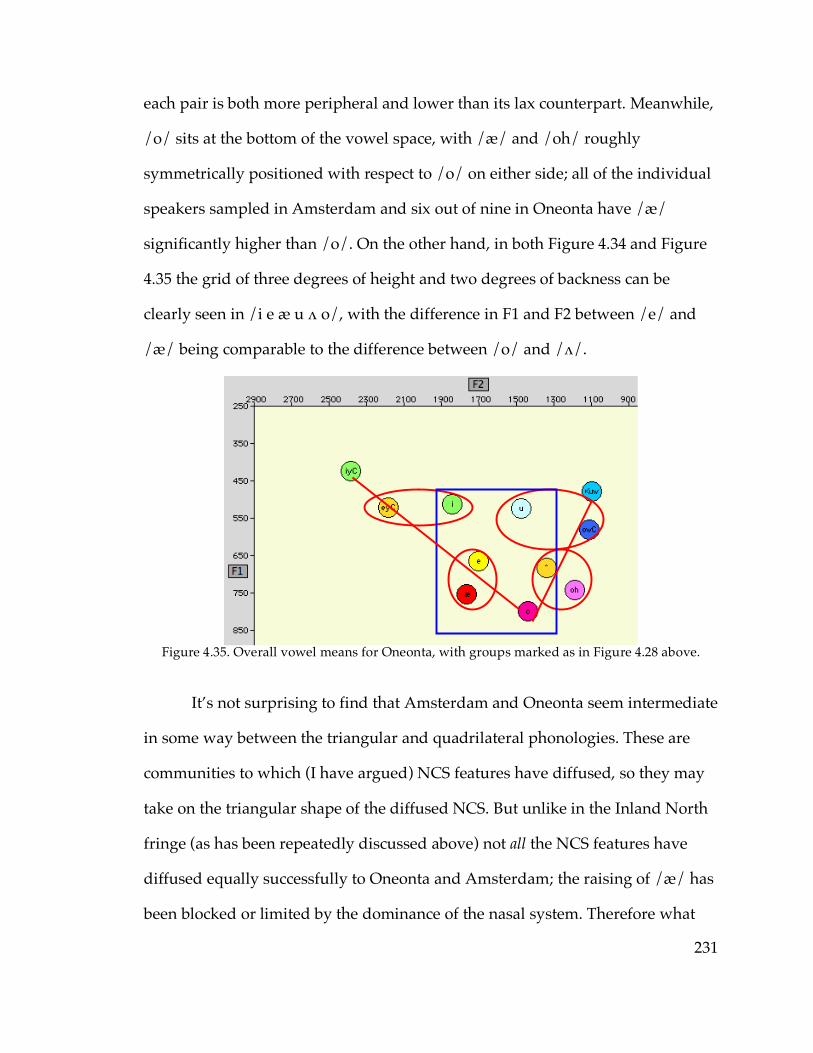
231
each pair is both more peripheral and lower than its lax counterpart. Meanwhile,
/o/ sits at the bottom of the vowel space, with /æ/ and /oh/ roughly
symmetrically positioned with respect to /o/ on either side; all of the individual
speakers sampled in Amsterdam and six out of nine in Oneonta have /æ/
significantly higher than /o/. On the other hand, in both Figure 4.34 and Figure
4.35 the grid of three degrees of height and two degrees of backness can be
clearly seen in /i e æ u ʌ o/, with the difference in F1 and F2 between /e/ and
/æ/ being comparable to the difference between /o/ and /ʌ/.
Figure 4.35. Overall vowel means for Oneonta, with groups marked as in Figure 4.28 above.
It’s not surprising to find that Amsterdam and Oneonta seem intermediate
in some way between the triangular and quadrilateral phonologies. These are
communities to which (I have argued) NCS features have diffused, so they may
take on the triangular shape of the diffused NCS. But unlike in the Inland North
fringe (as has been repeatedly discussed above) not all the NCS features have
diffused equally successfully to Oneonta and Amsterdam; the raising of /æ/ has
been blocked or limited by the dominance of the nasal system. Therefore what
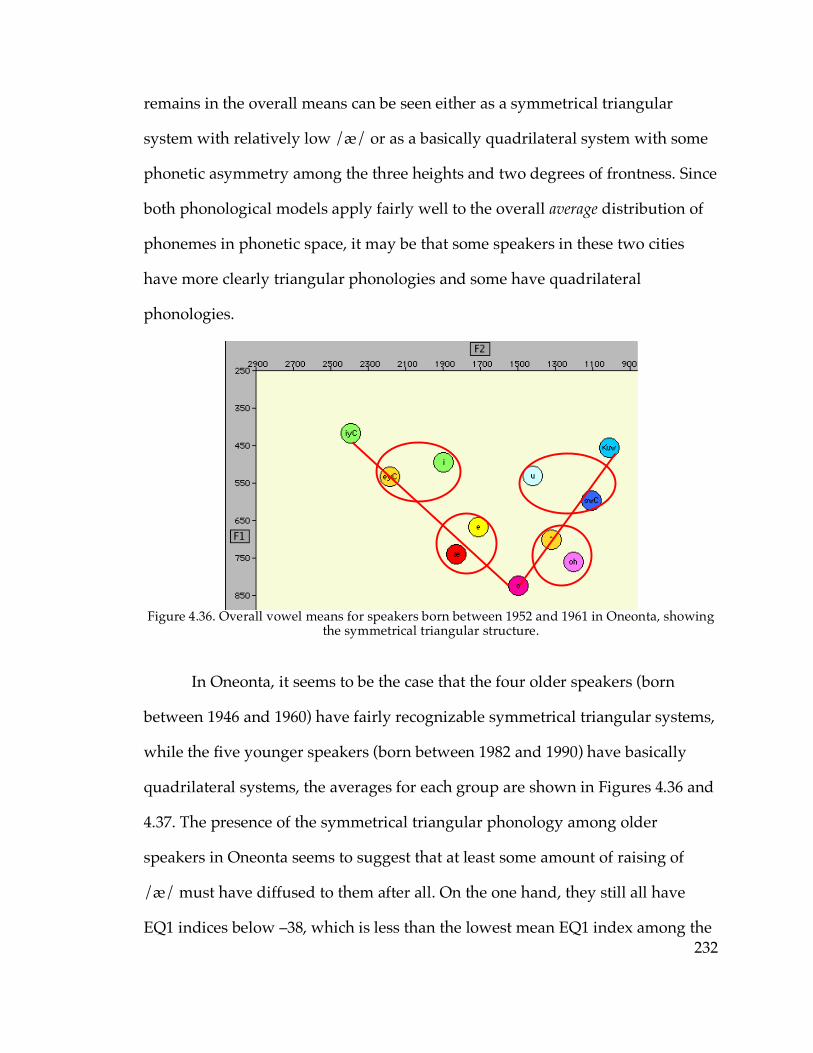
232
remains in the overall means can be seen either as a symmetrical triangular
system with relatively low /æ/ or as a basically quadrilateral system with some
phonetic asymmetry among the three heights and two degrees of frontness. Since
both phonological models apply fairly well to the overall average distribution of
phonemes in phonetic space, it may be that some speakers in these two cities
have more clearly triangular phonologies and some have quadrilateral
phonologies.
Figure 4.36. Overall vowel means for speakers born between 1952 and 1961 in Oneonta, showing
the symmetrical triangular structure.
In Oneonta, it seems to be the case that the four older speakers (born
between 1946 and 1960) have fairly recognizable symmetrical triangular systems,
while the five younger speakers (born between 1982 and 1990) have basically
quadrilateral systems, the averages for each group are shown in Figures 4.36 and
4.37. The presence of the symmetrical triangular phonology among older
speakers in Oneonta seems to suggest that at least some amount of raising of
/æ/ must have diffused to them after all. On the one hand, they still all have
EQ1 indices below –38, which is less than the lowest mean EQ1 index among the
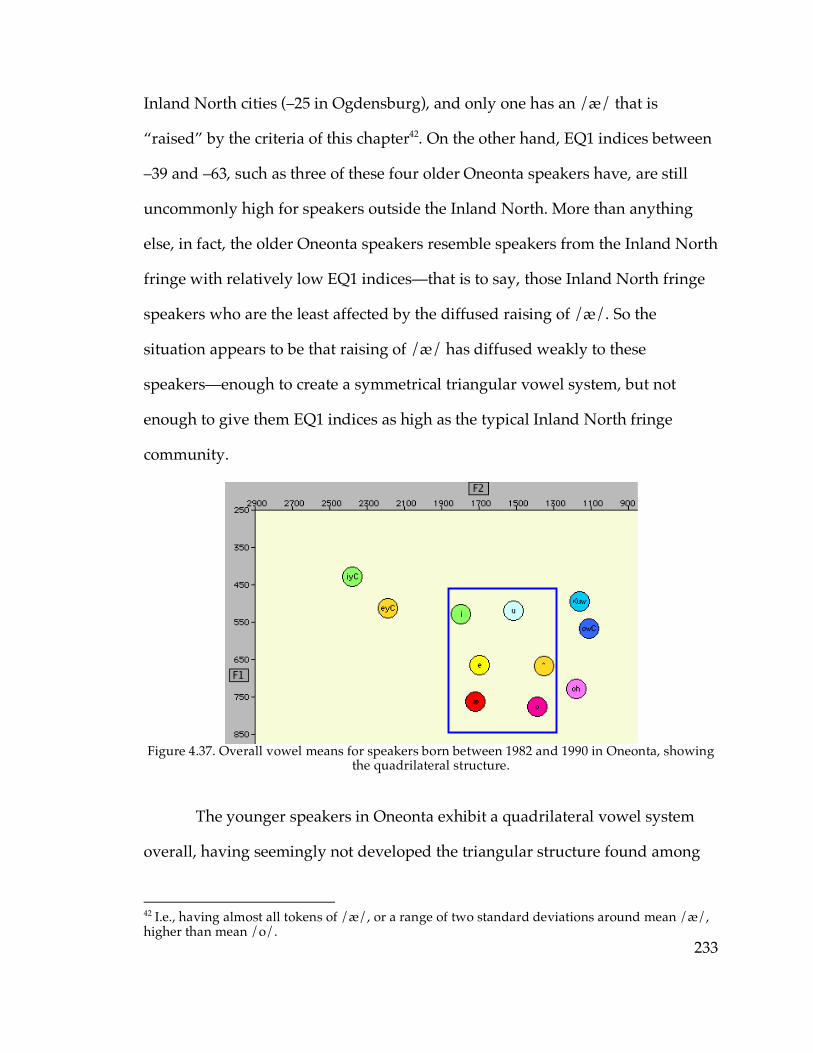
233
Inland North cities (–25 in Ogdensburg), and only one has an /æ/ that is
“raised” by the criteria of this chapter42. On the other hand, EQ1 indices between
–39 and –63, such as three of these four older Oneonta speakers have, are still
uncommonly high for speakers outside the Inland North. More than anything
else, in fact, the older Oneonta speakers resemble speakers from the Inland North
fringe with relatively low EQ1 indices—that is to say, those Inland North fringe
speakers who are the least affected by the diffused raising of /æ/. So the
situation appears to be that raising of /æ/ has diffused weakly to these
speakers—enough to create a symmetrical triangular vowel system, but not
enough to give them EQ1 indices as high as the typical Inland North fringe
community.
Figure 4.37. Overall vowel means for speakers born between 1982 and 1990 in Oneonta, showing
the quadrilateral structure.
The younger speakers in Oneonta exhibit a quadrilateral vowel system
overall, having seemingly not developed the triangular structure found among
42 I.e., having almost all tokens of /æ/, or a range of two standard deviations around mean /æ/, higher than mean /o/.
234
their elders; this suggests either that the diffusion of /æ/-raising which led to the
triangular system among the adults is recent enough that it has not yet been
acquired by children in the community (recall diffusion takes place through
contact between adults), or conceivably that it is of relatively long standing but
retreating in apparent time. In Amsterdam, it is both the oldest and youngest
speakers who display the most rectangular vowel distributions, with the more
triangular patterns toward the middle of the age range. This is consistent with
the first of the two scenarios posited for Oneonta, with the older speakers being
too old to have been subject to it. At this point, however, we are dealing with
small enough numbers of speakers—and impressionistic enough criteria for
determining whether a speaker is triangular or quadrilateral—that it is difficult
to say anything definitive.
The presence of the symmetrical triangular system among Oneonta and
Amsterdam speakers, however, suggests that the NCS raising of /æ/ has
diffused weakly into the Hudson Valley, despite the fact that it is /æ/ that
defines the sharpest phonetic difference between the Hudson Valley and Inland
North fringe. Recall that the symmetrical triangular vowel system, as Preston
formulates is, is merely the structured result of the diffusion of NCS features,
including the raising of /æ/. The triangular system itself is probably not the
specific object of diffusion given Labov (2007)’s argument that diffusion does not
act upon the structural relationships between linguistic entities. Rather, it is
merely the structural consequence of diffusion, based on the principle that the
result of diffusion is likely to be structurally symmetrical or unmarked,
regardless of whether this is true in the community of origin of the feature
235
undergoing diffusion; this distinction will be explored further in Chapter 7. So
some diffusion of /æ/-raising is probably involved in Amsterdam and
Oneonta—even though not as much /æ/ raising is present in these cities as in
the Inland North fringe—in order to create the symmetrical triangular
configuration.
This is, in fact, what would be expected under the hypothesis advanced
earlier in this chapter that it is the presence of the prenasal allophone that stops
the pre-oral allophone of /æ/ from becoming as raised as it is in the Inland
North. That is to say, the prenasal allophone would not be expected to prevent
the pre-oral allophone from being raised at all; according to the argument put
forward in this chapter, one allophone should only prevent the other from
moving too close to its own phonetic position. This seems to be what happens in
Amsterdam and Oneonta: there is no general obstacle to the diffusion of some
amount of raising of pre-oral /æ/, any more than there is an obstacle to the
diffusion of /e/-backing or /o/-fronting. Rather, the diffusion of /æ/-raising to
these cities does take place, enough to cause /æ/ to be higher than /o/ for most
speakers and create a recognizable symmetrical triangular vowel system for
many; but the prenasal allophone blocks the pre-oral allophone from being
raised too far.
4.6. Diffusion of allophony
The analysis of the NCS presented in this chapter is based on the
hypothesis that the nasal system blocks diffusion of the raising of one allophone
236
into the other allophone’s phonetic space. What this means is that the nasal
system seemingly does not, as a result of diffusion from the Inland North,
develop into a continuous system. At the same time, we do see evidence of
diffusion in the opposite direction—i.e., that the nasal system may have diffused
from non–Inland North regions into the Inland North fringe. If we take seriously
the hypothesis that the nasal system blocks diffusion of substantial raising of
/æ/, then the presence of the raised nasal system in the Inland North fringe
implies that the nasal system must have developed there relatively recently. And
the raised nasal system is most frequent in Gloversville and Ogdensburg, two
cities that have been clearly shown to be very close to the boundary between the
Inland North fringe and a region in which the nasal system dominates. So the
raised nasal system may well be the result of diffusion of the nasal system into
the Inland North fringe, while the continuous system does not appear to diffuse
in the other direction.
Of course, continuous and nasal /æ/ systems are not simply a pair of
alternative possibilities that have equal linguistic status. The observation guiding
the analysis above has been that they occupy quite different positions in
Bermúdez-Otero (2007)’s life cycle of sound patterns—the allophony in the
continuous system is a Phase I phonetic implementation rule, while the that of
the nasal system is a Phase II discrete phonological rule. The order of the phases
in the “life cycle” is important here: the model predicts that the natural direction
of change is from Phase I to Phase II, and restructuring of a phonetic rule into a
categorical phonological one. So it’s unsurprising that the raised nasal system
should begin to develop—whether arising from diffusion from the non–Inland
237
North regions or of its own accord—in the Inland North fringe, where prenasal
tokens of /æ/ were already the highest and/or frontest in the raised continuous
system. But the lack of diffusion in the opposite direction, of the continuous
system into the regions where the nasal system predominates, can thus be
interpreted as a resistance to the reversal of the life cycle of phonological
change—of the restructuring of a discrete phonological rule back into a gradient
phonetic tendency. In other words, the dialectological evidence seems to
reinforce the assumption of an inherent order in the life-cycle phases, and
indicate that the restructuring that converts a phonetic rule to a phonological rule
is not reversible by diffusion.
A Phase II phonological rule is a step on the way toward phonemic split:
the division of a phoneme into discrete allophones with their own feature sets is
a necessary precursor, according to the “life cycle”, to the further development
into contrasting phonemes. However, while phonemic splits themselves do not
appear to be capable of successfully undergoing diffusion between communities,
there is no reason for a Phase II phonological rule to be subject to the same
constraints against diffusion that a phonemic split is. Instead of requiring
recipient speakers to learn the unpredictable phonemic incidence of two
phonemes in an entire set of words individually, in diffusion of a Phase II pattern
speakers need only learn a single exceptionless rule. Given that splits cannot be
successfully diffused, the fact that the precursors to splits—i.e., discrete
phonological rules—can be diffused may explain how multiple communities can
end up with the same or very similar phonemic splits.

238
Moreover, a Phase II pattern does not even appear to be at risk of
collapsing back into a Phase I pattern through diffusion, based on the analysis
earlier in this chapter: continuous /æ/ systems do not seem to diffuse into the
regions where the nasal system predominates, as the prenasal allophone appears
to block the pre-oral allophone from moving into its space. Phase II, by this
account, appears to be the most stable phase in the life cycle, at least from the
point of view of diffusion. This relative stability may be justified by the
conceptually relatively simple phonological structure of a Phase II rule: it is both
categorical and discrete. In other words, a discrete allophonic rule requires
speakers neither to memorize the differing behavior of a large number of lexical
items, as a phonemic split does, nor to apply a barely-perceptible context-
dependent gradient statistical tendency to the pronunciation of a single
phonological segment, as a Phase I phonetic implementation rule would; all that
is necessary for the speaker to learn is a single mapping from one segment to
another based on a reliable rule. Labov (2007) presented the argument that the
phonological simplicity of a discrete allophonic rule will lead to the instability of
phonemic splits in diffusion; here we find evidence that a similar principle might
apply to gradient allophonic phonetic implementation rules, for a similar
reason—discrete rules can be more simply represented and conceptualized.
239
4.7. Conclusion
The key empirical findings of this chapter are the following:
• The “diffused” /æ/ system, observed by Labov (2007) in Albany and
other communities across the country with a history of influence from
New York City, also exists in Poughkeepsie and to a lesser extent
Schenectady, defining a “Hudson Valley core” region.
• The diffused system not only regularizes the New York City phonemic
split into an allophonic alternation but also streamlines the allophonic
pattern into a somewhat more natural class of environments, excluding
tokens before /g/ from tensing and thus treating all velar consonants
the same.
• A nasal /æ/ system—i.e., a sharp distinction between prenasal and
pre-oral tokens of /æ/—can coexist with the NCS general raising of
/æ/. However, the raised nasal pattern is much more frequent in the
Inland North fringe than the Inland North core.
• Conversely, continuous /æ/ distributions are extremely infrequent
outside the regions where the NCS is dominant; in general, the
presence of continuous distributions is correlated with more advanced
NCS.
• In a language-game task based on syllable division, subjects in
(caught/cot-merging) Canton treated both /æ/ and /o/ as short
vowels, while subjects in (Inland North fringe) Ogdensburg were more
likely to treat both as long vowels.
240
• Despite not having pre-oral /æ/ raised as it is in the Inland North,
some speakers in the Hudson Valley fringe cities of Amsterdam and
Oneonta appear to have a symmetrical triangular outline of the vowel
system characteristic of communities to which the NCS has diffused.
The dialectological findings are interpreted as indicating that the reason
/æ/-raising did not spread as effectively into the Hudson Valley as other
elements of the NCS did is that the raised prenasal allophone of /æ/ in the
Hudson Valley is able to some extent to prevent the pre-oral allophone from
raising into its phonetic space. The raised nasal system, on the other hand,
developed in the Inland North fringe, perhaps as a result of diffusion of the nasal
system from other areas, after the NCS raising of /æ/ had already taken place.
Some broader conclusions and hypotheses about the dialectological
diffusion of phonological change are suggested by the findings in this chapter as
well, expanding on the pictures of diffusion presented by Labov (2007) and
Preston (2008). Labov and Preston both argue that the result of diffusion will be a
phonologically relatively unmarked pattern—Labov shows that the result of
diffusion is phonologically regular, while Preston adds the contention that the
result of diffusion will be phonologically symmetrical. To these we can add the
finding from the closer examination of the diffused /æ/ system in the Hudson
Valley core that the phonologically regular result of diffusion is itself more
phonologically symmetrical than the system from which the diffusion originates,
in that tensing is triggered by the same places of articulation for voiced stops as
for nasals and voiceless fricatives.

241
The hypothesis that one allophone is capable of blocking another
allophone of the same phoneme into its phonetic space rests upon the principle
that the fundamental unit of chain shifting is not the phoneme but the discrete
phonological segment, whether that segment is an entire phoneme or merely one
of two or more allophones. This follows immediately from a modular feed-
forward model of phonetic and phonological patterns, especially as formalized in
detail by Bermúdez-Otero (2007): since a chain shift is a gradual change in
phonetic implementation, the entities on which the shift operates are the outputs
of allophonic rules. Since phonetic implementations cannot “look backward” into
the derivation of phonological segments, discrete allophones even of the same
phoneme must act independently of each other in chain shifts.
Finally, the findings of this chapter suggest further constraints upon
diffusion. Insofar as the natural direction of phonological change is for a gradient
phonetic pattern of allophony to become a sharp phonologically-specified rule,
then it seems that diffusion is not sufficient to reverse that course and merge the
two phonologically-distinct allophones back into a gradient phonetic pattern. In
other words, it seems as if a community can resist or reject the diffusion of a
feature that would reverse the natural life cycle of phonological change in this
respect. This can be taken as another example of the tendency for the result of
diffusion to be a relatively unmarked structure, in that arguably discrete
allophonic rules are less marked than gradient phonologically-conditioned
implementation rules. It can equally be taken as an example of the principle that
diffusion acts directly only on surface-level linguistic entities, not on the
relationships between them, and thus it does not change the fact that the
242
prenasal and pre-oral allophones of /æ/ are discretely distinct from each other
in phonological representations.
Many of the findings and hypotheses advanced in this chapter are of
necessity somewhat speculative, on account of the more or less impressionistic
criteria used to define many of the key categories employed in the analysis, and
because of the relatively small number of speakers on whom some of the
conclusions are based. However, the hypotheses are motivated not only by the
data but by the overall architecture of phonological structure as articulated by
Bermúdez-Otero (2007) and the constraints on diffusion as articulated by Labov
(2007). So the analyses in this chapter may be best construed as data-driven
conjectures about how these two sets of principles interact, rather than final
conclusions to questions of the diffusion of phonological change.
243
Chapter 5
The Low Back Merger
5.1. Expansion and resistance
Labov (1994) states what he identifies as “Herzog’s Principle”—the
principle that phonological mergers tend to expand across dialect geography, at
the expense of distinctions. This is a corollary to “Garde’s Principle”: once a
merger is completed in a given community, it is impossible to reverse by the
ordinary means of linguistic change. The reasoning is straightforward; once a
merger that is established in one community manages to spread to an adjacent
community and get established there, that new community is a permanent
addition to the merger’s territory. Thus the merger’s geographic extent expands,
while the distinction contracts.
In this chapter I will examine the status of the caught-cot merger in my
sample through three indices: merger in individuals’ own minimal-pair
judgments, the phonetic distance between /o/ and /oh/, and the transfer of an
entire class of words from one of the two phonemes to the other. To the best of
my knowledge, the merger has not been previously reported in Upstate New
York. However, Upstate New York is adjacent to and in communication with
several regions where the merger is already known to be complete and of
relatively long standing, viz. Northwestern New England, Canada, and Western
Pennsylvania. These are shown on Map 5.1: Vermont, Quebec, and eastern
Ontario abut northern New York (the area including Ogdensburg, Canton, and
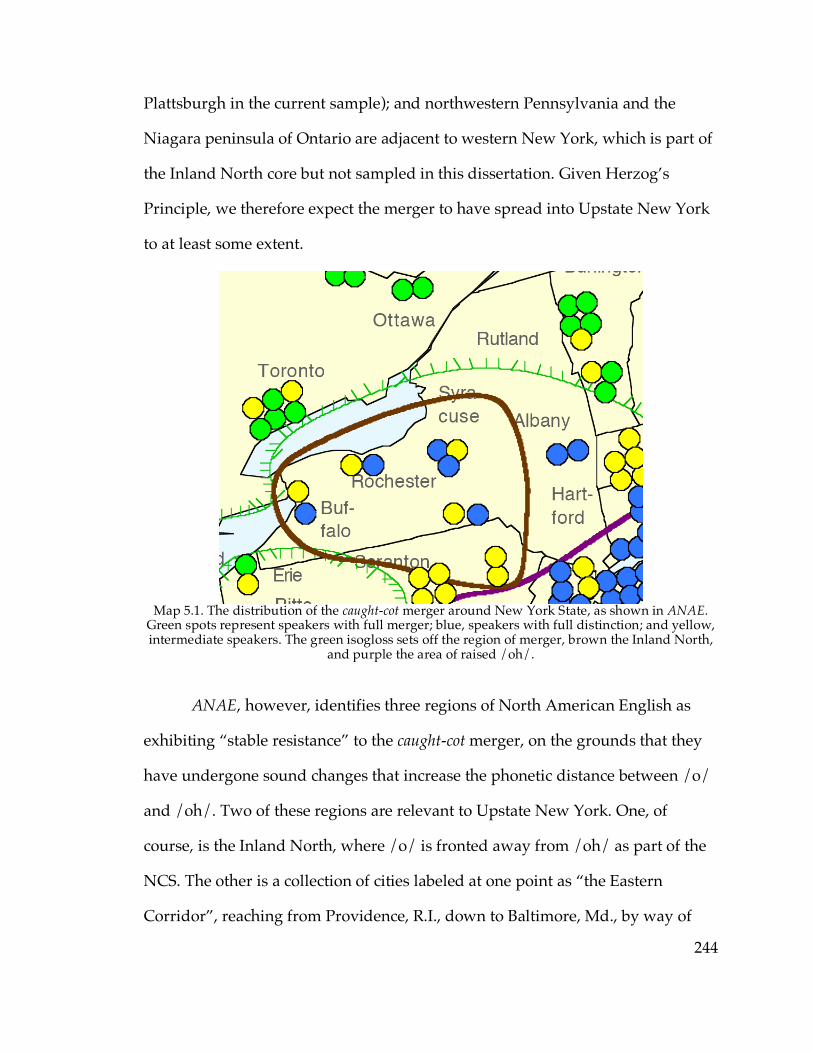
244
Plattsburgh in the current sample); and northwestern Pennsylvania and the
Niagara peninsula of Ontario are adjacent to western New York, which is part of
the Inland North core but not sampled in this dissertation. Given Herzog’s
Principle, we therefore expect the merger to have spread into Upstate New York
to at least some extent.
Map 5.1. The distribution of the caught-cot merger around New York State, as shown in ANAE.
Green spots represent speakers with full merger; blue, speakers with full distinction; and yellow, intermediate speakers. The green isogloss sets off the region of merger, brown the Inland North,
and purple the area of raised /oh/.
ANAE, however, identifies three regions of North American English as
exhibiting “stable resistance” to the caught-cot merger, on the grounds that they
have undergone sound changes that increase the phonetic distance between /o/
and /oh/. Two of these regions are relevant to Upstate New York. One, of
course, is the Inland North, where /o/ is fronted away from /oh/ as part of the
NCS. The other is a collection of cities labeled at one point as “the Eastern
Corridor”, reaching from Providence, R.I., down to Baltimore, Md., by way of
245
New York City; in these cities, /oh/ is raised away from /o/, becoming an
upper-mid back vowel. This chapter will examine to what degree these features
are effective at resisting the advance of the merger predicted by Herzog’s
Principle. To do so, it is necessary to establish which communities exhibit these
“resistant” features.
The communities in the current sample where the NCS obtains, of course,
have been thoroughly identified in the foregoing chapters. However, it was also
observed that the fronting of /o/ has apparently diffused southeastward out of
the Inland North into the region identified as the Hudson Valley. In Hudson
Valley communities such as Amsterdam and Oneonta, mean /o/ was found to
be backer than in the Inland North core or fringe, but still substantially fronter
than it is in other dialects that lack the caught-cot merger. So perhaps the Hudson
Valley communities will share to some degree in whatever resistance to the
merger the NCS fronting of /o/ affords the Inland North.
ANAE’s standard for inclusion in the Eastern Corridor, which includes
New York City, is that /oh/ must be raised to such an extent that its mean F1 is
less than 700 Hz. Only one community in the current sample meets that criterion:
Poughkeepsie, in which in fact all seven sampled speakers have mean F1 of /oh/
between 575 Hz and 675 Hz. In no other community in the sample does more
than one speaker have F1 of /oh/ less than 700 Hz.1 One other known
community in Upstate New York has an overall mean /oh/ higher than 700 Hz,
though: Albany, whose two Telsur speakers have /oh/ F1 at 603 Hz and 735 Hz,
1 In fact, only three other speakers in the sample meet this criterion: Buck B. from Cooperstown, Vincent B. from Gloversville, and Carl T. from South Glens Falls. Each is the oldest speaker sampled from his community.

246
making a mean of 669 Hz. Grouping Albany together with Poughkeepsie is
reminiscent of a dialect boundary identified in Chapter 4, in which some
speakers in these two communities plus one speaker from Schenectady were
found to exhibit the diffused /æ/ system as a result of New York City influence.
Those communities were grouped together as the Hudson Valley core. Since
raised /oh/ is another New York City feature that may have expanded to areas
in close contact with New York City, it is unsurprising to find /oh/ raised above
700 Hz in the Hudson Valley core region.
Now that the areas of potential resistance to the caught-cot merger have
been identified, the next section will discuss the distribution of the merger itself.
5.2. Minimal-pair judgments
Each speaker in the sample was asked for explicit judgments on at least
two minimal or near-minimal /o/~/oh/ pairs. In in-person interviews, cot ~
caught and dawn ~ don were both on the list of written minimal pairs that
interview subjects were asked to judge as sounding the same or different.
Telephone interview subjects were asked one exact minimal-pair question (dawn
and Don), and for each of three near-minimal pairs of words (caught ~ hot,
sock ~ talk, taller ~ dollar) were asked to judge whether the two words rhymed.
In the entire corpus of 119 speakers, only 12 apparently exhibited the full
merger in perception (i.e., described all /o/~/oh/ pairs as the same or rhyming).
These twelve speakers are listed in Table 5.2.
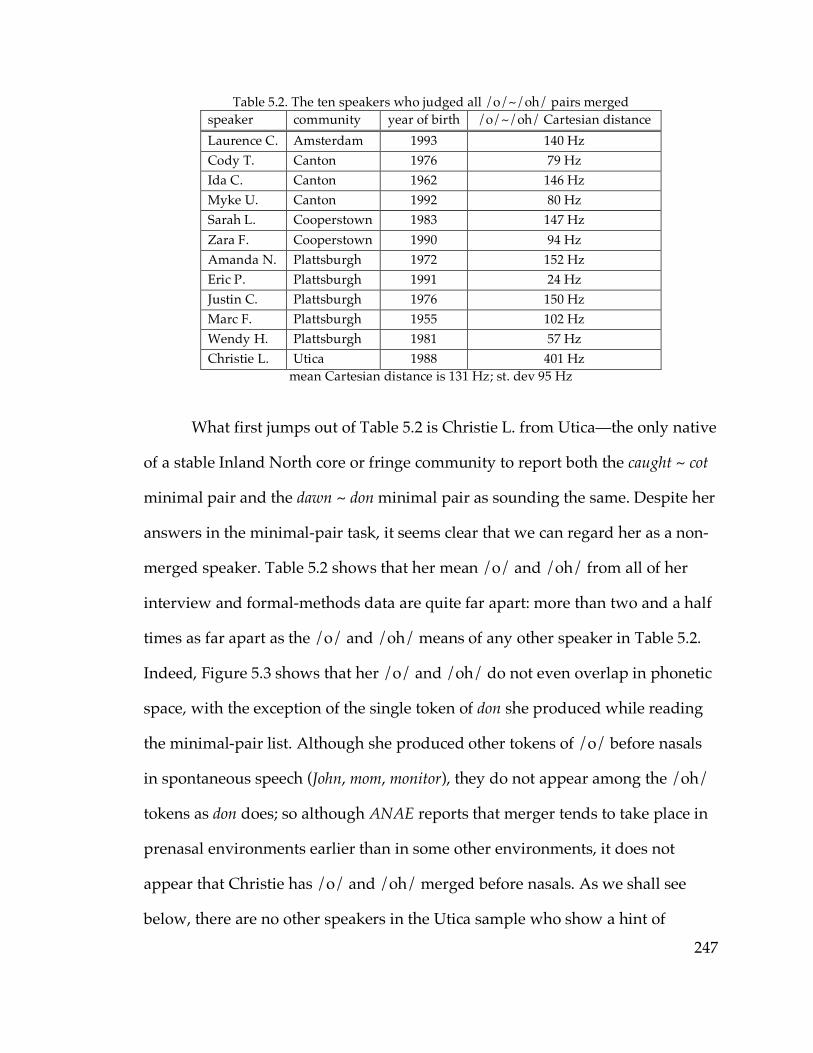
247
Table 5.2. The ten speakers who judged all /o/~/oh/ pairs merged speaker community year of birth /o/~/oh/ Cartesian distance Laurence C. Amsterdam 1993 140 Hz Cody T. Canton 1976 79 Hz Ida C. Canton 1962 146 Hz Myke U. Canton 1992 80 Hz Sarah L. Cooperstown 1983 147 Hz Zara F. Cooperstown 1990 94 Hz Amanda N. Plattsburgh 1972 152 Hz Eric P. Plattsburgh 1991 24 Hz Justin C. Plattsburgh 1976 150 Hz Marc F. Plattsburgh 1955 102 Hz Wendy H. Plattsburgh 1981 57 Hz Christie L. Utica 1988 401 Hz
mean Cartesian distance is 131 Hz; st. dev 95 Hz
What first jumps out of Table 5.2 is Christie L. from Utica—the only native
of a stable Inland North core or fringe community to report both the caught ~ cot
minimal pair and the dawn ~ don minimal pair as sounding the same. Despite her
answers in the minimal-pair task, it seems clear that we can regard her as a non-
merged speaker. Table 5.2 shows that her mean /o/ and /oh/ from all of her
interview and formal-methods data are quite far apart: more than two and a half
times as far apart as the /o/ and /oh/ means of any other speaker in Table 5.2.
Indeed, Figure 5.3 shows that her /o/ and /oh/ do not even overlap in phonetic
space, with the exception of the single token of don she produced while reading
the minimal-pair list. Although she produced other tokens of /o/ before nasals
in spontaneous speech (John, mom, monitor), they do not appear among the /oh/
tokens as don does; so although ANAE reports that merger tends to take place in
prenasal environments earlier than in some other environments, it does not
appear that Christie has /o/ and /oh/ merged before nasals. As we shall see
below, there are no other speakers in the Utica sample who show a hint of

248
caught-cot merger—even those whose /o/ and /oh/ are much closer in phonetic
space than 401 Hz securely judged the phonemes as distinct in the minimal-pair
tasks. Based on all these observations, it seems clear that we can regard Christie’s
responses to the minimal-pair tasks as essentially an error—perhaps she misread
the words she was supposed to judge (as appears to have happened with don in
Figure 5.3) or perhaps she merely misunderstood the task. At any rate, Christie’s
example warns us to be cautious in evaluating speakers’ merged status only on
the basis of their responses to the minimal-pair tasks.
Figure 5.3. The /o/ and /oh/ of Christie L., an 18-year-old unemployed woman from Utica. Magenta squares represent /o/; lavender triangles represent /oh/. Tokens of minimal-pair
words are highlighted.
All of the other nine speakers in Table 5.2 show clusters of /o/ and /oh/
tokens with large overlaps in phonetic space. Justin C., a coffee-shop employee
from Plattsburgh, is a typical example—in fact, his Cartesian distance between
mean /o/ and /oh/ is relatively large compared to some of the other speakers
on Table 5.2—and his /o/ and /oh/ are shown in Figure 5.4. Note that near the
center of his distribution as shown in Figure 5.4, there is an area where tokens of
/o/ and /oh/ are roughly equally concentrated, between about 650 Hz and
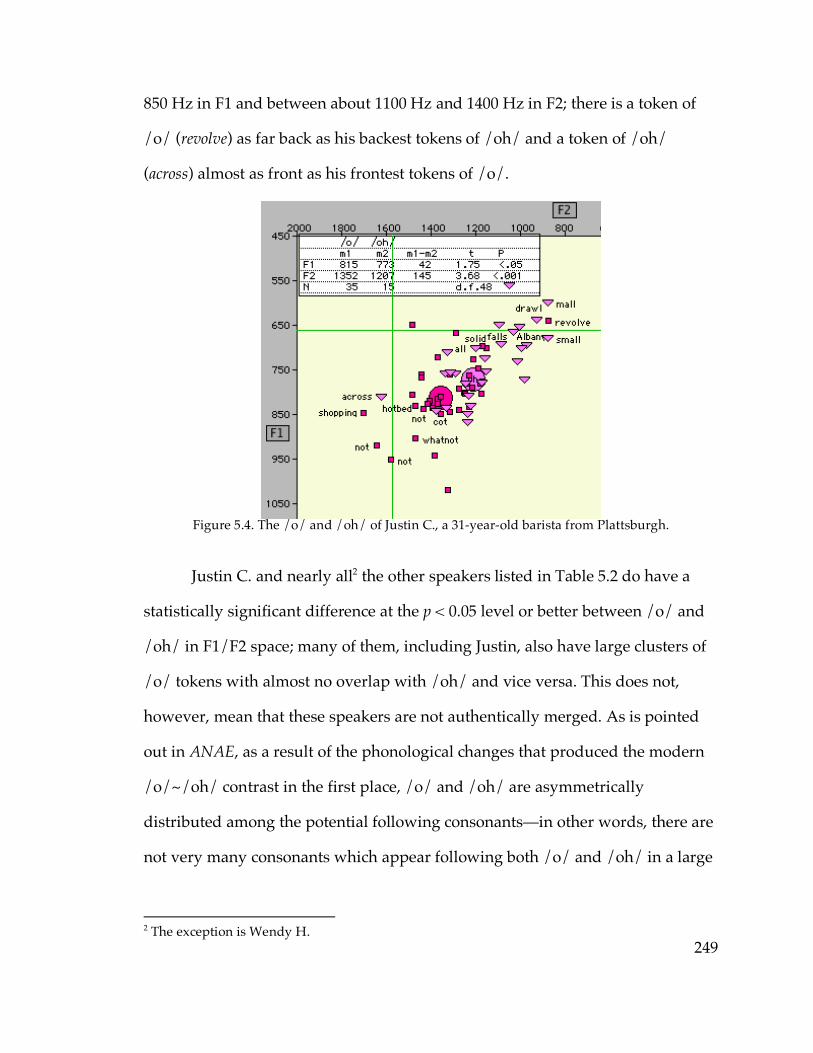
249
850 Hz in F1 and between about 1100 Hz and 1400 Hz in F2; there is a token of
/o/ (revolve) as far back as his backest tokens of /oh/ and a token of /oh/
(across) almost as front as his frontest tokens of /o/.
Figure 5.4. The /o/ and /oh/ of Justin C., a 31-year-old barista from Plattsburgh.
Justin C. and nearly all2 the other speakers listed in Table 5.2 do have a
statistically significant difference at the p < 0.05 level or better between /o/ and
/oh/ in F1/F2 space; many of them, including Justin, also have large clusters of
/o/ tokens with almost no overlap with /oh/ and vice versa. This does not,
however, mean that these speakers are not authentically merged. As is pointed
out in ANAE, as a result of the phonological changes that produced the modern
/o/~/oh/ contrast in the first place, /o/ and /oh/ are asymmetrically
distributed among the potential following consonants—in other words, there are
not very many consonants which appear following both /o/ and /oh/ in a large
2 The exception is Wendy H.

250
number of common words.3 And in the case of Justin, for example, the apparent
statistical distinction between /o/ and /oh/ is seemingly well accounted for
merely by this asymmetrical distribution. For example, almost all of Justin’s
tokens of /o/~/oh/ preceding /l/ are historically /oh/: all, falls, Albany, drawl,
etc.; these make up most of the cluster of /oh/ tokens at the back of the
distribution. The only two tokens of /o/ before /l/, solid and revolve4, are within
the cluster of /oh/ before /l/. Similarly, almost all the tokens before nonvelar
stops, which make up most of the frontmost cluster, are /o/. The only tokens of
/oh/ before nonvelar stops are two minimal-pair–style tokens of caught; these
are near the center of the overall /o/~/oh/ distribution along with the minimal-
pair–style tokens of cot. So a close examination of Justin’s /o/~/oh/ tokens
suggests that the phonemes actually are merged, despite the statistically
significant 150-Hz difference in their means, and the merged phoneme merely
exhibits a fairly wide range of allophonic phonetic conditioning.
Herold (1990) discusses in some detail the issue of diagnosing a speaker’s
merger status on the basis of acoustic data without being led astray by the
asymmetric distribution of coda consonants between /o/ and /oh/, and finds
several statistical acoustic criteria that converge with her impressionistic
auditory judgments of merger status. For example, she found that speakers
whom she judged impressionistically to have distinct /o/ and /oh/ were those
whose /o/ and /oh/ tokens were found by t-test to differ in both F1 and F2 at
the p < 0.01 level. However, determining the precise merger status of individual
3 For example, before /p/, /o/ is common (hop, stop, drop) and /oh/ is rare; before /ŋ/ the opposite is true. 4 The behavior of revolve will be discussed in great detail later in this chapter.
251
speakers—for example, whether the some or all of the speakers listed on Table
5.2 maintain an authentic phonological contrast between /o/ and /oh/ that they
are unaware of in their subjective judgments5—is of less importance for the
purpose of mapping the dialectology of New York State than it was in Herold’s
project of exploring the mechanisms of merger. Each of the communities in Table
5.2 has at least one speaker in the sample who maintains the /o/~/oh/
distinction securely; that is, it is clearly the case that the caught-cot merger is not
complete in any of them. ANAE affirms that merger usually takes place in
perception (e.g., in explicit minimal-pair judgments) before production.
Therefore what we can say confidently is that these nine speakers (i.e., the ten on
Table 5.2 minus Christie L.) are merely the most merged in their respective
communities and among the most merged in the entire sample, regardless of
whether they are actually fully merged or just nearly so; and the argument for
excluding Christie L. as an error seems clear enough without having to resort to
more advanced statistical techniques.
Table 5.2 includes three speakers in Canton and five in Plattsburgh. On
the basis of the presence of the merger in these communities, they were
(proleptically) assigned to a “Northwestern New England” region in previous
chapters. It is not surprising to find the caught-cot merger in this area, of course.
This is one of two parts of New York State that are directly adjacent to regions
where the merger is complete (Vermont and Canada); the other such part of New
York State is part of the Inland North core and thus ostensibly resistant to the
5 This would be a “near-merger”, in the sense discussed in detail by Labov (1994 ch. 12).
252
merger. So if the caught-cot merger were going to be found anywhere in New
York State it would be here, in the northeastern corner of the state.6
Identifying these communities as dialectologically part of Northwestern
New England on the basis of the caught-cot merger is a bit of an exaggeration, of
course. In Northwestern New England (and Canada) the merger is essentially
complete; as Map 5.1 shows, nearly all speakers in the ANAE sample in Vermont
have the full merger, and none made the distinction securely. In both Canton and
Plattsburgh the oldest speaker sampled maintained the distinction for both
minimal pairs. So Canton and Plattsburgh are not as advanced in the caught-cot
merger as Northwestern New England proper (or Canada) is; but they are clearly
heading in that direction. From here on, the dialect region in New York State that
includes these communities will be referred to as the “North Country”7.
Ogdensburg, like Canton and Plattsburgh, is in the geographical North
Country; in fact, Ogdensburg is located directly on the Canadian border.
However, no speakers sampled in Ogdensburg judged all pairs as merged, and it
is in the Inland North fringe, not the North Country dialect region as defined
above. Ogdensburg seemingly must have at least slightly more direct contact
with Canada than Canton does, being located on the border and the site of a
border crossing, and is not appreciably farther from Vermont than Canton is. So
6 In this data, a larger fraction of speakers in Plattsburgh display full merger in perception than in Canton—five out of seven versus three out of nine. This is consistent what would be expected, in that Plattsburgh is close to both Canada and Vermont, and Canton is only close to Canada—especially given Boberg (2000)’s finding that phonological diffusion across the U.S.–Canada border is relatively weak; however, the difference between Canton and Plattsburgh in this respect is not statistically significant. Map 5.8 below shows the location of these communities. 7 The “North Country” as a conventional region of New York State includes some communities which are not in this dialect region, such as Watertown and Ogdensburg; but no better name for the dialect region seemed available. I was going to call it simply “Northeastern New York”, but apparently that conventionally refers to an area quite some distance to the south, including Glens Falls and Albany.

253
Canton does not apparently exceed Ogdensburg in the availability of
communication with communities where the caught-cot merger is complete. The
only other obvious dialectological difference between the two communities is
that the NCS is present in Ogdensburg. So far, then, it seems as if the NCS is
doing its job in preventing the caught-cot merger from reaching Ogdensburg; but
this issue will be discussed more below.
Laurence C., the youngest speaker interviewed in Amsterdam and one of
the youngest in the entire sample, is the only speaker sampled in the broad
Hudson Valley area to show full merger in perception. He may indicate that
Hudson Valley communities such as Amsterdam are in fact relatively more open
to caught-cot merger than nearby Inland North communities are. However,
Laurence is only a single speaker, and all other speakers in the Amsterdam
sample have /o/ and /oh/ securely distinct. It may also be worth noting that
Laurence’s father is described as a native of “Northern New York” (i.e., the
region that includes the “North Country”), and therefore may have the merger
himself. So Laurence’s merger is not sufficient for us to draw any broad
conclusions about the status of the merger in the Hudson Valley.
The two speakers from Cooperstown on Table 5.2 will be considered
below in conjunction with those on Table 5.5. This table lists speakers whose
status with respect to /o/~/oh/ minimal pairs is “transitional” in the sense used
by ANAE: they could not decide whether the minimal pairs were the same or
different, or judged them as “close”, or had different judgments for different
minimal pairs representing the same phonemic contrast. These therefore
represent the subset of speakers on whom the caught-cot merger has had enough
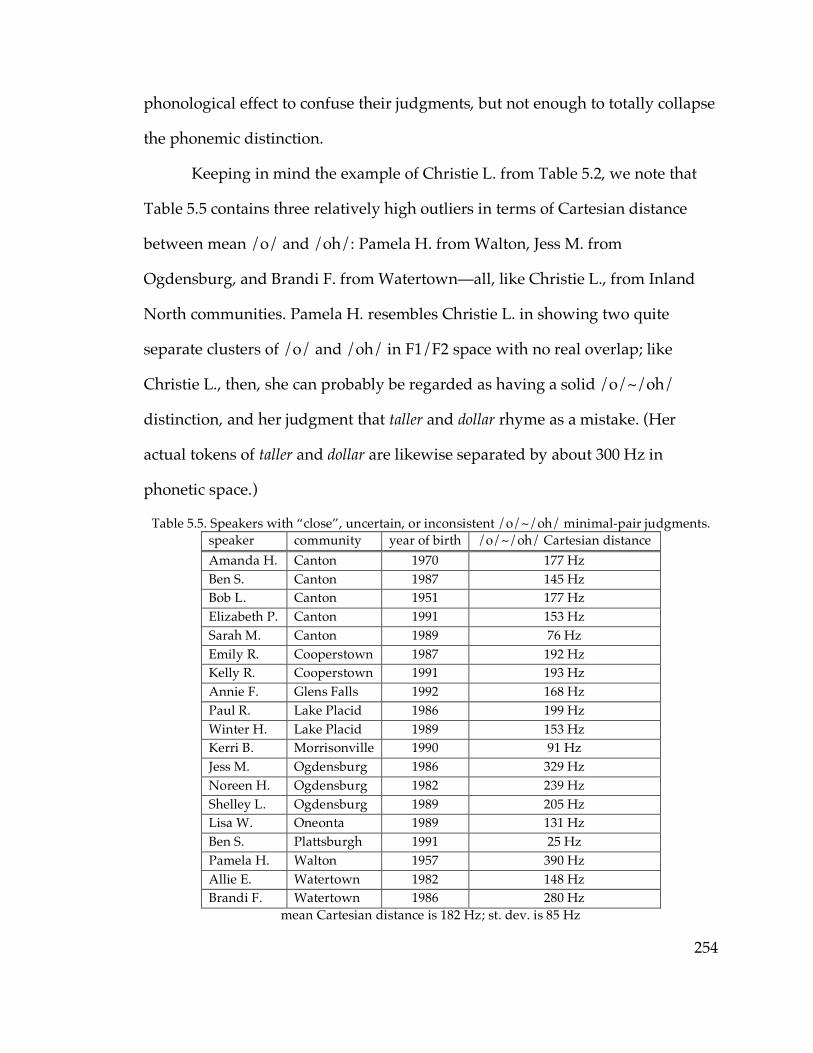
254
phonological effect to confuse their judgments, but not enough to totally collapse
the phonemic distinction.
Keeping in mind the example of Christie L. from Table 5.2, we note that
Table 5.5 contains three relatively high outliers in terms of Cartesian distance
between mean /o/ and /oh/: Pamela H. from Walton, Jess M. from
Ogdensburg, and Brandi F. from Watertown—all, like Christie L., from Inland
North communities. Pamela H. resembles Christie L. in showing two quite
separate clusters of /o/ and /oh/ in F1/F2 space with no real overlap; like
Christie L., then, she can probably be regarded as having a solid /o/~/oh/
distinction, and her judgment that taller and dollar rhyme as a mistake. (Her
actual tokens of taller and dollar are likewise separated by about 300 Hz in
phonetic space.)
Table 5.5. Speakers with “close”, uncertain, or inconsistent /o/~/oh/ minimal-pair judgments. speaker community year of birth /o/~/oh/ Cartesian distance Amanda H. Canton 1970 177 Hz Ben S. Canton 1987 145 Hz Bob L. Canton 1951 177 Hz Elizabeth P. Canton 1991 153 Hz Sarah M. Canton 1989 76 Hz Emily R. Cooperstown 1987 192 Hz Kelly R. Cooperstown 1991 193 Hz Annie F. Glens Falls 1992 168 Hz Paul R. Lake Placid 1986 199 Hz Winter H. Lake Placid 1989 153 Hz Kerri B. Morrisonville 1990 91 Hz Jess M. Ogdensburg 1986 329 Hz Noreen H. Ogdensburg 1982 239 Hz Shelley L. Ogdensburg 1989 205 Hz Lisa W. Oneonta 1989 131 Hz Ben S. Plattsburgh 1991 25 Hz Pamela H. Walton 1957 390 Hz Allie E. Watertown 1982 148 Hz Brandi F. Watertown 1986 280 Hz
mean Cartesian distance is 182 Hz; st. dev. is 85 Hz
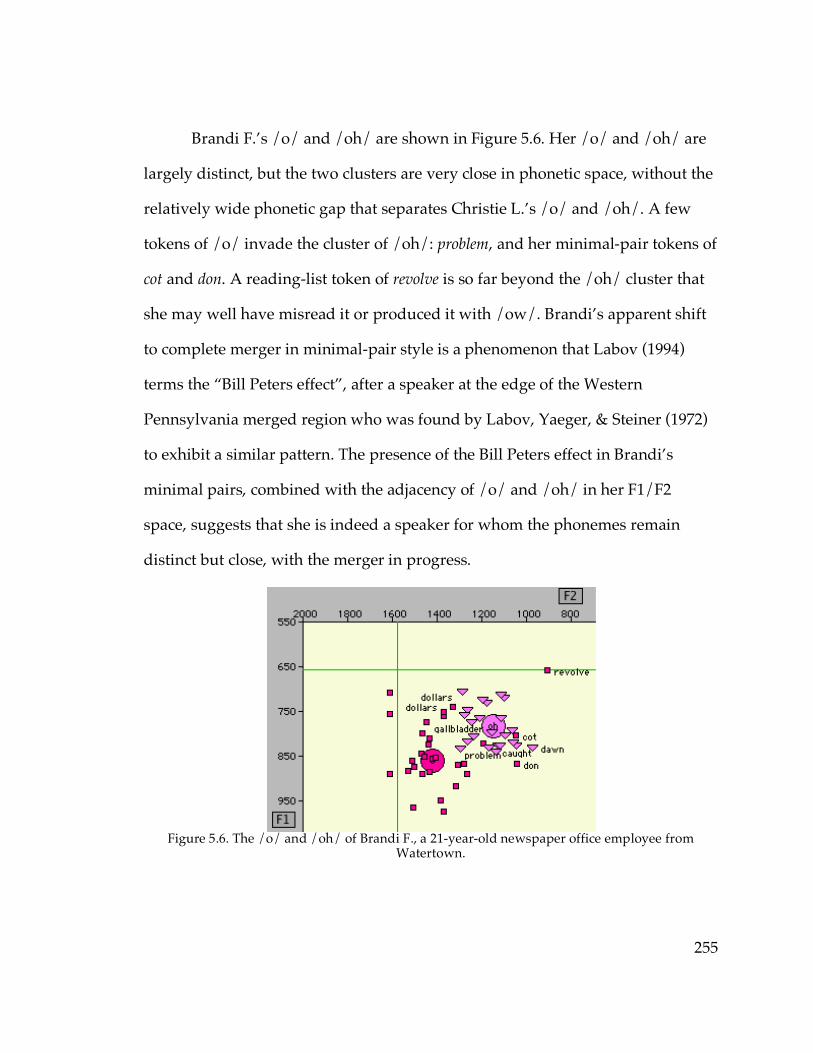
255
Brandi F.’s /o/ and /oh/ are shown in Figure 5.6. Her /o/ and /oh/ are
largely distinct, but the two clusters are very close in phonetic space, without the
relatively wide phonetic gap that separates Christie L.’s /o/ and /oh/. A few
tokens of /o/ invade the cluster of /oh/: problem, and her minimal-pair tokens of
cot and don. A reading-list token of revolve is so far beyond the /oh/ cluster that
she may well have misread it or produced it with /ow/. Brandi’s apparent shift
to complete merger in minimal-pair style is a phenomenon that Labov (1994)
terms the “Bill Peters effect”, after a speaker at the edge of the Western
Pennsylvania merged region who was found by Labov, Yaeger, & Steiner (1972)
to exhibit a similar pattern. The presence of the Bill Peters effect in Brandi’s
minimal pairs, combined with the adjacency of /o/ and /oh/ in her F1/F2
space, suggests that she is indeed a speaker for whom the phonemes remain
distinct but close, with the merger in progress.
Figure 5.6. The /o/ and /oh/ of Brandi F., a 21-year-old newspaper office employee from
Watertown.

256
Jess M. from Ogdensburg has clusters that are basically distinct with little
overlap, as shown in Figure 5.7. Two expected /o/ tokens appear within the
/oh/ cluster: revolve and Ogdensburg itself. Revolve, as will be discussed below,
appears to have /oh/ for a large number of speakers in the sample, and tokens of
historical /o/ before /g/, according to ANAE, show great variation between /o/
and /oh/ in American English; so neither of these in some sense counts as a clear
indication of any degree of merger in Jess’s /o/~/oh/ distribution. She is,
however, one of three speakers out of nine in Ogdensburg who gave “close” or
inconsistent judgments on minimal pairs; the other two (Noreen H. and Shelley
L.) both have some degree of real overlap between their /o/ and /oh/ token
clusters. So even though Jess has a clear phonetic distinction between /o/ and
/oh/, it makes sense to say that she may be participating in the same tendency
towards “close” /o/ and /oh/ that is seen among some other members of her
community.
Figure 5.7. The /o/ and /oh/ of Jess M., a 22-year-old student and receptionist from
Ogdensburg.
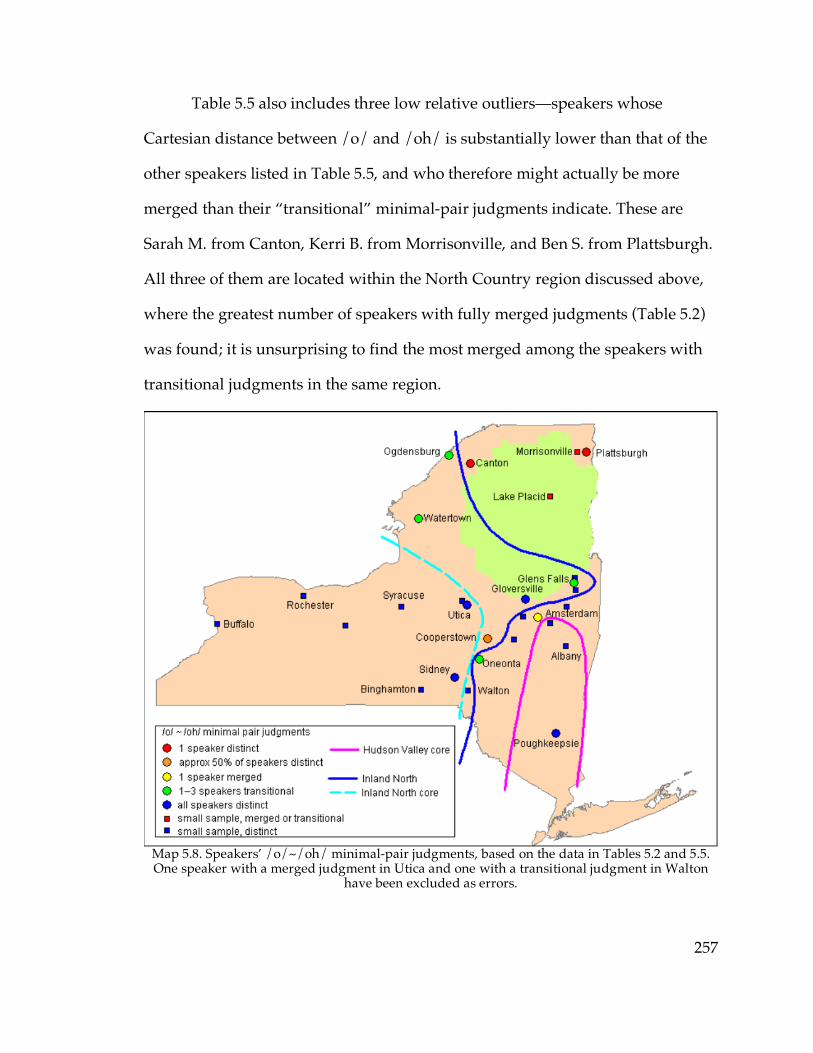
257
Table 5.5 also includes three low relative outliers—speakers whose
Cartesian distance between /o/ and /oh/ is substantially lower than that of the
other speakers listed in Table 5.5, and who therefore might actually be more
merged than their “transitional” minimal-pair judgments indicate. These are
Sarah M. from Canton, Kerri B. from Morrisonville, and Ben S. from Plattsburgh.
All three of them are located within the North Country region discussed above,
where the greatest number of speakers with fully merged judgments (Table 5.2)
was found; it is unsurprising to find the most merged among the speakers with
transitional judgments in the same region.
Map 5.8. Speakers’ /o/~/oh/ minimal-pair judgments, based on the data in Tables 5.2 and 5.5. One speaker with a merged judgment in Utica and one with a transitional judgment in Walton
have been excluded as errors.
258
In fact, if Pamela H. is removed from Table 5.5 as an error, fully half of the
remaining speakers with transitional judgments are from that region: five from
Canton, one from Plattsburgh, both speakers from Lake Placid, and the one from
Morrisonville. Moreover, all but the two oldest speakers in these four
communities appear on either Table 5.5 or Table 5.2. Clearly the caught-cot
merger is well underway in the North Country, albeit not complete as it is in
adjacent Northwestern New England or Canada. Map 5.8, which summarizes the
minimal-pair judgments of all the speakers in the sample, shows that the North
Country is the only dialect region identified in New York State where the caught-
cot merger is advanced enough to have an effect on the minimal-pair judgments
of the majority of speakers.
Cooperstown was established in earlier chapters as a former Inland North
community in which the NCS is diminishing: of nine Cooperstown speakers
interviewed, the five born in 1963 or earlier have NCS scores between two and
four, and the four born in 1983 or later have NCS scores of zero or one. The
minimal-pair data shows that the reorganization of the vowel phonology of
Cooperstown extends beyond the NCS to the caught-cot merger as well: all of the
four younger speakers have merged or transitional minimal-pair judgments,
while all of the five older speakers have distinct judgments. By contrast, in
Sidney, the other village in which the NCS was seen to be retreating in apparent
time, all sampled speakers judge the /o/~/oh/ minimal pairs as distinct, and
have Cartesian distance between mean /o/ and /oh/ of more than 200 Hz.
Several speakers in Inland North fringe communities in which the NCS
seems stable appear on Table 5.5 as having transitional minimal-pair judgments,
259
apparently defying the supposed resistance of the Inland North to the caught-cot
merger. These include three from Ogdensburg, two from Watertown, and one
from Glens Falls. The three in Ogdensburg all have NCS scores of three or more
and positive EQ1 indices, so it can’t just be the fact that not all speakers in the
Inland North fringe exhibit the NCS that allows the caught-cot merger to begin to
penetrate; at least in Ogdensburg, it is NCS speakers themselves who are subject
to the influence of the merger in progress. Moreover, unlike Laurence C. from
Amsterdam, who had fully-merged minimal-pair judgments, none of them
reported having a parent from a region where the merger is advanced.8 It seems
plausible that it is the influence of neighboring merged regions that allows the
merger to begin to spread into these communities—Ogdensburg is adjacent to
Canada and close to Canton, Watertown is less than 30 miles from the Canadian
border as well, and Glens Falls is near Vermont, while Gloversville is separated
from the nearest merged region by larger unmerged cities such as Schenectady
and Albany—but there are not enough speakers in the sample for the lack of
transitional judgments in Gloversville to be statistically robust.
It is worth noting that /o/~/oh/ distinction is still relatively healthy in
the Inland North fringe; these transitional speakers are only six out of 40 total
speakers sampled in Inland North fringe communities in this dissertation, and
there are no fully merged speakers found in such communities. The contrast
between Ogdensburg and Canton remains instructive: in Ogdensburg, three out
of nine speakers have transitional judgments about the /o/~/oh/ minimal pairs,
8 Neither did Lisa W. from Oneonta, the other transitional speaker not from Cooperstown or the North Country. To be fair, not all of these seven speakers were able to identify where both of their parents were from.
260
while in Canton, less than 20 miles away, five out of nine have transitional
judgments and three are fully merged.9 Ogdensburg has the greatest degree of
caught-cot merger found in a stable NCS community, and from this perspective
the NCS seems to be doing a pretty good job holding off or delaying the merger,
given all the dialectological pressure Ogdensburg appears to be under. But on
the other hand, the presence of three out of nine speakers with transitional
merger status does not bespeak stable resistance to the merger.
It might be possible to argue that the minimal-pair task is a relatively
artificial task, and any sample even of people with a relatively secure phonemic
distinction might be expected to include a few who give transitional judgments
merely out of confusion or unfamiliarity with the task. Indeed, we have already
identified two subjects who appear to meet that description, Pamela H. in Walton
and Christie L. in Utica, on the basis of their wide phonetic distances and lack of
overlap between /o/ and /oh/. Could it be that the apparent influence of the
encroaching merger upon the minimal-pair judgments of other Inland North
speakers is really just error in the experimental methods, gone undetected
because of smaller Cartesian distances? After all, there are plenty of speakers in
the sample with fully distinct minimal-pair judgments whose /o/~/oh/
Cartesian distances are no wider than some of those listed in Table 5.5.
Well, perhaps. But if the appearance of transitional minimal-pair
judgments in communities where the merger is not really in progress were just
an inescapable consequence of flaws in the experimental methods, one would
9 If merged speakers are rated as 0, transitional speakers as 1, and distinct speakers as 2, a t-test on the advancement of merger in these two communities finds that the difference between them is statistically significant; p < 0.01.
261
expect such errors to be relatively evenly distributed throughout the sample.
Now, there are a total of 31 speakers listed on Tables 5.2 and 5.5, with merged or
transitional minimal-pair judgments. Two have been excluded as errors already;
seventeen are natives of the North Country region, where the merger is already
complete in a relatively large number of speakers. That leaves twelve speakers
who have merged or transitional minimal-pair judgments in regions where the
caught-cot merger is not very well attested.
The oldest of these twelve speakers are Allie E. in Watertown and Noreen
H. in Ogdensburg, both of whom were born in 1982. The median year of birth of
the entire 119-speaker sample is 1974. That means that, if the appearance of
transitional judgments in non-merging communities is merely a result of poor
experimental design, then all the subjects whose judgments were affected by this
flaw were coincidentally in the younger half of the sample—the probability of
which happening is approximately 0.00025, well below any statistical
significance threshold one might care to choose. Now, it may be that younger
speakers are more likely to give confused judgments about minimal pairs even if
they have a secure phonemic distinction, merely because, up to a certain age, the
speaker’s phonology and dialect are still to a certain degree in flux. Labov (2001)
shows that many sound changes in progress display a “peak in apparent time”
around late adolescence, indicating that speakers younger than that peak are still
in the process of acquiring the innovative phonology; it is conceivable that, even
if the caught-cot merger is not in progress in a given community, sufficiently
young speakers may be sufficiently uncertain about their phonological system in
general to give mixed judgments on minimal pairs. However, even if that is the

262
case, not all of these twelve speakers with transitional judgments are young
enough for that to be relevant: six of the twelve were 21 years of age or older
when interviewed, well above any age that might be suggested to be the point
where the speaker’s phonology solidifies. And the probability of even six
experimental errors all coincidentally appearing in the younger half of the
sample is still less than 0.02.
Above, two speakers with merged and transitional judgments were
excluded from consideration in those classes on the grounds that their /o/~/oh/
Cartesian distances were wide enough to suggest that their judgments were
confused. We ought therefore to see if any speakers with distinct judgments have
sufficiently narrow Cartesian distances to indicate that they might be more
merged than they’re letting on. The mean Cartesian /o/~/oh/ distance among
sampled speakers with distinct minimal-pair judgments is 315 Hz, with a
standard deviation of 89 Hz. Only one speaker’s /o/ and /oh/ are more than
two standard deviations closer than the mean; this is Mike P., a security officer
from Ogdensburg, born in 1977, whose /o/~/oh/ Cartesian distance is
(coincidentally) 89 Hz.10 He is an outlier not only in his distance from the mean,
but also in the degree of difference between him and the next-smallest Cartesian
distance among speakers with distinct judgments, as Figure 5.9 shows. If we
suppose Mike P.’s minimal-pair judgments to be as confused as Christie L’s
above, and he really has a merged or “close” phonology, then he actually
supports the hypothesis that the distribution of transitional judgments is not
10 There are four speakers with Cartesian distances more than two standard deviations greater than the mean: Janet B. from Utica, the most advanced NCS speaker in the sample; and three Poughkeepsie speakers with raised /oh/.
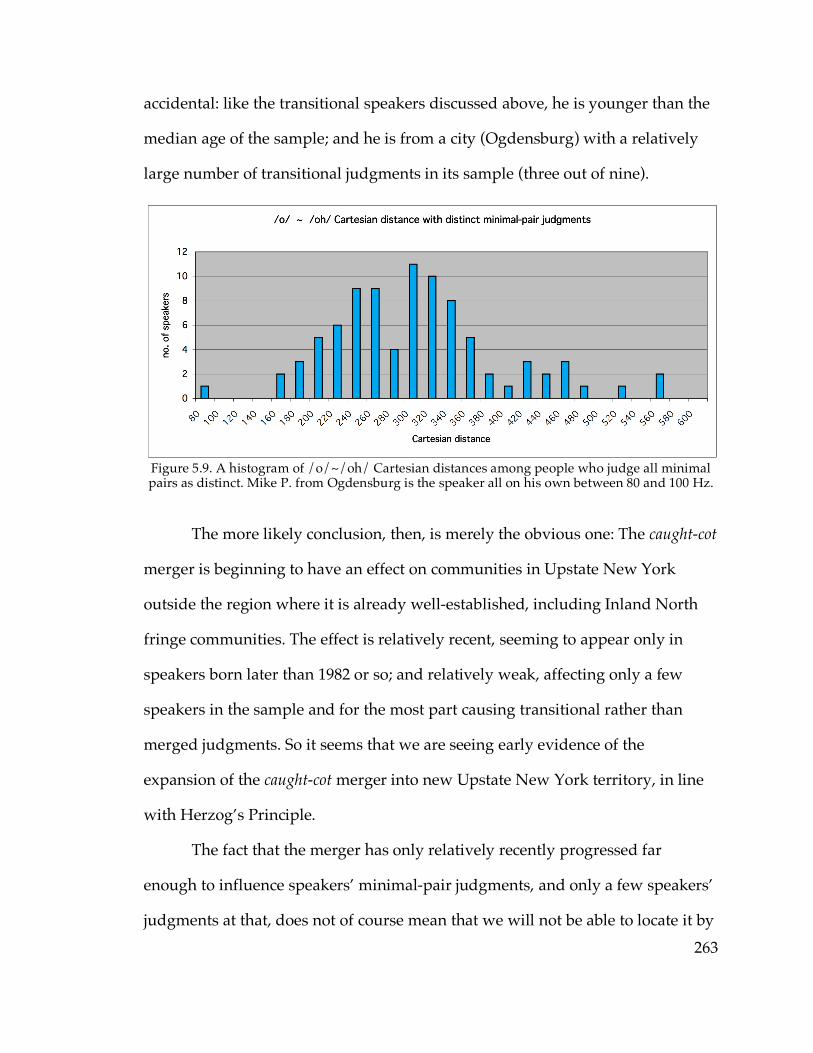
263
accidental: like the transitional speakers discussed above, he is younger than the
median age of the sample; and he is from a city (Ogdensburg) with a relatively
large number of transitional judgments in its sample (three out of nine).
Figure 5.9. A histogram of /o/~/oh/ Cartesian distances among people who judge all minimal pairs as distinct. Mike P. from Ogdensburg is the speaker all on his own between 80 and 100 Hz.
The more likely conclusion, then, is merely the obvious one: The caught-cot
merger is beginning to have an effect on communities in Upstate New York
outside the region where it is already well-established, including Inland North
fringe communities. The effect is relatively recent, seeming to appear only in
speakers born later than 1982 or so; and relatively weak, affecting only a few
speakers in the sample and for the most part causing transitional rather than
merged judgments. So it seems that we are seeing early evidence of the
expansion of the caught-cot merger into new Upstate New York territory, in line
with Herzog’s Principle.
The fact that the merger has only relatively recently progressed far
enough to influence speakers’ minimal-pair judgments, and only a few speakers’
judgments at that, does not of course mean that we will not be able to locate it by
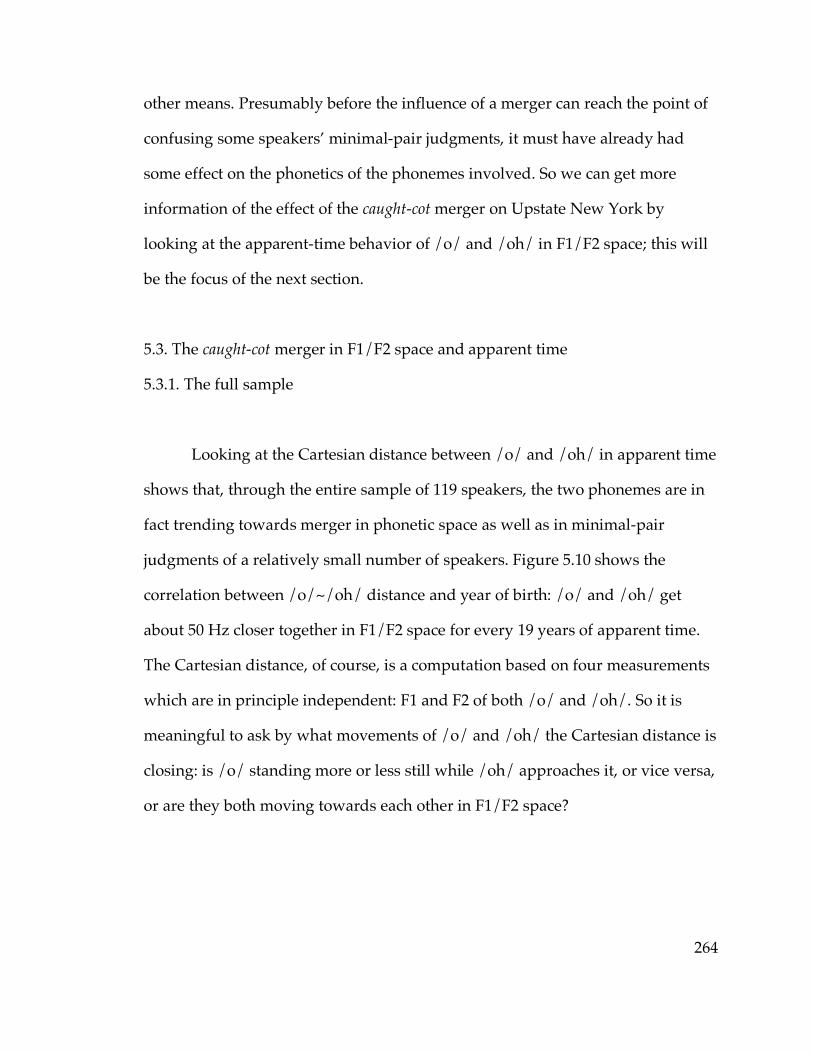
264
other means. Presumably before the influence of a merger can reach the point of
confusing some speakers’ minimal-pair judgments, it must have already had
some effect on the phonetics of the phonemes involved. So we can get more
information of the effect of the caught-cot merger on Upstate New York by
looking at the apparent-time behavior of /o/ and /oh/ in F1/F2 space; this will
be the focus of the next section.
5.3. The caught-cot merger in F1/F2 space and apparent time
5.3.1. The full sample
Looking at the Cartesian distance between /o/ and /oh/ in apparent time
shows that, through the entire sample of 119 speakers, the two phonemes are in
fact trending towards merger in phonetic space as well as in minimal-pair
judgments of a relatively small number of speakers. Figure 5.10 shows the
correlation between /o/~/oh/ distance and year of birth: /o/ and /oh/ get
about 50 Hz closer together in F1/F2 space for every 19 years of apparent time.
The Cartesian distance, of course, is a computation based on four measurements
which are in principle independent: F1 and F2 of both /o/ and /oh/. So it is
meaningful to ask by what movements of /o/ and /oh/ the Cartesian distance is
closing: is /o/ standing more or less still while /oh/ approaches it, or vice versa,
or are they both moving towards each other in F1/F2 space?
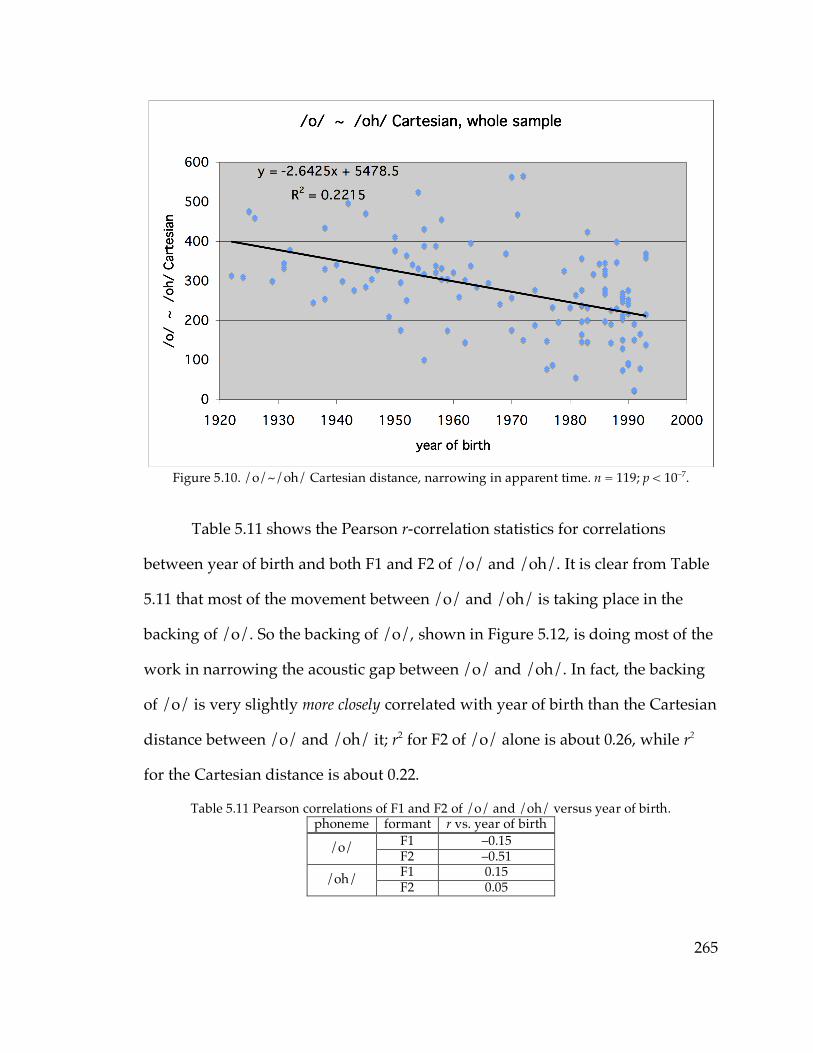
265
Figure 5.10. /o/~/oh/ Cartesian distance, narrowing in apparent time. n = 119; p < 10–7.
Table 5.11 shows the Pearson r-correlation statistics for correlations
between year of birth and both F1 and F2 of /o/ and /oh/. It is clear from Table
5.11 that most of the movement between /o/ and /oh/ is taking place in the
backing of /o/. So the backing of /o/, shown in Figure 5.12, is doing most of the
work in narrowing the acoustic gap between /o/ and /oh/. In fact, the backing
of /o/ is very slightly more closely correlated with year of birth than the Cartesian
distance between /o/ and /oh/ it; r2 for F2 of /o/ alone is about 0.26, while r2
for the Cartesian distance is about 0.22.
Table 5.11 Pearson correlations of F1 and F2 of /o/ and /oh/ versus year of birth. phoneme formant r vs. year of birth
F1 –0.15 /o/ F2 –0.51 F1 0.15 /oh/ F2 0.05
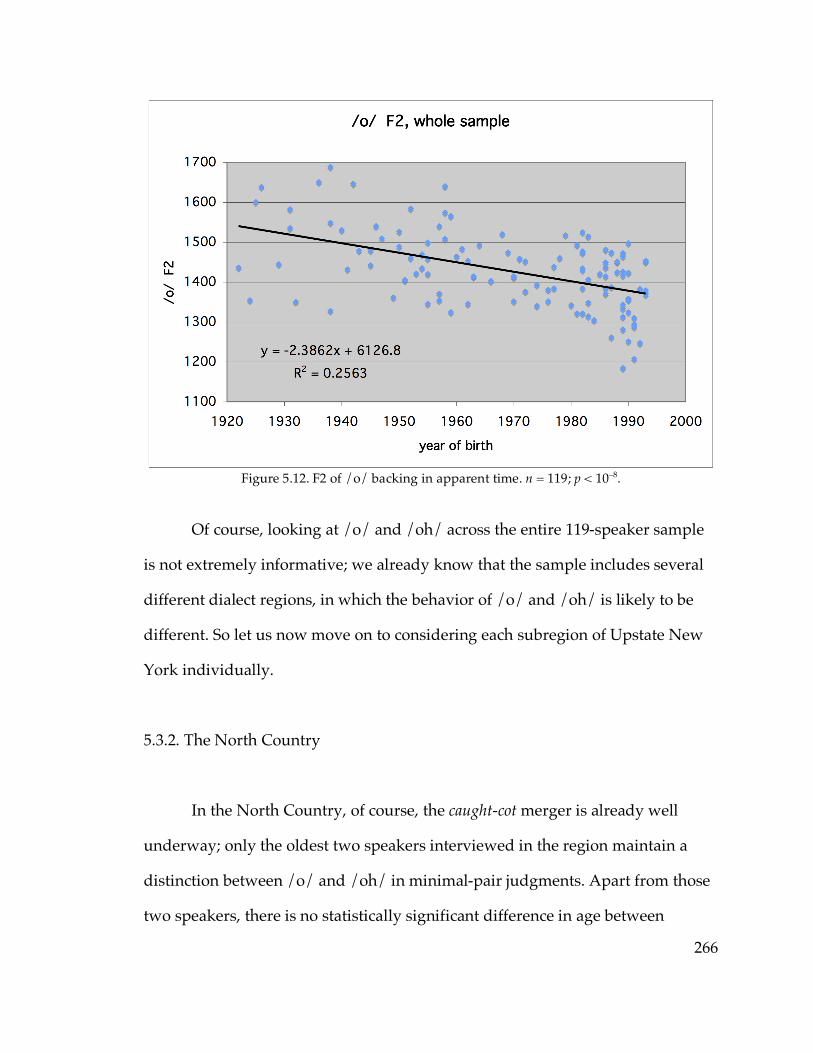
266
Figure 5.12. F2 of /o/ backing in apparent time. n = 119; p < 10–8.
Of course, looking at /o/ and /oh/ across the entire 119-speaker sample
is not extremely informative; we already know that the sample includes several
different dialect regions, in which the behavior of /o/ and /oh/ is likely to be
different. So let us now move on to considering each subregion of Upstate New
York individually.
5.3.2. The North Country
In the North Country, of course, the caught-cot merger is already well
underway; only the oldest two speakers interviewed in the region maintain a
distinction between /o/ and /oh/ in minimal-pair judgments. Apart from those
two speakers, there is no statistically significant difference in age between

267
speakers with “merged” and “transitional” minimal-pair judgments; from
minimal pairs alone there is no direct evidence to indicate that the merger is still
in progress after 1950; moreover, if those two older speakers, whose /o/~/oh/
Cartesian distances are both greater than 250 Hz, are excluded, the negative
correlation between Cartesian distance and year of birth for the remaining
speakers is not statistically significant (r2 ≈ 0.15, p ≈ 0.12). However, F1 and F2 of
/o/ provide clear acoustic evidence that the merger is still ongoing in the North
Country: /o/ is backing and perhaps raising in apparent time, toward /oh/,
which remains stationary.11 These correlations are shown in Figures 5.13 and
5.14.
Figure 5.13. Raising of /o/ in apparent time in the North Country. n ≈ 19; p ≈ 0.053, but if the two oldest speakers are excluded, r2 rises to about 0.26 and p < 0.04.
The most striking fact about the movement of /o/ in the North Country is
in Figure 5.14: the seemingly abrupt backward movement of /o/ among the
11 On the other hand, Pearson correlation of both F1 and F2 of /oh/ with year of birth gives r2 < 0.02.
268
seven youngest speakers, who include at least one speaker from each of the four
sampled communities in the region. Every one of the seven speakers born after
1988 has F2 of /o/ less than 1315 Hz, and every one of the twelve speakers born
before 1988 has F2 of /o/ greater than 1315 Hz; there is no overlap whatsoever.
(The difference is statistically significant at p < 10–4.) Indeed, all of the apparent-
time difference in F2 of /o/ is between the speakers born before 1988 and the
speakers born after 1988: if the seven youngest speakers are excluded, no
correlation between F2 of /o/ and year of birth is found among the twelve
remaining speakers (r2 < 10–3).
Figure 5.14. The backing of /o/ in apparent time in the North Country. n = 19; p < 0.02. If the two oldest speakers are excluded, r2 rises to about 0.35 and p is still less than 0.02.
The difference between the speakers born before and after 1988 is so
striking that it is tempting to say something like “1988 is the year the caught-cot
merger went to completion in the North Country.” This is reminiscent of Johnson
(2007)’s findings on the Massachusetts–Rhode Island border, where the merger
269
also appears to have gone to completion relatively suddenly: in each of several
communities, children born before after a certain date had full merger, while the
merger statuses of those born before that date were mixed and often depended
on whether a given speaker’s parents were merged.
Johnson’s model does not apply directly to the current data, however.
First of all, Johnson found the merger going to completion at different times in
different consecutive communities, whereas the 1988 date of the abrupt backing
of /o/ in the North Country is based on data from several communities, of
which the two best-sampled, Canton and Plattsburgh, are roughly 100 miles
from each other and not in very close contact. Next, this sudden change in F2 is
not well-reflected in other, more direct measures of caught-cot merger: the
speakers born after 1988 are no more likely than the speakers born before 1988 to
have merged rather than transitional minimal-pair judgments.12 Likewise, the
seven younger speakers do not overall have /o/ and /oh/ much closer in
Cartesian distance than the ten older speakers: the difference between the seven
younger speakers’ mean Cartesian distance and the older speakers’ is not
significant at the 0.05 level (p ≈ 0.055). Finally, in southeastern New England
Johnson attributed the advancement of the merger to an increase in the number
of locals whose parents were natives of a merging region; but in the North
Country, almost none of the sampled speakers, when asked, described their
parents as being from merging regions other than the North Country itself (the
only exception is Marc F. from Plattsburgh, whose parents were from Vermont),
12 In fact, the younger speakers have fewer merged minimal-pair judgments than the older speakers—two out of seven versus six out of ten—although the difference is not statistically significant. In this comparison and the next, the two oldest speakers, who have distinct minimal-pair judgments, are excluded.
270
and if anything, there is a growing number of speakers with parents from non-
merging regions13; of the nine sampled North Country speakers born later than
1985, only one has neither parent from an non-merging region. There is no
noticeable relationship between parents’ geographical origin and F2 of /o/,
Cartesian distance, or minimal-pair judgments.
There is a correlation between parents’ geographical origin and F1 of both
/o/ and /oh/: /o/ and /oh/ are higher (i.e., F1 is lower) for speakers with
parents from non-merging regions (r < –0.5 and p < 0.05 for both correlations).
Figure 5.15 demonstrates how speakers with both parents from unmerged
regions have both /o/ and /oh/ higher than do speakers with both parents from
the North Country and Vermont (verified by t-test: p < 0.01 for both /o/ and
/oh/). Of course, not all parents from the North Country would have been
merged themselves: after all, as has been observed above, the cot-caught merger is
relatively new to the North Country, and the two oldest speakers sampled in the
region make the distinction clearly. The third-oldest sampled speaker in the
North Country, Bob L. from Canton, was born in 1951; therefore if we consider
only speakers at least 25 years younger than Bob, we can be relatively more
confident that all remaining parents from the North Country would have been at
least partially merged themselves. In this case the correlation between parents’ 13 Included in “non-merging regions” here are Ogdensburg, New York City, Long Island, Syracuse, Endicott (a village near Binghamton, in the Inland North core), Michigan, and North Carolina. All other parents of speakers in the North Country sample are themselves from Vermont or communities in the North Country, no further west than Canton nor much further south than Lake Placid. The most questionably classified community here is Massena, a village northeast of Canton and Ogdensburg. In the absence of direct data, it is unclear whether to expect Massena to be dialectologically part of the North Country (being further east than Canton) or the Inland North fringe (being, like Ogdensburg, on the St. Lawrence River). It is here classified as a North Country community; but treating it as unmerged would not substantially change most of the results, inasmuch as only one parent of one of speaker is from Massena. If Massena is considered part of the North Country, year of birth is positively correlated with number of parents from non-merging communities (r2 ≈ 0.27; p < 0.05).
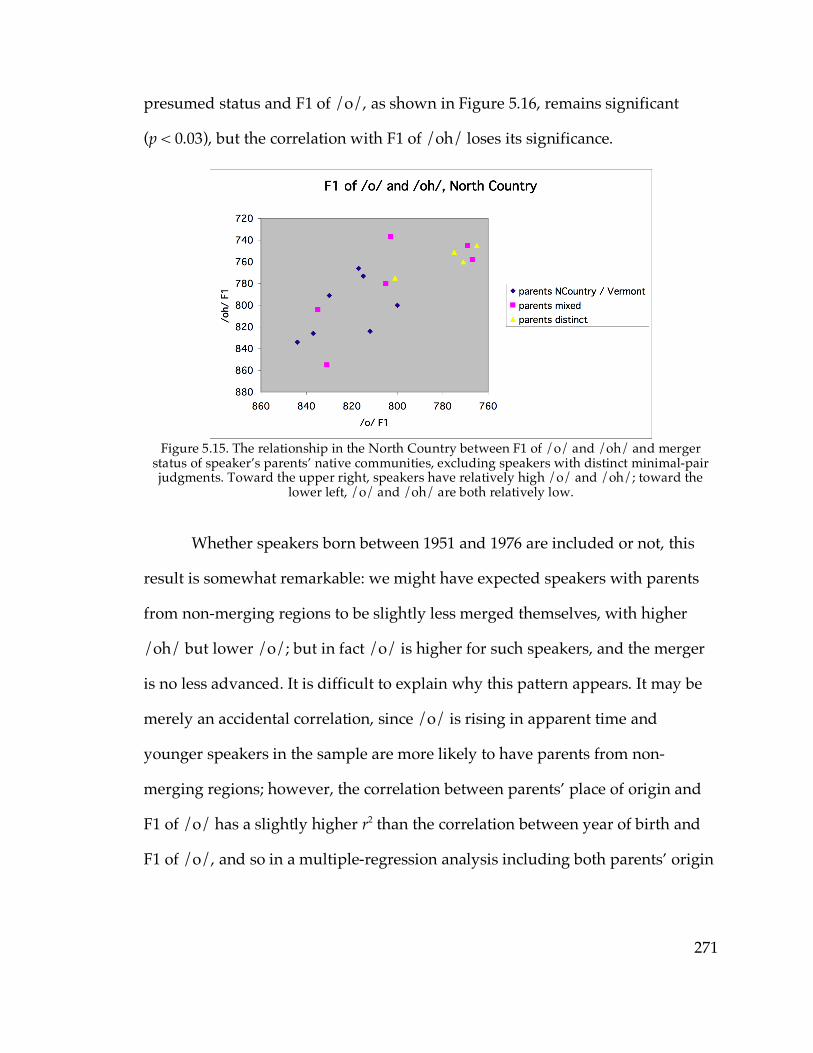
271
presumed status and F1 of /o/, as shown in Figure 5.16, remains significant
(p < 0.03), but the correlation with F1 of /oh/ loses its significance.
Figure 5.15. The relationship in the North Country between F1 of /o/ and /oh/ and merger
status of speaker’s parents’ native communities, excluding speakers with distinct minimal-pair judgments. Toward the upper right, speakers have relatively high /o/ and /oh/; toward the
lower left, /o/ and /oh/ are both relatively low.
Whether speakers born between 1951 and 1976 are included or not, this
result is somewhat remarkable: we might have expected speakers with parents
from non-merging regions to be slightly less merged themselves, with higher
/oh/ but lower /o/; but in fact /o/ is higher for such speakers, and the merger
is no less advanced. It is difficult to explain why this pattern appears. It may be
merely an accidental correlation, since /o/ is rising in apparent time and
younger speakers in the sample are more likely to have parents from non-
merging regions; however, the correlation between parents’ place of origin and
F1 of /o/ has a slightly higher r2 than the correlation between year of birth and
F1 of /o/, and so in a multiple-regression analysis including both parents’ origin
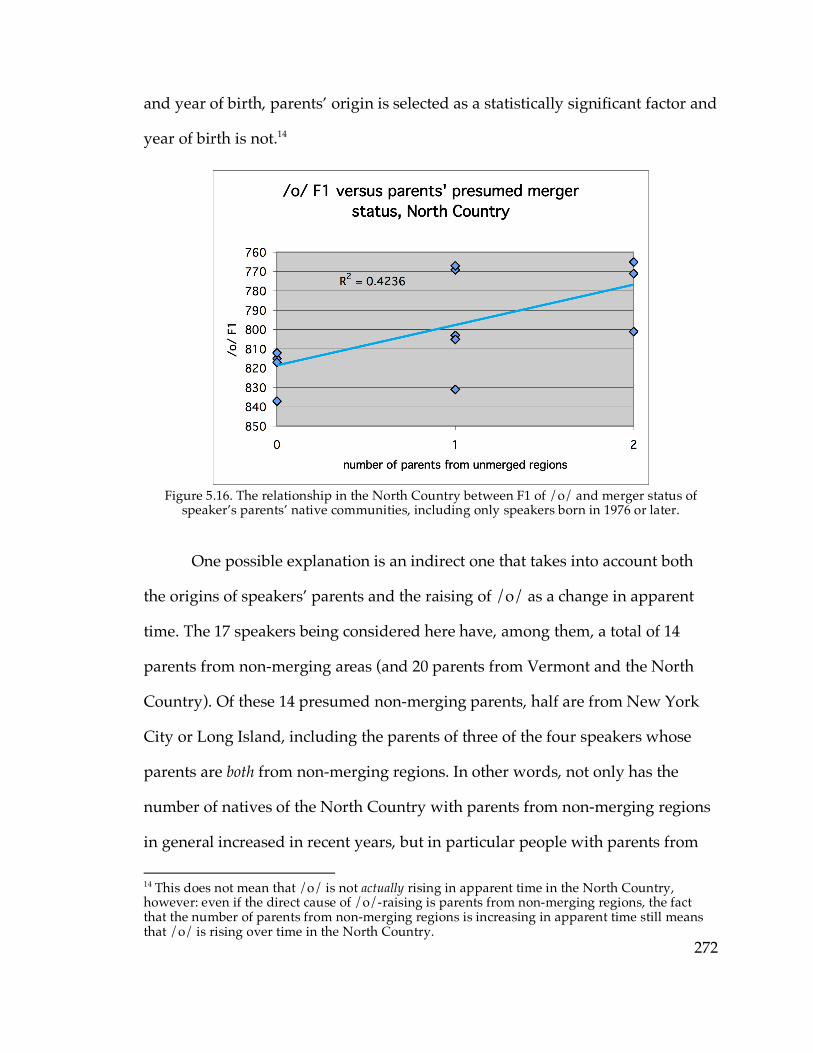
272
and year of birth, parents’ origin is selected as a statistically significant factor and
year of birth is not.14
Figure 5.16. The relationship in the North Country between F1 of /o/ and merger status of
speaker’s parents’ native communities, including only speakers born in 1976 or later.
One possible explanation is an indirect one that takes into account both
the origins of speakers’ parents and the raising of /o/ as a change in apparent
time. The 17 speakers being considered here have, among them, a total of 14
parents from non-merging areas (and 20 parents from Vermont and the North
Country). Of these 14 presumed non-merging parents, half are from New York
City or Long Island, including the parents of three of the four speakers whose
parents are both from non-merging regions. In other words, not only has the
number of natives of the North Country with parents from non-merging regions
in general increased in recent years, but in particular people with parents from
14 This does not mean that /o/ is not actually rising in apparent time in the North Country, however: even if the direct cause of /o/-raising is parents from non-merging regions, the fact that the number of parents from non-merging regions is increasing in apparent time still means that /o/ is rising over time in the North Country.
273
areas with raised /oh/ may make up a relatively large component of that increase.
Speakers in a caught-cot merging community whose parents are from New York
City or Long Island might end up having a somewhat raised merged /o/~/oh/
phoneme: the parents, by virtue of having a raised /oh/, would have a relatively
high (i.e., low-F1) mean overall distribution of /o/ and /oh/, and so the children,
who fail to acquire the distinction, do nevertheless acquire their parents’ raised
overall /o/~/oh/ mean. If there are enough children with New York City or
Long Island parents in the community, this result could feed back in and cause a
general trend toward raising of the merged /o/~/oh/ phoneme in apparent
time, affecting even speakers whose parents are not from raised-/oh/ areas.
Obviously the data is not nearly deep enough to prove or disprove this
hypothesis; it must basically be accorded the status of conjecture. There is not
even a statistically significant correlation of /oh/ with year of birth, as we would
expect to find if /oh/ is raising in apparent time. There is evidence, however,
that the phonetic distribution of parents’ unmerged phonemes can have an effect
on their children in merging communities: a multiple-regression analysis finds
that North Country speakers with parents from the Inland North have
significantly fronter /o/ (p < 0.02).
In any event, we have not yet explained the sharp F2 difference in /o/
between North Country speakers born before and after 1988. The apparent
suddenness of the change in F2 suggests that it reflects a discrete change in the
phonological features of /o/; a mere change in the phonetic implementation of
the same /o/ features would be expected to manifest as a more gradual drift
through phonetic space, according to the taxonomy of Bermúdez-Otero (2007).
274
The obvious candidate for such a feature is rounding. The hypothesis that the
difference between /o/ in the North Country before and after 1988 is rounding is
tentatively supported by my own impressionistic auditory judgments of
rounding in listening to speakers’ minimal-pair pronunciations: North Country
speakers whose /o/~/oh/ minimal pairs sound merged to me sound,
impressionistically, to be (with a few exceptions) merged as an unrounded vowel
for speakers born before 1988 and as a rounded vowel for speakers born later.
Assuming this is the case, what could have made the merged /o/~/oh/ change
suddenly from rounded to unrounded in 1988, after seemingly decades of
relative stability? One possibility, again, is the increasing presence in the North
Country of natives whose parents are from unmerged communities—and who
therefore presumably had unrounded /o/ but rounded /oh/. If /o/ and /oh/
were already in the process of merging as an unrounded phoneme, it is possible
that an influx of speakers with rounded /oh/, although certainly not sufficient to
reverse the merger, might have been sufficient to change the target of the merger
to a rounded one.
The Canadian chain shift, as described in ANAE, begins with the backing
of /æ/ in response to the merger of /o/ and /oh/ in rounded position. Given
that /o/ and /oh/ appear to be merging in the North Country in rounded
position, and that the North Country is adjacent to Canada, we can also ask if
there is evidence that the Canadian Shift is taking place here as well. There is
some evidence that it is: at least, /æ/ is (relatively weakly) backing in apparent
time, as Figure 5.17 shows; moreover, F2 of /æ/ is even more strongly correlated
with F2 of /o/ (r2 ≈ 0.37; p < 0.01). Overall, /æ/ is quite back indeed: the mean F2

275
of the 18 North Country speakers sampled is 1663 Hz, noticeably backer than
even the Canadian speakers in the Telsur corpus, whose mean is 1725 Hz
(p < 0.02). There is no apparent-time change in F1 of /æ/ or in either formant of
/e/.
Figure 5.17. The backing of /æ/ in apparent time in the North Country (p < 0.05).
Despite the immediate proximity of Canadian English, it is not necessarily
the case that the backing of /æ/ in the North Country is the direct result of the
diffusion of Canadian Shift features from Canada, especially given the reluctance
of phonetic features to spread across the U.S.–Canada border as noted by Boberg
(2000). It may just as easily be an independent parallel development, as a result
of the raising and backing of /o/ leaving space for /æ/ to shift back; the same
development has been noted independently in California, another caught-cot
merging region (see e.g. Eckert 2008), and ANAE finds Canadian Shift
sporadically throughout the West.

276
Figure 5.18. F2 of /o/ in apparent time in Cooperstown and Sidney. In Cooperstown, the
correlation between /o/ F2 and year of birth is statistically significant (p ≈ 0.001); in Sidney, it does not reach the level of significance.
5.3.3. Cooperstown and Sidney
The only community in the sample outside the North Country in which
multiple speakers had fully-merged minimal-pair judgments was Cooperstown.
As mentioned earlier in this chapter, the caught-cot merger has taken over
Cooperstown quite rapidly: of the nine speakers interviewed in Cooperstown,
the five born in 1963 or earlier all had distinct minimal-pair judgments, and the
four born in 1983 or later all had merged or transitional judgments. This is
reminiscent of Cooperstown’s rapid retreat from the NCS, as documented in
Chapter 3: the five older speakers all have NCS scores between two and four,
and the four younger speakers all score zero or one. Given the retreat from the
NCS, it is unsurprising that the phonetic approach to the caught-cot merger
277
should be the backing of /o/; Figure 5.18 displays the backing of /o/ in
apparent time in Cooperstown.
In Sidney, whose /o/ is also shown on Figure 5.18, the NCS is also
diminishing in apparent time, but the caught-cot merger has not had a direct
effect on speakers’ minimal-pair judgments: all speakers sampled judged all
/o/~/oh/ minimal pairs as distinct. Since the NCS is diminishing, we would
expect to find /o/ backing in apparent time, as we did in Cooperstown. Now,
the Pearson correlation of F2 of /o/ with year of birth does not reach the level of
statistical significance (p ≈ 0.17), although it does have a higher r2 value (0.29)
than F1 of /o/ or either formant of /oh/; and as Figure 5.18 shows, only one of
the five older speakers sampled in Sidney has /o/ as back as the three younger
speakers do. A t-test comparing the five older speakers (mean F2: 1523 Hz) and
three younger speakers (mean F2: 1380 Hz) does yield a significant difference,
with p < 0.05.
5.3.4. The Inland North core and fringe
Earlier in this chapter, indications were found of incipient caught-cot
merger in the Inland North fringe: six relatively young speakers out of the 40
sampled in the Inland North fringe region had transitional minimal-pair
judgments; and one speaker in Ogdensburg had distinct judgments but only
89 Hz in Cartesian distance between /o/ and /oh/. If the caught-cot merger has
begun relatively recently to have enough of an effect in the Inland North fringe
to affect speakers’ minimal-pair judgments, then there should be phonetic
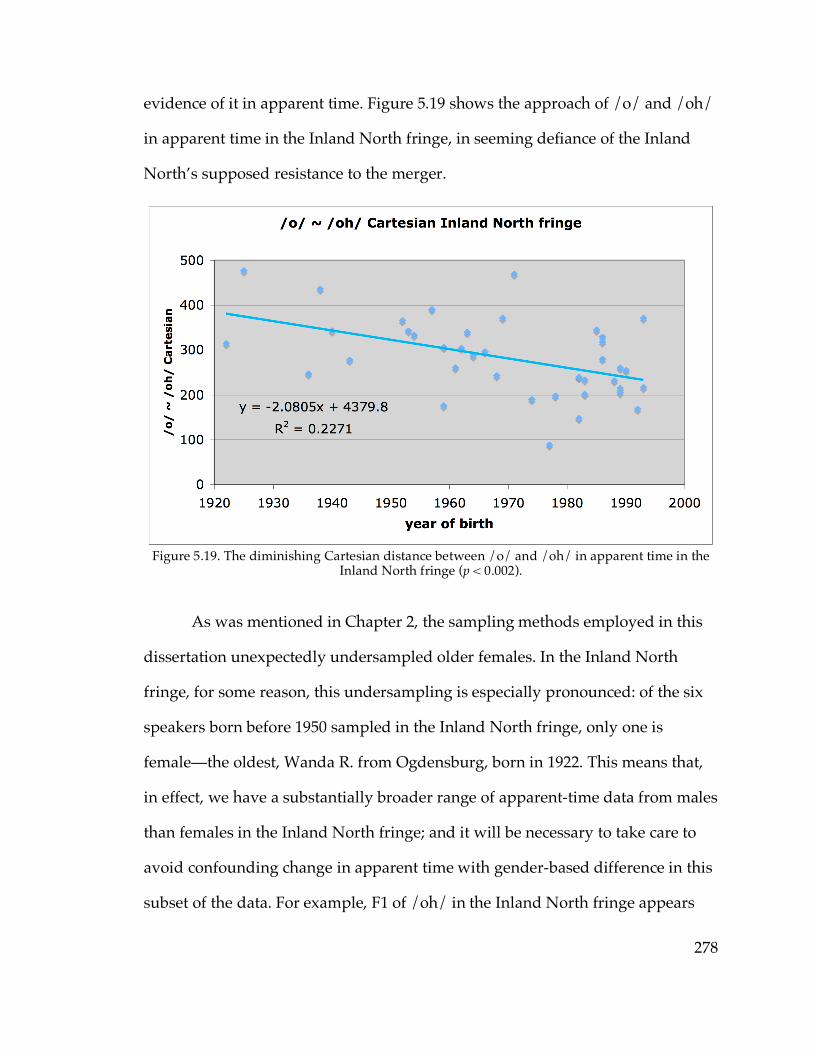
278
evidence of it in apparent time. Figure 5.19 shows the approach of /o/ and /oh/
in apparent time in the Inland North fringe, in seeming defiance of the Inland
North’s supposed resistance to the merger.
Figure 5.19. The diminishing Cartesian distance between /o/ and /oh/ in apparent time in the Inland North fringe (p < 0.002).
As was mentioned in Chapter 2, the sampling methods employed in this
dissertation unexpectedly undersampled older females. In the Inland North
fringe, for some reason, this undersampling is especially pronounced: of the six
speakers born before 1950 sampled in the Inland North fringe, only one is
female—the oldest, Wanda R. from Ogdensburg, born in 1922. This means that,
in effect, we have a substantially broader range of apparent-time data from males
than females in the Inland North fringe; and it will be necessary to take care to
avoid confounding change in apparent time with gender-based difference in this
subset of the data. For example, F1 of /oh/ in the Inland North fringe appears

279
significantly correlated with year of birth (r2 ≈ 0.12, p ≈ 0.03) in the sample; but in
a multiple-regression analysis in which gender and year of birth are both
included as factors, year of birth is no longer selected as significant (p ≈ 0.08).
Figure 5.20. The backing of /o/ in apparent time in the Inland North fringe. The blue regression line with r2 ≈ 0.56 (p < 0.0002) represents the apparent-time trend for males only; the sampled
females do not have a wide enough effective age range to show a significant apparent-time trend.
Gender and year of birth are both significant factors for F2 of /o/,
however (adjusted r2 ≈ 0.48; p < 0.001 for each): /o/ is backing in apparent time,
with females leading the change, as shown in Figure 5.20. So not only are some
younger speakers in the Inland North fringe beginning to feel the effects of the
caught-cot merger in their minimal-pair judgments, but in fact /o/ is backing in
apparent time to make that happen, in an exact reversal of the /o/-fronting of
the NCS. In other words, not only is the presence of the NCS in these
communities seemingly insufficient to prevent the expansion of the caught-cot
merger into them, but the structure of the NCS cannot even prevent one of the
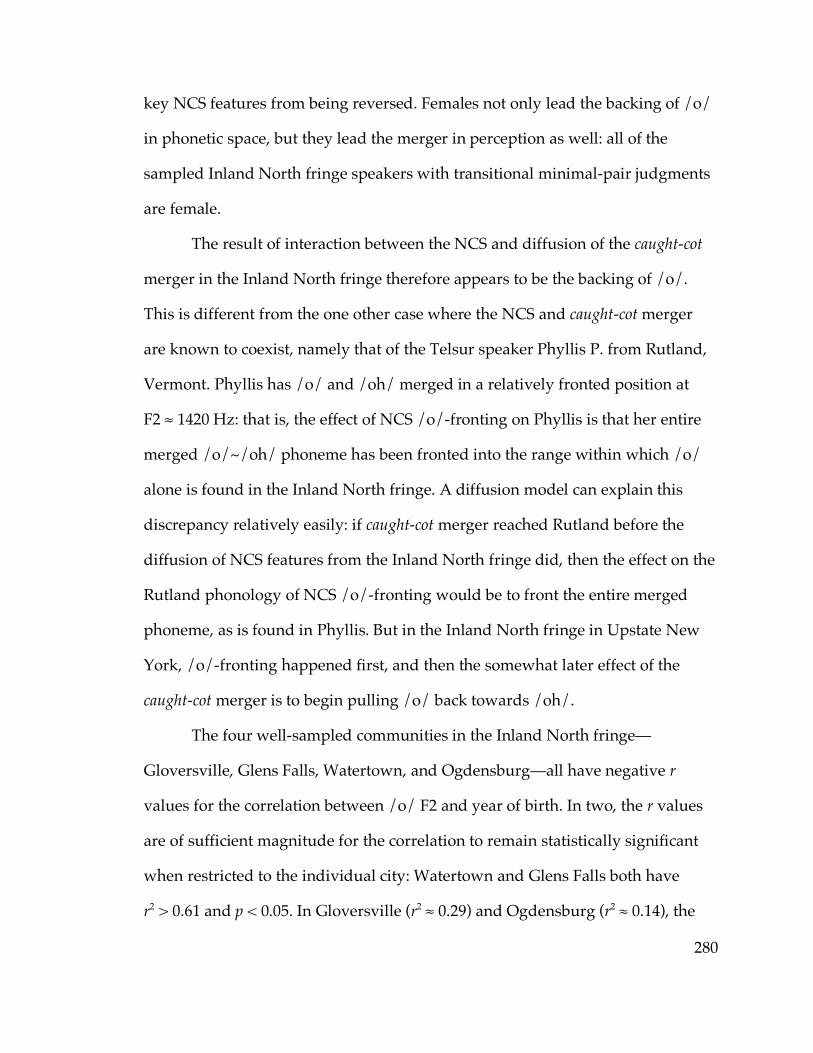
280
key NCS features from being reversed. Females not only lead the backing of /o/
in phonetic space, but they lead the merger in perception as well: all of the
sampled Inland North fringe speakers with transitional minimal-pair judgments
are female.
The result of interaction between the NCS and diffusion of the caught-cot
merger in the Inland North fringe therefore appears to be the backing of /o/.
This is different from the one other case where the NCS and caught-cot merger
are known to coexist, namely that of the Telsur speaker Phyllis P. from Rutland,
Vermont. Phyllis has /o/ and /oh/ merged in a relatively fronted position at
F2 ≈ 1420 Hz: that is, the effect of NCS /o/-fronting on Phyllis is that her entire
merged /o/~/oh/ phoneme has been fronted into the range within which /o/
alone is found in the Inland North fringe. A diffusion model can explain this
discrepancy relatively easily: if caught-cot merger reached Rutland before the
diffusion of NCS features from the Inland North fringe did, then the effect on the
Rutland phonology of NCS /o/-fronting would be to front the entire merged
phoneme, as is found in Phyllis. But in the Inland North fringe in Upstate New
York, /o/-fronting happened first, and then the somewhat later effect of the
caught-cot merger is to begin pulling /o/ back towards /oh/.
The four well-sampled communities in the Inland North fringe—
Gloversville, Glens Falls, Watertown, and Ogdensburg—all have negative r
values for the correlation between /o/ F2 and year of birth. In two, the r values
are of sufficient magnitude for the correlation to remain statistically significant
when restricted to the individual city: Watertown and Glens Falls both have
r2 > 0.61 and p < 0.05. In Gloversville (r2 ≈ 0.29) and Ogdensburg (r2 ≈ 0.14), the
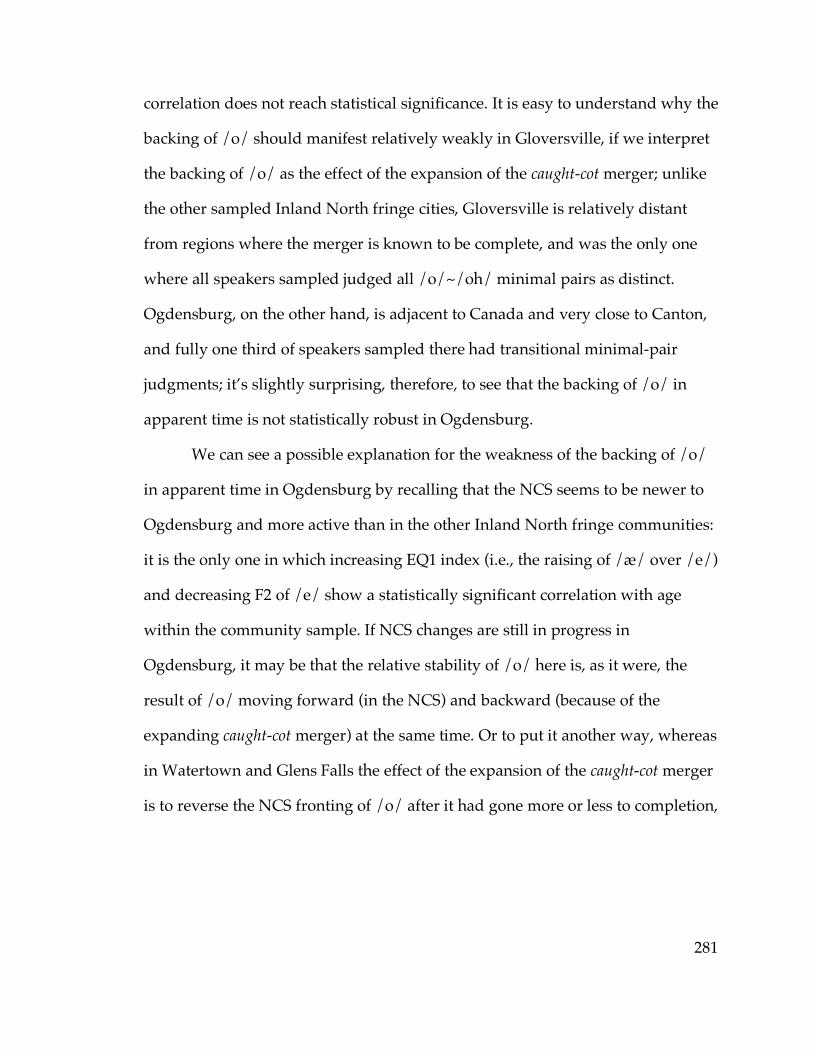
281
correlation does not reach statistical significance. It is easy to understand why the
backing of /o/ should manifest relatively weakly in Gloversville, if we interpret
the backing of /o/ as the effect of the expansion of the caught-cot merger; unlike
the other sampled Inland North fringe cities, Gloversville is relatively distant
from regions where the merger is known to be complete, and was the only one
where all speakers sampled judged all /o/~/oh/ minimal pairs as distinct.
Ogdensburg, on the other hand, is adjacent to Canada and very close to Canton,
and fully one third of speakers sampled there had transitional minimal-pair
judgments; it’s slightly surprising, therefore, to see that the backing of /o/ in
apparent time is not statistically robust in Ogdensburg.
We can see a possible explanation for the weakness of the backing of /o/
in apparent time in Ogdensburg by recalling that the NCS seems to be newer to
Ogdensburg and more active than in the other Inland North fringe communities:
it is the only one in which increasing EQ1 index (i.e., the raising of /æ/ over /e/)
and decreasing F2 of /e/ show a statistically significant correlation with age
within the community sample. If NCS changes are still in progress in
Ogdensburg, it may be that the relative stability of /o/ here is, as it were, the
result of /o/ moving forward (in the NCS) and backward (because of the
expanding caught-cot merger) at the same time. Or to put it another way, whereas
in Watertown and Glens Falls the effect of the expansion of the caught-cot merger
is to reverse the NCS fronting of /o/ after it had gone more or less to completion,
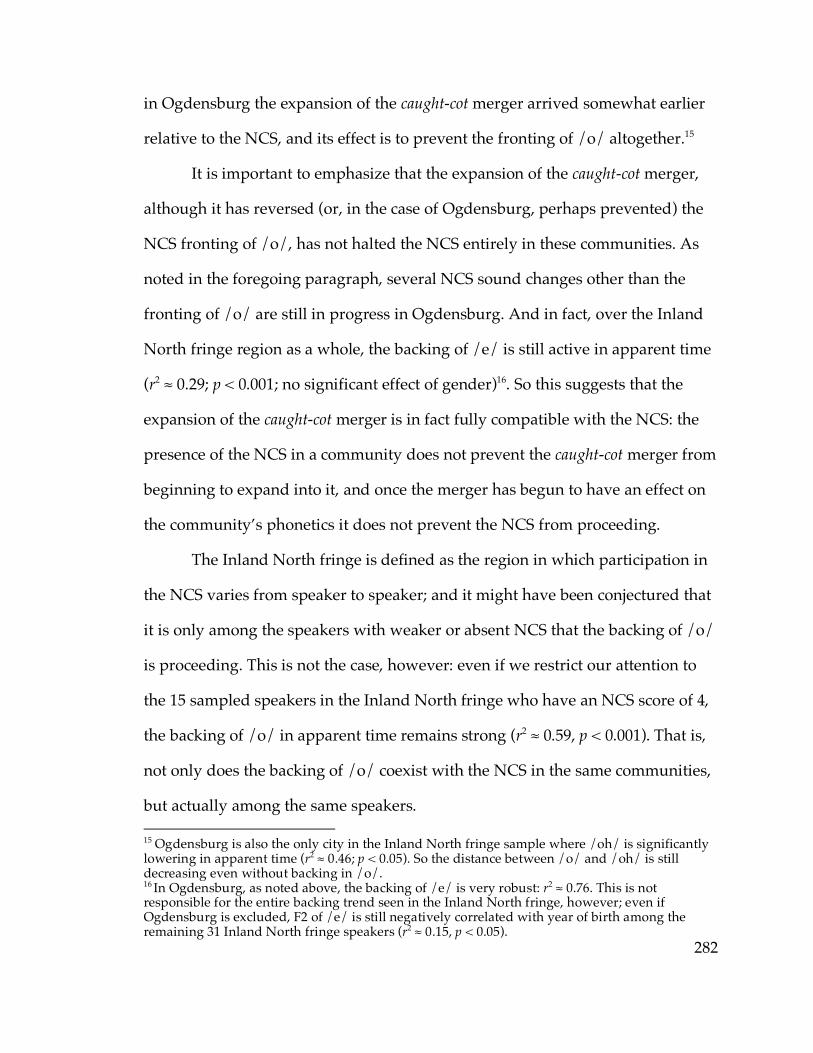
282
in Ogdensburg the expansion of the caught-cot merger arrived somewhat earlier
relative to the NCS, and its effect is to prevent the fronting of /o/ altogether.15
It is important to emphasize that the expansion of the caught-cot merger,
although it has reversed (or, in the case of Ogdensburg, perhaps prevented) the
NCS fronting of /o/, has not halted the NCS entirely in these communities. As
noted in the foregoing paragraph, several NCS sound changes other than the
fronting of /o/ are still in progress in Ogdensburg. And in fact, over the Inland
North fringe region as a whole, the backing of /e/ is still active in apparent time
(r2 ≈ 0.29; p < 0.001; no significant effect of gender)16. So this suggests that the
expansion of the caught-cot merger is in fact fully compatible with the NCS: the
presence of the NCS in a community does not prevent the caught-cot merger from
beginning to expand into it, and once the merger has begun to have an effect on
the community’s phonetics it does not prevent the NCS from proceeding.
The Inland North fringe is defined as the region in which participation in
the NCS varies from speaker to speaker; and it might have been conjectured that
it is only among the speakers with weaker or absent NCS that the backing of /o/
is proceeding. This is not the case, however: even if we restrict our attention to
the 15 sampled speakers in the Inland North fringe who have an NCS score of 4,
the backing of /o/ in apparent time remains strong (r2 ≈ 0.59, p < 0.001). That is,
not only does the backing of /o/ coexist with the NCS in the same communities,
but actually among the same speakers. 15 Ogdensburg is also the only city in the Inland North fringe sample where /oh/ is significantly lowering in apparent time (r2 ≈ 0.46; p < 0.05). So the distance between /o/ and /oh/ is still decreasing even without backing in /o/. 16 In Ogdensburg, as noted above, the backing of /e/ is very robust: r2 ≈ 0.76. This is not responsible for the entire backing trend seen in the Inland North fringe, however; even if Ogdensburg is excluded, F2 of /e/ is still negatively correlated with year of birth among the remaining 31 Inland North fringe speakers (r2 ≈ 0.15, p < 0.05).
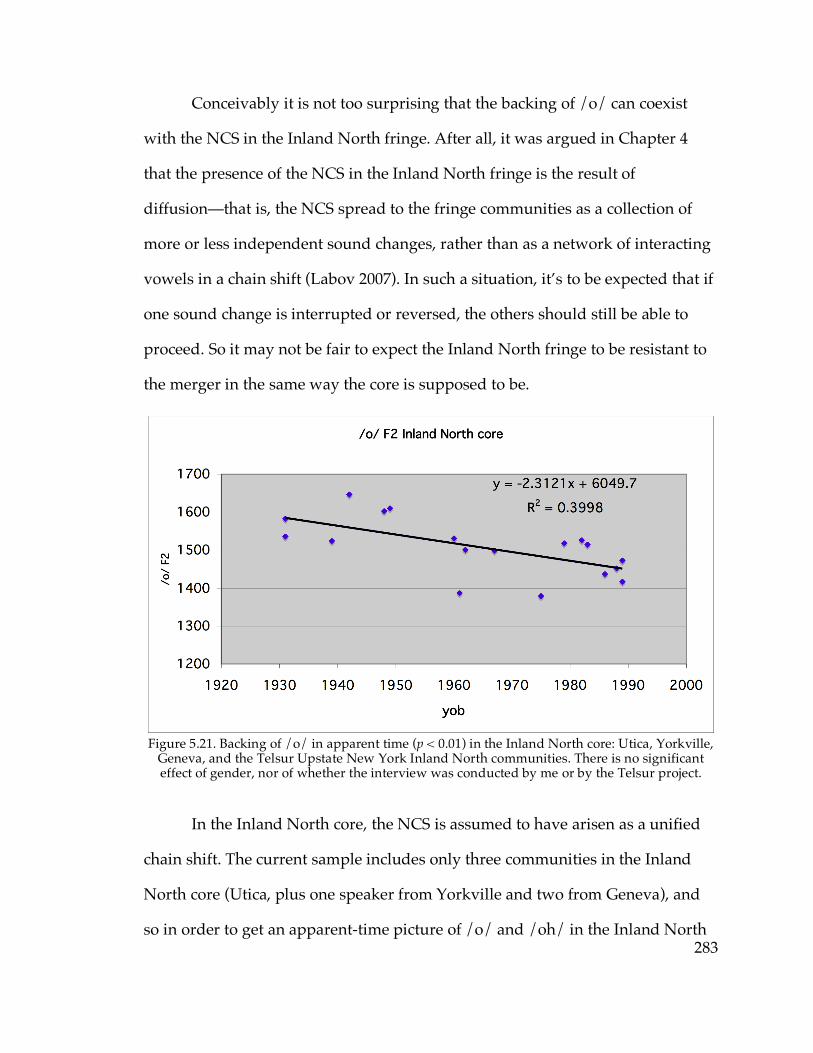
283
Conceivably it is not too surprising that the backing of /o/ can coexist
with the NCS in the Inland North fringe. After all, it was argued in Chapter 4
that the presence of the NCS in the Inland North fringe is the result of
diffusion—that is, the NCS spread to the fringe communities as a collection of
more or less independent sound changes, rather than as a network of interacting
vowels in a chain shift (Labov 2007). In such a situation, it’s to be expected that if
one sound change is interrupted or reversed, the others should still be able to
proceed. So it may not be fair to expect the Inland North fringe to be resistant to
the merger in the same way the core is supposed to be.
Figure 5.21. Backing of /o/ in apparent time (p < 0.01) in the Inland North core: Utica, Yorkville, Geneva, and the Telsur Upstate New York Inland North communities. There is no significant effect of gender, nor of whether the interview was conducted by me or by the Telsur project.
In the Inland North core, the NCS is assumed to have arisen as a unified
chain shift. The current sample includes only three communities in the Inland
North core (Utica, plus one speaker from Yorkville and two from Geneva), and
so in order to get an apparent-time picture of /o/ and /oh/ in the Inland North

284
core, we will also include the Telsur corpus’s eight Inland North Upstate New
York speakers in the analysis: two each from Buffalo, Rochester, Syracuse, and
Binghamton. Figure 5.21 shows that /o/ is backing in apparent time in the
Inland North core as well.17 In the fringe, it was possible to argue that the
backing of /o/ could proceed without disturbing the other NCS features because
in communities to which the NCS has diffused, there’s not necessarily any
particular structural relationship between the different sound changes. In the
Inland North core, where the NCS is presumed to be a coherent chain-shift
system, that argument is not valid, and we have to accept that the backing of /o/
is capable of coexisting with the NCS as a chain shift.
At this point, we must be open to the possibility that the backing of /o/ in
the Inland North core and fringe communities is not a consequence of the
expansion of the caught-cot merger but an independent internal development of
the Inland North vowel system. Perhaps, for example, fronting of /o/ has merely
reached some kind of phonetic or phonological limit in the Inland North,
“bounced” (as it were) off the front of the vowel space, and ended up moving
backward. Now, the overall mean F2 of /o/ of the 18 Inland North core speakers
in Figure 5.21 is 1508 Hz. The Telsur corpus includes 53 speakers classified as
part of the Inland North region outside of New York state; these 53 speakers
have a mean /o/ F2 of 1497 Hz—essentially no different from the mean /o/ F2
of the 18 New York State Inland North core speakers. So if /o/ is backing in the
Inland North core in New York State for its own reasons, because it has gone as
17 Since /o/ is backing, the Cartesian distance between /o/ and /oh/ is also decreasing in apparent time (r2 ≈ 0.23, p < 0.05); /oh/ and F1 of /o/ show no apparent-time change.
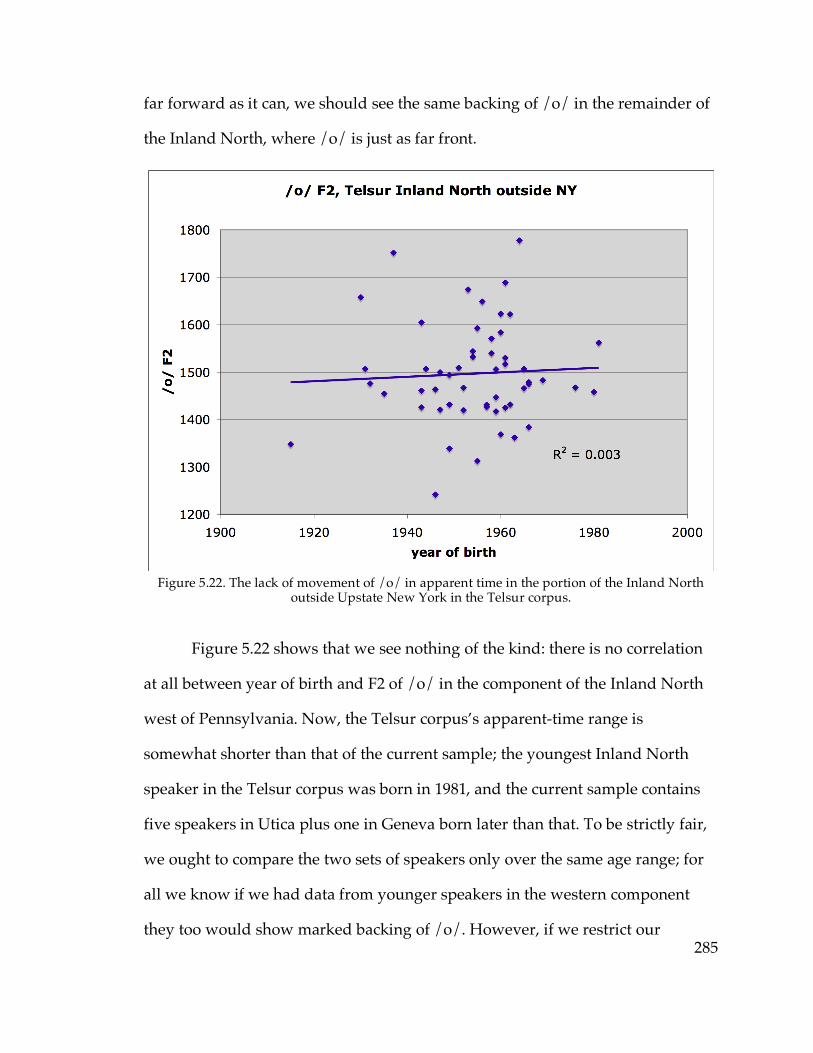
285
far forward as it can, we should see the same backing of /o/ in the remainder of
the Inland North, where /o/ is just as far front.
Figure 5.22. The lack of movement of /o/ in apparent time in the portion of the Inland North
outside Upstate New York in the Telsur corpus.
Figure 5.22 shows that we see nothing of the kind: there is no correlation
at all between year of birth and F2 of /o/ in the component of the Inland North
west of Pennsylvania. Now, the Telsur corpus’s apparent-time range is
somewhat shorter than that of the current sample; the youngest Inland North
speaker in the Telsur corpus was born in 1981, and the current sample contains
five speakers in Utica plus one in Geneva born later than that. To be strictly fair,
we ought to compare the two sets of speakers only over the same age range; for
all we know if we had data from younger speakers in the western component
they too would show marked backing of /o/. However, if we restrict our
286
attention to speakers born between 1931 and 1981 (for the oldest speaker
sampled in the New York State Inland North core and the youngest speaker in
the Telsur corpus in the western component, respectively), the results do not
change: over that 50-year span, /o/ is already significantly backing in apparent
time in New York State (n = 12; r2 ≈ 0.35; p < 0.05), but stationary in the western
component (n = 51; r2 ≈ 0.001).
So, although the Inland North region as a whole has been described as
showing “extraordinary” or “mysterious” uniformity (Labov 2001:515, 2008), the
behavior of /o/ is strikingly different between the portion of the Inland North in
Upstate New York and the portion to the west. This dialectological difference
between two components of the Inland North coincides with a geographic
discontinuity: the two components are separated by northwestern Pennsylvania,
an area that was found to be part of the North by early dialectological research
(Kurath 1949, Kurath & McDavid 1961) but where the NCS never occurred
(Evanini 2009). At any rate, this shows that the backing of /o/ that we see in
apparent time in the Inland North core in Upstate New York is not merely the
next natural stage in the development of the NCS vowel system, common to both
Inland North components; it must have some other cause, applicable in Upstate
New York but not the western component of the Inland North.
Is it likely that the backing of /o/ in apparent time is the result of influence from
the caught-cot merger? None of the sampled speakers in the Inland North core
have the merger themselves—they all have more than 250 Hz in Cartesian
distance between /o/ and /oh/; and they all have distinct minimal-pair
judgments with the exception of Christie L. from Utica, whose merged

287
judgments can be fairly reasonably regarded (as argued above) as a mistake. But
is it necessary for the caught-cot merger to be actually present in a region in order
for us to describe that region as subject to the effect of the merger? In other words,
can the geographical expansion of a merger in accordance with Herzog’s
Principle have the immediate effect only of initiating a sound change in the
direction of merger, without (yet) causing any speakers to actually exhibit the
merger in their own phonology?
If we take the transitional minimal-pair judgments in the Inland North
fringe to be a case of such geographical expansion, it clearly seems that it can.
The oldest speakers in the Inland North fringe sample with transitional
judgments, as noted earlier in this chapter, were born in 1982 (excluding Pamela
H. from Walton as an error), but the backing of /o/ in phonetic space originated
well before that: if we restrict the Inland North fringe sample only to the 23
speakers born before 1982—that is, before the merger has any direct effect on the
judgments of sampled speakers—the correlation of F2 of /o/ with year of birth is
still relatively strong and statistically significant (r2 ≈ 0.25; p < 0.02; adding
gender to the regression pushes adjusted r2 up to approximately 0.43). That
means that by 1982, roughly speaking, the backing of /o/ had already been in
progress for some time before speakers’ minimal-pair judgments had begun to be
affected by it. So if we interpret what is happening in the Inland North fringe as
the expansion of the caught-cot merger by diffusion, then that implies that the
effect of the diffusion of merger need only be a sound change in the direction of
merger; the merger itself may begin to take place in perception some time later.
While this does not prove that the backing of /o/ in the Inland North core (or
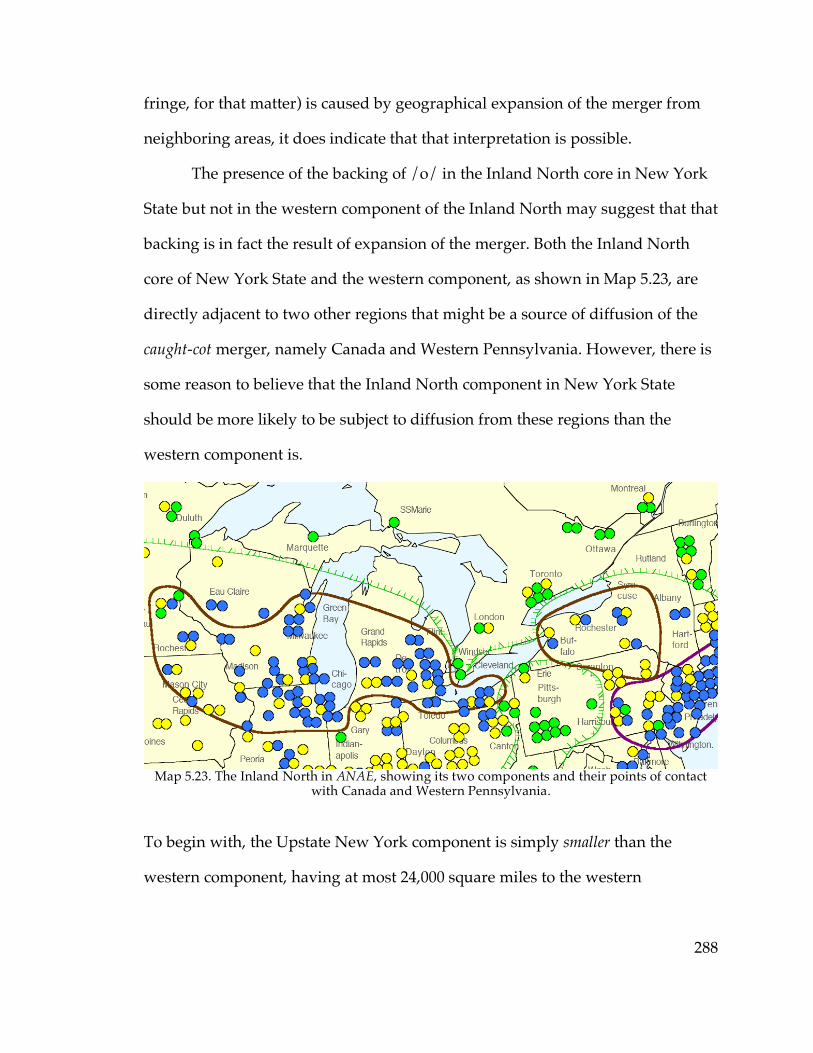
288
fringe, for that matter) is caused by geographical expansion of the merger from
neighboring areas, it does indicate that that interpretation is possible.
The presence of the backing of /o/ in the Inland North core in New York
State but not in the western component of the Inland North may suggest that that
backing is in fact the result of expansion of the merger. Both the Inland North
core of New York State and the western component, as shown in Map 5.23, are
directly adjacent to two other regions that might be a source of diffusion of the
caught-cot merger, namely Canada and Western Pennsylvania. However, there is
some reason to believe that the Inland North component in New York State
should be more likely to be subject to diffusion from these regions than the
western component is.
Map 5.23. The Inland North in ANAE, showing its two components and their points of contact
with Canada and Western Pennsylvania.
To begin with, the Upstate New York component is simply smaller than the
western component, having at most 24,000 square miles to the western
289
component’s at least 60,000 square miles. 18 This means that the communities in
the New York component are simply on average closer to fully-merged regions
than are communities in the western component. Geneva is probably one of the
most distant communities in Upstate New York from fully-merged regions
collectively, being located approximately 110 road miles from the Canadian
border to the west, 150 from the Canadian border to the north, 225 from Vermont
to the east, and 150 from Clinton County, Penna., to the south19; it seems fairly
clear that no place in the Inland North core or fringe in New York State is more
than about 150 miles from at least one fully-merged region. By contrast, for
example, Chicago, Ill. is about 250 miles from the Upper Peninsula of Michigan,
and about 300 from the Canadian border at Detroit, the two closest merged
regions. So to the extent that diffusion of linguistic features is more likely to take
place over shorter geographic distances, we would expect the New York
component of the Inland North, considered as an entire region, to be more
subject to diffusion of the caught-cot merger than the western component.
Moreover, the larger merged cities are also closer to New York State than
to the western component overall. The major Canadian metropolitan areas of
Toronto, Ottawa, and Montréal are all closer to the New York State than to the
western component; and Pittsburgh, the major city of Western Pennsylvania, is at
best about equidistant from the two halves of the Inland North. So to the extent
that linguistic changes are most likely to diffuse from major cities than from 18 The figure of 24,000 includes the area inside the eastern brown isogloss on Map 5.23; that is an overestimate, in that it includes Scranton, Penna., which by the standard used in this dissertation would not be considered part of the Inland North core. The figure of 60,000 excludes the parts of Iowa and Minnesota included in the western brown isogloss; ANAE does not formally include Iowa and Minnesota in the Inland North proper in most contexts. 19 Clinton County is the nearest county to Geneva within the isogloss of caught-cot merger shown by Labov (1994:315).
290
smaller communities, New York State again seems more likely to be subject to
diffusion of the caught-cot merger than the western component is. And finally,
the same applies insofar as changes are more likely to diffuse from larger
communities to smaller communities than vice versa: Pittsburgh is substantially
larger than Buffalo (which is the largest city in Upstate New York), but smaller
than Cleveland, Ohio, the nearest city in the western component, so the direction
of diffusion is more likely to be from Western Pennsylvania to Upstate New York
than from Western Pennsylvania to the western component of the Inland North.
Now, the argument in the foregoing paragraphs that the backing of /o/
seen in the Inland North core is the result of expansion of the influence of the
caught-cot merger from neighboring regions is somewhat sketchy. It might, of
course, simply be the case that the backing of /o/ originated in Upstate New
York for independent reasons, irrespective of the presence of full merger in
adjacent regions, and that the reason the same thing did not occur in the western
component is merely that, despite their shared NCS and settlement history, the
eastern and western Inland North components are disjoint regions in the present
day without a particularly great deal of interaction. It will be argued below,
however, that even if the backing of /o/ is an independent development of the
Upstate New York component of the Inland North core, it still serves as evidence
that the Inland North’s supposed “stable resistance” to the effects of Herzog’s
Principle is an overstatement.

291
5.3.5. The Hudson Valley
The Hudson Valley core was defined in Chapter 4 as the region near the
Hudson River which shows direct phonological influence from New York City.
Based on the analysis of /æ/ patterns, the two cities in the current sample that
were included in that region were Poughkeepsie and Schenectady. With respect
to low-back vowel patterns, however, only Poughkeepsie is included: as
mentioned earlier in this chapter, every analyzed speaker in Poughkeepsie has
mean F1 of /oh/ less than 700 Hz, which is sufficient to classify the city as part of
ANAE’s “raised /oh/” region of resistance to the caught-cot merger. Both
analyzed speakers in Schenectady, however, have mean F1 of /oh/ greater than
700 Hz, so for purposes of studying /oh/ and /o/, Schenectady should not be
included in the same category as Poughkeepsie. Thus in this chapter,
Schenectady will be excluded from consideration as part of the Hudson Valley
core. Within Poughkeepsie alone—and within Poughkeepsie plus the two Telsur
speakers from Albany, the other known Hudson Valley core community—there
is no apparent-time movement in F1 or F2 of /o/ or /oh/ or in the Cartesian
distance between them (p > 0.3 for all correlations). So at least the raised /oh/,
unlike the NCS fronting of /o/, seems to be doing its job in preventing the
influence of the caught-cot merger.
The remainder of the Hudson Valley—we may as well call it the Hudson
Valley “fringe”—is a bit harder to describe, inasmuch as it is a region that is
defined negatively: that is to say, it is defined merely as the region where there is
not strong evidence in the data for raised /oh/, NCS, or caught-cot merger in

292
perception. That means it is not necessarily the case that the communities
assigned to the Hudson Valley fringe form a coherent dialect area that can be
characterized by unified sound changes. It is likely that some of the communities
classified as Hudson Valley fringe communities would have been characterized
as Inland North fringe communities if either somewhat more data had been
collected from them or slightly different arbitrary standards had been used in
defining the classifications used in the current research; they might in actuality
best be described as transitional.
Figure 5.24. Raising of /o/ in apparent time in the Hudson Valley fringe (Amsterdam, Oneonta,
Cobleskill, Fonda, Saratoga Springs, and Schenectady), by gender.
Using this definition of the region, but keeping in mind the caveats
described in the foregoing paragraph, we find that the Cartesian distance
between /o/ and /oh/ is decreasing in apparent time in the Hudson Valley
fringe (r2 ≈ 0.25, p < 0.02; no significant effect of gender). Both raising and
backing of /o/ appear to be involved: both formants of /o/ are significantly
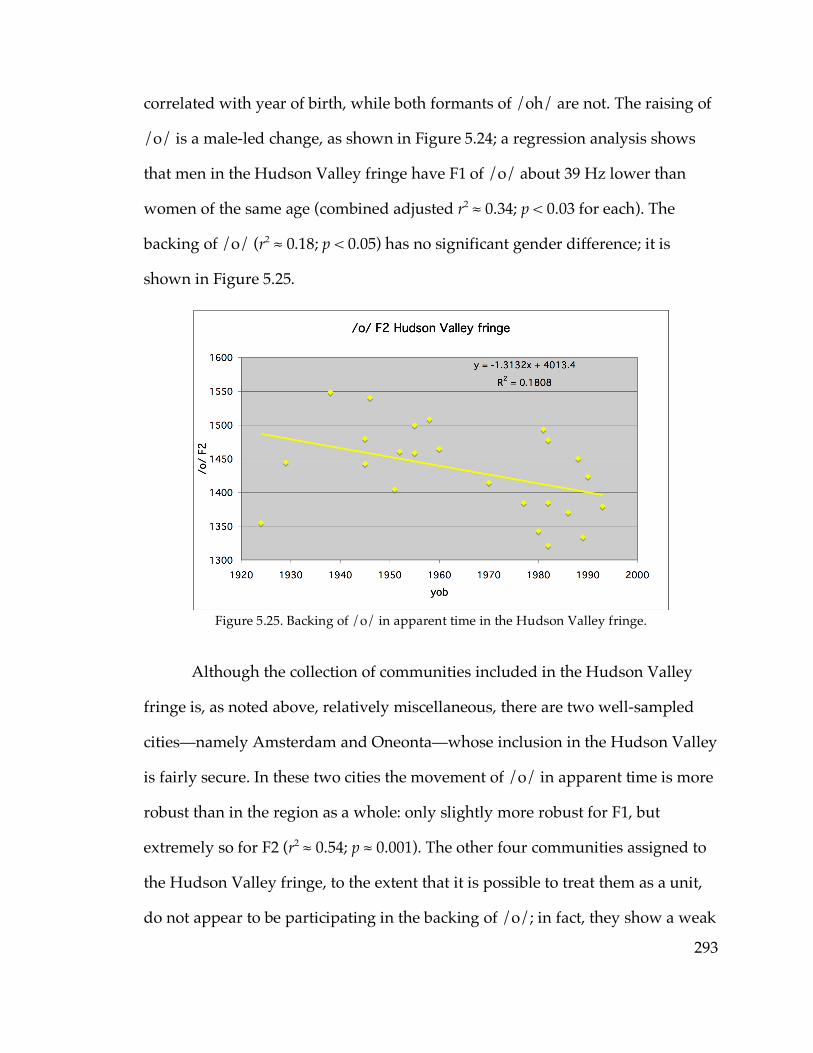
293
correlated with year of birth, while both formants of /oh/ are not. The raising of
/o/ is a male-led change, as shown in Figure 5.24; a regression analysis shows
that men in the Hudson Valley fringe have F1 of /o/ about 39 Hz lower than
women of the same age (combined adjusted r2 ≈ 0.34; p < 0.03 for each). The
backing of /o/ (r2 ≈ 0.18; p < 0.05) has no significant gender difference; it is
shown in Figure 5.25.
Figure 5.25. Backing of /o/ in apparent time in the Hudson Valley fringe.
Although the collection of communities included in the Hudson Valley
fringe is, as noted above, relatively miscellaneous, there are two well-sampled
cities—namely Amsterdam and Oneonta—whose inclusion in the Hudson Valley
is fairly secure. In these two cities the movement of /o/ in apparent time is more
robust than in the region as a whole: only slightly more robust for F1, but
extremely so for F2 (r2 ≈ 0.54; p ≈ 0.001). The other four communities assigned to
the Hudson Valley fringe, to the extent that it is possible to treat them as a unit,
do not appear to be participating in the backing of /o/; in fact, they show a weak
294
(and not statistically significant: r2 ≈ 0.1) correlation in the opposite direction,
towards fronter /o/ in apparent time. The raising of /o/ in F1 is not statistically
significant when restricted to these four communities either, although the
correlation is at least in the right direction.
The backing of /o/ in Amsterdam and Oneonta is led by women, as it is
in the Inland North fringe; in a multiple linear regression, women have /o/
about 51 Hz backer than men (p < 0.05; combined adjusted r2 ≈ 0.54). So the
apparent behavior of /o/ in Amsterdam and Oneonta consists of a gradual trend
toward raising, possibly led by men20, accompanied by a sharper backing, led by
women. The absence of clear movement in /o/ in the data from the other
communities assigned to the Hudson Valley fringe reinforces the impression that
the dialectological affiliation of these other communities is for the most part
ambiguous, or at least not fully determinable from the data.
5.3.6. Sudden sound change?
Above it was noted that the apparent-time movement of F2 of /o/ in the
North Country resembled a sudden drop more than a gradual change: all
speakers born later than 1988 had /o/ backer in F2 than all speakers born earlier
than 1988, with no overlap and no detectable apparent-time change on either
side of the 1988 cutoff. This sudden change was interpreted as representing a
categorical change in the phonological representation of /o/, from an unrounded
to a rounded phoneme. 20 The trend toward raising of /o/ is still present when the data is restricted to Amsterdam and Oneonta; however, the gender effect loses its statistical significance (p > 0.15).
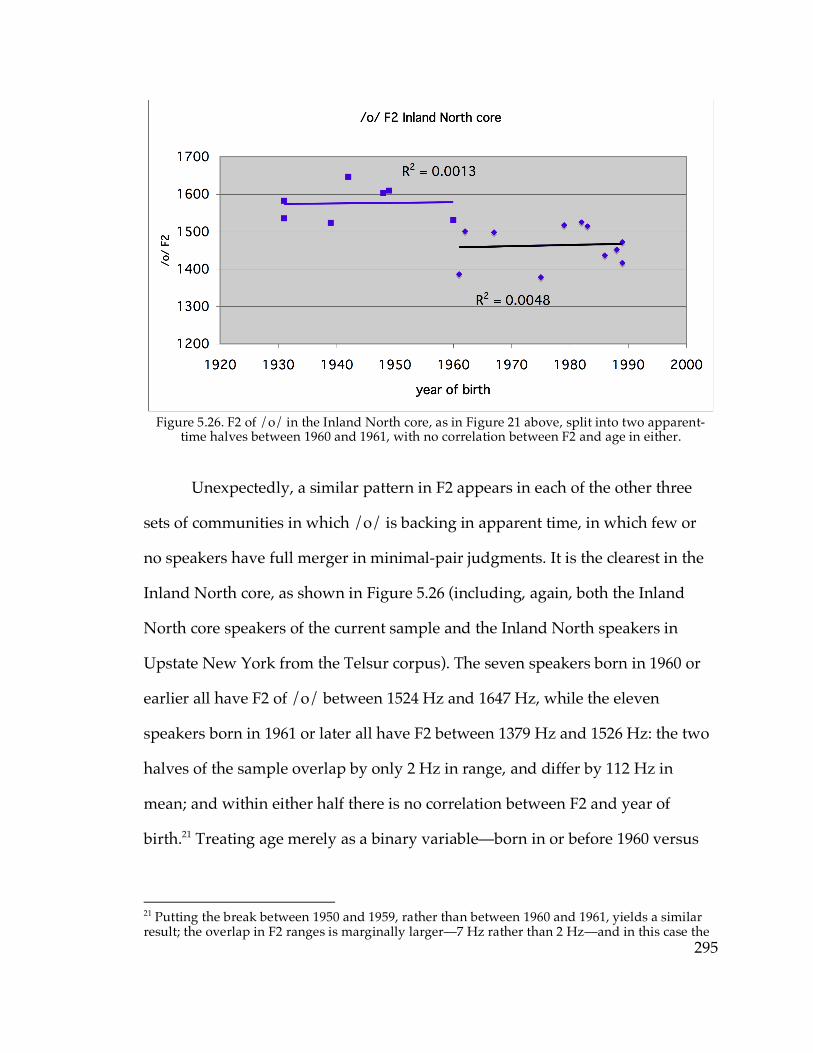
295
Figure 5.26. F2 of /o/ in the Inland North core, as in Figure 21 above, split into two apparent-
time halves between 1960 and 1961, with no correlation between F2 and age in either.
Unexpectedly, a similar pattern in F2 appears in each of the other three
sets of communities in which /o/ is backing in apparent time, in which few or
no speakers have full merger in minimal-pair judgments. It is the clearest in the
Inland North core, as shown in Figure 5.26 (including, again, both the Inland
North core speakers of the current sample and the Inland North speakers in
Upstate New York from the Telsur corpus). The seven speakers born in 1960 or
earlier all have F2 of /o/ between 1524 Hz and 1647 Hz, while the eleven
speakers born in 1961 or later all have F2 between 1379 Hz and 1526 Hz: the two
halves of the sample overlap by only 2 Hz in range, and differ by 112 Hz in
mean; and within either half there is no correlation between F2 and year of
birth.21 Treating age merely as a binary variable—born in or before 1960 versus
21 Putting the break between 1950 and 1959, rather than between 1960 and 1961, yields a similar result; the overlap in F2 ranges is marginally larger—7 Hz rather than 2 Hz—and in this case the
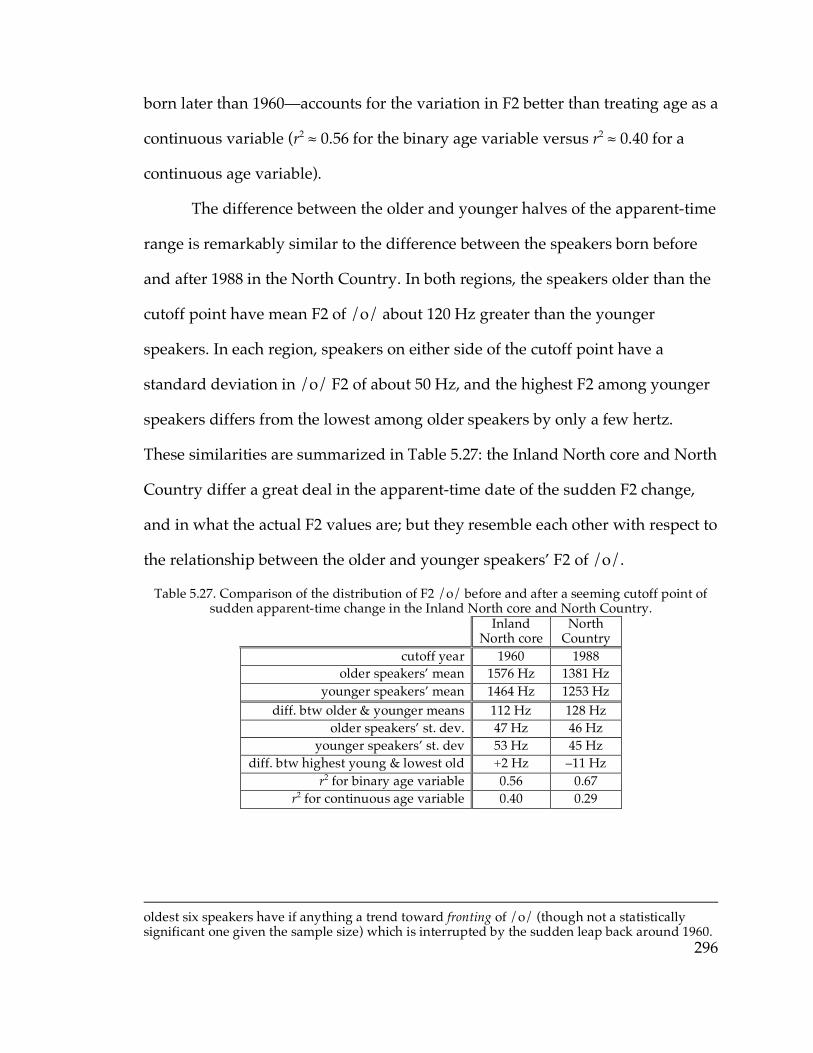
296
born later than 1960—accounts for the variation in F2 better than treating age as a
continuous variable (r2 ≈ 0.56 for the binary age variable versus r2 ≈ 0.40 for a
continuous age variable).
The difference between the older and younger halves of the apparent-time
range is remarkably similar to the difference between the speakers born before
and after 1988 in the North Country. In both regions, the speakers older than the
cutoff point have mean F2 of /o/ about 120 Hz greater than the younger
speakers. In each region, speakers on either side of the cutoff point have a
standard deviation in /o/ F2 of about 50 Hz, and the highest F2 among younger
speakers differs from the lowest among older speakers by only a few hertz.
These similarities are summarized in Table 5.27: the Inland North core and North
Country differ a great deal in the apparent-time date of the sudden F2 change,
and in what the actual F2 values are; but they resemble each other with respect to
the relationship between the older and younger speakers’ F2 of /o/.
Table 5.27. Comparison of the distribution of F2 /o/ before and after a seeming cutoff point of sudden apparent-time change in the Inland North core and North Country.
Inland North core
North Country
cutoff year 1960 1988 older speakers’ mean 1576 Hz 1381 Hz
younger speakers’ mean 1464 Hz 1253 Hz diff. btw older & younger means 112 Hz 128 Hz
older speakers’ st. dev. 47 Hz 46 Hz younger speakers’ st. dev 53 Hz 45 Hz
diff. btw highest young & lowest old +2 Hz –11 Hz r2 for binary age variable 0.56 0.67
r2 for continuous age variable 0.40 0.29
oldest six speakers have if anything a trend toward fronting of /o/ (though not a statistically significant one given the sample size) which is interrupted by the sudden leap back around 1960.
297
In the North Country, the sudden change in F2 around 1988 was
explained as being the result of a categorical shift of /o/ from rounded to
unrounded. Despite the strikingly similar apparent-time profile of the sudden
change in F2 around 1960 in the Inland North core, it’s hard to come up with a
comparably satisfying phonological explanation for it. There is no clear structural
difference between younger and older Inland North core speakers’ vowel
systems, or the relationship of /o/ to the other vowels in them. For example, all
18 speakers are subject to the NCS, and have either triangular vowel systems (as
discussed in Chapter 4) or quadrilateral systems with /o/ and /oh/ as the two
low vowels instead of /æ/ and /o/. There are speakers with both positive and
negative EQ1 indices among both the older and younger groups; the same is true
of both triangular and low-/oh/ quadrilateral vowel structures. From viewing
the speakers’ vowel systems holistically, it is not immediately obvious that the
younger speakers have consistently backer /o/ than the older speakers; it only
becomes evident when the /o/ data is isolated as in Figure 5.26. For this reason,
it is tempting to dismiss the apparent suddenness in the backing of /o/ as
merely an odd but accidental characteristic of the data. Nevertheless, the notion
of sudden backing of /o/ is also supported, though weakly, in the Inland North
fringe and the Hudson Valley fringe.
As Figure 5.28 shows, there is a gap in apparent time in the sample of
Oneonta and Amsterdam; no speakers born between 1961 and 1976 were
interviewed in either city. That leaves two age clusters in the Amsterdam and
Oneonta sample: seven older speakers, born between 1945 and 1960, and nine
younger speakers, born between 1977 and 1993. The contrast between these two

298
age clusters’ F2 of /o/ is relatively sharp, and reminiscent of the contrast
between the age clusters of the Inland North core and the North Country: the
difference between the older and younger speakers’ mean /o/ F2 is 103 Hz; the
standard deviation within each age cluster is approximately 42 Hz; and there is
no hint of backing in apparent time within either cluster. The two clusters have a
fairly small overlap in /o/ F2—all of the younger speakers have F2 of 1451 Hz or
less, while all of the older speakers except one (Marilyn R. from Amsterdam,
who was born in 1951 and has mean /o/ F2 of 1405 Hz) have 1461 Hz or more.
To put it another way, the overlap between the older and younger speakers only
occupies a range of about 50 Hz.
Figure 5.28. F2 of /o/ in Amsterdam and Oneonta, split into two apparent-time halves.
Obviously the large gap in the apparent-time distribution of the sample
prevents us from concluding that there was a sudden F2 change here the way
there appears to have been in the Inland North core or the North Country; it may
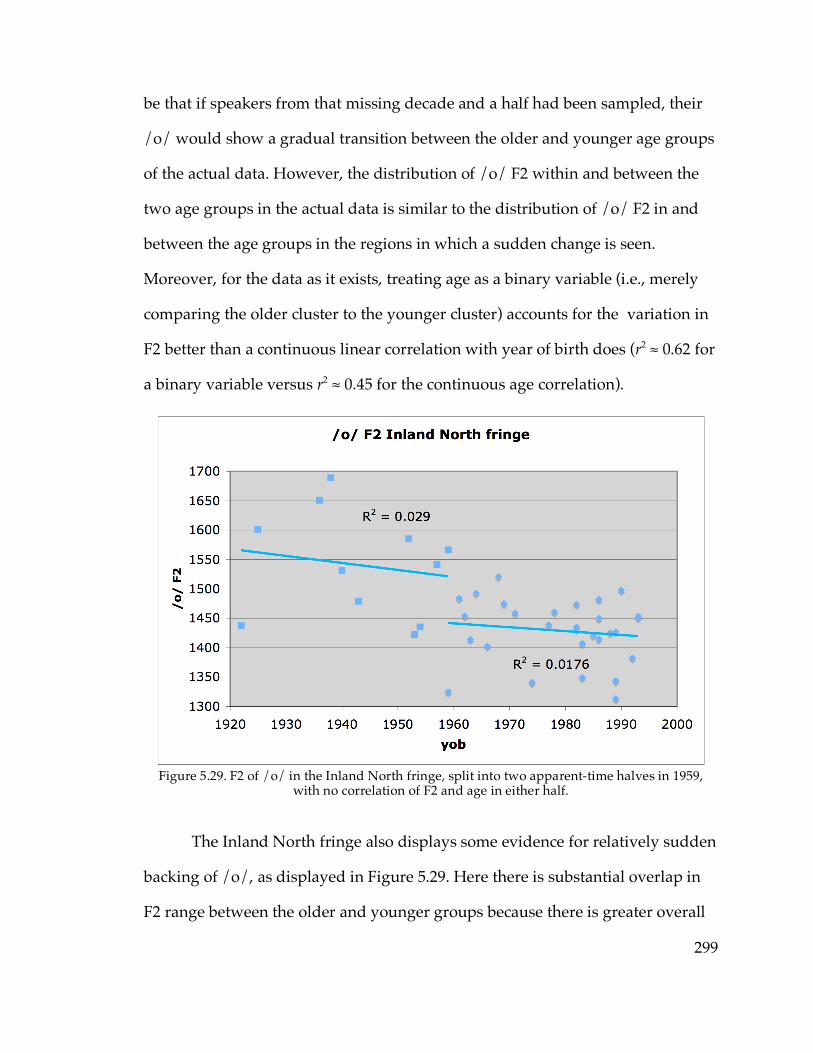
299
be that if speakers from that missing decade and a half had been sampled, their
/o/ would show a gradual transition between the older and younger age groups
of the actual data. However, the distribution of /o/ F2 within and between the
two age groups in the actual data is similar to the distribution of /o/ F2 in and
between the age groups in the regions in which a sudden change is seen.
Moreover, for the data as it exists, treating age as a binary variable (i.e., merely
comparing the older cluster to the younger cluster) accounts for the variation in
F2 better than a continuous linear correlation with year of birth does (r2 ≈ 0.62 for
a binary variable versus r2 ≈ 0.45 for the continuous age correlation).
Figure 5.29. F2 of /o/ in the Inland North fringe, split into two apparent-time halves in 1959,
with no correlation of F2 and age in either half.
The Inland North fringe also displays some evidence for relatively sudden
backing of /o/, as displayed in Figure 5.29. Here there is substantial overlap in
F2 range between the older and younger groups because there is greater overall
300
variability in backness of /o/—speakers born later than 195922 range from
1313 Hz to 1521 Hz, while older speakers range from 1422 to 1689. However, the
difference between the means of the older and younger speakers is 111 Hz,
roughly the same as the difference between the older and younger F2 means in
the Inland North core, the Hudson Valley fringe, and the North Country.
So yet again, the entire range over which F2 of /o/ varies seems to have
suddenly shifted backward by slightly more than 100 Hz, with no correlation
between F2 and year of birth on one side of the jump or the other. Again,
modeling the effect of age as a simple binary opposition between older and
younger speakers accounts for more of the variation in /o/ (r2 ≈ 0.38) than does
modeling F2 as a linear function of year of birth (r2 ≈ 0.33). In the Inland North
fringe, the issue is confused somewhat by the undersampling of women in the
older age group; however, restricting this analysis to male speakers yields
substantially comparable results: a difference between older and younger
speakers of 128 Hz; better r2 from binary than continuous age variable (this time
0.65 versus 0.56); no correlation between year of birth and F2 on either side of the
1959 line (r2 < 0.09 for both).
In the Inland North fringe, like the Inland North core, there is no clear
phonological correlate of the sudden-seeming phonetic change. Younger
22 Selecting the point in apparent time to split the sample is slightly tricky: there are two Inland North fringe speakers whose year of birth is coded as 1959, of whom one (Dan L. from Ogdensburg) has a relatively front /o/ at 1566 Hz, and the other (Betty C. from South Glens Falls) has a relatively back /o/ at 1325 Hz. However, whereas Betty C. stated that she was born in 1959, what Dan L. said—in his interview on August 20, 2008—was that he was 49 years old. Given this, there is a 36% chance that Dan was actually born in 1958, which adds up to an 80% chance that he is older than Betty C. Based on that, it seems arguably justified to place the apparent-time division between Dan and Betty; doing so creates the sharpest division in F2 between older and younger speakers, and that is the division I use in this discussion. Including Dan L. in the younger group, however, would not substantially change the character of the results here.
301
speakers are no less likely than older speakers to have triangular vowel systems
or to exhibit NCS features, and no change in the relationship of /o/ to other
vowels is suggested by impressionistic examination of the vowel charts of Inland
North fringe speakers. In Oneonta, and perhaps to a lesser extent Amsterdam,
the younger speakers are in fact more likely to have quadrilateral vowel systems
and the older speakers triangular systems.
Because of gaps in the apparent-time distribution of the data, it is not
possible to identify the date of the “sudden” backing of /o/ with equal precision
in all regions. In the North Country, 1988 is clearly the only possibility; and in
the Inland North fringe, 1959 gives the best results. In Amsterdam and Oneonta,
the break could be anywhere between 1961 and 1976; in the Inland North core, a
break between 1960 and 1961 gives the cleanest results, but it could be placed as
early as 1950 without changing much. However, outside the North Country,23 a
date within one or two years of 1960 works for all of them. This suggests that it is
possible that this sudden backing of /o/ occurred essentially simultaneously in
all parts of Upstate New York where the caught-cot merger was not already
substantially in progress. If we do not assume the backing of /o/ occurred
simultaneously throughout the state, then it must have happened first in the
Inland North core and last in the Hudson Valley fringe—much in the same way
that it was conjectured Chapters 3 and 4 that the NCS fronting of /o/ diffused
from the Inland North core to the fringe and the Hudson Valley. 23 A previous discussion of this data (Dinkin 2008b) suggested a sudden backing around 1960 in apparent time in the North Country also. However, that analysis grouped Telsur speakers in western Massachusetts and in Scranton, Penna., who also showed transitional minimal-pair judgments, with North Country speakers as a general category of “communities where the caught-cot merger is well in progress”. This is unsupportable on strict dialectological grounds, however, and the data from the North Country alone is not sufficient to show a sudden change in /o/ around that apparent time if it does exist.
302
A phonological reason, if any, for the suddenness of the backing of /o/ is
difficult to think of. As noted above, it appears to correlate with a shift from
triangular to quadrilateral vowel systems in the Hudson Valley fringe, but not in
the Inland North. The possibility must be entertained that the backing of /o/
was in fact not a sudden categorical change but a gradual change that appears
sudden in the apparent-time data. As Labov (2001:449) notes, the linear
correlation between year of birth and progression of sound change is an
oversimplified model; “many convergent findings indicate that linguistic change
follows a logistic progression… in which change starts out slowly, reaches a
maximum rate at mid-course, and slows down again asymptotically at the end.”
The apparent sudden change in /o/ in apparent time in Upstate New York may
well be merely a manifestation of a continuous logistic change with messy data.
With a sufficiently fast (albeit gradual) slope of change, and variation or
error within the data that is sufficiently large relative to the magnitude of the
change, a change that follows a logistic curve can end up looking like a sudden
change between earlier and later segments, with no discernable change within
either segment. Figure 5.30 displays a simple example of a logistic curve with
noise looking like a sudden change in the same way as the data on /o/-backing
from Upstate New York looks like a sudden change. So what we are dealing with
here may not actually be a sudden phonological change, but a gradual phonetic
change whose progress is obscured by its rapidity, by gaps in the apparent-time
coverage of the data, and by other sources of variation. In fact, inasmuch as no
consistent direct phonological correlates of the backing of /o/ are apparent, it
seems more likely that it originated as a rapid but gradual change throughout
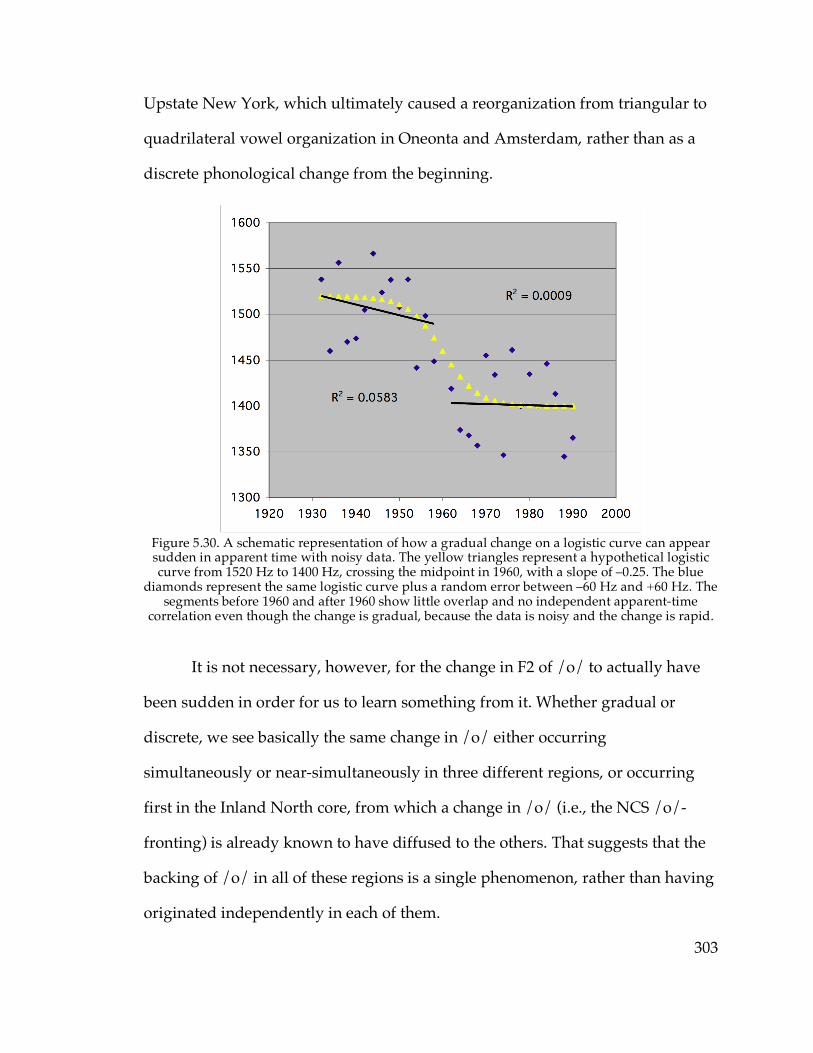
303
Upstate New York, which ultimately caused a reorganization from triangular to
quadrilateral vowel organization in Oneonta and Amsterdam, rather than as a
discrete phonological change from the beginning.
Figure 5.30. A schematic representation of how a gradual change on a logistic curve can appear sudden in apparent time with noisy data. The yellow triangles represent a hypothetical logistic curve from 1520 Hz to 1400 Hz, crossing the midpoint in 1960, with a slope of –0.25. The blue
diamonds represent the same logistic curve plus a random error between –60 Hz and +60 Hz. The segments before 1960 and after 1960 show little overlap and no independent apparent-time
correlation even though the change is gradual, because the data is noisy and the change is rapid.
It is not necessary, however, for the change in F2 of /o/ to actually have
been sudden in order for us to learn something from it. Whether gradual or
discrete, we see basically the same change in /o/ either occurring
simultaneously or near-simultaneously in three different regions, or occurring
first in the Inland North core, from which a change in /o/ (i.e., the NCS /o/-
fronting) is already known to have diffused to the others. That suggests that the
backing of /o/ in all of these regions is a single phenomenon, rather than having
originated independently in each of them.

304
The three regions being considered here—the Inland North core and
fringe and Hudson Valley fringe—differ in their degree of participation in the
NCS, as has been well established in Chapters 3 and 4. In the Inland North core,
all speakers sampled show robust effects of the NCS; in the Inland North fringe,
participation in the NCS is more variable and there is evidence that the NCS
diffused there rather than arising there naturally; in the Hudson Valley fringe,
/o/ is fronted and /e/ is backed, but substantial raising of /æ/ is not found.
Although /o/ may not be as front in the Hudson Valley fringe as it is in the
Inland North regions, it still seems front enough to fall into ANAE’s category of
resistance to the caught-cot merger: six of the seven speakers in the older cluster
in Figure 5.28 above have F2 of /o/ fronter than 1450 Hz, which is the criterion
used in ANAE to identify the North as a region of resistance.
The findings of this section, however, suggest that the apparent resistance
to the spread of the merger identified by ANAE in the Inland North is really an
illusion. Having /o/ fronter than 1450 Hz is not sufficient to prevent a sound
change that narrows the distance between /o/ and /oh/ in Amsterdam and
Oneonta; having /o/ fronter than 1450 Hz in conjunction with other NCS sound
changes is not enough to prevent it, as in the Inland North fringe; and having the
entire NCS chain-shift structure is not enough to prevent it, as in the Inland North
core. In fact, if anything, the backing of /o/ took place first in the Inland North
core—the region which the ANAE analysis seems to suggest should be the most
resistant to backing of /o/, because the entire phonological system ought to be
organized in a way that reinforces the frontness of /o/. So if even the part of the
Inland North that ought to be most resistant to caught-cot merger can be subject
305
to a rapid backing of /o/ towards /oh/, it seems that neither the frontedness of
/o/ alone nor the NCS as a general phonological system is capable of preventing
the progress of the caught-cot merger.
Strictly speaking, we have not actually established that the reason for the
backing of /o/ in Upstate New York is the expansion of the caught-cot merger. It
is still conceivable, after all, that the backing of /o/ might have originated
independently in the New York State component of the Inland North core, with
no particular influence from merged communities; Labov (to appear) points out
that low vowels have been relatively free to move back and forth between
relatively front and relatively back positions at multiple times throughout the
history of English with no particular external stimulus. However, even if that is
the case, then the fact that /o/ is free to rapidly move back 120 Hz basically of its
own accord in the Inland North would seem to undermine anyhow the idea that
the Inland North’s fronted /o/ is supposed to be able to resist influence from the
caught-cot merger: if /o/ is able to be moved back without even the effect of
diffusion from merged communities, surely it should be even more susceptible to
backing when there is direct influence from the merger. So we can conclude from
this that ANAE’s characterization of the Inland North as a region that resists the
caught-cot merger was somewhat rash: rather than having a phonological system
that actively resists the merger, it was merely a region that, as of the Telsur data
set, had not happened to be directly influenced by the merger yet. In any event,
the next section will display more direct evidence for ongoing caught-cot merger
in Upstate New York beyond the North Country.
306
5.4. Phonological transfer before preconsonantal /l/
5.4.1. Mechanisms of merger
Herold (1990) discusses two mechanisms by which merger can take place,
and introduces a third herself. These three mechanisms are as follows:
• Merger by approximation. The two phonemes which are in the
process of merging move toward each other in phonetic space
gradually over time via regular phonetic change; the merger is
completed when the phonetic distance between the two original
phonemes gets sufficiently close to zero.
• Merger by transfer. Individual words that historically contained one
of two phonemes begin one at a time to be pronounced with the other.
The merger is completed when all of the words from one class have
been moved to the other.
• Merger by expansion. This third type of merger, discovered by Herold
in Tamaqua, Penna., goes to completion very rapidly. Whereas in
merger by approximation the contrast between the two phonemes
remains while the merger is in progress up until they are too close in
F1/F2 space to be discriminated, and in merger by transfer the contrast
remains as long as at least one word remains in each category, in
merger by expansion the phonemic contrast is lost immediately, and
all the words with either historical phoneme come to be distributed
across the entire region of phonetic space formerly occupied by both of
them.

307
Labov (1994) states that mergers that proceed by approximation are most
likely to be those that occur as the result of general principles of vowel
movement, whereas mergers by transfer are likely to be the result of change from
above the level of consciousness, away from a phonemic contrast that is not
made in the standard language. Herold suggests that merger by expansion can
be attributed to a sudden large increase in contact with speakers who do not
have the contrast.
These three mechanisms of merger are not entirely independent; it is
possible for two (or more) of these mechanisms to be involved in a single case of
merger, or for one to evolve into another. For example, Johnson (2007) argues
that, in communities on the Massachusetts–Rhode Island border, the caught-cot
merger goes to completion suddenly once the proportion of children in a given
community whose parents were natives of merging regions exceeds a certain
threshold. The data he presents suggests that merger by approximation and
merger by expansion are both involved in this process: the younger children in
Seekonk, Mass. who have full merger have both older siblings and parents who
consistently maintain the /o/~ /oh/ distinction, but the parents have /o/~/oh/
separated by a much wider distance in F1/F2 space than the older siblings do. So
what appears to have happened in Seekonk is that the merger began to proceed
by approximation sometime between the parents’ generation and the older
siblings’ generation, but once the population of children with merged parents in
the community had become sufficiently large, the younger siblings lost the
distinction completely in a case of merger by expansion.
308
Herold (1990:53–54) mentions a variant form of merger by transfer that we
may call phonological transfer, characterizing it as follows: “phonologically
conditioned two-way transfer in which all words with a following /l/, for
example, are transferred into the set of words pronounced with X, while words
with a following /p/ are transferred into the Y set.” In other words, rather than
individual lexical items being transferred one at a time from one phonemic class
to the other until the merger is complete, entire phonological classes are
transferred simultaneously. While merger by transfer is in progress, the
phonological contrast still exists, with in principle as great a phonetic distance
between the two phonemes as it’s always had; the same is true in cases of
phonological transfer. In phonological transfer, however, the phonemic
distinction is weakened because it no longer exists in certain contexts. For
example, if all words with a following /l/ are transferred into phonological class
Y, in Herold’s example, phonemes X and Y are no longer contrastive before
/l/—they have undergone a conditioned merger (which may, of course,
continue on towards becoming a full merger by means of additional
phonological transfer or any other merger mechanisms, but doesn’t have to). Of
course, phonological transfer is not the only route to conditioned merger. If a
merger is in progress by approximation, then as Harris (1985:332, quoted by
Herold) puts it, “some allophonic subsets of a particular phoneme may show a
greater propensity than others for overlap with allophones of a neighbouring
phoneme”. In other words, if two phonemes are approaching each other through
regular phonetic change, then if a certain phonetic environment is most

309
advanced in the change in both directions, the phonemes will merge in that
phonetic environment first.
In Bermúdez-Otero (2007)’s model of the life cycle of phonological change,
the relationship between (conditioned) merger by phonological transfer and
merger by approximation is clear: phonological approximation is merely the
result of phonological restructuring of the phonetic subregularities of the gradual
phonetic approximation. To unpack that: in a case of merger by approximation,
or any other gradual phonetic change, some phonetic environments will be
somewhat more advanced in the change, and others somewhat less advanced;
the position of each allophone within the general distribution of the phoneme in
phonetic space is, in Bermúdez-Otero’s words, “exquisitely sensitive to a broad
range of properties of its phonetic environment”. Let us suppose, as in Herold’s
example, that the closest allophone of phoneme X to Y in phonetic space is the
allophone before /l/— for the sake of concreteness, let’s suppose that that Y is
backer than X and thus X’s allophone before /l/ is the backest allophone in X’s
phonetic distribution. If this phonetically gradient rule should undergo what
Bermúdez-Otero terms restructuring, it will become a discrete phonological rule:
instead of the pre-lateral allophone of X being merely the backest part of the
phonetic range of X, it will move to a distinct position in phonetic space,
represented by a different set of phonological features. And if X and Y are
sufficiently close, that set of phonological features may simply be the features of
Y, so the words that formerly contained the allophone of X before /l/ now
contain the allophone of Y before /l/. This all seems fairly trivial, but it actually
makes two concrete predictions about the behavior of allophones in a case of
310
merger by phonological transfer. First, a phonetic environment in which merger
by phonological transfer occurs will be one in which, before restructuring, the
allophones of the original phoneme were closest to merger already—e.g., if X
before /l/ has merged into Y by phonological transfer, then prior to the
phonological transfer the allophones of X before /l/ must already have been the
closest allophones to Y in phonetic space. And second, after phonological
transfer has taken place, there will be no distinction within the phonetic
distribution of the target phoneme between tokens of the two historical
phonemes—e.g., words that originally contained X before /l/ will appear among
the other tokens of Y before /l/, not necessarily on the side of Y’s phonetic extent
closest to X.
According to ANAE, the caught-cot merger is more advanced in North
American English as a whole before /n/ than in the other environments tested
by the Telsur project; but it does not state whether the merger before /n/ takes
place by means of approximation or phonological transfer. The apparent-time
movement of /o/ found in the previous section suggests that the caught-cot
merger in Upstate New York is proceeding by approximation. In this section,
however, I will examine the role of phonological transfer in the merger.
5.4.2. Definition and motivation of (olC)
Earlier in this chapter, a few speakers whose /o/~/oh/ distributions were
presented in detail were seen to have tokens of the word revolve, which
historically and according to dictionaries contains /o/, among tokens of /oh/.
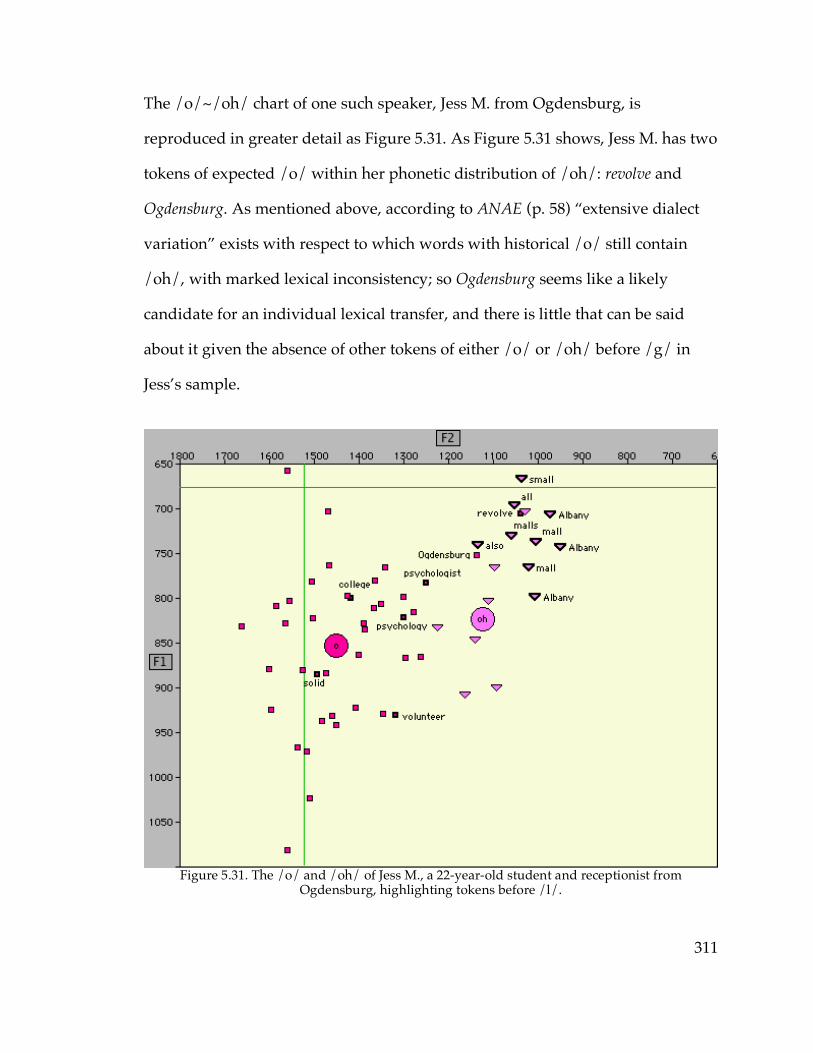
311
The /o/~/oh/ chart of one such speaker, Jess M. from Ogdensburg, is
reproduced in greater detail as Figure 5.31. As Figure 5.31 shows, Jess M. has two
tokens of expected /o/ within her phonetic distribution of /oh/: revolve and
Ogdensburg. As mentioned above, according to ANAE (p. 58) “extensive dialect
variation” exists with respect to which words with historical /o/ still contain
/oh/, with marked lexical inconsistency; so Ogdensburg seems like a likely
candidate for an individual lexical transfer, and there is little that can be said
about it given the absence of other tokens of either /o/ or /oh/ before /g/ in
Jess’s sample.
Figure 5.31. The /o/ and /oh/ of Jess M., a 22-year-old student and receptionist from
Ogdensburg, highlighting tokens before /l/.

312
However, revolve is a likely case for phonological transfer. It satisfies both
of the expected allophonic criteria for phonological transfer mentioned at the end
of the previous subsection: First, the position before coda /l/ is an environment
which produces back allophones of many vowel phonemes, as is documented
thoroughly in ANAE with respect to /ow/ and /uw/ in particular, so it is to be
expected that a word like revolve would be among the backest tokens of /o/ if it
were to be among tokens of /o/ at all. And second, revolve is quite clearly found
among a large cluster tokens of /oh/ before /l/—some word-final, such as all
and small, and some preconsonantal, such as Albany—and not at all close to other
tokens of /o/, whether before /l/ or otherwise; indeed, revolve is among the
highest and backest /oh/ tokens. It would be implausible to claim that this high,
back revolve merely contains an extremely high and back token of /o/;
everything about its phonetic position suggests that revolve contains /oh/ for Jess
M. So the phonetic environment of revolve is a good candidate in which to look
for merger in progress by phonological transfer. For Jess M. at least, /o/ before
intervocalic /l/ does not become /oh/: solid, college, volunteer, and psychology all
clearly have /o/, not /oh/. So the environment of interest is specifically a
following preconsonantal /l/24, which we can refer to by the notation (olC).
The sample contains a total of 86 tokens of (olC). This includes fully 53
tokens of revolve, which was used as a wordlist item in several of the
communities studied. It also includes three tokens of resolve and one of evolve
24 Word-final /l/ is not considered in the present analysis because only one word containing /o/ before word-final /l/ (namely doll) was produced by any of the speakers sampled; it was included in the formal methods in Oneonta and Watertown. Several speakers appear to have /oh/ in doll, but inasmuch as there are no other words with /o/ before word-final /l/ in the data, it is not strictly possible to tell if this is the result of phonological transfer or individual lexical transfer.

313
(each of them a misreading of the wordlist item revolve), eleven of involved, two of
involvement, 14 of golf, and one each of involving and volcano.25 Revolve was a
wordlist item in eight communities—Canton, Cooperstown, Ogdensburg,
Oneonta, Plattsburgh, Poughkeepsie, Sidney, and Watertown—and therefore we
have at least one (olC) token from each in-person interview subject in each of
those communities (including Kerri B. from Morrisonville, who was interviewed
in Plattsburgh), and can get a relatively clear picture of the status of the variable
in them. In addition, between one and three speakers produced at least one token
of (olC) in each of Amsterdam, Cobleskill, Glens Falls, Gloversville, and Utica.
For each token, we can judge whether it remains /o/ or has been
transferred to /oh/ based on whether it appears among other tokens of /oh/
before /l/, and/or higher and backer than the mean /oh/. If (for instance)
revolve appears lower and fronter than mean /oh/ and relatively close to other
tokens of /o/, while most tokens of /oh/ before /l/ are higher and backer than
the mean, revolve will be considered to still contain /o/. Speakers for whom the
caught-cot merger is already complete, to the extent that the highest and backest
tokens of /oh/ occupy the same area of phonetic space as those of /o/, are
excluded.
25 For all but one of these tokens, the consonant after /l/ is /f/ or /v/. Therefore it may be that the environment of interest here is not /ol/ before a consonant in general, but before a labiodental fricative in particular. The analysis of phonological transfer is obviously not affected by this choice.
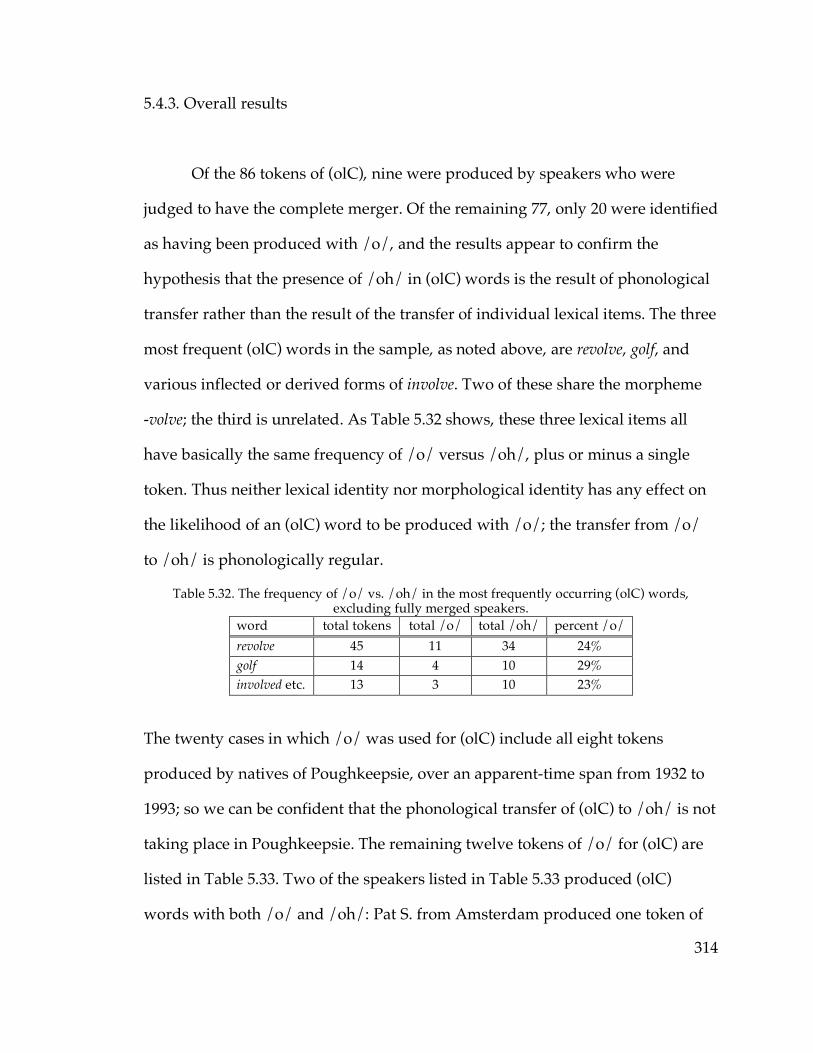
314
5.4.3. Overall results
Of the 86 tokens of (olC), nine were produced by speakers who were
judged to have the complete merger. Of the remaining 77, only 20 were identified
as having been produced with /o/, and the results appear to confirm the
hypothesis that the presence of /oh/ in (olC) words is the result of phonological
transfer rather than the result of the transfer of individual lexical items. The three
most frequent (olC) words in the sample, as noted above, are revolve, golf, and
various inflected or derived forms of involve. Two of these share the morpheme
-volve; the third is unrelated. As Table 5.32 shows, these three lexical items all
have basically the same frequency of /o/ versus /oh/, plus or minus a single
token. Thus neither lexical identity nor morphological identity has any effect on
the likelihood of an (olC) word to be produced with /o/; the transfer from /o/
to /oh/ is phonologically regular.
Table 5.32. The frequency of /o/ vs. /oh/ in the most frequently occurring (olC) words, excluding fully merged speakers.
word total tokens total /o/ total /oh/ percent /o/ revolve 45 11 34 24% golf 14 4 10 29% involved etc. 13 3 10 23%
The twenty cases in which /o/ was used for (olC) include all eight tokens
produced by natives of Poughkeepsie, over an apparent-time span from 1932 to
1993; so we can be confident that the phonological transfer of (olC) to /oh/ is not
taking place in Poughkeepsie. The remaining twelve tokens of /o/ for (olC) are
listed in Table 5.33. Two of the speakers listed in Table 5.33 produced (olC)
words with both /o/ and /oh/: Pat S. from Amsterdam produced one token of
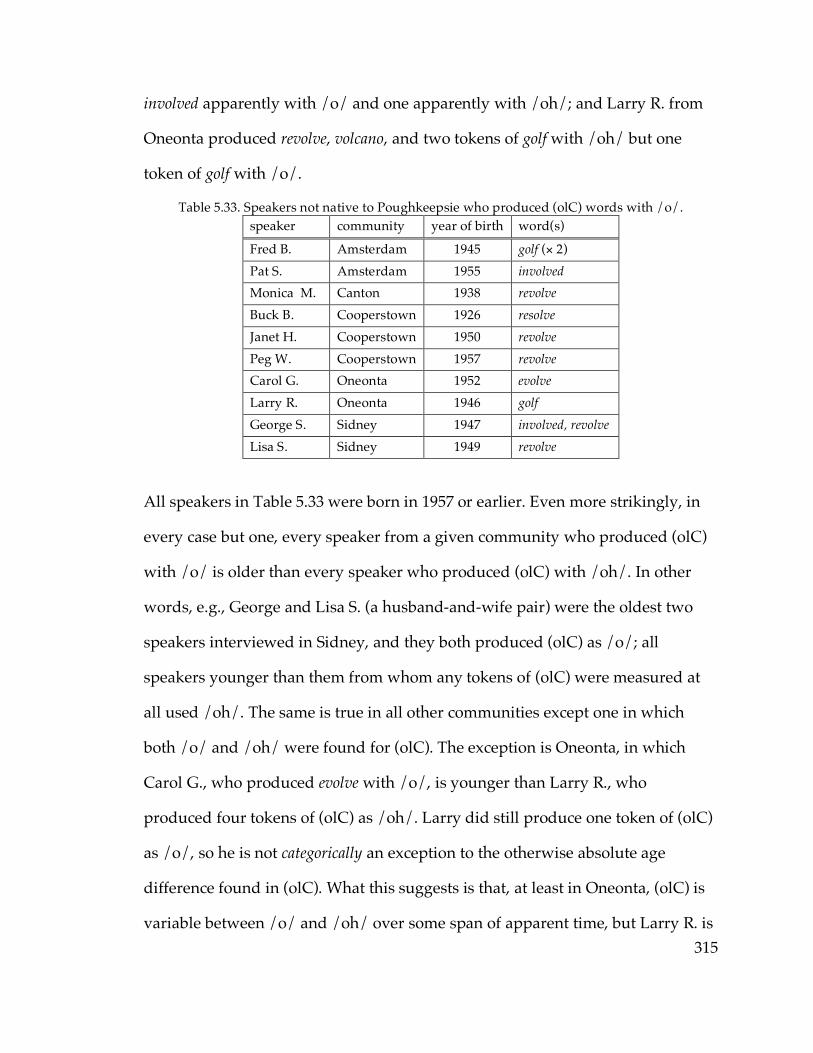
315
involved apparently with /o/ and one apparently with /oh/; and Larry R. from
Oneonta produced revolve, volcano, and two tokens of golf with /oh/ but one
token of golf with /o/.
Table 5.33. Speakers not native to Poughkeepsie who produced (olC) words with /o/. speaker community year of birth word(s)
Fred B. Amsterdam 1945 golf (× 2) Pat S. Amsterdam 1955 involved Monica M. Canton 1938 revolve Buck B. Cooperstown 1926 resolve Janet H. Cooperstown 1950 revolve Peg W. Cooperstown 1957 revolve Carol G. Oneonta 1952 evolve Larry R. Oneonta 1946 golf George S. Sidney 1947 involved, revolve Lisa S. Sidney 1949 revolve
All speakers in Table 5.33 were born in 1957 or earlier. Even more strikingly, in
every case but one, every speaker from a given community who produced (olC)
with /o/ is older than every speaker who produced (olC) with /oh/. In other
words, e.g., George and Lisa S. (a husband-and-wife pair) were the oldest two
speakers interviewed in Sidney, and they both produced (olC) as /o/; all
speakers younger than them from whom any tokens of (olC) were measured at
all used /oh/. The same is true in all other communities except one in which
both /o/ and /oh/ were found for (olC). The exception is Oneonta, in which
Carol G., who produced evolve with /o/, is younger than Larry R., who
produced four tokens of (olC) as /oh/. Larry did still produce one token of (olC)
as /o/, so he is not categorically an exception to the otherwise absolute age
difference found in (olC). What this suggests is that, at least in Oneonta, (olC) is
variable between /o/ and /oh/ over some span of apparent time, but Larry R. is
316
the only speaker sampled in this city26 who produced enough tokens for
variation to appear.
Although it is hard to say anything about intra-speaker variation in (olC),
inasmuch as only two speakers produced it, at least we can say that there is
probably no effect of style on the choice of /o/ or /oh/ for (olC): 27% (thirteen)
of the 49 word-list tokens of (olC) used /o/, as did a basically-identical 25%
(seven) of the 28 spontaneously produced tokens.27 Again, the intra-speaker
variation cannot merely be attributed to lexical diffusion, where some words get
shifted to /oh/ for some speakers while other words remain unshifted; the two
speakers who show variation both show variation within an individual lexical
item.
5.4.4. Phonological transfer by region
It is possible that the transfer of (olC) from /o/ to /oh/ is not related to
the caught-cot merger, but is rather an independent phonological change—much
as the transfer of /o/ before voiceless fricatives to /oh/ (as in cross) in the
prehistory of American English cannot be considered to be evidence that the
caught-cot merger was in progress at that time. Several facts, however, indicate
that the transfer of (olC) in Upstate New York is indeed part of the merger in
progress. Most obvious is the complete absence of /oh/ for (olC) in
26 Keith M. from Sidney, born in 1958, produced five tokens of (olC), all /o/. 27 It is conceivable, given that golf and involve were only produced spontaneously and revolve only in word-list style, that style and lexical identity interact in a manner that is invisible in the data. For example, the word revolve might strongly favor the use of /o/, while word-list style strongly disfavors it in a way the exactly cancels out the effect. I see no reason to take this possibility seriously.
317
Poughkeepsie, a Hudson Valley core community in which /oh/ is raised to have
F1 less than 700 Hz for all sampled speakers and in which there is no evidence of
backing of /o/ or narrowing of /o/~/oh/ Cartesian distance in apparent time.
On the other hand, of the regions where sufficient data exists to tell, the
transfer of (olC) to /oh/ is the most complete in the Inland North fringe: no
Inland North fringe speaker produced a single measured token of (olC) as /o/.
And the Inland North fringe is, apart from the North Country, the region where
the caught-cot merger is most advanced in perception, having six speakers with
transitional minimal-pair judgments. In the North Country itself, only one
speaker shows /o/ for (olC)—namely Monica M. from Canton, who is the oldest
speaker in the North Country sample and apparently predates the caught-cot
merger in the region, and who is from the one of the two well-sampled North
Country communities where the merger is slightly less complete than the other.
So the relative dialectological distribution of /o/ and /oh/ for (olC) suggests
that the use of /oh/ is correlated with the influence of the caught-cot merger.
The apparent-time evidence points in the same direction: as far as the data
indicates, the shift of (olC) to /oh/ appears to have gone to completion
everywhere except Poughkeepsie sometime around 1960—roughly the same
time that /o/ appears to have been moved back by about 120 Hz in several
regions of Upstate New York.28 The general patterns of correspondence in
apparent-time and geographical distribution between backing of /o/,
phonological transfer of (olC), and caught-cot merger in speakers’ minimal-pair
judgments suggests that they are all different reflections of the ongoing influence 28 Note that the shift of (olC) to /o/ does not contribute to the backing of mean /o/; for the purposes of this dissertation, tokens before /l/ are disregarded in computing means.
318
of the merger, which is proceeding simultaneously by approximation and by
phonological transfer.
In most communities, the transfer of (olC) is the most advanced of those
three measures of progress of the caught-cot merger: the use of /oh/ in (olC)
words is found among speakers born before the apparent-time /o/-backing
cutoff and with no evidence of merger in their minimal-pair judgments.
Cooperstown is an exception to this: of the five in-person interview subjects in
Cooperstown, all of the three oldest, as listed on Table 5.33, used /o/ for (olC);
while only Kelly R. (born in 1991) clearly had /oh/.29 This is striking for a couple
of reasons. First, in terms of its NCS scores in apparent time, Cooperstown
appeared in previous chapters to be an Inland North fringe village in retreat
from the NCS, which means that the older Cooperstown speakers should be less
different from the Inland North fringe than the younger speakers. But all
speakers sampled in the Inland North fringe proper, including four born before
1960, use exclusively /oh/ for (olC); the Cooperstown speakers from its period
as an Inland North community, even those with NCS scores of three and four,
differ sharply from that, using only /oh/.30 The older Cooperstown speakers’
retention of /o/ for (olC) is even more striking because the caught-cot merger is
otherwise noticeably more advanced in Cooperstown than in the Inland North
fringe—all of the four speakers in the Cooperstown sample born in 1983 or later
have at least transitional minimal-pair judgments and Cartesian /o/~/oh/
29 The fifth in-person interview subject in Cooperstown, Zara F. (born in 1990), already has full caught-cot merger. 30 Despite the small number of speakers producing categorizable (olC) in Cooperstown, the difference between Cooperstown’s three-out-of-four /o/ tokens and the Inland North fringe’s 24 /oh/ tokens is significant at the p < 0.002 level.
319
distances less than 200 Hz. By comparison, in Ogdensburg, the most merged
Inland North fringe community, two of the five youngest speakers have fully-
distinct judgments and all have more than 200 Hz in Cartesian distance. So
although Cooperstown is distinguished from the rest of the sampled region by
the rapidity with which the caught-cot merger is taking place there, the
phonological transfer of (olC) does not seem to have substantially preceded the
merger in perception the way it apparently has in most of the other communities
sampled.
Sidney resembles Cooperstown in that it is trending away from the NCS
in apparent time, but that is about as far as the resemblance goes. In Sidney, six
speakers produced tokens of (olC). Of these, the two oldest, as shown in Table
5.33, used /o/ in them, while all of the rest (including Keith M., born in 1958,
who produced five (olC) tokens) used /oh/. This might not seem at first glance
to be a difference between Sidney and Cooperstown—after all, if in Sidney
speakers born in 1958 and later use /oh/ for (olC) while in Cooperstown
speakers born in 1957 and earlier use /o/, that is prima facie no difference at all.
Where Cooperstown and Sidney differ, however, is in the relationship between
(olC) and other indicators of merger. Apart from the use of /oh/ for (olC), the
influence of the caught-cot merger is not very well attested in Sidney: it is the only
well-sampled community other than Poughkeepsie in which year of birth does
not have a statistically significant linear Pearson correlation with F2 of /o/31, F1
of /oh/, or Cartesian distance between /o/ and /oh/. The presence of /oh/ for
31 In this case a t-test finds that the older and younger speakers are significantly different; the weakness of the Pearson correlation, however, indicates that the difference between younger and older speakers is not as distinctive or clear-cut as in most of the other communities sampled.
320
(olC) therefore indicates that Sidney is not altogether different from most of the
other communities sampled: the phonological transfer of (olC) appears to have
gone to completion by 1958 in apparent time, acting as an early indicator of
caught-cot merger influence in a community long before there is direct evidence
of the merger itself. In Cooperstown, however—at least in the present sample—
/oh/ only appears in (olC) once the caught-cot merger has already appeared in
minimal-pair judgments.
The status of (olC) in the Inland North core is somewhat hard to identify.
Keith M. from Sidney has an NCS score of four and is old enough to have grown
up when Sidney was still an Inland North core community; so his /oh/ in (olC)
words may indicate to some extent that the phonological transfer is of relatively
long standing in the Inland North core. In stable Inland North core communities,
however, data is sparse: only two sampled speakers in Utica—both born in
1989—produced (olC) at all, both using /oh/. Among the eight Inland North
speakers in Upstate New York in the Telsur corpus, only one produced any
tokens of (olC): Simon Z. from Syracuse, born in 1948, produced three tokens
(two of involved and one of Solvay, the name of a village near Syracuse), all as
/o/. To the extent that this tells us anything about the status of the Inland North
core in New York State as a whole, it seems to line up more or less with the
behavior of (olC) in some of the other communities sampled: one speaker born
earlier than 1961 uses /o/, but by 1989 in apparent time, the transfer to /oh/ had
gone to completion. So, if we interpret the use of /oh/ for (olC) as evidence for
merger in progress by phonological transfer, this weakly supports the hypothesis
321
that the backing of /o/ in the Inland North core is related to the expansion of
caught-cot merger, rather than an independent sound-change development.
Utica can be contrasted in this respect with Poughkeepsie. Poughkeepsie
and Utica both have features that ANAE describes as resistant to the caught-cot
merger—Poughkeepsie because of its raised /oh/ and Utica because of its NCS.
But while Poughkeepsie has completely avoided the phonological transfer of
(olC) to /oh/—even Natalie I. from Poughkeepsie, born in 1993, uses /o/ for
both of her (olC) tokens—in Utica it exists at least among young speakers. This is
further evidence for the observation made above that raised /oh/ seems to be
successful at imparting “stable resistance” to the merger, while the fronted /o/
of the NCS does not appear to have that effect. Two different mechanisms of
merger are in evidence in the Inland North core in apparent time, namely
approximation and phonological transfer, while neither appears in
Poughkeepsie.
The Telsur corpus only contains two more Inland North speakers with
measured tokens of (olC), in both cases the word dolphin: Tricia K. from Flint,
Mich., born in 1947, and Alice R. from Cleveland, Ohio, born in 1962. Both
appear to use /o/ in dolphin, although the phonological identity of Tricia K.’s
vowel in dolphin is somewhat ambiguous based on its position in the vowel
space. In any event, neither is young enough to give any clear suggestion about
whether the western component of the Inland North has proven any more
successful at resisting merger by phonological transfer than the New York
component has, as it has been more successful at avoiding the backing of /o/.
On the other hand, numerous Telsur speakers without full merger in the
322
Midland—a region where the merger is known to be in progress—display /oh/
in (olC); the phonological transfer is not a phenomenon restricted to Upstate
New York.
Meanwhile, seven32 Telsur speakers from the “Eastern corridor” have a
total of ten (olC) tokens measured in the corpus. One of these tokens—golf,
produced by Alexa L. from Wilmington, Del., born in 1966—contains /oh/,
indicating that the use of /oh/ for (olC) is perhaps not entirely absent from the
Eastern corridor. However, it may be that Alexa’s /oh/ in golf is merely an
individual lexical transfer, and therefore not necessarily related to the
phonological transfer seen elsewhere; Alexa also has two tokens of involved with
/o/. It may also be worth noting that Alexa is the only one of these seven
speakers outside the direct sphere of influence of New York City; the others are
all in New York City itself, northern New Jersey, or Middletown, Conn. In any
event, finding at most one use of /oh/ out of a total of 18 tokens of (olC) in
raised-/oh/ communities (including both the eight tokens from Poughkeepsie
and ten from the Telsur corpus) is a far cry from the 57 /oh/ out of 72 (olC)
found in the rest of Upstate New York (including Simon Z. from Syracuse). So
the Telsur corpus appears to support the hypothesis that the raised /oh/ resists
the phonological transfer of (olC) to /oh/—although, again, only two of these
seven speakers (Alexa L. herself and Tiffany M. from New York City, born in
1982) were born later than 1960.
32 An eighth speaker, Rosanne V. from Philadelphia, Penna., has two tokens of the placename Folcroft which are coded as /o/ and appear in or near the /oh/ phonetic cluster. However, the individual who answered my phone call to the Folcroft borough office tells me that Folcroft is correctly pronounced with /ow/, so these tokens are of unclear relevance to (olC) and are not considered here.
323
5.5. Cooperstown and Sidney
In Chapters 3 and 4, the differences between Cooperstown and Sidney
were mentioned but largely glossed over—they were both merely taken as
examples of the apparent fact that small villages on the border between the
Inland North and the Hudson Valley were relatively unstable in their
dialectological status, trending away from the NCS while larger cities equally
near the dialect boundary did not. However, as observed in this chapter, the
difference between Sidney and Cooperstown is more thoroughgoing than that. In
Sidney, the younger speakers sampled do not exhibit the NCS, but apart from
that they are not dissimilar from speakers in other nearby communities. Like the
majority of speakers sampled in the nearby city of Oneonta, they have NCS
scores of two; they have /oh/ in (olC) words but no merger in their minimal-pair
judgments. In Cooperstown, on the other hand, the NCS has disappeared much
more rapidly than in Sidney; younger speakers’ scores are all zero or one. And at
the same time, the younger Cooperstown speakers are all either transitional or
merged in their minimal-pair judgments. In these respects, younger speakers in
Cooperstown resemble the North Country, and are quite different from speakers
in any of the sampled communities nearer to Cooperstown. In this chapter, it was
found that Cooperstown speakers do not appear to have used /oh/ in (olC)
words prior to the caught-cot merger taking place in perception, unlike most
other Upstate New York communities. Another anomaly in Cooperstown
phonology, discussed Chapter 4, is one speaker’s diffused New York City–style
/æ/ system; it was concluded that she acquired this /æ/ system from her
324
parents during a period in which the village was in dialectological flux enough
that there was no identifiable community norm /æ/ system for her to acquire
from her peers.
Thus Sidney basically moves in an orderly way toward the phonology of
Oneonta; while Cooperstown abandons its NCS system, goes through a period
during which its phonology was sufficiently in flux that it did not have a well-
defined community /æ/ system, and ends up resembling neither of the dialect
regions of the cities it’s close to. Why, then, do these two villages undergo their
retreats from the NCS in such completely different ways? To answer this, we will
look at the villages’ economic and demographic makeup.
Sidney is basically a manufacturing community. Somewhat atypically, it
still contains (or contained, at the time of the research) two major manufacturers
that employ village residents (Mead, the paper company, and Amphenol, an
aerospace company), long after the collapse of major industries in other
communities in this part of the state, such as the former glove industry of
Gloversville and the carpet industry of Amsterdam. The presence of industry in
Sidney does not appear to have been able to draw people to it from a wide
geographical area, however; although the population of the village of Sidney
grew throughout most of the 20th century33, only two of the eight speakers
interviewed in Sidney, both born earlier than 1951, have parents who were raised
anywhere farther than about 25 miles from Sidney.
Cooperstown is completely different from Sidney in this respect. The
economic activity of Cooperstown is centered not around industry but around 33 Thanks for this information are due to whoever answered the phone at the library of the New York State Historical Association.
325
tourism; the village is home to the National Baseball Hall of Fame, and an entire
baseball-themed tourism and summer-camp industry has grown up around it.
When I visited in mid-July, the sidewalks in Cooperstown were packed with
visitors walking between the Hall of Fame, souvenir stores, and baseball-themed
eating establishments; in Sidney the same week, the streets seemed desolate by
comparison. One interview subject suggested that a property owner in
Cooperstown could make more money by renting to tourists for the three
months of the summer and leaving the apartment vacant the rest of the year than
by renting to someone who intended to live there year-round. Apart from
baseball tourism, the largest employer in Cooperstown is not an industry but a
hospital. And—perhaps most relevantly for dialectology—Cooperstown appears
to have attracted not only tourists but also migrants from the New York City area
and beyond. Of the eight parents of the four younger speakers interviewed in
Cooperstown, only one was described as coming from anywhere in the general
vicinity of Cooperstown (specifically Oneonta). The others include one from
Ohio, one from Pennsylvania, three from the New York City area—one from the
city, one from New Jersey, and one from Long Island—and Zara F.’s parents,
who are from Russia. Among the ten parents of the five older speakers, four
were from Cooperstown itself, one from Halcottville (a relatively isolated hamlet
some 60 road miles southeast of Cooperstown), and the rest from the Hudson
Valley core, New York City, or Massachusetts.
In short, while the speakers sampled in Sidney were for the most part not
only natives of Sidney but children of natives of the region as well, most speakers
in the Cooperstown sample—especially relatively recently—are the children of

326
migrants to not only the village but to New York State as a whole. Based on these
demographic facts, the difference between Cooperstown and Sidney’s retreats
from the NCS in apparent time is easy to explain. Sidney’s present-day linguistic
situation is presumably more or less the outcome of the evolution through
generational transmission of its previous linguistic situation, probably with some
amount of diffusion from communities such as Oneonta with which it is in
contact. The dialect of Cooperstown, on the other hand, was apparently
suddenly upended by migration into the village from a diverse collection of
locations in and beyond New York State.
And in fact, the Cooperstown data seems exactly in line with what would
be expected in a community containing migrants and the children of migrants
from diverse dialect backgrounds, according to the theory of new-dialect
formation (see e.g. Trudgill et al. 2000, Kerswill 2002). In a mixed-dialect
community, speakers of the second generation are expected to show considerable
inter-speaker variability with respect to which features of which contributing
dialects they exhibit; “there is no single peer-dialect for children to acquire, and
the role of adults, especially perhaps of parents and other caretakers, will
therefore be more significant than is usually the case” (Trudgill et al. 2000:306).
This is exactly what we seem to see among the four sampled Cooperstown
speakers born between 1950 and 1963. One of the four, as mentioned above,
shows the diffused /æ/ system and has parents from the Hudson Valley core.
Another exhibits the NCS, and her father is a native of Cooperstown. The other
two have neither the NCS nor the diffused /æ/ system, and they have low EQ1
indices comparable to those of Hudson Valley fringe communities and
327
continuous /æ/ distributions. Such a variety of features—especially among
speakers of comparable age—is not seen in any other community sampled in this
dissertation.
The third generation in a dialect-mixed community is expected to show
leveling and simplification. These are defined by Trudgill (1986:126) respectively
as “the loss of marked and/or minority variants” and “[the process] by which
even minority forms may be the ones to survive if they are linguistically
simpler[…] and through which even forms and distinctions present in all the
contributory dialects may be lost.” If the speakers born between 1950 and 1963
are the second generation in the process of new-dialect formation, then among
the speakers born between 1983 and 1991 we should expect to see the effects of
leveling and simplification. And indeed we do: the younger speakers show no
trace of the NCS or the diffused /æ/ system, which are marked and cross-
dialectally unusual patterns, and uniformly exhibit the relatively unmarked and
common nasal /æ/ system; this is a case of leveling. They all have merged or at
least transitional /o/~/oh/ minimal-pair judgments, which are entirely absent
from the older Cooperstown speakers in the sample (even though two of the
older speakers have a parent from eastern Massachusetts, a merged region); this
loss of a distinction is a case of simplification.
Therefore it seems that the sharp difference between Sidney’s and
Cooperstown’s behavior in retreating from the NCS is due to the differing
demographic situations in the two villages. The composition of the population of
Sidney has remained more or less stable over the past decades, and its dialect has
moved gradually away from the NCS apparently through diffusion from the
328
influence of Oneonta. Cooperstown has attracted migrants from multiple
regions, bringing with them a variety of dialect features that wiped out the NCS
by means of the leveling and simplification that arises from new dialect
formation.34 This scenario must remain a hypothetical one, of course, until a
much deeper sociolinguistic study with a much larger sample can be conducted
in Cooperstown and Sidney to ascertain the exact demographic profile of the
NCS and other dialect features in both of them. Nevertheless, the limited data
from these communities collected in the current study matches the hypothesis of
new-dialect formation in Cooperstown very closely.
5.6. Stable resistance reevaluated
The evidence presented in this chapter generally suggests that ANAE’s
description of the Inland North as a region of stable resistance to the caught-cot
merger was incorrect, while the description of the raised-/oh/ region as resistant
to the merger was correct. Both regions were described as resistant because they
are subject to sound changes that increase the phonetic distance between /oh/
and /o/—and indeed, /oh/ and /o/ are no farther apart in the /oh/-raising
Hudson Valley core than among the older Inland North core speakers (i.e., those
prior to the obvious backing of /o/)35. Why then should that margin of security
successfully insulate the Hudson Valley core, as predicted by ANAE, from 34 Strikingly, the population of the village of Cooperstown has consistently declined over the course of the 20th century and into the 21st; it is as if the migrants have replaced, rather than added to, the native population. 35 The seven Inland North core speakers born before 1961, including the current sample and the Telsur Inland North sample, have a mean Cartesian distance of 427 Hz. The nine Hudson Valley core speakers, including the seven sampled from Poughkeepsie and the two Telsur speakers from Albany, also have a mean Cartesian distance of 427 Hz.

329
participating in the effects of caught-cot merger—even such a relatively
innocuous effect as the lexical transfer of (olC)— while the Inland North defies
ANAE’s prediction?
The answer, of course, is that not all margins of security are created equal;
raising /oh/ away from /o/ does not necessarily have the same effect on
openness to the merger as fronting /o/ away from /oh/ does. The raising of
/oh/, especially in the area of New York City influence, is the raising of a vowel
with a tense nucleus along the periphery of the vowel space. Movement in this
direction exactly follows one of Labov (1994)’s three general principles of chain
shifting; and these principles, Labov (to appear) emphasizes, tend to be
“unidirectional” changes. It is not entirely impossible for such a unidirectional
change to reverse direction, but it takes place “rarely” and under “special
circumstances”—thus Johnson (2007) finds caught-cot merger in communities on
the Massachusetts–Rhode Island border that are historically part of the raised-
/oh/ region, but it took major demographic changes to bring it about.36 On the
other hand, the fronting or backing of a low vowel, as long as it remains low, is a
bidirectional change; low vowels have moved forward and backward several
times in the history of English, only remaining permanently front or
permanently back once they had left the low vowel tier. So by the general
principles of unidirectional and bidirectional vowel changes, it’s not surprising
that the fronting of a low vowel in the Inland North should be relatively easily
36 Becker (2009) has recently and unexpectedly reported /oh/ to be lowering in apparent time among white speakers in New York City’s Lower East Side; whether it took a special demographic situation to bring this change about is not yet clear.
330
reversed by pressure toward merger, while the raising of a tense vowel in the
Hudson Valley core is not.
Labov (to appear: ch.7) suggests that “the movement of /o/ is not easily
reversed, since it is locked into the larger context of the NCS.” However, as this
chapter has shown, the NCS structure is not sufficient to prevent the reversal of
/o/-fronting. This is further evidence that it is Herzog’s Principle—i.e., the
expansion of the caught-cot merger—driving the backing of /o/ in the Inland
North, rather than an independent development. The structure of a chain shift
depends upon the robustness of the contrasts between the phonemes involved in
a shift; apart from the general principles of vowel shifting, what drives a chain
shift on its unidirectional way is the fact that if any of the phonemes involved
were to reverse course, it would collide with the next phoneme moving up
behind it in the chain. If the phonemic contrast is weakened, however, perhaps
as a result of influence from communities in which those two phonemes are
merged, the structure of the chain shift will not be sufficient to prevent the
motion of the shift from being reversed.
Now, the only raised-/oh/ community in the current sample is
Poughkeepsie, which is not particularly close to any regions where the merger is
complete; so it might be possible to argue that the only reason no effect of merger
in progress is seen in Poughkeepsie is merely that Poughkeepsie has less direct
access to speakers from merged regions than the Inland North core. However,
although the Inland North core as a whole shares a border with Canada and
Western Pennsylvania, Utica itself—the best-represented Inland North core
community in the current study—is quite distant from any known fully-merged
331
regions, and younger speakers in Utica have backed /o/ and (to the extent the
data shows) /oh/ for (olC) anyhow. So if direct geographic proximity to merged
communities is not necessary for the weakening of the distinction in Utica,
there’s no reason to expect it to be necessary in Poughkeepsie. Moreover,
consider again the Massachusetts–Rhode Island border, historically a raised-
/oh/ region directly adjacent to a highly influential merged region. Johnson
(2007:349) suggests that even there, “non-migratory adult-to-adult contact [i.e.,
diffusion] does not lead to lasting change in low vowel systems”; the spread of
the merger is directly correlated with migration into raised-/oh/ communities of
merged speakers and their children. In Utica, no such demographic change
apparently exists: out of the 14 parents of the seven Utica speakers sampled, only
one was from a merged region, and nearly all of the rest were from Utica or its
immediate vicinity. Mutatis mutandis, the same is true for Poughkeepsie. So with
respect to the influence of the caught-cot merger, Utica and Poughkeepsie do not
appear to differ noticeably in either geographic or demographic access to merged
speakers; the only difference is the nature of the sound change that would be
required to bring about merger.
This tells us a great deal about the relative strength of Herzog’s Principle
of merger expansion and the ability of individual dialects to resist mergers by
maintaining large margins of security between the implicated phonemes. In the
Inland North core, diffusion of the merger can weaken the distinction between
the phonemes to the point where a part of a chain shift can be reversed—but only
when such a reversal does not violate one of the general principles of vowel
shifting. In the regions of raised /oh/, where narrowing the space between /o/
332
and /oh/ would require the lowering of a tense peripheral vowel, simple
diffusion of the merger through contact is not sufficient to cause the phonemes to
move toward each other; substantial demographic change is necessary to allow
the merger to spread into such regions. So a sound change of the “bidirectional”
type, like fronting or backing of a low vowel, seemingly cannot actually impart
resistance to merger merely by increasing the phonetic distance between two
phonemes.
Now, in general, the results of both this chapter and of Johnson (2007) are
a vindication for Herzog’s Principle over “stable resistance” to merger; both find
trends toward merger, or merger itself, expanding into regions described as
resistant to it by ANAE. But the difference in the manners by which these
expansions take place is instructive. On the Rhode Island–Massachusetts border,
individual communities are undergoing the merger as a result of demographic
change, not unlike what happened in Cooperstown in the present study. From a
certain point of view, this can be construed not as merger expanding into the
Rhode Island dialect region, but rather as these communities leaving the Rhode
Island dialect region, in that a sufficiently large portion of their population
originates from a different origin. No such thing, as far as we can tell, is the case
in Utica; the community shows evidence of progress toward the merger even
though the population does not appear to have undergone a great deal of
migration from outside the Inland North. So to be more specific, although the
caught-cot merger can spread into the raised-/oh/ region in a purely geographical
sense, it is still meaningful to say that raised /oh/ does impart some degree of
stable resistance to it: the phonological system of raised-/oh/ regions is not
333
compatible with diffusion of the merger, and it takes direct introduction of a
large number of merged children (what Johnson has referred to as transfusion) to
change the phonology and allow the merger to spread. The Inland North’s
phonological system, however, as we have seen here, seems quite compatible
with the spread of the merger.
It may seem somewhat perverse to describe the Inland North, as we have
done, as less resistant to the spread of caught-cot merger than the raised-/oh/
region is, when the merger itself is still essentially unattested in the Inland North.
But “stable resistance” to the merger, the term ANAE uses, cannot simply mean
the same thing as absence of merger. For “stable resistance” to exist, there must be
a feature of the phonological system that actively prevents diffusion of the
merger from taking place. Otherwise, we would have to describe any unmerged
dialect which has simply never had substantial contact with a merged dialect as
“resistant” to it—when in reality such a dialect may be fully susceptible to the
merger but has merely never yet had any stimulus to undergo it. The reason for
the illusion of stable resistance in the Inland North is clear, of course, and is
exactly what ANAE identified as the reason for stable resistance. The frontedness
of the NCS /o/ means that, even when influence from the merger is felt and /o/
is backed toward /oh/, the contrast between the two phonemes remains robust:
it would take much more than 120 hertz’ worth of backing to bring /o/ and
/oh/ close enough to cause full merger in the Inland North core. But the mere
fact that the influence of the merger on the Inland North core has not (yet) been
extensive enough to cause the merger itself in speakers’ perception or production
does not mean that the Inland North can be described as resistant to the effects of
334
the merger in the same way that the raised-/oh/ region is. A large margin of
security between phonemes means that diffusion of the merger may not cause
the phonemes to actually merge immediately; but it does not mean that diffusion
of the merger will have no effect at all, as would be necessary for a true situation
of “stable resistance”. The Inland North’s fronted /o/ delays, rather than
prevents, the caught-cot merger.
5.7. Conclusion
The key empirical finding of this chapter is that the caught-cot merger is in
progress throughout most of Upstate New York. It is only in far northern New
York, the region referred to herein as the North Country, that the merger is
nearing completion to the extent that nearly every speaker sampled shows some
degree of merger in perception. However, in almost every other region, there is
evidence of movement toward the merger: /o/ is backing in apparent time, and
words containing (olC) such as revolve have been or are being transferred from
the /o/ class to the /oh/ class. The only region where there is no such evidence
of the effect of merger is the Hudson Valley core, where /oh/ is raised away
from /o/ to high mid position.
The influence of the merger appears to be spreading southward from the
North Country, inasmuch as the merger’s progress appears to be more advanced
in the Inland North fringe, which is adjacent to the North Country, than in the
Hudson Valley fringe. There are more speakers in the Inland North fringe
sample with transitional minimal-pair judgments than in the Hudson Valley

335
fringe, and in the Inland North fringe the transfer of (olC) appears to have
already gone to completion. The Inland North fringe city where the greatest
number of speakers have transitional judgments is Ogdensburg, which despite
being in the Inland North fringe is squeezed up between Canada on one side and
the North Country on the other. This could be taken as further confirming that
the weakening of the /o/ ~ /oh/ distinction is the result of diffusion of the
merger from the North Country; however, the samples are small enough that the
difference between Ogdensburg and other Inland North fringe cities in this
respect does not reach the level of statistical significance. It may also be the case
that the influence of the merger is also diffusing northeastward from Western
Pennsylvania into the Inland North core, in that backing of /o/ is seen in the
Inland North core about the same time as it is in the Inland North fringe,
although the core is farther from the North Country; but there is not enough data
available from the Inland North core west of Utica to be able to say anything
certain about the path of diffusion there. Different aspects of the merger may
take place at different speeds in different regions: while transfer of (olC) seems to
have gone to completion relatively early in the Inland North fringe, the backing
of /o/ took place at the same time as in the Inland North core or later.
Cooperstown is the only community sampled outside the North Country
where the merger is advanced enough that multiple individuals have fully
merged minimal-pair judgments. However, the merger in Cooperstown is not
directly related to the diffusion of the merger from other areas; here it is the
result of phonological simplification as part of new dialect formation in a
dialectally-diverse community.
336
From these results we can draw the following conclusions of more or less
general relevance to the study of dialectology, and of North American
dialectology in particular:
• A merger expanding by diffusion into new communities does not
necessarily have direct effects on speakers’ minimal-pair judgments
immediately; it may just weaken the contrast enough for other
phonetic or phonological trends toward merger to begin, which may
only effect perception directly some decades down the line.
• Merger can proceed simultaneously by more than one of the
mechanisms listed by Herold (1990); here phonological transfer and
phonetic approximation coexist in the progress of a single merger.
• Having a large phonetic distance between /o/ and /oh/ is not
sufficient to block the merger from affecting a region: ANAE’s
hypothesis that fronted /o/, as in the NCS, makes a community resist
diffusion of the caught-cot merger was mistaken.
• However, raised /oh/ as in the Hudson Valley core does appear to
provide relatively stable resistance. This can be accounted for because,
according to the general principles of vowel shifting, fronting a low
vowel is a reversible change, while raising a peripheral vowel is a
unidirectional change.
• The supposed unity of the Inland North as a homogeneous dialect area
from Utica to Milwaukee is being broken up: /o/ is backing in Upstate
New York, but not in the western component of the Inland North.
337
In general, the results of this chapter are a vindication for Herzog’s
Principle that mergers expand at the expense of distinctions. Neither the present-
day dialect boundary between the Inland North fringe and the phonologically
very different North Country nor the settlement-history boundary between the
Inland North fringe and the Hudson Valley fringe is sufficient to prevent the
merger from expanding. Herzog’s Principle is not strong enough on its own,
however, to reverse the general principles of vowel shifting as described by
Labov (1994); relatively stable resistance does in fact exist. With sufficient
population movement and demographic change, however, as found by Johnson
(2007), merger can even overwhelm stable resistance of that sort. But such
demographic change is not necessary for caught-cot merger to advance by
diffusion into the Inland North, the chain-shift structure and fronted /o/ of the
NCS notwithstanding.
338
Chapter 6
Secondary Stress on -mentary
6.1. The structure of -mentary variation
To the best of my knowledge, no previous research has been published on
the distinctive pronunciation of elementary and other words ending in -mentary in
Upstate New York. As the results presented below will show, most speakers
across the region pronounce such words with secondary stress on the
penultimate syllable (this may be loosely notated as “eleméntàry”)—a
pronunciation shown in apparently no major dictionary of English. This chapter
will examine the dialect geography of this feature in the main data set and in a
supplementary rapid and anonymous telephone survey.
Although the stressed-penultimate pronunciation has seemingly escaped
notice so far, it is not hard to conjecture a plausible origin for it. The large
majority of words ending in the morpheme -ary standardly have a secondarily-
stressed penultimate in American English—consider dietary, missionary, planetary,
fragmentary, tributary. Of the two pages of -ary words in Muthmann (2002), very
few have a standard American English pronunciation with an unstressed
penultimate: several -mentary words such as elementary, anniversary, a few
trisyllabic words such as glossary and rosary, a few words in -iary such as auxiliary
and judiciary, and perhaps one or two others. Many of these words with
unstressed -ary are, as far as the individual speaker is concerned, synchronically
monomorphemic, whereas dietary, planetary, and so on have transparent
339
morphological structure. The shift to a stressed penultimate in words of the
-mentary type, then, is a simple analogical change—it is a regularization of the
pronunciation of the morpheme -ary to be the same in -mentary words as it is in
the large majority of other words in which it appears.
In this dissertation, data on pronunciation of words of the -mentary type
was chiefly collected by means of the wordlists subjects were asked to read at the
conclusion of their interviews. The wordlist used in Utica, the first in-person
interview site, included elementary, sedimentary, and rudimentary. Since one Utica
speaker explicitly expressed unfamiliarity with the word rudimentary, for in-
person interviews in later communities rudimentary was removed from the
wordlist and replaced with complimentary and documentary. In telephone
interviews, elementary and documentary were both elicited. In total, 118 wordlist
or telephone-elicited tokens of elementary were recorded, 111 of documentary, 84
of sedimentary, 80 of complimentary, and 8 of rudimentary. In addition to wordlist
tokens, 24 speakers produced tokens of elementary in connected speech (at least,
24 did so in the portion of their interview that was analyzed), usually in response
to questions about where they had gone to school, and often as part of the name
of a specific school. This adds up to a total of 425 tokens of -mentary words1;
every speaker in the sample produced at least one recorded -mentary token.
The status of the penultimate syllable of each token of a -mentary word
was coded by ear according to the classification listed in Table 6.1. Four principal
possibilities for the penultimate syllable—the -a- of -mentary—were discerned: it
1 Actually 427, as one speaker—Cody T. from Canton—produced three tokens of elementary in connected speech, all with penultimate secondary stress. These three tokens of the same word from the same speaker in the same style produced with no variation have been condensed into a single data point for analysis.

340
could be completely deleted; it could be present but completely unstressed and
reduced to schwa; it could be secondarily stressed, producing a clash with the
primary-stressed antepenultimate; or it could be secondarily stressed with no
clash, with the antepenultimate unstressed and reduced. Only in the relatively
rare case that I was unable to determine by ear after several listenings whether a
token had a reduced or secondarily-stressed penultimate did I resort to
classifying it as “intermediate or ambiguous”; in several such cases I had the
impression that the vowel of the penultimate syllable was schwa, but that the
preceding /t/ was aspirated in a manner indicative of at least some amount of
stress on the syllable.2 It is not clear to what extent such tokens actually represent
a possible fifth phonological variant, with a stressed schwa in the penultimate
syllable, and to what extent they merely represent inescapable phonetic variation
in production of one of the other principal phonological variants causing the
choice of variant to be obscured.
Table 6.1: Coding of -mentary words. code meaning example n % of total3
0 complete deletion ˌɛləˈmɛntɹi 35 8% 1 reduction to schwa ˌɛləˈmɛntəɹi 51 12% 2 intermediate or ambiguous forms (ˌɛləˈmɛnˌtəɹi) 15 4% 3 secondary stress ˌɛləˈmɛnˌtɛɹi 304 72% 4 reduction of antepenultimate ˈɛləmənˌtɛɹi 20 5%
In any event, “intermediate or ambiguous forms” are infrequent enough
that it seems they can be safely ignored. Discarding those leaves 410 tokens of
-mentary that will be the focus of the discussion in this chapter. Out of 119
speakers, 44 show variation between the remaining four unambiguous variants, 2 See Wells (1990) for the relationship between stress and aspiration in English syllable structure. 3 These numbers do not appear to add up to 100% because of rounding effects.

341
producing -mentary words using at least two of the four. Six speakers exhibited
intra-word variation—i.e., they pronounced elementary one way in connected
speech and another way in wordlist style. Based on this data, we will regard
-mentary as a linguistic variable involving a choice among variants 0, 1, 3, and 4.
To analyze the patterns of variation in -mentary it will be necessary to
define the envelope of variation by establishing the derivational relationship
between the different variants. Two obvious possibilities for the derivation of
-mentary variants can be modeled as decision trees in the following ways:
(1) a. Primary stress on antepenultimate?
If no, then variant 4: ˈɛləmənˌtɛɹi
If yes, then: b. Secondary stress on penultimate?
If yes, then variant 3: ˌɛləˈmɛnˌtɛɹi
If no, then: c. Delete penultimate?
If no, then variant 1: ˌɛləˈmɛntəɹi
If yes, then variant 0: ˌɛləˈmɛntɹi
(2) a. Secondary stress on penultimate? If yes, then: b. Primary stress on antepenultimate?
If no, then variant 4: ˈɛləmənˌtɛɹi
If yes, then variant 3: ˌɛləˈmɛnˌtɛɹi
If no, then: c. Delete penultimate?
If no, then variant 1: ˌɛləˈmɛntəɹi
If yes, then variant 0: ˌɛləˈmɛntɹi
342
Both models group variants 1 and 0 together as what we might call the
“reduced” variants, but they differ with respect to the relationship of variants 3
and 4. Model (2) seems more in line with the analogical analysis of -mentary
given above. If the morphological motivation behind the variation in -mentary is
analogy with the stress pattern of -ary in other words containing the morpheme,
then that motivation justifies grouping together as a single class variants 3 and 4,
which respect the analogy, against the reduced variants, which do not. Choices
(2b) and (2c), then, are each just a choice between different methods of building
the stress pattern of the rest of the word once choice (2a), the choice of whether to
respect the analogy, has been made. On the other hand, model (1), which groups
together variant 3 and the reduced variants against variant 4, has no particular
relationship to the morphological analogy which appears to be behind the
variation in the first place.
The pattern of variation in the data may also support model (2). Every
speaker who produced one or more tokens of variant 4 also produced one or
more tokens of variant 3. Now, under model (1), there’s no reason to expect
variants 3 and 4 to be well correlated with each other—speakers with high
probabilities of choosing variant 4 at point (1a) should have correspondingly low
probabilities of choosing any of the other three variants, including variant 3. On
the other hand, under model (2), we would expect a higher degree of correlation
between variants 3 and 4; to the extent that speakers have a high probability of
selecting “yes” at choice (2a), they will have relatively high probability of both
variants 3 and 4 and a lower probability of the reduced variants. So the
343
distribution of variant 4 with respect to variant 3 in the data supports model (2)
over model (1) of the derivational structure of variation.
The distribution of variant 4 in the data might even go too far in that
direction, however—not only do all speakers who produce variant 4 also
produce at least one token of variant 3, but no speaker who produces variant 4
produces a single reduced token. To put it another way: the 76 speakers who
produced no reduced tokens of -mentary produced a total of 237 elicited tokens of
variant 3 and 20 of variant 4. So among this subset of the sample, for whom the
probability of selecting a stressed penultimate at choice (2a) approximates 100%,
the probability of choosing variant 4 at choice (2b) is about 7%. There are 24
speakers in the sample who produced both variant 3 and reduced tokens, with a
total of 53 elicited tokens of variant 3 among them. If they had the same 7% rate
of selecting variant 4 at choice (2b), they would be expected to produce about
three or four tokens of variant 4. But in fact, they produced none at all; the
difference between zero and the expected 3.5 tokens is significant at the p < 0.05
level.
So it may be the case that no individual speaker’s grammar actually
includes the entire decision tree shown in (2) or (1); some speakers choose
between variant 3 and variant 4, and others choose between variant 3 and the
reduced variants, but none have all four variants available to them. In spite of
this, the decision tree in (2) will be used as a model for the structure of -mentary
variation in Upstate New York, under the principle that the object of study in
language variation is the speech community, rather than the individual speaker.
Although variant 4 and the reduced variants do not co-occur in the tokens
344
produced by any individual speaker, they do co-occur in the same communities;
in fact, every community in which variant 4 occurs also has at least one token of
one of the reduced variants.
Variant 4 is the least frequent variant in the data—as noted above, even
among speakers who produce no reduced tokens at all it occurs only 7% of the
time. It appears only in wordlist reading style—never among the 24
spontaneously-produced tokens of elementary, and never in telephone-elicited
tokens. For this reason I conjecture that it is a hypercorrect spelling
pronunciation, influenced by the stress pattern of the corresponding nouns
element, document, and so on. The relationship between variants 3 and 4—i.e.,
choice (2b) above—will be touched upon later in this chapter. However, because
of the rarity of variant 4 and its apparent restriction to wordlist style, the
majority of the discussion in this chapter will focus on choice (2a)—the choice
between the stressed-penult variants 3 and 4 and the reduced variants 0 and 1.
6.2. Results from interview data
6.2.1. Overall results
The large majority of tokens of -mentary used stressed-penult variants: 324
out of 410 tokens, or 79%. Out of 119 speakers, 64% (76) produced only the
stressed-penult variants, while only 16% (19) produced exclusively reduced
variants and 20% (24) showed variation between reduced and stressed penult.
Among those 24 speakers who show variation, the stressed penult is still fairly
dominant: 14 used stressed-penult variants in more than half of their tokens of
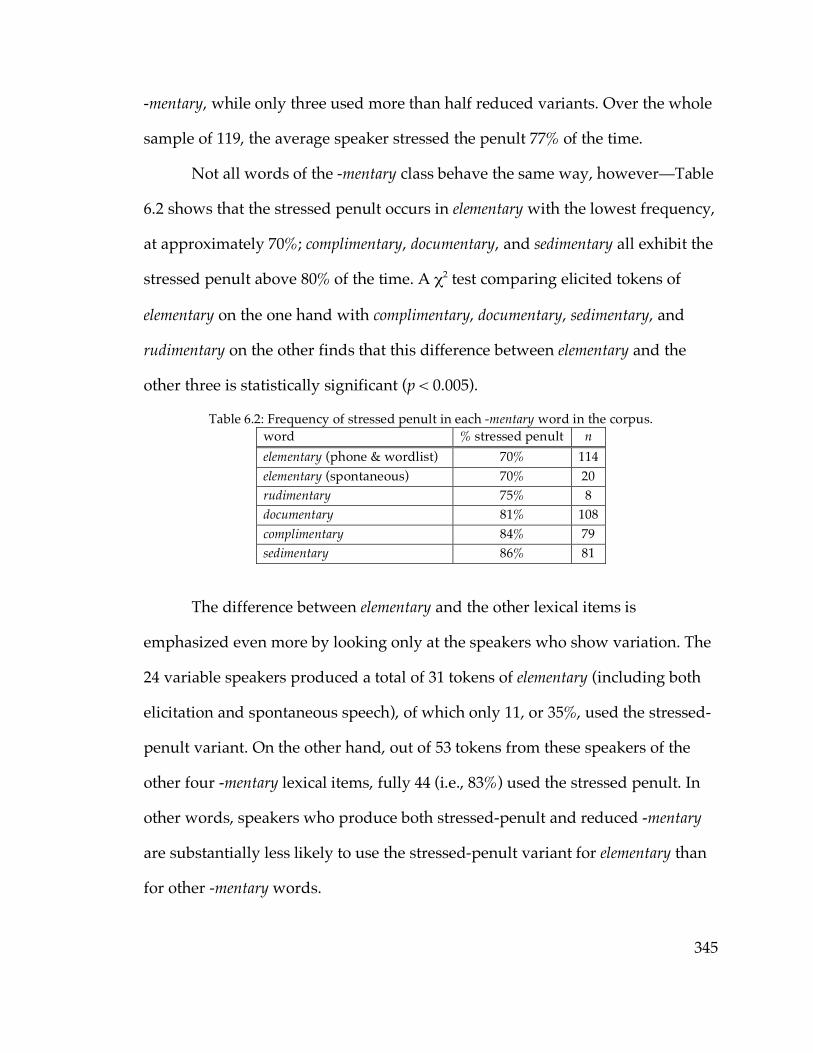
345
-mentary, while only three used more than half reduced variants. Over the whole
sample of 119, the average speaker stressed the penult 77% of the time.
Not all words of the -mentary class behave the same way, however—Table
6.2 shows that the stressed penult occurs in elementary with the lowest frequency,
at approximately 70%; complimentary, documentary, and sedimentary all exhibit the
stressed penult above 80% of the time. A χ2 test comparing elicited tokens of
elementary on the one hand with complimentary, documentary, sedimentary, and
rudimentary on the other finds that this difference between elementary and the
other three is statistically significant (p < 0.005).
Table 6.2: Frequency of stressed penult in each -mentary word in the corpus. word % stressed penult n elementary (phone & wordlist) 70% 114 elementary (spontaneous) 70% 20 rudimentary 75% 8 documentary 81% 108 complimentary 84% 79 sedimentary 86% 81
The difference between elementary and the other lexical items is
emphasized even more by looking only at the speakers who show variation. The
24 variable speakers produced a total of 31 tokens of elementary (including both
elicitation and spontaneous speech), of which only 11, or 35%, used the stressed-
penult variant. On the other hand, out of 53 tokens from these speakers of the
other four -mentary lexical items, fully 44 (i.e., 83%) used the stressed penult. In
other words, speakers who produce both stressed-penult and reduced -mentary
are substantially less likely to use the stressed-penult variant for elementary than
for other -mentary words.
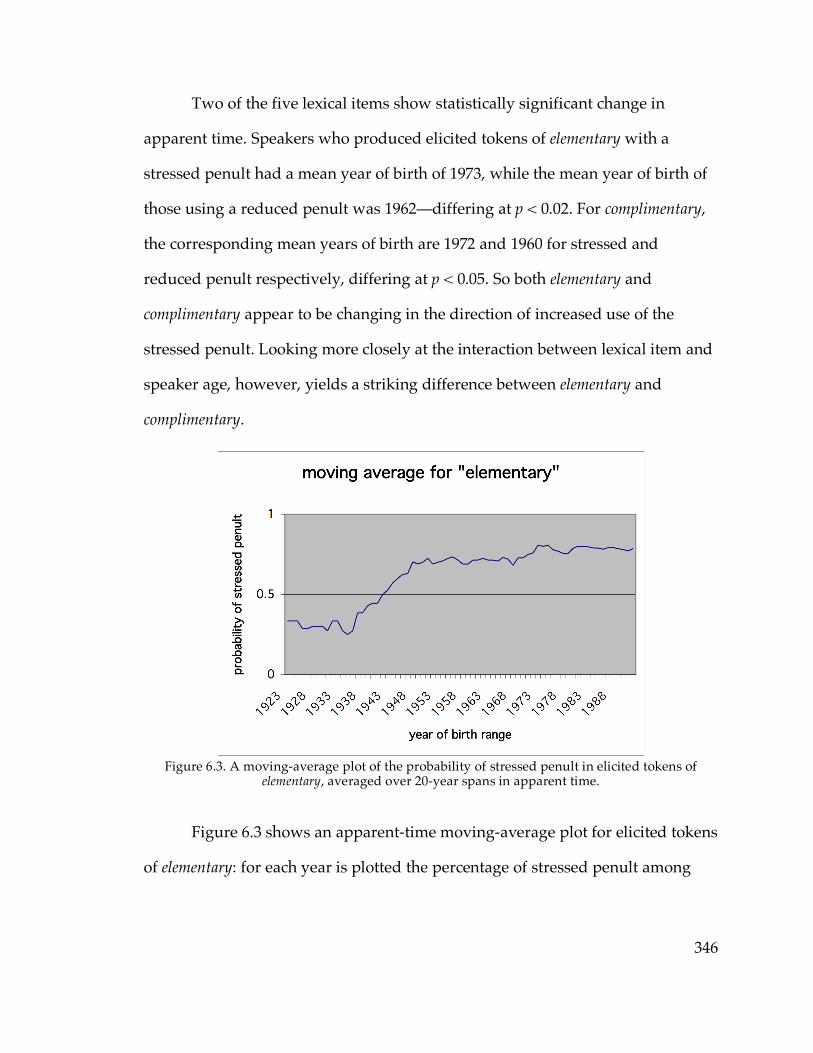
346
Two of the five lexical items show statistically significant change in
apparent time. Speakers who produced elicited tokens of elementary with a
stressed penult had a mean year of birth of 1973, while the mean year of birth of
those using a reduced penult was 1962—differing at p < 0.02. For complimentary,
the corresponding mean years of birth are 1972 and 1960 for stressed and
reduced penult respectively, differing at p < 0.05. So both elementary and
complimentary appear to be changing in the direction of increased use of the
stressed penult. Looking more closely at the interaction between lexical item and
speaker age, however, yields a striking difference between elementary and
complimentary.
Figure 6.3. A moving-average plot of the probability of stressed penult in elicited tokens of
elementary, averaged over 20-year spans in apparent time.
Figure 6.3 shows an apparent-time moving-average plot for elicited tokens
of elementary: for each year is plotted the percentage of stressed penult among
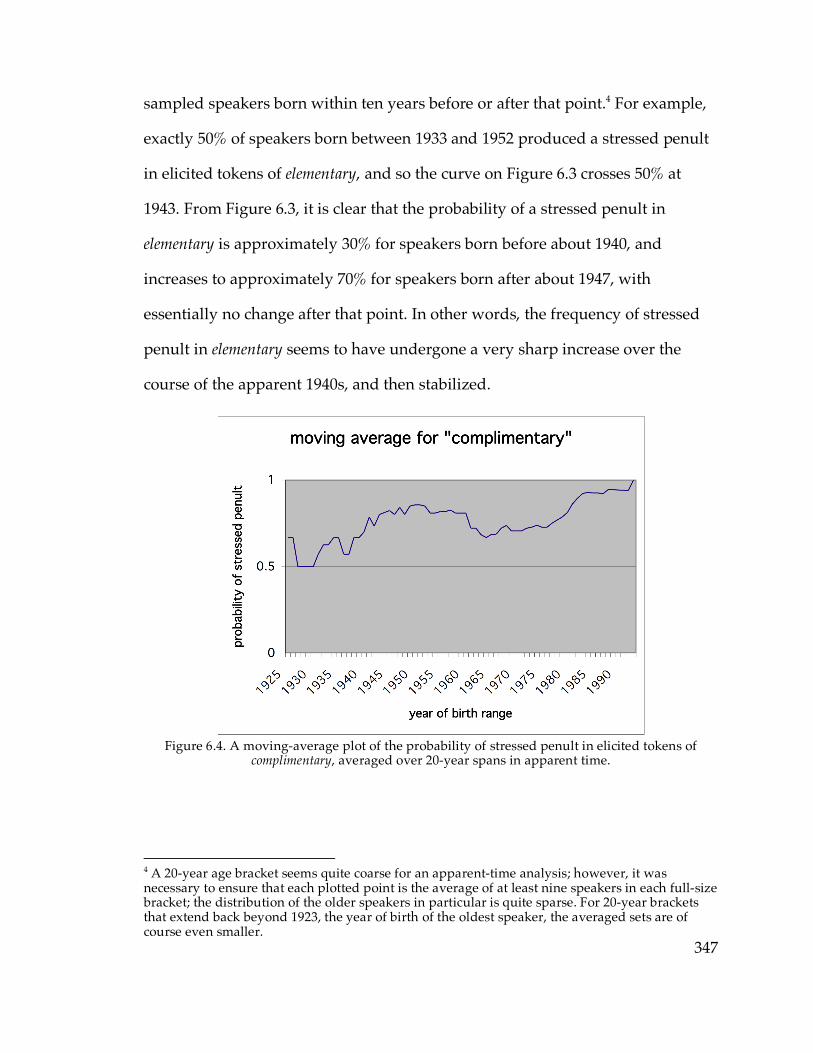
347
sampled speakers born within ten years before or after that point.4 For example,
exactly 50% of speakers born between 1933 and 1952 produced a stressed penult
in elicited tokens of elementary, and so the curve on Figure 6.3 crosses 50% at
1943. From Figure 6.3, it is clear that the probability of a stressed penult in
elementary is approximately 30% for speakers born before about 1940, and
increases to approximately 70% for speakers born after about 1947, with
essentially no change after that point. In other words, the frequency of stressed
penult in elementary seems to have undergone a very sharp increase over the
course of the apparent 1940s, and then stabilized.
Figure 6.4. A moving-average plot of the probability of stressed penult in elicited tokens of
complimentary, averaged over 20-year spans in apparent time.
4 A 20-year age bracket seems quite coarse for an apparent-time analysis; however, it was necessary to ensure that each plotted point is the average of at least nine speakers in each full-size bracket; the distribution of the older speakers in particular is quite sparse. For 20-year brackets that extend back beyond 1923, the year of birth of the oldest speaker, the averaged sets are of course even smaller.
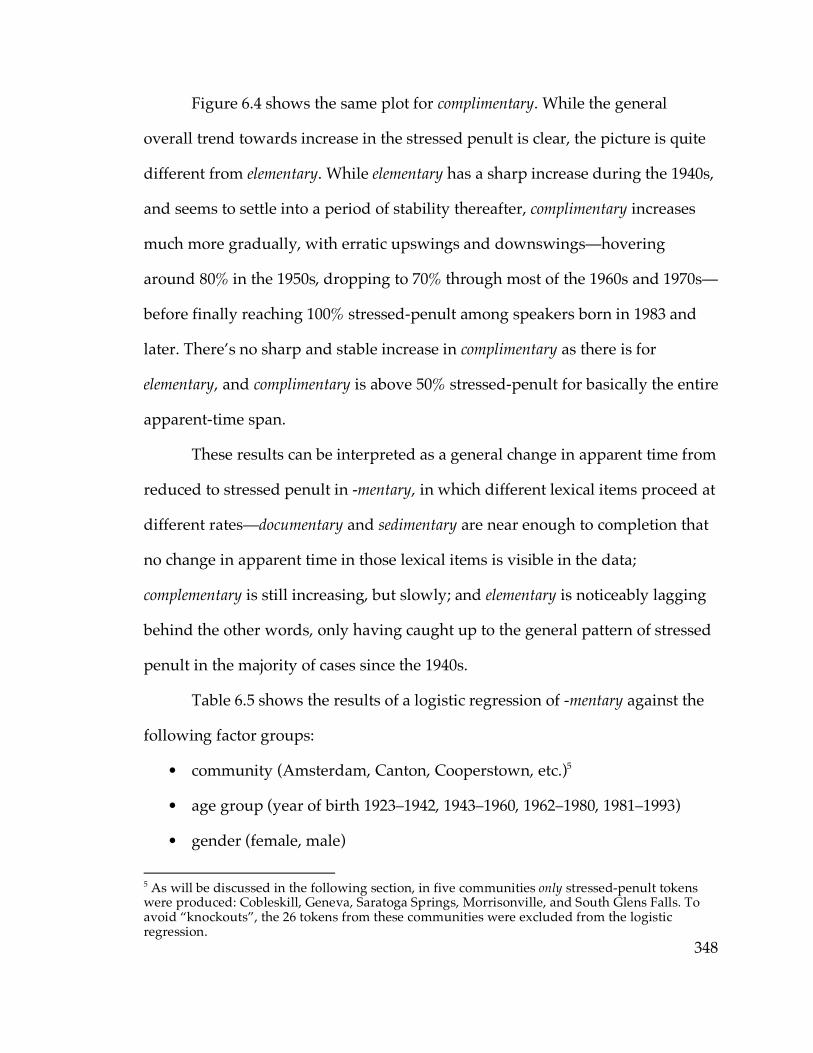
348
Figure 6.4 shows the same plot for complimentary. While the general
overall trend towards increase in the stressed penult is clear, the picture is quite
different from elementary. While elementary has a sharp increase during the 1940s,
and seems to settle into a period of stability thereafter, complimentary increases
much more gradually, with erratic upswings and downswings—hovering
around 80% in the 1950s, dropping to 70% through most of the 1960s and 1970s—
before finally reaching 100% stressed-penult among speakers born in 1983 and
later. There’s no sharp and stable increase in complimentary as there is for
elementary, and complimentary is above 50% stressed-penult for basically the entire
apparent-time span.
These results can be interpreted as a general change in apparent time from
reduced to stressed penult in -mentary, in which different lexical items proceed at
different rates—documentary and sedimentary are near enough to completion that
no change in apparent time in those lexical items is visible in the data;
complementary is still increasing, but slowly; and elementary is noticeably lagging
behind the other words, only having caught up to the general pattern of stressed
penult in the majority of cases since the 1940s.
Table 6.5 shows the results of a logistic regression of -mentary against the
following factor groups:
• community (Amsterdam, Canton, Cooperstown, etc.)5
• age group (year of birth 1923–1942, 1943–1960, 1962–1980, 1981–1993)
• gender (female, male)
5 As will be discussed in the following section, in five communities only stressed-penult tokens were produced: Cobleskill, Geneva, Saratoga Springs, Morrisonville, and South Glens Falls. To avoid “knockouts”, the 26 tokens from these communities were excluded from the logistic regression.
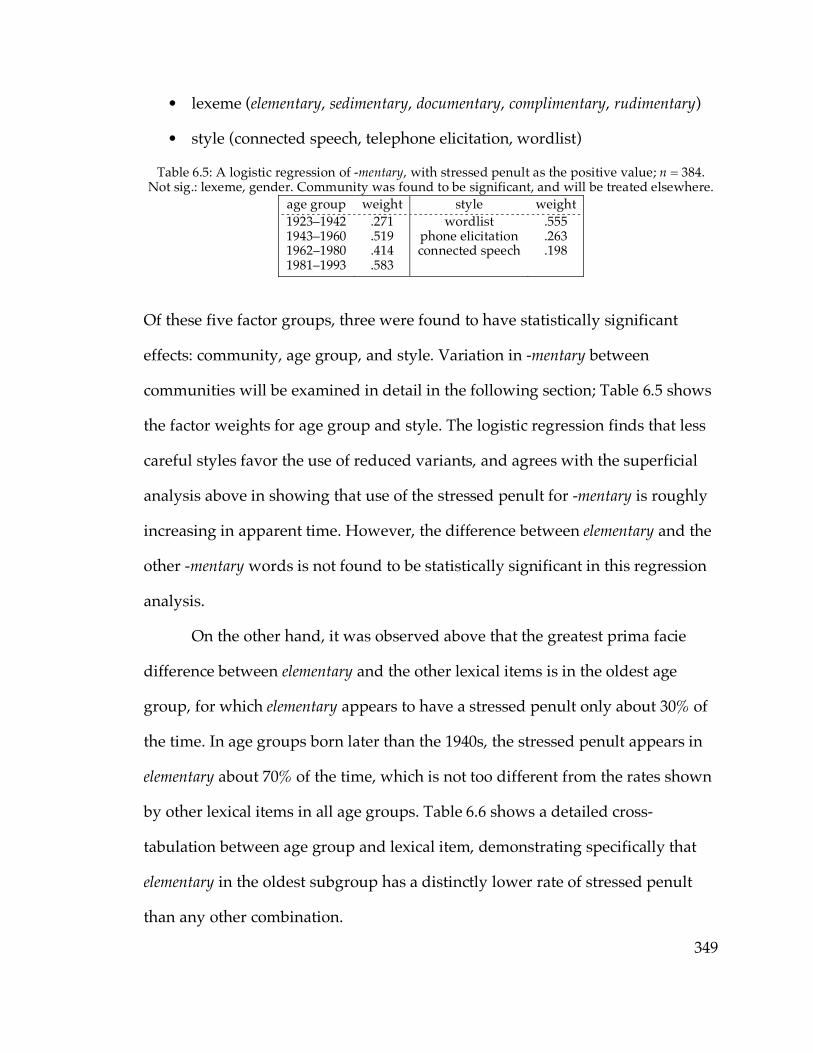
349
• lexeme (elementary, sedimentary, documentary, complimentary, rudimentary)
• style (connected speech, telephone elicitation, wordlist)
Table 6.5: A logistic regression of -mentary, with stressed penult as the positive value; n = 384. Not sig.: lexeme, gender. Community was found to be significant, and will be treated elsewhere.
age group weight style weight 1923–1942 1943–1960 1962–1980 1981–1993
.271
.519
.414
.583
wordlist phone elicitation connected speech
.555
.263
.198
Of these five factor groups, three were found to have statistically significant
effects: community, age group, and style. Variation in -mentary between
communities will be examined in detail in the following section; Table 6.5 shows
the factor weights for age group and style. The logistic regression finds that less
careful styles favor the use of reduced variants, and agrees with the superficial
analysis above in showing that use of the stressed penult for -mentary is roughly
increasing in apparent time. However, the difference between elementary and the
other -mentary words is not found to be statistically significant in this regression
analysis.
On the other hand, it was observed above that the greatest prima facie
difference between elementary and the other lexical items is in the oldest age
group, for which elementary appears to have a stressed penult only about 30% of
the time. In age groups born later than the 1940s, the stressed penult appears in
elementary about 70% of the time, which is not too different from the rates shown
by other lexical items in all age groups. Table 6.6 shows a detailed cross-
tabulation between age group and lexical item, demonstrating specifically that
elementary in the oldest subgroup has a distinctly lower rate of stressed penult
than any other combination.
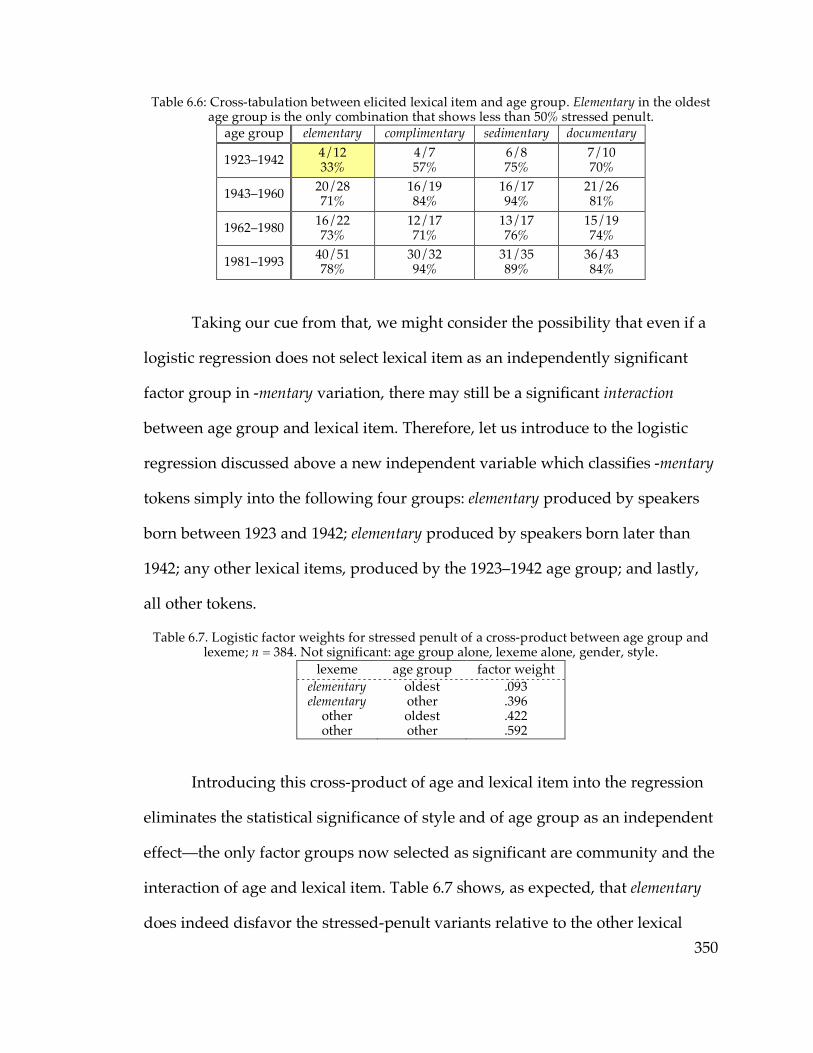
350
Table 6.6: Cross-tabulation between elicited lexical item and age group. Elementary in the oldest age group is the only combination that shows less than 50% stressed penult.
age group elementary complimentary sedimentary documentary
1923–1942 4/12 33%
4/7 57%
6/8 75%
7/10 70%
1943–1960 20/28 71%
16/19 84%
16/17 94%
21/26 81%
1962–1980 16/22 73%
12/17 71%
13/17 76%
15/19 74%
1981–1993 40/51 78%
30/32 94%
31/35 89%
36/43 84%
Taking our cue from that, we might consider the possibility that even if a
logistic regression does not select lexical item as an independently significant
factor group in -mentary variation, there may still be a significant interaction
between age group and lexical item. Therefore, let us introduce to the logistic
regression discussed above a new independent variable which classifies -mentary
tokens simply into the following four groups: elementary produced by speakers
born between 1923 and 1942; elementary produced by speakers born later than
1942; any other lexical items, produced by the 1923–1942 age group; and lastly,
all other tokens.
Table 6.7. Logistic factor weights for stressed penult of a cross-product between age group and lexeme; n = 384. Not significant: age group alone, lexeme alone, gender, style.
lexeme age group factor weight elementary elementary
other other
oldest other oldest other
.093
.396
.422
.592
Introducing this cross-product of age and lexical item into the regression
eliminates the statistical significance of style and of age group as an independent
effect—the only factor groups now selected as significant are community and the
interaction of age and lexical item. Table 6.7 shows, as expected, that elementary
does indeed disfavor the stressed-penult variants relative to the other lexical
351
items—and elementary as produced by the oldest set of speakers disfavors it
extremely.
Inasmuch as the cross-product of age and lexical item was introduced
post-hoc in a transparent attempt to make the statistics reflect the prima-facie
observation that reduced variants seem to appear for elementary more frequently
than for the other lexical items, it is not quite clear whether the regression
including or excluding the cross-product factor should be taken as more reliable.
Either way, however, the factors that are identified as favoring the stressed
penult are those that might have been expected to favor it in any case.
The change toward the stressed penultimate in -mentary was described
above as a case of analogical change. It is commonly understood6 in historical
linguistics that more frequently-used words are relatively resistant to analogical
change, and therefore we should expect the most common of the -mentary words
to be the least advanced in the shift to the stressed penult. Data from the first
release of the American National Corpus7 indicates that elementary is by far the
most frequent -mentary word in spoken American English: elementary appears in
the spoken portion of the corpus 99 times, while all other -mentary words
combined make a total of 21 appearances. This being the case, we would expect
elementary to show the greatest resistance to the stressed penult—and that seems
to be exactly what we find.
6 Commonly understood, and therefore quite difficult to find a citation for; but see e.g. Bynon (1977:43): “Perhaps their stability and resistance to [analogical] change [sc. that of words such as tooth, foot, be and go] is due to their very high frequency of occurrence in discourse and to the fact that their forms are therefore acquired by the child at an early stage before the respective grammatical rules have been acquired.” Hooper (1976) cites this observation as far back as the late 19th century (Paul [1890] 1970), and provides some quantitative evidence for it in the case of analogical weakening of strong verbs. 7 Available via http://www.americannationalcorpus.org/frequency.html; downloaded 14 August 2009.
352
Moreover, the same prediction is made if we consider the stressed penult
as a phonological change, rather than a morphologically-based analogy. From a
phonological perspective, the innovation in the pronunciation of -mentary words
is a case of fortition—replacement of a weak (“reduced”, central, unstressed or
outright deleted) sound with a strong (stressed, more peripheral) one, the
opposite of which is lenition. I have described elsewhere what I refer to as
“Phillips’s Principle” (after Phillips 1984) on the behavior of variable lenition as
follows: “more frequent words are more subject[…] to lenition—that is, variation
in the direction of reduced articulatory effort, whether part of a sound change in
progress or not” (Dinkin 2008a). But Phillips’s Principle appears to imply its own
converse, at least in the current case: a change in progress toward fortition will
be regarded by any individual involved speaker as variation between a stronger
form and a weaker form; and in a case of variation of that type, according to
Phillips’s Principle, relatively frequent words will favor the weaker form more
than relatively infrequent words. In other words, in this case, Phillips’s Principle
predicts as well that that elementary will favor the reduced-penult variants more
than the less frequent -mentary words do; which again is what the data appears
to show.
If, as in Table 6.5 above, we do not include the interaction between age
and lexical item in the logistic regression, we find a significant effect of style on
-mentary: relatively less careful styles favor the reduced penult. This pattern is
likewise explained naturally by considering fortition as merely the flip side of
lenition. For speakers who vary between stressed-penult and reduced variants,
the reduced variants may be synchronically considered to be just that—reduced

353
forms of the full stressed-penult citation form. If that is the case, it is
unsurprising that the reduced form appears more in connected speech and even
telephone-elicited tokens than in reading from a wordlist.
6.2.2. Geographical results
As shown in the previous section, the stressed-penult variants of -mentary
occur in the large majority of tokens in the data. Moreover, the stressed-penult
variants are also well attested throughout the geographical extent of the sample:
in every community sampled, at least half the speakers from whom elicited
tokens of -mentary were recorded8 produced at least one stressed penult. In other
words, at least half the speakers sampled in each community appear to have the
stressed penult in -mentary available to them at least in relatively careful speech.
The stressed penult is attested at a relatively high frequency throughout the
entire geographic range of eastern Upstate New York sampled in this
dissertation. There is nevertheless, however, noticeable regional variation in the
frequency of -mentary among the sampled communities, and that regional
variation is the topic of this section.
Every speaker in the sample can be assigned a numerical score
representing the relative frequency of the stressed penult in the tokens of
-mentary they produced; this score is simply the fraction of their tokens of
-mentary in which the stressed penult was used. Thus, for example, a speaker
8 The one exception who makes this caveat necessary is Allison S., a 23-year-old barista from Poughkeepsie. Due to an equipment failure during her interview, her reading of the wordlist was not recorded; she did say elementary once in connected speech, pronouncing it with the penult deleted (i.e., as variant 0).
354
who produced only stressed-penult tokens gets a score of 1; a speaker who
produced only reduced tokens gets a score of 0; and a speaker such as Robert O.
from Gloversville, who produced a reduced penult in elementary but stressed
penults in documentary, sedimentary, and complimentary, gets a score of 0.75. The
score of a community can be defined merely as the average of the scores of the
speakers interviewed from that community.
Five communities have -mentary scores of 1—i.e., in these five
communities, no reduced-penult tokens of -mentary were produced at all:
Cobleskill, Geneva, Saratoga Springs, Morrisonville, and South Glens Falls. Each
of these five communities had three or fewer speakers interviewed; Morrisonville
had only one. The highest mean -mentary score from a community with seven or
more speakers interviewed was 0.98, in Canton: here all elicited -mentary tokens
had the stressed penult, and only one speaker produced a connected-speech
reduced token. The lowest community score was 0.43, in Poughkeepsie. The
exact score of each community is listed in Table 6.9 below.
As Map 6.8 shows, an unexpectedly clear geographic pattern appears in
the community -mentary scores, with higher scores further west and north, and
lower scores further east and south. The only exceptions to the isoglosses on Map
6.8 are a few communities in which only two or three speakers were
interviewed—Queensbury, South Glens Falls, Saratoga Springs, and to a lesser
extent Cobleskill—which have higher -mentary scores than the communities
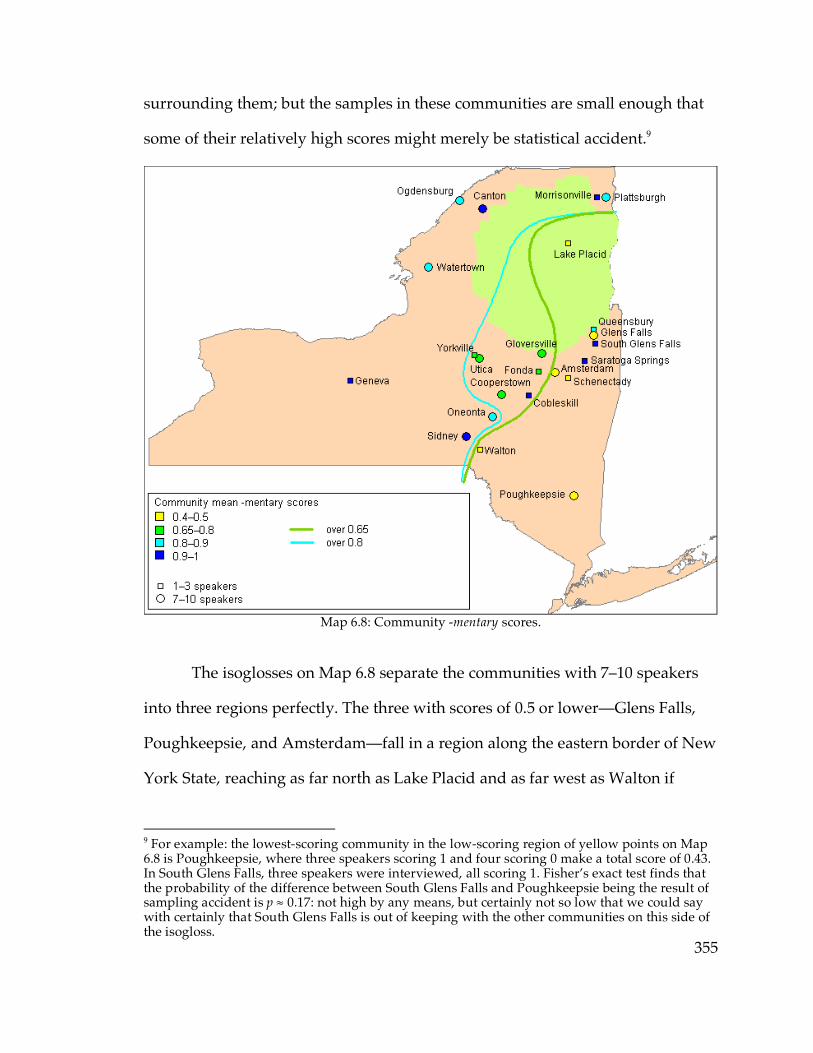
355
surrounding them; but the samples in these communities are small enough that
some of their relatively high scores might merely be statistical accident.9
Map 6.8: Community -mentary scores.
The isoglosses on Map 6.8 separate the communities with 7–10 speakers
into three regions perfectly. The three with scores of 0.5 or lower—Glens Falls,
Poughkeepsie, and Amsterdam—fall in a region along the eastern border of New
York State, reaching as far north as Lake Placid and as far west as Walton if
9 For example: the lowest-scoring community in the low-scoring region of yellow points on Map 6.8 is Poughkeepsie, where three speakers scoring 1 and four scoring 0 make a total score of 0.43. In South Glens Falls, three speakers were interviewed, all scoring 1. Fisher’s exact test finds that the probability of the difference between South Glens Falls and Poughkeepsie being the result of sampling accident is p ≈ 0.17: not high by any means, but certainly not so low that we could say with certainly that South Glens Falls is out of keeping with the other communities on this side of the isogloss.
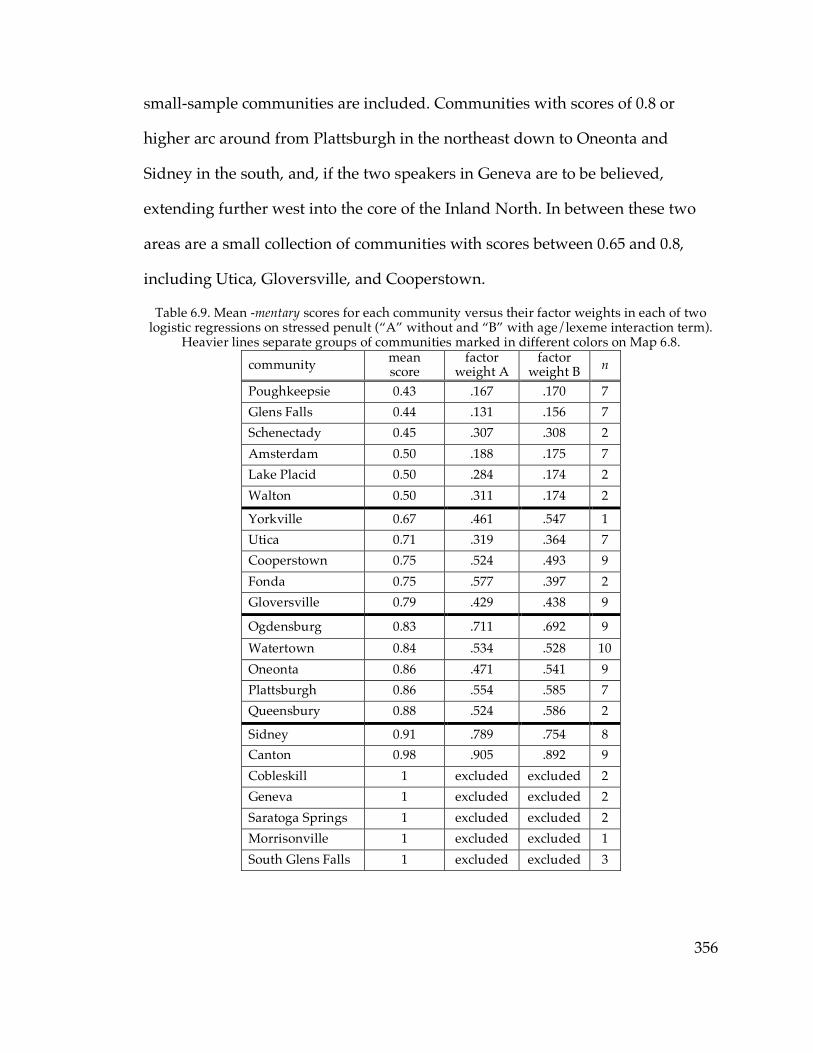
356
small-sample communities are included. Communities with scores of 0.8 or
higher arc around from Plattsburgh in the northeast down to Oneonta and
Sidney in the south, and, if the two speakers in Geneva are to be believed,
extending further west into the core of the Inland North. In between these two
areas are a small collection of communities with scores between 0.65 and 0.8,
including Utica, Gloversville, and Cooperstown.
Table 6.9. Mean -mentary scores for each community versus their factor weights in each of two logistic regressions on stressed penult (“A” without and “B” with age/lexeme interaction term).
Heavier lines separate groups of communities marked in different colors on Map 6.8. community mean
score factor
weight A factor
weight B n
Poughkeepsie 0.43 .167 .170 7 Glens Falls 0.44 .131 .156 7 Schenectady 0.45 .307 .308 2 Amsterdam 0.50 .188 .175 7 Lake Placid 0.50 .284 .174 2 Walton 0.50 .311 .174 2
Yorkville 0.67 .461 .547 1 Utica 0.71 .319 .364 7 Cooperstown 0.75 .524 .493 9 Fonda 0.75 .577 .397 2 Gloversville 0.79 .429 .438 9
Ogdensburg 0.83 .711 .692 9 Watertown 0.84 .534 .528 10 Oneonta 0.86 .471 .541 9 Plattsburgh 0.86 .554 .585 7 Queensbury 0.88 .524 .586 2
Sidney 0.91 .789 .754 8 Canton 0.98 .905 .892 9 Cobleskill 1 excluded excluded 2 Geneva 1 excluded excluded 2 Saratoga Springs 1 excluded excluded 2 Morrisonville 1 excluded excluded 1 South Glens Falls 1 excluded excluded 3

357
Now, it might be argued that computing average -mentary scores is not the
best way of determining each community’s degree of advancement in the change
toward stressed penult: after all, it was found in the previous section that at least
one or two other factors (such as style, age of speaker, and lexical identity) have
statistically significant effects on the choice between reduced and stressed-penult
variants of -mentary, and these features might not be evenly distributed among
the sampled communities. Table 6.9, therefore, displays the comparison between
community -mentary scores as defined here and the factor weights for each
community as calculated by logistic regressions both including a cross-product
between age and lexical identity (as in Table 6.7 above) and excluding it (as in
Table 6.5).
As Table 6.9 shows, the logistic regressions justify the major isogloss of
Map 6.8, the dark green isogloss separating the communities with scores of 0.5
and lower and those with scores of 0.65 and higher. The six communities with
the lowest -mentary scores are also those with the lowest factor weights in both
logistic regressions: every community with a -mentary score of 0.5 or lower has a
factor weight less than any community with a score higher than 0.5, regardless of
whether the interaction between age and lexeme is included in the logistic
regression. Now, although these six communities are consistently the six least
favorable to the stressed penult by all three measures, some seem more favorable
to it than others: Schenectady in particular has factor weights in both logistic
regressions closer to those of Utica than to Poughkeepsie, Glens Falls, or
Amsterdam. However, it is the three cities in this set with samples of seven
speakers that have the lowest overall factor weights—all three are below .200 in
358
both regressions and differ by at least .131 from the next highest-weighted well-
sampled community. So the logistic regressions strongly support the dark green
isogloss on Map 6.8 as drawn with respect to the well-sampled cities, and weakly
with respect to some of the communities with smaller samples.
The light blue isogloss on Map 6.8 is less well supported by the logistic
regressions. Regression B, which includes the age/lexeme interaction term, still
largely distinguishes the communities with scores above 0.8 (and factor weights
above .500) from those with score below 0.8 (and factor weights below .500), with
only the single speaker from Yorkville as an exception. However, communities
with factor weights above and below .500 come quite close together on either
side of that line, with Cooperstown and Watertown’s factor weights differing by
only .035. Regression A would group Oneonta with the green communities of
Map 6.8 (a grouping that is not geographically unmotivated), while Fonda rises
to a relatively high factor weight. Finally, if the six communities with low
-mentary scores are removed and new logistic regressions run on the remaining
communities, community is no longer selected as a significant factor—indicating
that the difference between -mentary scores above and below 0.8 on Map 6.8 is
not statistically very meaningful.
So the intermediate region of communities in green on Map 6.8 should be
taken at best with a grain of salt. The statistical results support, however, the
dark green isogloss separating the sampled region into a large central, northern,
and western area of very high use of the stressed penult (the mean score for all of
the 85 speakers in this area is 0.84) and a southern and eastern region of
359
relatively low incidence of the stressed penult.10 Combined with the finding from
the previous section that the stressed-penult variants appear to be increasing in
apparent time (at least for the lexical item elementary), this gives us a general
picture of the change toward the stressed penult advancing eastward across New
York State over time. In this model, the stressed penult has reached the eastern
edge of the state only relatively recently, and therefore the change toward the
stressed penult is further from completion there; but its presence is still clearly
noticeable and shows a high degree of inter-speaker variability. For the sake of
conciseness, I will for the time being refer to the region of relatively low stressed-
penult incidence as “the eastern region”.
6.2.3. Analysis of geographical results
The most striking fact about the eastern region is its almost complete lack
of correspondence to the dialect regions defined in earlier chapters on the basis
of phonological features. In fact, the eastern region is extremely phonologically
diverse: it includes Poughkeepsie, a Hudson Valley core city, with raised /oh/
and diffused /æ/ system; Amsterdam, a Hudson Valley fringe city; Glens Falls,
an Inland North fringe city, with the NCS; and Lake Placid, a North Country
village, with the caught-cot merger. This means that the -mentary isogloss cuts
across the phonologically-defined regions, separating Lake Placid from the rest
10 But only relatively low, compared to the rest of the sampled area. Of the 34 speakers on the yellow side of the dark green isogloss, fully 16 (47%) produced only the stressed penult, and another six (18%) produced at least one stressed-penult token; the average -mentary score for these 34 speakers is 0.57. Considered independently, and not in comparison to the other sampled communities that still seems pretty high.
360
of the North Country, Glens Falls from the rest of the Inland North, and the
phonologically very similar Amsterdam and Oneonta from each other.
Meanwhile, although the sharpest phonological isogloss in the entire sampled
region is that between Ogdensburg and Canton, these two communities are
grouped together by their treatment of -mentary. And while (as repeatedly noted
throughout this dissertation) the younger speakers in Cooperstown are
phonologically completely dissimilar to the speakers in the other communities in
their vicinity, their mean -mentary score of 0.69 is very much in keeping with the
surrounding area. The eastern region does appear to include the entire Hudson
Valley core region; and like the NCS isogloss, the -mentary isogloss separates
Amsterdam from Gloversville; but that’s as close as the dialect regions defined
by -mentary get to resembling the phonologically-defined regions.
Although it is a pronunciation variable, the choice between the -mentary
variants deals only with the pronunciation of a small family of lexical items (or of
a single morpheme, -ary); it does not interact with the general structure of the
phonological system. For this reason, as Evanini (2009) points out, it makes more
sense to consider -mentary as a lexical dialect feature than a phonological feature.
And it is, of course, well understood that the regions defined by present-day
lexical isoglosses need not correspond well to the dialect regions defined by
phonological change. Famously, as ANAE and Campbell (2003) both show, the
boundary between the regions using pop and soda to mean ‘soft drink’ separates
the Inland North core cities of Syracuse and Buffalo—Syracuse (and
Binghamton) joining with the Hudson Valley and points to the east in using soda,
361
while Buffalo and points west use pop11—while simultaneously uniting most of
the Inland North with the Midland into a single large pop region, defying the
sharpest phonological divide in the United States. So -mentary resembles
soda/pop in having an isogloss that is seemingly independent of phonologically-
defined dialect regions.
The status of -mentary as a fundamentally lexically-defined variable,
moreover, suggests something about the potential objects of dialect diffusion.
Labov (2007) argues that, since diffusion takes place through contact between
adults from different dialect regions, it can directly affect only relatively surface-
level linguistic entities, such as regular phonological rules or individual lexical
items; speakers fail to take note of the structured relationships between linguistic
objects. In the case of the diffusion of the New York City /æ/ system in
particular, speakers do not take note of words’ internal morphological structure;
unlike in the New York City system, tensing of /æ/ in the diffused system does
not depend on the location of morpheme boundaries. However, the pattern of
-mentary variation indicates that in at least some cases speakers do take note of
morpheme boundaries during dialect diffusion.
The data presented so far suggests that the stressed penult has spread
relatively recently to the eastern region, and that the most frequent -mentary
word, elementary, lags as expected in an analogical change. Indeed, elementary
appears to lag not only in the area where the stressed penult is most prevalent,
but also in the eastern region itself. Only four speakers out of the 35 sampled in
11 The status of Rochester appears to be intermediate: of the two Telsur speakers in Rochester, one uses soda and the other pop; Campbell (2003) finds Monroe County, which contains Rochester, to be about two-thirds pop-using and one-third soda.
362
the eastern region show variation between reduced and stressed-penult variants.
These four individuals produced only one stressed-penult token of elementary
against five reduced tokens (including one in connected speech), but six stressed-
penult tokens of other -mentary words and only one reduced. This difference is
significant at the p < 0.05 level; it remains significant if restricted only to the three
speakers who exhibited variation between elicited tokens, or expanded to all
speakers in the eastern region. 12
This is not what would be expected in a scenario where speakers in the
process of diffusion never pay attention to lexeme-internal morpheme
boundaries. If the object of diffusion were strictly the lexical item, one would
expect the most frequent lexical item to be the most advanced in a change in a
region that the change had diffused to: diffusion acting on lexical items only
would simply have more opportunities to affect pronunciations of more frequent
words than of less frequent words. But for elementary in the eastern region the
opposite is the case; the most frequent word is still the least advanced in the
change. This suggests that what is undergoing diffusion in this case is not the
individual lexical items elementary, documentary, and so on, but rather the
analogical change in the morpheme -ary itself. That is to say, it seems that
diffusion is capable of directly transmitting changes in a bound derivational
morpheme. Insofar as that diffusion only directly affects surface-level linguistic
entities, the morpheme -ary appears to be sufficiently superficial to be thus
affected.
12 If expanded to the entire eastern region, there are as follows: elementary has 16 stressed penults out of 35 (46%), and the other lexical items have 49 out of 74 (66%); this is significant at the p < 0.05 level. If the two tokens of elementary produced in spontaneous speech, both reduced, are excluded, however, p rises to approximately 0.08.
363
The -mentary isogloss of Map 6.8, of course, does not define the outer
limits of stressed-penult use; the entire sampled region is within the area of
stressed-penult use, and the green isogloss merely separates two sub-regions
within that area. In order to gain a clearer understanding of the forces
influencing the distribution of the stressed penult, it will be necessary to go
beyond the region sampled by the current project and attempt to find the outer
boundaries of the distribution of the stressed penult. Before moving on to the
broader search for the geographic boundaries of the stressed penult, however, let
us briefly look at the pattern of variation between the two stressed-penult
variants.
6.2.4. The reduced-antepenult variant
Variant 4, as defined above, may be referred to as the reduced-antepenult
variant: the -ment- of -mentary is reduced to minimal stress, so that the stress
pattern of the word is élementàry. It is attested only in wordlist style, and only
from speakers who produced no tokens of reduced variants. It was posited above
that the reduced-antepenult variant is a spelling pronunciation or hypercorrect
alternative to variant 3, the other stressed-penult variant; and therefore in this
section we will consider only the variation between the two stressed-penult
variants, disregarding reduced tokens.
The reduced antepenult is very infrequent in the data: among 274 tokens
of stressed-penult -mentary in wordlist style, the reduced antepenult only occurs
a total of 20 times, or about 7%. Table 6.10 shows the results of a multiple logistic
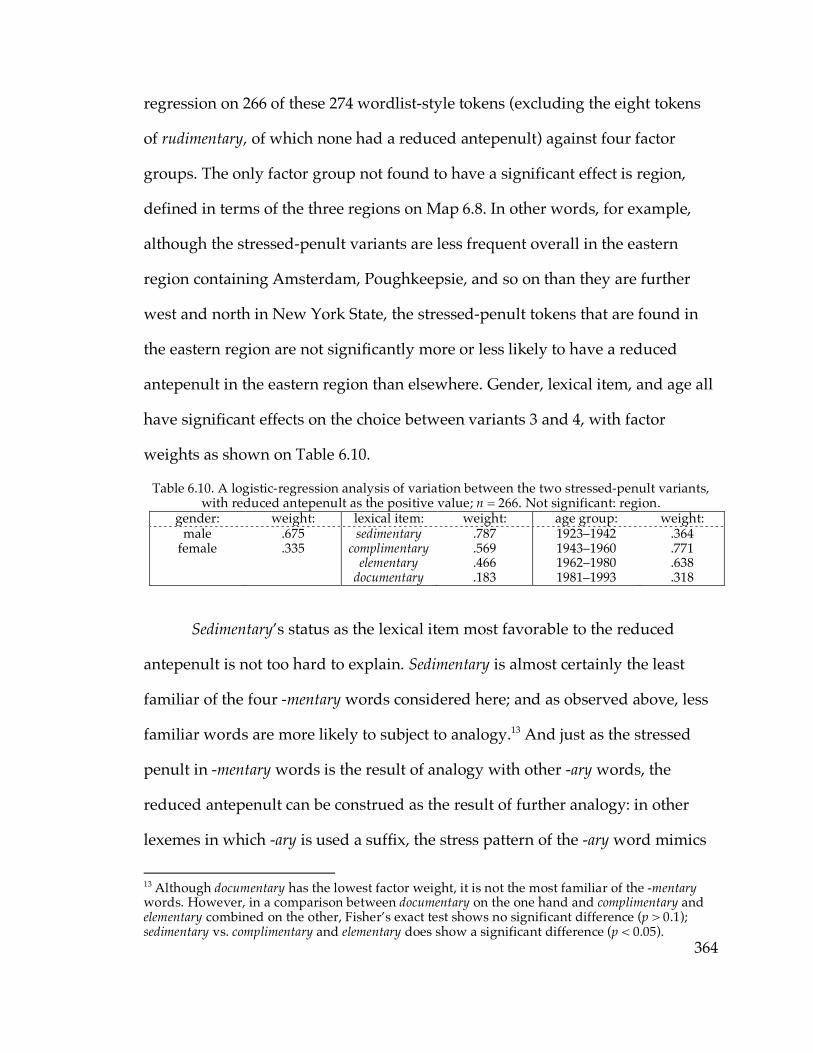
364
regression on 266 of these 274 wordlist-style tokens (excluding the eight tokens
of rudimentary, of which none had a reduced antepenult) against four factor
groups. The only factor group not found to have a significant effect is region,
defined in terms of the three regions on Map 6.8. In other words, for example,
although the stressed-penult variants are less frequent overall in the eastern
region containing Amsterdam, Poughkeepsie, and so on than they are further
west and north in New York State, the stressed-penult tokens that are found in
the eastern region are not significantly more or less likely to have a reduced
antepenult in the eastern region than elsewhere. Gender, lexical item, and age all
have significant effects on the choice between variants 3 and 4, with factor
weights as shown on Table 6.10.
Table 6.10. A logistic-regression analysis of variation between the two stressed-penult variants, with reduced antepenult as the positive value; n = 266. Not significant: region.
gender: weight: lexical item: weight: age group: weight: male
female .675 .335
sedimentary complimentary
elementary documentary
.787
.569
.466
.183
1923–1942 1943–1960 1962–1980 1981–1993
.364
.771
.638
.318
Sedimentary’s status as the lexical item most favorable to the reduced
antepenult is not too hard to explain. Sedimentary is almost certainly the least
familiar of the four -mentary words considered here; and as observed above, less
familiar words are more likely to subject to analogy.13 And just as the stressed
penult in -mentary words is the result of analogy with other -ary words, the
reduced antepenult can be construed as the result of further analogy: in other
lexemes in which -ary is used a suffix, the stress pattern of the -ary word mimics
13 Although documentary has the lowest factor weight, it is not the most familiar of the -mentary words. However, in a comparison between documentary on the one hand and complimentary and elementary combined on the other, Fisher’s exact test shows no significant difference (p > 0.1); sedimentary vs. complimentary and elementary does show a significant difference (p < 0.05).
365
that of the root: missionary, dietary, and planetary all bear primary stress on the
first syllable, just as mission, diet, and planet do. In -mentary variant 3, the majority
stressed-penult variant, this is not the case: sediméntàry does not share the stress
pattern of sédiment. Pronouncing sedimentary with the reduced antepenult,
therefore, is the result of analogy in two ways: bringing the pronunciation of the
derived sédimentàry in line with that of the root sediment, and allowing the suffix
-ary to have the same phonological relationship to its root in sediment as it has in
other words.
The reduced antepenult is favored by males. A possible explanation for
this tendency might lie in the cognitive differences that have been found between
males’ and females’ degree of reliance on memory versus real-time derivation in
the production of morphologically complex words: Ullman et al. (2002) report
the results of several experiments that support the hypothesis that “females may
tend to memorize previously encountered complex representations (e.g., regular
past-tenses; played) that males generally compose on-line (play + -ed).” This
hypothesis would seem to predict that males should be somewhat more likely
than females to resort to an analogical pronunciation for a morphologically
complex item encountered on a wordlist (i.e., to compose the pronunciation “on-
line”), while females would be more likely to employ the pronunciation that is
most common in discourse. That prediction is borne out by the -mentary data,
which therefore supports the analysis of the reduced antepenultimate as an
analogical spelling pronunciation.
The effect of age on the reduced antepenult seems somewhat complicated,
from the logistic-regression results: it is the intermediate age groups, born
366
between 1943 and 1980, that show the highest rate of the reduced antepenult,
while the youngest and oldest groups appear to disfavor it. However, the oldest
age group’s low factor weight and low apparent rate of reduced antepenult may
be merely a statistical accident due to the relatively small number of older
speakers in the sample and (proportionally) even smaller number of stressed-
penult tokens produced by them: only 22 stressed-penult tokens were produced
by speakers born before 1943, of which one had a reduced antepenult (for a rate
of 4.5%). The intermediate age groups have a total of 16 reduced-antepenult
tokens out of 117 stressed-penult tokens, for a reduced-antepenult rate of 14%,
but Fisher’s exact test shows that the oldest age group does not differ
significantly from the intermediate groups (p > 0.2). On the other hand, the
youngest age group does differ significantly from the intermediate age groups
(p < 0.001), and even from all three other age groups combined (p < 0.002), with
three reduced-antepenult tokens out of 127 stressed-penult tokens (2.4%). So
perhaps it would be best to disregard the undersampled oldest age group for the
purposes of this analysis, and treat the age-group profile as indicating merely an
apparent-time decline in the reduced antepenult.
Such an apparent-time decline is relatively surprising, inasmuch as the
stressed penult itself appears to be increasing in apparent time. If the origin of
the stressed penult is an analogical change, and the reduced antepenult is, as
argued above, merely a further analogy in the same direction, one might have
expected the reduced antepenult to be the next stage in the same change, and
therefore to be increasing at the expense of the stress-clash form eleméntàry. But
the opposite is happening—the reduced-antepenult forms are receding, and

367
there is no evidence of them extending beyond wordlist style into any less
careful style. This may indicate that as the shift toward the stressed penult goes
to completion—i.e., as there is less and less variation in the community between
stressed and reduced penults in -mentary words—individual speakers are less
likely to feel uncertain of the pronunciation of a -mentary word, and therefore less
likely to resort to an analogical spelling pronunciation (such as the reduced-
antepenult variant) when such a word is encountered in a written wordlist.
6.3. Moving beyond the current sample
The region this dissertation is principally focused on is the eastern half of
the state of New York, since the chief dialectological goal of the project was to
identify the eastern boundary of the NCS, which was already known to be east of
Syracuse. Therefore nearly all of the speakers sampled for analysis in this
dissertation are located in the eastern half of the state, and so the discussion in
the preceding section can give us a clear idea of the distribution of the stressed
penult in -mentary only in that core sampled region. In the current sample, the
only direct indication we have of the extent of the stressed penult outside of the
eastern half of New York is two speakers from Geneva, both of whom produced
only stressed-penult tokens of -mentary, suggesting that the use of the stressed
penult extends much further west than the core region of study. To these can be
added two speakers whom I interviewed but did not analyze from Brockville,
Ont., located about ten miles upstream (southwest) from Ogdensburg on the
opposite side of the St. Lawrence River, which marks the U.S.–Canada border.
368
The two Brockville speakers used reduced variants for all -mentary words, which
suggests that the dominance of the stressed penult in New York’s North Country
does not extend across the boundary into Canada.
As mentioned above, other data on the status of -mentary beyond the
eastern part of New York State is hard to find. One unexpected, though
unreliable, source of information on -mentary is Wikipedia. The Wikipedia article
on Central New York14—defined as the region centered around Syracuse and
Utica, and thus spanning the western boundary of the core region sampled in
this dissertation—reports the following:
Many Central New Yorkers pronounce elementary as /ɛlʌmɛntɛɹi/ instead of the General American pronunciations of /ɛlʌmɛntɝi/ and /ɛlʌmɛntri/. The r-colored vowels in documentary and complimentary follow suit.
This remark was added to the Wikipedia article on 19 September 2007, with no
reference or explanation, by an anonymous contributor. While it is unwise to
take unreferenced claims made in Wikipedia as reliable data for research
purposes, at any rate this constitutes evidence that at least one other person has
seemingly independently noticed the stressed-penult pronunciation of -mentary
words, and in a region that extends somewhat further west than the bulk of my
sample.
Extending the known range of the stressed penult somewhat farther west,
Sinhababu (2007) performed, at my request, a small amount of informal
fieldwork in Rochester. He reports: “Four out of five women who grew up in
Rochester and go out on Thursday night pronounce ‘documentary’ with the
stress on the next-to-last syllable. The woman from Syracuse does too.” 14 http://en.wikipedia.org/wiki/Central_New_York, viewed on 16 August 2009.
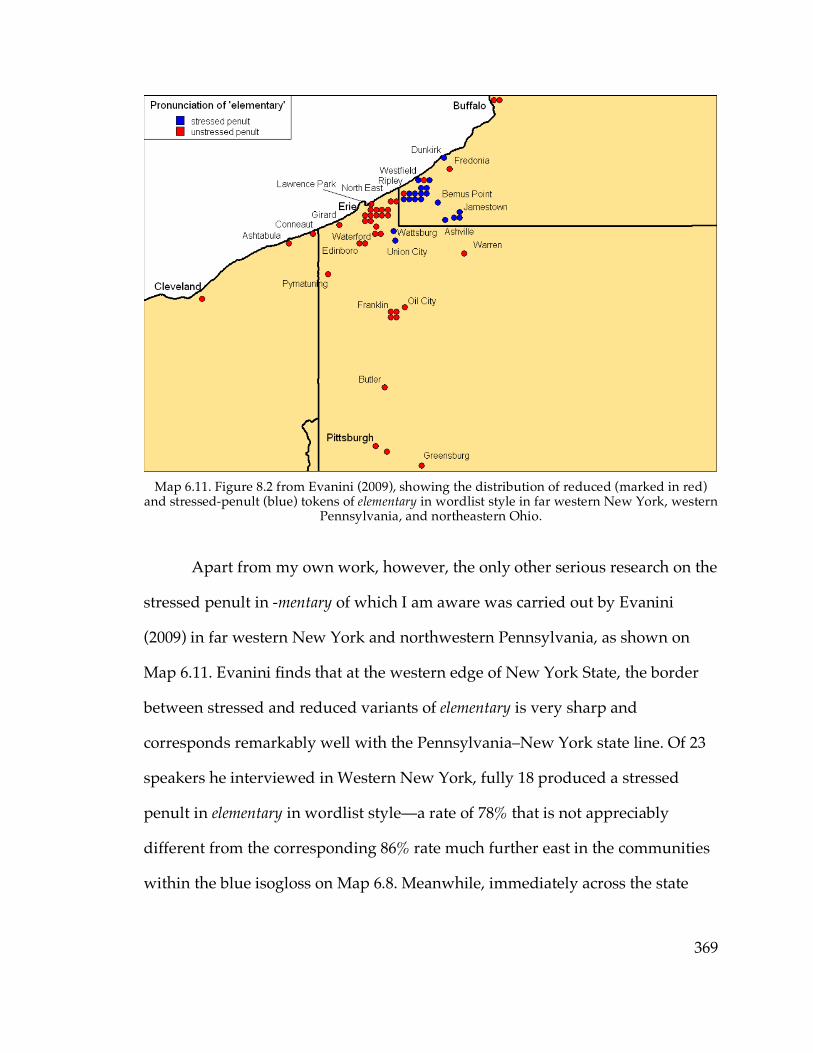
369
Map 6.11. Figure 8.2 from Evanini (2009), showing the distribution of reduced (marked in red)
and stressed-penult (blue) tokens of elementary in wordlist style in far western New York, western Pennsylvania, and northeastern Ohio.
Apart from my own work, however, the only other serious research on the
stressed penult in -mentary of which I am aware was carried out by Evanini
(2009) in far western New York and northwestern Pennsylvania, as shown on
Map 6.11. Evanini finds that at the western edge of New York State, the border
between stressed and reduced variants of elementary is very sharp and
corresponds remarkably well with the Pennsylvania–New York state line. Of 23
speakers he interviewed in Western New York, fully 18 produced a stressed
penult in elementary in wordlist style—a rate of 78% that is not appreciably
different from the corresponding 86% rate much further east in the communities
within the blue isogloss on Map 6.8. Meanwhile, immediately across the state
370
line in Erie County, Penna., 20 out of 22 speakers (91%) produced reduced
variants.
This juxtaposition of 78% stressed-penult immediately across the border
from 91% reduced (or more, if we were to include data from further south in
Pennsylvania) is unlike anything seen in the eastern half of New York State,
where even the relatively high rate of reduced -mentary in the so-called eastern
region reaches only 52% in wordlist-style elementary, hardly 91%. This seems to
amply justify identifying Chautauqua County—the westernmost county in New
York—plus the two stressed-penult speakers in Erie County, Penna. as the
extreme western limit of the stressed penult.
Evanini’s finding that the stressed-penult variants of -mentary exist at the
far western edge of New York State, combined with the scattered and less
reliable data from between Evanini’s region of study and my own, suggests that
stressed-penult -mentary may be found throughout the entire width of the state.
Moreover, while in the eastern part of New York State it is the oldest speakers
who show the lowest rate of stressed penult in elementary, Evanini’s work makes a
suggestion in the opposite direction: the only two speakers in Evanini’s sample
in Pennsylvania who produced the stressed penult were both over the age of 75
at the time they were interviewed, suggesting that the stressed penult may
actually be of relatively long standing but disappearing in apparent time on the
Pennsylvania side of the border. This seems to (weakly) support the hypothesis
that the stressed penult is expanding from west to east—in the eastern part of
New York State it is relatively new in apparent time, in that older speakers are

371
the least likely to use the stressed penult, but at the western edge of its (known)
distribution it at least appears to be of somewhat longer standing.
6.4. The rapid and anonymous school-district telephone survey
In order to gain a clearer picture of the distribution of the stressed penult
in -mentary, I carried out, with the assistance of Keelan Evanini, a rapid and
anonymous telephone survey of the pronunciation of elementary across the entire
state of New York and parts of adjacent states (Dinkin & Evanini 2009). The
methodology of this survey was inspired by a rapid and anonymous survey of
the caught-cot merger carried out by William Labov in 1966 and described in
ANAE as follows:
At that time, long distance telephone operators were more locally situated than at present. The basic paradigm was to ask for the number for a name pronounced as [hæri hak], using a low central vowel for the surname. Hawk is a more common surname than Hock, and in the areas where the merger was dominant, the operators would unhesitatingly search for Harry Hawk. The name was usually not found. The investigator then asked the operator if she had looked for Harry [H-A-W-K]. In the one-phoneme area, the answer was normally ‘yes’; in the two-phoneme area, the normal response was ‘no’. (p. 65)
Just as it was relatively easy in 1966 to elicit perceptual judgments of
minimal pairs from telephone directory-assistance operators, since part of their
job was to infer the spelling of names pronounced to them by people over the
telephone, there is a class of people from whom it is relatively easy to elicit
pronunciations of elementary over the telephone: receptionists at schools and
school-district offices. In order to map the distribution of the stressed-penult
pronunciation of elementary, the word was elicited during telephone calls to
372
district offices and elementary schools in 185 school districts across New York
and nearby parts of adjacent states.
In 56 of the 62 counties15 in New York State, pronunciations of elementary
were collected from two school districts as part of this study. In most cases the
districts chosen were the one containing the most populous city or village in the
district, and a second one in a geographically distinct part of the county from the
first one. When it proved impossible to elicit a token of elementary from two
districts meeting that collective description, we simply called whatever two
districts we could get data from, as far apart geographically as possible. Data was
also collected from counties in Pennsylvania, Massachusetts, Vermont, and
eastern Ontario along the border with New York State, and additional districts as
far into each as necessary until stressed-penult tokens stopped appearing. In
some of the Northern Tier of counties in Pennsylvania, data was collected from
more than two districts in order to be able to define the outer geographical limit
of the stressed penult more precisely; and in the two most populous counties
located just south of the Northern Tier (Lackawanna County, containing
Scranton, and Lycoming County, containing Williamsport), a much larger
amount of data was collected in order to have a better sample of the most
densely-populated parts of northern Pennsylvania.
The question asked to elicit the token of elementary varied depending on
what type of office was reached. Typical questions used when calling school-
15 The six exceptions were Hamilton County and the five counties that make up New York City. Since New York City is a single speech community and (as will be seen) apparently well outside the range of the stressed penultimate, only one school was called and one data point collected in the city. No data was collected in Hamilton County because Hamilton County is extremely sparsely populated and contains very few schools, none of which seem to contain the word elementary in their names.
373
district offices included “How many schools of each age group are there in this
district?” (“…three elementary schools”) in districts containing a large number of
schools, and “What are the names of the principals of the schools in this district?”
(“The principal of the elementary school is…”) in districts containing a relatively
small number of schools. When phoning elementary-school offices, frequently-
used questions included “What is the full name of this school?” (with the hope of
eliciting, for example, “Banford Elementary School”) and simply “Is this a
middle school?” (“No, it’s an elementary school”). In a few cases, we were lucky
enough that the person answering in an elementary school office would simply
state the name of the school, including the word elementary, upon picking up the
phone. Whenever it could be done realistically, the investigator would then say
“I’m sorry, say that again?” in order to elicit a second token of the word
elementary, following the technique originally developed by Labov ([1966] 2006)
in the well-known rapid and anonymous study of rhoticity in New York City
department stores.
More district offices than individual school offices were called, on the
grounds that calls were being made in the summer (of 2008) and therefore
district offices were more likely to be staffed. Whenever a voicemail message was
encountered that contained the word elementary (e.g., “You have reached Banford
Elementary School” or “To reach the elementary school office, press 2”), the
pronunciation of elementary was noted, but every effort was made to reach an
actual speaker. However, districts in which it proved impossible to reach a living
speaker but one or more tokens of elementary were collected from voicemail
recordings are included in the data. This includes only six school districts in New
374
York State, but larger fractions of those in the adjoining states, many of which
were called later in the afternoon or evening when the offices were more likely to
be closed. In particular, nearly all of the data collected from school districts in
Pennsylvania further south than the Northern Tier of counties is voicemail data
only.
This rapid and anonymous school-district study suffers, of course, from
the disadvantage of all rapid and anonymous studies: it is impossible to be
certain that the respondents—the people who work in schools or school-district
offices—are natives of the communities in which they work. This leads to an
inescapable level of imprecision in the data. We cannot deny the possibility, of
course, that the secretary of the superintendent of schools in any particular
community in Upstate New York may have moved to New York State as an
adult and therefore not pronounce elementary in a manner representative of the
community she is taken as a sample of; however, the regional consistency of the
stressed penult, as will be seen below, seems to indicate that this is not too
serious a concern. More probably of importance in the interpretation of the
results, however, is the possibility that individuals may commute across the
isogloss. That is to say, the results of Evanini (to appear) on the western edge of
the New York–Pennsylvania border indicate a very sharp boundary between
regions where the stressed-penult and reduced variants of elementary dominate;
it is therefore possible that a speaker might be a native and resident of a
community in (for example) the stressed-penult region, but work in a school-
district office of a community a few miles away in the reduced-penult region. For
this reason the exact location of the isogloss between stressed-penult and reduced
375
variants should not be taken as totally reliable, although it can be taken as
indicating general regions.
Moreover, the results from the school-district study are not strictly
comparable to the interview results. The school-district study collected only
tokens of elementary, while the interview results contain a variety of -mentary
words. It was observed earlier in this chapter that elementary is the lexical item
least favorable to the stressed penult, and so it may well be that some of the
school-district speakers who produced reduced variants of elementary would
have produced stressed-penult tokens of, for example, documentary if those had
been elicited. Furthermore, the great strength of the rapid and anonymous
methodology—that it elicits natural speech from respondents who are unaware
their speech per se is being observed—is actually a disadvantage in this case, as it
was found above that more natural speech styles may actually inhibit the
production of the stressed penult. This implies that the interview data, in which
the majority of -mentary tokens were elicited through formal methods, would
show a higher probability of stressed penult than a rapid and anonymous school-
district inquiry in the same community. In other words, for both lexical and
stylistic reasons, the school-district study is likely to underestimate the density
and geographic extent of the stressed-penult -mentary.
Map 6.12 shows the results of the school-district study, representing
districts where only stressed-penult tokens were collected with blue points,
districts where only reduced tokens were collected with red points, and districts
where both were collected (either from multiple speakers or in multiple tokens of
elementary from a single speaker) with yellow points. The red isogloss outlines

376
the full geographic extent of the stressed penult in the school-district data; only
reduced variants were produced outside the red line.
Map 6.12. Results of the rapid and anonymous telephone study of elementary, with the isoglosses
from Map 6.8 above superimposed.
As predicted, the red isogloss outlines a smaller area than that in which
stressed-penult -mentary is known to be attested: both Westfield and
Poughkeepsie fall outside the isogloss but have stressed-penult tokens of
elementary recorded in interview data. Similarly, there are several communities in
which a majority of interviewed speakers produced stressed-penult elementary in
elicitation style but only reduced variants were collected in the school-district
study: Saratoga Springs, Gloversville, Utica, Cooperstown, Geneva, Rochester
377
(according to Sinhababu 2007), and Westfield. By contrast, there are six
communities in New York State with both interview data and school-district data
in which less than a majority of interviewed speakers produced stressed-penult
elementary (Lake Placid, Glens Falls, Schenectady, Amsterdam, Poughkeepsie,
Buffalo); Glens Falls is the only one of these six to have any stressed-penult
tokens produced in the school-district study.
Although the total geographical area in which the stressed penult is found
in the school-district study is smaller than the area in which it is known to exist
in interview data, the school-district study agrees with the interview data in
showing that the frequency of the stressed penult declines from west to east. In
the area enclosed between the red and green isoglosses on Map 6.12—i.e., within
the area of incidence of the stressed penult in the school-district study, but in the
“eastern region” where -mentary scores from interview data are 0.5 or less—there
are a total of 25 sampled districts (including two in Vermont). Among these 25,
the stressed penult and the reduced variants are about equally frequent: there are
ten blue points (representing exclusive used of the stressed penult) and nine red
points (representing exclusive reduced variants). In the area between the green
and blue isoglosses, where the interview data shows -mentary scores between
0.65 and 0.8, the distribution is about the same as in the eastern region: four blue
points and three red points. In the large northern, western, and central region,
however, the picture is quite different: there are 73 districts sampled in the area
bounded by the red and blue isoglosses (including ten in Pennsylvania); among
these there are only seven red points and fully 54 blue points: a ratio of eight to
378
one in favor of the stressed penult, in contrast to the more or less even split in the
eastern region (from which it differs significantly: p ≈ 0.001).
There may be an effect of city size playing a role in the results of the
school-district survey. The nine most populous cities within the region in which
the stressed penult is attested are Buffalo, Rochester, Syracuse, Albany,
Schenectady, Utica, Niagara Falls, Troy, and Binghamton, all of which had
populations of more than 40,000 as of the 2000 U.S. Census. In only one third of
those nine cities (Syracuse, Niagara Falls, and Binghamton) were stressed-penult
tokens collected in the school-district survey; whereas fully 87% of the remaining
97 districts (i.e., 84 of them) produced at least one stressed-penult token. Despite
the small number of cities of 40,000 or more, this difference is significant at the
p < 0.001 level. This may represent a greater resistance of larger cities to the
spread of the stressed penult in -mentary, though it may merely mean that larger
cities are more likely to have people answering the telephones in school offices
who were born outside of the region. The possibility that larger cities resist the
stressed penult is weakly supported by the fact that Buffalo, the largest city in
Upstate New York, is also the only community in New York State with interview
data from more than one speaker (in this case two speakers, interviewed by
Evanini) in which only reduced-penult tokens of elementary were collected, even
in wordlist style.
379
6.5. Analysis of isoglosses
Map 6.12 indicates that the stressed penult in elementary is nearly, but not
exclusively, limited to the state of New York. Two towns in Vermont show the
stressed penult in the school-district study, both of which are directly on the
New York state line; of the communities in Pennsylvania in which the stressed
penult is found, none is more than 20 miles or so from the New York border. So
it would be only a slight exaggeration to say that the stressed penult in -mentary
is a feature proper to New York State.
The closest match between a -mentary isogloss and the boundary of New
York, as seen on Map 6.12, is found in the North Country, at the New York–
Ontario16 border and the northern end of the New York–Vermont border—here
none of the Vermont or Ontario districts show the stressed penult, and most of
the New York districts do, including the ones closest to the border. The
coincidence between the sharp isogloss and the international boundary is
reminiscent of some sharp lexical isoglosses found by Chambers (1994),
coinciding with the boundary between Western New York and the “Golden
Horseshoe” region of Ontario, and seems to support Boberg (2000)’s hypothesis
that the international boundary impedes the diffusion of linguistic change. The
boundary between New York and Vermont here is formed by Lake Champlain,
which is spanned by road bridges only at its extreme northernmost and
southernmost points—thus, for example, although Burlington, Vt. and
Plattsburgh, the two largest cities on Lake Champlain, are only 20 miles apart on 16 We did not attempt collect data from Quebec because of the unlikelihood of finding Anglophone schools close to the border with the word elementary in their names.
380
opposite sides of the lake, it takes over an hour to get from one city to the other
by car and ferry. The correspondence here between the isogloss and the state
boundary may therefore be a simple case of a linguistic boundary coinciding
with a natural obstacle to transportation and communication.17
Evanini (2009)’s data shows that, at the western edge of New York State,
the -mentary isogloss corresponds relatively closely to the state line, with 86% of
speakers in Chautauqua County, but only two out of 22 speakers on the
Pennsylvania side of the boundary, using the stressed penult. The sharpness of
the boundary is emphasized by the communities of Ripley, N.Y. and North East,
Penna., which are immediately adjacent on opposite sides of the border. In North
East, the two speakers sampled by Evanini use reduced variants in wordlist-style
elementary; in neighboring Ripley, ten out of eleven use stressed-penult variants.
The sharpness of the boundary is all the more striking in its lack of
correspondence to the phonological isoglosses—Evanini finds that Ripley
patterns phonologically with communities on the Pennsylvania side of the
boundary, rather than with the Inland North communities elsewhere in
Chautauqua County, in that it lacks the NCS and has a well-advanced caught-cot
merger.
Evanini’s overall finding is that the area of northwestern Pennsylvania
around the city of Erie, although historically part of the Northern dialect region,
never underwent the NCS, and has in many (though not all) respects moved in
17 In Chapter 5, on the other hand, it was hypothesized that the caught-cot merger had spread into the Plattsburgh area from Vermont; if true, that means that Lake Champlain cannot be a total barrier to the spread of linguistic change. However, mergers are the most easily diffused of all linguistic changes; moreover, the apparent-time data seems to indicate that the merger is substantially newer to Plattsburgh than to Burlington, meaning the lake may have impeded the merger’s advance somewhat in any case.

381
the direction of features associated with the rest of Western Pennsylvania rather
than the North. Ripley, although on the New York side of the border, is grouped
with northwestern Pennsylvania in this respect, although in apparent time it lags
behind the communities in Pennsylvania proper in its adoption of Western
Pennsylvania features such as the caught-cot merger. Now, the presence of two
elderly speakers in Erie County, Penna. who produced stressed-penult tokens of
elementary in Evanini’s interview data may indicate that the stressed penult was
formerly more prevalent in the northwestern corner of Pennsylvania than it is
now. In this case, the stressed penult in -mentary may be regarded as just another
one of the “Northern” features that northwestern Pennsylvania has abandoned
in its move towards more Western Pennsylvania–associated features. In that
case, the reason the -mentary isogloss is so close to the state line here is that
Ripley lags behind the communities on the Pennsylvania side of the border in
retreating from Northern features.
Further evidence for considering the stressed penult in -mentary to be a
Northern feature, rather than strictly speaking a New York State feature, can be
had by looking further eastward along the New York–Pennsylvania border.
Mid–20th century dialectological research grouped the Northern Tier of
Pennsylvania counties with New York State as part of the Northern dialect
region on both phonetic and lexical criteria (Kurath 1949; Kurath & McDavid
1961); I am not aware of any recent detailed research along this line to see how
the mid–20th century isoglosses have held up with respect to present-day
features such as the NCS. The -mentary isogloss on Map 6.12, however, seems to
reflect this pattern: the northernmost communities in Pennsylvania are relatively
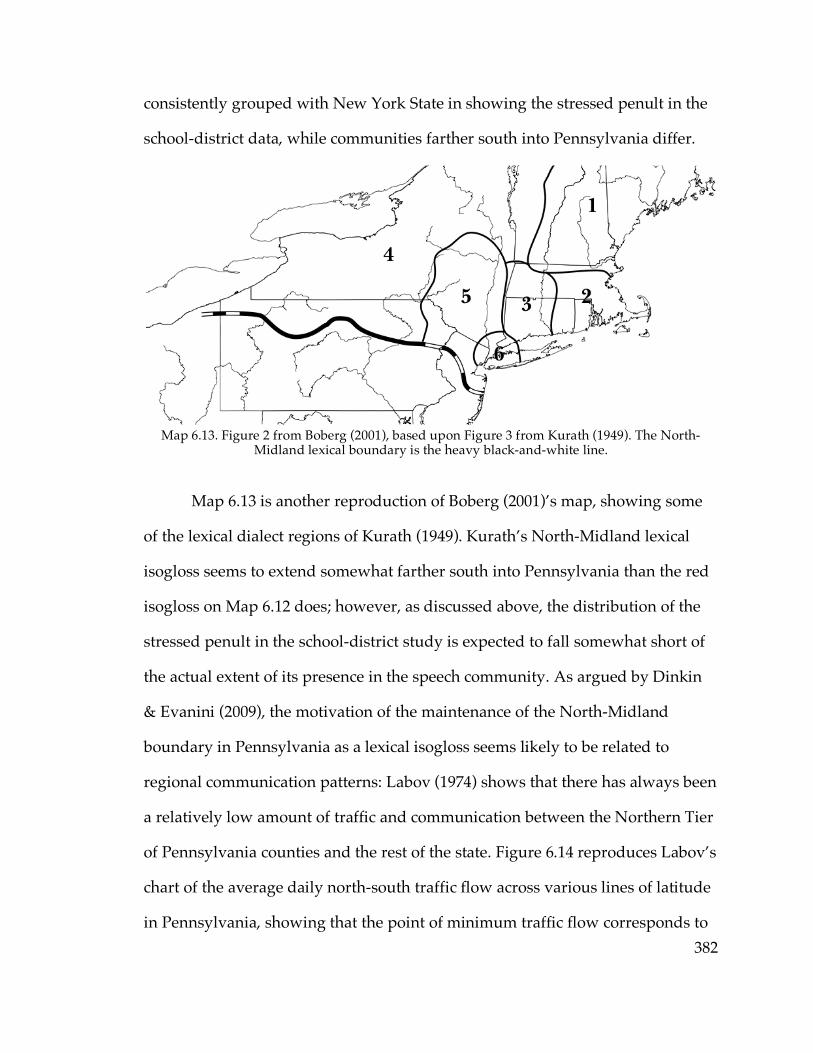
382
consistently grouped with New York State in showing the stressed penult in the
school-district data, while communities farther south into Pennsylvania differ.
Map 6.13. Figure 2 from Boberg (2001), based upon Figure 3 from Kurath (1949). The North-
Midland lexical boundary is the heavy black-and-white line.
Map 6.13 is another reproduction of Boberg (2001)’s map, showing some
of the lexical dialect regions of Kurath (1949). Kurath’s North-Midland lexical
isogloss seems to extend somewhat farther south into Pennsylvania than the red
isogloss on Map 6.12 does; however, as discussed above, the distribution of the
stressed penult in the school-district study is expected to fall somewhat short of
the actual extent of its presence in the speech community. As argued by Dinkin
& Evanini (2009), the motivation of the maintenance of the North-Midland
boundary in Pennsylvania as a lexical isogloss seems likely to be related to
regional communication patterns: Labov (1974) shows that there has always been
a relatively low amount of traffic and communication between the Northern Tier
of Pennsylvania counties and the rest of the state. Figure 6.14 reproduces Labov’s
chart of the average daily north-south traffic flow across various lines of latitude
in Pennsylvania, showing that the point of minimum traffic flow corresponds to

383
(or is even slightly north of) the North-Midland isogloss. On the other hand,
Evanini (2009) finds that there has always been a relatively high degree of
communication between northwestern and southwestern Pennsylvania. Thus the
-mentary isogloss appears to match Pennsylvania’s regional communication
patterns in grouping most of the Northern Tier with New York State, but
grouping the northwestern corner of Pennsylvania with the region south of it.
Figure 6.14. A reproduction of Figure 12.6 from Labov (1974), showing the index of traffic density
across each of seven east-west lines across Pennsylvania.
The largest discrepancy between the Kurath lexical isogloss and the
school-district -mentary isogloss is in the area of Scranton, Penna.: as Map 6.12
shows, the school-district study collected data from 14 communities surrounding
and including Scranton (in Lycoming, Wyoming, and Luzerne Counties) and
found not a single token of stressed-penult elementary. Kurath’s North-Midland

384
isogloss, however, as seen on Map 6.13, easily reaches far enough south to
include the entire vicinity of Scranton18 as part of the North, and even ANAE
includes Scranton as part of the Inland North in some maps. Despite Scranton’s
inclusion in the North, however, neither of the two Telsur speakers in Scranton
has an NCS score of 4 or more—they score 1 and 3, which would not be sufficient
to include Scranton in even the Inland North fringe by the standards of the
present work, let alone the Inland North core. Moreover, Herold (1990) reports
the presence of the caught-cot merger in Scranton, further distinguishing it from
the Inland North. So notwithstanding the fact that Scranton is historically part of
the linguistic North, it does not appear to be sufficiently closely tied to the Inland
North to be subject to the NCS. Scranton’s nonparticipation in the NCS is
mirrored by the absence in the Scranton area of the nearby Northern stressed
penult in -mentary, although not enough research has been done on the Scranton
area to explain what the cause of its separation from the rest of the North is, or
whether the north-south traffic minimum in the eastern part of Pennsylvania
specifically runs to the north or south of Scranton.
So far it looks as if the stressed penult in -mentary originated in the Inland
North core of New York State (and northern Pennsylvania), and either failed to
spread into or retreated from some historically Northern areas in which the NCS
never took place. But it appears to be still in the process of spreading into and
through the eastern part of the state—into the regions described in this
dissertation as the Inland North fringe, Hudson Valley, and North Country. The
eastward expansion of stressed-penult -mentary is in some respects reminiscent 18 Scranton is located near the sharp bend in the Susquehanna River in northeastern Pennsylvania, which is visible on Map 6.13 as being just north of the North-Midland boundary.
385
of the pattern of diffusion of the NCS, as discussed in previous chapters: NCS
features appear to have spread eastward from the Inland North core to the
Inland North fringe; and the backing of /e/ spread into the Hudson Valley as
well although substantial raising of /æ/ did not. Indeed, just as the NCS appears
to have continued spreading eastward from the Glens Falls area to the point that
it occurs in one Telsur speaker in Rutland, Vt., the easternmost extent of the
stressed penult in elementary in the school-district study is two towns in Vermont
along the New York border, not too far from Glens Falls.19 However, the stress
pattern of -mentary words is essentially a lexical feature that does not depend on
the structure of the vowel system, and for that reason the stressed penult spreads
eastward irrespective of the phonological status of the communities it spreads
into: the area in which the stressed penult is most frequent and the area in which
is it least frequent both include Inland North, Hudson Valley, and North
Country communities. Thus, while the path of advancement of the NCS is
constrained by the differing phonologies of the communities it might spread
into, the path of the stressed penult might in some sense be taken to be the most
natural path for the west-to-east advance of linguistic innovations in New York
State—i.e., the route along which dialect features diffuse if there are no linguistic
constraints interfering with the course of diffusion.
Identifying the location of the southeastern boundary of the stressed
penult is a bit of a challenge. As Map 6.12 shows, the southeasternmost extent of
the stressed penult in the school-district study is an arc roughly 80–100 miles
north of New York City; if the east-west component of New York–Pennsylvania 19 Rutland itself was not sampled in the school-district survey because the city does not appear to contain any schools with elementary in their names.
386
boundary were projected eastward, or the Massachusetts-Connecticut boundary
projected westward20, it would roughly coincide with the red isogloss.
Poughkeepsie is south of this line, however, and it is known from interview data
that the stressed penult occurs in elementary and other -mentary words in wordlist
style in Poughkeepsie. So the actual southeastern limit of the stressed penult
must be 40 miles or more south of where the red isogloss appears on Map 6.12.
However, the fact that there are no tokens of the stressed penult attested in the
southeastern part of New York State in the school-district study seems to indicate
that the southeastern boundary of the stressed penult must not be too far beyond
Poughkeepsie in any case.
Recall that, as shown above, the two large regions’ -mentary scores from
interview data seem to correspond fairly well to the frequencies of the stressed
penult in them from school-district data. In the area bounded by the red and
green isoglosses on Map 6.12, 64% of school districts produced at least one
stressed-penult token of elementary, and the average individual -mentary score
among the interviewed speakers in this area is 0.6. In the area bounded by the
red and blue isoglosses, 90% of school districts produced at least one stressed-
penult token, and the average individual -mentary score is about 0.88.21 So in the
area southeast of the red isogloss, where no school district produced a single
stressed-penult token, the best hypothesis seems to be that the stressed penult in
-mentary vanishes fairly rapidly any further south than Poughkeepsie.
20 The result of this geometric operation will be referred to below as the “projected line”. 21 It remains approximately 0.88, in fact, regardless of whether only interviews conduced by me are considered or whether Evanini’s and Sinhababu’s speakers are included in calculating the average.
387
While the outer limit of the stressed penult along the New York–
Pennsylvania border corresponds roughly to the location of the Kurath (1949)
North-Midland lexical boundary, the hypothesized location of the southeastern
limit of the stressed penult does not clearly correspond to any known isogloss.
While the immediate area around New York City is excluded from the stressed
penult, the area of exclusion seems larger than the immediate New York City
dialect area (labeled “6” on Map 6.13). At the same time, it is certainly smaller
than Kurath’s Hudson Valley dialect area (labeled “5”). This dissertation’s
“Hudson Valley core” region, defined as the region subject to the diffusion of
characteristic features of the New York City dialect, includes Poughkeepsie and
extends some distance north from there, so the area of absence of the stressed
penult doesn’t correspond to the Hudson Valley core, either.
While it does not correspond to any known linguistic boundary, the
southeastern limit of the stressed penult does appear to correspond to a well-
known cultural boundary: the boundary between Upstate and Downstate New
York. While the exact location of the boundary between “Upstate” and
“Downstate” is notoriously hard to formalize, Upstate can be loosely
characterized as that part of New York State that is far enough north to be
beyond the immediate influence of New York City in some sense—for example,
outside the New York City media market, or far enough away that few locals
commute to New York City for work. For example, Empire State Development, a
state-run agency for promoting economic development, defines “Downstate” as
388
including Long Island, New York City, and the five closest counties north of
New York City, and “Upstate” as the rest of the state22.
The saliency of “Upstate” versus “Downstate” as a boundary between two
distinct parts of New York State is supported by a map-drawing task I asked
most of my in-person interview subjects in the summer of 2008 to perform.
Subjects were given a mostly-blank outline map of New York State, labeled only
with the caption “New York - The Empire State” and the locations of a few cities
(New York City, Albany, Syracuse, Binghamton, Buffalo, Plattsburgh, and either
Watertown and Ogdensburg or Oneonta) and asked to draw lines on the map in
order to divide the state into its major subregions. A total of 20 individuals in
Oneonta23, Sidney, and Cooperstown performed this task, as well as 14 in
Ogdensburg and Canton. The amount of detail in these hand-drawn maps varied
widely: a few respondents divided the state into a large number of relatively
small regions, giving them labels like “Capital District”, “Hudson Valley”,
“Central New York”, “Southern Tier”, and so on; a few others divided the state
broadly into quarters and labeled them merely, for instance, “north”, “east”,
“south”, and “west”. But all but three of the 20 subjects in the Oneonta area24
separated off New York City and the area immediately north of it from the rest of
the state, using a boundary line at least 35 or so miles north of New York City
22 These definitions are found in a document available at http://www.empire.state.ny.us/UpstateDownstateFund/Guidelines051109.pdf, viewed 23 August 2009. 23 These are the Oneonta speakers interviewed in 2008, whose interviews were not phonetically analyzed. 24 Interestingly, the subjects from Ogdensburg and Canton did not consistently separate a “Downstate” or New York City area from the area north of the projected line—only five of fourteen did so, suggesting that individuals substantially farther north than the conventional Upstate-Downstate boundary are less cognizant of it. Those in Ogdensburg and Canton who labeled some area as “Upstate” gave that name to the North Country or part of it; a few labeled as “Downstate” a region including both New York City and Albany.
389
and no farther north than approximating the projected line of the east-west
Pennsylvania border; many labeled the area south of this line with some such
moniker as “Downstate” or “The City”.25 These seventeen Upstate/Downstate
boundaries are shown superimposed on Map 6.15.
The second most salient subregion of New York State, based on this task,
is Western New York: 16 out of the 20 maps drawn by Oneonta-area residents
included some kind of boundary separating Buffalo and the western extremity of
the state from Syracuse and locations further east (Rochester was not marked on
the blank map), usually with the label “Western NY”; these lines are also shown
on Map 6.15. Now, despite the fact that Western New York and much of Central
New York are within the Inland North core and share the NCS, the salient
regional division between Western and Central New York is reflected in
linguistic reality: to a good approximation, Western New York is the only part of
the state where pop is used rather than soda to mean ‘soft drink’ (ANAE;
Campbell 2003). So the salient regional division is reflected not in the patterns of
sound change, but in the distribution of a lexical variable. By the same token,
then, although the salient division between Upstate and Downstate New York
does not appear to correspond neatly to any major phonological dialect
boundaries, it does seem to approximately represent the southeastern boundary
of the stressed penult in -mentary. In other words, while the geographical
advance of sound change is constrained by the phonological systems of the
surrounding regions, which are not easily changed through diffusion, the spread
of relatively recent lexical variants appears to more or less reflect the general folk 25 Several had more than one labeled region south of such a line—distinguishing Long Island from New York City, for example, and a larger labeled “Downstate” region from both of them.
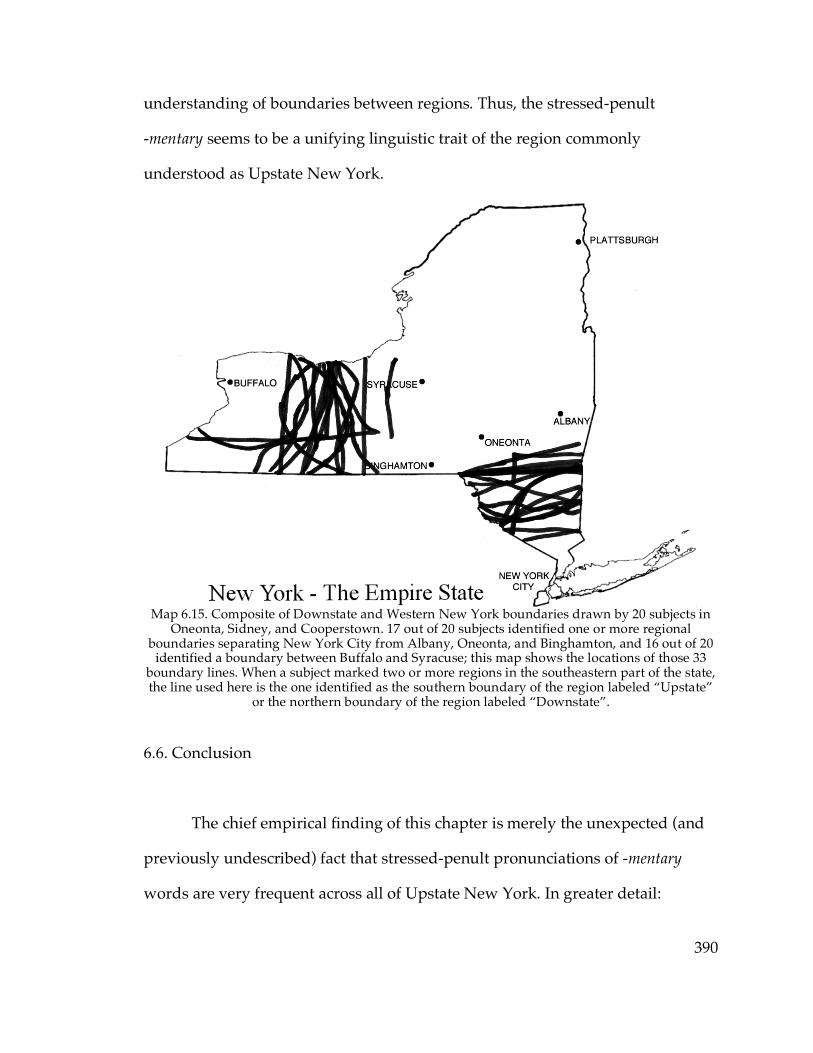
390
understanding of boundaries between regions. Thus, the stressed-penult
-mentary seems to be a unifying linguistic trait of the region commonly
understood as Upstate New York.
Map 6.15. Composite of Downstate and Western New York boundaries drawn by 20 subjects in
Oneonta, Sidney, and Cooperstown. 17 out of 20 subjects identified one or more regional boundaries separating New York City from Albany, Oneonta, and Binghamton, and 16 out of 20
identified a boundary between Buffalo and Syracuse; this map shows the locations of those 33 boundary lines. When a subject marked two or more regions in the southeastern part of the state, the line used here is the one identified as the southern boundary of the region labeled “Upstate”
or the northern boundary of the region labeled “Downstate”.
6.6. Conclusion
The chief empirical finding of this chapter is merely the unexpected (and
previously undescribed) fact that stressed-penult pronunciations of -mentary
words are very frequent across all of Upstate New York. In greater detail:

391
• The stressed penult appears to be increasing in apparent time; the
word elementary lags the change.
• A region along the eastern edge of New York State has a lower
frequency of the stressed penult than the rest of the state; the
boundaries of this region do not resemble the dialect regions defined
in previous chapters.
• The stressed penult extends out of New York State into the Northern
Tier of counties in Pennsylvania, but it is not found in northwestern
Pennsylvania or any further south in New York than Poughkeepsie.
These findings are interpreted as confirming that the stressed penult is the
result of an analogical change in the morpheme -ary, even in the eastern region
where the stressed penult is less prevalent; this suggests that an analogical
change in a morpheme can be the object of dialect diffusion. The locations of the
-mentary isoglosses suggest that, in the absence of interaction with systematic
phonological structure, the geographical distribution of lexically-specific (or
morpheme-specific) features will be shaped by communication patterns and
perhaps by boundaries between overtly recognizable regions.
The final chapter will draw some general comparisons and conclusions
about the structure of dialect boundaries and diffusion, based on the discussion
in this and the preceding three chapters.
392
Chapter 7
Conclusions
7.1. Defining dialect boundaries
One of the core goals of this dissertation was to locate the boundaries
between the dialect regions of New York State, in order to determine the nature
of the boundaries and the linguistic behavior of speakers in the communities
located closest to them. Several sets of communities have been identified as
dialect regions by analyzing the data from the Upstate New York sample, and
referred to by such names as “Inland North fringe”, “Hudson Valley core”, and
“North Country”. However, the ontological status of such collections of
communities as dialect regions is not immediately obvious. There are, after all,
both differences and similarities among these supposed regions, and it is not a
priori necessary that the differences between the sets of communities that have
been referred to up to this point as dialect regions should be allowed to outweigh
the differences within the notional regions, or the similarities between them. For
example, on the one hand the Inland North core exhibits raised /æ/, a feature of
the NCS, and the Hudson Valley essentially does not. On the other hand, the
backing of /e/ is another feature of the NCS, and the Hudson Valley exhibits
even more backing of /e/ than the western component of the Inland North does
(Michigan, northern Illinois, etc.), though less than the Inland North
communities in Upstate New York. To simplify the question, is it justified to
393
exclude the Hudson Valley from the Inland North on the basis of /æ/, rather
than including it on the basis of /e/?
In fact, of the features studied in this dissertation, relatively few seem to
respect the boundaries between the notional dialect regions. The isoglosses for
stressed penult in -mentary, of course, show no relationship whatsoever with any
of the boundaries between the notional dialect regions discussed in earlier
chapters. But even the phonetic and phonological features, though they may
differ in advancement between the different regions, nevertheless show clear
indications of diffusion across the boundaries between regions. While the NCS
raising of /æ/ stops relatively abruptly at the edge of the Inland North, and is
mostly absent in the Hudson Valley and entirely absent in the North Country,
the backing of /e/ (as mentioned above) extends into them both. Both the
fronting of /o/ (relative to non–Northern dialect regions) and the backing of /o/
(in apparent time) are shared by both the Inland North and the Hudson Valley
fringe, although both features are less extreme in the Hudson Valley than in the
Inland North core or fringe. This same backing of /o/ is an indication that the
influence of the caught-cot merger is not confined to the North Country, even
though only in the North Country (and Cooperstown) is the merger relatively
advanced in perception; the transfer of (olC) words such as revolve from /o/ to
/oh/ is also found throughout the Inland North and Hudson Valley fringes. The
nasal /æ/ system predominates in the Hudson Valley fringe but is found
frequently in the Inland North fringe as well. So it now begins to seem as if the
only feature that reliably correlates with the major regional boundary posited in
this dissertation is the raising of /æ/. So in order to identify the eastern
394
boundary of the Inland North, we have seemingly drawn a line based on a single
feature, while other features are shared on both sides of the boundary. Is this
really a good method?
An alternative approach would be to forgo the aim of having relatively
clearly identified linear boundaries, in favor of defining dialect regions with both
high internal homogeneity and distinctly different features from one another.
Under that system, regions with clearly-defined distinctive linguistic innovations
might be separated from each other by very large intermediate or transitional
regions that are not assigned full membership in either. Thus, for example, we
might define the Inland North as the region with full participation in the NCS,
including raised continuous /æ/, backed /e/, and fronted /o/, with (at least in
New York State) the stressed penult in -mentary and the beginnings of a long-
term trend toward caught-cot merger; and define the New York City dialect
region as the area with the characteristic New York City split /æ/ system, raised
/oh/, and no stressed penult in -mentary. From that point of view, most of the
regions defined and communities sampled in the southeastern and central part of
New York State in this project would constitute merely a broad transitional area
between the Inland North and New York City, with varying degrees of the
features of one or the other of the regions. So the Inland North fringe has less
advanced and less consistent participation in the NCS changes than the Inland
North core does, with a higher frequency of phonologically discrete /æ/
allophony (i.e., the nasal /æ/ system). The Hudson Valley fringe shows some
but not all NCS features, with the nasal /æ/ system fully dominant. In the
Hudson Valley core, NCS features are further reduced, /oh/ is raised, and the
395
diffused /æ/ system begins to be found—still a phonologically discrete pattern
of allophony, but with a greater resemblance to the phonemic split of New York
City. Meanwhile, across all of these regions, the frequency of the stressed penult
in -mentary declines from northwest to southeast. So the areas in between the
Inland North core and New York City have no particular distinctive linguistic
features of their own, at least as far as the variables examined in this dissertation
are concerned; the closest they get to having distinctive features are the nasal
/æ/ system in the Hudson Valley fringe and the diffused system in the Hudson
Valley core, which are phonologically intermediate between the continuous
distribution and the New York City system. The Inland North fringe and
Hudson Valley are, from this point of view, merely the manifestation of the
gradual boundary between the Inland North and New York City. By the same
token, the North Country and the northern part of the Inland North fringe can be
regarded as the gradual boundary between the Inland North core and Canada.
However, the approach of identifying just a few key dialect regions with
major features and regarding everything else as merely a transitional or
intermediate region between the dialects is not very satisfying. It fails to take into
account, for example, the internal structural relationships between the changes
involved in the NCS, so that a region which is subject to all the NCS features to a
reduced degree and a region which is subject to only some of them are given
more or less equal status as possessing “intermediate” degrees of the NCS, with
one merely closer to the Inland North than the other. Similarly, it is not capable
of explaining the irregular distribution of linguistic features within the broad
transitional areas; for instance, regarding the northern part of the Inland North

396
fringe and the North Country as just a transitional region between the Inland
North and Canada misses the fact that Ogdensburg has a higher degree of Inland
North features than Canton does despite being closer to Canada. Such an
approach would likewise ignore the striking correlation between high NCS
scores and early settlement from southwestern New England. Finally, it simply
seems inelegant to describe a fairly large geographical area, the Hudson Valley
fringe, as merely part of a transitional zone between two regions with neither of
which it shares many of the most distinctive features—or as part of no dialect
region at all.
Now, it is certainly true that most of the features studied in this
dissertation show signs of having diffused across the boundaries between the
posited dialect regions; and there does seem to be something questionable about
defining a dialect “boundary” that dialect features can move across relatively
freely. However, this concern leads directly to a criterion for defining dialect
boundaries in a meaningful way. If it’s not appropriate to separate communities
into different dialect regions when linguistic features can diffuse freely between
them, then we can define a boundary between dialect regions to be located
where there is an obstacle to diffusion—a line that some feature or set of features
which is relatively prevalent on one side of the line is prevented from diffusing
across. ANAE hints in this direction by not using mergers as principal criteria for
defining dialect regions—for instance, despite their completed caught-cot merger,
ANAE includes southern West Virginia and eastern Kentucky in the South rather
than in the Western Pennsylvania dialect area. This is because of Herzog’s
Principle that mergers expand at the expense of distinctions: if mergers have
397
such an expansive tendency, then presumably they should be able to expand
across the boundaries between dialect regions, and therefore shouldn’t be used
to define boundaries themselves. The principle I introduce here—that dialect
boundaries are defined by obstacles to diffusion—is simply an extension of that
idea.
Obstacles to diffusion may be socially motivated. For instance, Labov (to
appear: ch.10) suggests that the reason the NCS has (mostly) not diffused into the
Midland may in part be attributable to Midland resistance to “Yankee cultural
imperialism”. The North-Midland boundary, under this account, corresponds to
a boundary in settlement history between communities originally settled from
Western New England and New York State and communities originally settled
from Pennsylvania; the settlers brought with them distinct cultural traditions and
ideologies, and the Midland resists the sound changes of the North because of
their association with the ideology of the North. The only geographically
Midland city to which the NCS has diffused is St. Louis, Mo., where Murray
(2002) suggests that the Inland North dialect is perceived as having a high
standard of correctness that influences the community as a result of “St.
Louisans’ strong aversion to sounding like a ‘hoosier’ [i.e., a hick or hillbilly]
when they speak”. Under this account, there is an ideological barrier to the
diffusion of linguistic features, and that obstacle to diffusion constitutes the
boundary between the North and Midland dialect boundaries.
The more usual sort of obstacle to the diffusion of a linguistic feature, of
course, will be a linguistic obstacle. I argue in Chapter 4 of this dissertation that
the reason that the NCS raising of /æ/ has not diffused effectively into

398
Amsterdam and Oneonta, even while other elements of the NCS have, is because
the nasal /æ/ system is an effective phonological block to the diffusion of a
continuous pattern of /æ/-raising, and the nasal system cannot be reverted into
a continuous system to allow this diffusion to proceed. Thus the raising of /æ/ is
blocked from diffusing into the Hudson Valley by a phonological
incompatibility. This justifies regarding the Inland North and the Hudson Valley
fringes as distinct dialect regions. The Hudson Valley is not merely an extension
of the greater Inland North with even less advancement of the NCS than the
Inland North fringe has, or part of a gradual fading-out of NCS features in the
approach toward New York City—it is a qualitatively different dialect region, in
which at least one aspect of the Inland North phonology is actually inaccessible,
not merely absent. Thus it is coherent from a dialectological point of view to say
that certain Inland North phonological features, such as the backing of /e/, have
diffused into a region which nevertheless maintains its status as not part of the
Inland North.
An obstacle to diffusion is not necessarily an obstacle in both directions:
although the phonology of the nasal system stops raising from diffusing across
the Inland North–Hudson Valley border, the nasal system itself does not appear
to be prevented from developing in the Inland North (whether as a result of
diffusion or as an independent innovation). Moreover, the fact that diffusion is
only blocked in one direction implies also that the location of the boundary is not
permanent. Recall, for example, that Sidney appears to be retreating in apparent
time from /æ/-raising, perhaps as a result of diffusion of the non–Inland North
pattern from Oneonta. If this is the case, the Inland North–Hudson Valley
399
boundary is in the process of moving from one side of Sidney to the other. If the
lowering of /æ/ in Sidney goes to completion to match Oneonta’s /æ/ and the
nasal system comes to predominate1, Sidney will be a Hudson Valley fringe
community, and the boundary will be between it and Binghamton. If continuous
distributions of /æ/ were to somehow remain frequent in Sidney even after /æ/
has fully lowered, however, this approach implies that it would still be
appropriate to describe Sidney as part of the Inland North fringe—there would
be no obstacle to the diffusion of /æ/ back into it.
According to this definition, then, the eastern edge of the Inland North as
established in this dissertation is an authentic dialect boundary—perhaps not as
robust a boundary as the one between the North and Midland, but one that
represents a legitimate and relatively stable linguistic difference between the
communities on either side of it. Since the boundary between the Inland North
and Hudson Valley fringe is defined by only one feature that fails to diffuse, it
may make sense to think of it as a lower-order or secondary dialect boundary,
defining dialectological sub-regions of a broader major region. So while the
North-Midland boundary is one of the principal dialect boundaries of North
American English, the Inland North and the Hudson Valley are just closely
related sub-regions of the broad Northern region.
While the boundary between the Inland North and the Hudson Valley is
defined by only one feature that fails to diffuse, the boundary between the Inland
North and North Country is defined by two. One is the raising of /æ/ again, of
course: the nasal /æ/ system is if anything even more prevalent in the North
1 In the current sample, three out of eight speakers in Sidney have nasal systems.

400
Country than the Hudson Valley fringe. Now, the Inland North fringe and North
Country are sharply distinguished by the advancement of the caught-cot merger,
in that all but the two oldest North Country speakers have /o/ and /oh/
merged or transitional in perception, while only a few younger Inland North
fringe speakers are transitional and none are merged. But this difference in
merger status alone does not demonstrate an obstacle to diffusion; the apparent-
time backing of /o/ in the Inland North and the completed phonological transfer
of (olC) from /o/ to /oh/ indicate that the caught-cot merger is indeed in the
process of diffusing to the Inland North fringe, although it is not very advanced
yet.
However, the near-completion of the low back merger in North Country
does appear to block the diffusion of the triangular vowel phonology from the
Inland North fringe. Recall that Preston (2008) argues that the reason that
triangular vowel systems are a likely result of diffusion is their structural
symmetry: each front vowel is matched with a back vowel of the same height
and peripherality. In this model, /æ/ and /oh/ are a corresponding front-back
pair, with /o/ as the lone low central vowel at the bottom vertex of the triangle.
But in a community with the caught-cot merger, that symmetrical triangular
structure is unavailable: if the merged /oh/~/o/ phoneme is used as the back
counterpart of /æ/, there is no low vertex vowel and thus the system is not
triangular; while if /oh/~/o/ were used as the low vertex, /æ/ would lack a
back counterpart and thus the triangular system would not be symmetrical. Since
the main rationale for the triangular system as a result of diffusion is its
symmetry, there is therefore no motivation for the North Country to develop a
401
triangular system through diffusion. And indeed, while some speakers in
Amsterdam and Oneonta in the Hudson Valley fringe show triangular vowel
distributions, no speakers in Canton or Plattsburgh have a distinctively
triangular system2, despite (in particular) Canton’s proximity to the Inland North
fringe. At the same time, other features do appear to have spread from the Inland
North to the North Country: the North Country resembles the Hudson Valley
fringe in having /e/ backed to about 1700 Hz, seemingly a diffused NCS
component3; and of course the stressed penult in -mentary, which I conjecture to
have diffused from farther west, is very advanced in the North Country as well.
So the failure of clearly triangular vowel distributions to appear in the North
Country the way they do in the Hudson Valley fringe may be taken to be a result
of the caught-cot merger preventing (or at least, eliminating the motivation for)
the diffusion of triangular patterns. From this point of view, the dialect boundary
between the Inland North and the North Country may be taken to be of a higher
order than the boundary between the Inland North and Hudson Valley fringe.
The Hudson Valley core and fringe are separated by an obstacle to
diffusion that justifies regarding them as distinct dialect regions also. In Chapter
5, it was argued that the raised /oh/ found in the Hudson Valley core confers 2 A couple of speakers in Canton and Plattsburgh have vowel systems that are ambiguous and could be interpreted as either triangular or quadrilateral. However, the mean vowel distributions over all nine Canton speakers and all seven Plattsburgh speakers are clearly quadrilateral; those of Amsterdam and Oneonta are intermediate between triangular and quadrilateral, indicating that both patterns are found in those cities relatively frequently. 3 Here we cannot strictly rule out the possibility that the backing of /e/ diffused into the North Country from Canada, where /e/-backing is part of the Canadian Shift, rather than from the Inland North. However, in the Telsur sample the four closest Canadian speakers to the North Country (two from Montreal, Que., and one each from Ottawa and Arnprior, Ont.) have collectively a mean /e/ F2 of 1830 Hz, apparently substantially fronter than the North Country mean of 1708 Hz. That’s not enough ANAE data on the nearby part of Canada to reach the level of statistical significance, of course (p ≈ 0.1); but it does seem to suggest that the backing of /e/ is more likely to have spread from the Inland North fringe (whose /e/ is backer than the North Country’s) than from Canada.
402
stable resistance to the caught-cot merger (in a way that the NCS does not).
Although the merger itself is not robustly present in the Hudson Valley fringe, I
have argued that the phonological transfer of words of the (olC) type from /o/
to /oh/ is an early stage of the merger in progress—and indeed, this transfer is
present in the Hudson Valley fringe but completely absent in the Hudson Valley
core community of Poughkeepsie. Thus there does appear to be an obstacle to
diffusion of the phonological transfer of (olC)—and therefore a dialect
boundary—between the Hudson Valley fringe and core. In the other direction,
the dialect boundary between the Hudson Valley core and New York City can be
defined by the New York City split /æ/ system: as we have seen, the split /æ/ is
blocked from diffusing effectively out of New York City by the mere fact that it is
a phonemic split, and ends up as the monophonemic diffused /æ/ system in the
Hudson Valley core. In this case diffusion has taken place, but the fact that
structural constraints prevent the result of diffusion from having the same
systematic properties as the source of the diffusion justifies describing the
Hudson Valley core and New York City as distinct dialect regions.
Whether the boundary of the stressed penultimate in -mentary can be
interpreted as a dialect boundary is a somewhat tougher question. Since the
stressed penult is basically a lexical feature and does not interact in an obvious
manner with other components of the linguistic system, it is unlikely that there
are any linguistically motivated obstacles to its diffusion. Obviously the area
along the eastern border of New York State where the stressed penult is present
with slightly lower frequency does not count as a separate dialect region from
the remainder of Upstate New York, where the stressed penult is more
403
dominant: the stressed penult has clearly diffused eastward across this line. In
northern Pennsylvania, the southernmost extent of the stressed penult appears to
be the traditional North-Midland dialect boundary, which has been shown to
correspond fairly closely to a natural break in patterns of travel and
communication—thus the very lack of traffic between the Northern Tier of
Pennsylvania counties and locations further south can be interpreted as an
obstacle to linguistic diffusion, motivating this dialect boundary.
But what about the southeastern limit of the stressed penult, separating
Upstate from Downstate New York? Here it is harder to say whether there is a
legitimate obstacle to diffusion of lexical changes from Upstate to Downstate
New York, because of cultural or communication issues, or whether diffusion is
not impeded and merely has not had enough time to take place yet, especially
inasmuch as the adjacent portion of Upstate New York is the eastern region
where the stressed penult is less advanced. Certainly there are phonological
features that have evidently diffused across this line, in the opposite direction:
the raised /oh/ and diffused /æ/ system, reaching Poughkeepsie and all the
way up to Albany. But in order to decide whether the Upstate-Downstate line
constitutes an actual obstacle to the diffusion of lexical change, it would be
necessary to hunt for other lexical innovations in Upstate New York and see how
far south towards Downstate they have diffused. As mentioned in the previous
chapter, the location of the soda-pop isogloss, between Western and Central New
York, does give some evidence for supposing that boundaries between
popularly-understood regions might be able to act as obstacles to diffusion—
though, again, no other lexical isogloss has been shown to correspond to the soda-
404
pop isogloss. Even if such lines do act as obstacles to diffusion, and thus can be
meaningfully described as boundaries between dialect regions, if they only
correspond to one lexical feature each they must be considered boundaries of a
very low order.
The apparent northern boundary of the stressed penult, between the
North Country and Canada, seems much sharper: in Canton and Plattsburgh the
stressed penult is extremely high-frequency, unlike in the part of Upstate New
York adjacent to Downstate. The North Country and Canada also differ sharply
in their treatment of /æ/: three of the four closest Canadian speakers to the
North Country have /æ/ systems unlike anything seen in New York State, with
prenasal tokens of /æ/ not appreciably higher than pre-oral tokens. Based on
Boberg (2000)’s argument that the U.S.–Canada boundary might act as an
impediment to diffusion, and the sharpness of these differences between North
Country phonology and that of the nearby part of Canada, it seems reasonable to
assume that there is a dialect boundary between the North Country and Canada
as well (notwithstanding the caught-cot merger in progress in the North Country
and complete in Canada).
This dissertation began with a naive definition of dialect boundaries as
merely what obtains in any situation where two communities that are relatively
near each other differ in linguistic features. The definition introduced in this
section, however, of dialect boundaries as obstacles to diffusion, give dialect
boundaries a more well-grounded ontological and theoretical status. Under the
naive definition, the existence of a dialect boundary is merely a descriptive fact
about linguistic differences between two regions. Under the definition of this
405
section, on the other hand, a dialect boundary becomes, rather than a mere
description of dialect diversity, an explanation of dialect diversity: a dialect
boundary is what causes two regions to continue to exhibit linguistic differences.
Labov (2007) delves into the theory of diffusion in order to untangle the
relationship between the family-tree model and the wave model of linguistic
change: under the family-tree model, individual dialects diverge from each other
as a result of the transmission and incrementation of their individual
innovations, while under the wave model dialects converge as changes are
diffused from one community to another. Dialect boundaries, under the
definition introduced in this section, are then where the two models of linguistic
change interface: a change may diffuse as a wave until it reaches the dialect
boundary, which preserves the distinctiveness of the two dialect regions and
allows them to continue diverging in accordance with the family-tree model.
7.2. Western New England
One of the aims of this dissertation was to explore the dialectological
relationship between Western New England and the Inland North; and defining
boundaries as obstacles to diffusion can give us a way of looking at this issue,
although any attempt to look deeply at Western New England is hampered by
the lack of available data. Boberg (2001) describes a gradual transition from full
caught-cot merger in Northwestern New England to full distinction with some
evidence of NCS participation in Southwestern New England, with “little
phonological reason” for separating Southwestern New England from the Inland

406
North. By the standards defined in Chapter 4, however, six of the seven Telsur
speakers in Western Massachusetts and Connecticut exhibit nasal /æ/ systems,
grouping Southwestern New England from this point of view with the Hudson
Valley (a region which had not been acoustically studied as of Boberg’s paper,
and is located in between the Inland North proper and Southwestern New
England) rather than with the Inland North, inasmuch as the nasal system is
taken to be the feature that prevents diffusion of the full NCS.
That said, two of the Southwestern New England Telsur speakers have
higher EQ1 indices than any speaker sampled in the Hudson Valley fringe: Jesse
M. from New Britain, Conn. (born 1939, EQ1 –20) and Elena D. from Springfield,
Mass. (born 1925, EQ1 –29); Elena D. is also the only Western New England
Telsur speaker to have a continuous rather than nasal /æ/ system. Inasmuch as
Elena D. is the oldest of the seven Southwestern New England speakers, it may
be that she predates the development of the nasal system in that region; we
know, after all, that the continuous system must have existed in Southwestern
New England at one point because it was the source for the settlement of the
Inland North, where the continuous system dominates, and the restructuring of a
continuous system into a nasal system appears to be a unidirectional
phonological change. It is conceivable, then, that at one point Southwestern New
England, like the Inland North region whose settlement was derived from it, was
beginning to trend in the direction of the NCS, but the rise of the nasal system
stemmed that trend and prevented the general raising of /æ/ from continuing.
Boberg defines the chief internal dialect boundary of Western New
England in terms of the distribution of the caught-cot merger: thus Northwestern
407
New England consists of Vermont, where the merger is complete, while
Southwestern New England includes Connecticut and Western Massachusetts.
Defining boundaries in terms of obstacles to diffusion, however, places the key
internal dialect boundary of Western New England in a very different location.
The three southernmost speakers in the Telsur sample of Western New
England—all in Connecticut—have raised /oh/, with mean F1 less than 700 Hz:
Jesse M. from New Britain (687 Hz), Tyler K. from Middletown (689 Hz), and
especially Amy N. from New Haven, on the southern edge of the state (610 Hz).
This is sufficient to include them in ANAE’s “Eastern Corridor” zone of raised
/oh/, which is described as resisting diffusion of the caught-cot merger (a
description which is supported by the status of Poughkeepsie in this
dissertation).4
This suggests that somewhere within Connecticut a dialect boundary can
be defined as separating an area to the south, where /oh/ is sufficiently raised to
resist the diffusion of merger, from an area to the north where /oh/ is not so
raised. In other words, while Boberg groups Western Massachusetts with
Connecticut because of the absence of completed caught-cot merger, the approach
to defining dialect boundaries taken in this chapter would group Western
Massachusetts (and probably part of Connecticut) with fully-merged Vermont,
on the grounds that there is no indication that there is any obstacle to the advance
of full merger into Western Massachusetts, even though the merger is not
complete there—indeed, two of the three Western Massachusetts speakers in the
4 It is not necessarily clear that 700 Hz is the exact right value for the cutoff; I use 700 Hz for convenience and because it is the cutoff used by ANAE. The mean F1 of /oh/ in Poughkeepsie is 617 Hz.

408
Telsur corpus have transitional, rather than fully distinct, minimal-pair
judgments, presumably indicating some degree of merger in progress. Further
research in Western New England, however, would be necessary to determine to
what extent and by what mechanism the caught-cot merger is in progress in
Western Massachusetts5, whether the raised /oh/ in southern Connecticut
actually resists the influence of the merger as predicted, and how far north such
resistance extends.
Amy N. from New Haven, in addition to having the highest /oh/ among
Telsur speakers in Western New England, also has the lowest EQ1 index—lower,
in fact, than any speaker in the Hudson Valley core or fringe6, at –187. The
second lowest is Tyler K. from Middletown, at –110. This seems to justify the
approach being taken in this chapter of using obstacles to diffusion as the
definition of dialect boundaries: although identifying southern Connecticut as a
separate dialect region from the rest of Western New England was motivated by
the behavior of /oh/, we find that the behavior of /æ/ in that region might be
distinct also. In other words, a boundary drawn on the basis of one feature may
correlate with another feature. This is a lot to hang on one or two speakers from
an undersampled region, of course, but it is striking that the raising of /oh/
seems to correlate with the non-raising of /æ/. By the same token, Amy N. and
Tyler K. have fairly clearly rectangular vowel systems, while most of the rest of
the Connecticut and Western Massachusetts speakers have triangular systems—
5 For example, is /o/ backing in apparent time? Have (olC) words jumped from /o/ to /oh/? 6 Actually, lower than any speaker in the current sample; however, Winter H. from Lake Placid comes quite close at –185, and there are several other speakers from the North Country and Poughkeepsie in the –150-to-–185 range.
409
unsurprising, since once of the most noticeable features of a triangular system is
the symmetry of /æ/ and /oh/ as a front-back pair.
So the southern-Connecticut raised-/oh/ area is looking less and less like
the Inland North, and can probably be categorized as a dialect region closely
related to the Hudson Valley core. The status of the rest of Southwestern New
England is more ambiguous, resembling a weak form of the Inland North in
some ways but more similar to the Hudson Valley fringe in other ways.
However, it seemingly must be considered a dialect region of its own in any case:
the Hudson Valley core intervenes between Southwestern New England and the
Hudson Valley fringe7, isolating western Massachusetts and Connecticut (the
part of Connecticut without raised /oh/, anyhow) as a separate dialect region.
The data is not sufficient to show, however, to what extent linguistic features can
diffuse between non-contiguous regions: does the interposition of the Hudson
Valley core between the Hudson Valley fringe and Western New England
constitute a barrier to diffusion between the two regions? But on the other hand,
even if there is no obstacle to direct diffusion between the Hudson Valley fringe
and Western New England, it seems inappropriate to identify two
noncontiguous areas as a single “dialect region” (notwithstanding the fact that
ANAE did exactly that for the Inland North).
7 The Hudson Valley core is really defined only by two communities, Albany and Poughkeepsie. It may be, however, that Hudson Valley core features do not cover the entire region between Albany and Poughkeepsie; the diffusion from New York of the raised /oh/ and the /æ/ system might (as predicted by the cascade model of diffusion) have reached Albany earlier than the smaller communities south of Albany. If that is the case, it may be that the Hudson Valley fringe does reach all the way to Western New England.
410
7.3. The objects of diffusion
7.3.1. Is diffusion taking place?
Several linguistic features have been loosely described in this dissertation
as having undergone diffusion from one community or region to another:
elements of the NCS, including /e/-backing, /o/-fronting, and /æ/-raising; the
caught-cot merger; a triangular layout of vowel phonemes; the New York City
/æ/ system (being reduced in the process into the “diffused” allophonic pattern
of the Hudson Valley core); and the stressed penult in -mentary. Diffusion is
defined specifically, however, as the spread of linguistic variants from
community to community by means of contact between adults; and so in order to
discuss the implications of the results of this dissertation for the theory of
diffusion it is necessary to be reasonably confident that it is contact between
adults that is responsible for the propagation of the changes in question.
Several of the changes studied here are taken to be the result of diffusion
because they show patterns already argued by Labov (2007) or Preston (2008) to
be caused by diffusion, namely the NCS in the Inland North fringe, which
exhibits a symmetrical triangular vowel system with no correlation between age
and score, and the diffused /æ/ system in the Hudson Valley core. Other
features are inferred to have been propagated by diffusion because of their
gradual geographic profiles. For example, as discussed in Chapter 5, the caught-
cot merger is taken to be undergoing diffusion (rather than, say, originating
independently in each community) because the incipient merger is more
advanced in regions closer to those where it is complete or nearly complete. Thus

411
if the merger had originated independently in the Hudson Valley fringe and
Inland North fringe, we would be surprised to find that it is more advanced in
the Inland North fringe, where the phonetic space between /o/ and /oh/ is
larger to begin with. However, if we accept diffusion as a possibility, the fact that
the Inland North fringe is adjacent to the North Country (and, in parts, Canada
and Vermont) explains the caught-cot merger’s unexpected relative advancement
there.
It is not impossible that diffusion might coexist with incrementation
through transmission, of course. An incipient sound change that may be
occurring for internally-motivated reasons among children in a community
could be reinforced and accelerated by diffusion of the same or a similar sound
change among the community’s adults. Moreover, diffusion could at least in
principle lead to incrementation through transmission: an innovation acquired by
adults in a community is transmitted to their children through the ordinary
means of language acquisition, and then augmented over time by the children. In
this case, of course, the system that is incremented through transmission will be
the diffused system itself, showing the characteristic structural features of
diffusion.
Of course, diffusion is not the only possible explanation for a linguistic
change propagating from one region to an adjacent region. Johnson (2007)
discusses the propagation of the caught-cot merger from eastern Massachusetts
toward Rhode Island, and attributes its advance not to diffusion but to contact
between children whose parents have moved from the merged region into the
historically unmerged region. In many cases it is not strictly speaking possible to
412
be certain from the current data that “transfusion” of that sort is not responsible
for the propagation of some of the changes studied in this dissertation; but there
is at least reason to doubt it. To begin with, almost every region of Upstate New
York, and nearly all of the cities in the current sample, have undergone
substantial population decline in the last 30–50 years (Population Trends 2004);
this suggests that it is unlikely that many of the communities sampled in this
dissertation have seen substantial enough recent in-migration for an incoming
population of children to change the dialectological status of the community.
However, population decline is not entirely incompatible with a high rate
of in-migration; the village of Cooperstown has lost population over the past 30
years, and yet in Chapter 5 it was argued that heavy migration is responsible for
the rapid dialect change there. This argument was made on the basis of the actual
migration in the history of the speakers sampled in the community: none of the
younger speakers sampled in Cooperstown, and only one third of the entire
sample of the village, had a parent who grew up in Cooperstown. Most of the
other communities in which seven or more interviews were conducted contrast
with Cooperstown in this respect: in all but Plattsburgh8, at least half of the
speakers sampled had a parent raised in the same community, and many others
had parents raised in the immediate vicinity. The combination of sharp
population declines throughout almost all of Upstate New York with the
relatively small percentage of speakers in the sample with parents from different
dialect regions suggests that (outside of Cooperstown) diffusion is the most
8 Plattsburgh is also the only one of these communities to have experienced population growth in the past 30 or 50 years.
413
likely explanation for the apparent regional propagation of linguistic change,
rather than dialect contact within children’s peer groups.
7.3.2. What is an observable element of language?
Since diffusion is defined as the result of dialect contact between adults,
whose grammatical systems are less malleable than children’s or adolescents’, it
can affect only relatively surface-level linguistic features. Thus, a feature cannot
undergo exact diffusion if such diffusion would require speakers in the recipient
community to learn a new underlying category, or take note in detail of the
structural makeup of the lexical items they affect; and complex rules that
undergo diffusion will be simplified because adult speakers in the recipient
community will not have been able to correctly learn all of the relevant
complexities. So, as Labov (2007) observes, the lexical exceptions to the New
York City /æ/ system are eliminated in the diffused system because speakers in
the recipient communities are not going to acquire a novel underlying contrast
between /æ/ and /æh/; the syllable-boundary constraint is eliminated because
recipient speakers do not take note of the fact that the phonological pattern
interacts with morphological structure but just take it as a surface-level
phonological rule. Chapter 4 of this dissertation adds to that the finding that
tensing before /g/ is eliminated because recipient speakers learn a simpler rule,
in which place and manner of articulation do not interact.
Labov (2007) characterizes the set of types of features which can undergo
diffusion as follows:
414
More precisely, adults borrow observable elements of language, the same elements that can be socially evaluated. The objects of social evaluation are at a level one step more abstract than words or sounds. The adult community assigns prestige or stigma to the word stem, irrespective of its appearance in a word with various inflections.
The stressed penult in -mentary is an example of a feature “one step more abstract
than words” undergoing diffusion. As argued in Chapter 6, it appears that it is
the innovative analogical behavior of the morpheme -ary itself that is undergoing
diffusion, rather than individual lexical items. Thus, a derivational morpheme
such as -ary is not too abstract to be the object of diffusion. This means that the
failure of the morphophonological constraints on New York City /æ/-tensing to
diffuse to the Hudson Valley core cannot be put down merely to adult speakers’
failure to take note of the morphological structure of words that are affected by a
diffused change; in the case of -mentary they apparently do so. So it seems that it
is the interaction between morphological and phonological structure that is at too
abstract a level to be subject to diffusion, rather than the mere existence of
morpheme boundaries themselves.
It is well known that phonemic mergers are very easily diffused, but they
do not seem to fit the description of “observable elements of language”; a merger
is a relatively abstract structural fact about the set of available phonemic
contrasts, and is “almost invisible to social evaluation” (Labov 2001:27). But
Labov also (1994:324) provides the mechanism by which mergers appear to
diffuse even in the absence of “observability”, following upon the work of
Herold (1990)—being in contact with merged speakers causes unmerged
speakers to depend less upon the phonemic contrast for the purposes of
communication. Thus, in the recipient community, the contrast is weakened
415
enough for other phonetic and phonological changes that can lead to merger
over the long term to be set into motion; this is exactly what we saw in Chapter 5
with the backing of /o/ and the transfer of (olC) from /o/ to /oh/ in the Inland
North and Hudson Valley fringe. So the effect of contact with merged speakers is
not (necessarily) immediate merger, but rather merely a sufficient weakening of
the barriers between phonemes for merger to take place eventually. The
“observable elements of language” that actually undergo diffusion in this case,
then, are phonetic and phonological changes that lead to merger, not merger
itself; while at the same time the phonemic distinction is “weakened” enough
that these phonetic and phonological movements in the direction of merger are
not prevented.
The fact that the Hudson Valley core apparently continues to resist
diffusion of the merger because of its raised /oh/ is further evidence for the
hypothesis that what is being diffused is not merger per se but rather sound
changes in the direction of merger. It was argued in Chapter 5 that the reason
raised /oh/ is better able to resist the diffusion of merger than fronted /o/ is
because the raising of /oh/ is a unidirectional sound change, while fronting a
low vowel is reversible—in other words, lowering /oh/ back toward /o/ would
be a marked sound change, while backing /o/ towards /oh/ in the Inland
North. But this difference between the Inland North and the Hudson Valley
fringe only makes sense if it what is being resisted in the Hudson Valley fringe is
416
the sound change itself, rather than the diffusion of the abstract relationship
between the phonemes.9
7.3.3. Phonemic mergers vs. allophonic mergers
As mentioned in Chapter 4, however, the weakening of phonological
barriers between phonemes that can take place as a result of diffusion does not
appear to apply to the phonological barriers between allophones of a single
phoneme. Formally, the difference between a discrete allophonic alternation (a
sound pattern of Phase II in the terminology of Bermúdez-Otero 2007) and a
gradient phonetic implementation rule (Phase I) seems fairly similar to the
difference between a pair of distinct phonemes and a merger between those
phonemes10: in both pairs, there are in the former case two distinct phonological
segments, where in the latter case there is only a single segment. However,
although mergers, as described above, diffuse easily into previously unmerged
communities through the weakening of the phonemic contrast, we see from the
distribution of nasal and continuous /æ/ systems that a Phase I pattern does not
seem to diffuse easily into a Phase II community. Indeed, I hypothesize in
Chapter 4 that in nasal systems the raised allophone actually blocks the unraised
allophone of /æ/ from moving into its space as a result of diffusion; this is the
9 This also explains why the merger does not diffuse to the Hudson Valley fringe by means of the raising of /o/ to /oh/, which after all would not require a marked sound change to take place and would satisfy Herzog’s Principle. The reason for this, by this analysis, is because the merger is not the first-order target of diffusion—the sound change itself is the feature being diffused, and since no dialect has /o/ raised as high as the Hudson Valley core’s /oh/, there’s no source of diffusion that might cause the Hudson Valley core to develop the caught-cot merger that way. 10 In fact, the later phases beyond Phase II of the “life cycle” are themselves phases of phonemic split.
417
exact opposite of what happens in the diffusion of mergers. Why, despite the
apparent structural similarity, can the barrier between phonological segments be
weakened through diffusion if the segments are distinct phonemes but not if
they are allophones of the same phoneme?
The reason for this, I argue, is merely because a discrete allophonic
alternation is synchronically a phonologically predictable rule. If diffusion
directly affects only more or less surface-level elements of linguistic structure,
and not the systematic relationships between them, then such a phonologically
regular rule (being merely a type of systematic relationship between
phonological segments) is not directly eliminated as a result of dialect contact.11
This means that, even if some speaker with (for example) a nasal /æ/ system is
in contact with a continuous-/æ/ community, the allophonic rule nevertheless
remains active as part of that speaker’s grammar, and still determines which
allophone appears in which words.
By contrast, if two segments represent different phonemes, there is in
some sense no systematic relationship between them at an abstract level in the
synchronic grammar. In the case of diffusion of a phonemic merger, once a
speaker or community is no longer depending on the contrast to distinguish
between words there is no other synchronic element of the grammar maintaining
the distinction, and sound changes in the direction of merger can go to
completion. In other words, if a phonemic contrast becomes redundant through
11 In the case of the partial diffusion of the New York City /æ/ system to the Hudson Valley core, this same argument holds in the other direction if we suppose the nasal system to have existed in the Hudson Valley prior to this diffusion. Diffusion doesn’t eliminate the fact that there’s a synchronic allophonic relationship between the tense and lax allophones, although it does seem to be able to change what the conditioning environments of that allophony are.

418
dialect contact, it might cease to be maintained; but an allophonic alternation is
already redundant, so dialect contact doesn’t weaken it. Thus, somewhat
counterintuitively, this argument entails that the phonological boundaries
between allophones of the same phoneme are stronger than those between
different phonemes with respect to tendency toward merger.
This hypothesis is perhaps a lot of analytical weight to place upon the
behavior of /æ/ among a few speakers in Amsterdam and Oneonta, but it is
consistent with the behavior that would be predicted by Bermúdez-Otero’s
categorization of sound patterns. Indeed, the fact that the categorization of sound
patterns can be portrayed as a “life cycle”—i.e., that Phase I gradient rules tend
to be restructured into Phase II discrete allophonic rules, but not vice versa—
suggests that the involvement of diffusion is not essential for this argument. That
is to say, the synchronic presence of a discrete allophonic rule relating two
segments may be sufficient to prevent those segments from moving back into
overlapping areas of phonetic space through internally-generated sound change,
as well as through diffusion.
Moreover, the hypothesis that potentially allophonic segments, rather
than entire phonemes, act as the key units of vowel shifting, could explain the
striking absence of so-called allophonic chain shifting, as discussed in detail by
Labov (to appear: ch.14). In brief, the problem of allophonic chain shifting is the
following: if (for example) the general raising of /æ/ under the NCS can trigger
the fronting of /o/ towards the space formerly occupied by /æ/, why doesn’t
the raising of prenasal /æ/ only in the nasal system trigger the fronting of
prenasal /o/? According to the hypothesis advanced here, the reason for the
419
absence of allophonic chain shifting is that the units of chain shifting are neither
the phonemes themselves nor allophones in general, but only phonologically
discrete allophones. Thus, in a nasal /æ/ system, the absence of prenasal tokens
among the low front /æ/ cluster is not sufficient to constitute a gap in phonetic
space for the purposes of chain shifting; since chain shifting is a Phase I
operation, the phonological entities it is sensitive to need not be entire phonemes
as long as they are discretely specified as sets of phonological features. Thus the
presence of the pre-oral allophone of /æ/ is sufficient to avoid triggering a chain
shift of any tokens of /o/, even the prenasal ones, despite the fact that the low
allophone of /æ/ includes no prenasal tokens.
Another factor that might be expected to contribute to the resistance of a
Phase II allophonic alternation from collapsing into a Phase I gradient phonetic
rule through diffusion is the tendency for the outcomes of diffusion to be
structurally simple and unmarked. As argued in Chapter 4, an allophonic
alternation is simpler as an element of the speaker’s grammatical knowledge
than a gradient allophonic tendency, since it can be represented as a single
regular rule, without needing to control the fine-grained detail of the phonetic
realizations of phonological features.
7.3.4. The two principles of diffusion
The symmetric triangular vowel system has been loosely described in this
dissertation as a feature of the NCS that is diffused to the Inland North fringe
and other communities. The symmetric triangular vowel system, however, is
420
obviously an abstract fact about the structure of the vowel system and the
relationships between the phonemes in it—not the type of surface-level feature
which would be expected to easily undergo diffusion. If as Labov (2007) argues
only “observable elements” of language and not the structured relationships
between them are subject to diffusion (i.e., interdialectal borrowing as a result of
contact between adults), the triangular shape of the vowel system should not be
diffusible. How then is it, as Preston (2008) argues, diffused?
In fact, the role that the triangular distribution must play in Preston’s
discussion is not that of the feature undergoing diffusion, being imitated by
speakers from other communities who come into contact with it, but rather that
of the symmetry imposed in the recipient community on an asymmetric feature.
What speakers are doing when they acquire a symmetrical triangular vowel
system through diffusion of the NCS, then, is merely acquiring some degree of
raising of /æ/, fronting of /o/, and so on, but imposing a symmetrical and thus
relatively unmarked structure upon it.
The triangular vowel system thus plays the same role in diffusion of the
NCS as the elimination of lexical exceptions, of the syllable-structure constraint,
and of tensing before /g/ plays in diffusion of the New York City /æ/ system
the Hudson Valley core, rather than being the target feature that speakers imitate
as a result of dialect contact. In the Hudson Valley core the feature speakers
borrow is the tensing of /æ/ before voiced stops and voiceless fricatives, but
they simplify the constraints on the tensing system into a more symmetrical and
unmarked pattern. So likewise, in diffusion of the NCS, the features speakers
borrow are the individual changes in /æ/, /e/, /o/, and other vowels; the
421
symmetrical layout in phonetic space of the overall vowel system is the
simplification of structure and reduction of markedness imposed upon the
system by adult learners. Under this analysis, then, the fact that the NCS in
Inland North core communities often has a triangular structure becomes only
indirectly relevant to the fact that the result of diffusion of the NCS is a
triangular system, rather than the immediate cause.12 Instead, it’s just that having
a generally triangular layout is a direct consequence of acquiring a moderate
degree of /æ/-raising (since /o/ is left behind as the only low monophthong),
and as a result of the nature of diffusion the triangular system becomes one with
a symmetrical distribution of front and back vowels.
This analysis serves as a reminder that the two key principles of diffusion
identified by Labov (2007)—that it acts directly only on “observable elements”,
rather than on the structural relationships between them, and that the outcome of
diffusion is likely to be structurally simple or unmarked—play distinct roles in
the process of diffusion, and considering both of them is necessary in order to
understand why diffusion takes the shape it does. Indeed, the second principle,
simplicity of the outcome, can help to explain why abstract-seeming structural
features might seem to undergo diffusion when the first principle would seem to
imply that they should not. Here I have argued that this is the case with respect
to the triangular vowel system that is the result of diffusion of the NCS; it can
also account for the diffusion of merger, as I have alluded to earlier in this
section. While merger is a structural fact about the relationship between surface
12 Indeed, some extreme Inland North core speakers have quadrilateral vowel systems, with /o/ and /oh/ respectively as the front and back low vowels instead of /æ/ and /o/, but this is not apparently what is imitated as a result of diffusion.
422
elements and not overtly noticeable, and therefore should not be directly
susceptible to diffusion by the first principle, the first principle can account for
phonetic and phonological changes that move in the direction of merger. It is the
second principle that accounts for the fact that the changes eventually lead to a
phonemic merger—i.e., a relatively unmarked system.
At the same time, the second principle may play a role in preventing a
Phase II allophonic rule from being diffused back into Phase I; a Phase II rule is
arguably structurally simpler than a Phase I context-dependent phonetic
implementation.
7.4. Unanswered dialectological questions
7.4.1. Gaps in the sample
The sampling technique of the dissertation was designed to collect a large
amount of data from a wide region of Upstate New York in a relatively short
period of time, and zero in on communities near the boundary. However, the
broad geographic scope of the study meant that it was not possible to obtain
detailed samples for most communities, or to return to collect more data in
regions that turned out to be of greater interest after the third phase of in-person
interviews. This means that there are several locations or areas in which the data
that was collected leave unanswered questions that can only be satisfactorily
answered with future studies.
Obviously there is much that could be learned from collecting additional
data from any of the communities sampled in this dissertation, or from new

423
communities bridging some of the geographic gaps left between the sampled
locations. If there is new-dialect formation in progress in Cooperstown, how is it
situated demographically in the village? Is there change in progress in Oneonta
towards less NCS influence; and if so, did Oneonta at one time have a greater
degree of NCS than it does now? What is the status of Saratoga Springs? Is the
Hudson Valley core actually a continuous dialect region extending up the
Hudson from Poughkeepsie to Albany, or does it disappear at some point north
of Poughkeepsie and only reappear in Albany because of the state capital’s closer
connection with New York City? Is there Canadian influence on the North
Country?
All of these questions deal with important issues in the dialectology of
New York State that would benefit from additional research to test my
hypotheses or go beyond the scope of the issues I intended to deal with in this
dissertation. In the next two subsections, however, I will focus on two of the
most vexing questions raised by this dissertation’s data and left, in my opinion,
without satisfactory explanation by my analysis.
7.4.2. Glens Falls and vicinity
The greatest dialectological quandary in the sample is the difference
between the city of Glens Falls and the communities adjacent to it. During the
course of fieldwork in Glens Falls, three speakers were interviewed from the
adjacent village of South Glens Falls and two from the adjacent town of
Queensbury; they were not excluded from analysis because it seemed plausible
424
to suppose that these immediately adjacent communities would be part of the
same general speech community as Glens Falls and therefore show the same
dialectological features. Phonetic analysis, however, revealed sharp and
unexplained differences between the city and the adjacent towns.
Glens Falls is a clear example of an Inland North fringe city: three out of
seven speakers have NCS scores of four; the mean EQ1 index is –19, and two
speakers have positive indices. Moreover, Glens Falls has the highest rate of
continuous /æ/ systems of any of the twelve well-sampled communities: only
one of seven speakers shows a nasal system, and her Cartesian distance between
prenasal and pre-oral /æ/ is only 386 Hz, not much greater than that of the
continuous-/æ/ speakers in the city. Of the total of five speakers sampled from
South Glens Falls and Queensbury, four have NCS scores of two and EQ1 indices
below –80; the fifth does score four, but his EQ1 index of –60 is the lowest of all
speakers in the sample whose NCS score is four. So even if South Glens Falls and
Queensbury can collectively be assigned to the Inland North fringe13, they have
much less advanced NCS than Glens Falls proper does. Meanwhile, four out of
the five speakers from South Glens Falls and Queensbury have nasal /æ/
systems; the three from South Glens Falls in particular all have Cartesian
differences between prenasal and pre-oral allophones of 550 Hz or more. The
South Glens Falls speaker with the NCS score of four (Carl T., born in 1940)
actually has the second-highest Cartesian distance in the entire sample, at
728 Hz.
13 Obviously, by the methodology employed in Chapter 3, only South Glens Falls, which has the speaker who scores four, is considered part of the Inland North fringe; Queensbury, whose sampled speakers both score two, is ineligible.
425
So Glens Falls’s /æ/ differs sharply from that of the communities directly
adjacent to it, in terms of EQ1 index and in terms of allophonic pattern. In
addition, Glens Falls differs from the adjacent towns with respect to the stress
pattern of -mentary words: the only reduced token of any -mentary word
produced in South Glens Falls or Queensbury was a single token of elementary in
spontaneous speech; all elicited -mentary tokens from those two communities had
the stressed penult. Glens Falls, on the other hand, has one of the lowest
frequencies of stressed penult in the entire sample; it is only of only three
communities in the sample (with Poughkeepsie and Schenectady) where the
stressed penult appeared in less than half of all -mentary tokens produced. So the
difference between Glens Falls and the communities adjacent to it is not only in
the behavior of /æ/ but also in the behavior of -mentary.
These two linguistic differences between Glens Falls and the other
communities is not even geographically consistent: with respect to /æ/, Glens
Falls is part of the Inland North while South Glens Falls and Queensbury behave
more like the nearby Hudson Valley, while with respect to -mentary the exact
opposite is the case. So it cannot merely be the case that Glens Falls is in general
more open to diffusion from some regions, while the adjacent towns are more
open to diffusion from others, given the inconsistency just noted. However, the
two features (/æ/-raising and -mentary) do display the general population-
pattern features expected of them: Chapter 6 showed that -mentary may be
somewhat disfavored in more densely populated cities, such as (in the current
example) Glens Falls in comparison to the adjacent towns; while Labov (2001)
attributes to Callary (1975) the claim that /æ/-raising is most favored in larger
426
cities. So it may be that the NCS and -mentary are just showing the exact behavior
expected of each of them at the edge of their distributions, one focusing in the
local city and the other in the less dense communities abutting it. The status of
Glens Falls, Queensbury, and South Glens Falls as constituting a single
community in the eyes of the locals (at least to the extent that people from
Queensbury and South Glens Falls who had never lived in Glens Falls were
willing to tell me they were lifelong residents of Glens Falls before beginning the
interviews) makes the fact that the city and the adjacent towns behave as distinct
speech communities at all a conundrum.
Glens Falls was part of the town of Queensbury until 1908, so it is unlikely
that there is any difference in settlement history between them. It is conceivable
that these differences may be merely a sampling fluke, although almost all of the
differences discussed here between Glens Falls and the adjacent towns are
statistically significant at the p < 0.05 level; if they are a fluke, a more detailed
study of Glens Falls and its environs could clarify the local dialectology. And
finally, the sampling process in this dissertation focused on collecting data from
cities and from villages that play the role of cities in being the most densely
populated locations in their immediate environs. It was observed in Chapter 3
that villages (such as Sidney) that depend on a nearby city for commerce appear
to be more dialectologically unstable than communities that have their own
commercial development; the difference between Glens Falls and the adjacent
towns may represent a similar phenomenon, although with a different apparent
manifestation. This hypothesis, and the hypothesis above that -mentary and NCS
427
follow different density-dependent patterns, could be tested by examining in
more detail the villages and towns adjacent to other Inland North fringe cities.
7.4.3. St. Lawrence County
The sharpest dialect boundary between nearby communities in this
dissertation’s sample is that between Ogdensburg and Canton—Ogdensburg
exhibits a relatively high degree of NCS (though perhaps still in progress), with
some signs of incipient caught-cot merger, while Canton has the lowest NCS
scores of all the well-sampled communities and a caught-cot merger nearing
completion. There is no room for a gradual boundary between them, made to
look sharp merely because locations between them were unsampled;
Ogdensburg and Canton are only 20 miles apart with no substantial populated
places between them. The analysis of the boundary of the Inland North as the
edge of Southwestern New England settlement is complicated here by the fact
that the only information I was able to find on the settlement history of
Ogdensburg (Merriam 1907) was somewhat vague. But in any event, it is clear
that Canton was settled from Northwestern New England. And inasmuch as
Northwestern New England itself was settled from Southwestern New England,
then even if Ogdensburg was settled from Southwestern New England it is
surprising to find a sharper linguistic boundary between regions Northwestern
and Southwestern New England settlement than between regions of
Northwestern New England and Hudson Valley settlement, which do not share
a common origin.
428
In Chapter 3 I conjectured that the sharp difference between Ogdensburg
and Canton is because Ogdensburg is located on the St. Lawrence River, and
therefore more directly open to trade from the Erie Canal area and Inland North
core earlier in its history than Canton was. However, I have no idea if other
communities located on the St. Lawrence show the same Inland North behavior
as Ogdensburg does; the analysis is hampered here by the fact that Canton and
Ogdensburg are the only towns near the Inland North–North Country border
from which I collected data. The original chief research goal of this dissertation
was to identify the boundary between the Inland North and Southwestern New
England (or what turned out to be the Hudson Valley); collecting a detailed
geographical sample near the northern edge of Upstate New York was a lower
priority. Future research, then, might focus on additional villages in St. Lawrence
County, attempting to determine the status of the dialect boundary in that area
more exactly: Massena, on the shores of the St. Lawrence like Ogdensburg, but
further west, like Canton; Potsdam, a village northwest of Canton whose
population is closer to that of Ogdensburg and toward which Canton shows
some regional orientation; Gouverneur, away from the river but halfway
between Canton and the NCS city of Watertown. These communities have
different combinations of some of the features that have been conjectured to play
a role in locating the dialect boundary between Ogdensburg and Canton—
population size, closeness to Canada and the river, closeness to Vermont, and
conceivably settlement history—and thus collecting data from them could test
various hypotheses on the motivation for the location of the boundary.
429
However, the sharpness of the boundary would still not be explained by
any of these hypotheses even if they were correct. Why should not Canton at
least show as much /æ/-raising as is found in Oneonta or Amsterdam, cities
where nasal systems are just as dominant? It is conceivable that the caught-cot
merger plays a role here, in that (as argued earlier in this chapter) the presence of
the merger makes a symmetrical triangular system unlikely, and it may be that
without an available symmetrical structure to serve, by the second principle, as
the result of diffusion, the diffusion of the single sound change of /æ/-raising is
not permitted to take place. However, this analysis does not account for Phyllis
P., the Telsur speaker from Rutland, Vt. with both raised /æ/ and full caught-cot
merger.
In the next (and final) section, I offer a general synopsis of my principal
empirical findings and theoretical inferences in this dissertation.
7.5. Overall wrapup and synopsis
The chief empirical result of this dissertation is a more detailed
dialectological picture of Upstate New York than had been possible based on any
other recent research. The dialect regions into which Upstate New York is
divisible, shown on Map 7.1, are the following:
• the Inland North core, which was already known from existing
research to be the area of advanced NCS, focused in central and
western New York;
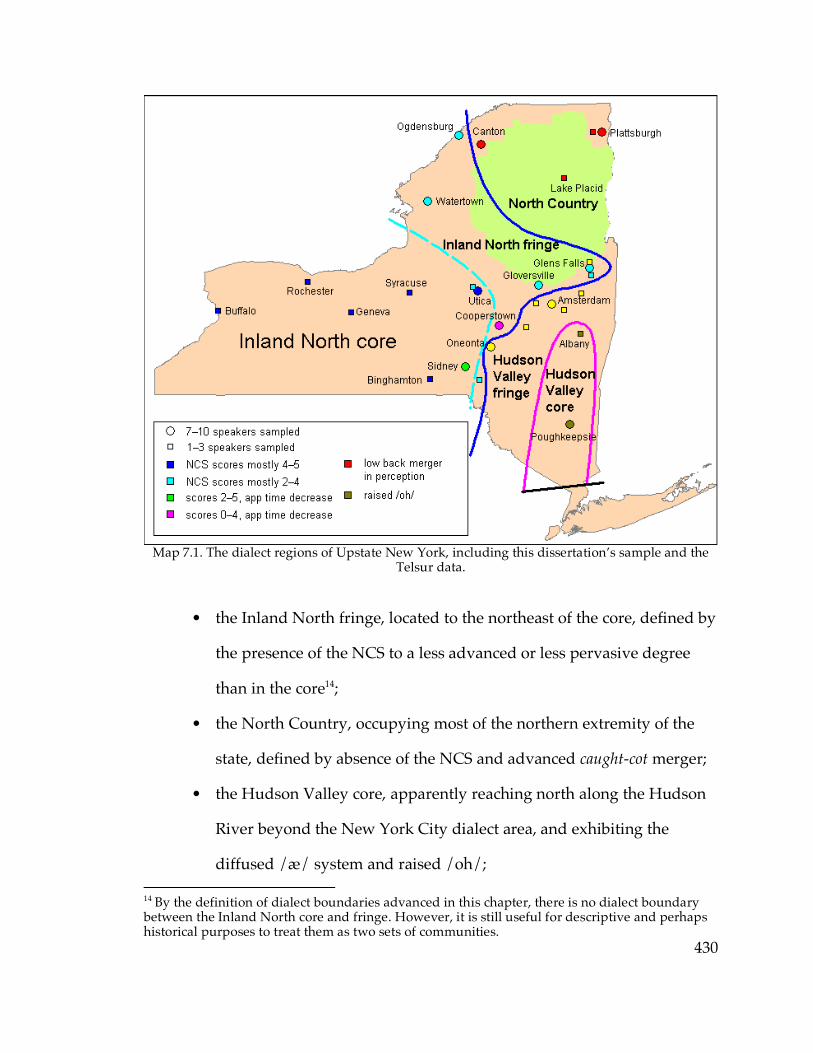
430
Map 7.1. The dialect regions of Upstate New York, including this dissertation’s sample and the
Telsur data.
• the Inland North fringe, located to the northeast of the core, defined by
the presence of the NCS to a less advanced or less pervasive degree
than in the core14;
• the North Country, occupying most of the northern extremity of the
state, defined by absence of the NCS and advanced caught-cot merger;
• the Hudson Valley core, apparently reaching north along the Hudson
River beyond the New York City dialect area, and exhibiting the
diffused /æ/ system and raised /oh/; 14 By the definition of dialect boundaries advanced in this chapter, there is no dialect boundary between the Inland North core and fringe. However, it is still useful for descriptive and perhaps historical purposes to treat them as two sets of communities.

431
• the Hudson Valley fringe, region between the Hudson Valley core and
the Inland North with few particularly marked features, showing some
influence of NCS vowels but little raising of /æ/.
The Inland North fringe and core are also distinguished by a relatively
high rate of continuous /æ/ systems, which are almost absent in the Hudson
Valley and North Country. The nasal system exists in the Inland North as well,
however, even among speakers with distinctly raised pre-oral /æ/, and the
phonetic distance between prenasal and pre-oral /æ/ is increasing in apparent
time.
Apparent-time trends toward the caught-cot merger are found in all of
these regions except the Hudson Valley core, contrary to the hypothesis that the
NCS should confer stable resistance to the merger. Meanwhile, the stressed-
penult pronunciation of -mentary words is present at a high rate throughout the
entirety of Upstate New York, even bleeding over into the Northern Tier of
Pennsylvania counties; it is less frequent along most of the eastern border of New
York State, but not in a way that resembles the boundaries any of the principal
dialect regions listed above.
The Inland North–Hudson Valley boundary seems to be correlated with
the settlement history of the communities in question: the early settlers of
communities that today exhibit the NCS were for the most part from
Southwestern New England, while the Hudson Valley communities, where the
NCS is absent, for the most part were founded by the descendants of New
Netherland Dutch colonists. I hypothesize that the Inland North core represents
the region in which the NCS originated, while the Inland North fringe consists of
432
those communities to which, due to their shared settlement history, the NCS was
able to diffuse relatively unimpeded. However, villages along the Inland North–
Hudson Valley boundary seem to display less stability or classifiability than the
cities with their own commercial development. The clearest example of this is
Sidney, which is visibly retreating from the NCS in apparent time; most of the
other villages sampled along the border have data from only two speakers, but
appear to be intermediate or ambiguous in status in a way that even the small
cities along the border are not. Cooperstown is a special case, apparently
undergoing new-dialect formation as a result of having a high percentage of
children of natives of other dialect regions among its population; it is
abandoning the NCS and entirely in favor of a less marked caught-cot merged
system.
The foregoing paragraphs outline the major empirical findings of this
dissertation. Based on these, I have formulated several hypotheses about the
structure of phonological change, and diffusion of phonological change in
particular. I describe these theoretical inferences for the most part as hypotheses,
rather than conclusions. This is because in many cases they are abstracted from
relatively small amounts of data, in which exceptions and unexplained
phenomena are still to be found, or which could be subject to more than one
possible interpretation. Serious testing of some of these hypotheses will have to
wait for studies directly targeted at answering the questions they pose, rather
than such a broad exploratory study as this dissertation fundamentally is; but
they are all founded directly on my (interpretation of my) empirical results and
the theoretical background of diffusion, dialectology, and phonological change.

433
Some of these hypotheses deal with the geographical distribution of
linguistic change: that small towns may be more subject to the linguistic
influence of the regional hubs on which they economically depend than are small
cities that have some commercial development of their own, perhaps because a
smaller absolute amount of dialect contact can have a greater proportional effect
on the population of a village; and that the geographic boundaries of an
innovative linguistic feature that does not interact with other structures in the
grammar may be more likely to be more directly shaped by regional patterns of
communication and overt cultural boundaries than to other linguistic
boundaries. A fairly abstract phonological hypothesis, suggested by the pilot
experiment I carried out in Ogdensburg and Canton, is that American English
does not distinguish phonemic length among low monophthongs.
The theoretical hypotheses about diffusion largely boil down to
elaborations of what I call have called the two principles of diffusion, taken from
Labov (2007) and defined earlier in this chapter: that diffusion of linguistic
change does not immediately change the structured relationships between
linguistic entities in the recipient community, but rather only affects surface-level
features; and that speakers in the recipient community are likely to reorganize
the result of diffusion into a more structurally symmetric or unmarked pattern.
These hypotheses include the following:
• The result of diffusion of a phonemic merger is not immediately
merger itself in the recipient community, but rather sound changes in
the direction of merger.
434
• Diffusion of a marked or unnatural sound change, such as the
lowering of a tense peripheral vowel, may be resisted.
• A bound derivational morpheme, such as -ary, is sufficiently
superficial as a linguistic entity to be able to be the subject of diffusion
per se.
• Diffusion should not be able to cause the “merger” of two
phonologically discrete allophones of a single phoneme back into the
same place in phonetic space.
This last hypothesis, I argue, is the reason why the NCS raising of /æ/ does not
appear to have effectively spread into regions where the nasal /æ/ system is
sufficiently dominant; the prenasal allophone blocks the pre-oral allophone from
raising. This hypothesis also depends on the principle, implicit in Bermúdez-
Otero (2007) but not explicitly stated, that the basic units of chain shifting are not
phonemes but rather potentially allophonic segments. This means that the Inland
North and Hudson Valley remain linguistically distinct because the full raising
of /æ/ is blocked from diffusing into the Hudson Valley, while the Inland North
fringe appears to have developed the NCS as a result of diffusion of all the NCS
features. Inspired by this, I propose defining the borders between dialect regions
as lying wherever a (social or structural) obstacle to the diffusion of linguistic
change exists.
This dissertation has only scratched the surface of New York State’s great
dialectological diversity, and much more work remains to be done, in both
geographical and linguistic ground to cover. However, even this relatively
restricted picture, the first detailed phonological portrait of the state, has

435
suggested answers to some questions about the structure of dialect diversity and
linguistic change, and beyond them pointed the way to deeper questions still.

436
Appendix
Index of sampled speakers
The following pages list all 119 of the speakers whose vowel systems were
phonetically analyzed. For each speaker, the following data is listed:
• pseudonym;
• home community;
• type of interview, in person (IP) or telephone (T);
• data of interview;
• year of birth, determined as discussed in Chapter 2;
• sex;
• mean formant values for the NCS vowels /æ/, /e/, /o/, /oh/, and
/ʌ/, although F1 of /ʌ/ has been omitted in order to save space and
because it does not play a part in the analyses in this dissertation;
• caught-cot minimal-pair judgments: merged (M), transitional (T), or
distinct (D).
A 120th speaker, Linda K. from Schenectady, whose vowel system was
not fully analyzed is not listed in the following table; her word-list /æ/ tokens
were analyzed, but none of her other vowel. She was interviewed by telephone
on August 29, 2006; her year of birth is 1926.
The actual recordings of the interviews and the individual vowel-token
measurement data will be archived at the Linguistics Lab at the University of
Pennsylvania.
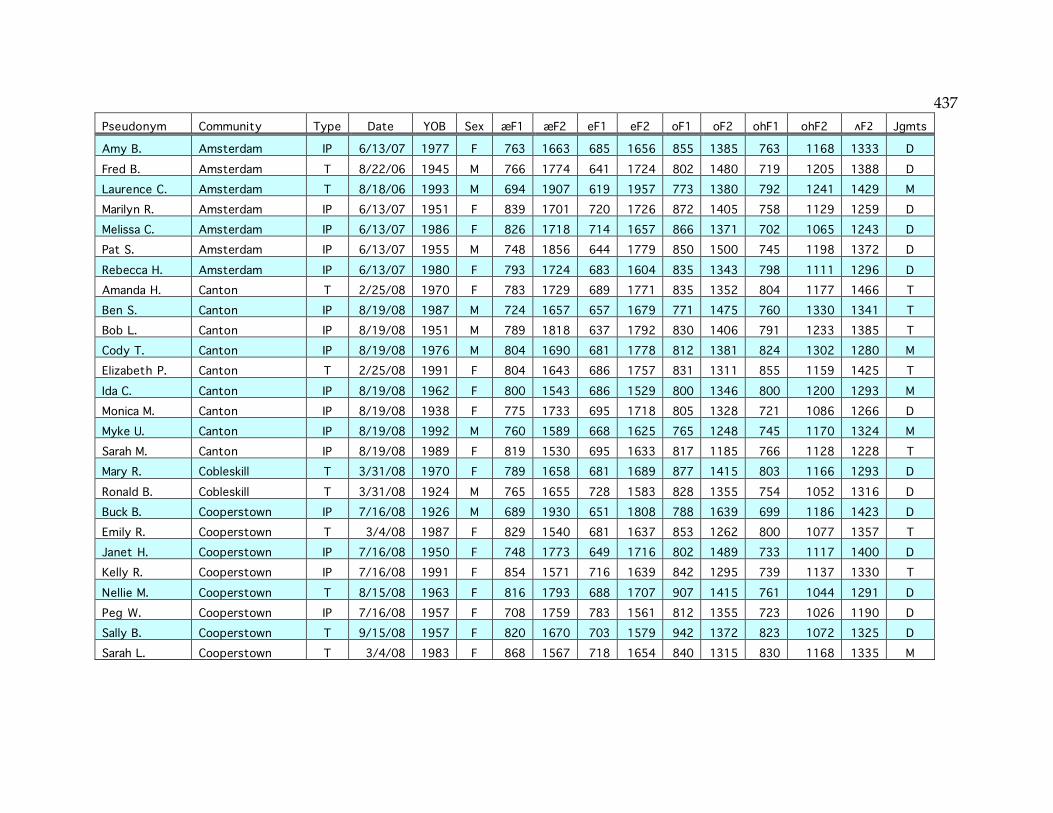
437 Pseudonym Community Type Date YOB Sex æF1 æF2 eF1 eF2 oF1 oF2 ohF1 ohF2 ʌF2 Jgmts
Amy B. Amsterdam IP 6/13/07 1977 F 763 1663 685 1656 855 1385 763 1168 1333 D Fred B. Amsterdam T 8/22/06 1945 M 766 1774 641 1724 802 1480 719 1205 1388 D Laurence C. Amsterdam T 8/18/06 1993 M 694 1907 619 1957 773 1380 792 1241 1429 M Marilyn R. Amsterdam IP 6/13/07 1951 F 839 1701 720 1726 872 1405 758 1129 1259 D Melissa C. Amsterdam IP 6/13/07 1986 F 826 1718 714 1657 866 1371 702 1065 1243 D Pat S. Amsterdam IP 6/13/07 1955 M 748 1856 644 1779 850 1500 745 1198 1372 D Rebecca H. Amsterdam IP 6/13/07 1980 F 793 1724 683 1604 835 1343 798 1111 1296 D Amanda H. Canton T 2/25/08 1970 F 783 1729 689 1771 835 1352 804 1177 1466 T Ben S. Canton IP 8/19/08 1987 M 724 1657 657 1679 771 1475 760 1330 1341 T Bob L. Canton IP 8/19/08 1951 M 789 1818 637 1792 830 1406 791 1233 1385 T Cody T. Canton IP 8/19/08 1976 M 804 1690 681 1778 812 1381 824 1302 1280 M Elizabeth P. Canton T 2/25/08 1991 F 804 1643 686 1757 831 1311 855 1159 1425 T Ida C. Canton IP 8/19/08 1962 F 800 1543 686 1529 800 1346 800 1200 1293 M Monica M. Canton IP 8/19/08 1938 F 775 1733 695 1718 805 1328 721 1086 1266 D Myke U. Canton IP 8/19/08 1992 M 760 1589 668 1625 765 1248 745 1170 1324 M Sarah M. Canton IP 8/19/08 1989 F 819 1530 695 1633 817 1185 766 1128 1228 T Mary R. Cobleskill T 3/31/08 1970 F 789 1658 681 1689 877 1415 803 1166 1293 D Ronald B. Cobleskill T 3/31/08 1924 M 765 1655 728 1583 828 1355 754 1052 1316 D Buck B. Cooperstown IP 7/16/08 1926 M 689 1930 651 1808 788 1639 699 1186 1423 D Emily R. Cooperstown T 3/4/08 1987 F 829 1540 681 1637 853 1262 800 1077 1357 T Janet H. Cooperstown IP 7/16/08 1950 F 748 1773 649 1716 802 1489 733 1117 1400 D Kelly R. Cooperstown IP 7/16/08 1991 F 854 1571 716 1639 842 1295 739 1137 1330 T Nellie M. Cooperstown T 8/15/08 1963 F 816 1793 688 1707 907 1415 761 1044 1291 D Peg W. Cooperstown IP 7/16/08 1957 F 708 1759 783 1561 812 1355 723 1026 1190 D Sally B. Cooperstown T 9/15/08 1957 F 820 1670 703 1579 942 1372 823 1072 1325 D Sarah L. Cooperstown T 3/4/08 1983 F 868 1567 718 1654 840 1315 830 1168 1335 M
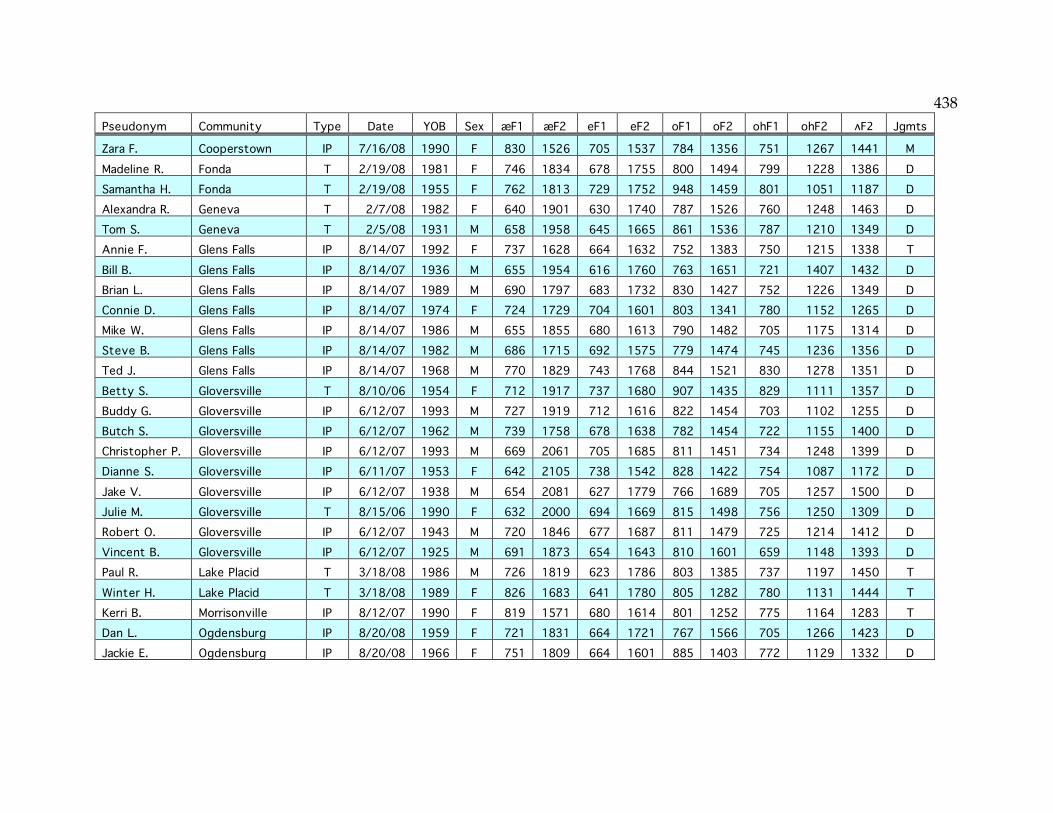
438 Pseudonym Community Type Date YOB Sex æF1 æF2 eF1 eF2 oF1 oF2 ohF1 ohF2 ʌF2 Jgmts
Zara F. Cooperstown IP 7/16/08 1990 F 830 1526 705 1537 784 1356 751 1267 1441 M Madeline R. Fonda T 2/19/08 1981 F 746 1834 678 1755 800 1494 799 1228 1386 D Samantha H. Fonda T 2/19/08 1955 F 762 1813 729 1752 948 1459 801 1051 1187 D Alexandra R. Geneva T 2/7/08 1982 F 640 1901 630 1740 787 1526 760 1248 1463 D Tom S. Geneva T 2/5/08 1931 M 658 1958 645 1665 861 1536 787 1210 1349 D Annie F. Glens Falls IP 8/14/07 1992 F 737 1628 664 1632 752 1383 750 1215 1338 T Bill B. Glens Falls IP 8/14/07 1936 M 655 1954 616 1760 763 1651 721 1407 1432 D Brian L. Glens Falls IP 8/14/07 1989 M 690 1797 683 1732 830 1427 752 1226 1349 D Connie D. Glens Falls IP 8/14/07 1974 F 724 1729 704 1601 803 1341 780 1152 1265 D Mike W. Glens Falls IP 8/14/07 1986 M 655 1855 680 1613 790 1482 705 1175 1314 D Steve B. Glens Falls IP 8/14/07 1982 M 686 1715 692 1575 779 1474 745 1236 1356 D Ted J. Glens Falls IP 8/14/07 1968 M 770 1829 743 1768 844 1521 830 1278 1351 D Betty S. Gloversville T 8/10/06 1954 F 712 1917 737 1680 907 1435 829 1111 1357 D Buddy G. Gloversville IP 6/12/07 1993 M 727 1919 712 1616 822 1454 703 1102 1255 D Butch S. Gloversville IP 6/12/07 1962 M 739 1758 678 1638 782 1454 722 1155 1400 D Christopher P. Gloversville IP 6/12/07 1993 M 669 2061 705 1685 811 1451 734 1248 1399 D Dianne S. Gloversville IP 6/11/07 1953 F 642 2105 738 1542 828 1422 754 1087 1172 D Jake V. Gloversville IP 6/12/07 1938 M 654 2081 627 1779 766 1689 705 1257 1500 D Julie M. Gloversville T 8/15/06 1990 F 632 2000 694 1669 815 1498 756 1250 1309 D Robert O. Gloversville IP 6/12/07 1943 M 720 1846 677 1687 811 1479 725 1214 1412 D Vincent B. Gloversville IP 6/12/07 1925 M 691 1873 654 1643 810 1601 659 1148 1393 D Paul R. Lake Placid T 3/18/08 1986 M 726 1819 623 1786 803 1385 737 1197 1450 T Winter H. Lake Placid T 3/18/08 1989 F 826 1683 641 1780 805 1282 780 1131 1444 T Kerri B. Morrisonville IP 8/12/07 1990 F 819 1571 680 1614 801 1252 775 1164 1283 T Dan L. Ogdensburg IP 8/20/08 1959 F 721 1831 664 1721 767 1566 705 1266 1423 D Jackie E. Ogdensburg IP 8/20/08 1966 F 751 1809 664 1601 885 1403 772 1129 1332 D
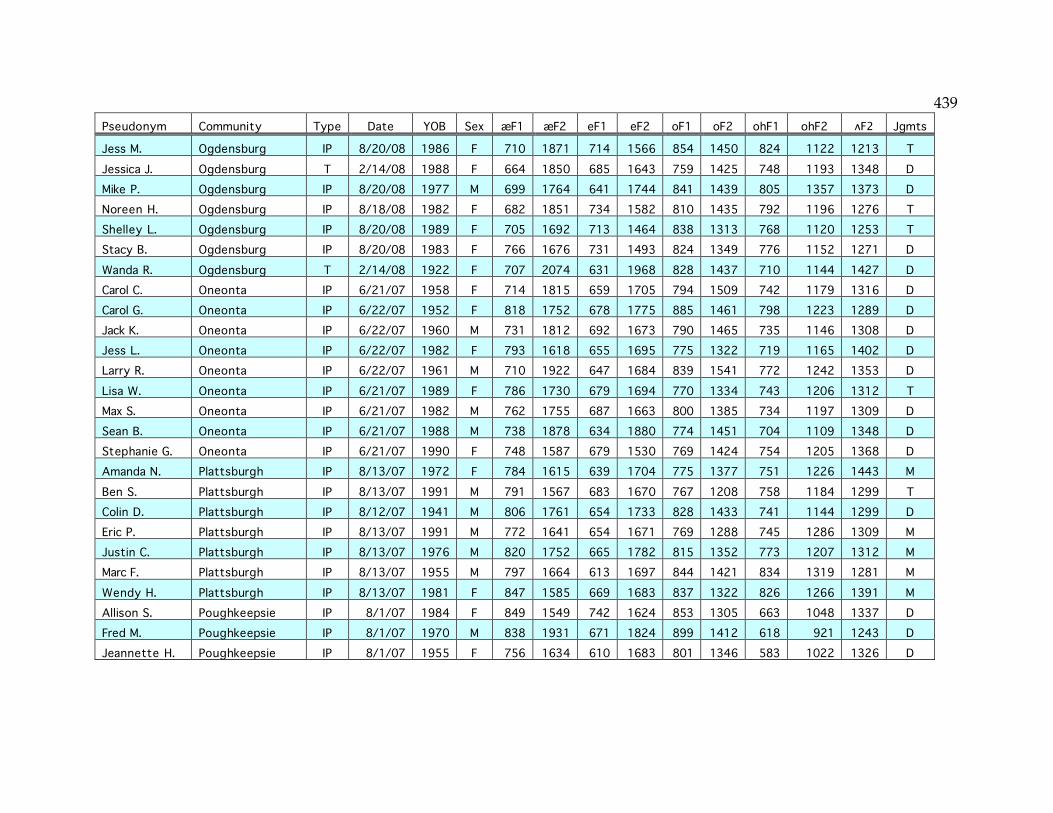
439 Pseudonym Community Type Date YOB Sex æF1 æF2 eF1 eF2 oF1 oF2 ohF1 ohF2 ʌF2 Jgmts
Jess M. Ogdensburg IP 8/20/08 1986 F 710 1871 714 1566 854 1450 824 1122 1213 T Jessica J. Ogdensburg T 2/14/08 1988 F 664 1850 685 1643 759 1425 748 1193 1348 D Mike P. Ogdensburg IP 8/20/08 1977 M 699 1764 641 1744 841 1439 805 1357 1373 D Noreen H. Ogdensburg IP 8/18/08 1982 F 682 1851 734 1582 810 1435 792 1196 1276 T Shelley L. Ogdensburg IP 8/20/08 1989 F 705 1692 713 1464 838 1313 768 1120 1253 T Stacy B. Ogdensburg IP 8/20/08 1983 F 766 1676 731 1493 824 1349 776 1152 1271 D Wanda R. Ogdensburg T 2/14/08 1922 F 707 2074 631 1968 828 1437 710 1144 1427 D Carol C. Oneonta IP 6/21/07 1958 F 714 1815 659 1705 794 1509 742 1179 1316 D Carol G. Oneonta IP 6/22/07 1952 F 818 1752 678 1775 885 1461 798 1223 1289 D Jack K. Oneonta IP 6/22/07 1960 M 731 1812 692 1673 790 1465 735 1146 1308 D Jess L. Oneonta IP 6/22/07 1982 F 793 1618 655 1695 775 1322 719 1165 1402 D Larry R. Oneonta IP 6/22/07 1961 M 710 1922 647 1684 839 1541 772 1242 1353 D Lisa W. Oneonta IP 6/21/07 1989 F 786 1730 679 1694 770 1334 743 1206 1312 T Max S. Oneonta IP 6/21/07 1982 M 762 1755 687 1663 800 1385 734 1197 1309 D Sean B. Oneonta IP 6/21/07 1988 M 738 1878 634 1880 774 1451 704 1109 1348 D Stephanie G. Oneonta IP 6/21/07 1990 F 748 1587 679 1530 769 1424 754 1205 1368 D Amanda N. Plattsburgh IP 8/13/07 1972 F 784 1615 639 1704 775 1377 751 1226 1443 M Ben S. Plattsburgh IP 8/13/07 1991 M 791 1567 683 1670 767 1208 758 1184 1299 T Colin D. Plattsburgh IP 8/12/07 1941 M 806 1761 654 1733 828 1433 741 1144 1299 D Eric P. Plattsburgh IP 8/13/07 1991 M 772 1641 654 1671 769 1288 745 1286 1309 M Justin C. Plattsburgh IP 8/13/07 1976 M 820 1752 665 1782 815 1352 773 1207 1312 M Marc F. Plattsburgh IP 8/13/07 1955 M 797 1664 613 1697 844 1421 834 1319 1281 M Wendy H. Plattsburgh IP 8/13/07 1981 F 847 1585 669 1683 837 1322 826 1266 1391 M Allison S. Poughkeepsie IP 8/1/07 1984 F 849 1549 742 1624 853 1305 663 1048 1337 D Fred M. Poughkeepsie IP 8/1/07 1970 M 838 1931 671 1824 899 1412 618 921 1243 D Jeannette H. Poughkeepsie IP 8/1/07 1955 F 756 1634 610 1683 801 1346 583 1022 1326 D

440 Pseudonym Community Type Date YOB Sex æF1 æF2 eF1 eF2 oF1 oF2 ohF1 ohF2 ʌF2 Jgmts
Louie R. Poughkeepsie IP 7/31/07 1954 M 695 1932 652 1793 753 1470 547 986 1291 D Mehmet T. Poughkeepsie IP 8/1/07 1972 M 763 1686 627 1715 802 1453 580 931 1438 D Natalie I. Poughkeepsie IP 8/1/07 1993 F 786 1775 618 1790 840 1369 671 1051 1466 D Vic R. Poughkeepsie IP 8/1/07 1932 M 764 1688 688 1661 815 1351 657 1005 1259 D Jeremy G. Queensbury IP 8/14/07 1989 M 706 1845 620 1791 748 1465 719 1217 1436 D Nate P. Queensbury IP 8/14/07 1990 M 781 1658 651 1644 822 1325 719 1066 1311 D Charlie P. Saratoga Springs T 2/11/08 1982 M 720 1796 696 1663 809 1478 716 1132 1290 D Sharon F. Saratoga Springs T 2/11/08 1945 F 810 1729 694 1736 875 1443 737 991 1270 D Benjamin W. Schenectady T 8/30/06 1938 M 736 1921 617 1839 818 1549 721 1231 1444 D Elaine B. Schenectady T 8/24/06 1929 F 783 1709 688 1657 866 1445 769 1160 1357 D Allison L. Sidney IP 7/14/08 1990 F 808 1651 728 1576 796 1359 731 1124 1300 D Amanda F. Sidney T 2/28/08 1950 F 665 1966 739 1645 914 1527 799 1130 1264 D George S. Sidney IP 7/14/08 1947 M 729 1796 672 1661 806 1510 755 1182 1354 D Jennifer B. Sidney IP 7/14/08 1987 F 748 1792 716 1664 838 1388 851 1160 1271 D Keith M. Sidney IP 7/14/08 1958 M 685 1992 648 1718 846 1641 812 1336 1346 D Lisa S. Sidney IP 7/14/08 1949 F 746 1622 753 1443 792 1362 735 1158 1271 D Pete G. Sidney IP 7/14/08 1974 M 799 1784 739 1642 844 1394 771 1124 1201 D Terri M. Sidney T 2/28/08 1958 F 558 2173 692 1591 909 1575 821 1126 1271 D Betty C. South Glens Falls IP 8/15/07 1959 F 852 1554 708 1531 839 1325 806 1152 1181 D Candie S. South Glens Falls IP 8/14/07 1983 F 745 1761 661 1611 752 1407 726 1174 1315 D Carl T. South Glens Falls IP 8/15/07 1940 M 686 1928 626 1897 708 1531 705 1188 1369 D Alex S. Utica IP 7/18/06 1989 M 673 1865 667 1666 791 1417 742 1150 1331 D Brian L. Utica IP 7/19/06 1983 M 725 1873 690 1706 841 1515 701 1112 1379 D Christie L. Utica IP 7/18/06 1988 F 655 1958 725 1723 837 1452 799 1052 1255 M Chuck O. Utica IP 7/18/06 1979 M 675 1884 713 1681 801 1518 768 1192 1318 D Janet B. Utica IP 7/19/06 1942 F 510 2300 790 1608 887 1647 842 1151 1289 D
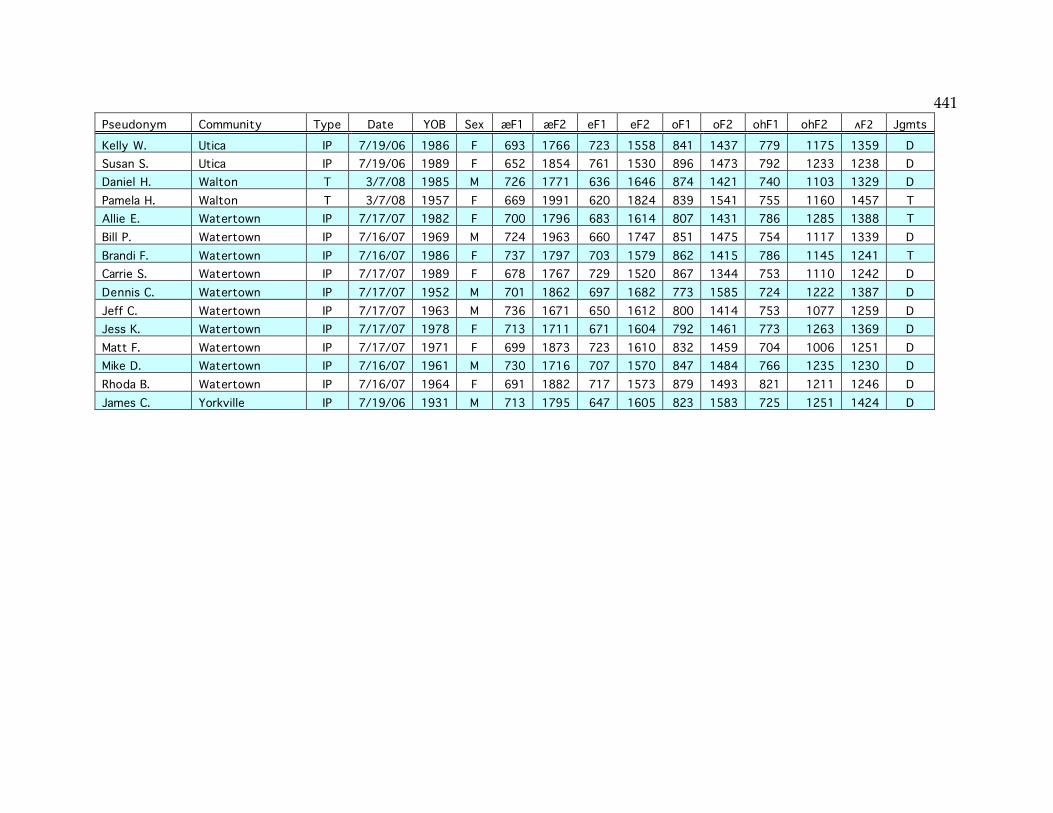
441 Pseudonym Community Type Date YOB Sex æF1 æF2 eF1 eF2 oF1 oF2 ohF1 ohF2 ʌF2 Jgmts Kelly W. Utica IP 7/19/06 1986 F 693 1766 723 1558 841 1437 779 1175 1359 D Susan S. Utica IP 7/19/06 1989 F 652 1854 761 1530 896 1473 792 1233 1238 D Daniel H. Walton T 3/7/08 1985 M 726 1771 636 1646 874 1421 740 1103 1329 D Pamela H. Walton T 3/7/08 1957 F 669 1991 620 1824 839 1541 755 1160 1457 T Allie E. Watertown IP 7/17/07 1982 F 700 1796 683 1614 807 1431 786 1285 1388 T Bill P. Watertown IP 7/16/07 1969 M 724 1963 660 1747 851 1475 754 1117 1339 D Brandi F. Watertown IP 7/16/07 1986 F 737 1797 703 1579 862 1415 786 1145 1241 T Carrie S. Watertown IP 7/17/07 1989 F 678 1767 729 1520 867 1344 753 1110 1242 D Dennis C. Watertown IP 7/17/07 1952 M 701 1862 697 1682 773 1585 724 1222 1387 D Jeff C. Watertown IP 7/17/07 1963 M 736 1671 650 1612 800 1414 753 1077 1259 D Jess K. Watertown IP 7/17/07 1978 F 713 1711 671 1604 792 1461 773 1263 1369 D Matt F. Watertown IP 7/17/07 1971 F 699 1873 723 1610 832 1459 704 1006 1251 D Mike D. Watertown IP 7/16/07 1961 M 730 1716 707 1570 847 1484 766 1235 1230 D Rhoda B. Watertown IP 7/16/07 1964 F 691 1882 717 1573 879 1493 821 1211 1246 D James C. Yorkville IP 7/19/06 1931 M 713 1795 647 1605 823 1583 725 1251 1424 D
442
442
References
Ash, Sharon (1999). “Word-list data and the measurement of sound change”.
Paper presented at NWAVE 28, Toronto.
Ash, Sharon (2002). “The distribution of a phonemic split in the mid-Atlantic
region: Yet more on short A”. U. Penn Working Papers in Linguistics 8.3:1–15.
Avis, Walter S. (1956). “Speech differences along the Ontario–United States
border”. Journal of the Canadian Linguistic Association 2.2:41–59.
Bagemihl, Bruce (1995). “Language games and related areas”. In John A.
Goldsmith (ed.), The Handbook of Phonological Theory, 697–712. Blackwell,
Cambridge, Mass.
Becker, Kara (2009). “Is c[ɔ]ffee t[ɔ]lk l[ɔ]st?: BOUGHT-raising on Manhattan’s
Lower East Side”. Paper presented at NWAV 38, Ottawa.
Bermúdez-Otero, Ricardo (2007). “Diachronic phonology”. In Paul de Lacy (ed.),
The Cambridge Handbook of Phonology, 497–517. Cambridge University Press,
Cambridge.
Bigham, Douglas (2007). “Vowel variation in southern Illinois”. Paper presented
at the annual meeting of the American Dialect Society, Anaheim, Calif.
Boberg, Charles (2000). “Geolinguistic diffusion and the U.S.–Canada border”.
Language Variation and Change 12.1:1–24.
Boberg, Charles (2001). “The phonological status of Western New England”.
American Speech 76:3–29.
Brown, William Howard (ed.) (1963). History of Warren County, New York. Board
of Supervisors of Warren County, Glens Falls, N.Y.
443
443
Bynon, Theodora (1977). Historical linguistics. Cambridge University Press,
Cambridge, U.K.
Callary, Robert E. (1975). “Phonological change and the development of an urban
dialect in Illinois”. Language in Society 4:155–169.
Campbell, Dudley M. (1906). A history of Oneonta. G.W. Fairchild, Oneonta, N.Y.
Campbell, Matthew T. (2003). “Generic names for soft drinks by county”.
Available at http://www.popvssoda.com/countystats/total-county.html; viewed 16
August 2009.
Chambers, J.K. (1994). “An introduction to dialect topography”. English Word-
Wide 15.1:33–53.
Chambers, J.K. (1998). “Social embedding of changes in progress”. Journal of
English Linguistics 26.1:5–36.
Cooper, James Fenimore (1838). The chronicles of Cooperstown. H. & E. Phinney,
Cooperstown, N.Y. Reproduced at
http://external.oneonta.edu/cooper/texts/chronicles.html; viewed 8 January 2009.
De Camp, L. Sprague (1944). “Pronunciation of Upstate New York place names”.
American Speech 19:4.250–265.
Dinkin, Aaron J. (2005). “Mary, darling, make me merry; say you’ll marry me:
Tense-lax neutralization in the Linguistic Atlas of New England”. U. Penn
Working Papers in Linguistics 11.2:73–90.
Dinkin, Aaron J. (2008a). “The real effect of word frequency on phonetic
variation”. U. Penn Working Papers in Linguistics 14.1:97–106.
Dinkin, Aaron J. (2008b). “Weakening resistance: Progress toward the low back
merger in New York State”. Paper presented at NWAV 37, Houston.
444
444
Dinkin, Aaron J. & Keelan Evanini (2009). “An eleméntàry linguistic definition of
Upstate New York”. Paper presented at NWAV 38, Ottawa.
Dinkin, Aaron J. & William Labov (2007). “Bridging the gap: Dialect boundaries
and regional allegiance in Upstate New York”. Paper presented at Penn
Linguistics Colloquium 31, Philadelphia.
Donlon, Hugh P. (1980). Amsterdam, New York: Annals of a mill town in the Mohawk
Valley. Donlon Associates, Amsterdam, N.Y.
Durant, Samuel W. (1878). History of Oneida County, New York. Everts & Fariss,
Philadelphia.
Eckert, Penelope. (2008). “Where do ethnolects stop?” International Journal of
Bilingualism 12(1–2):25–42.
Evanini, Keelan (2009). The permeability of dialect boundaries: A case study of the
region surrounding Erie, Pennsylvania. PhD dissertation, University of
Pennsylvania.
Farquhar, Kelly Yacobucci & Scott G. Haefner (2006). Amsterdam. Arcadia,
Charleston, S.C.
Frothingham, Washington (ed.) (1892a). History of Fulton County. D. Mason,
Syracuse, N.Y.
Frothingham, Washington (ed.) (1892b). History of Montgomery County. D. Mason,
Syracuse, N.Y.
Glens Falls Historical Association (1978). Bridging the years: Glens Falls, New York,
1763–1978. Glens Falls Historical Association, Glens Falls, N.Y.
Gould, Ernest C. (1969). Centennial history of Watertown, New York: A proud
heritage—a bright future. Theodore C. Oakes, New York.
445
445
Harris, John (1985). Phonological variation and change: Studies in Hiberno-English.
Cambridge University Press, Cambridge.
Herold, Ruth (1990). Mechanisms of merger: The implementation and distribution of
the low back merger in eastern Pennsylvania. PhD dissertation, University of
Pennsylvania.
History of Delaware County (1880). W. W. Munsell, New York. Reproduced at
http://www.dcnyhistory.org/munsell.html; viewed 8 January 2009.
Hooper, Joan B. (1976). “Word frequency in lexical diffusion and the source of
morphophonological change”. In Christie, William M., Jr., (ed.), Current
Progress in Historical Linguistics. North-Holland, Amsterdam.
Hough, Franklin Benjamin (1853). A history of St. Lawrence and Franklin Counties,
New York, from the earliest period to the present time. Little & Co., Albany, N.Y.
Hough, Franklin Benjamin (1854). A history of Jefferson County in the state of New
York. Joel Munsell, Albany, N.Y.
Hurd, D. Hamilton (1880). History of Clinton and Franklin Counties, New York. J.W.
Lewis, Philadelphia.
Hyde, Louis Fiske (1936). History of Glens Falls. Glens Falls Post Company, Glens
Falls, N.Y.
Ito, Rika (1999). Diffusion of urban sound change in rural Michigan: A case of the
Northern Cities Shift. PhD dissertation, Michigan State University.
Johnson, Daniel Ezra (2007). Stability and change along a dialect boundary: The low
vowels of southeastern New England. PhD dissertation, University of
Pennsylvania.
446
446
Kerswill, Paul (2002). “Koineization and accommodation”. In J. K. Chambers,
Peter Trudgill, & Natalie Schilling-Estes (eds.), The handbook of language
variation and change. Blackwell, Malden, Mass.
Kurath, Hans (1939). Handbook of the linguistic geography of New England. Brown
University, Providence, R.I.
Kurath, Hans (1949). A word geography of the eastern United States. U. of Michigan
Press, Ann Arbor, Mich.
Kurath, Hans & Raven I. McDavid, Jr. (1961). The pronunciation of English in the
Atlantic states. U. of Michigan Press, Ann Arbor, Mich.
Labov, William ([1966] 2006). The social stratification of English in New York City.
Second edition: Cambridge University Press, Cambridge, U.K.
Labov, William. (1974). “Linguistic change as a form of communication”. In
Albert Silverstein (ed.), Human communication: Theoretical explanations, 221–256.
Lawrence Erlbaum Associates, Hillsdale, N.J.
Labov, William (1989). “Exact description of the speech community: Short A in
Philadelphia”. In Ralph W. Fasold & Deborah Schiffrin (eds.), Language change
and variation, 1–57. John Benjamins, Philadelphia.
Labov, William (1994). Principles of linguistic change, volume 1: Internal factors.
Blackwell, Malden, Mass.
Labov, William (2001). Principles of linguistic change, volume 2: Social factors.
Blackwell, Malden, Mass.
Labov, William (2007). “Transmission and diffusion”. Language 83.2:344–387.
Labov, William (2008). “The mysterious uniformity of the Inland North”. Paper
presented at Methods XIII, Leeds.
447
447
Labov, William (to appear). Principles of linguistic change, volume 3: Cognitive and
cultural factors. Blackwell, Malden, Mass. Available at
http://www.ling.upenn.edu/phonoatlas/PLC3/PLC3.html.
Labov, William, Sharon Ash, & Charles Boberg (2006). The atlas of North American
English: Phonetics, phonology, and sound change. Mouton/de Gruyter, Berlin.
Labov, William & Maciej Baranowski (2006). “50 msec”. Language Variation and
Change 18:3.223–240.
Labov, William, Malcah Yaeger, & Richard Steiner (1972). A quantitative study of
sound change in progress. U.S. Regional Survey, Philadelphia.
Martinet, André (1952). “Function, structure, and sound change”. Word 8:1–32.
McCarthy, Corrine (2008). “The Northern Cities Shift in real- and apparent-time:
Evidence from Chicago”. Paper presented at NWAV 37, Houston.
Merriam, Nellie (1907). “The first settlement of Ogdensburg”. In Daughters of
the American Revolution, Swe-Kat-Si Chapter (eds.), Reminiscences of
Ogdensburg, 1749–1907, 1–17. Silver, Burdett, & Co., New York.
Moulton, William G. (1968). “Structural dialectology”. Language 44.3:451–466.
Murray, David (ed.) (1898). Delaware County, New York: History of the century,
1797–1897. W. Clark, Delhi, N.Y. Reproduced at
http://www.dcnyhistory.org/murray17971897.html; viewed 8 January 2009.
Murray, Thomas E. (2002). “Language variation and change in the urban
Midwest: The case of St. Louis, Missouri”. Language Variation and Change
14:347–361.
Muthmann, Gustav (2002). Reverse English dictionary: Based on phonological and
morphological principles. Mouton/de Gruyter, Berlin.
448
448
Novak, Barbra (2004). “The progression of the Northern Cities Shift in Ballston
Spa, New York”. Paper presented at NWAV 33, Ann Arbor, Mich.
Paul. Hermann ([1890] 1970). Principles of the history of language, H. A. Strong
(trans.). McGrath Publishing Co., College Park, Md.
Phillips, Betty (1984). “Word frequency and the actuation of sound change”.
Language 60:320–342.
Pierrehumbert, Janet (2002). “Word-specific phonetics”. In Carlos Gussenhoven
& Natasha Warner (eds.), Laboratory Phonology 7, 101–139. Mouton/de
Gruyter, Berlin.
Platt, Edmund ([1905] 1987). The Eagle’s history of Poughkeepsie: From the earliest
settlements 1683 to 1905. Dutchess County Historical Society, Poughkeepsie,
N.Y.
“Population trends in New York State’s cities” (2004). Local Government Issues in
Focus 1.1. Office of the New York State Comptroller, Division of Local
Government Services & Economic Development. Available at
http://www.osc.state.ny.us/localgov/pubs/research/pop_trends.pdf; viewed 6
December 2009.
Preston, Dennis (2008). “Diffusion and transmission: The Northern Cities Chain
Shift”. Paper presented at Methods XIII, Leeds.
Roberts, Ellis H. (1911). “Utica: Its history and progress”. In J. N. Larned, A
History of Buffalo, vol. II:257–291. The Progress of the Empire State Company,
New York.
Ryan, Mary P. (1983). Cradle of the middle class: The family in Oneida County, New
York, 1790–1865. Cambridge University Press, New York.
449
449
Sinhababu, Neil. (2007). “Dance floor linguistics research, and other adventures”.
Blog post at The Ethical Werewolf, available at
http://ethicalwerewolf.blogspot.com/2007/08/dance-floor-linguistics-research-
and.html; viewed 17 August 2007.
Thomas, C. K. (1935a). “Pronunciation in Upstate New York”. American Speech
10.2:107–112.
Thomas, C. K. (1935b). “Pronunciation in Upstate New York (III)”. American
Speech 10.4:292–297.
Trudgill, Peter (1974). “Linguistic change and diffusion: Description and
explanation in sociolinguistic dialect geography”. Language in Society 3:215–
246.
Trudgill, Peter (1986). Dialects in contact. Blackwell, New York.
Trudgill, Peter, Elizabeth Gordon, Gillian Lewis, & Margaret Maclagan (2000).
“Determinism in new-dialect formation and the genesis of New Zealand
English”. Journal of Linguistics 36:299–318.
Ullman, Michael T., Ivy V. Estabrooke, Karsten Steinhauer, Claudia Brovetto,
Roumyana Pancheva, Kaori Ozawa, Kristen Mordecai, & Pauline Make (2002).
“Sex differences in the neurocognition of language”. Brain and Language
83:141–143.
Veatch, Thomas Clark (1991). English vowels: Their surface phonology and phonetic
implementation in vernacular dialects. PhD dissertation, University of
Pennsylvania.

450
450
Wells, J. C. (1990). “Syllabification and allophony”. In Susan Ramsaran (ed.),
Studies in the Pronunciation of English: A Commemorative Volume in Honour of A.
C. Gimson, 76–86. Routledge, New York.