Embed Size (px)
Citation preview
PRZEGLĄD ELEKTROTECHNICZNY, ISSN 0033-2097, R. 90 NR 4/2014 149
Mikołaj BARTLOMIEJCZYK1,3, Milan ŠIMKO2, Milan CHUPÁČ2, Štefan HAMACEK3
Gdansk University of Technology, Poland (1), University of Žilina, Slovakia (2), University of Ostrava, Czech Republic (3)
Diagnostics of thermal processes in antenna systems of broadcast stations
Abstract.. Diagnostics is an important element associated with the operation of a radio antenna systems, allowing earlier detection of potential damage. Thermography is one of the diagnostic tools, which allows for non-invasive assessment of technical condition. It brings together both financial savings associated with the removal of the damage and the potential effects caused by it. The article presents an example of using a thermal imaging technique in fault location antenna systems.
Streszczenie. Istotnym elementem związanym z eksploatacja radiowych stacji nadawczych jest diagnostyka systemów antenowych, co umożliwia wcześniejsze wykrycie potencjalnych uszkodzeń. Jednym z narzędzi diagnostyki jest termowizja, która pozwala na bezinwazyjną ocenę stanu technicznego. Przynosi to ze sobą oszczędności finansowe związane zarówno z usuwaniem samego uszkodzenia jak I potencjalnymi skutkami przezeń spowodowanymi. W artykule przedstawiono przykład użycia techniki termowizyjnej w lokalizacji uszkodzenia systemów antenowych. (Diagnostyka zjawisk termicznych w systemach antenowych stacji nadawczych).
Keywords: antenna, thermography, radio, diagnostics. Słowa kluczowe: anteny, termowizja, radiostacje, diagnostyka.
doi:10.12915/pe.2014.04.34
Introduction The main characteristic of radio transmission is the
usage of radio waves in order to transmit information. The research area connected with this branch of science is undergoing constant development. It requires many technical innovations as the area of radio telecommunication networks applications is growing steadily and they provide wider and wider range of services. By means of their transmitters radio transmission is realized on a local, regional, national and international scale. Radio waves used are of short, very short and medium wavelengths. Some broadcast stations are able to cover the area of practically the whole world.
Exploitation of such broadcast stations equipped with antenna apparatus involves considerable technical requirements as for operational reliability. The reason for this are both the costs connected with removing potential technical faults as well as financial losses caused by the breaks in the transmitters operation. Thus the reliability of the subject apparatus is a key issue from the economic effectiveness point of view. Proper apparatus operation depends not only on the manufacture quality but also on periodic overhaul maintenance works (maintenance of antenna systems and their transmission media) since complex antenna systems are extremely sensitive to deterioration of transition resistances of the very antenna centres. Along with the rise in transition resistances value there falls the transmitter’s transmission power, and there arise losses on connecting elements. Carrying out regular revision overhauls is necessary for optimal broadcasting system performance, yet these are costly due to the necessity of running the works at height. One of the possibilities to limit the costs is applying a thermovision technique, which significantly reduces and simplifies the diagnostics process of antenna apparatus and limits the costs of these works [1, 2, 3].
From the point of view of proper exploitation of broadcast stations antenna systems it is advised to conduct control twice a year and remove detected faults immediately.
The most essential maintenance activities for antenna systems are:
1) overhaul of the fedeer system of antenna (wire distance control, capacitor frames, equalizing links, etc.),
2) overhaul of antenna itself (control of pulling mechanisms, insulation elements, etc.),
3) overhaul of phase distributor (control of contact elements, contact surfaces, etc.).
Theoretical analysis
At making thermal calculations (connector - conductor etc.) of overhead antenna systems it is crucial to take the following factors into consideration [4, 5]:
1) amount of load during measurement, 2) influence of wind speed on the amount of measured
heating. In order to determine precisely the value of temperature
growth at the point of contact one can base on dependencies between electric current, heat and time. In this case it will be a dependency between a current and temperature increase caused by it. This relation is considerably complex due to existence of many boundary conditions. A simplified conduct of procedure will be presented in the further part of this article.
On the basis of thermal calculations it is possibile to determine such temperature increase which would occur on the analyzed connection point in case of rated (i.e. 100%) load and lack of wind (i.e. wind speed v = 0 m/s). In this way acquired values of temperature increase are classified into several groups according to the quantity and importance of potential failures evoked by them. Appropriate preventive maintenance activities are defined for each group. Calculations of non-insulated conductor temperature increase caused by a direct current were made with the following assumptions:
a) a current density in the conductor is uniform, b) a conductor is uniform and linear, c) the temperature around the conductor is even.
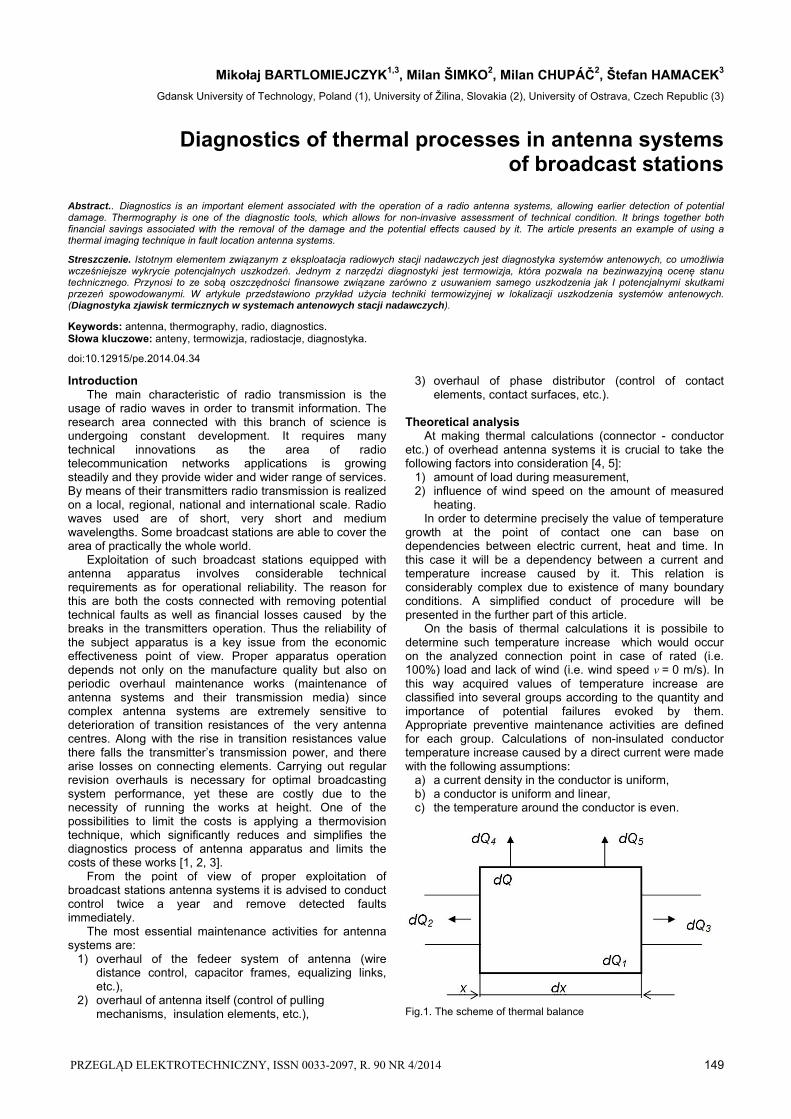
Fig.1. The scheme of thermal balance
150 PRZEGLĄD ELEKTROTECHNICZNY, ISSN 0033-2097, R. 90 NR 4/2014
Basing on the above-mentioned assumptions one can define the following thermal balance equations for the increase of dx distance:
(1) , where: dQ - element heat (connector), dQ1 - heat causing temperature increase (connector), dQ2 = dQ3 - heat led off from connector to conductor, dQ4 - heat emitted to the surroundings, dQ5 - heat emitted to the surroundings due to incandescence, dQ, dQ1, dQ4 - come out of Fig.1.
Fig.2. The dependence between the temperature increase and time
Fig.3. The temperature in function of time in case of spacing collar and capacitor frame
Fig.4. The dependence between the temperature of the contact point and relative transmission power in case of capacity frame, spacing collar and feeding line
Equation (1) after accepting the assumption of a steady temperature decrease along the conductor, i.e.: dQ2 = dQ3 = 0, will take the form of:
(2) ,
In the time function the above equation will take the form of:
(3) ∆ ∆ ∆ ∆ ,
By the assumption 0 = 0
(4) ∆ ∆ 1 ,
where: τ - time constant, 0 - temperature increase in time t = 0, - temperature increase in definite time.
Fig.5. The dependence between the warming of the contact point and transmission power in case of good and bad connection
Measurements
With regard to the complex character of a temperature increase dependency on the value of the current, which results from many boundary conditions, numerous measurements were conducted in order to facilitate the heating analysis of connections power supply line – spacing collar, capacitor frame on the area of antenna’s feeder, mechanical pulling device, etc. depending on the transmitter’s sending power. Temperatures of antenna system’s elements were measured with a thermovision camcorder Therma CAM P 65 and a pyrometer for various signal power sent. The measurement was executed after reaching fixed level of temperature value. This way a standard dependency (Fig. 3) of temperature increase spacing collar and capacitor frame was determined, analogous to Fig. 2. Following measurements were conducted in two conditions: at contact point in a clear condition and with a proper contact force and at contaminated and loosened contact point. 1) At contact point in a clear condition and with a
proper contact force If the connection feeder line – capacitor frame, spacing
collar etc. are in a good technical condition, i.e. the value of the contact force does not exceed permitted range and there is no contamination, then the contact point temperature have to be identical as in the remaining part of the conductor (Fig. 3). Table 1. The parameters of measurement presented on fig. 6 Sp 1 – feeder line temperature (Tl) 8.5 C Ar 1 – contact point temperature > 130.2 C ∆t1 – calculeted tepmerature of the contact point (Sp 1)
> 121.7 C
Transmission power Pn =250 kW Transmission frequency f =11650 kHz
PRZEGLĄD ELEKTROTECHNICZNY, ISSN 0033-2097, R. 90 NR 4/2014 151
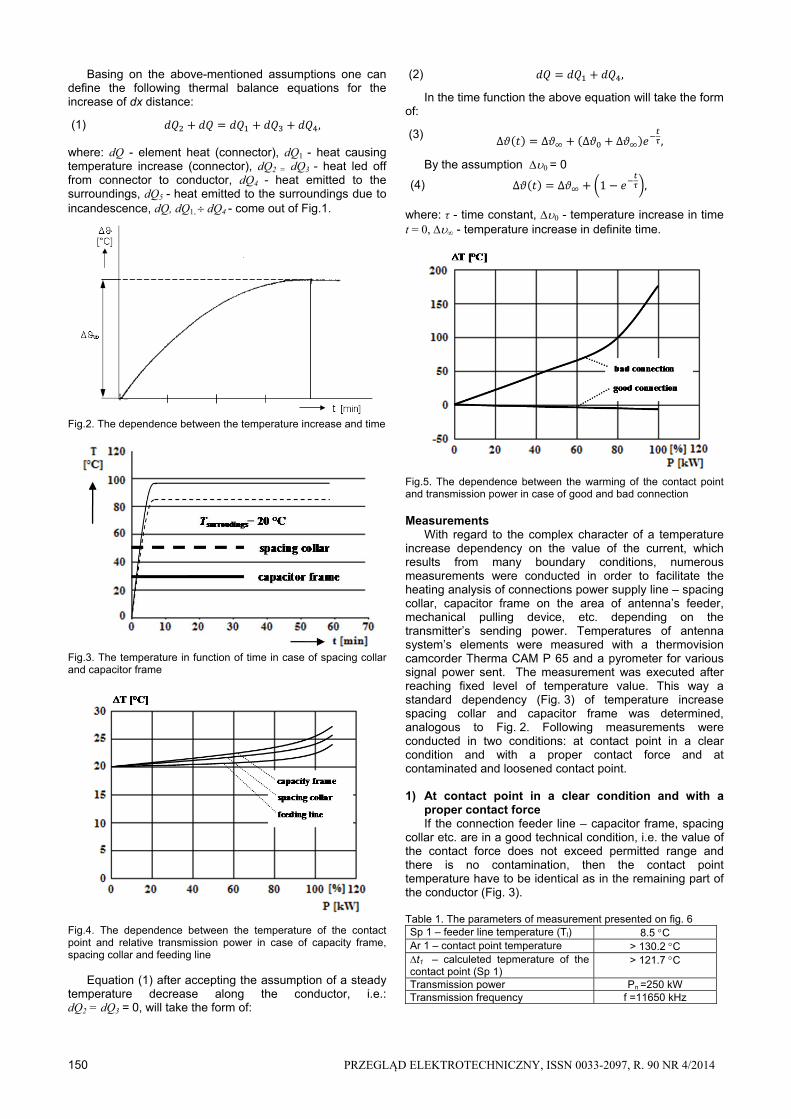
2) At contaminated and loosened contact point Fig. 4 presents measured characteristics of temperature increase depending on the load. Temperature increase values ∆t were calculated on the basis of the relation
(5) ∆
where: Tcon – measured temperature of contact point, Tl – temperature of the power line acquired at measurements described in point 1 (clear connection).
Fig.6. The real picture and the thermogram of damage places feeder line – capacitor frame
At contaminated and loosened contact point the characteristic of temperature increase depending on the power sent is of a parabolic character. The measurements’ results were shown on thermograms and presented characteristics were prepared on their basis.
In the situation when, due to exploitation conditions, the sending power was of a lower value than the transmitter’s rated power, it is possible to determine the temperature increase for the rated load on the basis of a relation:
(6) ∆ %∆
,
where ∆T100% - temperature increase defined for the transmitter’s nominal power, ∆t - measured temperature increase during the transmitter’s work at the power lower than the nominal power, PM - the transmitter’s power of work during the measurement, Pn - the transmitter’s Power.
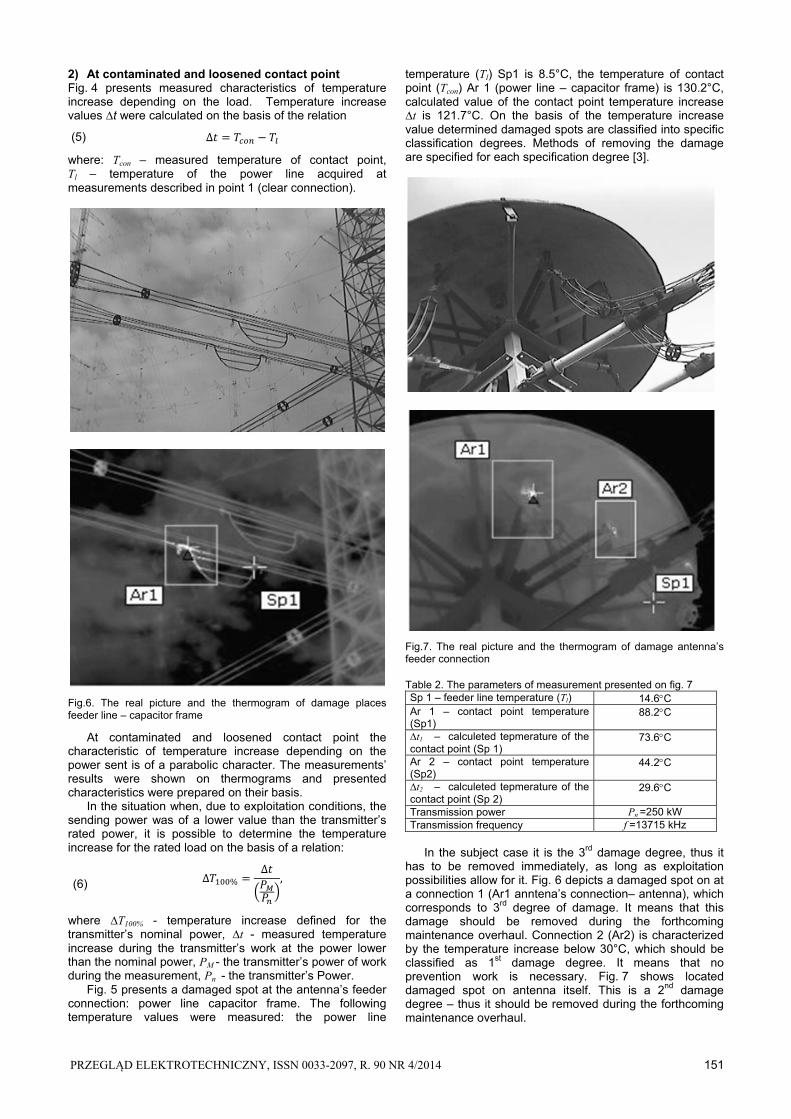
Fig. 5 presents a damaged spot at the antenna’s feeder connection: power line capacitor frame. The following temperature values were measured: the power line
temperature (Tl) Sp1 is 8.5°C, the temperature of contact point (Tcon) Ar 1 (power line – capacitor frame) is 130.2°C, calculated value of the contact point temperature increase ∆t is 121.7°C. On the basis of the temperature increase value determined damaged spots are classified into specific classification degrees. Methods of removing the damage are specified for each specification degree [3].
Fig.7. The real picture and the thermogram of damage antenna’s feeder connection Table 2. The parameters of measurement presented on fig. 7 Sp 1 – feeder line temperature (Tl) 14.6C Ar 1 – contact point temperature (Sp1)
88.2C
∆t1 – calculeted tepmerature of the contact point (Sp 1)
73.6C
Ar 2 – contact point temperature (Sp2)
44.2C
∆t2 – calculeted tepmerature of the contact point (Sp 2)
29.6C
Transmission power Pn =250 kW Transmission frequency f =13715 kHz
In the subject case it is the 3rd damage degree, thus it
has to be removed immediately, as long as exploitation possibilities allow for it. Fig. 6 depicts a damaged spot on at a connection 1 (Ar1 anntena’s connection– antenna), which corresponds to 3rd degree of damage. It means that this damage should be removed during the forthcoming maintenance overhaul. Connection 2 (Ar2) is characterized by the temperature increase below 30°C, which should be classified as 1st damage degree. It means that no prevention work is necessary. Fig. 7 shows located damaged spot on antenna itself. This is a 2nd damage degree – thus it should be removed during the forthcoming maintenance overhaul.
152 PRZEGLĄD ELEKTROTECHNICZNY, ISSN 0033-2097, R. 90 NR 4/2014
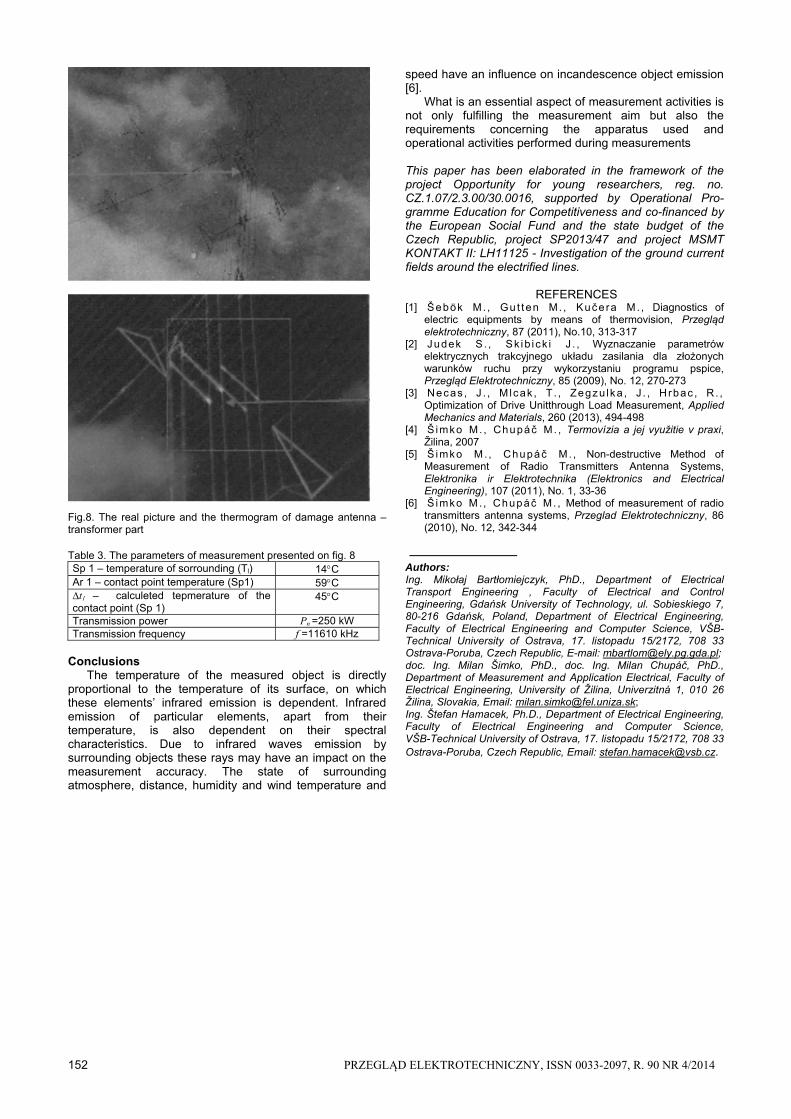
Fig.8. The real picture and the thermogram of damage antenna – transformer part Table 3. The parameters of measurement presented on fig. 8 Sp 1 – temperature of sorrounding (Tl) 14C Ar 1 – contact point temperature (Sp1) 59C ∆t1 – calculeted tepmerature of the contact point (Sp 1)
45C
Transmission power Pn =250 kW Transmission frequency f =11610 kHz
Conclusions
The temperature of the measured object is directly proportional to the temperature of its surface, on which these elements’ infrared emission is dependent. Infrared emission of particular elements, apart from their temperature, is also dependent on their spectral characteristics. Due to infrared waves emission by surrounding objects these rays may have an impact on the measurement accuracy. The state of surrounding atmosphere, distance, humidity and wind temperature and
speed have an influence on incandescence object emission [6]. What is an essential aspect of measurement activities is not only fulfilling the measurement aim but also the requirements concerning the apparatus used and operational activities performed during measurements This paper has been elaborated in the framework of the project Opportunity for young researchers, reg. no. CZ.1.07/2.3.00/30.0016, supported by Operational Pro-gramme Education for Competitiveness and co-financed by the European Social Fund and the state budget of the Czech Republic, project SP2013/47 and project MSMT KONTAKT II: LH11125 - Investigation of the ground current fields around the electrified lines.
REFERENCES
[1] Šebök M. , Gu t ten M. , Kučera M. , Diagnostics of electric equipments by means of thermovision, Przegląd elektrotechniczny, 87 (2011), No.10, 313-317
[2] Judek S . , Sk ib i ck i J . , Wyznaczanie parametrów elektrycznych trakcyjnego układu zasilania dla złożonych warunków ruchu przy wykorzystaniu programu pspice, Przegląd Elektrotechniczny, 85 (2009), No. 12, 270-273
[3] Necas , J . , M lcak , T . , Zegzu lka , J . , H rbac , R . , Optimization of Drive Unitthrough Load Measurement, Applied Mechanics and Materials, 260 (2013), 494-498
[4] Š imko M. , Chupáč M . , Termovízia a jej využitie v praxi, Žilina, 2007
[5] Š imko M. , Chupáč M. , Non-destructive Method of Measurement of Radio Transmitters Antenna Systems, Elektronika ir Elektrotechnika (Elektronics and Electrical Engineering), 107 (2011), No. 1, 33-36
[6] Š imko M. , Chupáč M. , Method of measurement of radio transmitters antenna systems, Przeglad Elektrotechniczny, 86 (2010), No. 12, 342-344
Authors: Ing. Mikołaj Bartłomiejczyk, PhD., Department of Electrical Transport Engineering , Faculty of Electrical and Control Engineering, Gdańsk University of Technology, ul. Sobieskiego 7, 80-216 Gdańsk, Poland, Department of Electrical Engineering, Faculty of Electrical Engineering and Computer Science, VŠB-Technical University of Ostrava, 17. listopadu 15/2172, 708 33 Ostrava-Poruba, Czech Republic, E-mail: [email protected]; doc. Ing. Milan Šimko, PhD., doc. Ing. Milan Chupáč, PhD., Department of Measurement and Application Electrical, Faculty of Electrical Engineering, University of Žilina, Univerzitná 1, 010 26 Žilina, Slovakia, Email: [email protected]; Ing. Štefan Hamacek, Ph.D., Department of Electrical Engineering, Faculty of Electrical Engineering and Computer Science, VŠB-Technical University of Ostrava, 17. listopadu 15/2172, 708 33 Ostrava-Poruba, Czech Republic, Email: [email protected].