Embed Size (px)
Citation preview

Diagnostic Testing Solutions for Power Transformers

2
testing during manufacturing factory acceptance testing
commissioning acceptance testing
Prevention is Better than Cure - Know More About the Condition of Your Transformer
manufacturing commissioning operation
Taking the right action at the right time
> periodic testing
> testing after an event - relocation, protection trip or warning, overcurrent, overvoltage, earthquake ...
Keep your transformer in good condition
with testing
factors causing deteriorationmechanical impacts
>transportation event >post fault event >seismic activity event >etc.
maintain OLTC >corroded contacts >diverter switch >motor & brake
tran
sfo
rmer
co
nd
itio
n100 %
and subsequent preventive actions

3
Prevention is Better than Cure - Know More About the Condition of Your Transformer
replacementoperation
> periodic testing
> testing after an event - relocation, protection trip or warning, overcurrent, overvoltage, earthquake ...
Keep your transformer in good condition
with testing
factors causing deterioration
aging >overloading >overheating >moisture
protection problems >protection underfunction >protection failure
Processing of insulation >degassing of fluid >retrofilling >drying of transformer >passivators or inhibitors
replace parts >bushings >surge arresters >gaskets >pumps, fans, etc.
and subsequent preventive actions
transformer life expectancy

44
Transformer Parts and Their Possible Faults
Part Faults detectable Measurement
Bushings
Partial breakdown between capacitive graded layers, cracks in resin-bonded insulation x x x x
Aging and moisture x x xOpen or compromised measuring tap connection x xPartial discharges in insulation x xLoss of oil in an oil-filled bushing x
Bushing CTsCurrent ratio or phase error considering burden, excessive residual magnetism, non-compliance to relevant IEEE or IEC standard x
Insulation materialsMoisture in solid insulation x1 x1 xAging, moisture, contamination of insulation fluids x x xPartial discharges x x
LeadsContact problems x xMechanical deformation x
OLTC
Contact problems in tap selector and at diverter switch x x x xOpen circuit, shorted turns, or high resistance connections in the OLTC preventative autotransformer, series autotransformer or series transformer x x x
Contact problems in the DETC x x x
Windings
Short circuits between windings or between turns x x x xStrand-to-strand short-circuits x xOpen circuits in parallel strands x x xShort circuit to ground x x xMechanical deformation x x x xContact problems, open circuits x x
CoreMechanical deformation x2 x2 xFloating core ground x x xShorted core laminates x x
Surge arresters Deterioration and aging x

5
Transformer Parts and Their Possible Faults
Transformer diagnostic set: see pages 6-21
Dielectric response analysis instrument: see pages 22-23
Frequency response analysis instrument: see pages 24-25
Partial discharge analysis system: see pages 26-29
Capa
cita
nce,
dis
sipa
tion
fact
or /
pow
er f
acto
r at
50
Hz
or 6
0 H
zSh
ort
circ
uit
impe
danc
e /
leak
age
reac
tanc
eTr
ansf
orm
er r
atio
Exci
ting
curr
ent
DC
win
ding
res
ista
nce
Pow
er f
acto
r / d
issi
patio
n fa
ctor
Ti
p up
tes
tVa
riabl
e fr
eque
ncy
pow
er f
acto
r /
diss
ipat
ion
fact
orFr
eque
ncy
resp
onse
of s
tray
loss
esD
ynam
ic r
esis
tanc
eW
att-
loss
and
cur
rent
m
easu
rem
ent
Die
lect
ric r
espo
nse
anal
ysis
Freq
uenc
y re
spon
se a
naly
sis
Part
ial d
isch
arge
ana
lysi
sCu
rren
t tr
ansf
orm
er a
naly
sis
Current transformer testing instrument: see CT Analyzer brochure
Part Faults detectable Measurement
Bushings
Partial breakdown between capacitive graded layers, cracks in resin-bonded insulation x x x x
Aging and moisture x x xOpen or compromised measuring tap connection x xPartial discharges in insulation x xLoss of oil in an oil-filled bushing x
Bushing CTsCurrent ratio or phase error considering burden, excessive residual magnetism, non-compliance to relevant IEEE or IEC standard x
Insulation materialsMoisture in solid insulation x1 x1 xAging, moisture, contamination of insulation fluids x x xPartial discharges x x
LeadsContact problems x xMechanical deformation x
OLTC
Contact problems in tap selector and at diverter switch x x x xOpen circuit, shorted turns, or high resistance connections in the OLTC preventative autotransformer, series autotransformer or series transformer x x x
Contact problems in the DETC x x x
Windings
Short circuits between windings or between turns x x x xStrand-to-strand short-circuits x xOpen circuits in parallel strands x x xShort circuit to ground x x xMechanical deformation x x x xContact problems, open circuits x x
CoreMechanical deformation x2 x2 xFloating core ground x x xShorted core laminates x x
Surge arresters Deterioration and aging xNotes:1) Power factor / dissipation factor measurements at 50 Hz or 60 Hz can detect high moisture contents, but have a blind spot for low moisture contents. Measuring power factor / dissipation factor at
lower frequencies, such as 15 Hz, improves sensitivity. The most sensitive method to determine moisture in solid insulation is dielectric response analysis.2) If the core ground can be opened.

6
All in One: the Multi-Functional Transformer Test Set CPC 100 / CP TD1
Leakage reactance/short-circuit impedance measurement instrument
DC winding resistance measurement instrument
winding resistanceI
TR
VRLVRHV
mechanical ?
TR
V
I
Frequency response of stray losses measurement instrument
winding strands
TR
V
I
+ more substation diagnostics
> Ground impedance measurement > Line impedance and ground factor measurement
> Resistance measurement > Primary relay testing
Measurement
V, I, P, Q, S
Cp: 1 pF - 3 µF
dissipation factor / power factor
resistance: 0.5 µW - 20 kW
Output
12 kV
800 AAC
400 ADC
15 - 400 Hz
Precision
output signal digitally generated
Cp measurement: < 0.05 % error
independent from mains quality in wave form and frequency
Weight of units
CPC 100: 29 kg / 65 lbs
CP TD1: 26 kg / 56 lbs

7
All in One: the Multi-Functional Transformer Test Set CPC 100 / CP TD1
IR ICV
I
Insulation
+ more substation diagnostics
> Current transformer testing > Voltage transformer testing
Power factor / dissipation factor measurement instrument
Transformer ratio measurement instrument
Transformer exciting current test instrument
fcore
I
TR
NP/NS
TR
VP VS
High voltage cable
20 m / 65 feet
double screen
insulation supervision
Trolley
to conveniently transport:
CPC 100, CP TD1,
measurement cable, high voltage cable
Weight of units
CPC 100: 29 kg / 65 lbs
CP TD1: 26 kg / 56 lbs
Power supply
110 - 240 V
50 - 60 Hz
16 A

8
Surge arresters Bushings OLTC Leads Insulation materials Windings Core
Capacitance and power factor / dissipation factor (PF / DF) measurements are performed to investigate the condition of bushings as well as the transformer overall insulation. Aging and decomposition of the insulation, or the ingress of water, increase the energy that is turned into heat in the insulation. The level of this dissipation is measured by the PF / DF.
On surge arresters, currents and watt losses of identical units can be compared. Deviations may indicate aging effects, poor contacts or open circuits between elements.
Capacitance values of bushings show if there have been breakdowns between capacitive layers. For resin bonded paper bushings, cracks into which oil has leaked, can also change the value of the capacitance.
A rise in capacitance of more than 10 % is normally considered to be dangerous, since it indicates that a part of the insulation distance is already compromised and the dielectric stress to the remaining insulation is too high.
Preventing bushings from exploding
Increased heat dissipation accelerates the aging of the insulation. If an aged insulation can no longer withstand the electrical stress, bushings explode.
Better understanding of losses
At line frequency, conductive losses can be represented with a parallel equivalent circuit.Polarization losses can be represented by a series equivalent circuit consisting of an ideal capacitor and a resistor.
Increased losses may pass a test at line frequency unnoticed, leaving the tester unaware of an insulation in distress. Measuring the DF / PF over a broad frequency range helps to better understand both types of losses.
Measuring Capacitance & Power Factor / Dissipation Factor
Typical loss shapes in 15 - 400 Hz range
conductive lossespolarization losses
superposition of both effects
equivalent circuits *)
typical loss shapes
Damaged TR after bushing explosion
Capacitive layers in bushings
center conductor
CI
CJ
f f
f

9
Measuring Capacitance & Power Factor / Dissipation Factor
High voltage is applied to the insulation to be tested, i.e. the bushing tip, and a low loss reference capacitor (integrated in CP TD1) is connected in parallel. The currents flowing through the insulation and through the reference capacitor are measured and the time difference between their zero crossings is determined. The loss angle d is then calculated from this time difference. The tangent of this angle is the dissipation factor. The cosine of the angle between voltage and current is the power factor. Results are compared with values given in IEEE C57.10.01 and IEC 60137, and can be compared with a base measurement, another phase, or a sister transformer.
If values deviate more than indicated by the standards, then dielectric response analysis can be performed to check for increased moisture.
Chemical tests can be performed to verify the quality of the insulation fluid (DGA, dielectric breakdown strength, interfacial tension, etc.) Measuring the power factor / dissipation factor of the insulation fluid can also be done with a CPC 100 accessory, the CP TC12 oil test cell.
Damaged TR after bushing explosion How does it work? How can results be confirmed?
Capacitive layers in bushings
CA
center conductor
grounded layer and tap electrode on flange
OIP bushing: PF / DF tip up test
Type RIP OIP RBP
Insu
latio
n
Resi
n im
preg
nate
d pa
per
Oil
im
preg
nate
d pa
per
Resi
n
bond
ed
pape
r
IEC 60137 < 0.70 < 0.70 < 1.50
IEEE C57.10.01 < 0.85 < 0.50 < 2.00
Typical new values
0.3 - 0.4 0.2 - 0.4 0.5 - 0.6
*) at 50 / 60 Hz and 20 °C
Dissipation factor / power factor in % *)
OIP bushing: PF / DF variable frequency test

10
Measuring Capacitance & Power Factor / Dissipation Factor
Power factor / dissipation factor (PF / DF) measurement indicates the condition of the liquid and solid insulation within a transformer.
Power and accuracy
The CPC 100 / CP TD1 can measure capacitance and PF / DF (tan d) in laboratories, test fields and on site.
A powerful test voltage source (12 kV, 100 mA continuous, 300 mA short-term load current) with variable frequency (15 - 400 Hz), combined with high accuracy measuring inputs allows fast, effective and accurate measurements.
Prepared test procedures can guide the user through the testing process and offer a basis for comprehensive reporting.
Modular equipment
The modular equipment (CPC 100: 29 kg / 65 lbs, CP TD1: 26 kg / 56 lbs) can be easily transported thanks to its sturdy cases, which can also be used to place the instruments onto them for working at a comfortable height, as shown on page 12.
For convenient transport or mobile use such as in test fields or in substations/power plants, the instruments can be mounted onto a trolley.
The CPC 100 is used to control the test, i.e.:
> entering the voltage and frequency values where C and cos j / tan d shall be measured
> starting and stopping the test
> supervising the measurement progress and intermediate results
> storing results on flash disk and USB memory stick
The CP TD1 includes
> a high voltage step-up transformer
> a reference capacitor (pressurized gas type)
> the unit to measure and compare currents in amplitude and phase
Power factor / dissipation factor tip up results
Energize HV to measure CH + CHL | CH | CHL, then energize LV to measure CL + CHL | CL | CHL - thanks to internal switching logic with guard
LV
CL
IN A
11
Measuring Capacitance & Power Factor / Dissipation Factor
Your Benefits
> perfect digitally generated sine wave test signal that is independent from power quality and line frequency
> laboratory precision for on-site use: < 0.05 % error for capacitance Cp
> portability (CPC 100: 29 kg / 65 lbs, CP TD1: 26 kg / 56 lbs)
> mobility through the use of a specialized trolley
> ruggedness and ergonomic design: transport cases with wheels bring equipment to appropriate working height (see page 12)
> automatic tests at different voltages
> automatic tests at different frequencies: early detection of insulation stress due to the improved sensitivity provided by measurements made in the range of 15 - 400 Hz
> optional measurement bandwidth reduction to ± 5 Hz and averaging of up to 20 results for precise measurements despite strong electromagnetic interference
> temperature correction according to type of insulation and relevant standard
> internal recalibration of electronic circuits of the CP TD1 with each measurement
> automatic reporting of capacitance Cp, DF (tan d), PF (cos j), power (active, reactive, apparent), impedance (absolute value, phase, inductivity, resistance, Q)
> automatic assessment if reference values for capacitance and power factor / dissipation factor are known
> less wiring effort through two measurement inputs (IN A, IN B) that can be used to measure for example the capacitance of a bushing at the same time as the main insulation
Energize HV to measure CH + CHL | CH | CHL, then energize LV to measure CL + CHL | CL | CHL - thanks to internal switching logic with guard
LV HV
CHL
CH
Power factor / dissipation factor variable frequency results

12
Measuring Ratio & Exciting (No-Load) Current
Ratio measurement with the CPC 100
The CPC 100 measures the transformer ratio by applying a high voltage at the HV winding of one transformer leg. In amplitude and phase, it measures the applied voltage and the voltage at the LV winding, as well as the exciting (no-load) current. The deviation from rated values is displayed as a percentage.
Measuring ratio per tap
The CPC 100 measures ratio and excitation current at each tap position. Each time the user operates the tap changer, the CPC 100 automatically starts a new measurement and measures and displays ratio, phase angle, and for each tap, the deviation from nominal ratio is displayed as a percentage.
For automatically measuring winding resistance and ratio of all phases and all taps, see page 16.
The measurement is performed for assessing possible winding damage, such as turn-to-turn short circuits, comparing the measured ratio and magnetizing currents to specifications, factory measurement results, and/or across phases.
In the factory, this measurement is performed to verify that ratio and the vector group is correct.
Setup for automatically measuring ratio and resistance per tap (see page 16)
Surge arresters Bushings OLTC Leads Insulation materials Windings Core
VP
IP
Principal test setup
TRVP / VS = NP / NS

13
Measuring Ratio & Exciting (No-Load) Current
Setup for automatically measuring ratio and resistance per tap (see page 16)
Your Benefits
> powerful AC voltage source, controllable from 0 to 2000 V
> a perfect digitally generated sine wave test signal that is independent from the quality of the mains wave form
> convenient and quick testing by automatic detection of tap changer operation as trigger for the next tap measurement
> exciting current measurement in amplitude and phase
> variable frequency for measurements outside mains frequency for noise suppression, if selected by the user
> accuracy and safety
> automatic reporting of measured voltage values and phase angles, measured ratio and deviation as a percentage, exciting current in amplitude and phase
> tabular and graphical result representation for every tap
Principal test setup How does it work? How can results be confirmed?
The winding ratio between primary and secondary windings is measured for each transformer leg, applying high voltage at the HV side and measuring on the LV side. The ratio of these voltages, equalling the turns ratio, is calculated. Results are compared with name-plate values and across phases.
The exciting current is the corresponding current flowing in the HV winding if the LV winding is open. Results are compared with a reference measurement, or a measurement performed on a sister transformer; in three phase transformers, the two outer phases can also be compared.
With the turns-ratio test, shorted turns can be detected. If a problem is suspected from a DGA, a dissipation factor test, or a relay trip, a turns-ratio test can be performed to rule out / verify if turns are shorted.
If the exciting current test shows deviations, and DC winding resistance and ratio test do not show errors, then the cause may be a core failure or unsymmetrical residual flux.
CPC 100 TRRatio test card
Exciting current [mA] per tap
TR
VS
VP / VS = NP / NS
Watt losses [W] per tap

14
Winding resistance per tap
Measuring DC Winding Resistance and OLTC
Measuring resistance with the CPC 100
The CPC 100 injects DC current into the winding, measures current and voltage and then calculates and displays the resistance. When the resistance value is stable, the CPC 100 makes the final measurement, and reduces the test current to zero to discharge the energy saved in the winding. When it is safe to remove test leads, the CPC 100 illuminates its green safety light.
Tapped windings and OLTC
In semi-automatic mode, the CPC 100 measures the resistance of each subsequent tap position. Each time the user operates the OLTC, the CPC 100 waits until the values stabilize, and then measures and displays the winding resistance at this tap position. When all taps have been measured, the CPC 100 discharges the inductive energy stored in the winding and indicates when this process is completed. For automatically measuring static and dynamic winding resistance and ratio of all phases and all taps, see page 16.
Dynamic resistance measurement
The OLTC has to switch from one tap position to another without interrupting the load current. When switching the tap changer during winding resistance measurement, the DC current temporarily decreases. This current decrease should be measured and compared across taps, as recommeded in the Cigré Transformer Maintenance Guide 445.
Winding resistance measurements are performed for assessing possible winding damage. It is also used to check the On-Load Tap Changer (OLTC) - to know when to clean or replace OLTC contacts, or to know when to replace or refurbish the OLTC itself, which has a shorter life span than the active part of the transformer.
In the factory, this measurement is performed to calculate the I2R component of conductor losses and to calculate winding temperature at the end of a temperature test.
Table in CPC 100 TRTapCheck test card
Surge arresters Bushings OLTC Leads Insulation materials Windings Core Burn-off at a diverter switch
Switching process

15
Measuring DC Winding Resistance and OLTC
Slope per tap
Ripple per tap
Your Benefits
> convenient and quick testing by using OLTC operation as a trigger for the next tap measurement
> additional condition assessment of the individual OLTC taps through dynamic resistance measurement, recorded as a part of “classical” resistance measurement, without extra effort
> high accuracy and safe testing through the use of a 4-wire connection. The CPC 100 visually indicates when it is safe to remove test leads, even if its power supply is interrupted during testing. If the test leads are removed or interrupted accidentally, the test current will flow through the voltage path, preventing dangerous overvoltages. If the CP SA1 accessory is in use during such an accidental interruption of test leads, damage to the CPC 100 will be prevented.
> automatically created report showing the test duration, the resistance value at measurement and reference temperature, etc.
> tabular and graphical results are produced for every tap for easy visual comparison
How does it work? How can results be confirmed?
To measure the winding resistance, the winding under test must first be loaded with energy (E=1/2*L*I2) until the inductance of the winding is saturated. Then the resistance can be determined by measuring DC current and DC voltage. For tapped windings, this should be done for every tap position, hence testing the OLTC and the winding together. Results should be compared to a reference measurement, across phases, or with a sister transformer. In order to compare measurements, the resistance values have to be re-calculated, to reflect different temperatures during the measurements.
Results should not differ more than 1 % compared to the reference measurement. Differences between phases are usually less than 2 - 3 %.
Transformer turns ratio or frequency response analysis can be used to confirm contact problems. In both cases, hot spots in the transformer will result in a DGA indicating increased heat. However, gas signatures are not unique and thus do not allow for the identification of the root cause.
Burn-off at a diverter switch
Switching process

16
Automatically Measuring Ratio & Winding Resistance of All Taps and All Phases
Using the CP SB1 accessory, the CPC 100 can automatically
> measure ratio and the exciting current of all of the taps and all phases
> confirm the vector group
> measure static and dynamic winding resistance of all of the taps and all phases
This accessory helps to save a lot of time as wiring is only necessary once. With the same cabling, both ratio and resistance measurements can be performed.
Through the CP SB1, the CPC 100 is connected to all phases of a transformer. The up and down command inputs of the OLTC are also connected and controlled by the CPC 100 and the CP SB1.
Ratio measurement
The CPC 100 only requires the user to enter ratio and the vector group to measure the ratio and the exciting current for each tap of each phase automatically. For each tap, results are compared to the specified ratio and the deviations are displayed.
Winding resistance measurement
With the CP SB1, the CPC 100 injects DC current into each tap of each winding. The CPC 100 then waits for the current to stabilize and measures the resistance value, as well as the data describing the switching process (dynamic resistance measurement).
The tap changer is then operated automatically until the measurement on one transformer phase is finished. Between measuring the different phases, the energy stored in the windings is quickly discharged. When the windings are fully discharged, the CPC 100 / CP SB1 automatically switches to the next phase.
At the end of the measurement, the last winding is discharged and the operator is notified visually that it is safe to remove the wiring.
AC, DC, OLTC control
LV
Faster Safer
17
Automatically Measuring Ratio & Winding Resistance of All Taps and All Phases
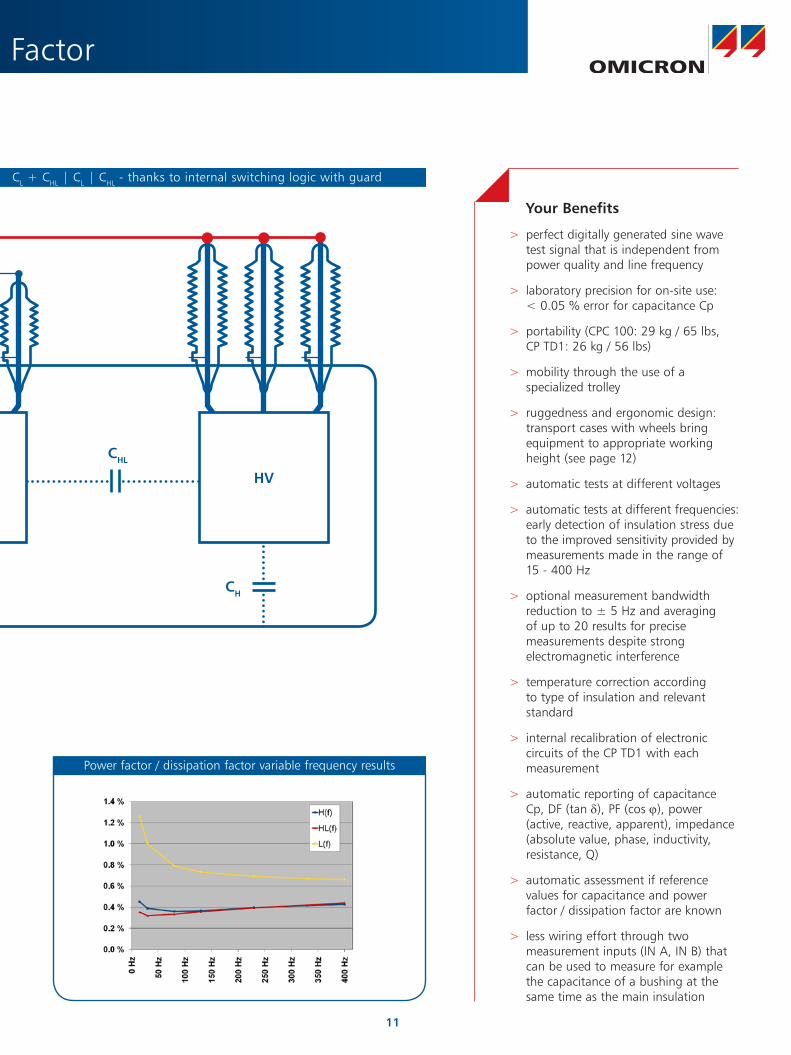
AC, DC, OLTC control
Your Benefits
> several times faster than conventional wiring technique: - minimum wiring - only once for all
connections- automatic discharging of the
windings between measurements- automatic tap changer operation
> increased safety: no repeated climbing up and down the transformer
> simple workflow: a single, automatic measurement for determining ratio and exciting current, as well as static and dynamic winding resistance
> prevention of wiring errors: prior to the measurement, wiring plausibility is automatically checked
> comprehensive automatic reporting for all phases and taps
Measurement with switchbox
Switchbox connected to CPC 100 / CP TD1
OLTC HV

18
Measuring Short Circuit Impedance / Leakage Reactance & Frequency Response of Stray Losses
Numerous incidents exist of asset managers investigating the reason why their transformer is gassing even though all standard electrical tests show acceptable results. This illustrates that their tools do not cover all trouble and failure possibilities.
The Frequency Response of Stray Losses of each phase will be nearly identical if all phases are in good condition. An increase in frequency will result in an increase in impedance as the skin effect becomes more pronounced.
Just like measuring leakage reactance or short circuit impedance at power system frequency, the CPC 100 measures leakage reactance, or short circuit impedance, across a frequency range of 15 - 400 Hz, as defined by the user.
It applies AC voltage to the high voltage winding, with the low voltage winding short-circuited. It then measures the load current in amplitude and phase and calculates the impedance. The measurement is performed for each transformer phase. The user then compares results across phases and / or over time.
The measurement is performed for assessing possible damage/displacement of windings. Measurements are compared over time or by comparing phases.
In case of a short-circuit, forces work towards the core for the inner winding and away from the core for the outer winding. If these forces affect the placement of windings, the leakage flux will change. In particular, short circuits between parallel strands of Continuously Transposed Conductors (CTCs), and local overheating due to excessive eddy current losses linked by the stray flux can be detected.
Measuring frequency response of stray losses
Surge arresters Bushings OLTC Leads Insulation materials Windings Core Regional overheating

19
Measuring Short Circuit Impedance / Leakage Reactance & Frequency Response of Stray Losses
Measuring frequency response of stray losses
Your Benefits
> a perfect digitally generated sine wave test signal that is independent from power quality
> additional diagnostic information through the measurement of the leakage reactance or short circuit impedance at several frequencies
> variable frequency for measurements outside mains frequency for noise suppression, if selected by the user
> accuracy and safety
> automatic reporting of all measured values
> display of result as Z and Φ, R and X, or R and L
> graphical results representation
Regional overheating How does it work? How can results be confirmed?
An AC source is connected to each phase of the HV winding with the corresponding LV winding shorted. The current and the voltage across the HV winding are measured in amplitude and phase, and the short circuit impedance is calculated. Short-circuit impedance measurements should ideally be performed over a range of frequencies, commonly known as Frequency Response of Stray Losses. Here, the AC source features variable frequency. After source current and voltage have been measured across the HV winding, the stray losses are represented by the inductive part of the short circuit impedance at higher frequencies.
Leakage reactance: deviations of more than 1 % ought to be investigated with other tests such as FRA. Differences between phases are usually less than 2 %. Deviations of more than 3 % are considered significant. Frequency response of stray losses (FRSL) results can be cross-checked with PD measurement, FRA, and DGA. If parallel strands are shorted, higher losses in the stray channel will cause high internal temperatures, normally indicated by a DGA. The gas signature is not unique and does not provide the identification of the root cause, however. FRSL is unique in this respect.
HV
Leakage flux
HVLV LV
Leakage flux force direction
FRSL test results with faulty phase C

20
CPC 100 / CP TD1 - Operation According to Individual Needs
Reporting
Performed tests can be saved and are the basis for comprehensive reports.
For customized reporting, all data belonging to the measurement, including settings, results, and administrative information such as date & time, filename, etc. can also be imported to MS Excel. OMICRON provides templates containing typical test procedures for power system apparatus, providing guidance during the measurement and conveniently and quickly producing comprehensive result representations in MS Excel. Test reports can automatically be entered into customer-specific sheets and further content, for example company logos, can be added.
Test preparation on PC
Tests can also be prepared in the office on a PC or laptop - without the CPC 100, with which the test will later be executed at site, step by step.
Manual front panel operation
Operating CPC 100 / CP TD1 manually provides results with minimal training – perfect for users operating the devices occasionally. Operating directly through the device, the user just selects the output to be used, the measurement to be made and performs it by pressing the green button. Users can measure exactly the way they consider best by using the device in this way.
Front panel operation supported by test cards
Dedicated test cards help when performing frequent applications conveniently and efficiently. The cards contain predefined procedures, dedicated to specific applications (for example power factor / dissipation factor, winding resistance and tap changer test, ratio measurement, etc.).
Several test cards can be combined to form an entire test plan for a power system apparatus (e.g. a power transformer), guiding the user through the measurement.
Test cards dedicated to specific tests
Result representation in MS Excel
Directly setting output values
Result representation on PC / laptop

21
CPC 100 / CP TD1 - Operation According to Individual Needs
Primary Test Manager (PTM)
Primary Test Manager (PTM) software supports the users’ workflow during diagnostic testing. The user can define and manage test objects, create test plans, perform measurements, and generate reports. PTM manages the entire workflow during testing, guiding the user through the process step-by-step.
1. Asset management PTM supports the administration of asset data of power transformers: general identifying characteristics like location, manufacturer, production date, serial numbers, etc. can be entered just like electrical data such as number of windings, voltage and power ratings, vector group, etc.
2. Dynamic test plan generation Based on the electrical data of the apparatus (such as vector group or bushing type), PTM generates a plan of diagnostic measurements to be performed in accordance with industry standards, thus saving time
and reducing the risk of errors. The test procedure can easily be adapted by selecting / de-selecting elements.
3. Guidance through testing During the measurement, PTM enables the user to directly control the test instrument from a PC or laptop. Clear connection schemes help the user to make correct connections and to avoid errors. The test progress is visible in the test table throughout the test.
4. Reporting After the tests, reports can be generated at any time for any of the measurements made previously. The report content is flexible and customizable. Customer specific report forms can be generated and other elements can be added, such as company logos.
PC control and application management with PTM
Primary Test Manager main screen
1. Asset management
2. Dynamic test plan generation
3. Guidance through testing
4. Result representation in PTM

22
Dielectric Response Analysis of Power Transformers and Bushings
Displaying the dissipation factor over a wide frequency range provides insight into the specific properties of the oil, the geometry of the solid insulation in the form of spacers and barriers, and the condition of the solid insulation itself. This is the only method that can - non-invasively - directly measure the actual moisture content in the solid insulation.
The method is scientifically approved by CIGRÉ. Aging threshold values as defined in IEC 60422 allow for an automatic insulation condition assessment and corresponding recommendations for further actions such as transformer drying.
OMICRON’s DIRANA can measure dielectric response over an extremely wide frequency range (10 µHz - 5 kHz). It minimizes testing time by combining frequency domain spectroscopy (FDS) at high frequencies and polarization and depolarization current measurement (PDC) at low frequencies. DIRANA also displays the polarization index (PI) based on FDS/PDC measurement. It thus replaces measuring insulation resistance, delivering the same information, but being more accurate for moisture determination. Testing time is further minimized by simulaneously measuring through two channels, and the application of an intelligent curve recognition. Measurements are ended automatically as soon as the typical shape of the curve, including the hump, indicates that all relevant points have been measured.
Dielectric response analysis is used to assess the water content of the solid insulation (cellulose) and thus periodically monitor its condition.
Knowing the water content is important for the condition assessment of transformer bushings and the transformer in its entirety.
In the factory, this measurement is used at the end of production to control the drying procress and to assure low moisture after drying.
Verifying the insulation condition with DIRANA
Surge arresters Bushings OLTC Leads Insulation materials Windings Core Typical shape of dielectric response
Dis
sipa
tion
fact
or
Frequency
Moisture and aging of cellulose
Oil conductivityInsulation Geometry
low
high
low
high
low
high
0,001
0,01
0,1
1
0,001 Hz 1 Hz 1000 Hz

23
limited
comprehensive
comprehensive
Dielectric Response Analysis of Power Transformers and Bushings
Verifying the insulation condition with DIRANA
DIRANA and accessories in sturdy case
Your Benefits
> insulation condition assessment concerning moisture / aging of cellulose and oil conductivity
> automatic result evaluation according to IEC 60422 (dry, moderately wet, wet, extremely wet), indicating if further actions are required
> completely non-invasive measurement
> minimum down-time: a measurement can be performed directly after the transformer has been shut down, as equilibrium is not required
> fast measurement through an intelligent combination of methods FDS and PDC, simultaneous measurement with two input channels and forecast algorithm
> automatic compensation of the influence of conductive aging by-products avoiding overestimation of moisture content
> predefined tests for all transformer types and bushings
> step-by-step software guidance
> also measure the insulation condition of cables, generators, motors and instrument transformers
Typical shape of dielectric response How does it work? How can results be confirmed?
If the dissipation factor of a transformer is plotted against a wide frequency range, the resulting dielectric response curve contains information on the insulation condition.
The very low and the high sections contain information on moisture and aging in the solid insulation, while the position of the slope in the mid range frequencies indicates the conductivity of the liquid insulation.
This curve is compared to model curves to evaluate aging, particularly for assessing the moisture content in the insulation.
There are no other non-invasive ways to assess moisture in a transformer; dielectric response analysis is unique in this respect.
The Karl Fischer titration method can determine moisture content in oil or in paper, but has several disadvantages.
For instance, to determine moisture in paper, the method requires opening the transformer and taking a paper sample. During the process, the insulation itself is being damaged and the sample takes up new moisture.
Dis
sipa
tion
fact
or
Frequency
Moisture and aging of cellulose
Oil conductivityInsulation Geometry
low
high
low
high
low
high
0,001
0,01
0,1
1
0,001 Hz 1 Hz 1000 Hz
~ 6.0 hFDS
~ 2.9 hDIRANA
~ 5.5 hPDC
durationf range

24
Sweep Frequency Response Analysis
Frequency response analysis (FRA) is based on the comparison of a reference test with an actual test, where the reference test is usually a fingerprint that has been previously measured. When such a fingerprint is not available, another phase or a sister transformer can also be used for comparison.
For on site use, FRAnalyzer comes in a rugged case which all necessary accessories fit into, including a battery with sufficient power to complete the comprehensive testing of any transformer.
FRAnalyzer uses braids for its connections which allow a high level of reproducibility due to their tight connection close to the bushing using clamps and screws.
This technique is recommended in the CIGRÉ brochure 342 on FRA:
> connection close to the bushing
> broad braids minimize test setup interference
Frequency response analysis (FRA) is used to verify the electrical and mechanical integrity of the active part of the transformer (core, leads, windings). FRA is also ideal for further diagnosis, if periodic testing or monitoring identifies irregularities.
A growing number of utilities also use FRA during routine testing, since the method can detect a wide range of faults while being completely non-invasive.
FRA is the most sensitive method for detecting mechanical deformations.
Test lead connection on transformer bushing using broad braids, clamps and screws
clamp connection
Oü
Surge arresters Bushings OLTC Leads Insulation materials Windings Core Elements forming a unique fingerprint
for large bushings, the influence of the measurement setup can be reduced
even more by using two braidsO

25
Sweep Frequency Response Analysis
Test lead connection on transformer bushing using broad braids, clamps and screws
Your Benefits
> non-invasive detection of:- winding deformations- shorted parallel strands- winding or interturn short circuits- winding shorted to ground- shorted core laminates- floating core ground- open circuits- contact resistance problems
> excellent reproducibilty through innovative connection technique
> powerful and easy-to-use software:- database solution- import of FRA traces from other
vendors (Doble, FRAMIT, FRAX, etc.)- export traces in CIGRE exchange (.xfra)
or .csv format- data export to MS Excel or database
applications- automatic assessment through
proven algorithm
> automatic reporting
> high accuracy and wide dynamic range
> small and lightweight device
> support is available from OMICRON for the interpretation of results
Elements forming a unique fingerprint How does it work? How can results be confirmed?
A low voltage sinusoidal signal with variable frequency is applied to one terminal of a winding and at the other end of the winding the response signal is measured. The voltage transfer function of the winding is determined as the output / input ratio.
The transfer function of a winding depends on the resistive, inductive and capacitive elements of the transformer. Changes in these elements as a consequence of a failure lead to changes in the transfer function. Results are represented in magnitude and phase as in a Bode diagram.
Frequency response analysis can detect a wide range of faults. Some of these faults can be confirmed by other measurements, such as DC winding resistance, frequency response of stray losses, short-circuit impedance / leakage reactance, exciting current, or ratio measurement.
However, no other method can give as clear an indication as frequency response analysis can to determine whether windings have been deformed, for example by the mechanical forces resulting from a fault.
Automatic comparison / evaluation of results
Small and lightweight FRAnalyzer

26
Partial Discharge Analysis
The OMICRON MPD PD system offers quick and precise recording of pulses on the three phases of a transformer using data acquisition from three or more channels.
Digital filter
In the MPD 600 the classical analog bandpass filter has been replaced by a digital filter using a mathematical algorithm. Digital system design eliminates aging effects and temperature drift making measurements comparable and reproducible by perfectly reproducing settings:
> the digital filter can be easily adapted to the conditions on site by tuning its center frequency and bandwith to minimize disturbances with fixed frequency bands
> calibration values for charge and voltage can be set directly on the laptop controlling the test, fully reproducible during the next measurement
Optical Isolation
Between individual PD acquisition units and between the acquisition units and the PC / laptop, fiber-optics are used for the communication. Communication with fiber-optics ensures a continuous, disturbance-free transmission of PD events and test voltage. The units are supplied using a battery power supply. This design provides complete galvanic isolation between the individual components, minimizing ground loops and so reducing interference.
Once initiated, partial discharge (PD) causes a progressive breakdown of insulating materials by electrical tree formation.
PD measurements are performed on the insulation of transformers to determine the insulation’s condition and to safely prevent it from breaking down.
PD measurement is also part of the factory acceptance test.
PD analysis on a three phase transformer
C2’C3’
C2’
C1’
void
conductor
conductor
Surge arresters Bushings OLTC Leads Insulation materials Windings Core Partial discharge measurement

27
Partial Discharge Analysis
PD analysis on a three phase transformer
Partial discharge measurement How does it work? How can results be confirmed?
A coupling capacitor is connected in parallel to the capacitances of the measured insulation distance. Any charge movements within the connected insulation distance will be reflected in the charge of the coupling capacitor. The resulting circulating current of the paralleled capacitances is measured and interpreted.
Analyzing PD means detecting and evaluating very small discharges, while dealing with very high test voltages, often complicated by external disturbances.
A chemical dissolved gas analysis (DGA) can also indicate partial discharges. It is impossible, however, to locate partial discharges with DGA.
Battery powered acquisition units
The acquisition units are supplied from rechargeable batteries, which can supply the units for more than 20 hours. Another advantage of battery power supply is that it eliminates disturbances which would result from a mains power supply.
Noise suppression through gating
Additionally, noise can be eliminated by amplitude / phase gating, dynamic noise gating or antenna gating. Here, one measurement channel, which is not connected to the equipment under test, is used as a detector for external disturbances. Any pulse picked up by this unit is considered to be an external disturbance and is therefore eliminated on all other units because internal PD cannot be detected by this antenna channel due to the shielding effect of tank and graded bushings.
Multi-channel measurement
Measuring simultaneously with several channels with synchronization accuracy in the range of nanoseconds has several advantages:
> it minimizes the time for which high voltage has to be applied to a suspect transformer and speeds up testing
> it allows for real-time de-noising of the data to minimize the influence of disturbances, and helps separating different sources of PD and identifying the type of PD sources
PD acquisition unit
Signals acquired simultaneously by 3 units
C3’
insulation
Ccoupling

28
Partial Discharge Analysis
“Tuning to” partial discharges (PD)
When you are listening to the radio, the audio filter of your receiver filters out all other radio stations, and only plays the one that you are listening to. The MPD can use two methods for “tuning to” PD sources to display only what you want to take a closer look on.
3-Phase Amplitude Relation Diagram
Through cross-coupling, a PD pulse on one phase in a transformer will usually appear on all phases - with different amplitudes. Noise, however, is external and thus produces amplitudes that are similar on all phases.
By synchronously measuring on all phases the tester can separate pulses by plotting them in the 3-Phase Amplitude Relation Diagram (3PARD).
Noise will create a separate cluster in this diagram, usually in the center of the 3PARD. PD, however, the pulses of which are often smaller than those of noise, typically form a cluster outside the center. If more than one PD source exists, each of them will form a separate cluster.
When a cluster is selected, the phase-resolved PD pattern will be shown specifically for this cluster, facilitating pattern recognition, i.e. determining the possible cause of a single PD source.
3-Center Frequency Relation Diagram
Another way to separate pulses is 3-Center Frequency Relation, which requires only one measurement channel, for example when the test object is a single phase transformer.
This method measures with three filters at different measurement frequencies at the same time. Using spectral differences, distinct internal pulses can be separated from each other and PD can be discriminated from external noise.
The result of the three measurements is plotted in the 3-Center Frequency Relation Diagram (3CFRD). The unfolding clusters in this diagram can then be analyzed separately.
Advantages of 3PARD and 3CFRD > allows the separation of PD activity from noise
> enables the separation of different PD sources
> facilitates pattern recognition
Separated partial discharge Separated noise
pd cluster
Measurements related to each other in 3PARD or 3CFRD
29
Partial Discharge Analysis
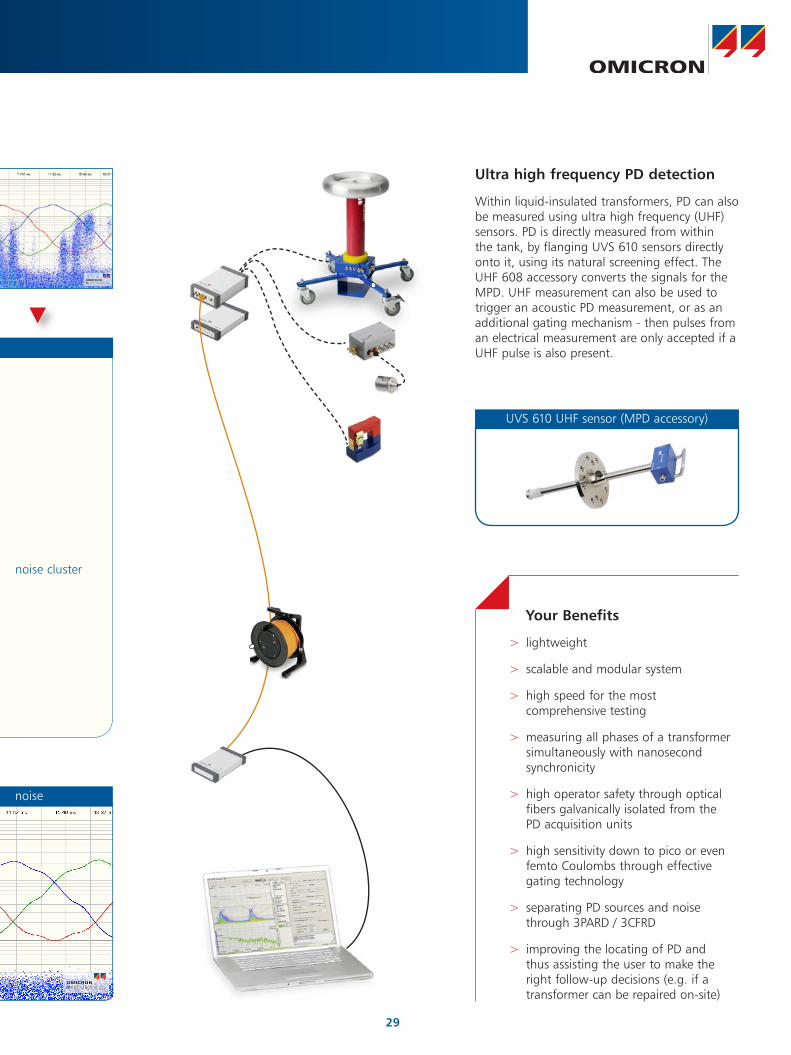
Your Benefits
> lightweight
> scalable and modular system
> high speed for the most comprehensive testing
> measuring all phases of a transformer simultaneously with nanosecond synchronicity
> high operator safety through optical fibers galvanically isolated from the PD acquisition units
> high sensitivity down to pico or even femto Coulombs through effective gating technology
> separating PD sources and noise through 3PARD / 3CFRD
> improving the locating of PD and thus assisting the user to make the right follow-up decisions (e.g. if a transformer can be repaired on-site)
Separated noise
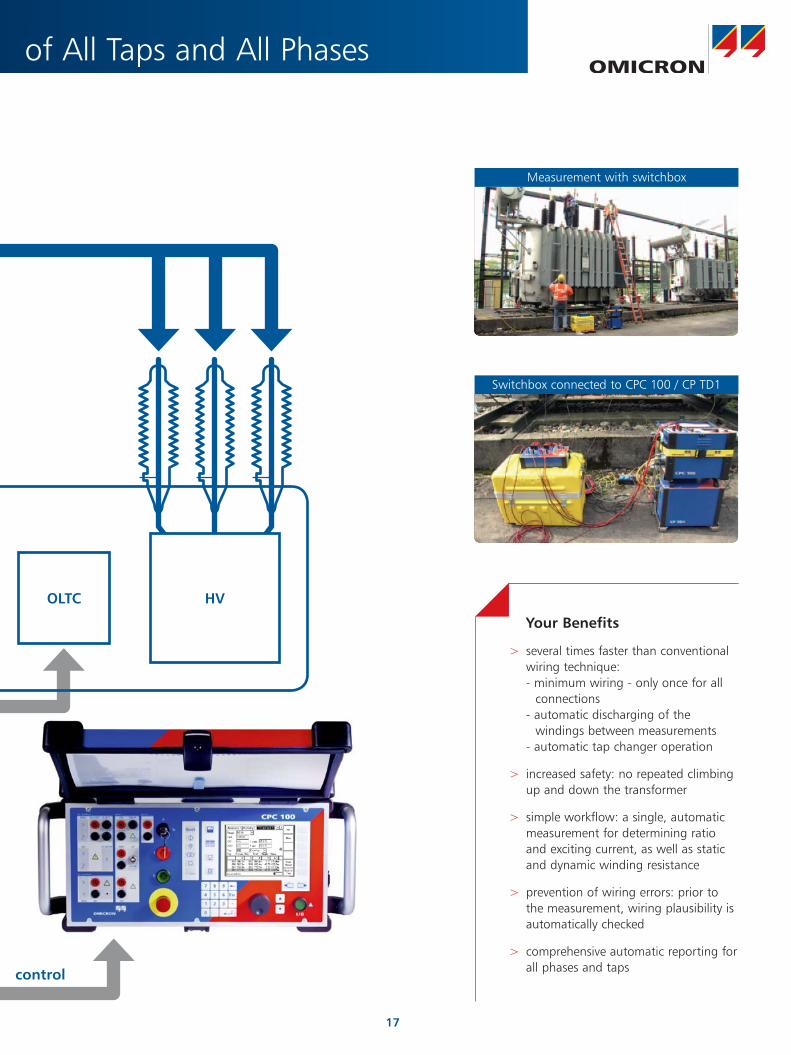
Ultra high frequency PD detection
Within liquid-insulated transformers, PD can also be measured using ultra high frequency (UHF) sensors. PD is directly measured from within the tank, by flanging UVS 610 sensors directly onto it, using its natural screening effect. The UHF 608 accessory converts the signals for the MPD. UHF measurement can also be used to trigger an acoustic PD measurement, or as an additional gating mechanism - then pulses from an electrical measurement are only accepted if a UHF pulse is also present.
UVS 610 UHF sensor (MPD accessory)
noise cluster
Measurements related to each other in 3PARD or 3CFRD

30
Power Transformer Services, Training and Support
Expertise in transformer diagnostics
OMICRON employs some of the world’s most renowned experts in transformer diagnosis.
Among them are members of working groups concerned with transformer maintenance and diagnosis in international standardization bodies, such as CIGRÉ, the IEEE, or the IEC.
They have performed numerous diagnostic measurements on power transformers, often as a result of customer requests.
Moreover, they have published many papers on power transformer diagnosis, which are available in the customer area on the OMICRON website, together with dedicated expert forums, moderated by OMICRON.
Result assessment support
OMICRON experts support customers in interpreting and assessing results - such as partial discharge patterns, or FRA fingerprints.
Technical support
High quality technical support teams also provide answers to questions on the use of the equipment, and are the first point of contact should a functional problem occur. If a repair is necessary, repair times are short - typically in the range of less than one or two weeks.
Dedicated events
OMICRON hosts the regular Diagnostic Measurements on Power Transformers Workshop. There, typically over a hundred delegates from all over the world share and discuss case studies and recent developments in transformer diagnosis.
Themes include best practice experiences and solutions in transformer testing presented by customers and new technological developments reported by OMICRON. Informal get togethers aid peer exchange.
Several smaller events on related subjects targeted on the particularities of specific geographical regions are also offered throughout the year.
Demonstration booth at dedicated event
OMICRON experts evaluating a customer’s results

31
Power Transformer Services, Training and Support
Demonstration booth at dedicated event
OMICRON experts evaluating a customer’s results Training courses
OMICRON training courses provide a solid theoretical and practical background and answer a client’s individual questions. Training courses are held at either the customer’s site, online through a webinar, or in one of the OMICRON training centers wordwide.
Power transformer training topics > Design, testing and maintenance
> Chemical diagnostic methods
> Diagnostic measurements and residual life assessment
> Condition assessment of HV bushings
> Moisture determination and dielectric diagnostics
> Frequency response analysis and interpretation
> Partial discharge measurement
> Training courses using OMICRON technology
Your Benefits
> assistance in interpretation and assessment of results
> access to relevant training modules
> dedicated conventions/conferences
> technical assistance in equipment usage from our technical support teams
> access to scientific papers on transformer diagnosis through the customer area on our website
Customer theoretical training
Customer practical training

OMICRON is an international company serving the electrical power industry with innovative testing and diagnostic solutions. The application of OMICRON products allows users to assess the condition of the primary and secondary equipment on their systems with complete confidence. Services offered in the area of consulting, commissioning, testing, diagnosis, and training make the product range complete.
Customers in more than 140 countries rely on the company’s ability to supply leading edge technology of excellent quality. Broad application knowledge and extraordinary customer support provided by offices in North America, Europe, South and East Asia, Australia, and the Middle East, together with a worldwide network of distributors and representatives, make the company a market leader in its sector.
The following publications provide further information on the solutions described in this brochure:
For a complete list of available literature please visit our website.
AmericasOMICRON electronics Corp. USA12 Greenway Plaza, Suite 1510Houston, TX 77046, USAPhone: +1 713 830-4660 +1 800-OMICRONFax: +1 713 [email protected]
Asia-PacificOMICRON electronics Asia LimitedSuite 2006, 20/F, Tower 2The Gateway, Harbour CityKowloon, Hong Kong S.A.R.Phone: +852 3767 5500Fax: +852 3767 [email protected]
Europe, Middle East, AfricaOMICRON electronics GmbHOberes Ried 16833 Klaus, AustriaPhone: +43 5523 507-0Fax: +43 5523 [email protected]
© OMICRON L228, January 2012Subject to change without notice www.omicron.at • www.omicronusa.com