Embed Size (px)
Citation preview

Diagnostic techniques for atmospheric streamer discharges
Y.L.M. Creyghton E.M. van Veldhuizen W.R. Rutgers
Indexing terms: Gas discharges, Corona measurements
Abstract: Fast electrical and optical diagnostics are required for the analysis of atmospheric streamer discharges. This is illustrated for the case of positive streamer corona produced along wire electrodes by high voltage pulses with rise times of tens of nanoseconds. Electrical measurements with a high time resolution reveal the energy input in two discharge phases (primary and secondary streamer). The discharge structure is visualised using a gated image intensifier. The number of streamers per unit length of anode wire and the streamer diameter are determined. The streamer velocity is measured with a time-of-flight method using two optical fibres. Time-resolved spectro- scopic measurements of the intensity ratio of N: and N, emission lines reveal that the average elec- tron energy in the primary streamer phase is sig- nificantly higher than in the subsequent secondary streamer. The neutral gas temperature in the dis- charge is determined from the rotational structure of an N, emission line and is only slightly above the background gas temperature. Schlieren pho- tographs visualise the heat dissipated in residual streamer channels.
1 Introduction
Streamer corona discharges in molecular gases at atmo- spheric pressure produced by submicrosecond high voltage pulses have recently gained increasing interest. This is due to several promising applications [l], e.g. oxi- dation of NO, and SO, [Z]. ozone production [3], disso- ciation of chemicals [4] and generation of aerosols [SI.
Externally applied high voltage pulses offer the possi- bility to optimise the streamer-induced processes by inde- pendent control of pulse parameters, i.e. polarity, peak voltage, DC-bias, rise time, pulse duration, and repetition rate. Applications still have to be optimised with respect to the yield of removed or produced products. Also, energy consumption must be reduced to the lowest pos- sible level. This requires the possibility to perform a con- sistent set of measurements under well defined conditions with adequate parameter variation.
The streamer discharge is a transient state with a fast propagating, concentrated positive space charge causing
8 IEE, 1994 Paper 1017A ( S 3 ) , first received 7th May 1993 The authors are with the Faculty of Electrical Engineering, Eindhoven University of Technology (EUT), PO Box 513. 5600 MB Eindhoven, The Netherlands
I E E Proc.-Sri. Meas. Technol.. Vol. 141. No. 2, March 1994
a high electric field in front of the streamer head and a moderate electric field in the streamer channel. After arrival at the cathode the primary streamer is followed by a secondary phase, which is seen as a partial reillumina- tion of the otherwise dark streamer channel. The con- cepts of streamers result from both experiments and theories [SI. Significant progress in numerical modelling of streamer propagation [7-91 is another reason for experimental research in this field. The distance between model and application is still too large to predict results from theory or to optimise the yield in a practical situ- ation.
In experimental research on the subject of streamers performed in the past, DC-powered self-repetitive streamer coronas in point-plate configurations were mainly used [lo, 113. In applications large gas flows are generally used and therefore wire-plate and wire-cylinder configurations are preferred.
At the EUT experimental facilities have been realised in recent years for optimisation of the NO, NO, and SO, removal process. Diagnostics were applied with the inten- tion to bridge the gap between theory and application. Several diagnostics are discussed below.
2 Experimental arrangements and data
Most of the diagnostics are applied to a discharge pro- duced in dry air with a wire-plate corona configuration as shown in Fig. 1.
Another shape that has been used is the wire-cylinder geometry. The electrical circuit that is used to produce high voltage pulses has been described previously [12].
acquisition
_ -
I cathode ] m- EZl- 34 current measurement
Fig. 1 Experimental set-up with wire-plate corona configuration used for measurements of uoltage, current, streamer velocity, and for measure- ments with intensifier-CCD system
141

Pulse peak voltage, rise time, duration and repetition rate and DC bias can be varied independently.
Electrical signals are measured using an oscilloscope (Tektronix DSA 601) which has an analogue bandwidth of 300 MHz and an overall effective resolution of 6.5 bit (i.e. 1 % of full scale) at 2 ns sample time. Weak spectro- scopic signals are measured with a photon counting tech- nique using a multi-channel analyser (LeCroy 3001) with 20 ns time resolution. The data from oscilloscope and multi-channel analyser are transmitted in real time through an IEEE interface to a PC.
3 Diagnostic techniques
3.1 Voltage and current measurement The shape of steep HV pulses can be measured with a standard capacitive-resistive divider (Tektronix, model P6015). Rise times not shorter than 1011s are correctly measured, provided that the divider is carefully cali- brated. With sub-microsecond pulses and appropriate control of the field stress at the probe tip it is possible to use the divider up to voltages of 100 kV. For the mea- surement of discharge current pulses the Rogowski coil is a suitable option. The minimum usable rise time decreases with the size of the coil, or rather with its inductance. One of the smallest coils commercially avail- able (Pearson 2877) has a rise time of 2ns. The total current in the pulse forming circuit is measured at the anode. To obtain the real discharge current a capacitive component, C dV/dt , is subtracted from the total current. The capacitance C is determined from the charge-to-voltage ratio measured with voltage pulses below corona onset, i.e. when the current is only capac- itive. With steep pulses the differences in the bandwidths of voltage and current probes cause an error in the calcu- lation of energy dissipation. This problem can be avoided by reducing the bandwidth of voltage and current mea- surements to the same value, for example by limiting the bandwidth of the oscilloscope.
The large rate of rise of the current in the pulse- forming circuit (up to 20 A/ns in practical situations) causes electromagnetic radiation which will interfere with measuring cables and with surrounding electronic equipment if no appropriate shielding is present. To satisfy EMC regulations and to perform accurate mea- surements, a hermetically closed metal Faraday cage sur- rounding the pulse forming circuit is unavoidable. The cylinder of a wire-cylinder configuration can be part of the metal shielding, provided that current loops remain inside the closed shielding structure. Cables leaving the shielding cage cause specific problems which are some- times difficult to solve. Electromagnetic radiation picked up inside the cage can be overcome by surrounding the cables with metal tubes. The tubes are virtually exten- sions of the metal shielding cage. Cables that are directly connected to the electrical circuit transmit potential waves. This problem is solved for the main power line with an appropriate filter. It cannot be completely solved for the voltage divider. Therefore, in the case of sensitive measurements, such as for example photon counting, the voltage divider is disconnected.
A current probe is made to determine the current induced by an individual streamer when it reaches the cathode. This kind of current probe was first applied in point-plate coronas by Marode [lo] and later also in dielectric barrier discharges [13]. It consists of a central metal pin of 1 mm in diameter and a surrounding ring with an outer diameter of 4 mm. They are insulated from
142
each other and from the surrounding plate with a thin plastic sheath. The probe, integrated in the flat polished cathode, does not alter the field distribution. A measured signal from the central pin indicates that the streamer hits the probe in its centre. In that case the whole streamer current is collected by the pin plus the sur- rounding ring because other streamers are at a distance of at least a few millimetres, which is known from image intensifier pictures.
3.2 Measurements with image intensifier and CCD camera
The streamers produced in pulsed corona with high over- voltage have a higher emission intensity than the streamers in DC-powered corona, where the voltage must remain below the static breakdown voltage. Therefore, still photographs of pulsed corona discharges can be readily made with a film sensitivity of around loo00 ASA. These photos, however, have no time resolution and it is very difficult to obtain quantitative information about intensity and about details such as the streamer diameter. These problems can be overcome largely with a gated image intensifier combined with a charge coupled device (CCD) camera. The intensifier greatly enhances the sensitivity up to a level close to that of photomulti- pliers and it allows a time resolution of 30 ns. The inten- sifier is sensitive in the range 180-600nm where the strongest emission lines are situated. A single quartz lens is used to make an image of the discharge on the image intensifier. A small aperture is used to improve the depth of field and to reduce optical aberration. With a camera lens an image of the phosphor plate of the intensifier is made on the CCD. The CCD (EG&G 1430-P) is equipped with a 14 bit digitiser, which offers a high dynamic range and the possibility for quantitative deter- minations.
3.3 Streamer velocity determination One of the most direct and simple measurements that can be used to validate the results of numerical streamer models is the measurement of streamer velocity. The velocity of a single streamer can be determined from streak camera pictures which have one spatial and one time-dependent co-ordinate. However, this method is not adequate when a number of streamers is formed simulta- neously along a wire-electrode.
The streamer velocity is determined from the time delay between two optical signals measured with two quartz fibres. The fibres are contained in thin tubes which strongly limit the angle of light rays (0.05 rad) that may reach the fibres. The distance between the central axis of the fibres is 4mm in the direction of propagation. The light signals are detected with photomultipliers (Hamamatsu, model R666) with 2 ns rise time. The amplitude of the photomultiplier output signals, mea- sured with the oscilloscope, varies statistically and decreases with the distance from the anode. To avoid the influence of signal amplitude, the time delays are mea- sured at a signal level which is 20% of the smallest ampli- tude. At this level the signal rate of rise is determined by the photomultiplier only.
The delay times are stored in real time to the memory of the computer. Displayed in a histogram the delay times show a symmetrical distribution with a standard deviation of up to 20%. This deviation is mainly due to the stochastic variation of streamer velocities. The average streamer velocity is determined from lo00 mea- surements at 20 Hz repetition rate of the discharge.
IEE Proc.-Sci. Meas. Technol., Vol. 141, No. 2, March 1994

3.4 Emission spectroscopy The emission spectrum of positive streamer corona in air has been investigated in detail by Hartmann [ll]. Emis- sion lines of the second positive system (SPS) of N, and the first negative system (FNS) of N l account for more than 99% of the total emission intensity. Hartmann used the relative intensities of the SPS to determine transition probabilities that appeared to be in very good agreement with those determined by other methods [14]. This fact can be taken as proof of direct excitation of the C3n,- level of N,. It is reasonable to assume that the B2Z:- level of N$ is also populated by direct excitation. The excitation is followed by a rapid decay (in less than 0.5 ns) governed by molecular quenching effects [lS, 161. The absence of lines of the first positive system in the spectrum of primary streamers and the low ionisation degree (< 10-~4) indicate that self-absorption can be ignored [ 1 I].
In the streamer head region the characteristic electron energy as well as the emitted light intensity are strongly peaked functions in space. Therefore, it is assumed that the peak value of the emitted light is proportional to the highest value of the characteristic energy within the streamer head. Under the reasonable assumptions that mainly direct excitation occurs and that de-excitation is caused mainly by collisional quenching and radiation, the (maximum) characteristic electron energy can be calcu- lated from the measured ratio of N; and N, lines. The calculation uses experimental data for cross-sections and molecular quenching coefficients and assumes a Maxwel- lian electron energy distribution function. The above mentioned assumptions and the uncertainty in experi- mental data [17] affect the accuracy of the method. However, in any case the N l / N , emission ratio is pro- portional to the average electron energy and it i s there- fore interesting to measure changes of this ratio as a function of pulse parameters and as a function of time and space.
The rotational temperature of the nitrogen molecule is measured to determine the gas temperature during the discharge. The exchange of translational and rotational energy is a fast process which causes a normal Boltzmann distribution among the rotational levels at a similar tem- perature to that of the neutral gas [18]. Nitrogen mol- ecules are excited by electrons without altering the angular momentum. Hence, the rotational distribution remains unchanged when the molecule is electronically excited and therefore the rotational structure of an emis- sion line can be used for the neutral temperature determi- nation.
Another application of emission spectroscopy is to demonstrate the presence of molecular species which are produced in the discharge. The production of OH, CO and NO, by dissociation of H,O, CO,, N, and 0, , can be. investigated qualitatively as a function of pulse param- eters.
For spectroscopic measurements optical emission is collected using a quartz lens (Fig. 2). The light of a cylin- drical volume, directed along the corona wire and with a diameter of lOmm, is focused on a quartz fibre. The spectral decomposition is achieved with a monochro- mator (Jarrel Ash, 0.5 m, dispersion 16 Ajmm).
3.5 Absorption spectroscopy Many chemical species that are created by the discharge cannot be determined outside the reactor due to their high reactivity levels and correspondingly short lifetimes. Absorption spectroscopy is a powerful tool to measure in
I E E Proc.-Sci. Meas. Technol., Vol. 141, No. 2, March 1994
situ the production and decay of chemically active rad- icals. Because of the important role of the OH radical in the chemistry of flue gas cleaning a relation between absorbed signal and absolute OH-radical density was
lens-fibre sysiem
Fig, 2 emission and absorption spectroscopy
Wire-cylinder corona reactor with optical arrangement for
derived previously [19]. However, the concentration of OH radicals appeared to be below the experimental detection limit. Another oxidising molecule which is easily accessed by means of absorption spectroscopy is ozone. Owing to its broad absorption spectrum [20], with a maximum at 250 nm, the interpretation is straight- forward and has been applied often. A high pressure, mercury flash lamp can serve as a light source, and this light can be transferred to the reactor with a similar lens- fibre system to the one used for emission spectroscopy.
3.6 Schlieren photography A standard Schlieren method is used to visualise regions that are warmed up by streamers [12]. A parallel beam of light passes the medium of investigation, i.e. the dis- charge gap between wire and plate. The beam is focused on a knife edge via a parabolic mirror. This mirror has a double function because it also forms an image of the discharge region on photographic film. In the absence of the discharge 50% of the light intensity is allowed to pass the knife edge barrier and forms an uniform grey image. Density gradients in the discharge region, with a com- ponent perpendicular to the knife edge, cause small deflection angles that are recorded as bright and dark regions on the Schlieren picture. The sensitivity of the optical arrangement is optimised so that minimum deflection angles of rad can be recorded. Using a triggered flash lamp as an external light source, a time resolution of 5 p is obtained.
3.7 Gas analysis Gas composition is an important aspect of a flue gas cleaning experiment. The concentrations of the minor species NO, NO, and SO, (generally less than 1000 ppm) must be determined accurately. The major species N,, O,, H,O and CO, influence the discharge and chem- istry. Mass spectrometry is not an adequate method because the masses of minor components coincide with the masses of isotopes of major components. A complete analysis of all components with commercially available instruments based on the principles of gas chromatog- raphy, chemiluminescence, fluorescence, infra-red or ultraviolet spectroscopy may lead to prohibitively high costs.
A simple solution at low cost is offered by electro- chemical sensors which are specifically designed for each gas to be detected. Electrochemical cells use porous cata- lytic electrodes in which the gas component to be analysed reacts with a liquid electrolyte. The concentra- tion can be derived from the current through the electro-
143

lyte [21]. Sensors for the gases of interest 0, , NO, NO,, SO, and CO are available in a portable configuration that is used for gas detection in industrial installations. High accuracy may be obtained when the internal micro- processor of the instrument accounts for the cross sensi- tivity of sensors. If the analyser is well calibrated NO, NO2 and SO, in flue gas are measured with an error that remains within 5% of the concentration at full scale.
4 Results
It is beyond the scope of this article to present detailed results of parameter variations. Only one or two exam- ples per subject will be shown. All results have been obtained in dry air and only the value of the peak voltage (Vp), which is the main pulse parameter, is given for each example. More data are available from already published work [12] or from one of the authors.
Fig. 3 shows examples of single (non-averaged) voltage and simultaneously measured current pulses. In the case of Fig. 3a the capacitive and discharge currents are seen as two separate peaks. A slight increase in the discharge current coincides in time with the occurrence of second- ary streamers, which are also clearly observed from light emission (see below). Fig. 3b shows a voltage pulse which is short enough to avoid energy dissipation during the secondary streamer phase. The average streamer transit time in this case is 20 ns. The pulse is superimposed on a DC-bias which is just below the DC-corona onset voltage.
In Fig. 4 an example of a cathode current probe signal is displayed. Four different phases in time can be distin- guished in the current signal:
(i) the current induced by a streamer when approach- ing the probe
(ii) a sharp rise of current that occurs when the posi- tively charged streamer head makes contact with the probe
(iii) the current during the propagation of the second- ary streamer
(iv) a resistive current that decays with the same slope as the total current measured.
Two examples of pictures obtained with the image inten- sifier are given in Figs. 5 and 6. For Fig. 5 the image of
0'5[
time.ns
Streamer induced cathode current probe signal (V, = 40 k V ) Fig, 4
the discharge was demagnified by a factor 5 and a rela- tively long gate time (2 p s ) has been used. Primary streamers crossing the entire gap are observed. Secondary streamers are seen as partial reilluminations near the anode of the otherwise dark channels left by the primary streamers. The streamer number density is - 7 cm-I. In
0 - 50 0 50 I00 150 200
200
100
0
-50 0 50 100 150 200 -50 0 50 I00 150 200 tirne,ns t ( m e , ns
U b
Fig. 3 n long tailed voltage pulse
144
Wuwforms ofvoltuge and cuwent pulses h short pulse (wire-cylinder configuration, wire-diameter = 0.6 mm, wire-length = 450 mm. gap distance = 35 mm)
I E E Proc.-Sri. Meas. Terhnol., Vol. 141. No. 2, March 1994
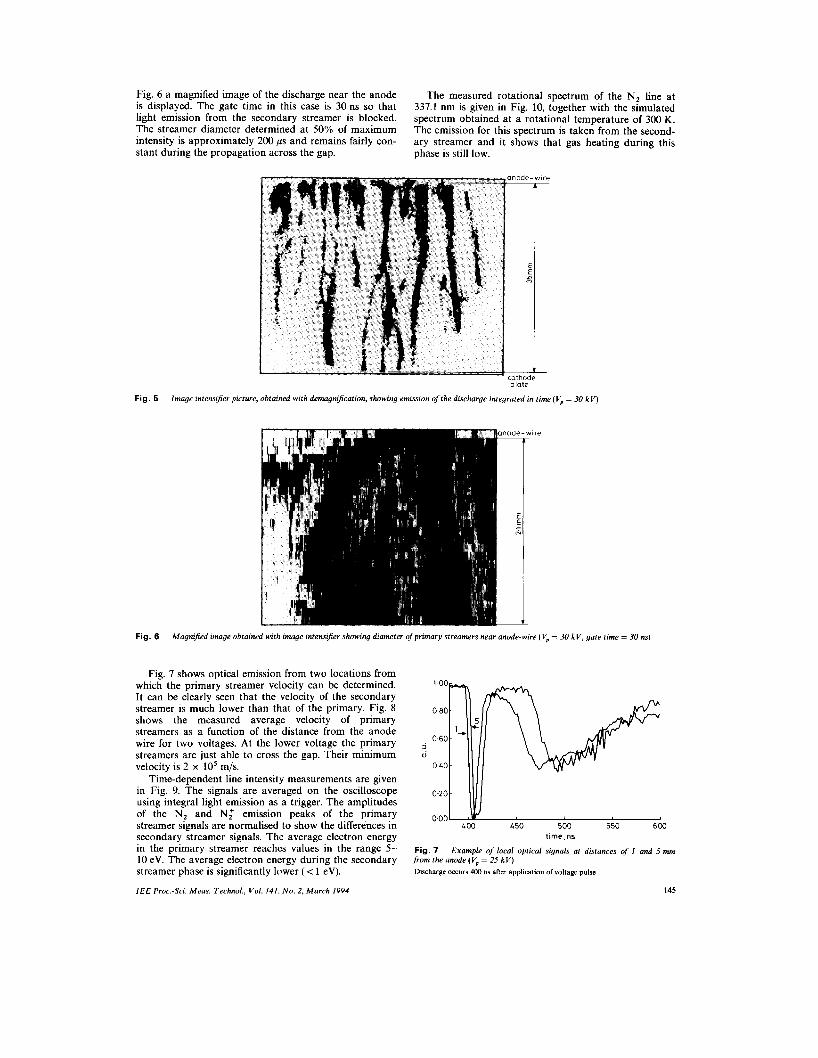
Fig. 6 a magnified image of the discharge near the anode is displayed. The gate time in this case is 3 0 ns so that light emission from the secondary streamer is blocked. The streamer diameter determined at 50% of maximum intensity is approximately 200 p and remains fairly con- stant during the propagation across the gap.
The measured rotational spectrum of the N, line at 337.1 nm is given in Fig. 10, together with the simulated spectrum obtained at a rotational temperature of 300 K. The emission for this spectrum is taken from the second- ary streamer and it shows that gas heating during this phase is still low.
Fig. 5 Image intensifier picture, obtained with demagnification, showing emission of the discharge integrated in time (V, = 30 k V )
ode -
E
wire r
Fig. 6 Magnified image obtained with image intensifier showing diameter of primary streamers near anode-wire (V, = 30 k V , gate time = 30 M)
Fig. 7 shows optical emission from two locations from which the primary streamer velocity can be determined. It can be clearly seen that the velocity of the secondary streamer is much lower than that of the primary. Fig. 8 shows the measured average velocity of primary streamers as a function of the distance from the anode wire for two voltages. At the lower voltage the primary streamers are just able to cross the gap. Their minimum velocity is 2 x io5 mjs.
Time-dependent line intensity measurements are given in Fig. 9. The signals are averaged on the oscilloscope using integral light emission as a trigger. The amplitudes of the N, and N: emission peaks of the primary streamer signals are normalised to show the differences in secondary streamer signals. The average electron energy in the primary streamer reachcs values in the range 5- 10 eV. The average electron energy during the secondary streamer phase is significantly lower (< 1 eV).
IEE Proc.-Sci. Meas. Technol., Vol. 141. N o . 2, March 1994
time,ns
Example of local optical signals at distances of I and 5 mm Fig. 7 /?om the anode ( V, = 25 k V ) Discharge occurs 400 ns after application of voltage pulse
145

Heat transfer from vibrationally excited states to the neutral gas is visualised on Schlieren photographs. An example of such a picture, taken 1 O O p after the dis- charge, is given in Fig. 11 . The highest energy dissipation occurs in the region of the secondary streamer.
0 10 20 30 0
dtstance,mm
Fig. 8 Junction ,$distance to anode
Average streamer velocity f . r V, = 20 kV and V, = 25 kV as
I-.- IL. I 0 200 4 00 600 800
time, ns
Fig. 9 N , and N ; fine intensities, normalised at theJrst peak V, = 30 kV. radial distance from anode wire: 0-6 mm, resolution: 0.4 nm (i) primary streamer
(ii) secondary streamer
Fig. 12 shows a spectrum at the band head of the main OH transition. From spectra measured under different pulse conditions the initial production of OH per unit dissipated energy can be investigated qualitatively. Fig. 13 gives the result of an ozone absorption measurement obtained with different flow velocities. The efficiency obtained with long-tailed HV-pulses is - 20 g O,/kWh.
A final result to be presented here in Fig. 14 is a demonstration of removal of NO which was added to moist air flowing through the corona reactor. The NO and NO, concentrations have been measured as a func- tion of electrical power input per quantity of gas treated. This variation is obtained by a change in pulse repetition frequency only keeping peak voltage and duration con- stant. A gas mixture of 72% N,, 18% 0, and 10% H,O is used at a temperature of 100°C. Oxidation of NO is indicated by an increase of NO,. At high power density NO, also decreases, probably because of further oxida- tion to NO, and "0,.
146
5 Conclusions
A good description of the pulsed corona discharge at atmospheric pressure requires electrical and optical diag- nostics with a time resolution of a few nanoseconds and a spatial resolution of several micrometres. Voltage and current probes, photomultipliers and image intensifiers can be applied to obtain qualitative and quantitative data. The diagnostics can be used for a better under-
Fig. 10 (V, = 40 k V , gap distance = 50 mm)
Schlieren picture taken 100 ps after the .start of the discharge
h
335.5 336.0 336-5 337.0 337.5 wavelength, nm
Fig. 11 Measured and calrula~ed rotational structure oJ the N, 337.1 nm emission line, V, = 30 kV, resolution: 0.02 (i) measured lii) calculated
I E E Proc.-Sri. Meos. Technol., Vol. 141, N o . 2, March 1994

standing of the pulsed corona discharge, verification of numerical streamer models and optimisation of practical applications such as removal of NO from flue gas.
I
6 307 308 309 310 wavelength,nm
Fig. 12 of OH (a2n + ’E) and N , (b’n, - a ‘ n , ) , resolution: 0.2 nm
Emission spectrum ofwater-air mixture showing several peaks
E
0 N *
x
n
0 D
Y
0
0
0
( 1 1 1 ) oooooooo
( 1 1 ) 0 000000000
0 I 2 3 4 tirne,min
Fig. 13 ent values ofthe gaspow HV-pulses with a long tail of type shown in Ftg. 3a are used
(i) without discharge (ii) 4W l/h
(iii) 200 I/h (iv) 80 l/h
Production of ozone in wire-cylinder configuration for differ-
250f\
energy consumption , W h /rn
Fig. 14 input Short HV-pulses of type shown in Fig. 36 are used
Removal of N O in simulated flue gas as function of energy
6 References
1 MASUDA, S.: ‘Pulse corona induced plasma chemical process: horizon of new plasma technologies’, Pure Appl. Chem., 1990,60, pp. 727-731
2 DINELLI, G., CIVITANO, L., and REA, M.: ‘Industrial experi- ments on pulse corona simultaneous removal of NO, and SO, from flue gas’, IEEE Trans. Ind. App., 1990,26, pp. 535-541
3 AMIROV, R.H~, ASINOVSKI, E.I., SAMOILOV, IS., and SHE- PELIN, A.V.: ‘The characteristics of ozone generation from air by nanosecond corona discharge’, in PENETRANTE, B.M., and SCHULTHEIS, S.E. (Eds.): ‘Non-thermal plasma techniques for pollution control’ (Springer, 1993), NATO AS1 series G, vol. 34, part B, pp. 149-164
4 YAMAMOTO, T., LAWLESS, P.A., RAMANATHAN, K., ENSOR, D.S., RAMSEY, G.H., and PLAKS, N.: ‘Application of corona-induced plasma reactors to decomposition of volatile organic compounds’. EPRl Coof. on Precipitators, San Diego, paper 3A-3, 1990
5 MEESTERS, G.M.H.: ‘Generation of micron-sized droplets from the taylor cone’, J. Aerosol Sci., 1992.23. pp. 37-49
6 LOEB, L.B.: ‘Electrical coronas; Their basic physical mechanisms’ (Univ. of California Press, 1965)
7 GALLIMBERTI. 1.: ‘Breakdown mechanisms in electronegative gases’. V. Int. Symp. on Gaseous Dielectrics, Knoxville, Pergamon, Oxford, UK, 1987, pp. 61-79
8 WANG, M.C., and KUNHARDT, E.E.: ‘Streamer dynamics’, Phys. Rev. A, 1990.42, pp. 2366-2373
9 MORROW, R.: ‘Theory of positive corona in SF, due to a voltage impulse’, IEEE Trans. Plasma Sci., 1991,13, pp. 86-94
IO MARODE. E.: ‘The mechanism of spark breakdown in air a t atmo- spheric pressure between a positive point and a plane. I. Experimen- tal: Nature of the streamer track, J. Appl. Phys., 1975, 46, pp. 2005-2015
I 1 HARTMANN, G.: ‘Spectroscopie de la decharge couronne’. Thesis no. 1073, University of Paris-Sud, Orsay, 1977
12 CREYGHTON, Y.L.M., VAN VELDHUIZEN, E.M., and RUTGERS, W.R.: ‘Electrical and optical study of pulsed positive coronas’, in PENETRANTE, B.M., and SCHULTHEIS, S.E. (Eds.): ‘Non-thermal plasma techniques for pollution control‘ (Springer, 1993), NATO AS1 series G, vol. 34, part A, pp. 205-230
13 KUCHLER, U.P.: ‘Zur Optimierung luftbetriebener Ozonerzeuger’. Thesis, University Aachen, 1990 (in German)
14 HARTMANN, G., and JOHNSON, P.C.: ‘Measurements of relative transition probabilities and the variation of the electronic transition moment for N,C’I l -B3n , second positive system’, J. Phys. B : Atom. Molec. Phys., 1978,11, pp. 1597-1611
15 MITCHELL, K.B.: ‘Fluorescence efficiencies and collisional deacti- vation rates for N, and N: bands excited by soft X rays’, J. Chem. Phys., 1970,53, pp. 1795-1802
16 CALO, J.M., and AXTMANN, R.C.: ‘Vibrational relaxation and electronic quenching of the C’n, (v’ = 1) state of nitrogen’, J. Cbem. Phys., 1971,54, pp. 1332-1341
17 SPYROU, N., and MANASSIS, C.: ‘Spectroscopic study of a posi- tive streamer in a point-to-plate discharge in air: Evaluation of the electric field distribution’, J. Phys. D: Appl. Phys., 1989, 22, pp. 120- 128
18 HERZBERG, G.: ‘Molecular spectra and molecular structure’ (D. van Nostrand, 1955)
19 VAN VELDHUIZEN, E.M., RUTGERS, W.R., CREYGHTON, Y.L.M., and RAMSAK, P.G.: ‘Measurements on pulsed corona in flue gas from a methane burner’. Proc. 10th Int. Cod . on Gas Dis- charges and their Appl., Swansea, 1992, pp. 678-681
20 FINLAYSON-PI’ITS, B.J., and PIlTS, B.J.: ‘Atmospheric chem- istry’ (Wiley, New York, 1986)
21 BOEHM, H.: ‘Elektrochemische Gassensoren und Gas- analysengeraete’, Technisches Messen, 1983, 50, pp. 399-406 (in German)
IEE Proc.-Sci. Mens. Technol., Vol. 141, No. 2, March 1994 147