Embed Size (px)
Citation preview
Clinical Imaging 36 (2012) 29–34
Diagnostic power of various computed tomography signs in diagnosingacute appendicitis
Vincent Lai⁎, Wan Chi Chan, Hin Yue Lau, Tsz Wai Yeung,Yiu Chung Wong, Ming Keung Yuen
Department of Radiology, Tuen Mun Hospital, Tuen Mun, Hong Kong, PR China
Received 2 February 2011; accepted 11 March 2011
Abstract
Objective: To review the diagnostic power of various computed tomography (CT) signs in acute appendicitis, in particular those initiallyclassified as inconclusive.Materials and methods: Retrospective review of 100 CT abdomen and pelvis studies with assessment of maximalluminal diameter, wall thickness and cross-sectional diameter of the appendix, periappendiceal inflammatory changes, and presence ofappendicolith. Results: All CT signs show statistically significant occurrences in acute appendicitis. Their respective cut-off values with bestsensitivity and specificity were calculated. Those from the inconclusive cases were also reviewed. Conclusion: Maximal cross-sectionaldiameter of the appendix is the most powerful parameter. Rest of the CT signs is supportive, especially in cases with inconclusive results.© 2012 Elsevier Inc. All rights reserved.
Keywords: Acute appendicitis; Computed tomography; Diagnostic signs; Maximal diameter; Periappendiceal inflammation
1. Introduction
Acute appendicitis is one of the commonest causes of acuteabdomen, and prompt diagnosis is essential to minimizemorbidity. Traditionally, diagnosis relied on history andphysical examination, but it had been difficult to find thebalance between decreasing false-negative appendectomyrates (10–30%) and making a diagnosis before perforationoccurs [1–5]. With advances in imaging technology, com-puted tomography (CT) has now become part of the standardof care in managing patients with suspected acute appendicitis[6–9]. Well-documented CT findings include direct signssuch as thickened appendiceal diameter, thickened appendi-ceal wall, and distended appendiceal luminal diameter, andindirect signs such as presence of periappendiceal inflamma-tory changes (fat stranding, fluid collection, phlegmon, orabscess formation), appendicolith, extraluminal air, adjacentadenopathy, and adjacent bowel wall thickening [10–19].
⁎ Corresponding author. Department of Radiology, Li Ka Shing Facultyof Medicine, The University of Hong Kong, Hong Kong. Tel.: +85261224478; fax: +852 24663569.
E-mail address: [email protected] (V. Lai).
0899-7071/$ – see front matter © 2012 Elsevier Inc. All rights reserved.doi:10.1016/j.clinimag.2011.04.003
However, not all of the above features are always usefulin diagnosing appendicitis. The incidences of appendicolith,adjacent bowel wall thickening, and adenopathy may be toolow for clinical use [16,20]. Extraluminal air occurs in caseswith perforation only [21,22]. The occurrence of periappen-diceal inflammatory changes is usually of variable degree[16]. We tend to rely on direct signs by measuring themaximal cross-sectional appendiceal diameter or wallthickness. Yet discrepancies exist amongst the recommendeddata or measurement from various past literatures, causingdiagnostic confusion occasionally in cases with intermediatefindings [23].
Hence, in this study, we aimed to review the diagnosticpower and measurement of various CT signs in diagnosingacute appendicitis. We also reviewed the CT findings forpatients classified as inconclusive from the initial CT studies.
2. Materials and method
We retrospectively reviewed all urgent CT studies ofthe abdomen and pelvis performed for either (1) acute abdo-men of uncertain cause initially but subsequently diagnosed
Table 1Summarized results of demographic data and different CT signs
Appendicitisgroup
Nonappendicitisgroup
Pvalue
n 41 59Male sex (%) 22 (54) 22 (39) .639Age (years) 37.8±27.2 41.2±24.7 .439Maximal luminal diameter (mm) 5.95±3.62 1.92±1.60 b.001Maximal wall thickness (mm) 3.43±1.52 2.03±0.95 b.001Maximal cross-sectional
diameter (mm)12.68±2.99 5.98±1.55 b.001
Periappendiceal infiltrates (grade) 1.71±0.75 0.20±0.52 b.001Periappendiceal fluid (grade) 1.51±1.08 0.41±0.79 b.001Periappendiceal abscess 14 (34%) 2 (1%) b.001Appendicolith 14 (34%) 0 (0%) b.001
30 V. Lai et al. / Clinical Imaging 36 (2012) 29–34
as appendicitis or (2) clinically suspected acute appendici-tis during the period of April 2007 to June 2008 at ourhospital through our radiology information system database.A total of 100 patients matching the above criteria wereretrieved and recruited in the study. Forty-four patients weremale and 56 were female. The mean age was 38.6 years(2–88 years old).
Imagings for all cases were performed by our multi-detector CT machine (16-head, Brillance 16, Philips).Scanning range was from the level of the diaphragm to thepubic symphysis in all patients. Imaging was performed inthe noncontrast phase initially and subsequently during theportovenous phase after a delayed dynamic bolus (2 ml/kg ofbody weight; maximum dose 100 ml) of nonionic iodinatedcontrast (Omnipaque 300) administered intravenously by amechanical injector at a rate of 3 ml/s. The raw imagesacquired were reconstructed into 2 mm thickness with 1-mminterspace for interpretation. No oral or rectal contrast wasgiven or administrated.
Images from all cases were reviewed by two indepen-dent radiologists directly from the CT workstation, with thefollowing CT criteria assessed: (1) maximal luminal diam-eter of the appendix; (2) maximal wall thickness of theappendix; (3) maximal cross-sectional diameter (outer wall-to-outer wall) of the appendix; (4) periappendiceal inflam-matory infiltrates (defined as stranding and infiltration ofthe periappendiceal fat) and free fluid; each of which wasgraded as absent (score=0), mild (score=1), moderate(score=2), or severe (score=3) subjectively; (5) periappen-diceal abscess formation; and (6) presence of appendicolith.For Parameters 1 to 3, all measurements were taken at thetransverse (axial) section at the level of maximal dimensionalong any elongated segment of the appendix. Sampling atany turning point of the appendix was avoided. In orderto standardize the measurement method and to minimizemeasurement error, a magnification ratio of 2.0 was usedand each parameter was measured three times by eachradiologist with the mean value obtained for each subject.Discrepancy of measurement, if any, was resolved aftersubsequent consensus.
The histological analytic results from the surgical caseswere evaluated and used as the gold standard to define thedefinitive diagnosis. The whole population was thendivided accordingly into two different groups with ageand sex matched: appendicitis group (n=41) and non-appendicitis group (n=59). Interobserver agreement for themeasured data was evaluated and expressed with the κstatistic. Agreement was excellent with κN0.80; good,κ=0.61–0.80; moderate, κ=0.41–0.60; fair, κ=0.21–0.40;and poor, κb0.20. Statistical analyses were then performedby SPSS 16.0 for Windows (SPSS Inc.) with the use of thet test. Differences with a P value of b.05 were consideredto be statistically significant. Receiver operating character-istic (ROC) curves were then generated with the cut-offvalues of the respective parameters determined from thecoordinates along the curves.
3. Results
For the 100 cases, 41 (41%) of them were subsequentlyproven to be positive, while 59 (59%) of them were negativefor appendicitis. The interobserver agreement showed goodagreement with the kappa value (κ) of “maximal luminaldiameter of the appendix”, “maximal wall thickness of theappendix”, “maximal cross-sectional diameter of the appen-dix”, “periappendiceal inflammatory changes and free fluid”,“abscess formation”, and “presence of appendicolith”measured at 0.75, 0.82, 0.81, 0.78, 0.90, and 1.00, respec-tively. The demographic and CT results are summarized inTable 1.
Amongst the appendicitis group, there were 41 patients(22 males, 19 females) with a mean age ±S.D. of 37.8±27.2.The mean values±S.D. of the measured parameters were asfollows:maximal luminal diameter of the appendix=5.95±3.62mm; maximal wall thickness of the appendix=3.43±1.52 mm;maximal cross-sectional diameter of the appendix=12.68±2.99mm; periappendiceal infiltrates=1.71±0.75; periappendicealfluid=1.51±1.08. All of them showed statistically significantlyhigher values compared with those in the nonappendicitisgroup (Pb.001). Abscess formation was present in 14(34%) of 41 patients and appendicolith was also found in14 (34%) of 41 patients, also showing statisticallysignificantly higher occurrences compared with the non-appendicitis group (Pb.001).
For the nonappendicitis group, there were 59 patients(22 males, 37 females) with a mean age±S.D. of 41.2±24.7years. Twenty-six (44%) of those patients were proven sur-gically as laparotomy was performed for other depictedsurgical causes in the CT scans: small bowel diverticulitis,intussusceptions, small bowel perforation, ruptured rightovarian cyst, right retroperitoneal hematoma, pseudoaneur-ysm, tubo-ovarian abscess, Crohn's disease with terminalileitis, caecal perforation, and terminal ileitis. The spectrumof the diseases is similar to previous published data [24,25].The remainders were assumed to be normal as they weretreated conservatively and subsequently discharged homeon stable condition. The mean values±S.D. of the measuredparameters were as follows: maximal luminal diameter of
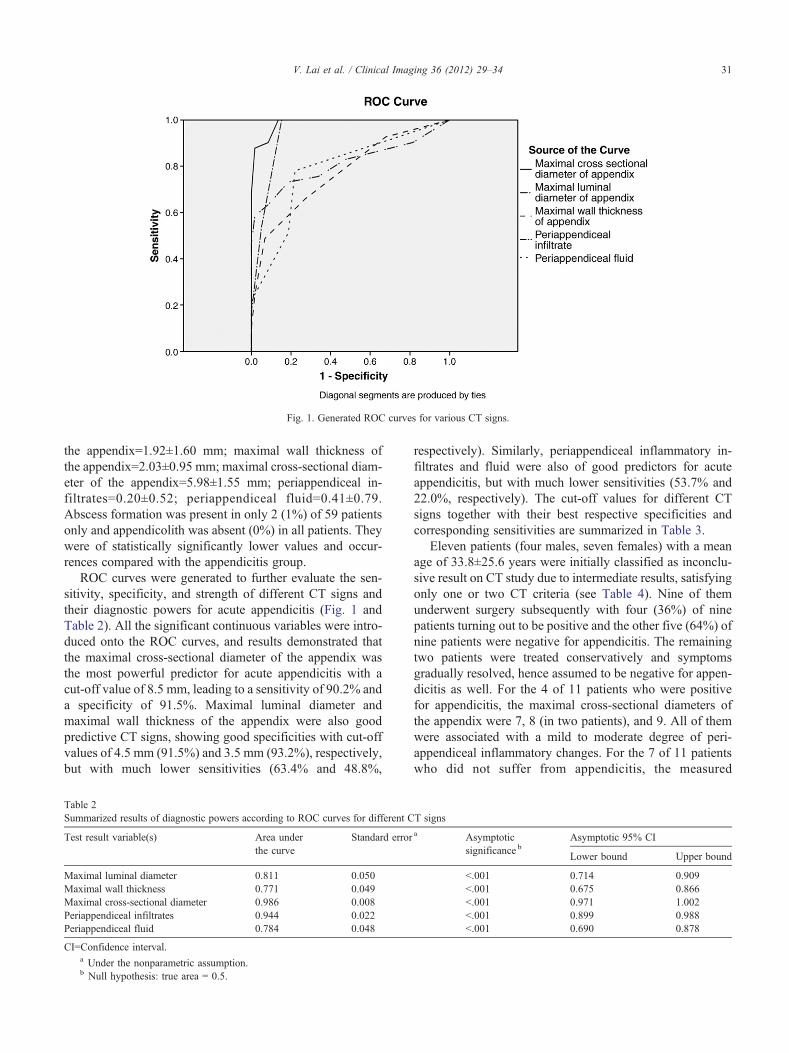
Fig. 1. Generated ROC curves for various CT signs.
31V. Lai et al. / Clinical Imaging 36 (2012) 29–34
the appendix=1.92±1.60 mm; maximal wall thickness ofthe appendix=2.03±0.95 mm; maximal cross-sectional diam-eter of the appendix=5.98±1.55 mm; periappendiceal in-filtrates=0.20±0.52; periappendiceal fluid=0.41±0.79.Abscess formation was present in only 2 (1%) of 59 patientsonly and appendicolith was absent (0%) in all patients. Theywere of statistically significantly lower values and occur-rences compared with the appendicitis group.
ROC curves were generated to further evaluate the sen-sitivity, specificity, and strength of different CT signs andtheir diagnostic powers for acute appendicitis (Fig. 1 andTable 2). All the significant continuous variables were intro-duced onto the ROC curves, and results demonstrated thatthe maximal cross-sectional diameter of the appendix wasthe most powerful predictor for acute appendicitis with acut-off value of 8.5 mm, leading to a sensitivity of 90.2% anda specificity of 91.5%. Maximal luminal diameter andmaximal wall thickness of the appendix were also goodpredictive CT signs, showing good specificities with cut-offvalues of 4.5 mm (91.5%) and 3.5 mm (93.2%), respectively,but with much lower sensitivities (63.4% and 48.8%,
Table 2Summarized results of diagnostic powers according to ROC curves for different C
Test result variable(s) Area underthe curve
Standard error
Maximal luminal diameter 0.811 0.050Maximal wall thickness 0.771 0.049Maximal cross-sectional diameter 0.986 0.008Periappendiceal infiltrates 0.944 0.022Periappendiceal fluid 0.784 0.048
CI=Confidence interval.a Under the nonparametric assumption.b Null hypothesis: true area = 0.5.
respectively). Similarly, periappendiceal inflammatory in-filtrates and fluid were also of good predictors for acuteappendicitis, but with much lower sensitivities (53.7% and22.0%, respectively). The cut-off values for different CTsigns together with their best respective specificities andcorresponding sensitivities are summarized in Table 3.
Eleven patients (four males, seven females) with a meanage of 33.8±25.6 years were initially classified as inconclu-sive result on CT study due to intermediate results, satisfyingonly one or two CT criteria (see Table 4). Nine of themunderwent surgery subsequently with four (36%) of ninepatients turning out to be positive and the other five (64%) ofnine patients were negative for appendicitis. The remainingtwo patients were treated conservatively and symptomsgradually resolved, hence assumed to be negative for appen-dicitis as well. For the 4 of 11 patients who were positivefor appendicitis, the maximal cross-sectional diameters ofthe appendix were 7, 8 (in two patients), and 9. All of themwere associated with a mild to moderate degree of peri-appendiceal inflammatory changes. For the 7 of 11 patientswho did not suffer from appendicitis, the measured
T signsa Asymptotic
significance bAsymptotic 95% CI
Lower bound Upper bound
b.001 0.714 0.909b.001 0.675 0.866b.001 0.971 1.002b.001 0.899 0.988b.001 0.690 0.878
Table 3Cut-off values for different CT signs with their respective best specificitiesand corresponding sensitivities
Cut-offvalue
Sensitivity(%)
Specificity(%)
Maximal luminal diameter (mm) 4.5 63.4 91.5Maximal wall thickness (mm) 3.5 48.8 93.2Maximal cross-sectional diameter 8.5 90.2 91.5Periappendiceal infiltrates (grade) 1.5 53.7 94.9Periappendiceal fluid (grade) 2.5 22 100
32 V. Lai et al. / Clinical Imaging 36 (2012) 29–34
maximal cross-sectional diameters of the appendix werewithin the range of 6–8 mm. Variable degrees of peri-appendiceal inflammatory changes were present in four(57%) of them (Patients 5, 8, 9, and 11), although these fourpatients were subsequently operated on and found to besuffering from other diseases. Nevertheless, there seemed tobe overlapping results demonstrated for patients withappendixes showing maximal cross-sectional diameters of7–8 mm, leading to potential diagnostic confusion.
4. Discussion
Appendicitis is a common clinical entity with substantialmorbidity and mortality, if untreated. CT has become im-portant and popular as it has the ability to diagnose appen-dicitis rapidly and effectively, clearly depicting the typicalfindings with sensitivity and specificity ranging from 91%to 100% and 91% to 99%, respectively [3,5,26–31]. Wegenerally rely on a typical constellation of CT findings todiagnose appendicitis, including appendiceal diameter ofmore than 6 mm, appendiceal wall thickness of more than3 mm, periappendiceal inflammatory changes (fat stranding,fluid collection, phlegmon, or abscess formation), presenceof appendicolith, extraluminal air, adjacent adenopathy, andadjacent bowel wall thickening [26,32]. However, missed/incorrect diagnoses still occur as not all of these signs are
Table 4Results of various CT signs for patients initially classified as inconclusive result o
Patient Sex Age LD (mm) WT (mm) CSD (mm)
Appendicitis group1 M 52 0 4 82 F 14 1 3 73 F 17 2 3 84 M 4 1 4 9
Nonappendicitis group5 F 30 4 2 76 F 9 0 2 77 M 80 4 1 78 F 49 4 2 89 F 39 0 4 810 M 67 4 3 811 F 11 0 3 6
LD=Maximal luminal diameter of the appendix; WT=maximal wall thickness ofGrade: 0=absent; 1=mild; 2=moderate; 3=severe.
necessarily present and substantial discrepancy in theirfrequencies [16] as well as recommended values had beenfound. Besides, some symptomatic patients may only showone of the above findings on CT scan (e.g., isolated appen-diceal enlargement or right lower quadrant stranding den-sities), causing diagnostic dilemma.
Results from our study demonstrated that all the CT signswere useful in predicting appendicitis, showing statisticallysignificant occurrences (Pb.001). From the analysis of theROC curve, the maximal cross-sectional diameter of theappendix was the most powerful CT sign in diagnosing acuteappendicitis, with a cut-off value of 8.5 mm (sensitivity of90.2% and specificity of 91.5%). This value is higher thanthe 6 mm stated from various past literatures [14,15,19,31],but is in line with findings from more recent studies by Iveset al. [33] and Daly et al. [23]. Maximal wall thickness ofthe appendix, maximal luminal diameter of the appendix,periappendiceal inflammatory changes, and presence ofappendicolith were also good predictive signs for appendi-citis but with lower and variable sensitivities (22.0–63.4%)when maintaining at a high specificity (N90%).
Retrospective review of the CT findings for patientsinitially reported as inconclusive revealed mixed results forappendix showing a maximal cross-sectional diameter of7–8 mm. This appeared incoherent with previous studies byBursali et al. [34], Johnson et al. [35], Benjaminov et al. [36],and Webb et al. [37], showing that the mean diameter ofa normal appendix ranged from 3.4 to 5.1, 5 to 7, 3.6 to 6.6,and 6 to 10 mm, respectively. Such findings signified apotential grey zone requiring further ancillary findings orsecondary/indirect signs, in particular the presence of peri-appendiceal inflammatory changes and exclusion of otherpathological processes, to conclude a definitive diagnosis[23]. Nevertheless, such postulation would require furtherdedicated study for clarification of such relationship. Non-visualization of the appendix is another major challenge witha reported rate of 15% [38], causing difficulty in interpre-tation. Although this may be of lesser concern with the use
n CT studies of the abdomen and pelvis
Infiltrates (grade) Fluid (grade) Remark
2 32 23 31 3
1 2 Pelvic inflammatory disease0 0 Mesenteric adenitis0 0 Not operated on1 3 Terminal ileitis1 2 Ruptured right ovarian cyst0 0 Not operated on2 2 TB peritonitis
the appendix; CSD=maximal cross-sectional diameter of the appendix.
33V. Lai et al. / Clinical Imaging 36 (2012) 29–34
of multidetector CT nowadays, paucity of intra-abdominalfat is still a major contributing factor [10,24,39,40] espe-cially in children since it is a natural contrast agent allowinginflammatory changes to be detected easily. We encounteredthree appendicitis cases with indistinct appendix, all ofwhich were associated with moderate to marked periappen-diceal inflammatory infiltrates, fluid, and abscess formation.Therefore depiction of secondary signs becomes importantin these encounters. One can conclude that the detectiverate of acute appendicitis would be low in the absence of adistinctly visualized appendix and any secondary inflamma-tory changes.
The major limitation of our results is that majority of thecases in the nonappendicitis group could not be verified bysurgical–pathological proof. Those who recovered sponta-neously or upon conservative management were assumed tobe normal and did not suffer from acute appendicitis. Yetsome of these patients could be suffering from early acuteappendicitis, chronic inflammatory appendiceal conditions[14], or chronic appendicitis syndrome, which is a uniquephenomenon in adult as described by Giuliano et al. [41].However, it would be unethical to perform surgery or ob-tain histological proof on these patients. The other majorlimitation would be the potential measurement errors thatoccurred in obtaining the maximal cross-sectional diameter,maximal wall thickness, and maximal luminal diameter ofthe appendix.
In conclusion, the overall accuracy of various CT signsin diagnosing acute appendicitis is high. The maximal cross-sectional diameter of the appendix is the most powerfulparameter, with a cut-off value of 8.5 mm for acute appen-dicitis showing high sensitivity and specificity. Maximalluminal diameter of the appendix, maximal wall thickness ofthe appendix, and periappendiceal inflammatory changes arealso good predictive CT signs showing statistically higheroccurrences and are particularly useful as supportive signswhen the CT findings are seemingly inconclusive.
References
[1] Brown JJ. Acute appendicitis: the radiologist's role. Radiology 1991;180:13–4.
[2] Curtin KR, Fitzgerald SW, Nemcek AA, Hoff FL, Vogelzang RL. CTdiagnosis of acute appendicitis: imaging findings. AJR 1995;164:905–9.
[3] Leite NP, Pereira JM, Cunha R, Pinto P, Sirlin C. CT evaluation ofappendicitis and its complications: imaging techniques and keydiagnostic findings. AJR 2005;185:406–17.
[4] Patrick DA, Janik JE, Janik JS, Bensard DD, Karrer FM, Increased CT.Scan utilization does not improve the diagnostic accuracy of appen-dicitis in children. J Pediatr Surg 2003;38(5):659–62.
[5] Weyant MJ, Eachempati SR, Maluccio MA, Rivadeneira DE,Grobmyer SR, Hydo LJ, et al. Interpretation of computed tomographydoes not correlate with laboratory or pathologic findings in surgicallyconfirmed acute appendicitis. Surgery 2000;128(2):145–52.
[6] Wilson EB, Cole JC, Nipper ML, Cooney DR, Smith RW. Computedtomography and ultrasonography in the diagnosis of appendicitis:when are they indicated? Arch Surg 2001;136(6):670–5.
[7] Iwahashi N, Kitagawa Y, Mayumi T, Kohno H. Intravenous contrast-enhanced computed tomography in the diagnosis of acute appendicitis.World J Surg 2005;29(1):83–7.
[8] Pickuth D, Spielmann RP. Unenhanced spiral CT for evaluating acuteappendicitis in daily routine. A prospective study. Hepatogastroenter-ology 2001;48(37):140–2.
[9] Kamel IR, Goldberg SN, KeoganMT, RosenMP, Raptopoulos V. Rightlower quadrant pain and suspected appendicitis: nonfocused appendicealCT—review of 100 cases. Radiology 2000;217(1):159–63.
[10] Nikolaidis P, Hwang CM, Miller FH, Papanicolaou N. The nonvisual-ized appendix: incidence of acute appendicitis when secondary inflam-matory changes are absent. AJR 2004;183:889–92.
[11] Wu CT, Lim KE. A retrospective study of CT findings in casesundergoing appendectomy at a single hospital. Clin Imaging 2007;31(4):239–43.
[12] Nathan RO, Blackmore CC, Jarvik JG. Therapeutic impact of CT ofthe appendix in a community hospital emergency department. AJR AmJ Roentgenol 2008;191(4):1102–6.
[13] Rao PM, Mueller PR. Clinical and pathologic variants of appendicealdisease: CT features. AJR Am J Roentgenol 1998;170(5):1335–40.
[14] Checkoff JL, Wechsler RJ, Nazarian LN. Chronic inflammatoryappendiceal conditions that mimic acute appendicitis on helical CT.AJR Am J Roentgenol 2002;179:731–4.
[15] Pickuth D, Spielmann RP, Unenhanced spiral CT. for evaluating acuteappendicitis in daily routine. A prospective study. Hepatogastroenter-ology 2001;48(37):140–2.
[16] Rao PM, Rhea JT, Novelline RA. Sensitivity and specificity of theindividual CT signs of appendicitis: experience with 200 helicalappendiceal CT examinations. Comput Assist Tomogr 1997;21(5):686–92.
[17] Choi D, Park H, Lee YR, Kook SH, Kim SK, Kwag H, et al. The mostuseful findings for diagnosing acute appendicitis on contrast-enhancedhelical CT. Acta Radiol 2003;44(6):574–82.
[18] Choi YH, Fischer E, Hoda SA, Rubenstein WA, Morrissey KP,Hertford D, et al. Appendiceal CT in 140 cases. Diagnostic criteriafor acute and necrotizing appendicitis. Clin Imaging 1998;22(4):252–71.
[19] Lane MJ, Liu DM, Huynh MD, Jeffrey RB, Mindelzun RE, Katz DS.Suspected acute appendicitis: nonenhanced helical CT in 300 conse-cutive patients. Radiology 1999;213(2):341–6.
[20] Lowe LH, Penney MW, Scheker LE, Perez R, Stein SM, Heller RM,et al. Appendicolith revealed on CT in children with suspected appen-dicitis: how specific is it in the diagnosis of appendicitis? AJR Am JRoentgenol 2000;175(4):981–4.
[21] Yeung KW, Chang MS, Hsiao CP. Evaluation of perforated andnonperforated appendicitis with CT. Clin Imaging 2004;28(6):422–7.
[22] Rao PM, Rhea JT, Novelline RA. Appendiceal and peri-appendicealair at CT: prevalence, appearance and clinical significance. Clin Radiol1997;52(10):750–4.
[23] Daly CP, Cohan RH, Francis IR, Caoili EM, Ellis JH, Nan B. Incidenceof acute appendicitis in patients with equivocal CT findings. AJR Am JRoentgenol 2005;184(6):1813–20.
[24] Kim HC, Yang DM, Jin W, Park SJ. Added diagnostic value ofmultiplanar reformation of multidetector CT data in patients withsuspected appendicitis. Radiographics 2008;28:393–406.
[25] Scatarige JC, Yousem DM, Fishman EK, Jones B, Siegelman SS. CTabnormalities in right lower quadrant inflammatory disease: review offindings in 26 adults. Gastrointest Radiol 1987;12(2):156–62.
[26] Levine CD, Aizenstein O, Lehavi O, Blachar A. Why we miss thediagnosis of appendicitis on abdominal CT: evaluation of imagingfeatures of appendicitis incorrectly diagnosed on CT. AJR 2005;184:855–9.
[27] Wijetunga R, Tan BS, Rouse JC, Bigg-Wither GW, Doust BD.Diagnostic accuracy of focused appendiceal CT in clinically equivocalcases of acute appendicitis. Radiology 2001;221(3):747–53.
[28] Rao PM, Rhea JT, Novelline RA, McCabe CJ, Lawrason JN, BergerDL, et al. Helical CT technique for the diagnosis of appendicitis:
34 V. Lai et al. / Clinical Imaging 36 (2012) 29–34
prospective evaluation of a focused appendix CT examination.Radiology 1997;202(1):139–44.
[29] Bouillot JL, Ruiz A, Alamowitch B, Capuano G, Aouad K,Fourmestraux J, et al. Suspected acute appendicitis. Role of enhancedhelical computed tomography. Prospective study of 100 patients. AnnChir 2001;126(5):427–33.
[30] Balthazar EJ, Megibow AJ, Siegel SE, Birnbaum BA. Appendicitis:prospective evaluation with high-resolution CT. Radiology 1991;180(1):21–4.
[31] Miki T, Ogata S, Uto M, Nakazono T, Urata M, Ishibe R, et al.Enhanced multidetector-row computed tomography (MDCT) in thediagnosis of acute appendicitis and its severity. Radiat Med 2005;23(4):242–55.
[32] Moteki T, Horikoshi H. New CT criterion for acute appendicitis:maximum depth of intraluminal appendiceal fluid. AJR 2007;188:1313–9.
[33] Ives EP, Sung S, McCue P, Durrani H, Halpern EJ. Independentpredictors of acute appendicitis on CT with pathologic correlation.Acad Radiol 2008;15(8):996–1003.
[34] Bursali A, Araç M, Oner AY, Celik H, Ekşioğlu S, Gümüş T.Evaluation of the normal appendix at low-dose non-enhanced spiralCT. Diagn Interv Radiol 2005;11(1):45–50.
[35] Johnson PT, Eng J, Moore CJ, Horton KM, Fishman EK. Multi-detector-row CT of the appendix in healthy adults. Emerg Radiol 2006;12(6):248–53.
[36] Benjaminov O, Atri M, Hamilton P, Rappaport D. Frequency ofvisualization and thickness of normal appendix at nonenhanced helicalCT. Radiology 2002;225(2):400–6.
[37] Webb EM, Wang ZJ, Coakley FV, Poder L, Westphalen AC, Yeh BM.The equivocal appendix at CT: prevalence in a control population.Emerg Radiol 2010;17(1):57–61.
[38] Ganguli S, Raptopoulos V, Komlos F, Sliewert B, Kruskal JB. Rightlower quadrant pain: value of the nonvisualized appendix in patients atmultidetector CT. Radiology 2006;241:175–80.
[39] Sivit CJ, Dudgeon DL, Applegate KE, Borisa VJ, Berlin SC, MorrisonSC, et al. Evaluation of suspected appendicitis in children and youngadults: helical CT. Radiology 2000;216:430–3.
[40] Kim HC, Yang DM, Shin HP. Why can we not see a normal appendixon CT? An evaluation of the factors influencing nonvisualization of anormal appendix by 64-slice MDCT. Clin Imaging 2009;33(1):33–8.
[41] Giuliano V, Giuliano C, Pinto F, Scaglione M. Chronic appendicitis“syndrome” manifested by an appendicolith and thickened appendixpresenting as chronic right lower abdominal pain in adults. EmergRadiol 2006;12(3):96–8.