Embed Size (px)
Citation preview

University of Groningen
Diagnostic performance of semi-quantitative and quantitative stress CMR perfusion analysisvan Dijk, Randy; van Assen, Marly; Vliegenthart, Rozemarijn; de Bock, Gertruida H; van derHarst, Pim; Oudkerk, MatthijsPublished in:Journal of cardiovascular magnetic resonance
DOI:10.1186/s12968-017-0393-z
IMPORTANT NOTE: You are advised to consult the publisher's version (publisher's PDF) if you wish to cite fromit. Please check the document version below.
Document VersionPublisher's PDF, also known as Version of record
Publication date:2017
Link to publication in University of Groningen/UMCG research database
Citation for published version (APA):van Dijk, R., van Assen, M., Vliegenthart, R., de Bock, G. H., van der Harst, P., & Oudkerk, M. (2017).Diagnostic performance of semi-quantitative and quantitative stress CMR perfusion analysis: A meta-analysis. Journal of cardiovascular magnetic resonance, 19, [92]. DOI: 10.1186/s12968-017-0393-z
CopyrightOther than for strictly personal use, it is not permitted to download or to forward/distribute the text or part of it without the consent of theauthor(s) and/or copyright holder(s), unless the work is under an open content license (like Creative Commons).
Take-down policyIf you believe that this document breaches copyright please contact us providing details, and we will remove access to the work immediatelyand investigate your claim.
Downloaded from the University of Groningen/UMCG research database (Pure): http://www.rug.nl/research/portal. For technical reasons thenumber of authors shown on this cover page is limited to 10 maximum.
Download date: 11-02-2018

REVIEW Open Access
Diagnostic performance of semi-quantitative and quantitative stress CMRperfusion analysis: a meta-analysisR. van Dijk1,3, M. van Assen1, R. Vliegenthart1,2, G. H. de Bock4, P. van der Harst3 and M. Oudkerk1*
Abstract
Background: Stress cardiovascular magnetic resonance (CMR) perfusion imaging is a promising modality for theevaluation of coronary artery disease (CAD) due to high spatial resolution and absence of radiation. Semi-quantitativeand quantitative analysis of CMR perfusion are based on signal-intensity curves produced during the first-pass ofgadolinium contrast. Multiple semi-quantitative and quantitative parameters have been introduced. Diagnosticperformance of these parameters varies extensively among studies and standardized protocols are lacking. This studyaims to determine the diagnostic accuracy of semi- quantitative and quantitative CMR perfusion parameters, comparedto multiple reference standards.
Method: Pubmed, WebOfScience, and Embase were systematically searched using predefined criteria (3272 articles). Acheck for duplicates was performed (1967 articles). Eligibility and relevance of the articles was determined by tworeviewers using pre-defined criteria. The primary data extraction was performed independently by two researchers withthe use of a predefined template. Differences in extracted data were resolved by discussion between the tworesearchers. The quality of the included studies was assessed using the ‘Quality Assessment of Diagnostic AccuracyStudies Tool’ (QUADAS-2). True positives, false positives, true negatives, and false negatives were subtracted/calculatedfrom the articles. The principal summary measures used to assess diagnostic accuracy were sensitivity, specificity,andarea under the receiver operating curve (AUC). Data was pooled according to analysis territory, reference standardand perfusion parameter.
Results: Twenty-two articles were eligible based on the predefined study eligibility criteria. The pooled diagnosticaccuracy for segment-, territory- and patient-based analyses showed good diagnostic performance with sensitivity of 0.88, 0.82, and 0.83, specificity of 0.72, 0.83, and 0.76 and AUC of 0.90, 0.84, and 0.87, respectively. In per territory analysisour results show similar diagnostic accuracy comparing anatomical (AUC 0.86(0.83–0.89)) and functional referencestandards (AUC 0.88(0.84–0.90)). Only the per territory analysis sensitivity did not show significant heterogeneity. Noneof the groups showed signs of publication bias.
Conclusions: The clinical value of semi-quantitative and quantitative CMR perfusion analysis remains uncertain due toextensive inter-study heterogeneity and large differences in CMR perfusion acquisition protocols, reference standards,and methods of assessment of myocardial perfusion parameters. For wide spread implementation, standardization ofCMR perfusion techniques is essential.
Trial registration: CRD42016040176.
Keywords: Magnetic resonance imaging, Coronary artery disease, Myocardial perfusion imaging
* Correspondence: [email protected] for Medical Imaging, University Medical Center Groningen, Universityof Groningen, Hanzeplein 1 EB 45, Groningen, The NetherlandsFull list of author information is available at the end of the article
© The Author(s). 2017 Open Access This article is distributed under the terms of the Creative Commons Attribution 4.0International License (http://creativecommons.org/licenses/by/4.0/), which permits unrestricted use, distribution, andreproduction in any medium, provided you give appropriate credit to the original author(s) and the source, provide a link tothe Creative Commons license, and indicate if changes were made. The Creative Commons Public Domain Dedication waiver(http://creativecommons.org/publicdomain/zero/1.0/) applies to the data made available in this article, unless otherwise stated.
van Dijk et al. Journal of Cardiovascular Magnetic Resonance (2017) 19:92 DOI 10.1186/s12968-017-0393-z

BackgroundIn recent years it has become apparent that information onthe functional consequence of a stenosis in the coronary ar-teries is essential in prognostication and treatment of pa-tients with coronary artery disease (CAD) [1–3]. Invasivecoronary angiography is the current gold standard for theassessment of CAD according to the ESC guidelines [4, 5].Fractional flow reserve (FFR) measurements are used to as-sess the functional significance by determining the pressuredrop over an epicardial stenosis [6]. The disadvantage ofinvasive coronary angiography is that it is an invasive pro-cedure, exposing patients to procedural risks and radiation[7–11]. In addition, in up to 60% of the patients undergoinginvasive angiography, no significant stenosis is present sug-gesting that the pre-selection of patients for invasive coron-ary angiography can be improved [12].A variety of noninvasive imaging modalities exists which
show potential to be used in the (functional) assessmentof patients suspected of CAD. These modalities includepositron emission tomography (PET), cardiovascular mag-netic resonance (CMR), computed tomography (CT), andsingle-photon emission computed tomography (SPECT).The different myocardial perfusion imaging (MPI) modal-ities all show a high diagnostic accuracy with an areaunder the curve (AUC) of 0.95 (0.91–0.99) for CMR per-fusion imaging in general compared to 0.93 for PET, 0.93for CT, and 0.82 for SPECT, respectively [13]. A disadvan-tage of MPI performed with either PET, SPECT or CT isthe radiation exposure during the examination [11, 14].MPI by stress CMR perfusion combines a high spatial
resolution with the absence of radiation. These featuresmake CMR perfusion an interesting modality for routineclinical assessment of CAD. The diagnostic accuracy ofCMR perfusion imaging has been assessed in multiplestudies and recent meta-analyses have provided exten-sive overviews of available evidence [13, 15–18], howeverthese meta-analyses do not discriminate between quali-tative and quantitative assessment. Currently, the visualassessment of perfusion defects is used in clinical prac-tice [19].Visual assessment however, is subjective andhighly dependent on expertise. However, analysis of thesignal-intensity curves (SI-curves) that can be acquiredduring the first wash-in of the paramagnetic contrastagent gadolinium have potential to provide quantitativeinformation on myocardial perfusion. These SI-curves toevaluate the myocardial blood flow (MBF) can be evalu-ated by semi-quantitative or quantitative methods [20].The semi-quantitative method is based on the maximalupslope of the tissue attenuation curve (TAC) [21]. Thequantitative method is based on model dependent de-convolution using the SI-curves. A variety of tracer kin-etic models are used providing a MBF value related tothe physiological MBF [22]. There are various proposedmodels for model dependent deconvolution with varying
complexity. Both the semi-quantitative and quantitativeparameters can be analyzed relatively as a ratio betweenvalues during stress and rest MPI or as absolute values.Although a large number of studies have been per-formed, meta-analysis of CMR perfusion available todate did not evaluate the diagnostic performance ofthese semi-quantitative and quantitative analysis of theSI-curves acquired during the first-pass perfusion.Therefore, the aim of this meta-analysis was to assess
the diagnostic accuracy of semi-quantitative or quantita-tive CMR perfusion imaging analysis based on SI time(SI-curves) as compared to either anatomical(quantita-tive coronary angiography (QCA)) or functional refer-ence standards (invasive coronary angiography +/− FFR)in patients with suspected or known CAD.
MethodsProtocol and registrationThis meta-analysis was performed in concordance withthe Preferred Reporting Items for Systematic Reviewsand Meta-analyses (PRISMA) statement and was regis-tered at PROSPERO (http://www.crd.york.ac.uk/PROS-PERO/display_record.asp?ID=CRD42016040176) underregistration number: 42016040176).
Eligibility criteriaTo produce an extensive overview of the diagnostic accur-acy of both semi-quantitative and quantitative CMR perfu-sion analysis, the following criteria to determine eligibilitywhere used: study domain – patients with known or sus-pected CAD. Index test – quantitative or semi-quantitativeCMR perfusion. Reference standard – invasive coronaryangiography +/− FFR and QCA. Study results – diagnosticaccuracy of index test compared to reference standard.Study design – observational. Overlap in study populationbetween studies was corrected for by only including thestudy with the highest number of patients. Studies evaluat-ing visual CMR perfusion outcome measures not based ontime intensity curves, evaluation on a segmental basis, ani-mal studies, phantom studies, and dose ranging studieswere excluded from both the qualitative and quantitativeanalysis. Furthermore, reviews and overview documentswere excluded from the quantitative analysis.
Search strategyThe following search strategy was used in Pubmed:(“Myocardial Ischemia”[Mesh] OR myocardial OR cardiacOR “coronary artery”) AND (“Magnetic Resonance Imagi-ng”[Mesh] OR Magnetic Resonance[tiab] OR mri[tiab]OR MRP[tiab]) AND (“Perfusion Imaging”[Mesh] OR per-fusion[tiab]) AND (Quantification*[tiab] OR quantitative[-tiab] OR deconvolut*[tiab] OR myocardial perfusionreserve[tiab] OR mpr[tiab] OR semiquantitative [tiab] ORsemiquantitative [tiab] OR semiquantitative OR MPRI
van Dijk et al. Journal of Cardiovascular Magnetic Resonance (2017) 19:92 Page 2 of 16

[tiab] OR myocardial blood flow [tiab] OR MBF [tiab] ORcontrast enhancement ratio [tiab] OR left ventricular up-slope [tiab] OR upslope integral [tiab] OR CER [tiab] ORSLP [tiab] OR INT [tiab]). Additionally, Embase and Webof Science were searched using adjusted search strategy tofit the search matrix of the source.
Study selectionThe search strategy was set-up in collaboration with thelocal Medical Library (Central Medical Library UniversityMedical Center Groningen). One researcher (RvD) exe-cuted the search and gathered the results in Mendeley(version 1.16.1). A check for duplicates was performedwith both the built in ‘check for duplicates’ function as wellas manually (RvD). Screening for study eligibility and rele-vance of the articles retrieved by the search strategy wasperformed individually by two reviewers (RvD and MvA)using the pre-defined study eligibility criteria. Studies werecategorized as includable, possibly includable, non-includable by screening the titles and abstracts. Inter-reviewer categorization was compared and in case of dis-agreement discussed to obtain consensus.
Data collection processThe primary data extraction was performed independentlyby both researchers (RvD and MvA) with the use of a prede-fined template. Data extraction was cross checked and dis-cussed to achieve consensus. In case of missing or uncleardata the corresponding authors were contacted (n = 12), inabsence of a response the studies were excluded.
Data itemsThe following patient characteristics were collected:age, gender, prevalence of CAD, and coronary arterydisease risk factors. Data on study design was col-lected, including: prospective/retrospective set up,number of patients enrolled, number of patients ex-cluded, scanner type and manufacturer, stressor agentand dose, contrast agent, perfusion sequence, cardiacsegmentation method, reference standard, outcomemeasures with reported sensitivity, specificity, negativepredictive value, positive predictive. The number oftrue positives (TP), false positives (FP), true negatives(TN), and false negatives (FN) were derived directlyfrom the article or calculated from the sensitivity andspecificity reported in the articles. All the figures andtables in this article are original for this article.
Quality assessmentTwo reviewers (RvD and MvA) independently evaluatedthe study quality of the included studies using the ‘Qual-ity Assessment of Diagnostic Accuracy Studies Tool’(QUADAS-2) [23]. Risk of bias was assessed across all
studies and within each individual study using RevMansoftware (version 5.3.5, Cochrane collaboration).
Statistical analysisThe principal summary measures used to assess diag-nostic accuracy were sensitivity, specificity, DiagnosticOdds Ratio (DOR), and AUC. In case studies performedmultiple semi-quantitative or quantitative analyses wechose the maximal upslope parameter as a representa-tive measure for semi-quantitative analysis and absoluteMBF for quantitative analysis. Furthermore, transmuralratios were used when studies reported sub-endocardial,sub-epicardial, and transmural outcomes. When multipletracer kinetic models were used for quantitative analysis,the Fermi model was selected. When both a semi-quantitative and a quantitative outcome, or both 1.5 T aswell as 3.0 T were used, both outcomes were taken intoaccount for the analysis.The primary data synthesis was based on bivariate
mixed-effects binary regression modeling. Sensitivity,specificity, and heterogeneity (using the Q-statistic andI2 index) were calculated and displayed in forest plots.Significant heterogeneity was defined as Q-statisticp < 0.10 and/or I2 > 50%. Separate subgroup forest plotswere evaluated when >5 studies were available.The Deeks’ funnel test was used to test for publication
bias, with a value <0.05 indicative of publication bias orsystematic difference between results of larger andsmaller studies. The DORs were used to calculate thesummary receiver operating curves (sROC). Based onthe ROC curves the AUC was calculated. Data analysiswas performed with STATA (version 13.0; STATA cor-poration, Lakeway Drive, College Station, Texas, USA).
ResultsThe systematic search in Pubmed, WebOfScience, andEmbase identified 3272 articles. After the removal of du-plicates, 1967 articles were screened based on title andabstract. The resulting 137 articles were assessed in fulltext for eligibility. Of these, 23 articles were deemed eli-gible based on the predefined study eligibility criteria in-cluding a total of patients, with mean age ranging from57 to 67 years. The PRISMA flowchart is shown in Fig. 1.The final analysis included 22 articles due to exclusionof one study using dobutamine as a stressor agent inwhich an inadequate heart rate response for diagnosiswas achieved in most age groups.Studies were performed at 1.5 T in 20 (91%) studies and
at 3 T in 6 (27%) studies (Bernhardt et al. used both 1.5 Tas well as 3.0 T). The stressor agent used was either ad-enosine or dipyridamole in 18 (82%) and 6 (27%), studies,respectively. Segment based outcome data was available in4 (18%) of all studies, territory based outcome data wasavailable in 13 (59%) and patient based outcome data in
van Dijk et al. Journal of Cardiovascular Magnetic Resonance (2017) 19:92 Page 3 of 16

11 (50%) studies included (Bertschinger et al. and Papa-nastasiou et al. reported both territory and patient baseddata). Perfusion analysis was performed semi-quantitativein 16 (73%) studies and quantitative in 10 (45%) (Huber etal. and Mordini et al. reported data on both semi-quantitative and quantitative analysis). The referencestandard was anatomical in 15 (68%) studies and func-tional in 11 (50%). See Tables 1, 2 and 3.
Diagnostic performanceFour studies with per segment-based analysis could beincluded, all using an anatomical reference method(QCA). Segment-based pooled sensitivity, specificity,and DOR were 0.88 (95% CI, 0.82–0.93), 0.72 (95%CI,0.56–0.84), and 19 (95% CI, 9–40), respectively. ROCcurve analysis showed an AUC of 0.90 (95% CI, 0.87–0.92). See Table 4 and Figs. 2 and 3.Eleven studies were included analyzing the perfusion
data on a per territory basis with Huber et al. [24]reporting on both semi-quantitative and quantitativeanalysis, including twelve study outcomes in the finalper territory analysis. Territory-based pooled sensitivity,specificity, and DOR were 0.82 (95% CI, 0.77–0.86), 0.83
(95% CI, 0.74–0.90), and 21 (95% CI, 10–45), respectively.ROC curve analysis showed an AUC of 0.84 (95% CI,0.81–0.87). See Table 4 and Figs. 4 and 5. Quantitativeanalysis (n = 6) on a per territory base yielded a sensitivity,specificity, and DOR of 0.77 (95% CI, 0.62–0.87), 0.86(95% CI, 0.72–0.94), and 21 (95% CI, 6–8) with an AUC of0.88 (95% CI, 0.85–0.91), while semi-quantitative analysis(n = 6) yielded a sensitivity and specificity of 0.77 (95% CI,0.60–0.88) and 0.84 (95% CI, 0.76–0.89) with an AUC of0.87 (95% CI, 0.84–0.90). Using a functional reference(n = 7) standard yielded a sensitivity, specificity, and DORof 0.77 (95% CI, 0.63–0.86), 0.85 (95% CI, 0.73–0.92), and18 (95% CI, 6–59) with an AUC of 0.88 (95% CI, 0.84–0.90), while the use of an anatomical reference (n = 5)showed sensitivity, specificity, and DOR of 0.85 (95% CI0.78–0.90), 0.83 (95% CI, 0.72–0.91), and 28 (95% CI, 13–63) with an AUC of 0.86 (95% CI, 0.83–0.89).Eight studies were included analyzing the CMR perfu-
sion data on a per patient basis, of which Mordini et al.[20] reported on both semi-quantitative and quantita-tive outcome and Bernhardt et al. [25] performed ana-lysis at both 1.5 T and 3.0 T, in the end including tenstudy outcomes in the final per patient analysis. Six had
Fig. 1 Flow diagram of the literature search and selection of relevant studies
van Dijk et al. Journal of Cardiovascular Magnetic Resonance (2017) 19:92 Page 4 of 16

an anatomical reference standard and 4 a functionalreference standard. Patient based sensitivity, specificity,and DOR were 0.83 (95% CI, 0.75–0.88), 0.76 (95% CI,0.65–0.85), and 15 (95%CI 6–36). ROC curve analysisshowed an AUC of 0.87 (95% CI, 0.84–0.90). See Table 4and Figs. 6 and 7.
Diagnostic accuracy in patients with decreased leftventricular ejection fraction or multi-vessel diseaseThe study of Krittayaphong et al. reported on the diag-nostic accuracy of MPRI in patients with decreased leftventrticular ejection fraction (LVEF). They report a de-creased sensitivity, specificity and diagnostic accuracy in
the subgroup of patients with decreased LVEF (sensitiv-ity 88.9%, specificity 58.3% and diagnostic accuracy 71.5)as compared to patients with normal LVEF (sensitivity89.7%, specificity 93.8% and diagnostic accuracy 91.1).Mordini et al. report that all their patients with multi-vessel disease (n = 7) were correctly identified withquantitative perfusion analysis. Giang et al. present asimilar sensitivity and specificity whether patients withthree vessel disease were included or not across alltested doses (e.g. 94/71% sensitivity/specificity when pa-tients with three vessel disease included at dose 3 com-pared to a 91%/71% sensitivity/specificity when patientswith three vessel disease excluded).
Table 1 Overview of patient demographics for all included studies
Study No.Patients
Male Agea HT(%)
DM(%)
smoking Hypercholesterolemia(%)
History of PCI/CABG (5)
prevalence ofCAD %
Previous MI(%)
Al-Saadi 2000[27]
34 32 59+/−11 NS NS NS NS NS 100 NS
Bertschinger2001 [28]
14 NS NS NS NS NS NS NS 93 NS
Ibrahim 2002 [29] 25 19 63+/−13 NS 28 NS 68 56 100 12
Nagel 2003 [30] 84 73 63+/−8 0 0 21 NS NS 51 0
Giang 2004 [31] 29 25 58+/−8 45 14 34 59 52 66 38
Plein 2005 [32] 92 68 58+/−11 30 8 35 54 NS 64 19
Rieber 2006 [33] 43 38 66+/−8 86 23 35 NS 28 67 19
Positano 2006[34]
32 20 65+/−10 NS NS NS NS NS 50 NS
Costa 2007 [35] 37 16 65+/−11 80 23 20 57 NS 97 NS
Pignitore 2008[36]
125 5114
62+/−760+/−5
7378
2726
5159
7066
NS 71 NS
KrittayaPhong2009 [37]
66 38 61+/−12 62 27 8 62 Exclusioncriterium
58 Exclusioncriterium
Kirschbaum 2011[38]
40 27 62+/−7 49 15 29 41 NS 34 NS
Lockie 2011 [39] 42 33 57+/−10 NS 19 21 Exclusion criterium 19 NS Exclusioncriterium
Bernhardt 2012[25]
34 26 62+/−11 80 15 47 53 NS 62 NS
Huber 2012 [24] 23 27 67+/−12 36 23 85 29 NS 55 19
Motwani 2012[40]
40 27 64+/−8 NS NS NS NS NS 53 NS
Chiribiri 2013 [41] 30 22 59+/−11 NS 27 27 NS NS 80 NS
Mordini 2014 [20] 67 45 60+/−11 60 16 42 75 25 34 25
Motwani 2014[42]
35 26 62+/−8 51 17 40 54 9 57 9
Yun 2015 [43] 58 17 60+/−11 59 26 28 48 10 31 16
Pan 2015 [44] 71 57 60+/−6 8 31 61 62 9 55 NS
Papanastasiou2016 [45]
24 20 63 ± 7 13 3 6 NS 4 67 7
aAge either mean+/−SD or mean(range). HT hypertension, DM diabetes mellitus, PCI percutaneous coronary intervention, CABG coronary artery bypass graft, CADCoronary Artery Disease, MI myocardial infarct
van Dijk et al. Journal of Cardiovascular Magnetic Resonance (2017) 19:92 Page 5 of 16

Study quality assessment and publication biasThe overall methodological quality of the studieswas good See Figs. 8 and 9. The per territory ana-lysis pooled sensitivity, per territory anatomical ref-erence standard sensitivity and per territory semi-
quantitative specificity did not show significant het-erogeneity See Figs. 2, 4, 6 and Table 4. The Deeks’Funnel plots did not indicate publication bias or sys-tematic difference between results of larger andsmaller studies See Figs. 10 and 11.
Table 2 Overview of the study specific acquisition protocol
Study Scanner Protocol Stressoragent
Contrast agent Contrastdosage
Perfusion sequence
Al-Saadi 2000 [27] 1.5 T,Philips
Rest/stress Dipyridamole Gadopentate (Magnevist) 0.025 mmol/kg T1-weighted inversion recoverysingle-shot turbo gradient echo
Bertschinger 2001 [28] 1.5 T, G.E. Stress only Dipyridamole Gadodiamide (Omniscan) NS interleaved gradient-echo EPI
Ibrahim 2002 [29] 1.5 T,Phillips
Rest/stress Adenosine Gadopentate (Magnevist) 0.05 mmol/l A fast hybrid, gated-imaging se-quence consisting of three short-axis slices was used
Nagel 2003 [30] 1.5 T,Philips
Rest/stress Adenosine Diethylenetriaminepentaaceticacid-gadolinium
0.025 mmol/kg single shot segmented k-spaceturbo-gradient-echo/echo-planar-imaging (EPI)-hybrid
Giang 2004 [31] 1.5 T, G.E. Stress only Adenosine Gadopentate (Magnevist) 0.05 mmol/kg hybrid echo planar
Plein 2005 [32] 1.5 T,Philips
Rest/stress Adenosine Gadopentate (Magnevist) 0.05 mmol/kg dynamic segmented k-spacegradient-echo combined withSENSE
Rieber 2006 [33] 1.5 T,Siemens
Stress/rest Adenosine Gadodiamide (Omniscan) 0.05 mmol/kg T1-weighted saturation recoveryturbo flash
Positano 2006 [34] 1.5 G.E. Rest/stress Dipyridamole Gadodiamide (Omniscan) 0.1 mmol/kg fast gradient-echo train
Costa 2007 [35] 1.5Siemens
Stress/rest Adenosine Gadolinium (Magnevist) 0.1 mmol/kg single-shot gradient-echo
Pignitore 2008 [36] 1.5 G.E. Rest/stress Dipyridamole Gadodiamide (Omniscan) 0.1 mmol/kg fast gradient-echo train
KrittayaPhong 2009 [37] 1.5 T,Phillips
Stress/rest adenosine Gadopentate (Magnevist) 0.05 mmol/l ECG-triggered, T1 weighted,inversion receovery single shotturbo gradient echo sequence
Kirschbaum 2011 [38] 1.5 T, GEMedicalSystems
Rest/stress adenosine Gadopentate (Magnevist) 0.05 mmol/kg steady state free-precessiontechnique
Lockie 2011 [39] 3.0 T,Philips
Stress/rest Adenosine Gadopentate (Magnevist) 0.05 mmol/kg saturation recovery gradient echomethod
Bernhardt 2012 [25] 1.5 T/3.0 T,Philips
Stress/rest Adenosine Gadoterate meglumine(Dotarem)
0.075 mmol/kg steady state free-precessiontechnique
Huber 2012 [24] 1.5 T,Siemens
NS Adenosine Gadopentate (Magnevist) 0.05 mmol/kg saturation turboFlash
Motwani 2012 [40] 3.0Phillips
Stress/rest Adenosine Gadopentate (Magnevist) 0.05 mmol/kg Saturation-recovery gradient echo
Chiribiri 2013 [41] 3.0 T,Philips
Stress/rest Adenosine Gadopentate (Magnevist) 0.05 mmol/kg saturation-recovery gradient echo
Mordini 2014 [20] 1.5 T,Siemens
Stress/rest Dipyridamole Gadopentate (Magnevist) 0.005 mmol/kgfollowed by0.1 mmol/kg
saturation recovery hybrid echo-planar
Motwani 2014 [42] 3.0 T,Philips
Stress/rest Adenosine Gadobutrol (Gadovist) 0.075 mmol/kg 3D spoiled turbo gradient-echo
Yun 2015 [43] 3.0 T,Philips
Stress/rest Dipyridamole Gadobenate Dimeglumine(Multihance)
0.05 mmol/kg saturation recovery gradient-echoT1-weighted
Pan 2015 [44] 3.0 T,Siemens
Stress/rest Adenosine Gadobutrol (Gadovist) 0.075 mmol/kg T1-weighted saturation recoveryturbo flash
Papanastasiou 2016 [45] 3.0 T,Siemens
Stress/rest Adenosine Gadobutrol (Gadovist) 0.05 mmol/kg Turbo-fast low saturation recoverysingle-shot gradient echo
van Dijk et al. Journal of Cardiovascular Magnetic Resonance (2017) 19:92 Page 6 of 16
DiscussionSummary of evidenceThe pooled diagnostic accuracy for segment-, territory- andpatient-based analyses showed good diagnostic perform-ance. The diagnostic accuracy of CMR perfusion analysishas been assessed in previous meta-analyses [13, 15–18].
However, this meta-analysis is the first focusing on thesemi-quantitative and quantitative analysis of the SI-curves.The diagnostic accuracy of CMR perfusion (pooled for vis-ual, semi-quantitative, and quantitative analysis) reported inthe earlier meta-analyses range from AUC 0.90 to 0.94 [13,15–18]. When comparing our results, the SI-curve based
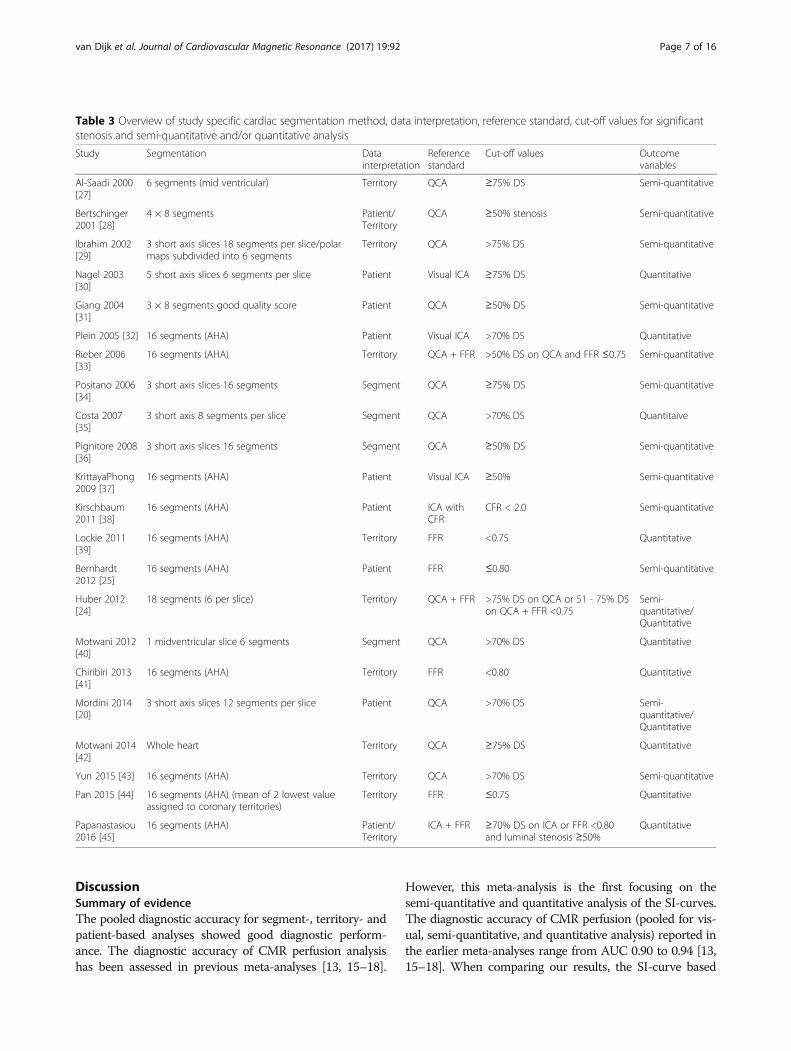
Table 3 Overview of study specific cardiac segmentation method, data interpretation, reference standard, cut-off values for significantstenosis and semi-quantitative and/or quantitative analysis
Study Segmentation Datainterpretation
Referencestandard
Cut-off values Outcomevariables
Al-Saadi 2000[27]
6 segments (mid ventricular) Territory QCA ≥75% DS Semi-quantitative
Bertschinger2001 [28]
4 × 8 segments Patient/Territory
QCA ≥50% stenosis Semi-quantitative
Ibrahim 2002[29]
3 short axis slices 18 segments per slice/polarmaps subdivided into 6 segments
Territory QCA >75% DS Semi-quantitative
Nagel 2003[30]
5 short axis slices 6 segments per slice Patient Visual ICA ≥75% DS Quantitative
Giang 2004[31]
3 × 8 segments good quality score Patient QCA ≥50% DS Semi-quantitative
Plein 2005 [32] 16 segments (AHA) Patient Visual ICA >70% DS Quantitative
Rieber 2006[33]
16 segments (AHA) Territory QCA + FFR >50% DS on QCA and FFR ≤0.75 Semi-quantitative
Positano 2006[34]
3 short axis slices 16 segments Segment QCA ≥75% DS Semi-quantitative
Costa 2007[35]
3 short axis 8 segments per slice Segment QCA >70% DS Quantitaive
Pignitore 2008[36]
3 short axis slices 16 segments Segment QCA ≥50% DS Semi-quantitative
KrittayaPhong2009 [37]
16 segments (AHA) Patient Visual ICA ≥50% Semi-quantitative
Kirschbaum2011 [38]
16 segments (AHA) Patient ICA withCFR
CFR < 2.0 Semi-quantitative
Lockie 2011[39]
16 segments (AHA) Territory FFR <0.75 Quantitative
Bernhardt2012 [25]
16 segments (AHA) Patient FFR ≤0.80 Semi-quantitative
Huber 2012[24]
18 segments (6 per slice) Territory QCA + FFR >75% DS on QCA or 51 - 75% DSon QCA + FFR <0.75
Semi-quantitative/Quantitative
Motwani 2012[40]
1 midventricular slice 6 segments Segment QCA >70% DS Quantitative
Chiribiri 2013[41]
16 segments (AHA) Territory FFR <0.80 Quantitative
Mordini 2014[20]
3 short axis slices 12 segments per slice Patient QCA >70% DS Semi-quantitative/Quantitative
Motwani 2014[42]
Whole heart Territory QCA ≥75% DS Quantitative
Yun 2015 [43] 16 segments (AHA) Territory QCA >70% DS Semi-quantitative
Pan 2015 [44] 16 segments (AHA) (mean of 2 lowest valueassigned to coronary territories)
Territory FFR ≤0.75 Quantitative
Papanastasiou2016 [45]
16 segments (AHA) Patient/Territory
ICA + FFR ≥70% DS on ICA or FFR <0.80and luminal stenosis ≥50%
Quantitative
van Dijk et al. Journal of Cardiovascular Magnetic Resonance (2017) 19:92 Page 7 of 16

Table 4 Pooled diagnostic accuracy of semi-quantitative and quantitative CMR perfusion analysis on segmental, territory, and perpatient basis (bold) and subgroup analysis of anatomical/functional reference standard or semi-quantitative/quantitative analysis(unbold)
No.Studies
No.S/T/P
Sensitivity Q-statisticsp-valuea
I2b Specificity Q-statisticsp-valuea
I2b PLR NLR DOR AUC
PerSegment
4 3838 0.88(0.82–0.93)
0.00 82.04 0.72(0.56–0.84)
0.00 96.23 3.1(1.0–5.10)
0.16(0.10–0.26)
19(9–40)
0.90(0.870.92)
Per territory 12 1058 0.82(0.77–0.86)
0.49 0.00 0.83(0.74–0.90)
0.00 90.68 5.0(3.1–7.9)
0.22(0.17–0.29)
23(12–44)
0.84(0.81–0.87)
Anatomicalreference
5 370 0.85(0.78–0.90)
0.49 0.00 0.83(0.72–0.91)
0.00 78.11 5.1(2.9–9.2)
0.18(0.12–0.27)
28(13–63)
0.86(0.83–0.89)
Functionalreference
7 688 0.77(0.63–0.86)
0.00 86.70 0.85(0.73–0.92)
0.00 93.19 5.1(2.5–10.3)
0.28(0.16–0.48)
18(6–59)
0.88(0.84–0.90)
Semi-quantitative
6 343 0.77(0.60–0.88)
0.00 86.96 0.84(0.76–0.89)
0.30 17.10 4.7(2.9–7.8)
0.28(0.15–0.53)
17(6–50)
0.87(0.84–0.90)
Quantitative 6 729 0.77(0.62–0.87)
0.00 89.39 0.86(0.72–0.94)
0.00 94.92 5.5(2.4–12.6)
0.27(0.14–0.49)
21(6–8)
0.88(0.85–0.91)
Per patient 10 566 0.83(0.75–0.88)
0.01 60.71 0.76(0.65–0.85)
0.00 66.27 3.5(2.2–5.5)
0.23(0.14–0.36)
15(6–36)
0.87(0.84–0.90)
aQ statistic p-value <0.10 and/or bI2 > 50% is considered to indicate heterogeneity. Subgroup analysis was performed when ≥5 studies were available
Fig. 2 Forest plot of per segment sensitivity and specificity of both semi-quantitative and quantitative CMR perfusion analysis against anatomicaland functional reference standards. Significant heterogeneity was defined as Q-statistic p < 0.10 and/or I2 > 50%
van Dijk et al. Journal of Cardiovascular Magnetic Resonance (2017) 19:92 Page 8 of 16

analysis of CMR perfusion does not lead to an increase inthe diagnostic accuracy as compared to the combined diag-nostic accuracy of CMR perfusion as reported in these pre-vious papers. Visual analysis of CMR perfusion does notyield lower diagnostic accuracy. This is possibly due to thefact that visual observations are made upon fewer and lesscomplex assumptions than both the semi-quantitative andquantitative analysis methods that are used. Both semi-quantitative and quantitative perfusion analysis are basedon SI-curves and calculate a derivative of myocardial bloodflow based on certain assumptions. The models used forquantitative analysis are mathematical representations of aphysiological process and rely on assumptions made aboutthe dynamic of contrast and blood plasma and pre-existingknowledge about the physiologic process and model dy-namics. In these models it is assumed that there is no diffu-sion of contrast medium into the intracellular space.Unfortunately, only in a few specific contrast agents this isthe case. Different models are used for CMR perfusion ana-lysis, with different degrees of complexity, and the optimalmodel is yet to be determined. The complexity of this mod-eling process, the many assumptions made and thereby theselection of a suitable model makes model-dependent per-fusion analysis highly susceptible to error and with incon-sistent results as a consequence. The use of differentmodels with varying results could add to the heterogeneityin the quantitative analysis group. Semi-quantitative ana-lysis, although in theory inferior to quantitative analysis, isa relatively simple method to estimate perfusion. The lowcomplexity of these methods make it a robust method,
allowing for less variation among research groups. As visualCMR perfusion analysis is relatively simple as compared toeither semi-quantitative and/or quantitative CMR perfusionanalysis, it is possible that this method is less susceptible tomethodological errors (causing false conclusions). However,the methods used for assessing semi-quantitative CMR per-fusion also vary within studies. The large variation in bothsemi-quantitative and quantitative CMR perfusion postprocessing techniques make it challenging to make anaccurate comparison due to extensive inter-study hetero-geneity. We compared the diagnostic accuracy of semi-quantitative and quantitative CMR perfusion analysis on aper territory basis and observed that the diagnostic accur-acy slightly decreased using quantitative analysis (AUC of0.87(0.83–0.89) compared to 0.81(0.78–0.85)). This is pos-sibly due to the fact that quantitative analysis is based onmultiple assumptions.If the noninvasive MPI techniques are to be used as a
gatekeeper for further diagnosis and treatment it is im-portant to select a modality in which the amount of falsenegative results is low to assure that patients with sig-nificant disease are not missed. This requires the sensi-tivity of the gatekeeper test to be high. We were alsoperformed subgroup analyses in the per territory group,based on the reference standards used. The anatomicalreference standards merely depict the presence orabsence of epicardial coronary stenosis (visual invasivecoronary angiography, QCA), whereas the functional ref-erence standards contained functional information on ei-ther pressure drop across the stenosis (FFR).Our results show similar diagnostic accuracy when
anatomical reference standards were used (0.85(0.82–0.88)) as compared to the diagnostic accuracy of SI-curve analysis with the use of functional referencestandards (0.82(0.79–0.86)) in the per territory analysis.For the anatomical reference standard, a DS >50, >70%
or >75% were generally used as the cut-off value for sig-nificant CAD in both QCA and visual angiographic as-sessment. For the functional reference standard, a FFRof either <0.75 or <0.8 were used to indicate significantCAD. The accuracy of the anatomical reference stan-dards as well as the currently used gold standard forfunctional reference of invasive coronary angiography+/− FFR for determining flow limiting CAD are debat-able. Furthermore, pooling of the different threshold alsoincreases heterogeneity in this meta-analysis. Previousresearch has shown that the anatomical presence of astenosis, with cut-off values of either >50% DS or >70%DS have a poor correlation with FFR [1]. The use of thefunctional FFR measurement to guide therapy hasproven to be superior as compared to anatomical assess-ment alone [2]. The FFR measurement is based on themeasurement of a pressure drop across an epicardialvessel pre- and post-stenosis and a value of either <0.75
Fig. 3 Summary receiver operating curve of the diagnosticperformance of segmental semi-quantitative and quantitative CMRperfusion analysis
van Dijk et al. Journal of Cardiovascular Magnetic Resonance (2017) 19:92 Page 9 of 16

or a more liberal cut-off of <0.8 is used to indicate afunctionally significant epicardial stenosis. However,what both the anatomical reference standard and thefunctional FFR measurement ignore microvasculatureperfusion defects and the assumptions of a linear rela-tionship between increasing stenosis or decreasing pres-sure with decreasing flow is made. To better understandthe myocardial perfusion, van de Hoef et al. aimed to de-termine the relationship between invasively measuredFFR and coronary flow reserve. The results of this studyindicate a non-linear relationship between FFR (pressuredrop information) and coronary flow reserve (flow infor-mation). The authors conclude that the disagreementbetween FFR and coronary flow reserve is caused by theinvolvement of the microvasculature and this indicatesthat the functional FFR measurement is not an accuraterepresentation of myocardial perfusion [26]. We believethat there is a trend towards a better understandingof the complex process of myocardial perfusion andthat the currently used reference standard as of yetfail to accurately represent myocardial perfusion. Theneed for a well validated and robust measurementtechnique for measuring myocardial perfusion is ne-cessary and this technique might be used in the
SENSITIVITY (95% CI)
Q = 10.45, df = 11.00, p = 0.40
I2 = 0.00 [0.00 − 87.51]
0.82[0.77 − 0.86]
0.90 [0.79 − 0.96]
0.81 [0.58 − 0.95]
0.71 [0.42 − 0.92]
0.85 [0.55 − 0.98]
0.79 [0.58 − 0.93]
0.92 [0.62 − 1.00]
0.75 [0.43 − 0.95]
0.79 [0.62 − 0.91]
0.84 [0.69 − 0.94]
0.83 [0.59 − 0.96]
0.80 [0.67 − 0.90]
0.69 [0.48 − 0.86]
StudyId
COMBINED
Al−Saadi 2000 (25)
Bertschinger 2001 (26)
Ibrahim 2002 (27)
Rieber 2006 (31)
Lockie 2011 (37)
Huber 2012 Q (39)
Huber 2012 SQ (39)
Chiribiri 2013 (41)
Motwani 2014 (43)
Yun 2015 (44)
Pan 2015 (45)
Papanastasiou 2016 (46)
0.0 0.2 0.4 0.6 0.8 1.0
SENSITIVITY
SPECIFICITY (95% CI)
Q =118.07, df = 11.00, p = 0.00
I2 = 90.68 [86.66 − 94.70]
0.83[0.74 − 0.90]
0.83 [0.69 − 0.93]
0.75 [0.35 − 0.97]
0.89 [0.78 − 0.95]
0.90 [0.73 − 0.98]
0.89 [0.81 − 0.95]
0.91 [0.59 − 1.00]
0.82 [0.48 − 0.98]
0.95 [0.90 − 0.98]
0.93 [0.84 − 0.98]
0.63 [0.46 − 0.77]
0.58 [0.50 − 0.66]
]0.59 [0.43 − 0.73
StudyId
COMBINED
Al−Saadi 2000 (25)
Bertschinger 2001 (26)
Ibrahim 2002 (27)
Rieber 2006 (31)
Lockie 2011 (37)
Huber 2012 Q (39)
Huber 2012 SQ (39)
Chiribiri 2013 (41)
Motwani 2014 (43)
Yun 2015 (44)
Pan 2015 (45)
Papanastasiou 2016 (46)
0.0 0.2 0.4 0.6 0.8 1.0
SPECIFICITY
Fig. 4 Forest plot of per territory sensitivity and specificity of both semi-quantitative and quantitative perfusion analysis against anatomical andfunctional reference standards. Significant heterogeneity was defined as Q-statistic p < 0.10 and/or I2 > 50%
Fig. 5 Summary receiver operating curve of the diagnostic performanceof territory based semi-quantitative and quantitative CMR perfusion analysis
van Dijk et al. Journal of Cardiovascular Magnetic Resonance (2017) 19:92 Page 10 of 16

future as the gold standard. The inability of both theanatomical and functional reference standards to ac-curately represent myocardial blood flow might haveinfluenced the results and so the results of this meta-analysis should be interpreted with caution.Further research is necessary to determine the ideal
golden standard for myocardial perfusion. We emphasizethat it might be beneficial to first critically review phan-tom or ex-vivo research regarding the determination ofmyocardial perfusion in search for the measurementwhich represents true myocardial blood flow as accur-ately as possible.In our meta-analysis we found an extensive vari-
ation in study population, CMR protocols, post pro-cessing techniques, and reference standards used.The lack of standardized CMR perfusion protocolsor post processing techniques might have influencedour estimates of a lower diagnostic accuracy than ex-pected of semi-quantitative and quantitative CMRperfusion analysis as compared to visual assessment.The extensive heterogeneity between the study pro-tocols should be taken into account in the interpret-ation of these results. Standardization of the analysisprotocols is needed to make more generalizablerecommendations.
Future research should focus on the construction ofa quantitative model that accurately depicts physio-logical myocardial blood flow. The different quantitativemodels should be compared and validated within a well-structured standardized CMR perfusion protocol prefer-ably against a well validated perfusion method to deter-mine which of the models accurately describes theperfusion process. Specific cut-off values to distinguishbetween normal and ischemic myocardium should bedetermined, and CMR protocols should be calibratedbetween the different CMR scanners. Visual CMR per-fusion analysis alone is already highly accurate in the as-sessment of significant CAD and might also benefitfrom standardization of CMR protocols. The includedstudies reported results per segment, vessel territory orper patient. In this study we chose to include all threegroups and report the results separately. However, itshould be noted that a per segment based analysis holdsmore anatomical value since CAD often involves only spe-cific coronary branches and not an entire vessel, affectingan entire vessel territory. This could have resulted in alower diagnostic accuracy for the territory based results.The per territory analysis however, has a high clinicalvalue since intervention more likely target the main cor-onary vessels instead of the secondary branches.
SENSITIVITY (95% CI)
Q = 22.91, df = 9.00, p = 0.01
I2 = 60.71 [33.52 − 87.90]
0.83[0.75 − 0.88]
0.70 [0.50 − 0.86]
0.86 [0.72 − 0.95]
0.88 [0.77 − 0.95]
0.89 [0.75 − 0.97]
0.96 [0.82 − 1.00]
0.62 [0.38 − 0.82]
0.90 [0.70 − 0.99]
0.87 [0.66 − 0.97]
0.70 [0.47 − 0.87]
0.67 [0.41 − 0.87]
StudyId
COMBINED
Bertschinger 2001 (26)
Nagel 2003 (28)
Plein 2005 (30)
KrittayaPhong 2009 (35)
Kirschbaum 2011 (36)
Bernhardt 2012 1.5T (38)
Bernhardt 2012 3.0T (38)
Mordini 2014 SQ (20)
Mordini 2014 Q (20)
Papanastasiou 2016 (46)
0.0 0.2 0.4 0.6 0.8 1.0
SENSITIVITY
SPECIFICITY (95% CI)
Q = 26.68, df = 9.00, p = 0.00
I2 = 66.27 [43.69 − 88.85]
0.76[0.65 − 0.85]
0.40 [0.16 − 0.68]
0.83 [0.68 − 0.93]
0.85 [0.69 − 0.94]
0.79 [0.59 − 0.92]
0.77 [0.55 − 0.92]
0.77 [0.46 − 0.95]
1.00 [0.75 − 1.00]
0.68 [0.52 − 0.81]
0.84 [0.70 − 0.93]
0.33 [0.04 − 0.78]
StudyId
COMBINED
Bertschinger 2001 (26)
Nagel 2003 (28)
Plein 2005 (30)
KrittayaPhong 2009 (35)
Kirschbaum 2011 (36)
Bernhardt 2012 1.5T (38)
Bernhardt 2012 3.0T (38)
Mordini 2014 SQ (20)
Mordini 2014 Q (20)
Papanastasiou 2016 (46)
0.0 0.2 0.4 0.6 0.8 1.0
SPECIFICITY
Fig. 6 Forest plot of per patient sensitivity and specificity of both semi-quantitative and quantitative perfusion analysis against anatomical and functionalreference standards. Significant heterogeneity was defined as Q-statistic p < 0.10 and/or I2 > 50%
van Dijk et al. Journal of Cardiovascular Magnetic Resonance (2017) 19:92 Page 11 of 16

LimitationsThe main limitations for this meta-analysis is the smallnumber of studies available regarding either segment,territory or patient based semi-quantitative or quantita-tive analysis of SI-curves in the assessment of myocar-dial perfusion using CMR and the wide variety of CMRprotocols used in these studies. This resulted in a highdegree of heterogeneity and possible bias making inter-study comparison difficult. Furthermore, there was anoverrepresentation of male patients in the includedstudies. This limitation makes the findings lessgeneralizable for women. We also decided not to in-clude visual CMR perfusion analysis as the diagnosticaccuracy of this assessment has been assessed in previ-ous meta-analyses and our aim was to explore the diag-nostic accuracy of SI-curve based assessment.Another limitation regarding this meta-analysis are
the wide variety of reference standards used. We de-cided to pool all reference standards used to provide a
Fig. 8 Deeks’ funnel plots of the studies on per segment (a), per territory (b), and per patient (c) basis. P-value <0.05 indicative of publication biasor systematic difference between results of larger and smaller studies
Fig. 7 Summary receiver operating curve of the diagnosticperformance of patient based semi-quantitative and quantitativeCMR perfusion analysis
Fig. 9 Deeks’ funnel plots of the subgroup analysis on per territorybasis with anatomical reference standard (a), functional referencestandard (b), semi-quantitative analysis (c), and quantitative analysis(d). P-value <0.05 indicative of publication bias or systematic differ-ence between results of larger and smaller studies
van Dijk et al. Journal of Cardiovascular Magnetic Resonance (2017) 19:92 Page 12 of 16

more complete overview of the evidence regarding SI-curve analysis during CMR perfusion. For our subgroupanalysis we decided to group reference standards on ei-ther providing anatomical or functional information andobserved a difference in diagnostic accuracy when usingeither anatomical or functional reference standards.We conclude that the reference standard used has
an influence on the diagnostic accuracy of SI-curveCMR-perfusion analysis and discussed the unclear re-lationship of both currently used anatomical and
functional reference standards with myocardial flowand perfusion.
ConclusionsThis meta-analysis provides an overview of 23 originalstudies reporting on the diagnostic accuracy of semi-quantitative or quantitative analysis of stress CMR perfu-sion on a per segment, per territory or per patient basisfor the assessment of significant CAD. Based on our re-sults we conclude that due to a high degree of inter-study
Fig. 10 Summary of the risk of bias and applicability concerns across the included studies as assessed with QUADAS-2 forms by the reviewers
van Dijk et al. Journal of Cardiovascular Magnetic Resonance (2017) 19:92 Page 13 of 16

heterogeneity the real value of signal intensity curve basedanalyses of stress CMR perfusion still remains unclear.Semi-quantitative analysis showed a higher diagnosticaccuracy for per territory analysis in this meta-analysis,possibly because it is less complex and less susceptible tofalse assumptions during the calculation. However, quanti-tative analysis still shows the potential to be used for abso-lute quantification of myocardial blood flow and furtherstudies should be performed to determine the quantitativemodel that best represent true myocardial blood flow. Thestandardization and validation of semi-quantitative orquantitative stress CMR perfusion is necessary before itcan be safely implemented in clinical practice.
AbbreviationsAUC: Area under the curve; CAD: Coronary artery disease;CMR: Cardiovascular magnetic resonance; CT: Computed tomography;DOR: Diagnostic odds ratio; FFR: Fractional flow reserve; FN: False negative;FP: False positive; LVEF: Left ventricular ejection fraction; MBF: Myocardialblood flow; MPI: Myocardial perfusion imaging; PET: Positron emissiontomography; QCA: Quantitative coronary angiography; SI: Signal intensity;
SPECT: Single-photon emission computed tomography; sROC: Summaryreceiver operating curve; TAC: Tissue attenuation curve; TN: True negative;TP: True positive
AcknowledgementsN/A.
FundingNo funding.
Availability of data and materialsThe datasets used and/or analysed during the current study are availablefrom the corresponding author on reasonable request.
Authors’ contributionsRvD and MvA equally contributed to this manuscript. RvD and MvA wereresponsible for the data acquisition and writing the manuscript. GHdB, RvDand MvA were responsible for the statistical method behind the analysis.GHdB, RV, PvdH and MO were major contributors in interpretation of thedata and in revising the manuscript. All authors read and approved the finalmanuscript.
Ethics approval and consent to participateThis meta-analysis was performed in concordance with the Preferred Report-ing Items for Systematic Reviews and Meta-analyses (PRISMA) statement and
Fig. 11 Risk of bias and applicability concerns assessment with an overview of the reviewers judgment about each separate domain for eachincluded study
van Dijk et al. Journal of Cardiovascular Magnetic Resonance (2017) 19:92 Page 14 of 16

was registered at PROSPERO (http://www.crd.york.ac.uk/PROSPERO/display_r-ecord.asp?ID=CRD42016040176) under registration number: 42016040176).No ethical approval or consent was needed for this study.
Consent for publicationNot applicable.
Competing interestsThe authors declare that they have no competing interests.
Publisher’s NoteSpringer Nature remains neutral with regard to jurisdictional claims inpublished maps and institutional affiliations.
Author details1Center for Medical Imaging, University Medical Center Groningen, Universityof Groningen, Hanzeplein 1 EB 45, Groningen, The Netherlands. 2Departmentof Radiology, University Medical Center Groningen, University of Groningen,Groningen, The Netherlands. 3Department of Cardiology, University MedicalCenter Groningen, University of Groningen, Groningen, The Netherlands.4Department of Epidemiology, University Medical Center Groningen,University of Groningen, Groningen, The Netherlands.
Received: 13 June 2017 Accepted: 9 October 2017
References1. Christou MAC, Siontis GCM, Katritsis DG, Ioannidis JPA. Meta-analysis of fractional
flow reserve versus quantitative coronary angiography and noninvasive imagingfor evaluation of myocardial ischemia. Am J Cardiol. 2007;99(4):450–6.
2. Tonino PAL, Fearon WF, De Bruyne B, Oldroyd KG, Leesar MA, Ver Lee PN,et al. Angiographic versus functional severity of coronary artery Stenoses inthe FAME study. Fractional flow reserve versus angiography in multivesselevaluation. J Am Coll Cardiol. 2010;55(25):2816–21.
3. Hamon MM, Fau G, Née G, Ehtisham J, Morello R, Hamon MM, et al.Meta-analysis of the diagnostic performance of stress perfusioncardiovascular magnetic resonance for detection of coronary artery disease.J Cardiovasc Magn Reson. 2010;56(3):29.
4. Montalescot G, Sechtem U, Achenbach S, Andreotti F, Arden C, Budaj A,et al. 2013 ESC guidelines on the management of stable coronary arterydisease. Eur Heart J. 2013;34(38):2949–3003.
5. Fihn SD, Blankenship JC, Alexander KP, Bittl JA, Byrne JG, Fletcher BJ, et al. 2014ACC/AHA/AATS/PCNA/SCAI/STS focused update of the guideline for thediagnosis and Management of Patients with Stable Ischemic Heart Disease: AReport of the American College of Cardiology /American Heart AssociationTask Force on Practice Cardiovascul. Circulation. 2014;130:1749–67.
6. Pijls NHJ, De Bruyne B, Peels K, Van Der Voort PH, Bonnier HJRM,Bartunek J, Koolen JJ, et al. Measurement of fractional flow reserve toassess the functional severity of coronary-artery Stenoses. N Engl J Med.1996;334(26):1703–8.
7. Jolly SS, Yusuf S, Cairns J, Niemel K, Xavier D, Widimsky P, et al. Radial versusfemoral access for coronary angiography and intervention in patients withacute coronary syndromes (RIVAL): a randomised, parallel group,multicentre trial. Lancet. 2011;377(9775):1409–20.
8. Arora N, Matheny ME, Sepke C, Resnic FS. A propensity analysis of the riskof vascular complications after cardiac catheterization procedures with theuse of vascular closure devices. Am Heart J. 2007;153(4):606–11.
9. Noto TJ, Johnson L, Krone R. Cardiac catheterization 1990: a report of theRegistryt of the Society for Cardiac Angiography and Intervention s(SCA&!).Catheter Cardiovasc Diagn. 1991;24:75–83.
10. Bokhari S, Raina A, Rosenweig EB, Schulze PC, Bokhari J, Einstein AJ, et al.PET imaging may provide a novel biomarker and understanding of rightventricular dysfunction in patients with idiopathic pulmonary arterialhypertension. Circ Cardiovasc Imaging. 2011;4(6):641–7.
11. Einstein AJ. Radiation risk from coronary artery disease imaging: how dodifferent diagnostic tests compare? Heart. 2008;94(12):1519–21.
12. Patel MR, Peterson ED, Dai D, Brennan JM, Redberg RF, Anderson HV, et al.Low diagnostic yield of elective coronary angiography. N Engl J Med. 2010;362(10):886–95.
13. Takx RAP, Blomberg BA, Aidi HE, Habets J, de Jong PA, Nagel E, et al.Diagnostic accuracy of stress myocardial perfusion imaging compared to
invasive coronary angiography with fractional flow reserve meta-analysis.Circ Cardiovasc Imaging. 2015;8(1):e002666.
14. Einstein AJ. Effects of radiation exposure from cardiac Imaging : how goodare the data? J Am Coll Cardiol. 2012;59(6):553–65.
15. Nandalur KR, Dwamena BA, Choudhri AF, Nandalur MR, Carlos RC.Diagnostic performance of stress cardiac magnetic resonance imaging inthe detection of coronary artery disease: a meta-analysis. J Am Coll Cardiol.2007;50(14):1343–53.
16. Hamlin SA, Henry TS, Little BP, Lerakis S, Stillman AE. Mapping the future ofcardiac MR imaging: case-based review of T1 and T2 mapping techniques.Radiographics. 2014;34(6):1594–611.
17. Desai RR, Jha S. Diagnostic performance of cardiac stress perfusion mri inthe detection of coronary artery disease using fractional flow reserve as thereference standard: a meta-analysis. Am J Roentgenol. 2013;201(2):245–52.
18. Li M, Zhou T, Yang L, Peng Z, Ding J, Sun G, et al. Diagnostic accuracy ofmyocardial magnetic resonance perfusion to diagnose ischemic Stenosiswith fractional flow reserve as reference. JACC Cardiovasc Imaging. 2014;7(11):1098–105.
19. Ebersberger U, Makowski MR, Schoepf UJ, Platz U, Schmidtler F, Rose J, et al.Magnetic resonance myocardial perfusion imaging at 3.0 Tesla for theidentification of myocardial ischaemia: comparison with coronary catheterangiography and fractional flow reserve measurements. Eur Heart JCardiovasc Imaging. 2013;14(12):1174–80.
20. Mordini FE, Haddad T, Hsu L-YY, Kellman P, Lowrey TB, Aletras AH, et al.Diagnostic accuracy of stress perfusion CMR in comparison withquantitative coronary angiography: fully quantitative, semiquantitative, andqualitative assessment. JACC Cardiovasc Imaging. 2014;7(1):14–22.
21. Handayani A, Sijens PE, Lubbers DD, Triadyaksa P, Oudkerk M, vanOoijen PMA, et al. Influence of the choice of software package on theoutcome of semiquantitative MR myocardial perfusion analysis.Radiology. 2013;266(3):759–65.
22. Handayani A, Triadyaksa P, Dijkstra H, Pelgrim GJ, van Ooijen PM,Prakken NH, et al. Intermodel agreement of myocardial blood flowestimation from stress-rest myocardial perfusion magnetic resonanceimaging in patients with coronary artery disease. Investig Radiol. 2015;50(4):275–82.
23. Whiting PF, Rutjes AWS, Westwood ME, Mallet S, Deeks JJ, Reitsma JB, et al.Research and reporting methods accuracy studies. Ann Intern Med. 2011;155(4):529–36.
24. Huber A, Sourbron S, Klauss V, Schaefer J, Bauner KU, Schweyer M,et al. Magnetic resonance perfusion of the myocardium:semiquantitative and quantitative evaluation in comparison withcoronary angiography and fractional flow reserve. Investig Radiol.2012;47(6):332–8.
25. Bernhardt P, Walcher T, Rottbauer W, Wöhrle J, Wohrle J, Wöhrle J.Quantification of myocardial perfusion reserve at 1.5 and 3.0 tesla: acomparison to fractional flow reserve. Int J Cardiovasc Imaging. 2012;28(8):2049–56.
26. Van De Hoef TP, Van Lavieren MA, Damman P, Delewi R, Piek MA,Chamuleau SAJ, et al. Physiological basis and long-term clinical outcome ofdiscordance between fractional flow reserve and coronary flow velocityreserve in coronary stenoses of intermediate severity. Circ Cardiovasc Interv.2014;7(3):301–11.
27. Al-Saadi N, Nagel E, Gross M, Bornstedt A, Schnackenburg B, Klein C, et al.Noninvasive detection of myocardial ischemia from perfusion reserve basedon cardiovascular magnetic resonance. Circulation. 2000;101(12):1379–83.
28. Bertschinger KM, Nanz D, Buechi M, Luescher TF, Marincek B, von SchulthessGK, et al. Magnetic resonance myocardial first-pass perfusion imaging:parameter optimization for signal response and cardiac coverage. J MagnReson Imaging. 2001;14(5):556–62.
29. Ibrahim T, Nekolla SG, Schreiber K, Odaka K, Volz S, Mehilli J, et al. Assessmentof coronary flow reserve: comparison between contrast-enhanced magneticresonance imaging and positron emission tomography. J Am Coll Cardiol.2002;39(5):864–70.
30. Nagel E, Klein C, Paetsch I, Hettwer S, Schnackenburg B, Wegscheider K,et al. Magnetic resonance perfusion measurements for the noninvasivedetection of coronary artery disease. Circulation. 2003;108(4):432–7.
31. Giang TH, Nanz D, Coulden R, Friedrich M, Graves M, Al-Saadi N, et al.Detection of coronary artery disease by magnetic resonance myocardialperfusion imaging with various contrast medium doses: first Europeanmulti-centre experience. Eur Heart J. 2004;25(18):1657–65.
van Dijk et al. Journal of Cardiovascular Magnetic Resonance (2017) 19:92 Page 15 of 16

32. Plein S, Radjenovic A, Ridgway JP, Barmby D, Greenwood JP, Ball SG,et al. Coronary artery disease: myocardial perfusion MR imaging withsensitivity encoding versus conventional angiography. Radiology. 2005;235(2):423–30.
33. Rieber J, Huber A, Erhard I, Mueller S, Schweyer M, Koenig A, et al. Cardiacmagnetic resonance perfusion imaging for the functional assessment ofcoronary artery disease: a comparison with coronary angiography andfractional flow reserve. Eur Heart J. 2006;27(12):1465–71.
34. Positano V, Pingitore A, Scattini B, Santarelli MF, De Marchi D, Favilli B, et al.Myocardial perfusion by first pass contrast magnetic resonance: a robustmethod for quantitative regional assessment of perfusion reserve index.Heart. 2006;92(5):689–90.
35. Costa MA, Shoemaker S, Futamatsu H, Klassen C, Angiolillo DJ, Nguyen M, et al.Quantitative magnetic resonance perfusion imaging detects anatomic andphysiologic coronary artery disease as measured by coronary angiography andfractional flow reserve. J Am Coll Cardiol. 2007;50(6):514–22.
36. Pingitore A, Lombardi M, Scattini B, De Marchi D, Aquaro GD, Positano V,et al. Head to head comparison between perfusion and function duringaccelerated high-dose dipyridamole magnetic resonance stress for thedetection of coronary artery disease. Am J Cardiol. 2008;101(1):8–14.
37. Krittayaphong R, Boonyasirinant T, Saiviroonporn P, Nakyen S,Thanapiboonpol P, Yindeengam A, et al. Myocardial perfusion cardiacmagnetic resonance for the diagnosis of coronary artery disease: do weneed rest images? Int J Cardiovasc Imaging. 2009;25(Suppl 1):139–48.
38. Kirschbaum SW, Nieman K, Springeling T, Weustink AC, Ramcharitar S, vanMieghem C, et al. Non-invasive diagnostic workup of patients with suspectedstable angina by combined computed tomography coronary angiography andmagnetic resonance perfusion imaging. Circ J. 2011;75(7):1678–84.
39. Lockie T, Ishida M, Perera D, Chiribiri A, De Silva K, Kozerke S, et al.High-resolution magnetic resonance myocardial perfusion imaging at3.0-Tesla to detect hemodynamically significant coronary stenoses asdetermined by fractional flow reserve. J Am Coll Cardiol. 2011;57(1):70–5.
40. Motwani M, Fairbairn TA, Larghat A, Mather AN, Biglands JD, Radjenovic A,et al. Systolic versus diastolic acquisition in myocardial perfusion MRimaging. Radiology. 2012;262(3):816–23.
41. Chiribiri A, Hautvast GLTF, Lockie T, Schuster A, Bigalke B, Olivotti L, et al.Assessment of coronary artery stenosis severity and location: quantitativeanalysis of transmural perfusion gradients by high-resolution MRI versusFFR. JACC Cardiovasc Imaging. 2013;6(5):600–9.
42. Motwani M, Kidambi A, Sourbron S, Fairbairn TA, Uddin A, Kozerke S, et al.Quantitative three-dimensional cardiovascular magnetic resonancemyocardial perfusion imaging in systole and diastole. J Cardiovasc MagnReson. 2014;16:19.
43. Yun C-H, Tsai J-P, Tsai C-T, Mok GSP, Sun J-Y, Hung C-L, et al. Qualitativeand semi-quantitative evaluation of myocardium perfusion with 3 T stresscardiac MRI. BMC Cardiovasc Disord. 2015;15(1):164.
44. Pan J, Huang S, Lu Z, Li J, Wan Q, Zhang J, et al. Comparison of myocardialTransmural perfusion gradient by magnetic resonance imaging to fractionalflow Reserve in Patients with Suspected Coronary Artery Disease. Am JCardiol. 2015;115(10):1333–40.
45. Papanastasiou G, Williams MC, Dweck MR, Alam S, Cooper A, Mirsadraee S,et al. Quantitative assessment of myocardial blood flow in coronary arterydisease by cardiovascular magnetic resonance: comparison of Fermi anddistributed parameter modeling against invasive methods. J CardiovascMagn Reson 2016;18:57.
• We accept pre-submission inquiries
• Our selector tool helps you to find the most relevant journal
• We provide round the clock customer support
• Convenient online submission
• Thorough peer review
• Inclusion in PubMed and all major indexing services
• Maximum visibility for your research
Submit your manuscript atwww.biomedcentral.com/submit
Submit your next manuscript to BioMed Central and we will help you at every step:
van Dijk et al. Journal of Cardiovascular Magnetic Resonance (2017) 19:92 Page 16 of 16

![, Helpdesk CCTV Kit - iget.eu · CCTV Kit Helpdesk. ... 6\QFKURQL]DFH 6H]QDP ýtVOR NDQiOX 6H]QDP XGiORVWt ýDVRYi RVD](https://img.pdfslide.us/doc/110x75/5b8106b47f8b9a2b678b6853/-helpdesk-cctv-kit-igeteu-cctv-kit-helpdesk-6qfkurqldfh-6hqdp-ytvor.jpg)