Embed Size (px)
Citation preview
Central JSM Alzheimer’s Disease and Related Dementia
Cite this article: Sadowsky CH, Kerbage C, Tariot PN, Agronin M, Alva G, et al. (2014) Diagnosis of Alzheimer’s Disease through the Eye and its Correlation with Cognitive Tests and Brain Imaging. JSM Alzheimer’s Dis Related Dementia 1(2): 1008.
*Corresponding authorCarl H. Sadowsky , Premiere Research Institute, 4631 North Congress Avenue Suite 200, West Palm Beach, Florida, USA, Tel: 561-845-0500; E-mail:
Submitted: 12 June 2014
Accepted: 02 October 2014
Published: 06 October 2014
Copyright© 2014 Sadowsky et al.
OPEN ACCESS
Keywords•Alzheimer’s disease•Human lens•Beta-amyloid•Amyloid PET Imaging•Fluorescence spectroscopy
Research Article
Diagnosis of Alzheimer’s Disease through the Eye and its Correlation with Cognitive Tests and Brain ImagingCarl H. Sadowsky1*, Charles Kerbage2, Pierre N. Tariot3, Marc Agronin4, Gustavo Alva5, P. Murali Doraiswamy6, F. Darell Turner2, Dennis Nilan2, Anne Cameron2, Gerald D. Cagle2 and Paul D. Hartung2
1Premiere Research Institute and Nova SE University, USA2Cognoptix, Inc., USA3Banner Alzheimer’s Institute, USA4Miami Jewish Health Systems, USA5ATP Clinical Research Inc., USA6Departments of Psychiatry and Medicine and Duke Institute for Brain Sciences, Duke University Medical Center, USA
Abstract
Despite decades of research, there is no definite pre-mortem diagnosis for Alzheimer’s disease (AD). Clinical diagnosis of the disease, even with newer biomarkers such as CSF and amyloid PET is not considered definite; it can only be confirmed post-mortem through histopathological identification in the brain of its characteristic features including beta-amyloid (Aβ) plaques. There is a clear need for a technique capable of improving the in-vivo diagnosis of AD at early stages.
We review here our previously published clinical studies using a Fluorescent Ligand Eye Scanning (FLES) System to differentiate between patients with probable AD and healthy volunteers (HV) as well as some new analyses. FLES is a combination of a fluorescent ligand and a laser eye scanning device. The fluorescent ligand was dosed topically to the inside of the lower eyelid of the study eyes the evening before the day of the measurement with the device.
Our published phase 2 trial showed by clinical diagnosis, the AD and HV groups could be differentiated with sensitivity of 85% and specificity of 95%, (p<0.001). Further, all but five of the clinically diagnosed AD patients were amyloid PET positive and all but three of HV were amyloid negative supporting the validity of their diagnoses. In addition, the results in the eye showed significant correlation with the Standard Uptake Value ratios (SUVr) obtained by amyloid brain imaging Positron Emission Tomography (PET) using florbetapir. We also report here new analyses showing the correlations between FLES eye findings and cognitive tests, as well as the effect of apolipoprotein (APOE) gene.
ABBREVIATIONSAD: Alzheimer’s Disease; Aβ: Beta Amyloid; PET: Positron
Emission Tomography; HV: Healthy Volunteer
INTRODUCTIONThere is a clear need for a simple scalable point of care
(office based) technology capable of improving the diagnosis of Alzheimer’s disease (AD) with high resolution sensitivity and
specificity. The uncertainty in diagnosis is noted through the misdiagnosis rate in post mortem studies [1-5].
The definite diagnosis of AD is performed post mortem through histopathological changes in the brain and identification of abnormal aggregates of beta amyloid (Aβ) in the form of plaques and tau in the form of neurofibrillary tangles [6-8]. Improving Alzheimer’s disease diagnostic accuracy by detecting the presence of hallmark pathology (e.g. protein Aβ) in the brain
Central
Sadowsky et al. (2014)Email:
JSM Alzheimer’s Dis Related Dementia 1(2): 1008 (2014) 2/5
has been the major goal of brain imaging using amyloid and tau Positron Emission Tomography (PET) tracers [9-12]. AmyvidTM
(florbetapir F 18), VizamylTM (flutametamol), and NeuraceqTM
(florbetaben F18) are radioactive tracers, recently approved by the U.S. Food and Drug Administration for Positron Emission Tomography (PET) imaging of the brain estimating beta-amyloid plaque density in patients who are being evaluated for cognitive impairment. While Amyloid PET has a high negative predictive value for discriminating AD from non-amyloid dementias, the positive predictive value remains low for application at an individual patient level. Tau PET remains investigational at present. Further, the expense and radiation exposure from PET remain limitations for large scale application of PET for routine screening purposes or application in developing countries.
Detection of Aβ in the eye
Over the past decade, studies have demonstrated AD related molecular and pathological changes in the eye [13-24] and detected the presence of β−amyloid in the lens [14,17-19,22-24] and the retina [15,16, 20,21]. Frederikse et al. demonstrated that Alzheimer’s precursor protein (-APP) and A are present in the interior fiber cells of the mammalian ocular lens [17]. Such proteins are formed in -sheet arrays organized in an amyloid protein supramolecular order. Goldstein ετ αλ. identified A1-40 and A1-42 in the supranuclear region of the lens at similar concentrations levels as have been found in the brain [19].
Additional studies in transgenic mice and individuals with Down Syndrome support the hypothesis linking the AD-associated pathology in the brain and lens [22, 23]. Moreover, deep cortical cataract has been documented in transgenic mice expressing human Aβ [24].
A first exploratory clinical trial was conducted using FLES to compare 5 patients clinically diagnosed with probable AD to 5 healthy volunteers (HV). The study demonstrated the safety of the FLES technique [25]. Noting that the study included a small number of participants, sensitivity and specificity of 80% were obtained separating both groups.
Based on the promising exploratory study results, a larger study was performed in forty participants (20 probable AD and 20 HV). Both FLES and amyloid florbetapir F 18 PET imaging were performed for comparison with clinical diagnosis. The results have been published [26]. Our findings showed that the FLES was capable of differentiating two groups with sensitivity and specificity of 85% and 95 %, respectively.
The aims of this article are to report on additional analyses: 1) report on ROC curves for eye test versus PET amyloid imaging, 2) examine correlations of eye tests with clinical cognitive function tests, 3) examine correlation of eye tests with APOE e4 genotype.
MATERIALS AND METHODSDetailed Methods have been published previously [26]. The
study was conducted in accordance with the current revision of Declaration of Helsinki guiding physicians in medical research involving human subjects. The Western Institutional Review Board (IRB), Olympia, WA, approved the protocol to initiate the clinical trial. The participants provided their signed written consent form. Consent was obtained by subjects or their Legally
Authorized Representative should the subject not have the capacity to consent.
Study design
The study was an observer-masked, age-matched case control study of AD patients and HV [26]. The reader of the PET images was also masked as to the clinical diagnosis of the subject.
FLES System
The FLES system, as described previously [26] is a combination product of ligand-device that detects the fluorescent signature of the applied ligand bound to A in the supranucleus of the lens. The ligand, aftobetin hydrochloride, is an ophthalmic ointment that is applied topically to the eye. It measures the emitted fluorescence signal of aftobetin-HCl bound to Aβ aggregates in the supranuclear region of the lens. The device scans the supranucleus region of the lens in 1 second and provides a numerical output, which is referred as Fluorescence Uptake Value (FUV). Contrary to other techniques, the device does not require operator’s (expert) read or any analysis of images
Amyloid PET Imaging
PET imaging sessions were performed on all participants with AmyvidTM (Florbetapir F18), a radioactive tracer, used to estimate the A plaque density in patients’ brain and rate images as positive or negative, as described previously [27- 29].
PET image interpretation was performed by a single blinded, certified reader at Banner Alzheimer’s Institute. PET SUVR segmentation methods have been reported previously but in brief were based on coregistering with MRI and standardized template. For all analyses Global SUVR (average of 6 cortical regions) was used as the metric.
Statistical analysis
Receiver operating characteristics (ROC) analysis was used to determine the decision threshold, or level of separation, between the AD and HV groups. The threshold is set to obtain a balance between sensitivity and specificity and calculate the area under the curve (AUC). The same analysis was used in comparing results between the two methods FLES and PET. The Cohen’s kappa coefficient (κ ) was calculated as a statistical measure for the agreement between the results obtained by the either PET or FLES and the clinical diagnosis of AD.
Detailed entry criteria have been described previously [26] and in brief were as follows:
Inclusion Criteria for AD subjects
o Clinical Dementia Rating (CDR) between 0.5 and 2, with a rating of at least 1 on the memory sub-scale
o Mini-Mental State Exam (MMSE) score between 14 and 24 inclusive
o National Institute of Neurological and Communicative Disorders and Stroke-Alzheimer’s Disease and Related Disorder Association (NINCDS-ADRDA) criteria for Probable AD
o Diagnostic and Statistical Manual-IV (DSM-IV) criteria for Dementia of the Alzheimer’s Type
Central
Sadowsky et al. (2014)Email:
JSM Alzheimer’s Dis Related Dementia 1(2): 1008 (2014) 3/5
Inclusion Criteria for HV subjects
o Cognitively normal, based on an absence of significant impairment in cognitive functions or activities of daily living
o CDR-Global score of 0 and CDR-Memory score of 0
o Mini-Mental State Exam (MMSE) score between 26-30
o Psychiatrically healthy, no depression in the clinical judgment of Investigator
o Normal memory function documented by scoring within the education adjusted ranges on the Logical Memory II subscale (Delayed Paragraph Recall, Paragraph A only) from the Wechsler Memory Scale-Revised (the maximum score is 25)
RESULTS AND DISCUSSION
Participants
Figure 1 and 2 summarizes demographics and clinical/cognitive scores for both groups. Twenty AD subjects (45% females) with median age of 76 years old met the NINCDS-ADRDA criteria for Probable AD and DSM-IV criteria for Dementia of the Alzheimer’s Type. Twenty HV subjects (45% females) with median age of 72 years old were recruited with no evidence of cognitive impairment. Both groups have same number of education years. Apolipoprotein (APOE) e4 was more prevalent among the AD group (40%) than the HV group (15%).
ROC curves for FLES prediction of Clinical Diagnosis
As reported previously [26], the ROC analysis of the data demonstrate the prediction of clinical diagnosis by FLES with sensitivity of 85% and specificity of 95% using the Cohen’s Kappa test (κ = 0.80, 95% CI =0.61-0.99, p<0.001, AUC=0.915) [26]. The threshold line obtained by ROC was 0.367, the average FLES score for the HV group was 0.23, which is almost half that of the AD group (0.50). Moreover, the results of the AD group had a range of 0.82 compared to that of the HV group of 0.45 [26].
Amyloid PET prediction of Clinical Diagnosis
Similar statistical analysis to the FLES test was performed for the AmyvidTM PET, both visual and quantitative readings, which were obtained on the same cohort in the study. The statistical results of visual AmyvidTM PET (positive or negative scans) predicting clinical diagnosis show both sensitivity and specificity of 80% (κ = 0.60, 95% CI =0.35-0.85, p<0.001).
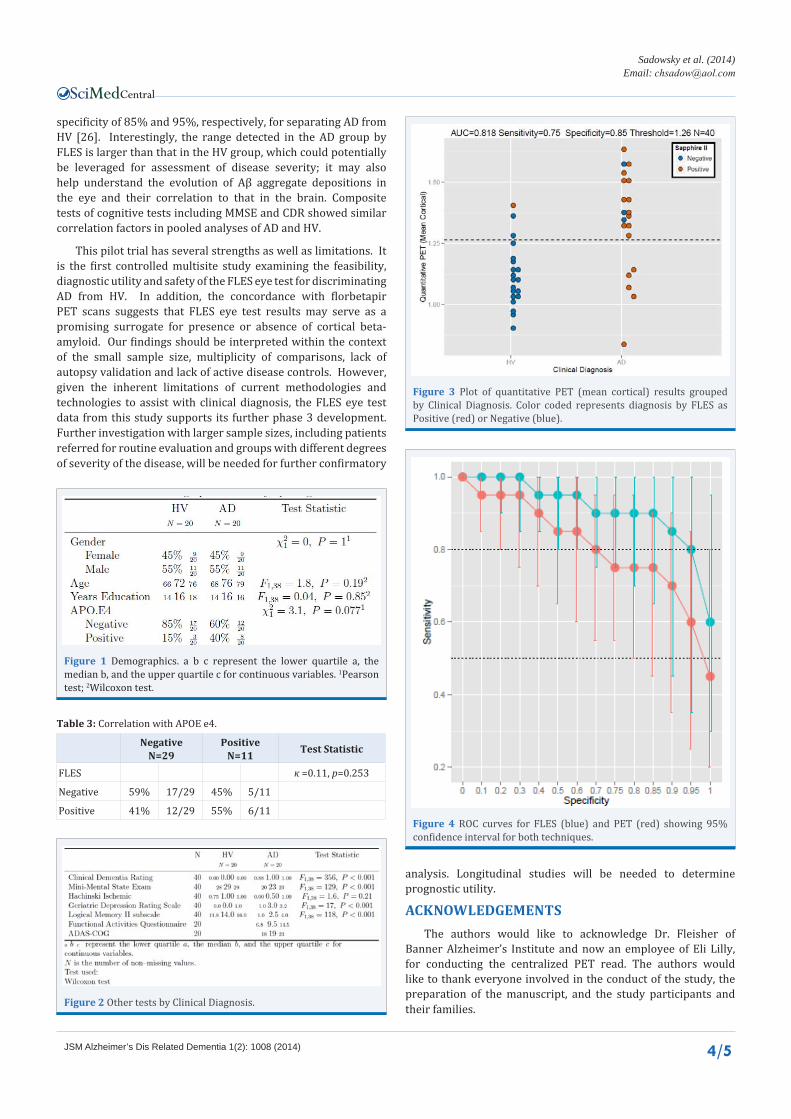
The statistical analysis performed on the quantitative AmyvidTM PET predicting clinical diagnosis yielded a sensitivity of 75% and specificity of 85% (κ = 0.60, 95% CI =0.35-0.85, p<0.001). Figure 3 is a scatter plot of the data obtained by quantitative AmyvidTM PET for all subjects tested in the clinical study. The threshold obtained from the ROC curve on the quantitative AmyvidTM PET in this cohort was 1.26, which is different than the published threshold used in differentiation between groups using AmyvidTM amyloid PET imaging [29]. Color coded dots in Figure 3 represent results obtained by FLES based on clinical diagnosis as positive (above threshold) or negative (below threshold) as described in the previous section.
ROC curvesFigure 4 shows the median for each subject and 95 %
confidence intervals for sensitivity and specificity from 0 to 1. FLES sensitivities were greater than those for quantitative PET at all specificity. FLES retained high sensitivity (>0.8) even at high specificity (0.9). Quantitative PET maintains high sensitivity (>0.8) only for specificity >0.7. The AUC curves for FLES and Quantitative PET were not significantly different (p=0.26) (Table 1).
Correlation with Cognitive functionsWe also investigated the correlation of FLES and PET results
with screening/baseline CDR (a measure of cognition and function) and MMSE (Table 2) in a pooled analysis of both AD and HV subjects. FLES was positively correlated with both MMSE and CDR. For each of the cognitive tests, the correlation with FLES was comparable (and numerically higher) to the correlations of cognition with florbetapir PET.
Correlation with APOE e4In this study cohort, 11 subjects were APOE e4 heterozygotes
and 29 were noncarriers. By clinical diagnosis, 40% of the AD group tested positive with APOE e4 and 85% of the HV group tested negative (Figure 1).
The FLES System correlated with APOE e4 allele test in 55% of the subjects who tested positive (APOE e4 detected) and in 59% of the subjects who tested negative (APOE e4 not detected) (κ = 0.11, 95% CI =0.21-0.43, p=0.253) (Table 3).
CONCLUSIONThe findings reported here extends our previous report from
the first multicenter phase 2 trial of FLES eye test as an aid for diagnosis AD [26]. As reported previously [26], the FLES eye test system was well tolerated and there were no serious adverse events recorded.
The concordance between amyloid PET and FLES was relatively high as reported previously [26]. The ROC curve analyses of the eye test, which was performed with the FLES system on one eye of every participant, demonstrated a high
HVN=20
ADN=20 Test Statistic
PET (Mean Cortical) κ =0.6, π<0.001
Negative 85% 17/20 25% 5/20
Positive 15% 3/20 75% 15/20
Table 1: Quantitative PET Prediction of Clinical Diagnosis.
CDR MMSE
FLES r 0.63 0.61
N 40 40
p 0.0000 0.0000
Quant. PET r 0.53 0.55
N 40 40
p 0.0004 0.0002
Table 2: Correlation factor (r)and p-values of Composite Cognitive tests (composed of CDR, MMSE ) by FLES and PET.
Central
Sadowsky et al. (2014)Email:
JSM Alzheimer’s Dis Related Dementia 1(2): 1008 (2014) 4/5
Figure 1 Demographics. a b c represent the lower quartile a, the median b, and the upper quartile c for continuous variables. 1Pearson test; 2Wilcoxon test.
Figure 2 Other tests by Clinical Diagnosis.
Figure 3 Plot of quantitative PET (mean cortical) results grouped by Clinical Diagnosis. Color coded represents diagnosis by FLES as Positive (red) or Negative (blue).
Figure 4 ROC curves for FLES (blue) and PET (red) showing 95% confidence interval for both techniques.
specificity of 85% and 95%, respectively, for separating AD from HV [26]. Interestingly, the range detected in the AD group by FLES is larger than that in the HV group, which could potentially be leveraged for assessment of disease severity; it may also help understand the evolution of Aβ aggregate depositions in the eye and their correlation to that in the brain. Composite tests of cognitive tests including MMSE and CDR showed similar correlation factors in pooled analyses of AD and HV.
This pilot trial has several strengths as well as limitations. It is the first controlled multisite study examining the feasibility, diagnostic utility and safety of the FLES eye test for discriminating AD from HV. In addition, the concordance with florbetapir PET scans suggests that FLES eye test results may serve as a promising surrogate for presence or absence of cortical beta-amyloid. Our findings should be interpreted within the context of the small sample size, multiplicity of comparisons, lack of autopsy validation and lack of active disease controls. However, given the inherent limitations of current methodologies and technologies to assist with clinical diagnosis, the FLES eye test data from this study supports its further phase 3 development. Further investigation with larger sample sizes, including patients referred for routine evaluation and groups with different degrees of severity of the disease, will be needed for further confirmatory
NegativeN=29
PositiveN=11 Test Statistic
FLES κ =0.11, p=0.253
Negative 59% 17/29 45% 5/11
Positive 41% 12/29 55% 6/11
Table 3: Correlation with APOE e4.
analysis. Longitudinal studies will be needed to determine prognostic utility.
ACKNOWLEDGEMENTSThe authors would like to acknowledge Dr. Fleisher of
Banner Alzheimer’s Institute and now an employee of Eli Lilly, for conducting the centralized PET read. The authors would like to thank everyone involved in the conduct of the study, the preparation of the manuscript, and the study participants and their families.
Central
Sadowsky et al. (2014)Email:
JSM Alzheimer’s Dis Related Dementia 1(2): 1008 (2014) 5/5
CONFLICT OF INTEREST The study was funded by Cognoptix. Paul Hartung, Dennis
Nilan, and Charles Kerbage are employees of Cognoptix and own stock. Anne Cameron is a consultant to Cognoptix and owns stock. Gerald Cagle was an employee of Cognoptix and owns stock. Other authors have received research grants and/or advisory fees from several companies in this field, including Cognoptix. P. Murali Doraiswamy owns stock in several companies whose products are not discussed here. He also has unlicensed patent(s) in the AD diagnostic field.
REFERENCES1. Lim A, Tsuang D, Kukull W, Nochlin D, Leverenz J, McCormick W, et
al. Clinico-neuropathological correlation of Alzheimer’s disease in a community-based case series. J Am Geriatr Soc. 1999; 47: 564-569.
2. Victoroff J, Mack WJ, Lyness SA, Chui HC. Multicenter clinicopathological correlation in dementia. Am J Psychiatry. 1995; 152: 1476-1484.
3. Mendez MF, Mastri AR, Sung JH, Zander BA, Frey WH 2nd. Neuropathologically confirmed Alzheimer’s disease: clinical diagnoses in 394 cases. J Geriatr Psychiatry Neurol. 1991; 4: 26-29.
4. Pearl GS. Diagnosis of Alzheimer’s disease in a community hospital-based brain bank program. South Med J. 1997; 90: 720-722.
5. Wade JP, Mirsen TR, Hachinski VC, Fisman M, Lau C, Merskey H. The clinical diagnosis of Alzheimer’s disease. Arch Neurol. 1987; 44: 24-29.
6. Hardy J, Selkoe DJ. The amyloid hypothesis of Alzheimer’s disease: progress and problems on the road to therapeutics. Science. 2002; 297: 353-356.
7. Karran E, Mercken M, De Strooper B. The amyloid cascade hypothesis for Alzheimer’s disease: an appraisal for the development of therapeutics. Nat Rev Drug Discov. 2011; 10: 698-712.
8. Reiman EM, Quiroz YT, Fleisher AS, Chen K, Velez-Pardo C, Jimenez-Del-Rio M, et al. Brain imaging and fluid biomarker analysis in young adults at genetic risk for autosomal dominant Alzheimer’s disease in the presenilin 1 E280A kindred: a case-control study. Lancet Neurol. 2012; 11: 1048-1056.
9. Klunk WE, Engler H, Nordberg A, Wang Y, Blomqvist G, Holt DP, et al. Imaging brain amyloid in Alzheimer’s disease with Pittsburgh Compound-B. Ann Neurol. 2004; 55: 306-319.
10. Nordberg A. PET imaging of amyloid in Alzheimer’s disease. Lancet Neurol. 2004; 3: 519-527.
11. Doraiswamy PM, Sperling RA, Coleman RE, Johnson KA, Reiman EM, Davis MD, et al. Amyloid-β assessed by florbetapir F 18 PET and 18-month cognitive decline: a multicenter study. Neurology. 2012; 79: 1636-1644.
12. Yang L, Rieves D, Ganley C. Brain amyloid imaging--FDA approval of florbetapir F18 injection. N Engl J Med. 2012; 367: 885-887.
13. Parnell M, Guo L, Abdi M, Cordeiro MF. Ocular manifestations of Alzheimer’s disease in animal models. Int J Alzheimers Dis. 2012; 2012: 786494.
14. Liang JJ. Interaction between beta-amyloid and lens alpha B-crystallin. FEBS Lett. 2000; 484: 98-101.
15. Isas JM, Luibl V, Johnson LV, Kayed R, Wetzel R, Glabe CG, et al. Soluble and mature amyloid fibrils in drusen deposits. Invest Ophthalmol Vis Sci. 2010; 51: 1304-1310.
16. Bruban J, Dinet V, Mascarelli F. The role of amyloid-β in retinal degeneration. Adv Exp Med Biol. 2012; 723: 67-74.
17. Frederikse PH, Garland D, Zigler JS Jr, Piatigorsky J. Oxidative stress increases production of beta-amyloid precursor protein and beta-amyloid (Abeta) in mammalian lenses, and Abeta has toxic effects on lens epithelial cells. J Biol Chem. 1996; 271: 10169-10174.
18. Frederikse PH. Amyloid-like protein structure in mammalian ocular lenses. Curr Eye Res. 2000; 20: 462-468.
19. Goldstein LE, Muffat JA, Cherny RA, Moir RD, Ericsson MH, Huang X, et al. Cytosolic beta-amyloid deposition and supranuclear cataracts in lenses from people with Alzheimer’s disease. Lancet. 2003; 361: 1258-1265.
20. Koronyo-Hamaoui M1, Koronyo Y, Ljubimov AV, Miller CA, Ko MK, Black KL, et al. Identification of amyloid plaques in retinas from Alzheimer’s patients and noninvasive in vivo optical imaging of retinal plaques in a mouse model. Neuroimage. 2011; 54 Suppl 1:S204-S217.
21. Koronyo Y, Salumbides BC, Black KL, Koronyo-Hamaoui M. Alzheimer’s disease in the retina: imaging retinal A plaques for early diagnosis and therapy assessment. Neurodegener Dis. 2012; 10: 285-293.
22. Moncaster JA, Pineda R, Moir RD, Lu S, Burton MA, Ghosh JG, et al. Alzheimer’s disease amyloid-beta links lens and brain pathology in Down syndrome. PLoS One. 2010; 5: e10659.
23. Jun G, Moncaster JA, Koutras C, Seshadri S, Buros J, McKee AC, et al. δ-Catenin is genetically and biologically associated with cortical cataract and future Alzheimer-related structural and functional brain changes. PLoS One. 2012; 7: e43728.
24. Melov S, Wolf N, Strozyk D, Doctrow SR, Bush AI. Mice transgenic for Alzheimer disease beta-amyloid develop lens cataracts that are rescued by antioxidant treatment. Free Radic Biol Med. 2005; 38: 258-261.
25. Kerbage C, Sadowsky CH, Jennings D, Cagle GD, Hartung PD. Alzheimer’s disease diagnosis by detecting exogenous fluorescent signal of ligand bound to Beta amyloid in the lens of human eye: an exploratory study. Front Neurol. 2013; 4: 62.
26. Kerbage C, Sadowsky CH, Tariot PN, Agronin M, Alva G, Turner FD, et al. Detection of Amyloid β Signature in the Lens and Its Correlation in the Brain to Aid in the Diagnosis of Alzheimer’s Disease. Am J Alzheimers Dis Other Demen. 2014.
27. Highlights of Prescribing Information. These highlights do not include all the information needed to use Amyvid safely and effectively. See full prescribing information for Amyvid. Amyvid (Florbetapir F 18 Injection) for intravenous use Initial U.S. Approval: 2012.
28. Clark CM, Schneider JA, Bedell BJ, Beach TG, Bilker WB, Mintun MA, et al. Use of florbetapir-PET for imaging beta-amyloid pathology. JAMA. 2011; 305: 275-283.
29. Fleisher AS, Chen K, Liu X, Roontiva A, Thiyyagura P, Ayutyanont N, et al. Using positron emission tomography and florbetapir F18 to image cortical amyloid in patients with mild cognitive impairment or dementia due to Alzheimer disease. Arch Neurol. 2011; 68: 1404-1411.
Sadowsky CH, Kerbage C, Tariot PN, Agronin M, Alva G, et al. (2014) Diagnosis of Alzheimer’s Disease through the Eye and its Correlation with Cognitive Tests and Brain Imaging. JSM Alzheimer’s Dis Related Dementia 1(2): 1008.
Cite this article