Embed Size (px)
Citation preview
Application ReportAN01286–May 2012
Diagnosing Software Faults in Stellaris® MicrocontrollersJoe Kroesche, Stellaris® Software
ABSTRACTDuring typical development efforts, system operation can sometimes end up in a fault handler. At first glance,faults might seem cryptic or difficult to understand, but Stellaris microcontrollers include several features tohelp determine why a fault occurred. Read this application note to learn about the fault handling capabilitiesof Stellaris microcontrollers, how to diagnose faults, and how to prevent them.
Contents1 Introduction ................................................................................................................................. 12 Fault System Overview .................................................................................................................. 13 Diagnosing Faults ......................................................................................................................... 44 Typical Faults and How to Avoid Them ............................................................................................ 155 General Fault Debug Flow ............................................................................................................ 186 Conclusion ................................................................................................................................ 187 References ................................................................................................................................ 18
1 IntroductionWhen software running on a Stellaris Cortex™-M processor encounters an error, it generates a fault, and theprogram execution is directed to a fault handler. In some cases, fault occurrence in a program can seemmysterious and difficult to debug. However, a fault should not be the cause of debug trepidation. The StellarisCortex-M processor provides a powerful fault handling system and several features to help you find the causeof a fault. After debugging a few faults, you will be more comfortable handling and troubleshooting faults asthey happen, and will be able to find the cause in a few minutes.
2 Fault System OverviewIn a Stellaris Cortex-M processor, a fault is a type of exception. There are 15 system exceptions includingSysTick and SVC. Four of these system exceptions are faults, with one for each type of fault that can occurin the processor when it is running code.
Table 1 shows the list of fault types and their causes.
Table 1. Fault Types
If not enabled...Required?Priority LevelDescriptionFault Typje
Not applicableRequiredHighest priority, fixed at -1aA hard fault includes any fault that isnot covered by the following threecategories. Any unhandled faultescalates to a hard fault.
Hard fault
Escalates to aHard fault
OptionalConfigurable, lower than Hard faultA memory management fault occurswhen executing code attempts toaccess an illegal location or violatesa rule of the Memory Protection Unit(MPU).
MemoryManagement fault
Diagnosing Software Faults in Stellaris® Microcontrollers 1AN01286–May 2012Copyright © 2012 Texas Instruments Incorporated
Table 1. Fault Types (continued)
If not enabled...Required?Priority LevelDescriptionFault Typje
Escalates to aHard fault
OptionalConfigurable, lower than Hard faultA bus fault occurs when there is anerror on the bus that happens whenaccessing a peripheral or memory.
Bus fault
Escalates to aHard fault
OptionalConfigurable, lower than Hard faultA usage fault occurs when there is aprogram error such as an illegalinstruction, alignment problem, orattempt to access a non-existentco-processor.
Usage fault
a. Only the reset and non-maskable interrupt (NMI) exceptions are higher in priority than the hard fault.
The Hard fault has the highest priority of any fault in the system. The priority of the fault is fixed at -1, and theonly higher priority exceptions in the system are reset and non-maskable interrupt (NMI). The remaining faulttypes have configurable priority levels but are typically lower priority than the Hard fault and higher prioritythan every other type of exception or interrupt. Only the Hard fault is required and cannot be disabled. Theother three fault types can be enabled or disabled in the system. If one of the other three fault types occursand is not enabled, then it is escalated to a Hard fault.
See the documentation from the “References” section for more details about fault types and how they can beconfigured.
When a fault occurs, there are two useful tools available to find the cause: the exception stack frame (see“Exception Stack Frame” for more information) and the fault status registers (see “Fault Status Registers” formore information).
2.1 Exception Stack FrameThe Cortex-M processor uses a uniformmechanism for saving program context information on the stack. Thissamemechanism is used for all types of exceptions that can occur in the system, including faults and interrupts.When an exception occurs (including a fault), the following registers are pushed on the stack, shown here inorder of increasing address on the stack:
SP+00 R0SP+04 R1SP+08 R2SP+12 R3SP+16 R12SP+20 LRSP+24 PCSP+28 xPSR
The register values saved in the exception stack frame provide a snapshot of the processor context at thetime the exception occurred. For a fault handler that is written in C, the compiler saves onto the stack anyadditional registers that are used by the fault handling function, so that the entire system context is saved ina fault handler.
The saved value of the working registers (R0-R3, R12) can be useful, especially if you isolate the problem toan instruction that uses one of those registers. These values allow you to reconstruct the condition of theinstruction at the time the instruction executed. The Program Counter (PC)) and Link Register (LR) valuesare the most useful information that is saved in the exception stack frame.
First, the saved value of the PC often points to the offending instruction. Using the debugger to examine theinstruction at that address along with the register values often provides enough clues that the cause of thefault becomes apparent. Sometimes it is not that easy though, and the saved PC only points in the vicinity ofthe problem, or does not provide any useful information at all (this is rare).
AN01286–May 20122 Diagnosing Software Faults in Stellaris® MicrocontrollersCopyright © 2012 Texas Instruments Incorporated
Fault System Overview www.ti.com
Second, the saved value of the LR can often be used to provide you with some context about what yourprogram was doing when the fault occurred. For example, if the code was executing in a certain function whenthe fault occurred, the saved LRmight point back into the function that called it. By examining the code at thelocation pointed to by the saved LR, you might be able to tell more about the calling function.
The saved LR can also be used, in conjunction with the rest of the stack, to unwind a series of function calls,providing an even better history. However, this process is a lot of trouble to do manually without an automaticstack backtrace from the debugger and is usually only necessary in tricky debug situations.
Sometimes the exception stack frame is not available. This usually happens when the stack pointer is pointingto a non-RAM location, which might be due to stack corruption or overflow.
2.2 Fault Status RegistersThere are three fault status registers, one for each type of fault:
• Memory Management Fault Status (MFAULTSTAT) register (8-bits at 0xE000.ED28)• Bus Fault Status (BFAULTSTAT) register (8-bits at 0xE000.ED29)• Usage Fault Status (UFAULTSTAT) register (16-bits at 0xE000.ED2A)Each of these fault status registers contains status bits to indicate the cause of the fault. Also, for the memorymanagement and bus fault types, there is an address register that holds the address that caused the fault.The three status registers can be read at separate addresses as shown above, but typically are read as acombined 32-bit word from address 0xE000.ED28.
2.2.1 Memory Management Fault Status (MFAULTSTAT) Register
DescriptionNameBit
Valid fault address is stored in the Memory Management Address Register(MMADR).
MMARVALID7
unused6:5
Memory access violation occurred while stacking on exception entry.MSTKERR4
Memory access violation occurred while unstacking on exception return.MUNSTKERR3
unused2
Data access violation.DACCVIOL1
Instruction access violation.IACCVIOL0
Bit 7 is set if theMemoryManagement Fault Address Register (MMADR), located at 0xE000.ED34, containsthe address that caused the memory management fault.
2.2.2 Bus Fault Status (BFAULTSTAT) Register
DescriptionNameBit
Valid fault address is stored in Bus Fault Address Register (FAULTADDR).BFARVALID7
unused6:5
Bus fault occurred while stacking on exception entry.STKERR4
Bus fault occurred while unstacking on exception return.UNSTKERR3
Stacked PC does not indicate exact address of bus fault.IMPRECISERR2
Stacked PC indicates exact address of bus fault.PRECISERR1
Instruction bus error.IBUSERR0
Bit 7 is set if theBus Fault Address Register (FAULTADDR), located at 0xE000.ED38, contains the addressthat caused the bus fault.
Diagnosing Software Faults in Stellaris® Microcontrollers 3AN01286–May 2012Copyright © 2012 Texas Instruments Incorporated
Fault System Overviewwww.ti.com
2.2.3 Usage Fault Status (UFAULTSTAT) Register
DescriptionNameBit
unused15:10
Traps an instruction that attempted to divide-by-zero. This trap can be enabled ordisabled.
DIVBYZERO9
Traps an attempt to make an unaligned memory access. This trap can be enabledor disabled.
UNALIGNED8
unused7:4
Attempted to execute a coprocessor instruction.NOCP3
Attempted exception return caused illegal load of PC.INVPC2
Invalid processing/instruction state.INVSTATE1
Attempt to execute an undefined instruction.UNDEFINSTR0
3 Diagnosing FaultsHere is a common debugging scenario:1. Developer discovers the application stops running.2. Using a debugger, developer discovers that the application ends up in a fault handler.3. Developer gets stuck not knowing what to do and asks for support.
The goal of this application note is to demystify step 3 and provide the developer with techniques to use toget the application running again.
The remainder of this section presents different fault scenarios and shows how to use the Stellaris features(described in the previous section) to determine the cause of the fault.
3.1 Default Interrupt HandlerTechnically, this is not a fault. However, this common scenario appears in customer support requests to theStellaris applications team. The following screen capture shows a program that is halted in theIntDefaultHandler() function.
Once here, it is safe to assume that an interrupt occurred that does not have a handler function entered inthe vector table. Once it is known that the program has entered the default handler, it is often obvious whichinterrupt has triggered and has no handler. In this case, there is no further debugging required. However,sometimes you want to find out which peripheral caused this interrupt to happen. The quickest way to find
AN01286–May 20124 Diagnosing Software Faults in Stellaris® MicrocontrollersCopyright © 2012 Texas Instruments Incorporated
Diagnosing Faults www.ti.com
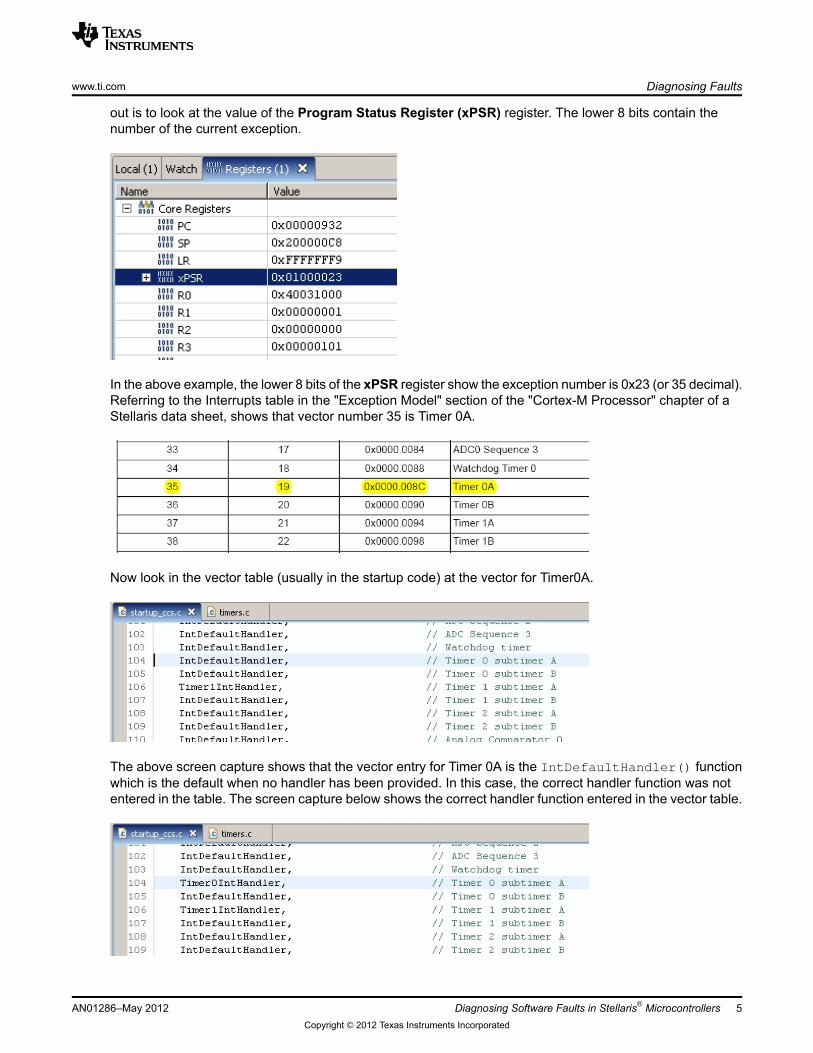
out is to look at the value of the Program Status Register (xPSR) register. The lower 8 bits contain thenumber of the current exception.
In the above example, the lower 8 bits of the xPSR register show the exception number is 0x23 (or 35 decimal).Referring to the Interrupts table in the "Exception Model" section of the "Cortex-M Processor" chapter of aStellaris data sheet, shows that vector number 35 is Timer 0A.
Now look in the vector table (usually in the startup code) at the vector for Timer0A.
The above screen capture shows that the vector entry for Timer 0A is the IntDefaultHandler() functionwhich is the default when no handler has been provided. In this case, the correct handler function was notentered in the table. The screen capture below shows the correct handler function entered in the vector table.
Diagnosing Software Faults in Stellaris® Microcontrollers 5AN01286–May 2012Copyright © 2012 Texas Instruments Incorporated
Diagnosing Faultswww.ti.com
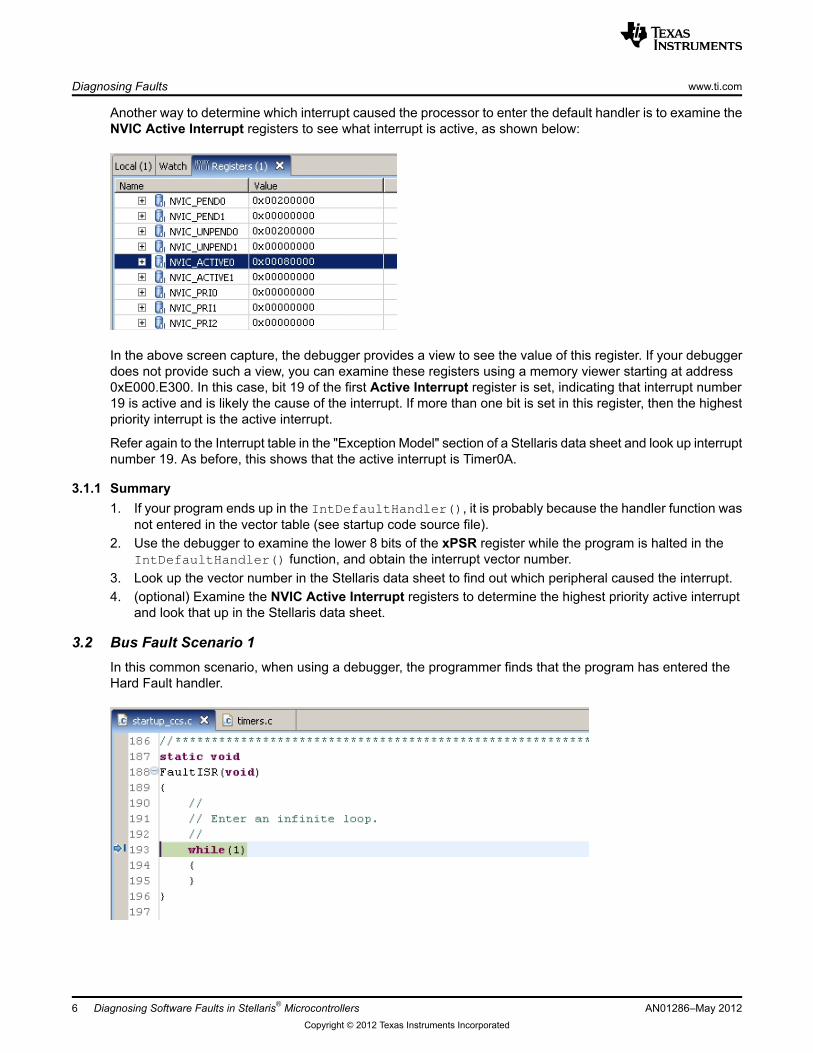
Another way to determine which interrupt caused the processor to enter the default handler is to examine theNVIC Active Interrupt registers to see what interrupt is active, as shown below:
In the above screen capture, the debugger provides a view to see the value of this register. If your debuggerdoes not provide such a view, you can examine these registers using a memory viewer starting at address0xE000.E300. In this case, bit 19 of the first Active Interrupt register is set, indicating that interrupt number19 is active and is likely the cause of the interrupt. If more than one bit is set in this register, then the highestpriority interrupt is the active interrupt.
Refer again to the Interrupt table in the "Exception Model" section of a Stellaris data sheet and look up interruptnumber 19. As before, this shows that the active interrupt is Timer0A.
3.1.1 Summary1. If your program ends up in the IntDefaultHandler(), it is probably because the handler function was
not entered in the vector table (see startup code source file).2. Use the debugger to examine the lower 8 bits of the xPSR register while the program is halted in the
IntDefaultHandler() function, and obtain the interrupt vector number.3. Look up the vector number in the Stellaris data sheet to find out which peripheral caused the interrupt.4. (optional) Examine the NVIC Active Interrupt registers to determine the highest priority active interrupt
and look that up in the Stellaris data sheet.
3.2 Bus Fault Scenario 1In this common scenario, when using a debugger, the programmer finds that the program has entered theHard Fault handler.
AN01286–May 20126 Diagnosing Software Faults in Stellaris® MicrocontrollersCopyright © 2012 Texas Instruments Incorporated
Diagnosing Faults www.ti.com
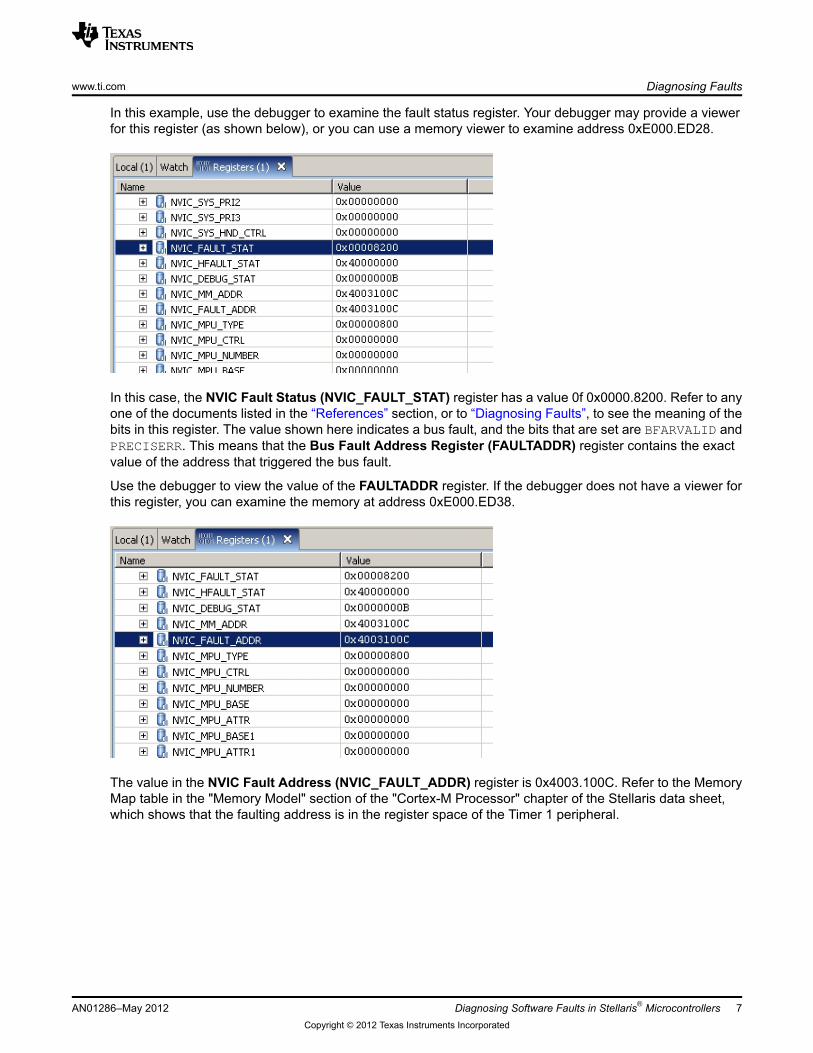
In this example, use the debugger to examine the fault status register. Your debugger may provide a viewerfor this register (as shown below), or you can use a memory viewer to examine address 0xE000.ED28.
In this case, the NVIC Fault Status (NVIC_FAULT_STAT) register has a value 0f 0x0000.8200. Refer to anyone of the documents listed in the “References” section, or to “Diagnosing Faults”, to see the meaning of thebits in this register. The value shown here indicates a bus fault, and the bits that are set are BFARVALID andPRECISERR. This means that the Bus Fault Address Register (FAULTADDR) register contains the exactvalue of the address that triggered the bus fault.
Use the debugger to view the value of the FAULTADDR register. If the debugger does not have a viewer forthis register, you can examine the memory at address 0xE000.ED38.
The value in the NVIC Fault Address (NVIC_FAULT_ADDR) register is 0x4003.100C. Refer to the MemoryMap table in the "Memory Model" section of the "Cortex-M Processor" chapter of the Stellaris data sheet,which shows that the faulting address is in the register space of the Timer 1 peripheral.
Diagnosing Software Faults in Stellaris® Microcontrollers 7AN01286–May 2012Copyright © 2012 Texas Instruments Incorporated
Diagnosing Faultswww.ti.com

This means that some part of the program was trying to access Timer 1 and caused a bus fault.
Note: This is a common support scenario for the Stellaris applications team. When there is a bus fault andthe faulting address is in the register space of a peripheral, it is almost always because the programmerdid not enable the peripheral before trying to use it.
Consider the following code snippet. The programmer enabled Timer 0, but forgot to add an additional lineof code to enable Timer 1.
The following shows the correct code. This eliminates the fault.
At this point, the cause of this fault has been found and corrected and no further debugging is required.However, another path could be taken to find the problem, and that is to start with the exception stack frame.Use the debugger to find the value of the stack pointer.
AN01286–May 20128 Diagnosing Software Faults in Stellaris® MicrocontrollersCopyright © 2012 Texas Instruments Incorporated
Diagnosing Faults www.ti.com
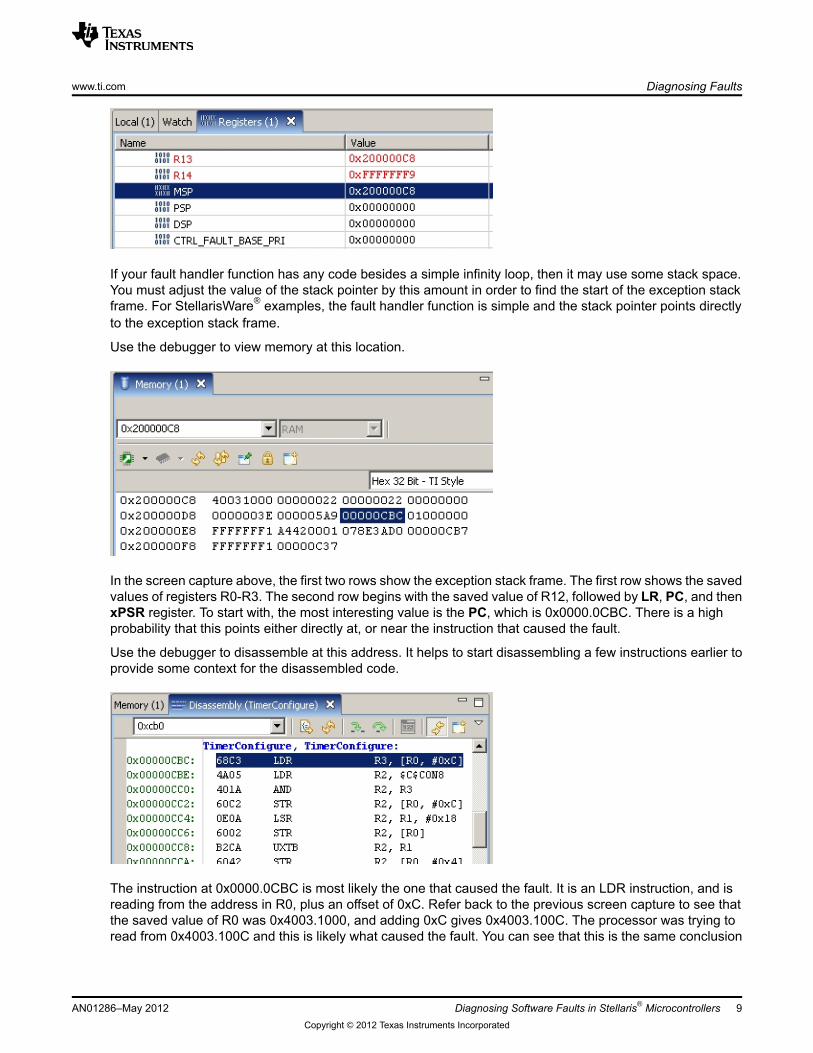
If your fault handler function has any code besides a simple infinity loop, then it may use some stack space.You must adjust the value of the stack pointer by this amount in order to find the start of the exception stackframe. For StellarisWare® examples, the fault handler function is simple and the stack pointer points directlyto the exception stack frame.
Use the debugger to view memory at this location.
In the screen capture above, the first two rows show the exception stack frame. The first row shows the savedvalues of registers R0-R3. The second row begins with the saved value of R12, followed by LR, PC, and thenxPSR register. To start with, the most interesting value is the PC, which is 0x0000.0CBC. There is a highprobability that this points either directly at, or near the instruction that caused the fault.
Use the debugger to disassemble at this address. It helps to start disassembling a few instructions earlier toprovide some context for the disassembled code.
The instruction at 0x0000.0CBC is most likely the one that caused the fault. It is an LDR instruction, and isreading from the address in R0, plus an offset of 0xC. Refer back to the previous screen capture to see thatthe saved value of R0 was 0x4003.1000, and adding 0xC gives 0x4003.100C. The processor was trying toread from 0x4003.100C and this is likely what caused the fault. You can see that this is the same conclusion
Diagnosing Software Faults in Stellaris® Microcontrollers 9AN01286–May 2012Copyright © 2012 Texas Instruments Incorporated
Diagnosing Faultswww.ti.com
that was found earlier in this section by examining the fault status register and the FAULTADDR register. Sowe have used a second method to find the same cause for the fault.
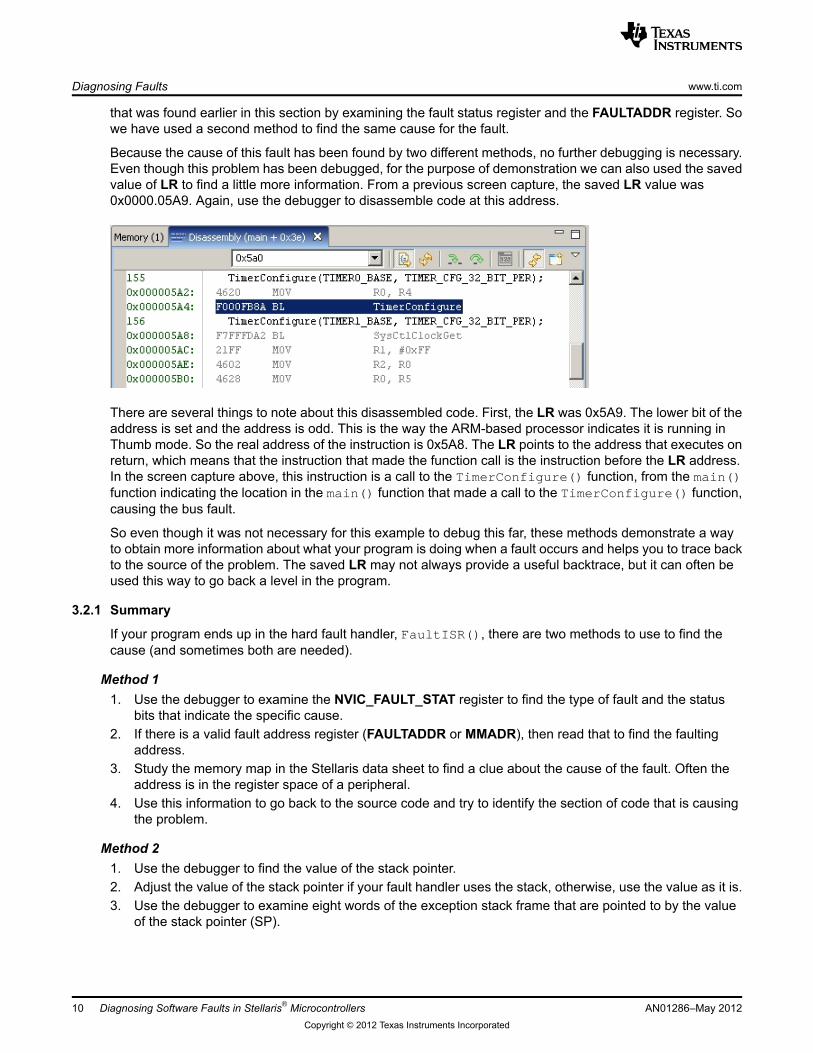
Because the cause of this fault has been found by two different methods, no further debugging is necessary.Even though this problem has been debugged, for the purpose of demonstration we can also used the savedvalue of LR to find a little more information. From a previous screen capture, the saved LR value was0x0000.05A9. Again, use the debugger to disassemble code at this address.
There are several things to note about this disassembled code. First, the LR was 0x5A9. The lower bit of theaddress is set and the address is odd. This is the way the ARM-based processor indicates it is running inThumb mode. So the real address of the instruction is 0x5A8. The LR points to the address that executes onreturn, which means that the instruction that made the function call is the instruction before the LR address.In the screen capture above, this instruction is a call to the TimerConfigure() function, from the main()function indicating the location in the main() function that made a call to the TimerConfigure() function,causing the bus fault.
So even though it was not necessary for this example to debug this far, these methods demonstrate a wayto obtain more information about what your program is doing when a fault occurs and helps you to trace backto the source of the problem. The saved LR may not always provide a useful backtrace, but it can often beused this way to go back a level in the program.
3.2.1 Summary
If your program ends up in the hard fault handler, FaultISR(), there are two methods to use to find thecause (and sometimes both are needed).
Method 11. Use the debugger to examine the NVIC_FAULT_STAT register to find the type of fault and the status
bits that indicate the specific cause.2. If there is a valid fault address register (FAULTADDR or MMADR), then read that to find the faulting
address.3. Study the memory map in the Stellaris data sheet to find a clue about the cause of the fault. Often the
address is in the register space of a peripheral.4. Use this information to go back to the source code and try to identify the section of code that is causing
the problem.
Method 21. Use the debugger to find the value of the stack pointer.2. Adjust the value of the stack pointer if your fault handler uses the stack, otherwise, use the value as it is.3. Use the debugger to examine eight words of the exception stack frame that are pointed to by the value
of the stack pointer (SP).
AN01286–May 201210 Diagnosing Software Faults in Stellaris® MicrocontrollersCopyright © 2012 Texas Instruments Incorporated
Diagnosing Faults www.ti.com
4. Find the saved value of the PC and disassemble code at that address to try to find an instruction that mayhave caused the fault. Use the values of the saved registers to reconstruct the instruction parameters.
5. If further context is required, disassemble code pointed at by the saved value of the . Often this revealsthe previous function in the call stack and helps to identify the cause of the fault.
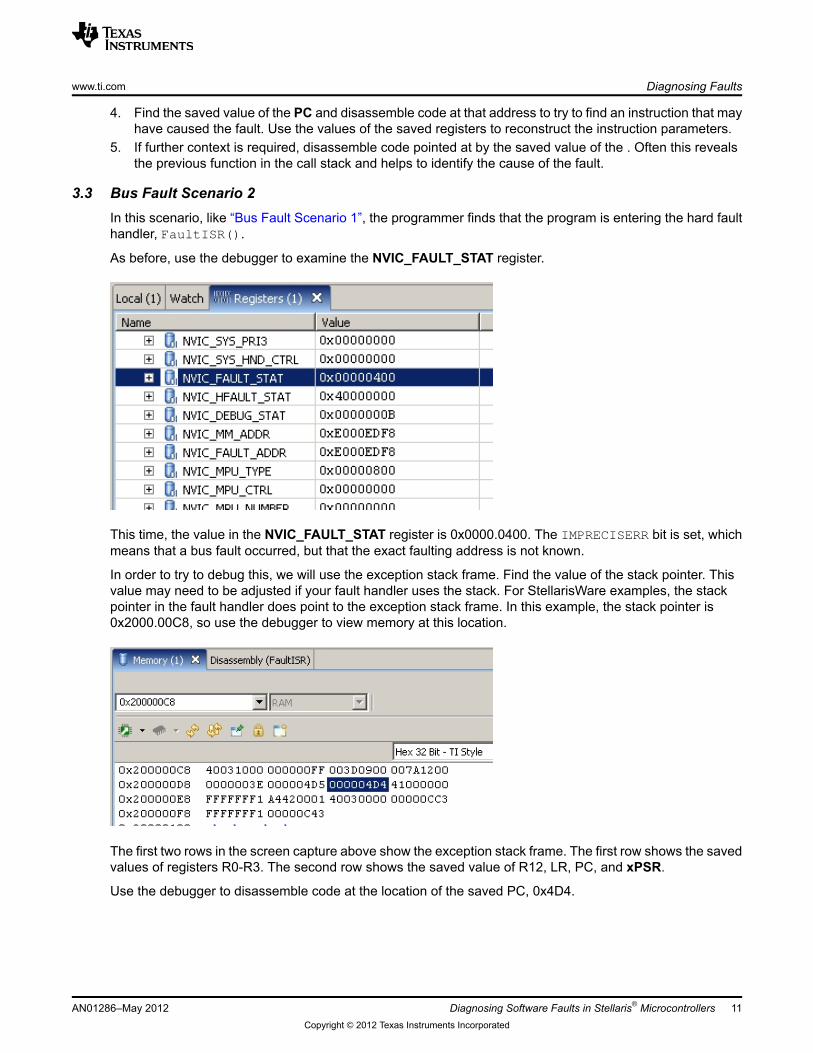
3.3 Bus Fault Scenario 2In this scenario, like “Bus Fault Scenario 1”, the programmer finds that the program is entering the hard faulthandler, FaultISR().
As before, use the debugger to examine the NVIC_FAULT_STAT register.
This time, the value in the NVIC_FAULT_STAT register is 0x0000.0400. The IMPRECISERR bit is set, whichmeans that a bus fault occurred, but that the exact faulting address is not known.
In order to try to debug this, we will use the exception stack frame. Find the value of the stack pointer. Thisvalue may need to be adjusted if your fault handler uses the stack. For StellarisWare examples, the stackpointer in the fault handler does point to the exception stack frame. In this example, the stack pointer is0x2000.00C8, so use the debugger to view memory at this location.
The first two rows in the screen capture above show the exception stack frame. The first row shows the savedvalues of registers R0-R3. The second row shows the saved value of R12, LR, PC, and xPSR.
Use the debugger to disassemble code at the location of the saved PC, 0x4D4.
Diagnosing Software Faults in Stellaris® Microcontrollers 11AN01286–May 2012Copyright © 2012 Texas Instruments Incorporated
Diagnosing Faultswww.ti.com
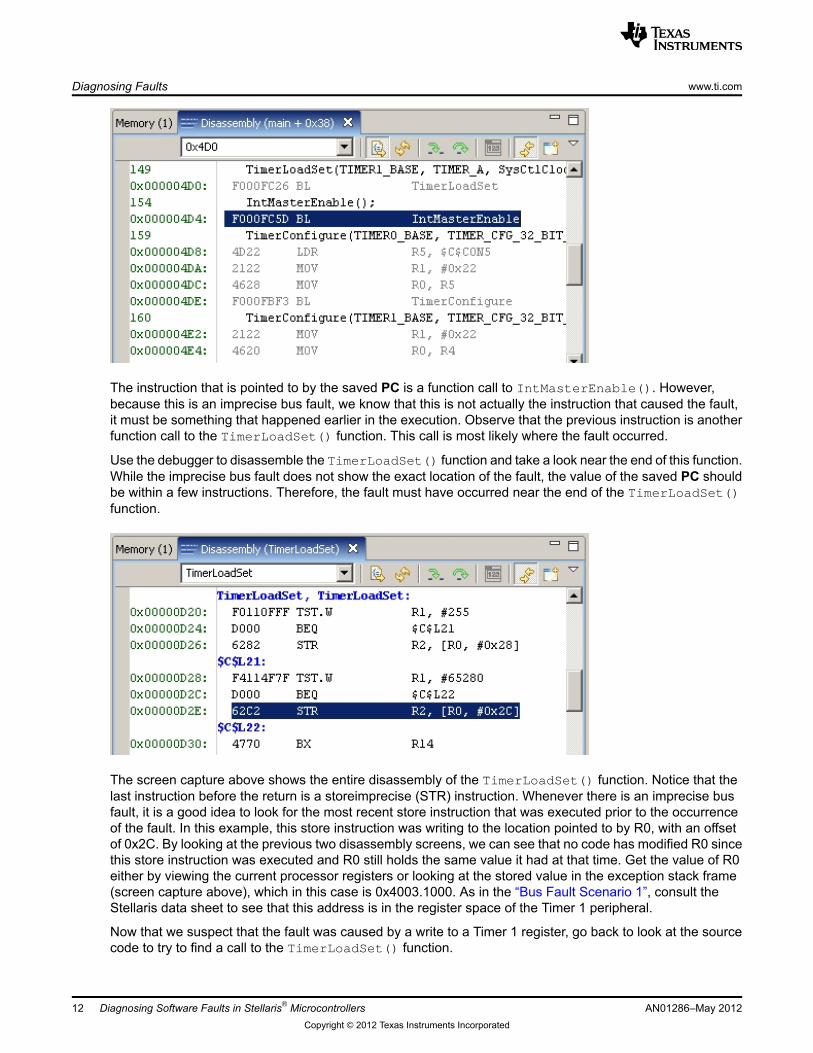
The instruction that is pointed to by the saved PC is a function call to IntMasterEnable(). However,because this is an imprecise bus fault, we know that this is not actually the instruction that caused the fault,it must be something that happened earlier in the execution. Observe that the previous instruction is anotherfunction call to the TimerLoadSet() function. This call is most likely where the fault occurred.
Use the debugger to disassemble the TimerLoadSet() function and take a look near the end of this function.While the imprecise bus fault does not show the exact location of the fault, the value of the saved PC shouldbe within a few instructions. Therefore, the fault must have occurred near the end of the TimerLoadSet()function.
The screen capture above shows the entire disassembly of the TimerLoadSet() function. Notice that thelast instruction before the return is a storeimprecise (STR) instruction. Whenever there is an imprecise busfault, it is a good idea to look for the most recent store instruction that was executed prior to the occurrenceof the fault. In this example, this store instruction was writing to the location pointed to by R0, with an offsetof 0x2C. By looking at the previous two disassembly screens, we can see that no code has modified R0 sincethis store instruction was executed and R0 still holds the same value it had at that time. Get the value of R0either by viewing the current processor registers or looking at the stored value in the exception stack frame(screen capture above), which in this case is 0x4003.1000. As in the “Bus Fault Scenario 1”, consult theStellaris data sheet to see that this address is in the register space of the Timer 1 peripheral.
Now that we suspect that the fault was caused by a write to a Timer 1 register, go back to look at the sourcecode to try to find a call to the TimerLoadSet() function.
AN01286–May 201212 Diagnosing Software Faults in Stellaris® MicrocontrollersCopyright © 2012 Texas Instruments Incorporated
Diagnosing Faults www.ti.com
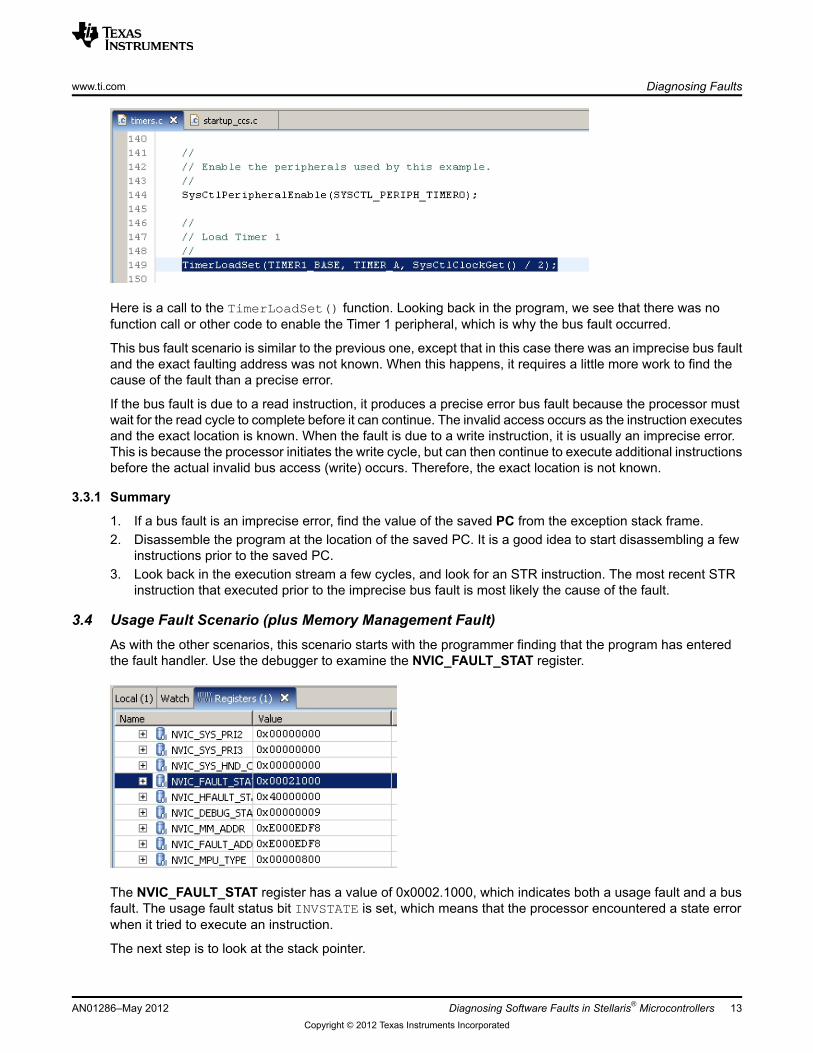
Here is a call to the TimerLoadSet() function. Looking back in the program, we see that there was nofunction call or other code to enable the Timer 1 peripheral, which is why the bus fault occurred.
This bus fault scenario is similar to the previous one, except that in this case there was an imprecise bus faultand the exact faulting address was not known. When this happens, it requires a little more work to find thecause of the fault than a precise error.
If the bus fault is due to a read instruction, it produces a precise error bus fault because the processor mustwait for the read cycle to complete before it can continue. The invalid access occurs as the instruction executesand the exact location is known. When the fault is due to a write instruction, it is usually an imprecise error.This is because the processor initiates the write cycle, but can then continue to execute additional instructionsbefore the actual invalid bus access (write) occurs. Therefore, the exact location is not known.
3.3.1 Summary
1. If a bus fault is an imprecise error, find the value of the saved PC from the exception stack frame.2. Disassemble the program at the location of the saved PC. It is a good idea to start disassembling a few
instructions prior to the saved PC.3. Look back in the execution stream a few cycles, and look for an STR instruction. The most recent STR
instruction that executed prior to the imprecise bus fault is most likely the cause of the fault.
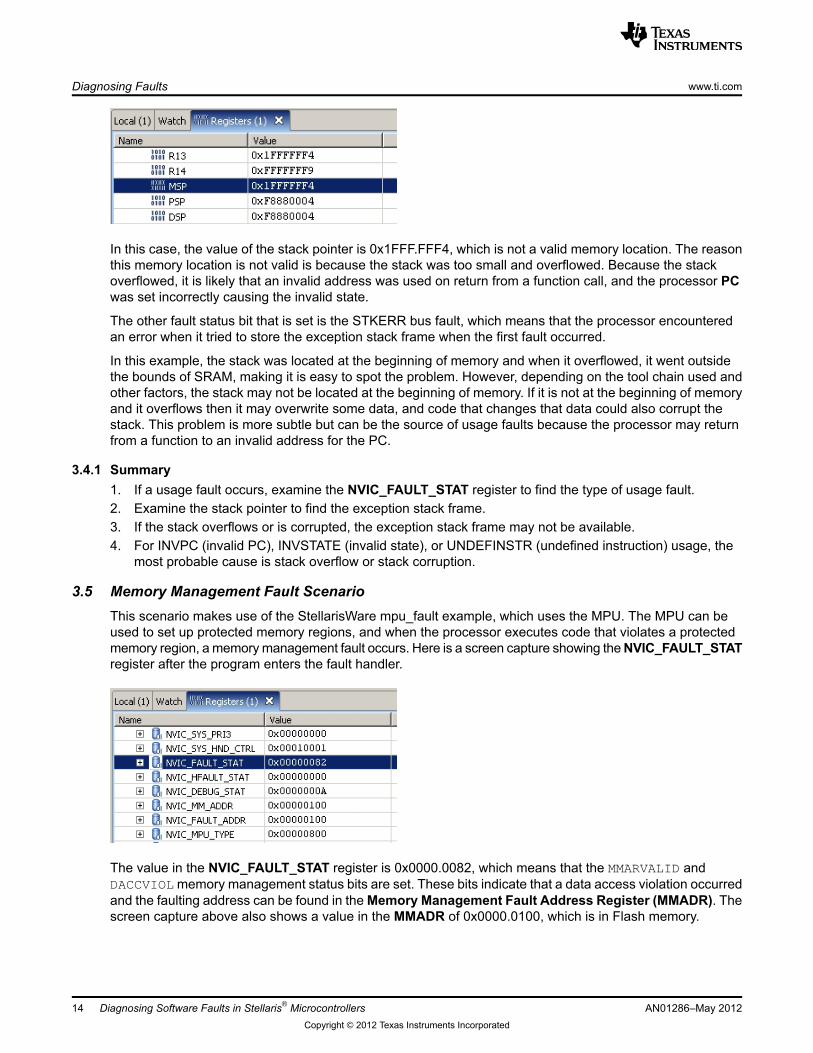
3.4 Usage Fault Scenario (plus Memory Management Fault)As with the other scenarios, this scenario starts with the programmer finding that the program has enteredthe fault handler. Use the debugger to examine the NVIC_FAULT_STAT register.
The NVIC_FAULT_STAT register has a value of 0x0002.1000, which indicates both a usage fault and a busfault. The usage fault status bit INVSTATE is set, which means that the processor encountered a state errorwhen it tried to execute an instruction.
The next step is to look at the stack pointer.
Diagnosing Software Faults in Stellaris® Microcontrollers 13AN01286–May 2012Copyright © 2012 Texas Instruments Incorporated
Diagnosing Faultswww.ti.com
In this case, the value of the stack pointer is 0x1FFF.FFF4, which is not a valid memory location. The reasonthis memory location is not valid is because the stack was too small and overflowed. Because the stackoverflowed, it is likely that an invalid address was used on return from a function call, and the processor PCwas set incorrectly causing the invalid state.
The other fault status bit that is set is the STKERR bus fault, which means that the processor encounteredan error when it tried to store the exception stack frame when the first fault occurred.
In this example, the stack was located at the beginning of memory and when it overflowed, it went outsidethe bounds of SRAM, making it is easy to spot the problem. However, depending on the tool chain used andother factors, the stack may not be located at the beginning of memory. If it is not at the beginning of memoryand it overflows then it may overwrite some data, and code that changes that data could also corrupt thestack. This problem is more subtle but can be the source of usage faults because the processor may returnfrom a function to an invalid address for the PC.
3.4.1 Summary1. If a usage fault occurs, examine the NVIC_FAULT_STAT register to find the type of usage fault.2. Examine the stack pointer to find the exception stack frame.3. If the stack overflows or is corrupted, the exception stack frame may not be available.4. For INVPC (invalid PC), INVSTATE (invalid state), or UNDEFINSTR (undefined instruction) usage, the
most probable cause is stack overflow or stack corruption.
3.5 Memory Management Fault ScenarioThis scenario makes use of the StellarisWare mpu_fault example, which uses the MPU. The MPU can beused to set up protected memory regions, and when the processor executes code that violates a protectedmemory region, amemorymanagement fault occurs. Here is a screen capture showing theNVIC_FAULT_STATregister after the program enters the fault handler.
The value in the NVIC_FAULT_STAT register is 0x0000.0082, which means that the MMARVALID andDACCVIOL memory management status bits are set. These bits indicate that a data access violation occurredand the faulting address can be found in theMemory Management Fault Address Register (MMADR). Thescreen capture above also shows a value in the MMADR of 0x0000.0100, which is in Flash memory.
AN01286–May 201214 Diagnosing Software Faults in Stellaris® MicrocontrollersCopyright © 2012 Texas Instruments Incorporated
Diagnosing Faults www.ti.com
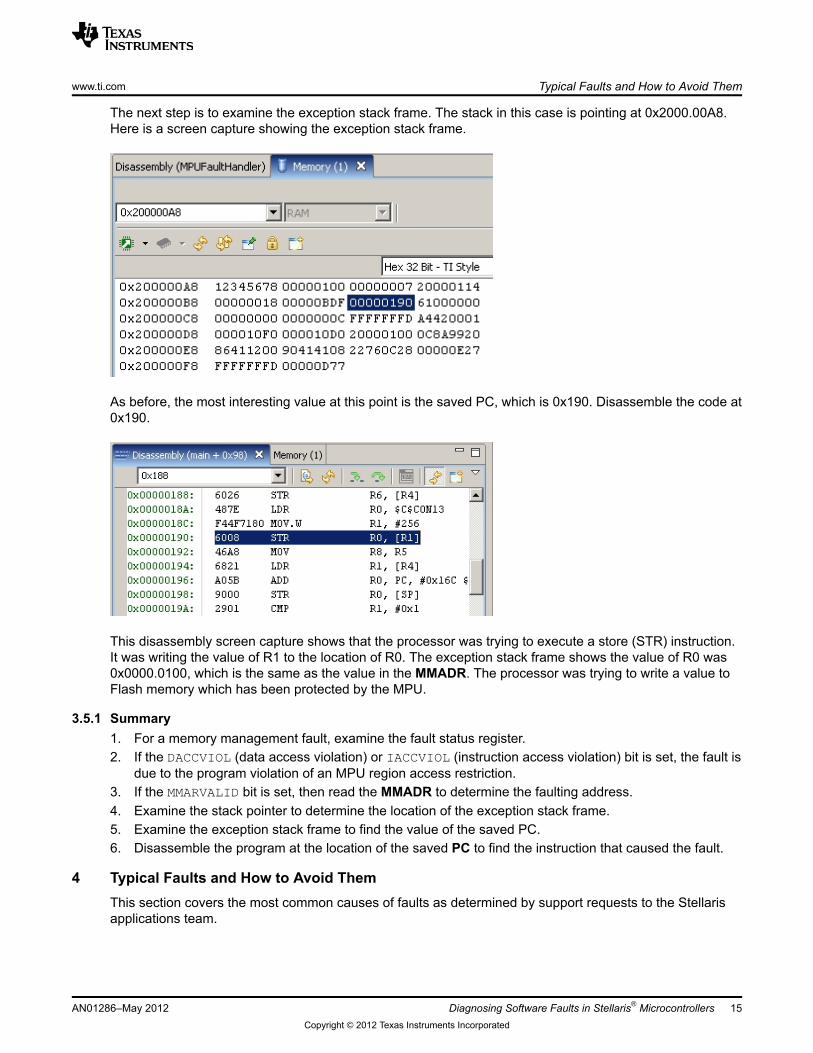
The next step is to examine the exception stack frame. The stack in this case is pointing at 0x2000.00A8.Here is a screen capture showing the exception stack frame.
As before, the most interesting value at this point is the saved PC, which is 0x190. Disassemble the code at0x190.
This disassembly screen capture shows that the processor was trying to execute a store (STR) instruction.It was writing the value of R1 to the location of R0. The exception stack frame shows the value of R0 was0x0000.0100, which is the same as the value in the MMADR. The processor was trying to write a value toFlash memory which has been protected by the MPU.
3.5.1 Summary1. For a memory management fault, examine the fault status register.2. If the DACCVIOL (data access violation) or IACCVIOL (instruction access violation) bit is set, the fault is
due to the program violation of an MPU region access restriction.3. If the MMARVALID bit is set, then read the MMADR to determine the faulting address.4. Examine the stack pointer to determine the location of the exception stack frame.5. Examine the exception stack frame to find the value of the saved PC.6. Disassemble the program at the location of the saved PC to find the instruction that caused the fault.
4 Typical Faults and How to Avoid ThemThis section covers the most common causes of faults as determined by support requests to the Stellarisapplications team.
Diagnosing Software Faults in Stellaris® Microcontrollers 15AN01286–May 2012Copyright © 2012 Texas Instruments Incorporated
Typical Faults and How to Avoid Themwww.ti.com
4.1 Bus Fault Due to Disabled PeripheralThis type of fault is most commonly seen in customer help requests regarding faults. Any attempt to accessa disabled peripheral, including DriverLib APIs, results in a bus fault.
To avoid this fault, be sure to call the SysCtlPeripheralEnable() function for all peripherals used byyour application.
4.2 Various Faults Caused by Stack OverflowStack problems are another common reason for support requests. Stack problems can be manifested inobscure ways including multiple faults and problems that do not appear at the time of the original stack error,but instead appear much later during program execution. These problems can be tricky to debug.
If your application is encountering a fault or multiple faults and the cause is not obvious, take a look at thestack allocation. Often it is helpful just to examine the value of the stack pointer when the fault occurs andcompare it to the valid range for the stack pointer (from the map file). If the stack pointer is near the baseaddress of the stack, then that is evidence that your stack might be too small. Try increasing the stack sizeby 50% or 100% to see if the problem disappears.
A function that is using a stack that has overflowed its bounds overwrites memory outside the space allocatedfor the stack. Often, this is storage for program variables. If this happens, the values of those variables becomecorrupted and the program will not run correctly. This may not create a fault until later.
Another issue that can occur when a function is running with an overflowed stack is that the function itselfmay use a variable that is in the space that has been overwritten by the stack. The function may write a valueto that variable, destroying the value that was saved on the stack, and then either saved registers, or eventhe PC, might have the wrong value when the function returns. This error can cause strange behavior includingreturning to a wrong address.
4.3 Stack Corruption Due to Buffer OverflowSometimes a function uses an array that is allocated on the stack, and then in the function body, the array iswritten beyond its bounds. This error can have the effect of overwriting other automatic variables used in thefunction as well as overwriting saved registers and the return address. One example is a function that lookslike this:
void myfunc(void){
char mystring[8];...usprintf(mystring, "my formatted output %d\n", somevar);...
}
In the above example, eight bytes were allocated on the stack for the character array. Later the usprintffunction was used to store text characters in the array without considering the array bounds. The format stringand the numerical value are written beyond the end of the space allocated formystring, which overwrites anyother stack variables, saved registers and return address, and possibly the stack context of the function thatcalled this function.
A similar thing can happen if a numerical array is allocated on the stack and is then written from a for-loop.Perhaps the index limits of the for-loop match the array size when the programmer first created the function,but then later the for-loop index limit is increased without also increasing the size of the allocated array.
Here is another problem that happens more often than you think.
AN01286–May 201216 Diagnosing Software Faults in Stellaris® MicrocontrollersCopyright © 2012 Texas Instruments Incorporated
Typical Faults and How to Avoid Them www.ti.com
void myfunc(void){
int myarray[1024];
...}
In this case, the programmer allocated a huge array on the stack. Unless the stack was adjusted for anunusually large program, this will likely cause a stack overflow the first time this function is entered.
Note: Be careful with arrays allocated on the stack and with array bounds in general.
4.4 Bad PC AddressThere are a couple of common pitfalls that can cause a bad PC address. Both usually occur when using afunction pointer to call another function.
In the first example, the function pointer is called before it has been initialized:
void myfunc(void){
void (*mypfn)(void);
...
mypfn();...
}
The compiler generates code to call the function through the function pointer, and if this pointer does not pointto a function, the PC can end up anywhere. This error can cause any of the following:• The processor jumps to valid code somewhere in the program and continues executing. The bug does
not show up until later.• The processor jumps to some location in memory that does not contain a valid instruction and a usage
fault (probably) occurs.• The processor jumps to a location outside the valid memory window and a bus fault and/or usage faults
occur.
Another problem can happen when using a hard-coded address for the function pointer:
mypfn = 0x100; // hard-coded address of jump destination...mypfn();
This error causes an INVSTATE usage fault, which occurs because even though instructions are 16-bit aligned(always even address), the ARM-based processor core uses the lower bit of the destination address todetermine the instruction mode: ARM or Thumb. The Cortex-M processor always executes in Thumb modeso the target address always has the lower bit set. If you disassemble code produced by the compiler, noticethat the address it uses for functions is always odd. Also, if you look back in this application note at some ofthe screen captures showing the exception stack frame, note that the saved value of the LR is also alwaysodd.
Diagnosing Software Faults in Stellaris® Microcontrollers 17AN01286–May 2012Copyright © 2012 Texas Instruments Incorporated
Typical Faults and How to Avoid Themwww.ti.com
5 General Fault Debug FlowListed below are the general steps to follow to debug a fault. These are the steps used in the examples earlierin this application note. Often you can collect enough clues to allow you to solve the problem before it becomesnecessary to follow all the steps.1. Examine the NVIC_FAULT_STAT register at 0xE000.ED28 to determine the type of fault.2. If either the MMARVALID or BFARVALID bits are set, read the corresponding Fault Address Register
(MMADR or FAULTADDR) to get the faulting address.3. Find the value of the stack pointer in the fault handler.4. If needed, adjust the stack pointer to find the address of the exception stack frame. This step is necessary
if your fault handler function allocates storage on the stack. For the StellarisWare examples, no adjustmentis needed.
5. Get the value of the saved PC from the exception stack frame.6. Disassemble the code at the location of the saved PC to find the instruction that caused the fault.
Sometimes the saved PC does not point to the exact instruction that caused the fault, but only in thegeneral location.
7. For an imprecise bus fault, look for the most recent store instruction that executed prior to the occurrenceof the fault.
8. Use the saved values of the other working registers, as needed, to reconstruct the instruction operands.9. Use the saved value of the LR to find the prior function in the call stack. Sometimes the saved LR value
cannot be used this way.
6 ConclusionThe Stellaris Cortex-M processor provides a powerful fault handling system and several features to help youfind the cause of a fault. After debugging a few faults, you will be more comfortable handling and troubleshootingfaults as they happen, and will be able to find the cause in a few minutes.
7 ReferencesThis application note provides information about Stellaris Cortex-M registers and other features related tofault handling. This information is presented at a summary level and does not serve as a reference for thesefeatures. For detailed information about Stellaris fault handling, see the following related documents whichare available on the Stellaris web site at www.ti.com/stellaris:• Stellaris Microcontroller Data Sheet• Stellaris® Errata• ARM® Cortex™-M Errata• Cortex™-M3/M4 Instruction Set Technical User's Manual• The Definitive Guide to the ARM® Cortex-M3 by Joseph Yiu
AN01286–May 201218 Diagnosing Software Faults in Stellaris® MicrocontrollersCopyright © 2012 Texas Instruments Incorporated
General Fault Debug Flow www.ti.com
IMPORTANT NOTICE
Texas Instruments Incorporated and its subsidiaries (TI) reserve the right to make corrections, modifications, enhancements, improvements,and other changes to its products and services at any time and to discontinue any product or service without notice. Customers shouldobtain the latest relevant information before placing orders and should verify that such information is current and complete. All products aresold subject to TI’s terms and conditions of sale supplied at the time of order acknowledgment.
TI warrants performance of its hardware products to the specifications applicable at the time of sale in accordance with TI’s standardwarranty. Testing and other quality control techniques are used to the extent TI deems necessary to support this warranty. Except wheremandated by government requirements, testing of all parameters of each product is not necessarily performed.
TI assumes no liability for applications assistance or customer product design. Customers are responsible for their products andapplications using TI components. To minimize the risks associated with customer products and applications, customers should provideadequate design and operating safeguards.
TI does not warrant or represent that any license, either express or implied, is granted under any TI patent right, copyright, mask work right,or other TI intellectual property right relating to any combination, machine, or process in which TI products or services are used. Informationpublished by TI regarding third-party products or services does not constitute a license from TI to use such products or services or awarranty or endorsement thereof. Use of such information may require a license from a third party under the patents or other intellectualproperty of the third party, or a license from TI under the patents or other intellectual property of TI.
Reproduction of TI information in TI data books or data sheets is permissible only if reproduction is without alteration and is accompaniedby all associated warranties, conditions, limitations, and notices. Reproduction of this information with alteration is an unfair and deceptivebusiness practice. TI is not responsible or liable for such altered documentation. Information of third parties may be subject to additionalrestrictions.
Resale of TI products or services with statements different from or beyond the parameters stated by TI for that product or service voids allexpress and any implied warranties for the associated TI product or service and is an unfair and deceptive business practice. TI is notresponsible or liable for any such statements.
TI products are not authorized for use in safety-critical applications (such as life support) where a failure of the TI product would reasonablybe expected to cause severe personal injury or death, unless officers of the parties have executed an agreement specifically governingsuch use. Buyers represent that they have all necessary expertise in the safety and regulatory ramifications of their applications, andacknowledge and agree that they are solely responsible for all legal, regulatory and safety-related requirements concerning their productsand any use of TI products in such safety-critical applications, notwithstanding any applications-related information or support that may beprovided by TI. Further, Buyers must fully indemnify TI and its representatives against any damages arising out of the use of TI products insuch safety-critical applications.
TI products are neither designed nor intended for use in military/aerospace applications or environments unless the TI products arespecifically designated by TI as military-grade or "enhanced plastic." Only products designated by TI as military-grade meet militaryspecifications. Buyers acknowledge and agree that any such use of TI products which TI has not designated as military-grade is solely atthe Buyer's risk, and that they are solely responsible for compliance with all legal and regulatory requirements in connection with such use.
TI products are neither designed nor intended for use in automotive applications or environments unless the specific TI products aredesignated by TI as compliant with ISO/TS 16949 requirements. Buyers acknowledge and agree that, if they use any non-designatedproducts in automotive applications, TI will not be responsible for any failure to meet such requirements.
Following are URLs where you can obtain information on other Texas Instruments products and application solutions:
Products Applications
Audio www.ti.com/audio Automotive and Transportation www.ti.com/automotive
Amplifiers amplifier.ti.com Communications and Telecom www.ti.com/communications
Data Converters dataconverter.ti.com Computers and Peripherals www.ti.com/computers
DLP® Products www.dlp.com Consumer Electronics www.ti.com/consumer-apps
DSP dsp.ti.com Energy and Lighting www.ti.com/energy
Clocks and Timers www.ti.com/clocks Industrial www.ti.com/industrial
Interface interface.ti.com Medical www.ti.com/medical
Logic logic.ti.com Security www.ti.com/security
Power Mgmt power.ti.com Space, Avionics and Defense www.ti.com/space-avionics-defense
Microcontrollers microcontroller.ti.com Video and Imaging www.ti.com/video
RFID www.ti-rfid.com
OMAP Mobile Processors www.ti.com/omap
Wireless Connectivity www.ti.com/wirelessconnectivity
TI E2E Community Home Page e2e.ti.com
Mailing Address: Texas Instruments, Post Office Box 655303, Dallas, Texas 75265Copyright © 2012, Texas Instruments Incorporated