Embed Size (px)
Citation preview
Diagnosing a Quality and Safety Problem in Your Peritoneal Dialysis Unit
SAMUEL SILVER
QUEEN’S UNIVERSITY
ISPD 2018
MAY 7, 2018
Conflicts of Interest •Honorarium from Sanofi Canada to speak about quality improvement and CKD-MBD

Objectives
To demonstrate tools that can identify quality of care problems
To illustrate principles of change idea development

Culture Eats Strategy for Breakfast
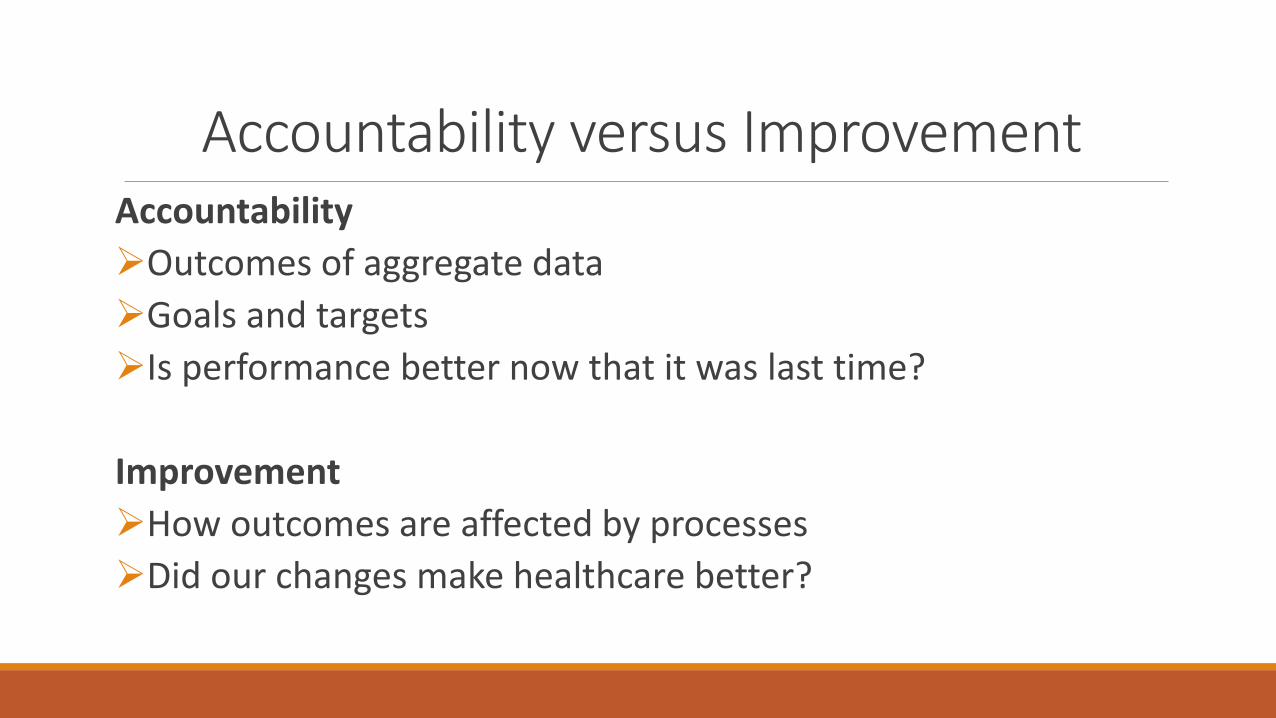
Accountability
Outcomes of aggregate data
Goals and targets
Is performance better now that it was last time?
Improvement
How outcomes are affected by processes
Did our changes make healthcare better?
Accountability versus Improvement
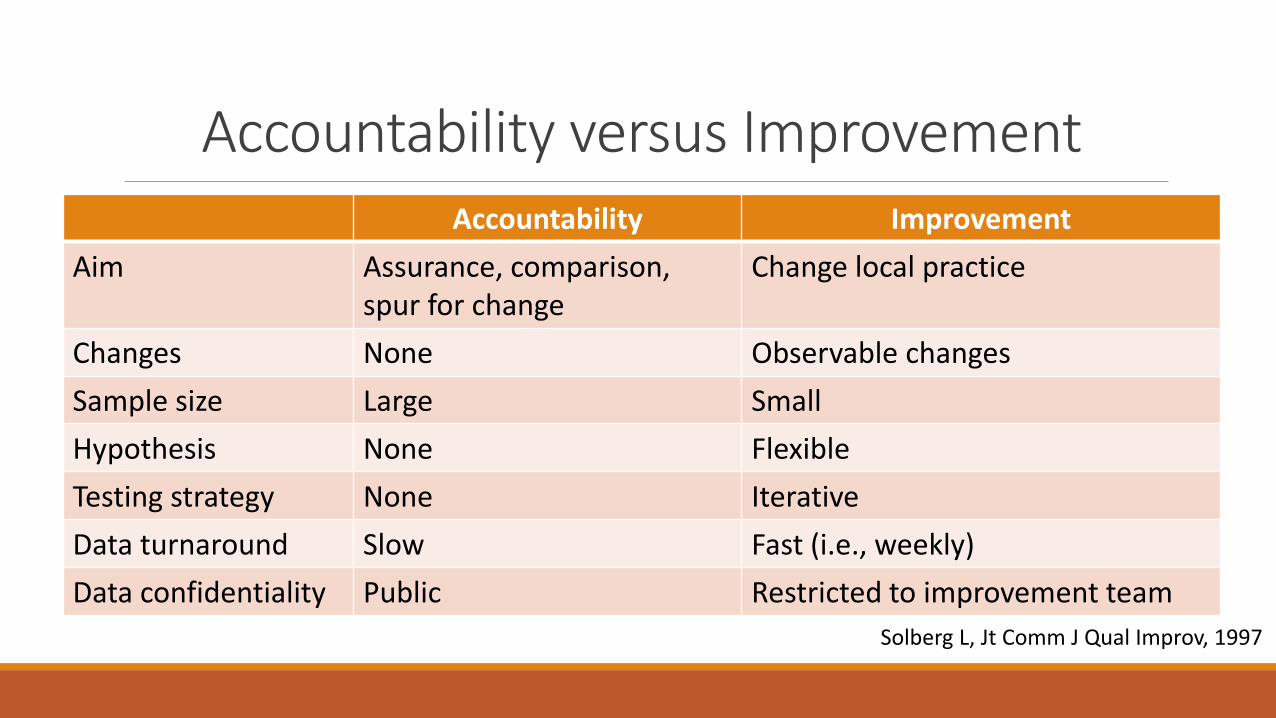
Accountability versus Improvement Accountability Improvement
Aim Assurance, comparison, spur for change
Change local practice
Changes None Observable changes
Sample size Large Small
Hypothesis None Flexible
Testing strategy None Iterative
Data turnaround Slow Fast (i.e., weekly)
Data confidentiality Public Restricted to improvement team
Solberg L, Jt Comm J Qual Improv, 1997

Accountability versus Improvement
Monthly reviews = accountability Evaluation of a local process change = improvement
Total # of patients on peritoneal dialysis # of new patients started on peritoneal dialysis # of catheter insertions Rate of peritonitis Dialysis adequacy

Frequent and severe problem (trigger event?)
Under your direct control
Feasible (how many resources are needed?)
Few unintended consequences
Synergy with other improvement activities at provincial or hospital level
Patient/staff satisfaction
Select the Right QI Target
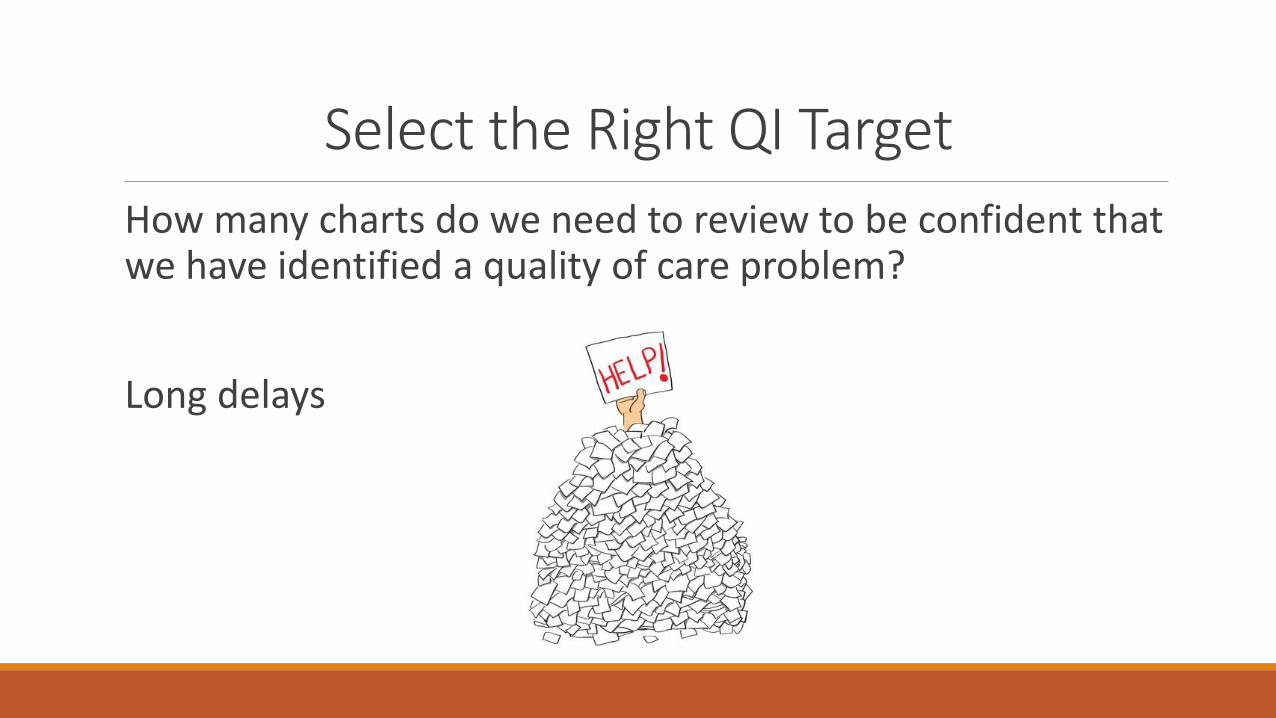
Select the Right QI Target
How many charts do we need to review to be confident that we have identified a quality of care problem?
Long delays
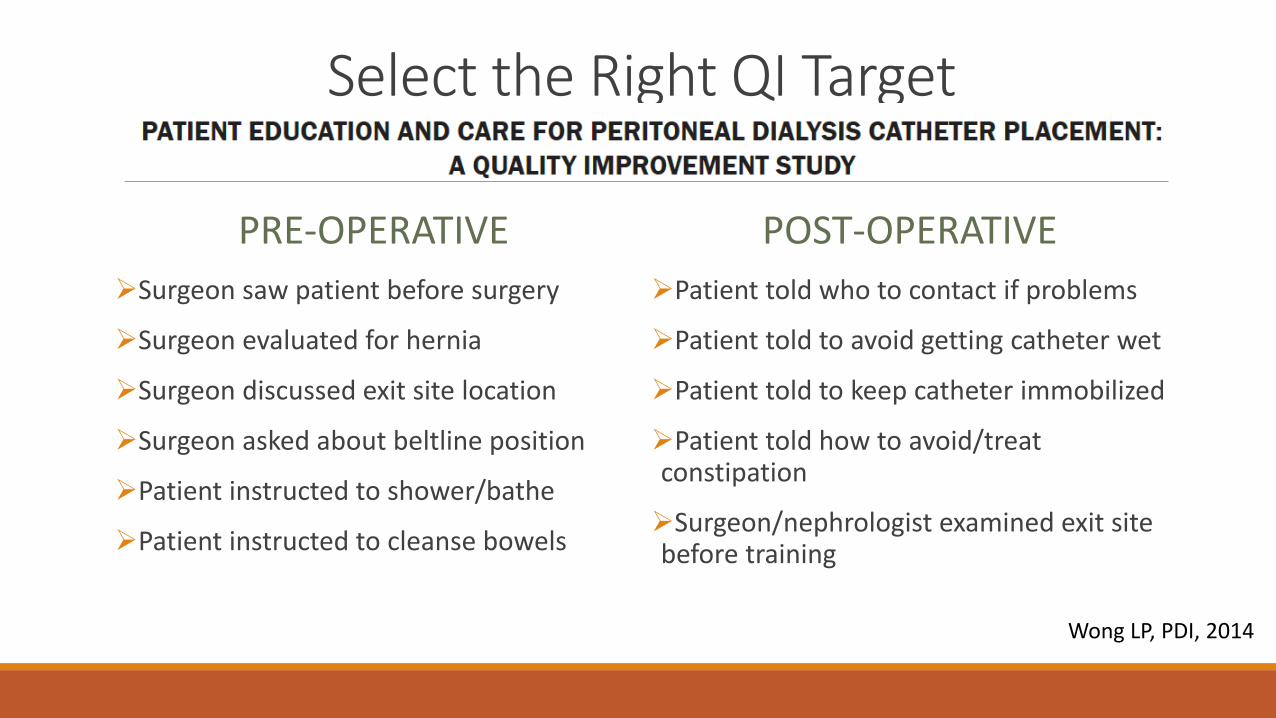
Select the Right QI Target
PRE-OPERATIVE
Surgeon saw patient before surgery
Surgeon evaluated for hernia
Surgeon discussed exit site location
Surgeon asked about beltline position
Patient instructed to shower/bathe
Patient instructed to cleanse bowels
POST-OPERATIVE
Patient told who to contact if problems
Patient told to avoid getting catheter wet
Patient told to keep catheter immobilized
Patient told how to avoid/treat constipation
Surgeon/nephrologist examined exit site before training
Wong LP, PDI, 2014

Etchells E, BMJ Qual Saf, 2016
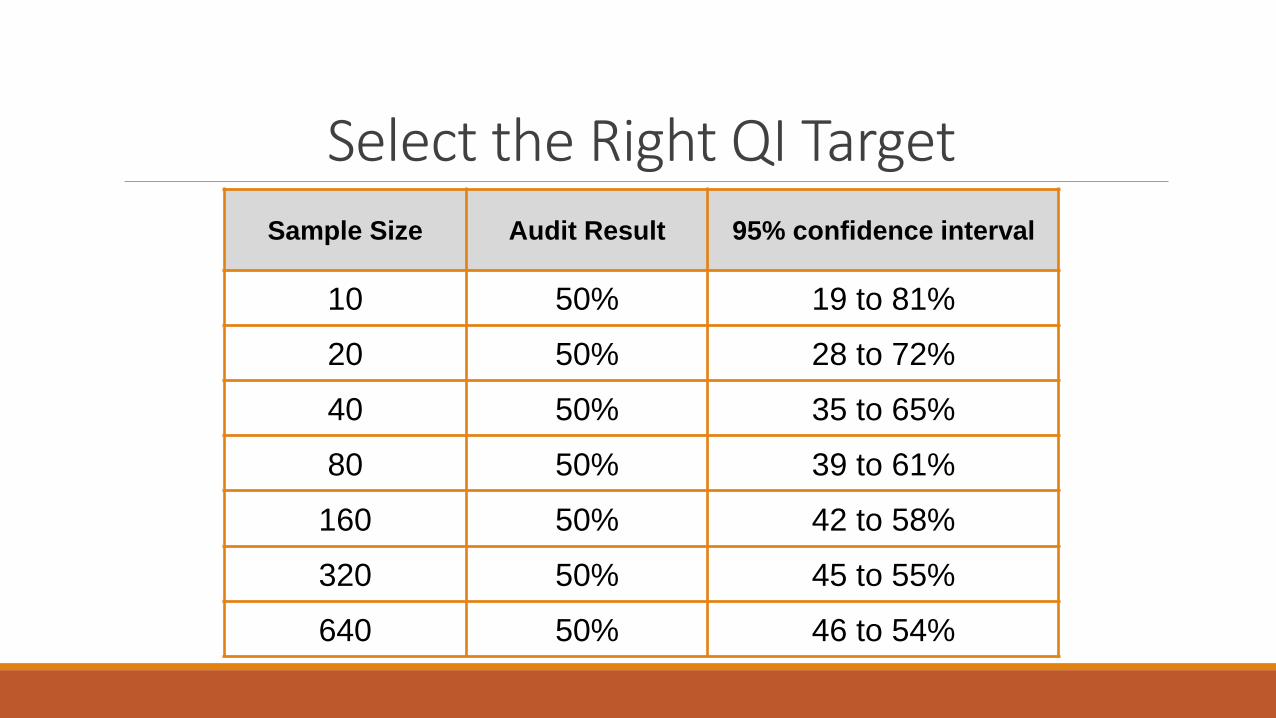
Select the Right QI Target Sample Size Audit Result 95% confidence interval
10 50% 19 to 81%
20 50% 28 to 72%
40 50% 35 to 65%
80 50% 39 to 61%
160 50% 42 to 58%
320 50% 45 to 55%
640 50% 46 to 54%
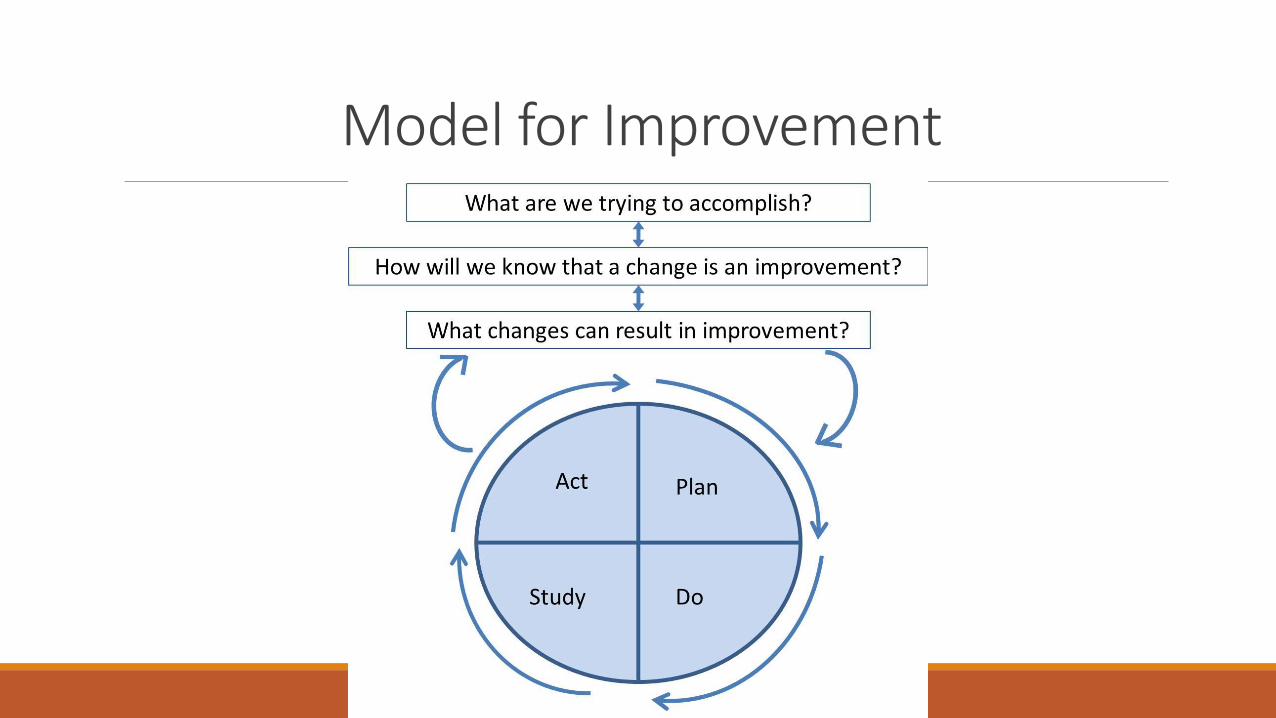
Model for Improvement
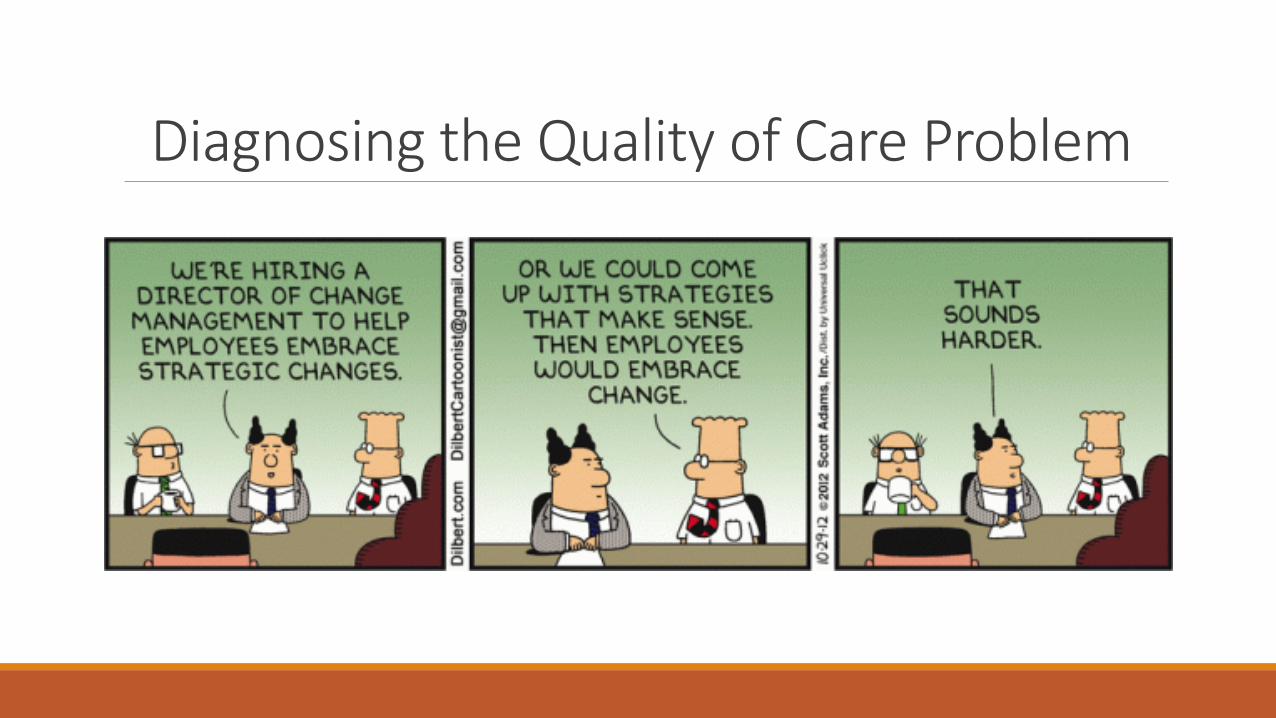
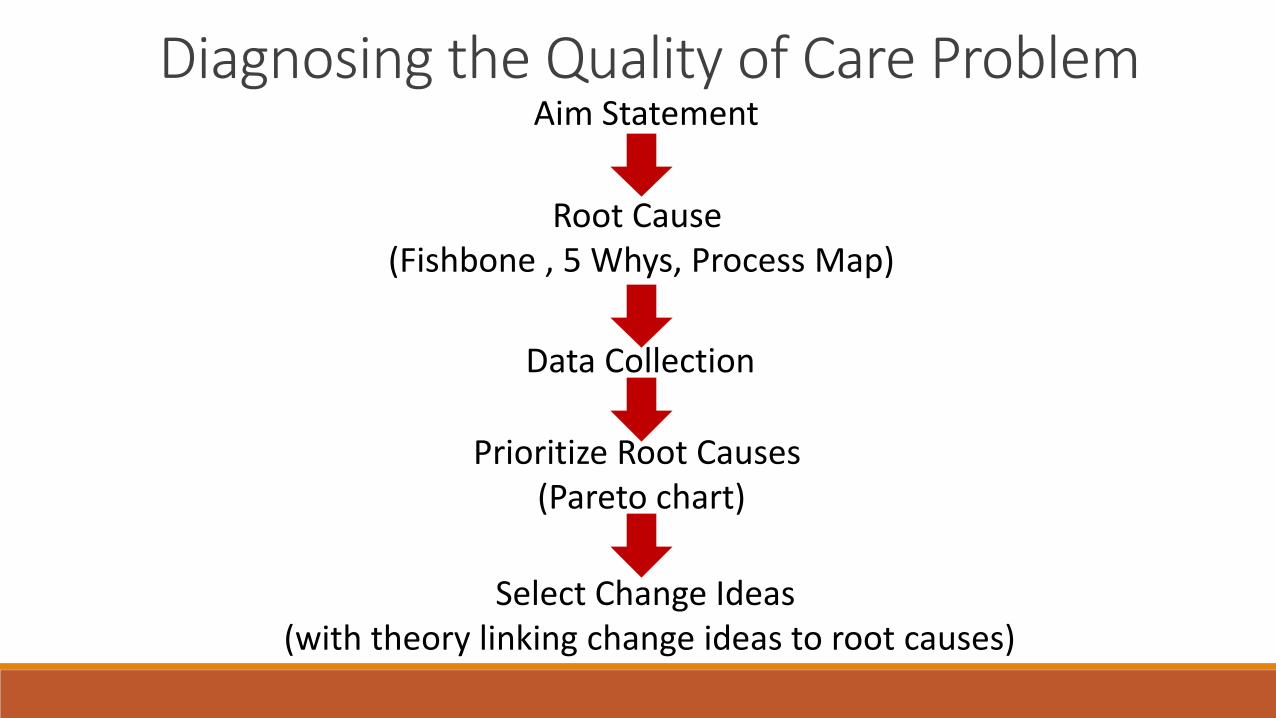
Diagnosing the Quality of Care Problem

Diagnosing the Quality of Care Problem Aim Statement
Root Cause (Fishbone , 5 Whys, Process Map)
Data Collection
Prioritize Root Causes (Pareto chart)
Select Change Ideas (with theory linking change ideas to root causes)
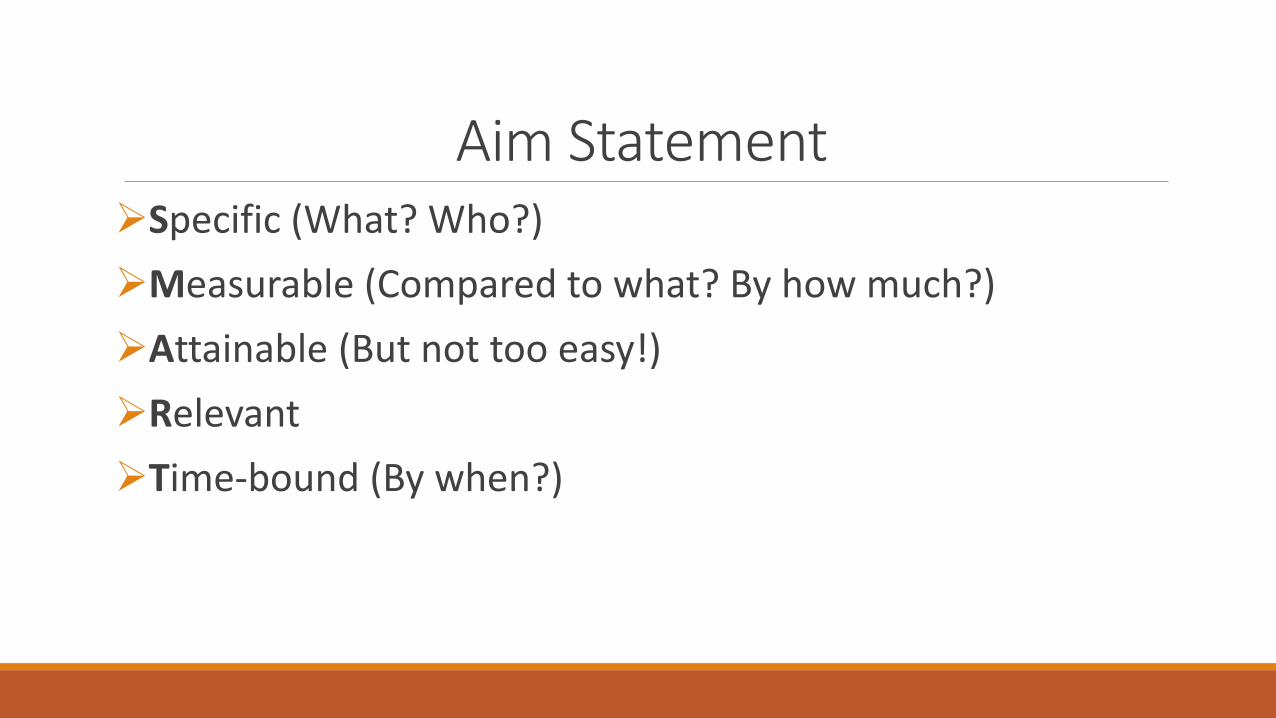
Aim Statement Specific (What? Who?)
Measurable (Compared to what? By how much?)
Attainable (But not too easy!)
Relevant
Time-bound (By when?)
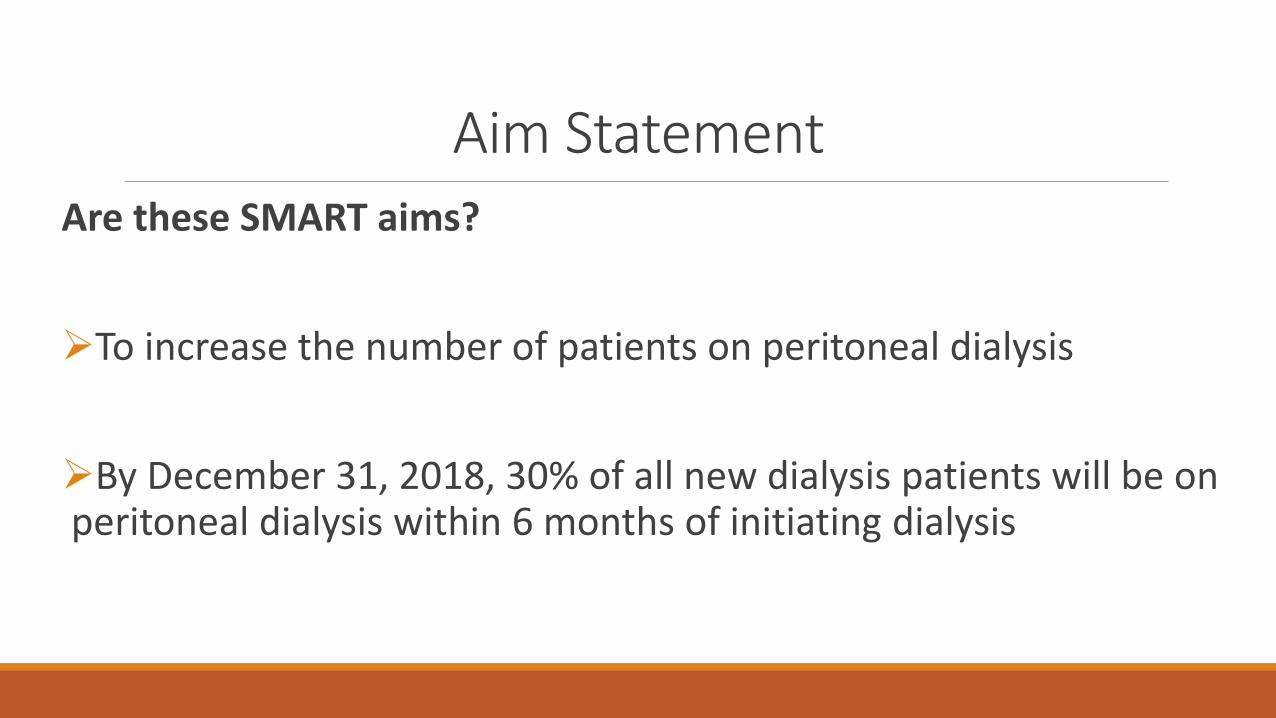
Aim Statement Are these SMART aims?
To increase the number of patients on peritoneal dialysis
By December 31, 2018, 30% of all new dialysis patients will be on peritoneal dialysis within 6 months of initiating dialysis
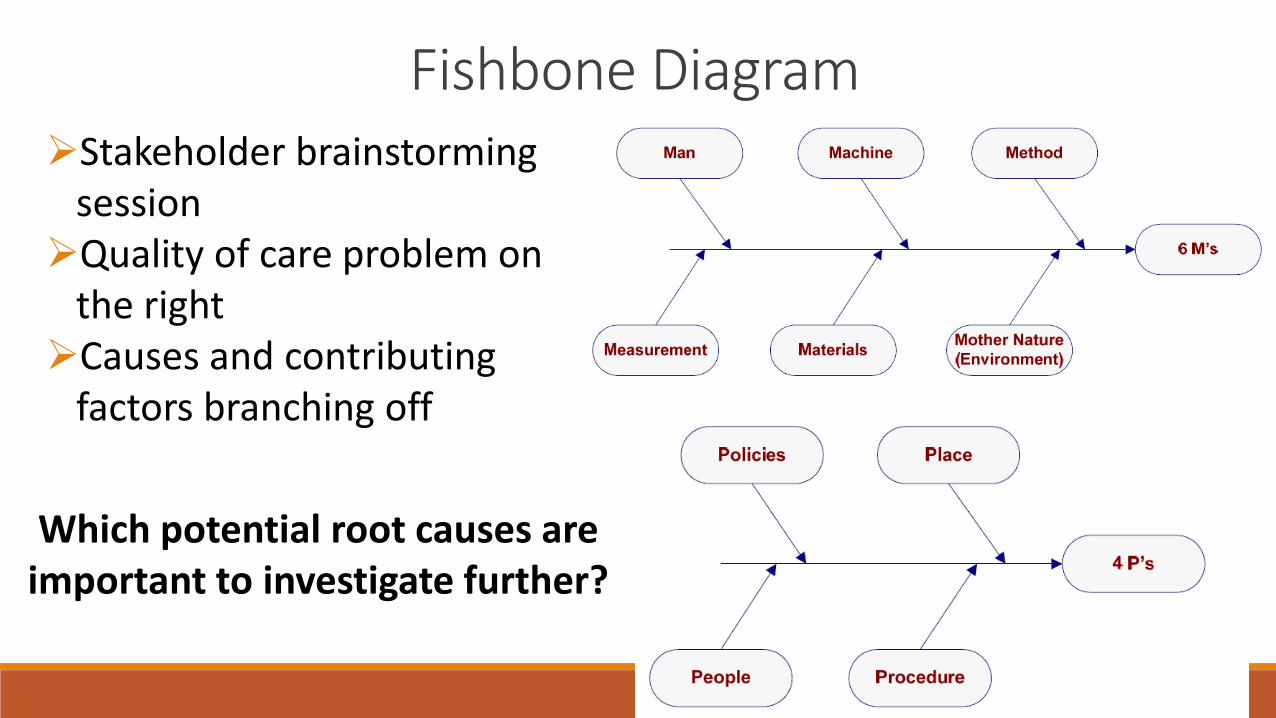
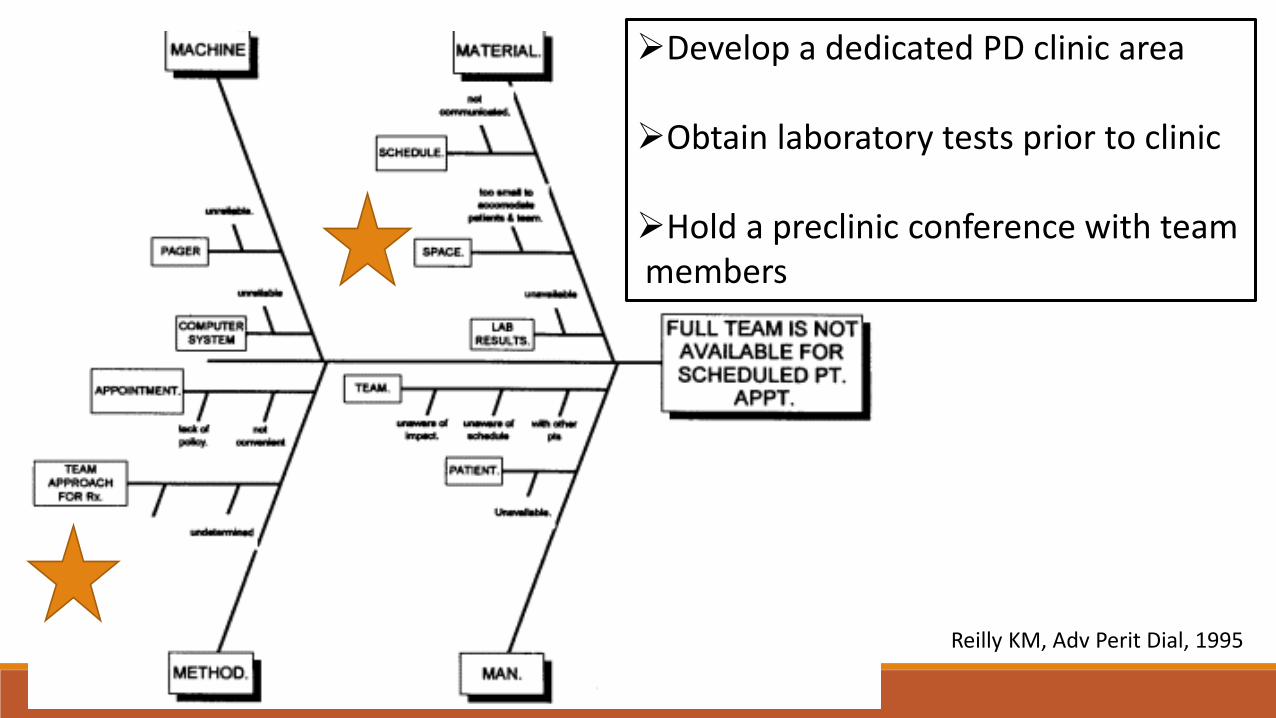
Fishbone Diagram Stakeholder brainstorming
session Quality of care problem on
the right Causes and contributing
factors branching off
Which potential root causes are important to investigate further?

Reilly KM, Adv Perit Dial, 1995
Develop a dedicated PD clinic area Obtain laboratory tests prior to clinic Hold a preclinic conference with team members
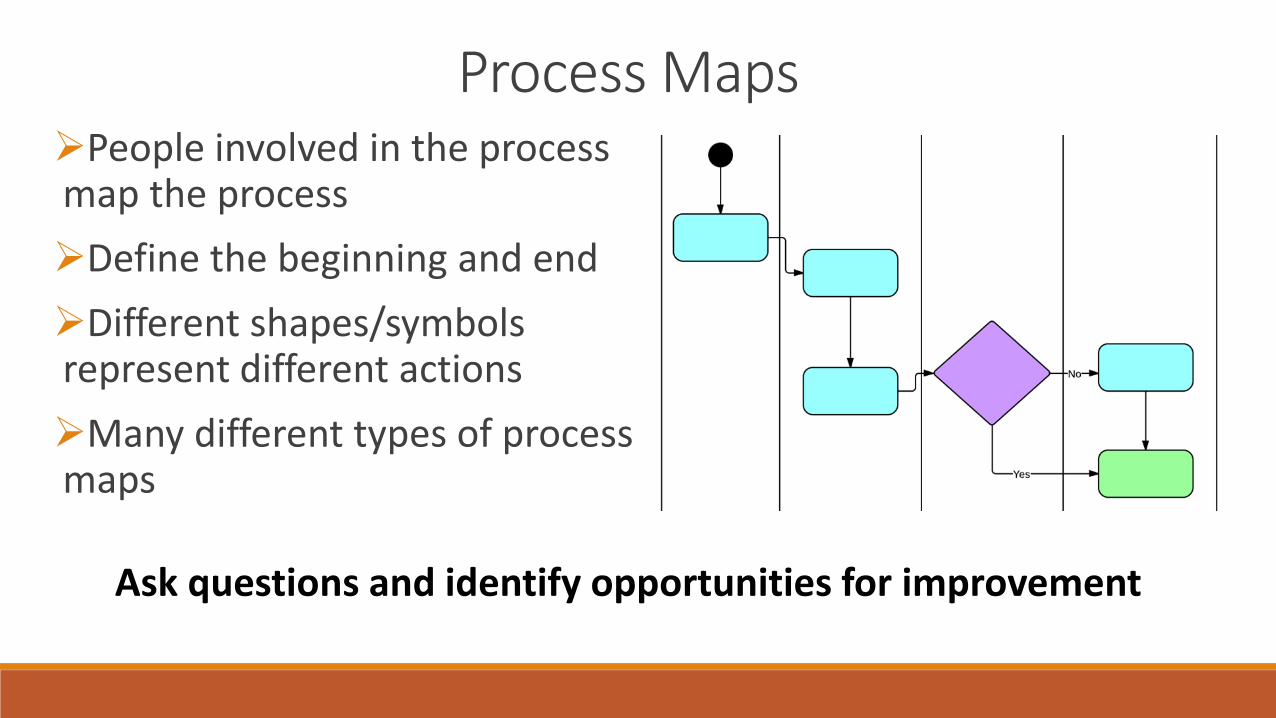
Process Maps People involved in the process map the process
Define the beginning and end
Different shapes/symbols represent different actions
Many different types of process maps
Ask questions and identify opportunities for improvement
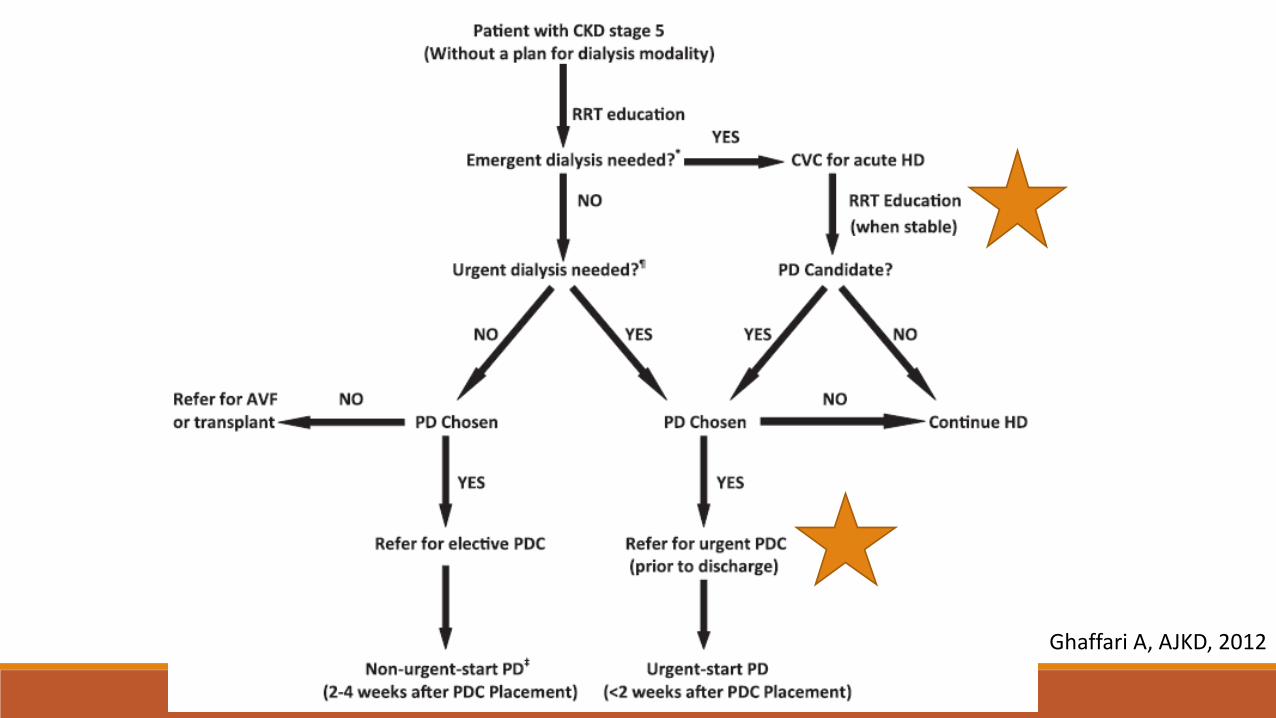
Ghaffari A, AJKD, 2012

Process Maps Slide courtesy of Peter
Woodbridge, Veterans Affairs
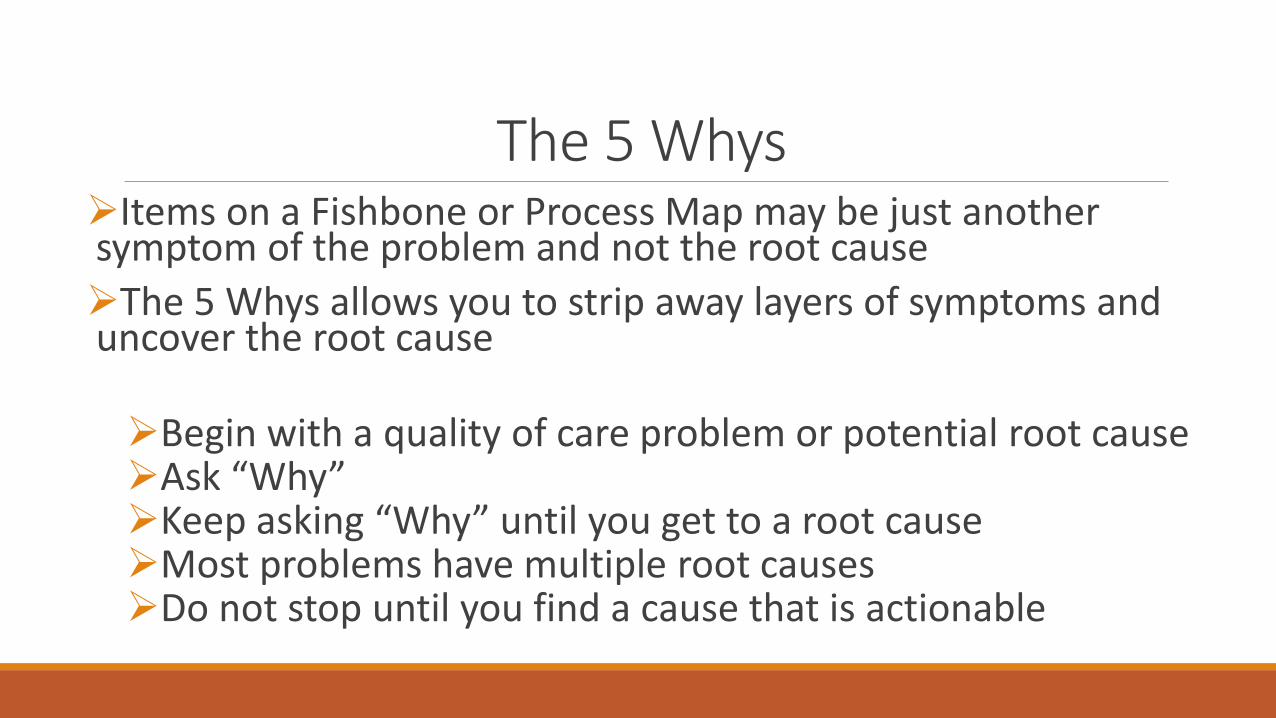
The 5 Whys Items on a Fishbone or Process Map may be just another symptom of the problem and not the root cause
The 5 Whys allows you to strip away layers of symptoms and uncover the root cause
Begin with a quality of care problem or potential root cause Ask “Why” Keep asking “Why” until you get to a root cause Most problems have multiple root causes Do not stop until you find a cause that is actionable
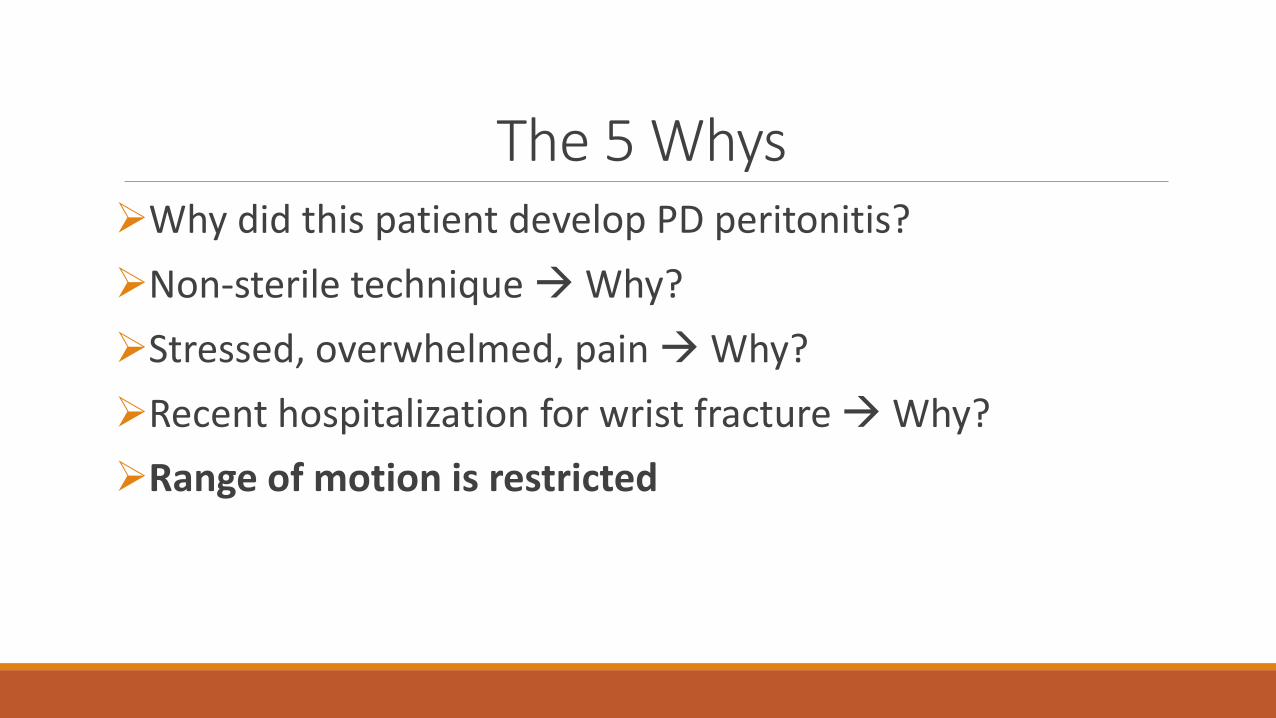
The 5 Whys Why did this patient develop PD peritonitis?
Non-sterile technique Why?
Stressed, overwhelmed, pain Why?
Recent hospitalization for wrist fracture Why?
Range of motion is restricted

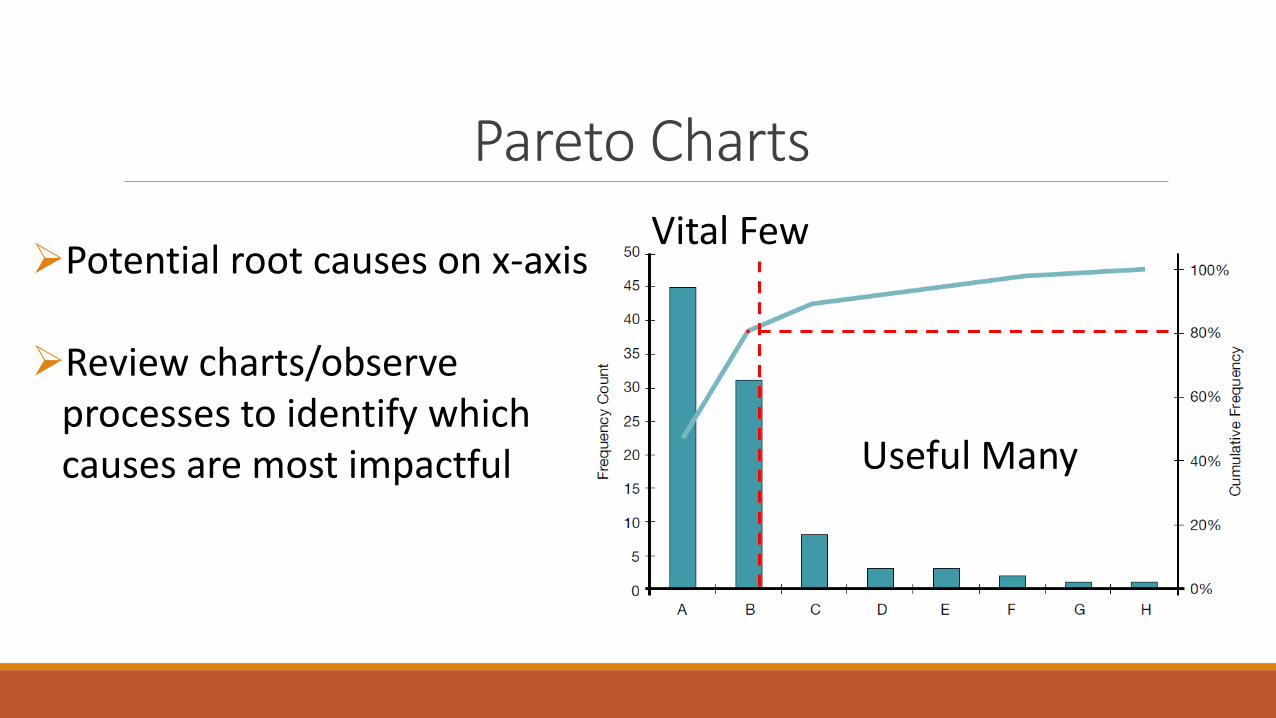
Pareto Charts
Potential root causes on x-axis Review charts/observe
processes to identify which causes are most impactful Useful Many
Vital Few
Reilly KM, Adv Perit Dial, 1995
Develop a dedicated PD clinic area Obtain laboratory tests prior to clinic Hold a preclinic conference with team members
Pareto Charts
Potential root causes on x-axis Review charts/observe
processes to identify which causes are most impactful Useful Many
Vital Few
Diagnosing the Quality of Care Problem Aim Statement
Root Cause (Fishbone , 5 Whys, Process Map)
Data Collection
Prioritize Root Causes (Pareto chart)
Select Change Ideas (with theory linking change ideas to root causes)
Objectives
To demonstrate tools that can identify quality of care problems
To illustrate principles of change idea development
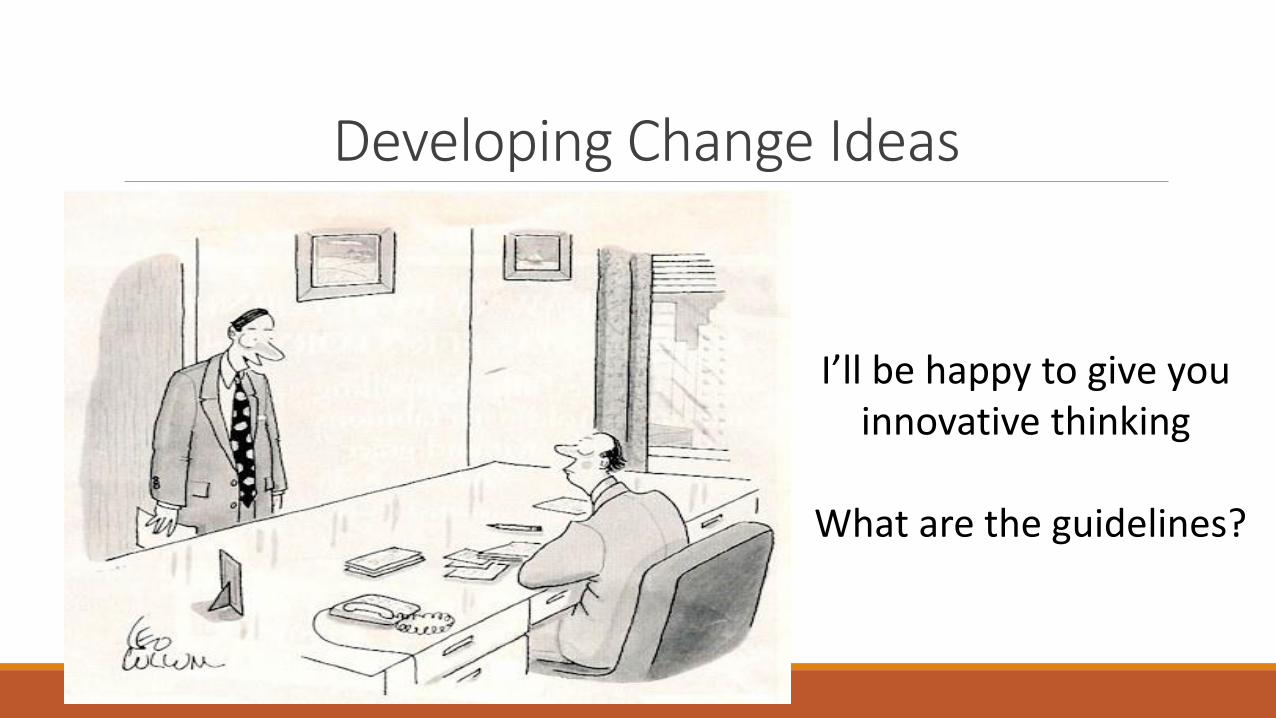
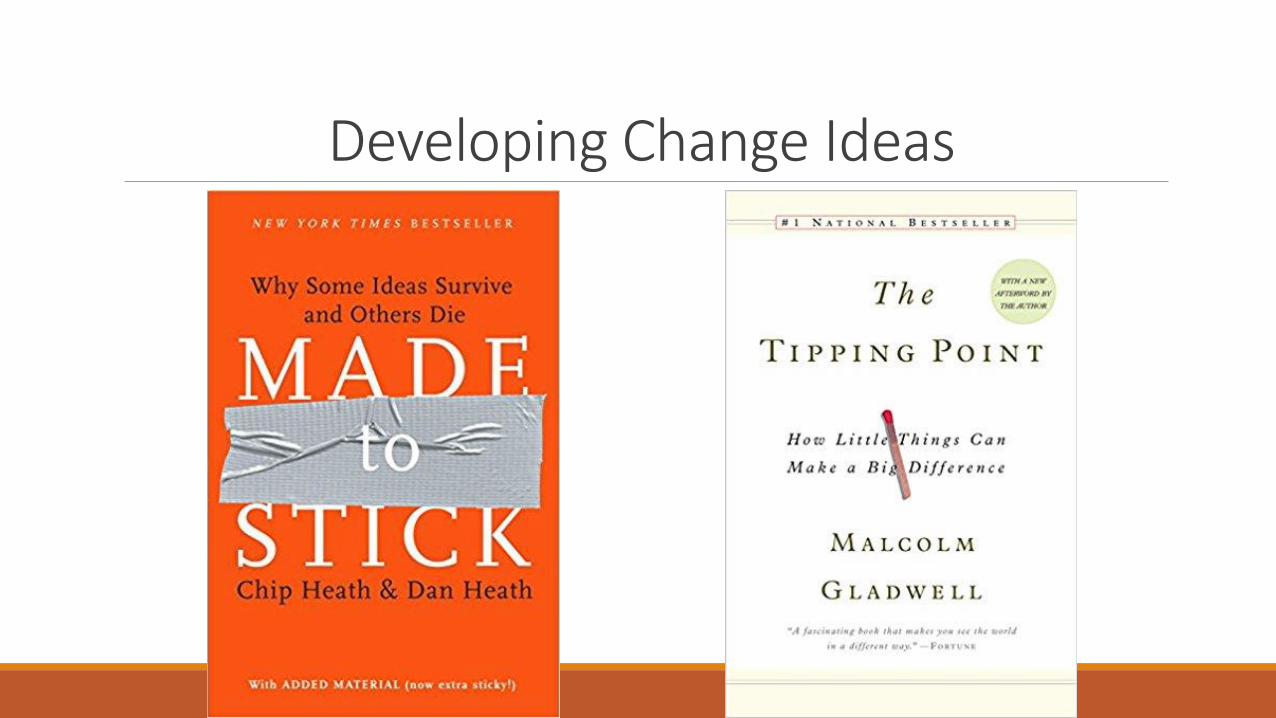
Developing Change Ideas
I’ll be happy to give you innovative thinking
What are the guidelines?
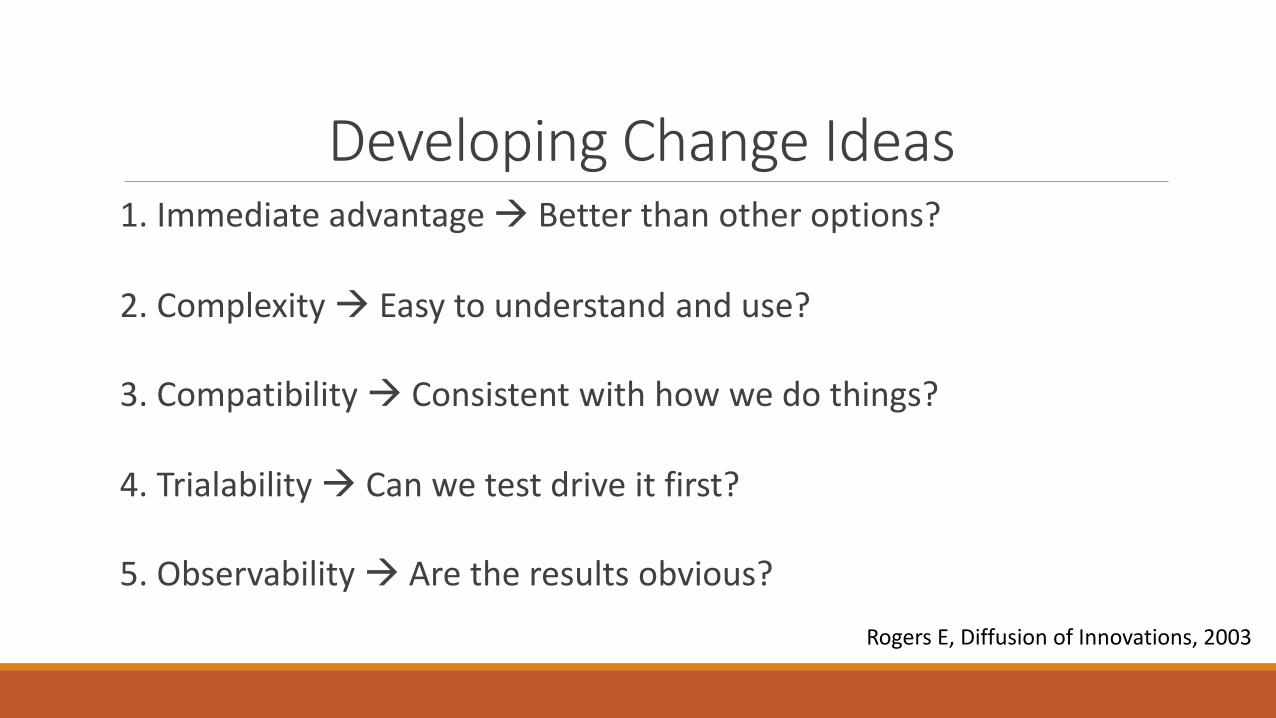
Developing Change Ideas 1. Immediate advantage Better than other options?
2. Complexity Easy to understand and use?
3. Compatibility Consistent with how we do things?
4. Trialability Can we test drive it first?
5. Observability Are the results obvious?
Rogers E, Diffusion of Innovations, 2003
Developing Change Ideas
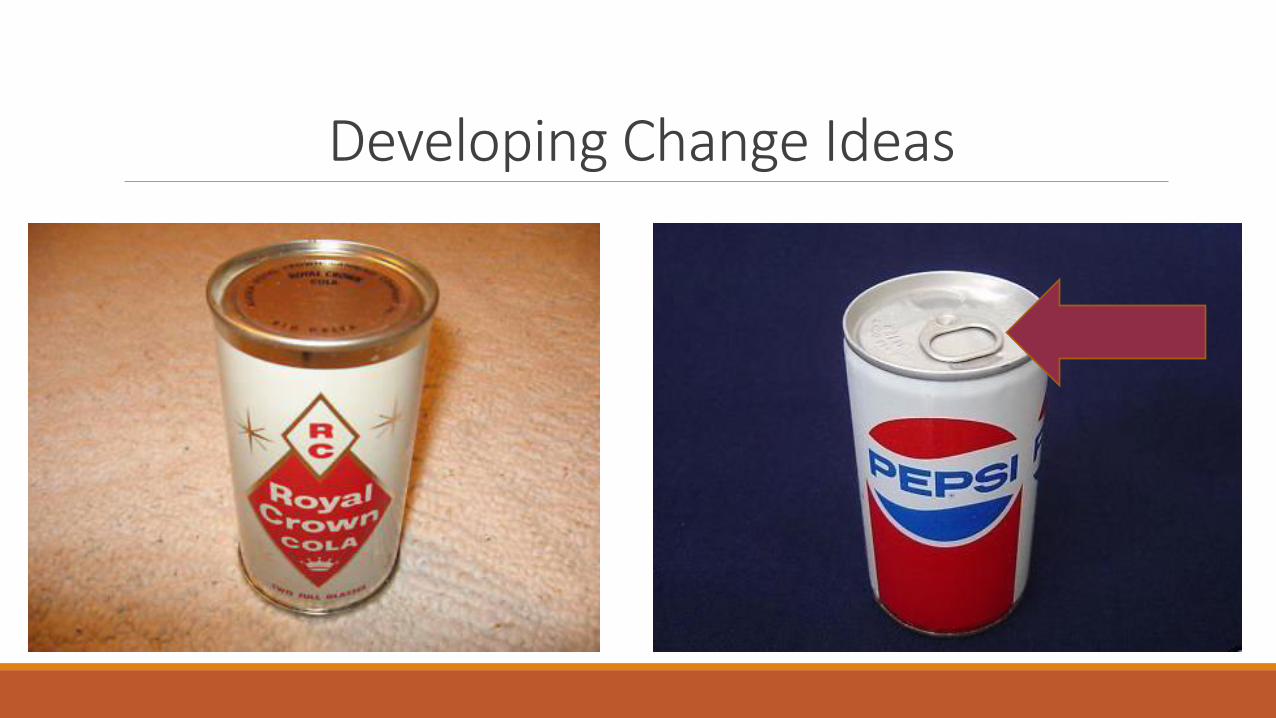
Developing Change Ideas
Developing Change Ideas Benchmarking against best practices
Literature, conferences, collaboratives, site visits

Developing Change Ideas Use change concepts to generate specific change ideas
Eliminate things that are not used
Minimize handoffs
Do tasks in parallel
Reduce choice of features
Give people access to information
Listen to patients
Use constraints
Offer service anytime/anyplace The Improvement Guide, 2009
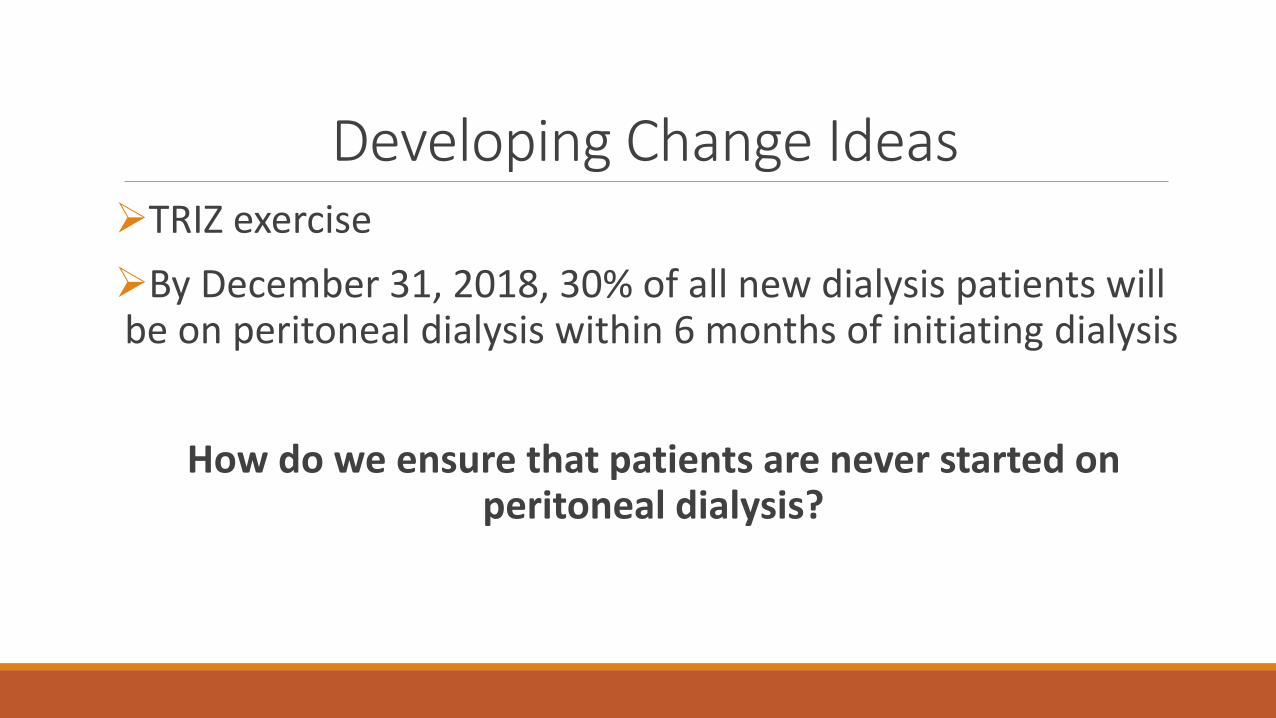
Developing Change Ideas TRIZ exercise
By December 31, 2018, 30% of all new dialysis patients will be on peritoneal dialysis within 6 months of initiating dialysis
How do we ensure that patients are never started on peritoneal dialysis?
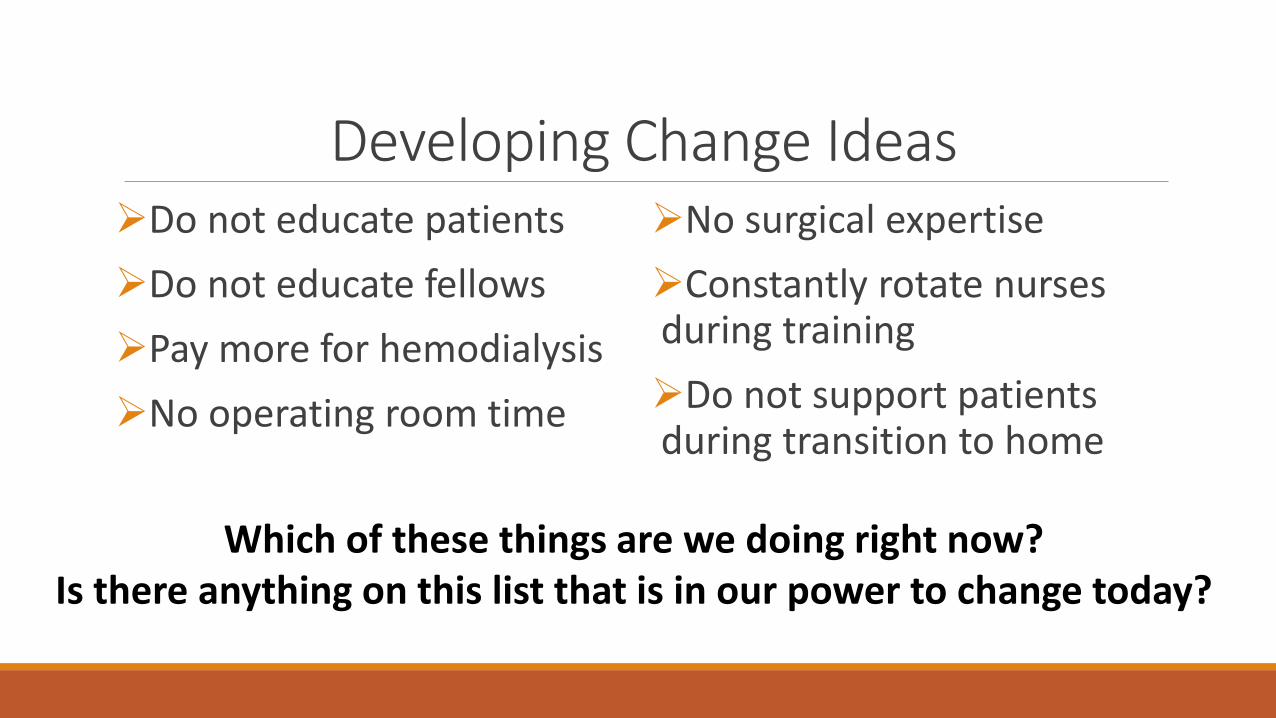
Developing Change Ideas Do not educate patients
Do not educate fellows
Pay more for hemodialysis
No operating room time
No surgical expertise
Constantly rotate nurses during training
Do not support patients during transition to home
Which of these things are we doing right now? Is there anything on this list that is in our power to change today?
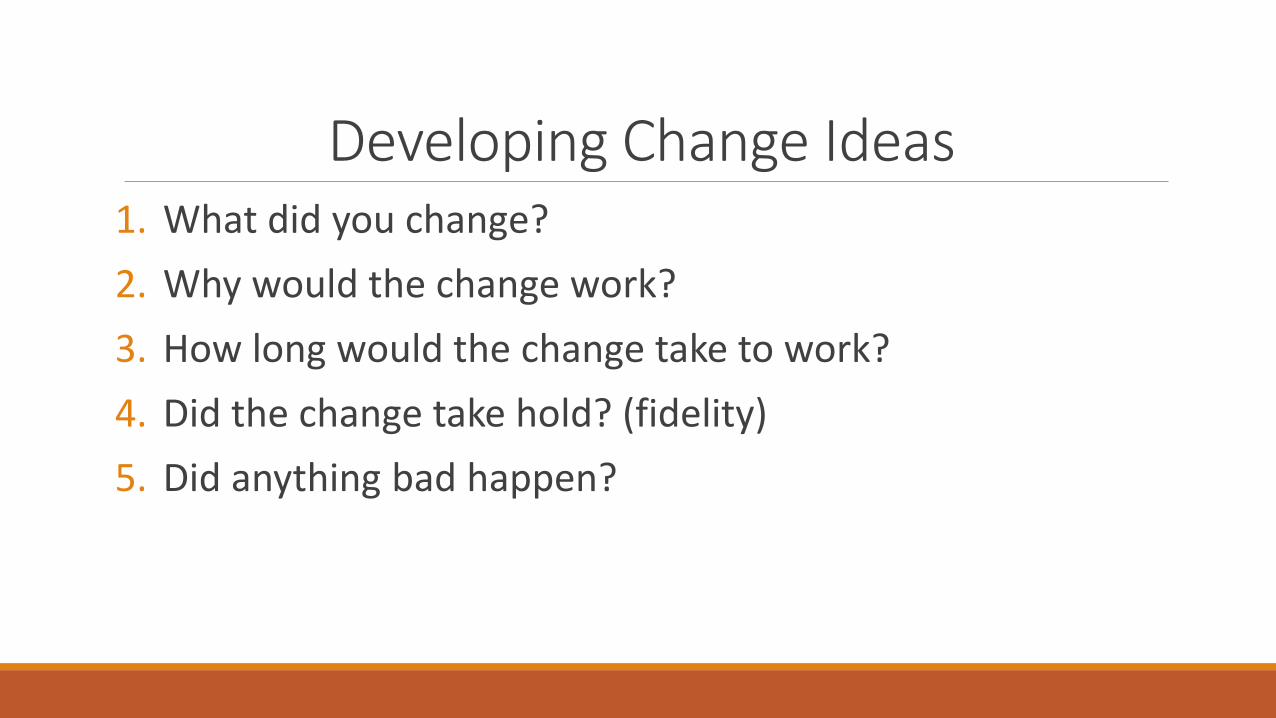
Developing Change Ideas 1. What did you change?
2. Why would the change work?
3. How long would the change take to work?
4. Did the change take hold? (fidelity)
5. Did anything bad happen?
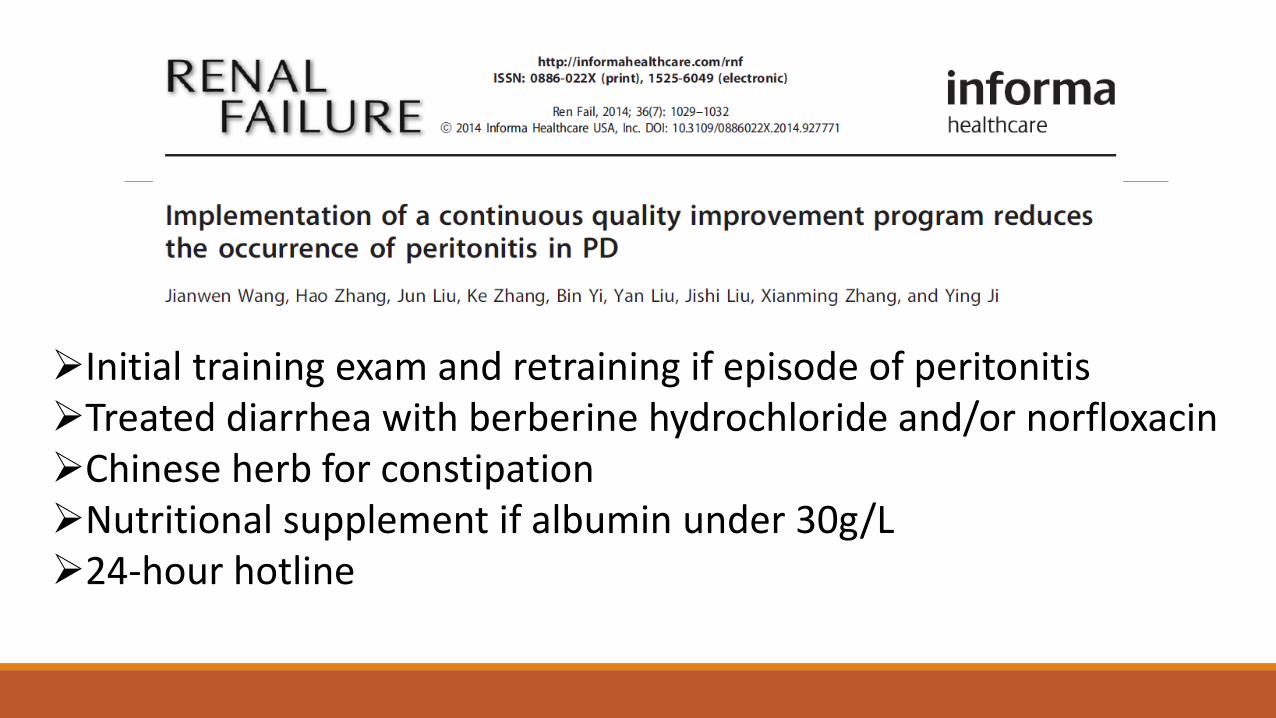
Initial training exam and retraining if episode of peritonitis Treated diarrhea with berberine hydrochloride and/or norfloxacin Chinese herb for constipation Nutritional supplement if albumin under 30g/L 24-hour hotline
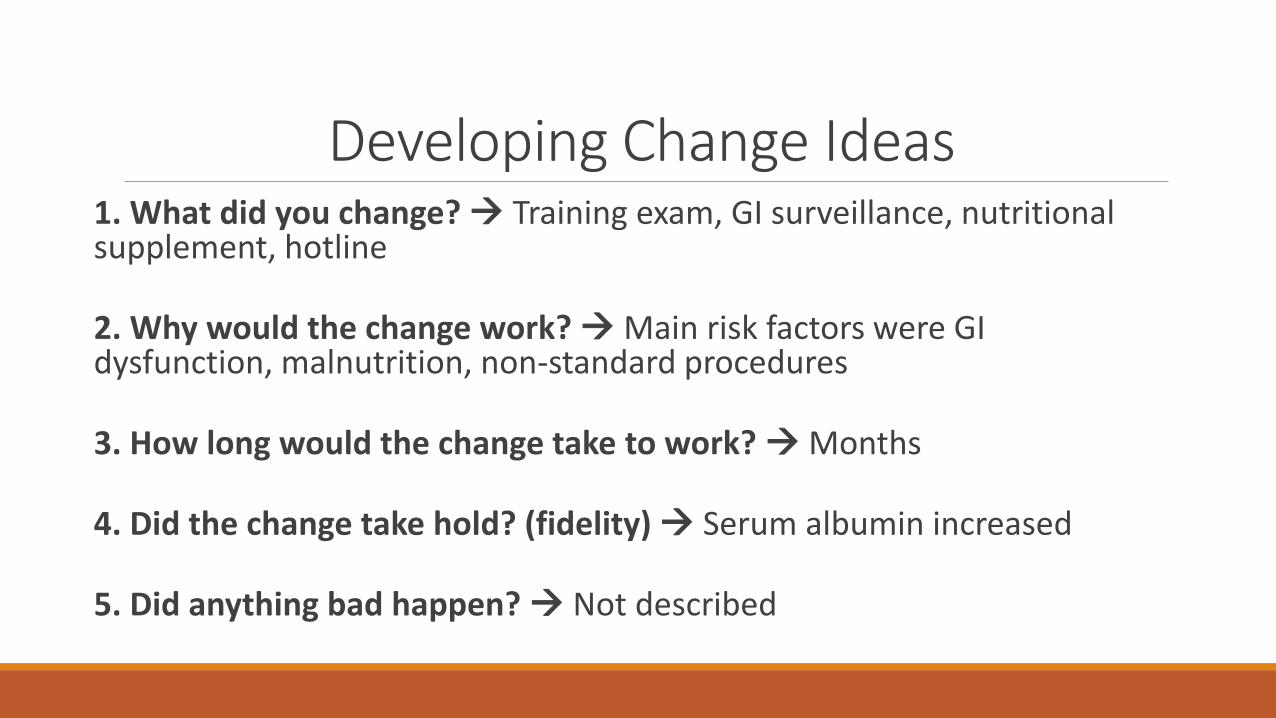
Developing Change Ideas 1. What did you change? Training exam, GI surveillance, nutritional supplement, hotline
2. Why would the change work? Main risk factors were GI dysfunction, malnutrition, non-standard procedures
3. How long would the change take to work? Months
4. Did the change take hold? (fidelity) Serum albumin increased
5. Did anything bad happen? Not described
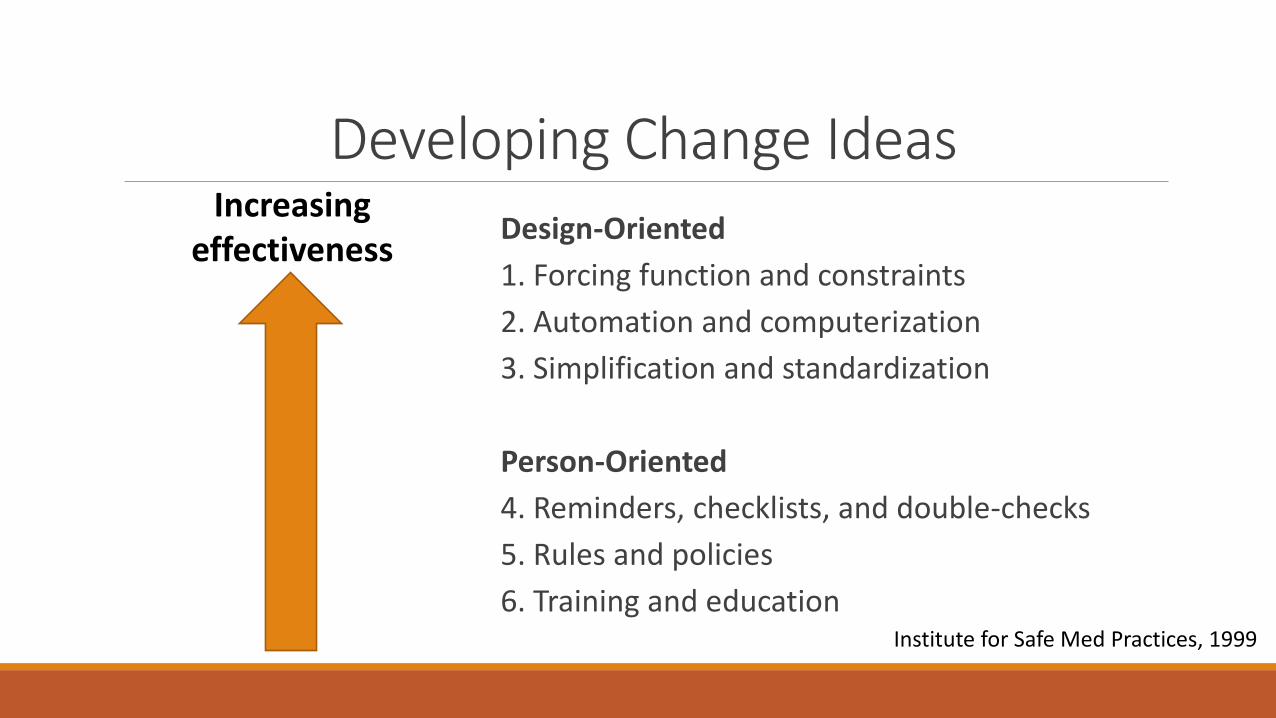
Developing Change Ideas
Design-Oriented
1. Forcing function and constraints
2. Automation and computerization
3. Simplification and standardization
Person-Oriented
4. Reminders, checklists, and double-checks
5. Rules and policies
6. Training and education
Increasing effectiveness
Institute for Safe Med Practices, 1999

Model for Improvement
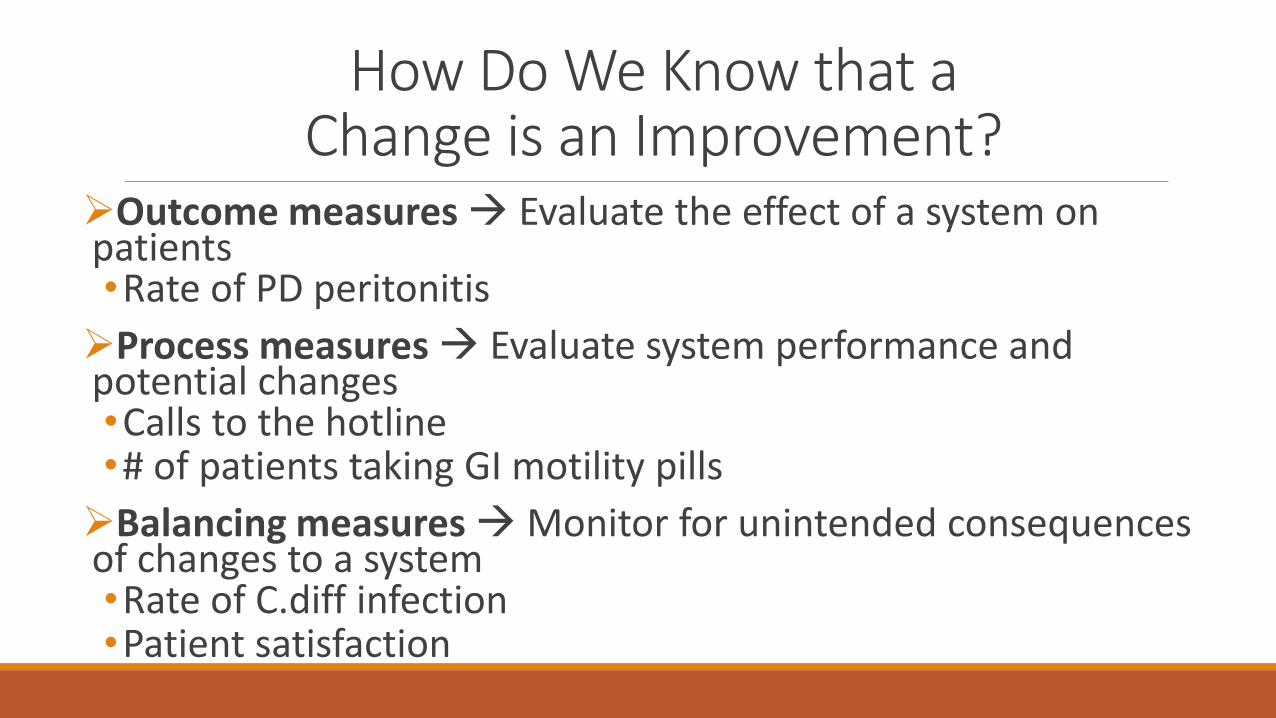
How Do We Know that a Change is an Improvement?
Outcome measures Evaluate the effect of a system on patients •Rate of PD peritonitis
Process measures Evaluate system performance and potential changes •Calls to the hotline •# of patients taking GI motility pills
Balancing measures Monitor for unintended consequences of changes to a system •Rate of C.diff infection •Patient satisfaction
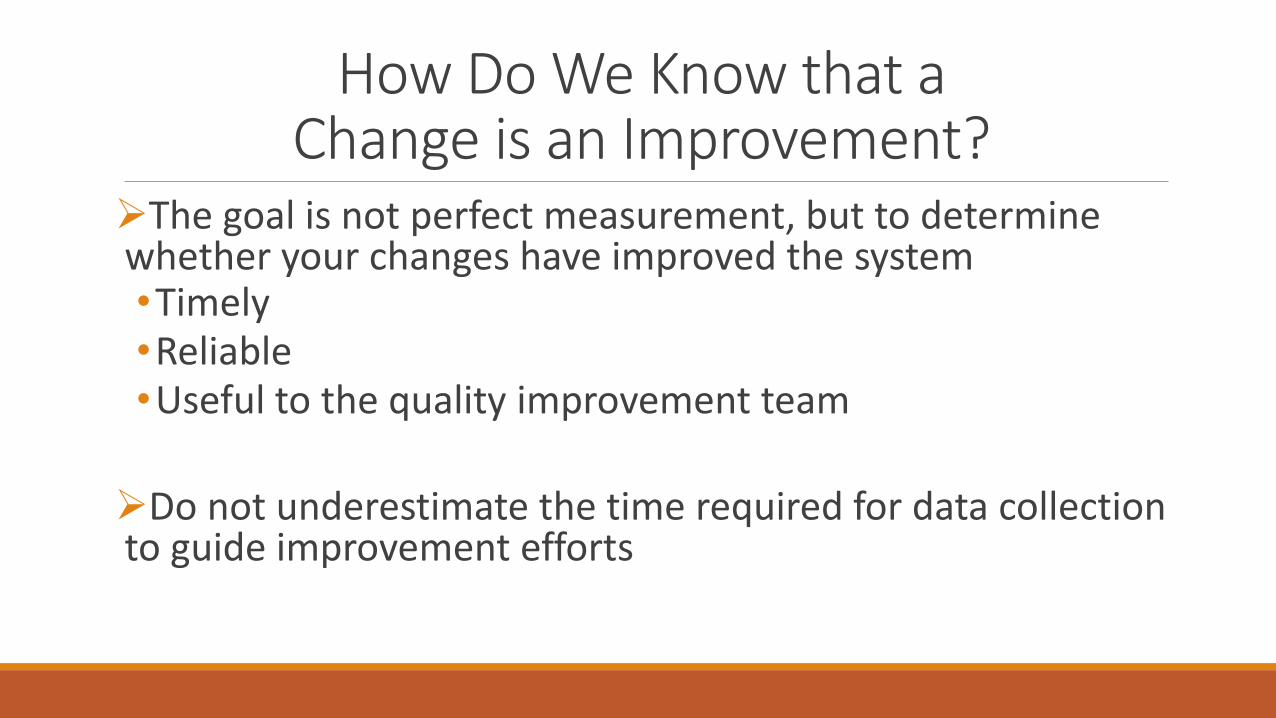
How Do We Know that a Change is an Improvement?
The goal is not perfect measurement, but to determine whether your changes have improved the system •Timely •Reliable •Useful to the quality improvement team
Do not underestimate the time required for data collection to guide improvement efforts
How Do We Know that a Change is an Improvement?

Run Charts
Perla R, BMJ Qual Saf, 2010
Same bar graph, with 3 different interpretations
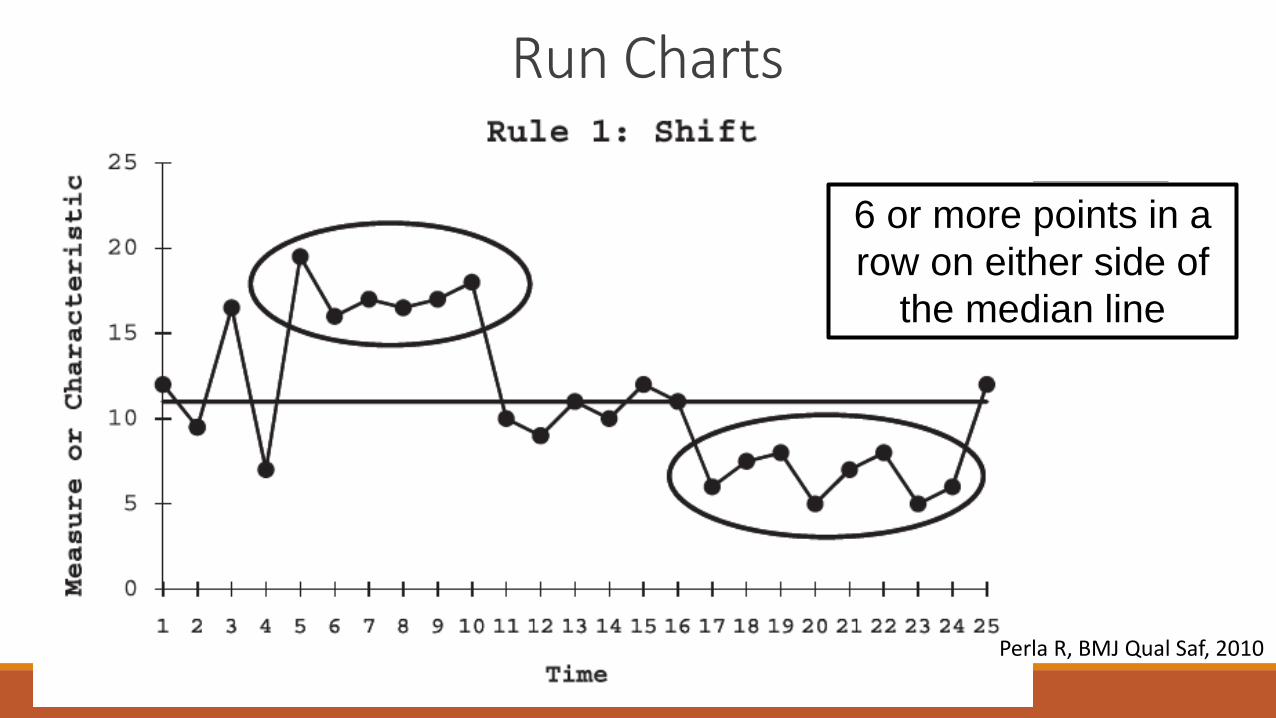
Run Charts
6 or more points in a
row on either side of
the median line
Perla R, BMJ Qual Saf, 2010
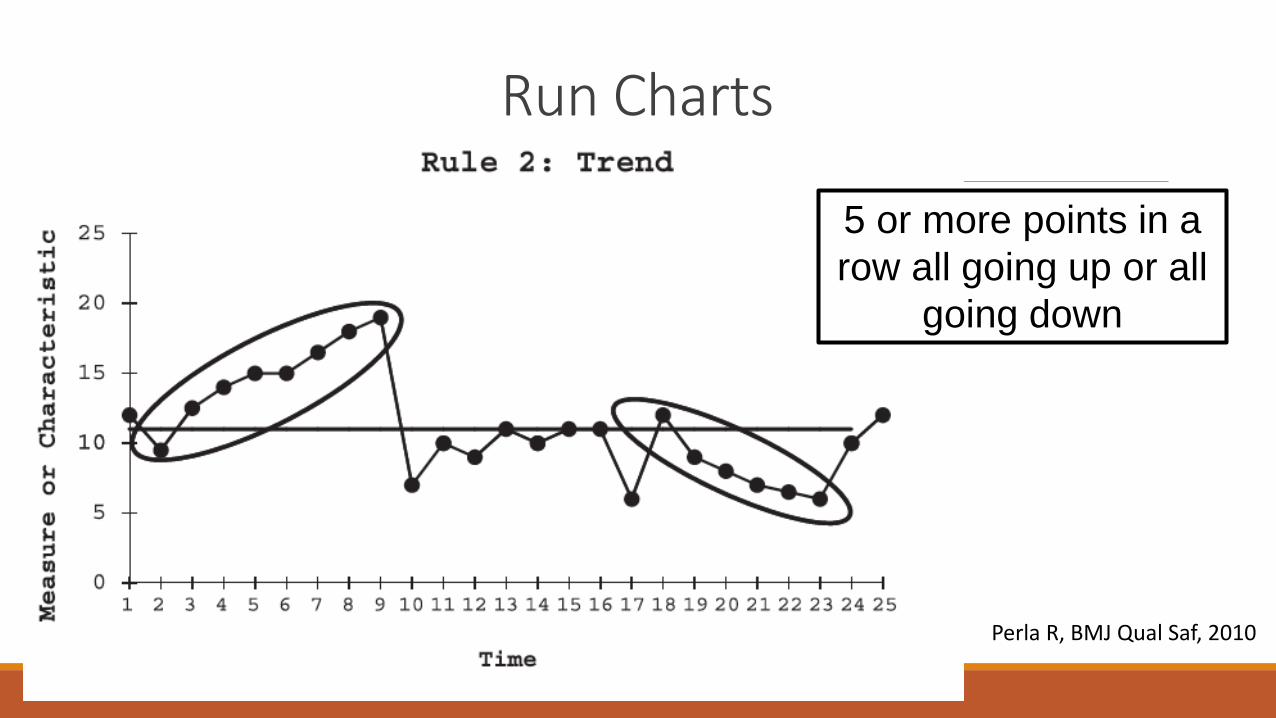
Run Charts
5 or more points in a
row all going up or all
going down
Perla R, BMJ Qual Saf, 2010
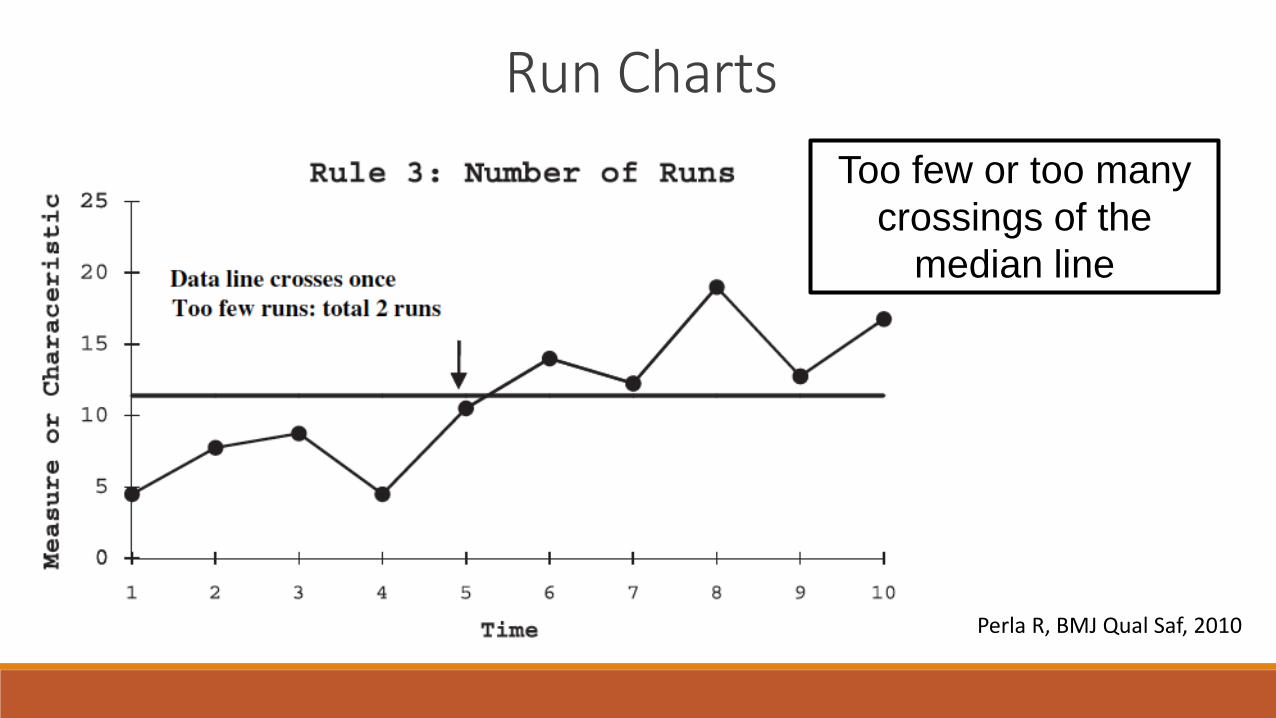
Run Charts
Too few or too many
crossings of the
median line
Perla R, BMJ Qual Saf, 2010

Run Charts
A point that is clearly
different than the rest,
i.e., the ‘outlier’
Perla R, BMJ Qual Saf, 2010
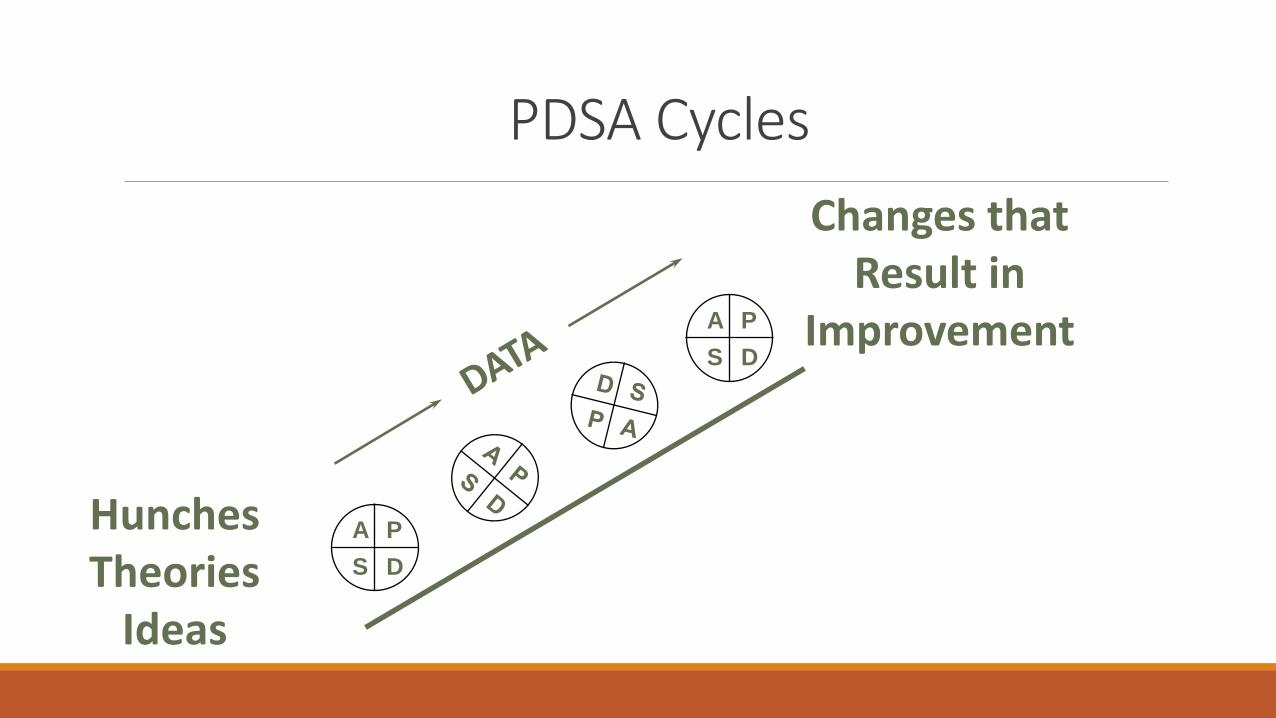
PDSA Cycles
Hunches Theories
Ideas
Changes that Result in
Improvement
A P
S D
A P
S D
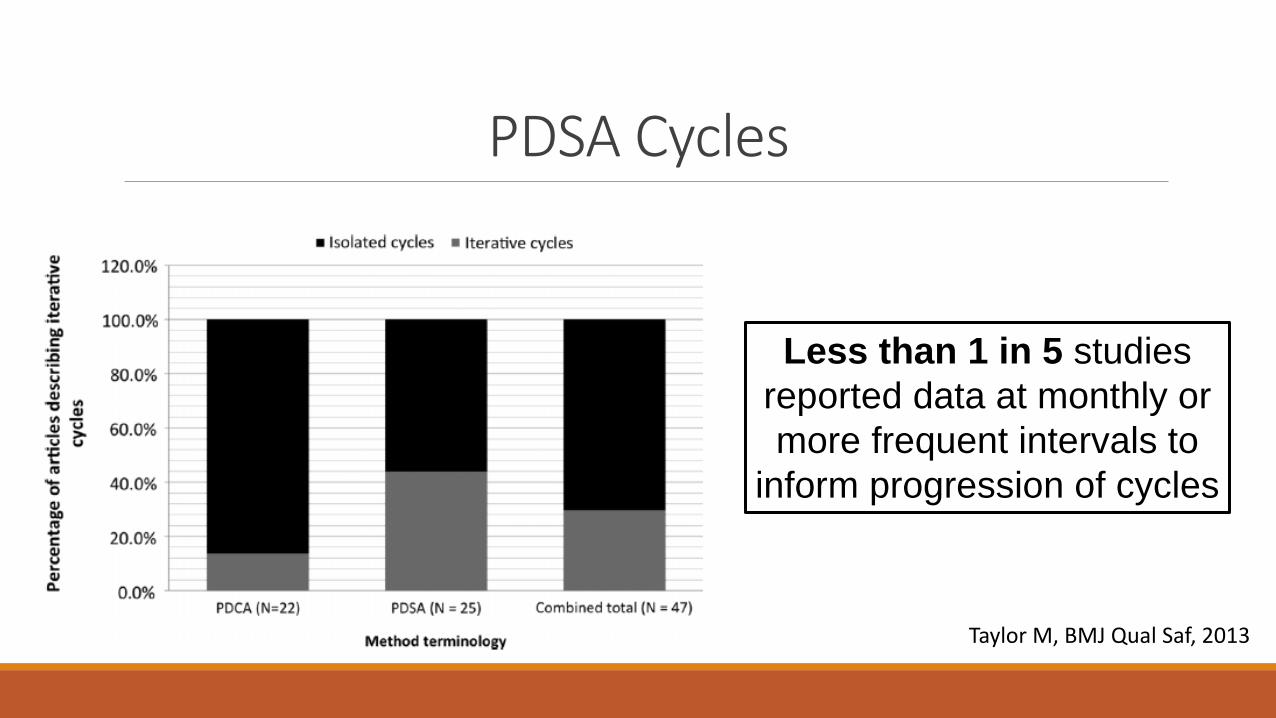
PDSA Cycles
Less than 1 in 5 studies
reported data at monthly or
more frequent intervals to
inform progression of cycles
Taylor M, BMJ Qual Saf, 2013
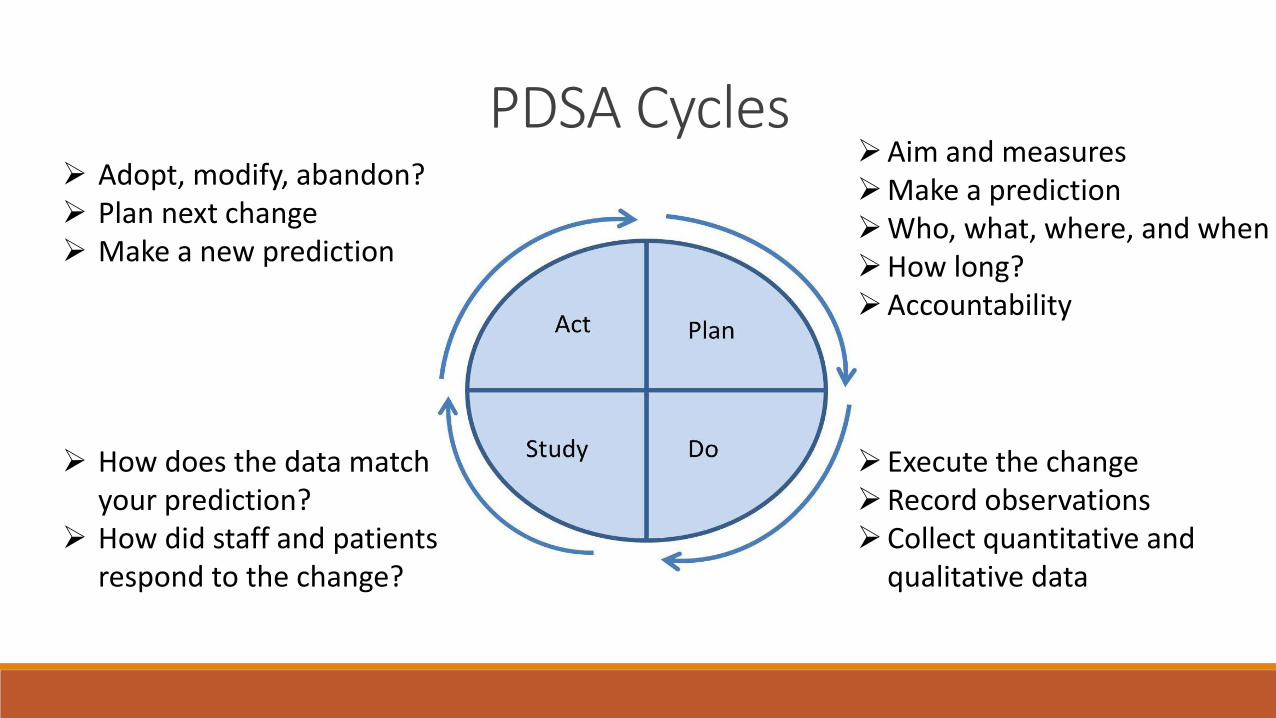
PDSA Cycles Aim and measures Make a prediction Who, what, where, and when How long? Accountability
Execute the change Record observations Collect quantitative and
qualitative data
Adopt, modify, abandon? Plan next change Make a new prediction
How does the data match your prediction?
How did staff and patients respond to the change?

PDSA Cycles Small sample size
Pick willing volunteers
Simple, non-resource intensive changes
Prioritize changes that do not require committees/approvals
Avoid technical slowdowns
Do not over-measure
Do not be afraid to abandon an unsuccessful change
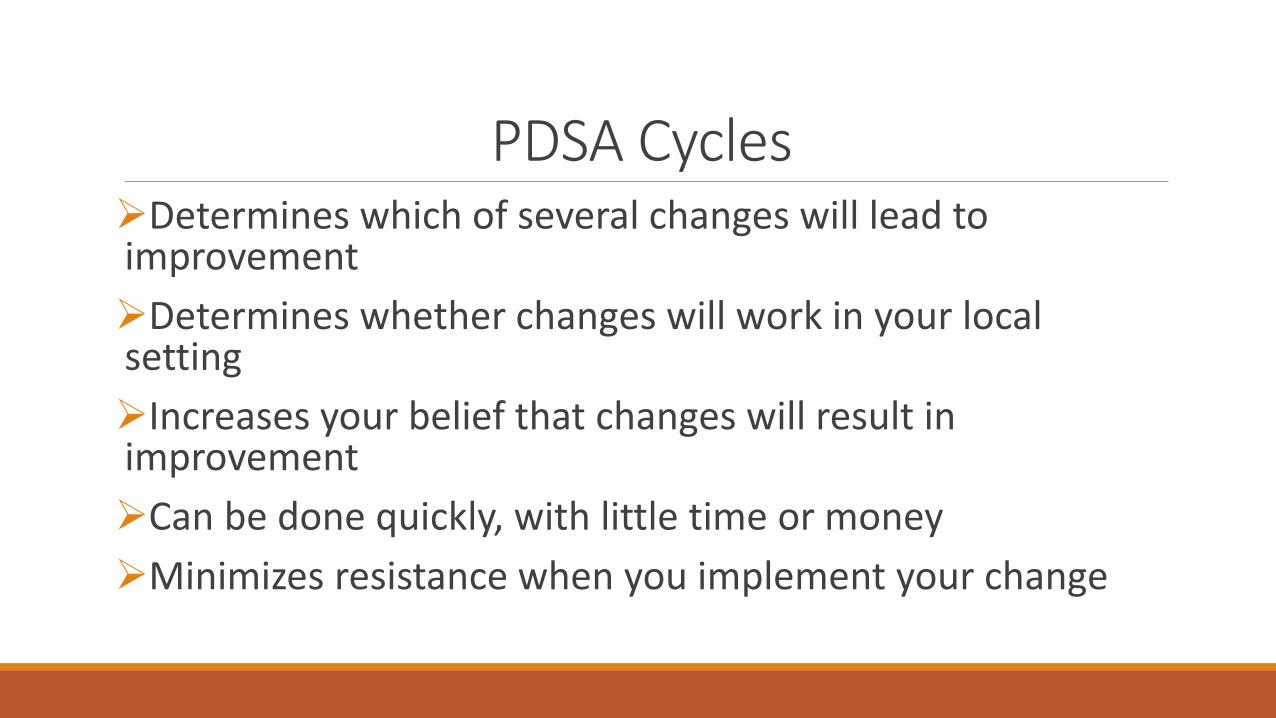
PDSA Cycles Determines which of several changes will lead to improvement
Determines whether changes will work in your local setting
Increases your belief that changes will result in improvement
Can be done quickly, with little time or money
Minimizes resistance when you implement your change
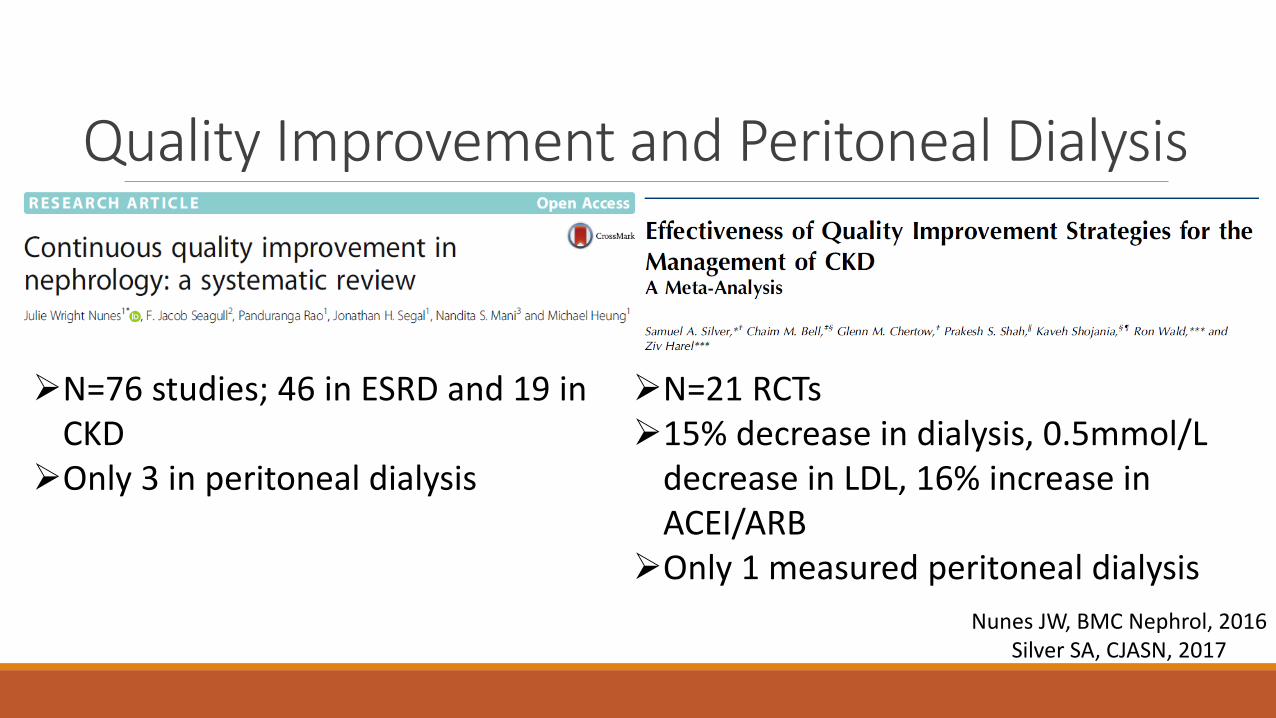
Nunes JW, BMC Nephrol, 2016 Silver SA, CJASN, 2017
Quality Improvement and Peritoneal Dialysis
N=76 studies; 46 in ESRD and 19 in CKD
Only 3 in peritoneal dialysis
N=21 RCTs 15% decrease in dialysis, 0.5mmol/L
decrease in LDL, 16% increase in ACEI/ARB
Only 1 measured peritoneal dialysis
Quality Improvement and Peritoneal Dialysis Brag and Steal This room @ 15:45
Publish
Conclusions To demonstrate tools that can identify quality of care problems •QI targets can often be identified with very small samples •You cannot change what you do not understand
To illustrate principles of change idea development •Target the system, not the individual • If you are not failing, then you are not innovating enough

Acknowledgements
People
• Chaim Bell
• Paula Blackstien-Hirsch
• Ed Etchells
• Rory McQuillan
• Peter Woodbridge
Funding
Diagnosing a Quality and Safety Problem in Your Peritoneal Dialysis Unit
Samuel Silver
Queen’s University
Kingston Health Sciences Centre
Kingston, Ontario, Canada