Embed Size (px)
Citation preview
DiabetesDiabetes
: : The Pandemic & Potential SolutionsThe Pandemic & Potential Solutions
Disease Control Priorities in Developing Countries Disease Control Priorities in Developing Countries a book chapter in DCP2 (2nd version) a book chapter in DCP2 (2nd version)
http://www.dcp2.org/pubs/DCP http://www.dcp2.org/pubs/DCP
Chapter 30 – April 2006Chapter 30 – April 2006
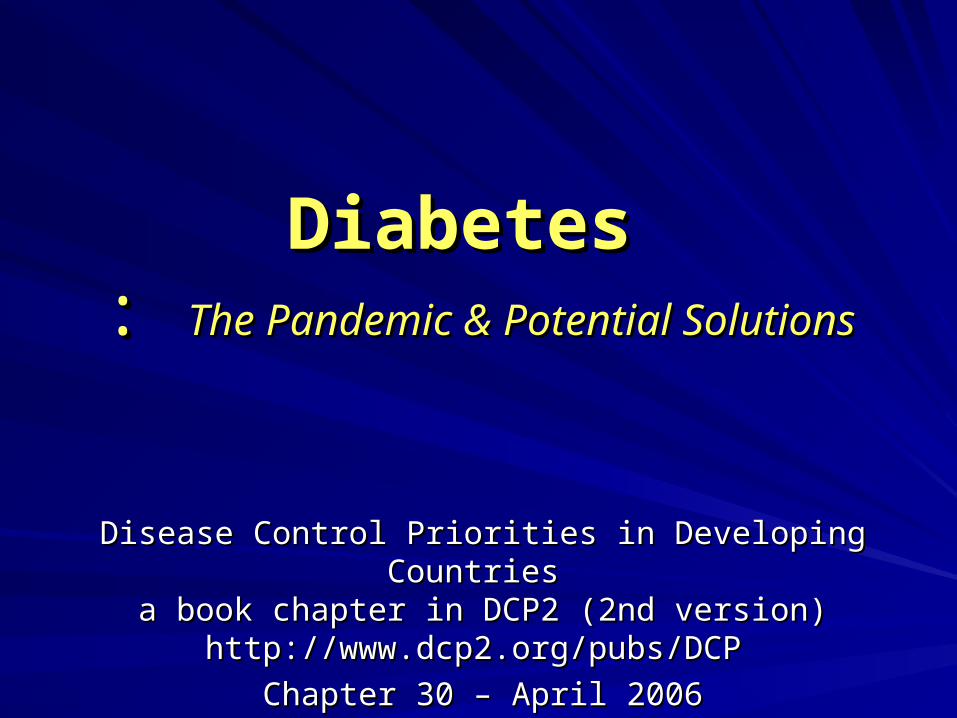
TopicsTopics1.1. Nature & distributionNature & distribution
2.2. Interventions & delivery modesInterventions & delivery modes
3.3. Cost-effectiveness of Cost-effectiveness of interventions & prioritiesinterventions & priorities
4.4. Lessons & experienceLessons & experience
5.5. R & D agendaR & D agenda
6.6. ConclusionConclusion
Table 30.2
Table 30.3
Table 30.4
Conclusion Table: Prioritized Key Interventions

1.Nature & Distribution1.Nature & Distribution

Secular trend and projectionsSecular trend and projections
Y 2003-2025 : 12 yrsY 2003-2025 : 12 yrs
Pop. 20-79 yrs Pop. 20-79 yrs
6 Developing regions : 6 Developing regions : 1.1. East Asia & the Pacific, East Asia & the Pacific,
2.2. Europe & Central Asia, Europe & Central Asia,
3.3. Latin America & the Caribbean, Latin America & the Caribbean,
4.4. Middle East and North Africa, Middle East and North Africa,
5.5. South Asia, South Asia,
6.6. Sub-Saharan AfricaSub-Saharan Africa
Prev. 5.1 6.3% (24% increase)
DM Pop.194m 333 m. (72% increase)
VARIATIONS
-Age structure
-Level of urbanization
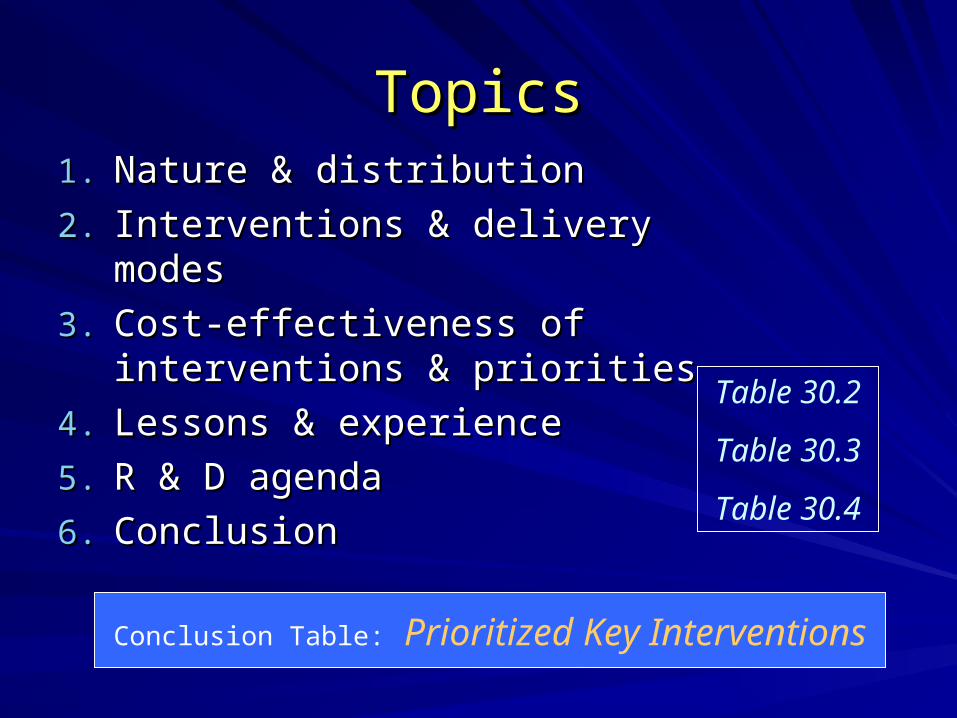
RegionRegion No.of No.of people people (million)(million)
Prevalence Prevalence (%)(%)
Death, Death, 2001 2001
(thousands)(thousands)
DALY, 2001 DALY, 2001 (thousands)(thousands)
2003200320252025 2003200320252025
DevelopingDeveloping 141141264264 4.54.55.95.9 757757 15,80415,804
DevelopedDeveloped 53536868 7.87.89.29.2 202202 4,1924,192
WorldWorld 194194333333 5.15.16.36.3 959959 19,99619,996
World : Direct medical costs, 2003 128,669-240,887 US$ million
IDF2003b, other info, WHO2004
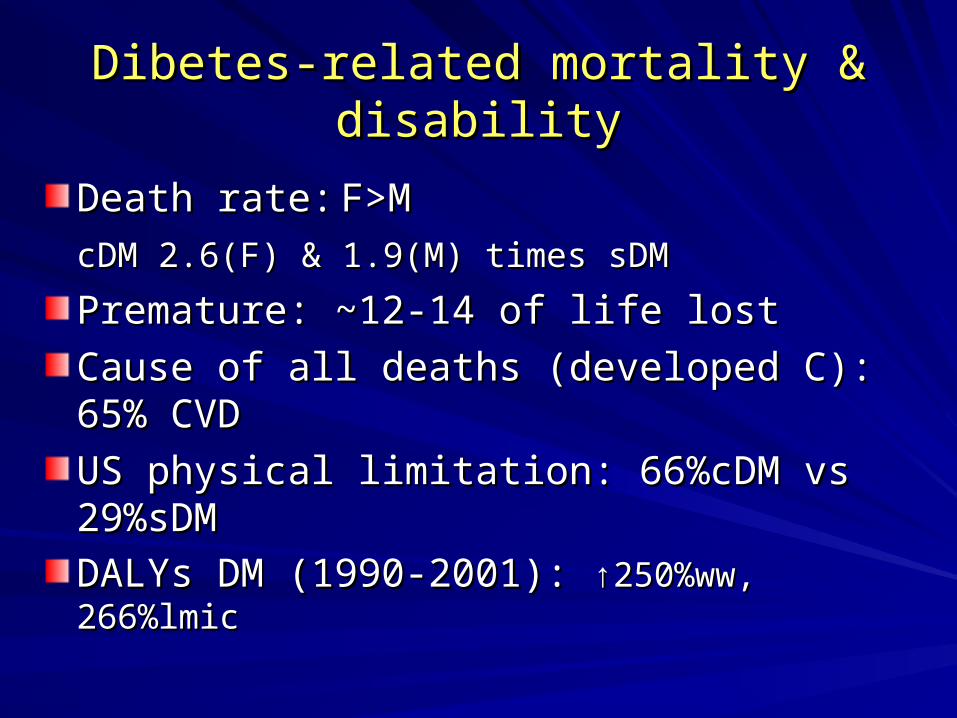
Dibetes-related mortality & disabilityDibetes-related mortality & disability
Death rate:Death rate: F>MF>M
cDM 2.6(F) & 1.9(M) times sDMcDM 2.6(F) & 1.9(M) times sDM
Premature: Premature: ~12-14 of life lost~12-14 of life lost
Cause of all deaths (developed C): 65% CVDCause of all deaths (developed C): 65% CVD
US physical limitation: 66US physical limitation: 66%cDM vs 29%sDM%cDM vs 29%sDM
DALYs DM (1990-2001): DALYs DM (1990-2001): ↑250%ww, 266%lmic↑250%ww, 266%lmic
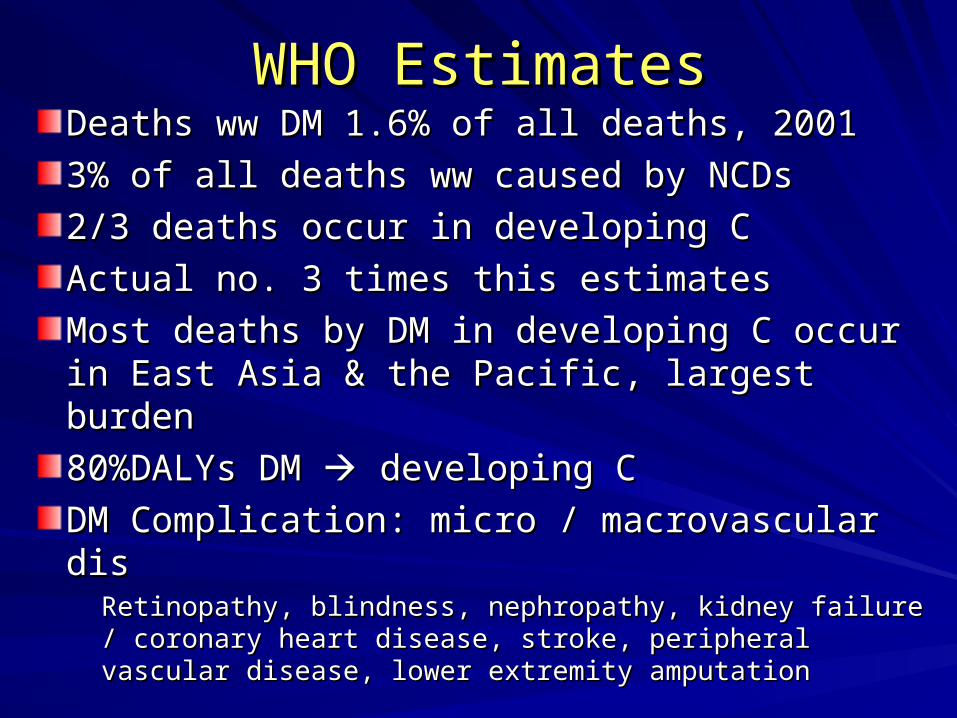
WHO EstimatesWHO EstimatesDeaths ww DM 1.6% of all deaths, 2001Deaths ww DM 1.6% of all deaths, 2001
3% of all deaths ww caused by NCDs3% of all deaths ww caused by NCDs
2/3 deaths occur in developing C2/3 deaths occur in developing C
Actual no. 3 times this estimatesActual no. 3 times this estimates
Most deaths by DM in developing C occur in Most deaths by DM in developing C occur in East Asia & the Pacific, largest burdenEast Asia & the Pacific, largest burden
80%DALYs DM 80%DALYs DM developing C developing C
DM Complication: micro / macrovascular disDM Complication: micro / macrovascular disRetinopathy, blindness, nephropathy, kidney failure / Retinopathy, blindness, nephropathy, kidney failure / coronary heart disease, stroke, peripheral vascular coronary heart disease, stroke, peripheral vascular disease, lower extremity amputationdisease, lower extremity amputation

Economic Burden of DMEconomic Burden of DM
DM Affects both national, individual & family DM Affects both national, individual & family economieseconomies
Direct health care costs of DM: 2.5-15% of Direct health care costs of DM: 2.5-15% of annual health care budgets, depending on annual health care budgets, depending on local prevalence & Rx availablelocal prevalence & Rx available
Indirect & intangible costs > direct: rise in Indirect & intangible costs > direct: rise in DM be among 20-64 y.in next 3 decadesDM be among 20-64 y.in next 3 decades
DM QoL value = 0.77 (UK pop, DM QoL value = 0.77 (UK pop, prospect studyprospect study))
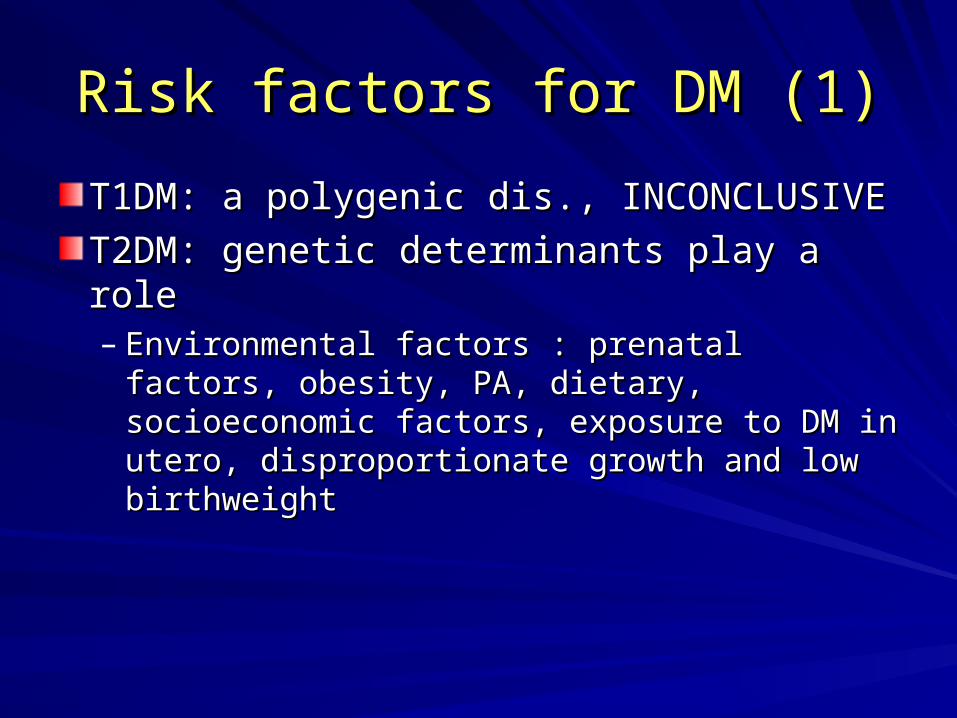
Risk factors for DM (1)Risk factors for DM (1)
T1DM: a polygenic dis., INCONCLUSIVE T1DM: a polygenic dis., INCONCLUSIVE
T2DM: genetic determinants play a roleT2DM: genetic determinants play a role– Environmental factors : prenatal factors, Environmental factors : prenatal factors,
obesity, PA, dietary, socioeconomic factors, obesity, PA, dietary, socioeconomic factors, exposure to DM in utero, disproportionate exposure to DM in utero, disproportionate growth and low birthweightgrowth and low birthweight
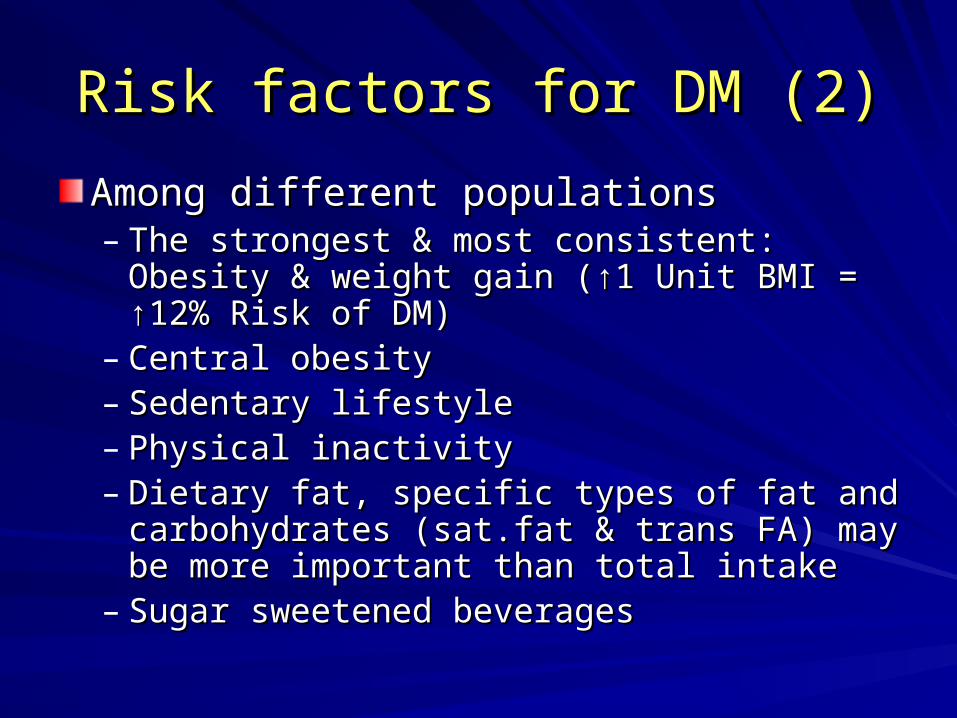
Risk factors for DM (2)Risk factors for DM (2)
Among different populationsAmong different populations– The strongest & most consistent: Obesity & The strongest & most consistent: Obesity &
weight gain (↑1 Unit BMI = ↑12% Risk of DM)weight gain (↑1 Unit BMI = ↑12% Risk of DM)– Central obesityCentral obesity– Sedentary lifestyleSedentary lifestyle– Physical inactivityPhysical inactivity– Dietary fat, specific types of fat and Dietary fat, specific types of fat and
carbohydrates (sat.fat & trans FA)carbohydrates (sat.fat & trans FA) may be may be more important than total intakemore important than total intake
– Sugar sweetened beveragesSugar sweetened beverages
Risk factors for DM (3)Risk factors for DM (3)
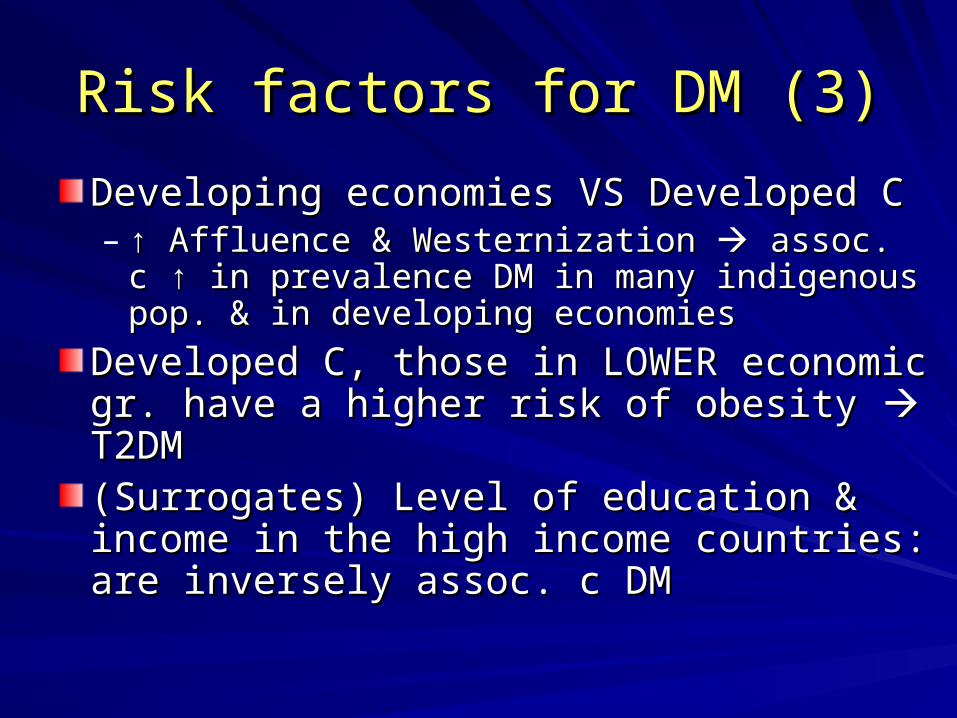
Developing economies VS Developed CDeveloping economies VS Developed C– ↑ ↑ Affluence & Westernization Affluence & Westernization assoc. c ↑ in assoc. c ↑ in
prevalence DM in many indigenous pop. & in prevalence DM in many indigenous pop. & in developing economiesdeveloping economies
Developed C, those in LOWER economic Developed C, those in LOWER economic gr. have a higher risk of obesity gr. have a higher risk of obesity T2DM T2DM(Surrogates) Level of education & income in (Surrogates) Level of education & income in the high income countries: are inversely the high income countries: are inversely assoc. c DMassoc. c DM

Factors that may reduce risk DMFactors that may reduce risk DM
Breastfeeding protects against the Breastfeeding protects against the development of obesity, insulin resist & DMdevelopment of obesity, insulin resist & DM
Increase PA.Increase PA.
Polyunsat.fats & long-chain omega-3 fatty Polyunsat.fats & long-chain omega-3 fatty acids found in fish oilsacids found in fish oils
High intakes of dietary fiber & of vegetablesHigh intakes of dietary fiber & of vegetables

2. Interventions 2. Interventions & delivery modes& delivery modes
Preventing T1DMPreventing T1DM
Not enough scientific evidenceNot enough scientific evidence
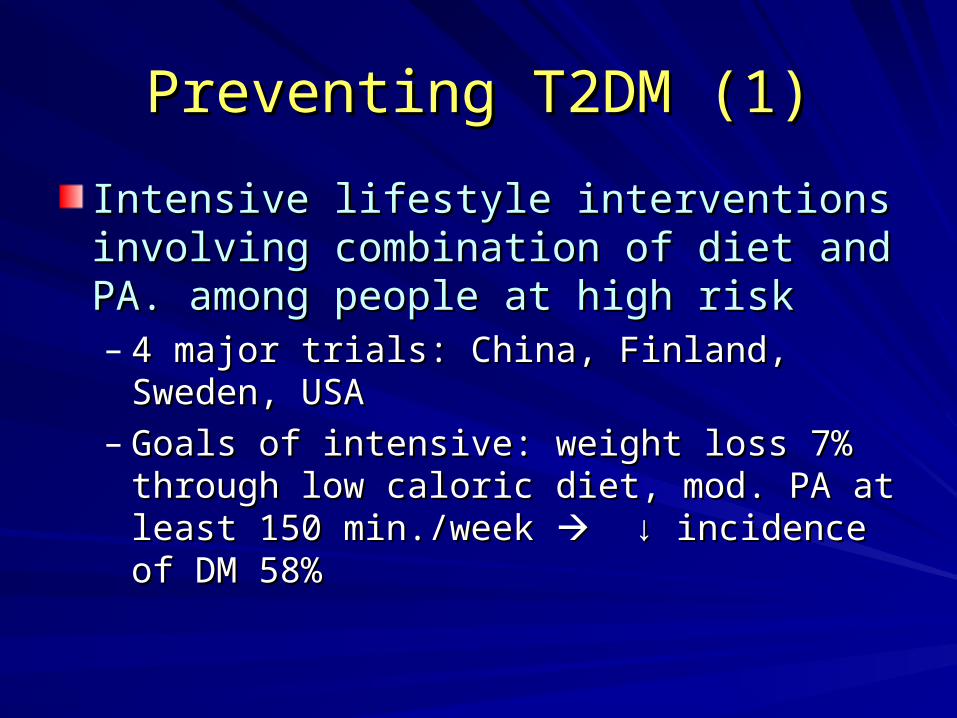
Preventing T2DM (1)Preventing T2DM (1)
Intensive lifestyle interventions involving Intensive lifestyle interventions involving combination of diet and PA. among people combination of diet and PA. among people at high riskat high risk– 4 major trials: China, Finland, Sweden, USA4 major trials: China, Finland, Sweden, USA– Goals of intensive: weight loss 7% through Goals of intensive: weight loss 7% through
low caloric diet, mod. PA at least 150 low caloric diet, mod. PA at least 150 min./week min./week ↓↓ incidence of DM 58% incidence of DM 58%
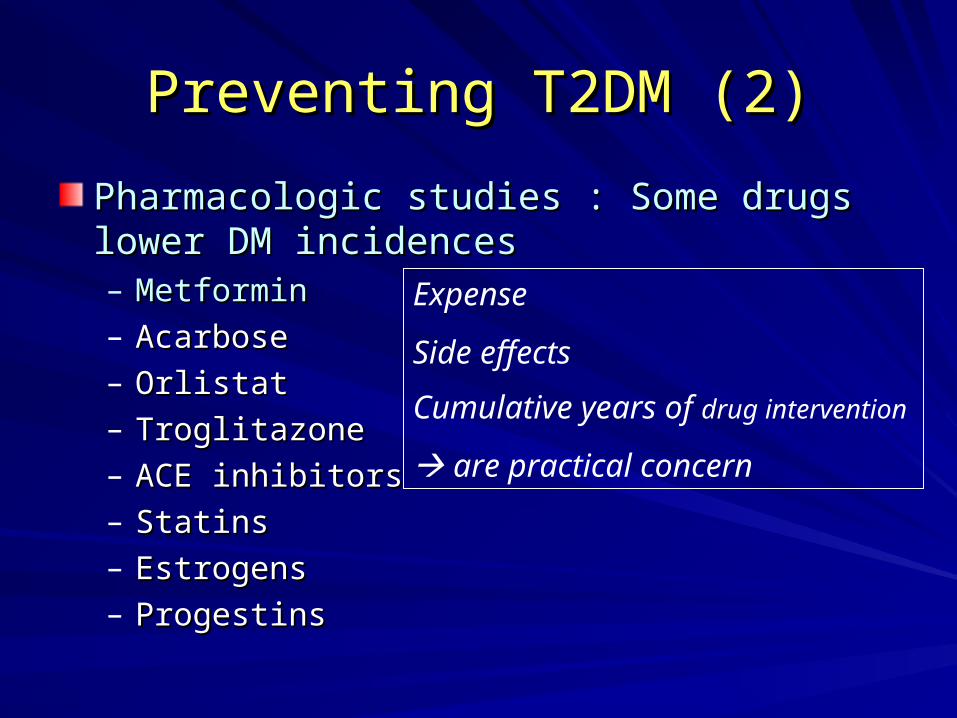
Preventing T2DM (2)Preventing T2DM (2)
Pharmacologic studies : Some drugs lower DM Pharmacologic studies : Some drugs lower DM incidencesincidences– MetforminMetformin– AcarboseAcarbose– OrlistatOrlistat– TroglitazoneTroglitazone– ACE inhibitorsACE inhibitors– StatinsStatins– EstrogensEstrogens– ProgestinsProgestins
Expense
Side effects
Cumulative years of drug intervention
are practical concern
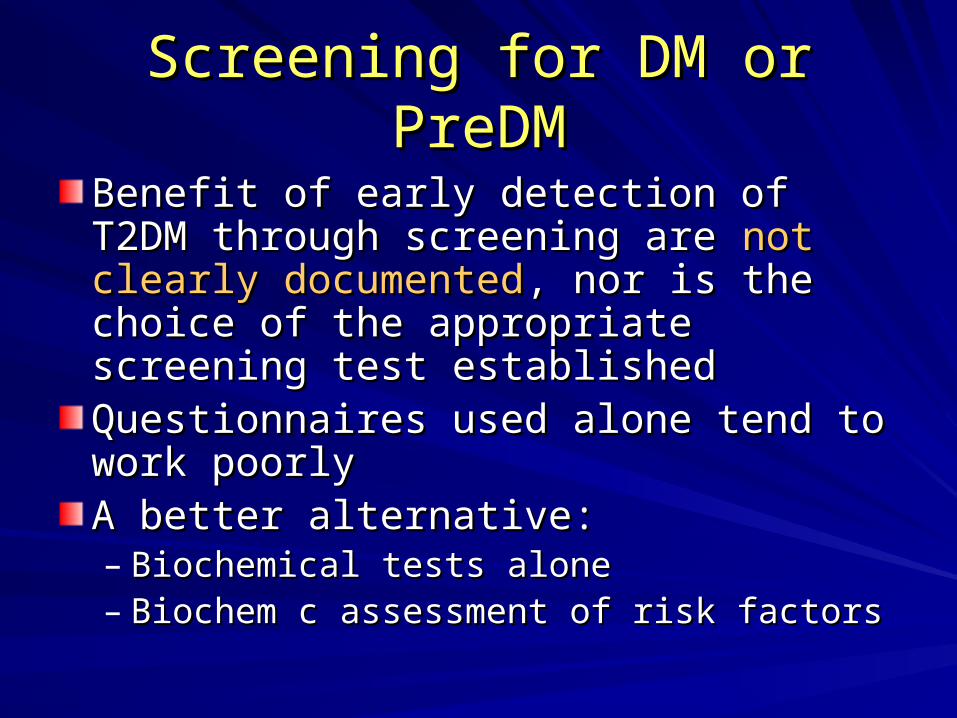
Screening for DM or PreDMScreening for DM or PreDM
Benefit of early detection of T2DM through Benefit of early detection of T2DM through screening are screening are not clearly documentednot clearly documented, nor , nor is the choice of the appropriate screening is the choice of the appropriate screening test establishedtest establishedQuestionnaires used alone tend to work Questionnaires used alone tend to work poorlypoorlyA better alternative:A better alternative:– Biochemical tests aloneBiochemical tests alone– Biochem c assessment of risk factorsBiochem c assessment of risk factors
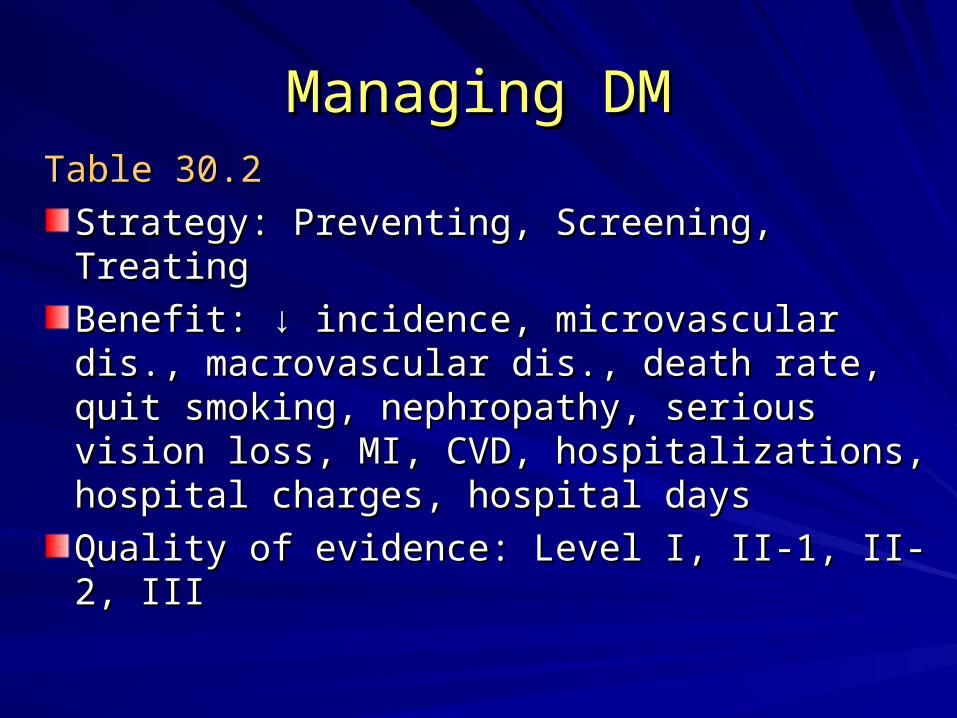
Managing DMManaging DMTable 30.2Table 30.2
Strategy: Preventing, Screening, TreatingStrategy: Preventing, Screening, Treating
Benefit: ↓ incidence, microvascular dis., Benefit: ↓ incidence, microvascular dis., macrovascular dis., death rate, quit smoking, macrovascular dis., death rate, quit smoking, nephropathy, serious vision loss, MI, CVD, nephropathy, serious vision loss, MI, CVD, hospitalizations, hospital charges, hospital hospitalizations, hospital charges, hospital daysdays
Quality of evidence: Level I, II-1, II-2, IIIQuality of evidence: Level I, II-1, II-2, III
3. Cost-effectiveness of 3. Cost-effectiveness of interventions & prioritiesinterventions & priorities
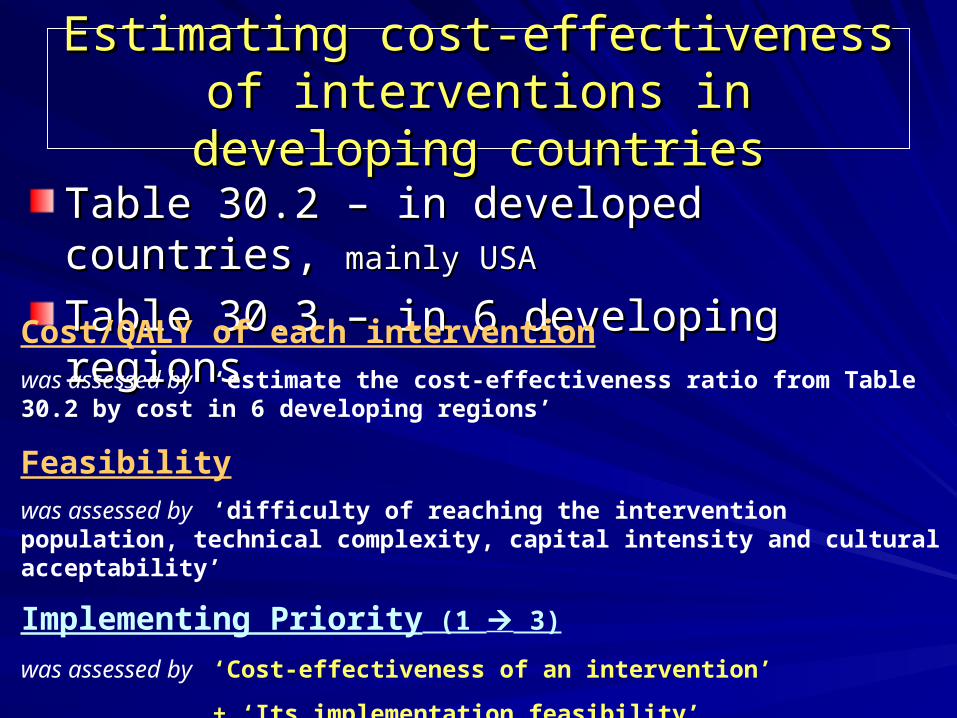
Estimating cost-effectiveness of Estimating cost-effectiveness of interventions in developing countriesinterventions in developing countries
Table 30.2 – in developed countries, Table 30.2 – in developed countries, mainly USAmainly USA
Table 30.3 – in 6 developing regionsTable 30.3 – in 6 developing regions
Cost/QALY of each intervention
was assessed by ‘estimate the cost-effectiveness ratio from Table 30.2 by cost in 6 developing regions’
Feasibility
was assessed by ‘difficulty of reaching the intervention population, technical complexity, capital intensity and cultural acceptability’
Implementing Priority (1 3)
was assessed by ‘Cost-effectiveness of an intervention’
+ ‘Its implementation feasibility’
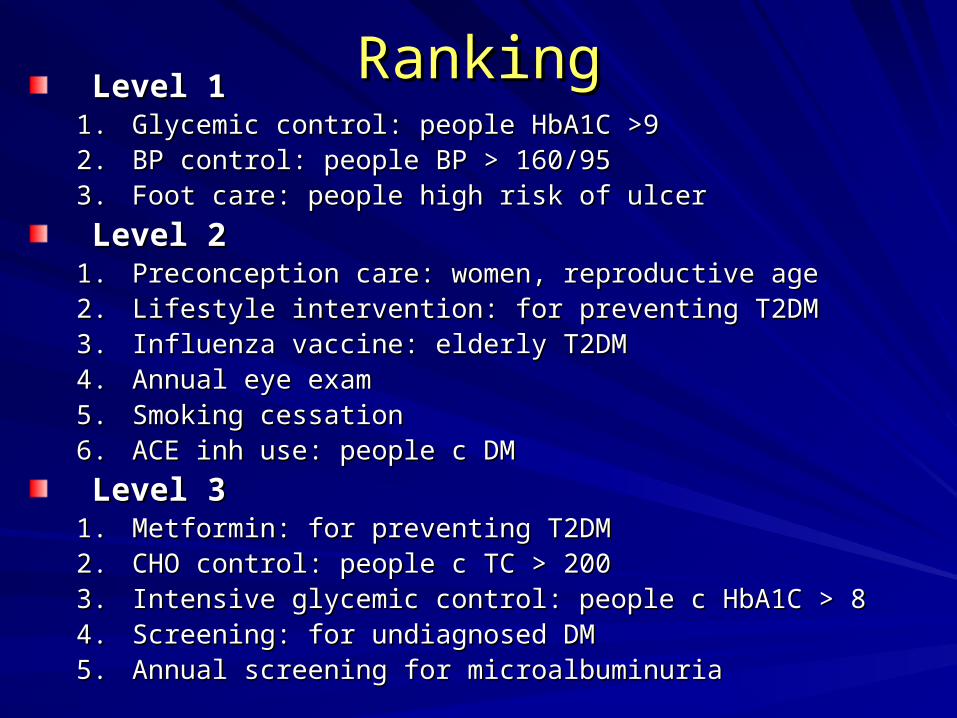
RankingRankingLevel 1Level 1
1.1. Glycemic control: people HbA1C >9Glycemic control: people HbA1C >92.2. BP control: people BP > 160/95BP control: people BP > 160/953.3. Foot care: people high risk of ulcerFoot care: people high risk of ulcer
Level 2Level 21.1. Preconception care: women, reproductive agePreconception care: women, reproductive age2.2. Lifestyle intervention: for preventing T2DMLifestyle intervention: for preventing T2DM3.3. Influenza vaccine: elderly T2DMInfluenza vaccine: elderly T2DM4.4. Annual eye examAnnual eye exam5.5. Smoking cessationSmoking cessation6.6. ACE inh use: people c DMACE inh use: people c DM
Level 3Level 31.1. Metformin: for preventing T2DMMetformin: for preventing T2DM2.2. CHO control: people c TC > 200CHO control: people c TC > 2003.3. Intensive glycemic control:Intensive glycemic control: people c HbA1C > 8people c HbA1C > 84.4. Screening: for undiagnosed DMScreening: for undiagnosed DM5.5. Annual screening for microalbuminuriaAnnual screening for microalbuminuria
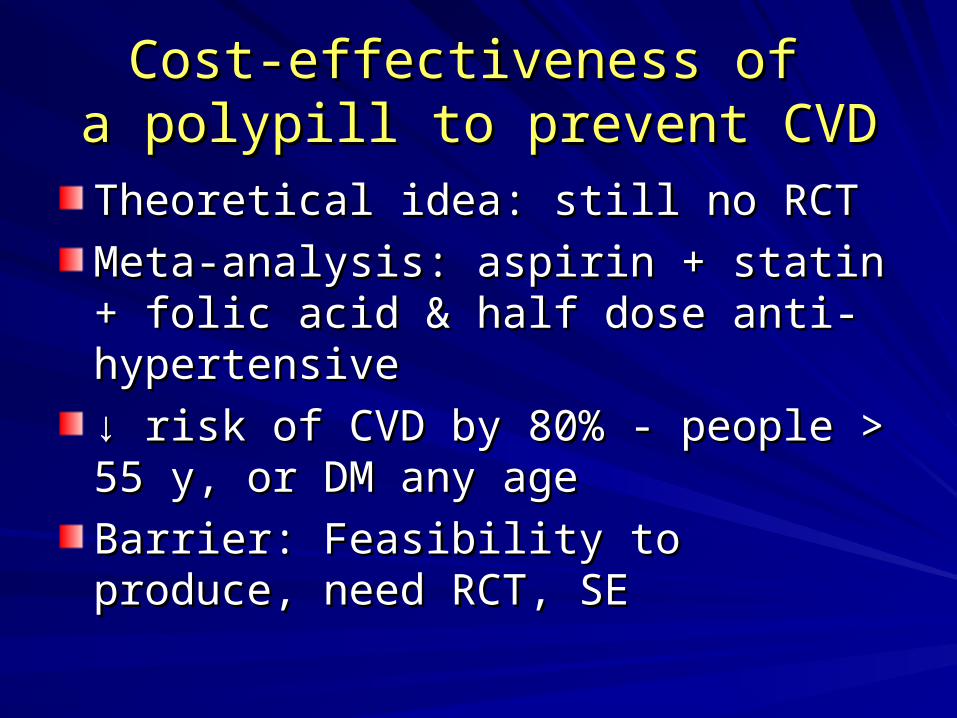
Cost-effectiveness of Cost-effectiveness of a polypill to prevent CVDa polypill to prevent CVD
Theoretical idea: still no RCTTheoretical idea: still no RCT
Meta-analysis: aspirin + statin + folic acid Meta-analysis: aspirin + statin + folic acid & half dose anti-hypertensive& half dose anti-hypertensive
↓ ↓ risk of CVD by 80% - people > 55 y, or risk of CVD by 80% - people > 55 y, or DM any ageDM any age
Barrier: Feasibility to produce, need RCT, Barrier: Feasibility to produce, need RCT, SESE
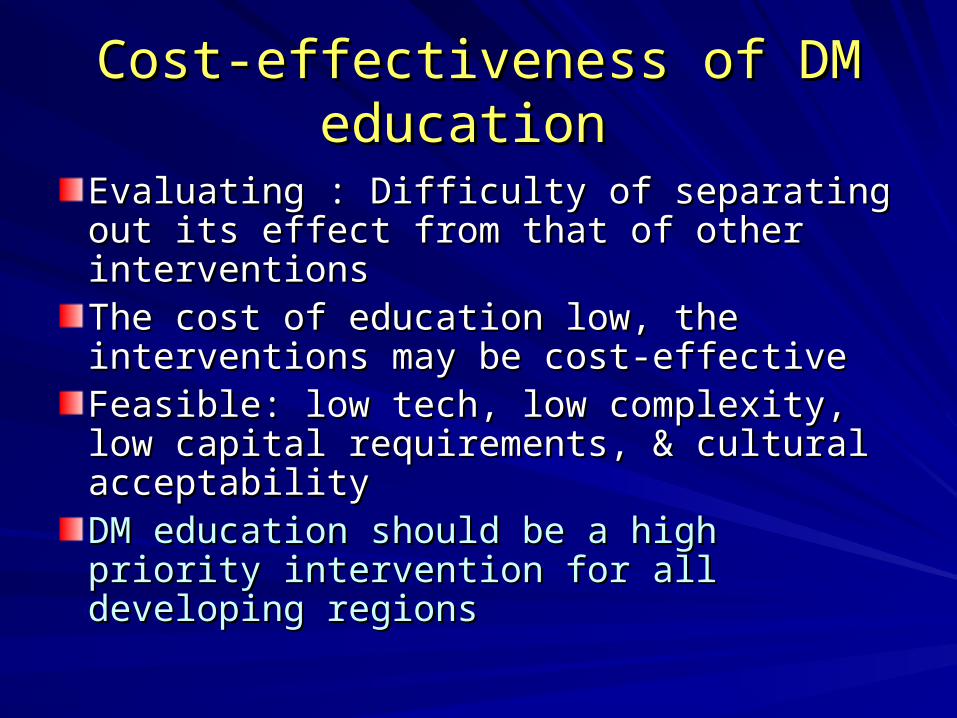
Cost-effectiveness of DM education Cost-effectiveness of DM education
Evaluating : Difficulty of separating out its Evaluating : Difficulty of separating out its effect from that of other interventionseffect from that of other interventionsThe cost of education low, the The cost of education low, the interventions may be cost-effectiveinterventions may be cost-effectiveFeasible: low tech, low complexity, low Feasible: low tech, low complexity, low capital requirements, & cultural capital requirements, & cultural acceptabilityacceptabilityDM education should be a high priority DM education should be a high priority intervention for all developing regionsintervention for all developing regions

4.Lessons & experience4.Lessons & experience
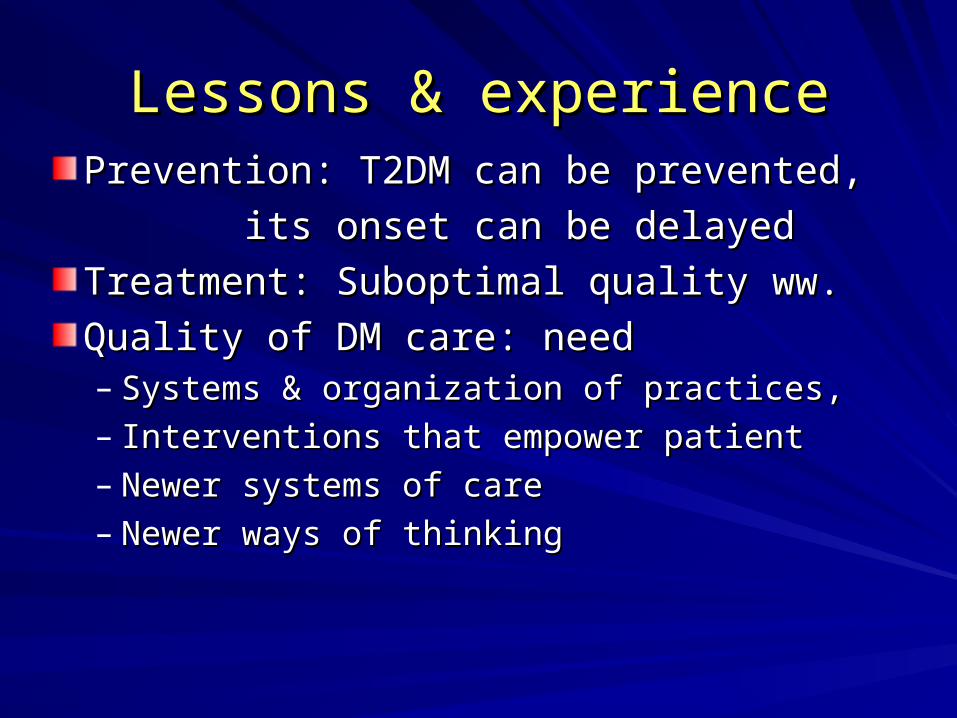
Lessons & experienceLessons & experiencePrevention: T2DM can be prevented, Prevention: T2DM can be prevented,
its onset can be delayedits onset can be delayed
Treatment: Suboptimal quality ww.Treatment: Suboptimal quality ww.
Quality of DM care: needQuality of DM care: need– Systems & organization of practices, Systems & organization of practices, – Interventions that empower patientInterventions that empower patient– Newer systems of careNewer systems of care– Newer ways of thinkingNewer ways of thinking

5.Research & development 5.Research & development agendaagenda
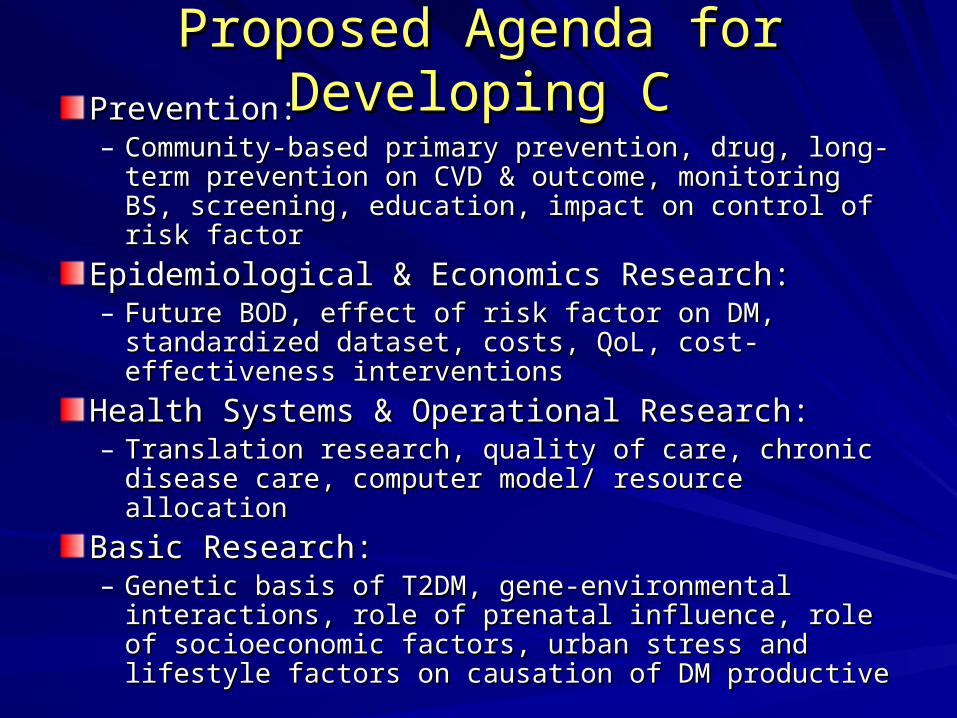
Proposed Agenda for Developing CProposed Agenda for Developing CPrevention:Prevention:– Community-based primary prevention, drug, long-Community-based primary prevention, drug, long-
term prevention on CVD & outcome, monitoring BS, term prevention on CVD & outcome, monitoring BS, screening, education, impact on control of risk factorscreening, education, impact on control of risk factor
Epidemiological & Economics Research:Epidemiological & Economics Research:– Future BOD, effect of risk factor on DM, standardized Future BOD, effect of risk factor on DM, standardized
dataset, costs, QoL, cost-effectiveness interventionsdataset, costs, QoL, cost-effectiveness interventions
Health Systems & Operational Research:Health Systems & Operational Research:– Translation research, quality of care, chronic disease Translation research, quality of care, chronic disease
care, computer model/ resource allocationcare, computer model/ resource allocation
Basic Research:Basic Research:– Genetic basis of T2DM, gene-environmental Genetic basis of T2DM, gene-environmental
interactions, role of prenatal influence, role of interactions, role of prenatal influence, role of socioeconomic factors, urban stress and lifestyle socioeconomic factors, urban stress and lifestyle factors on causation of DM productivefactors on causation of DM productive

6.Conclusion6.Conclusion
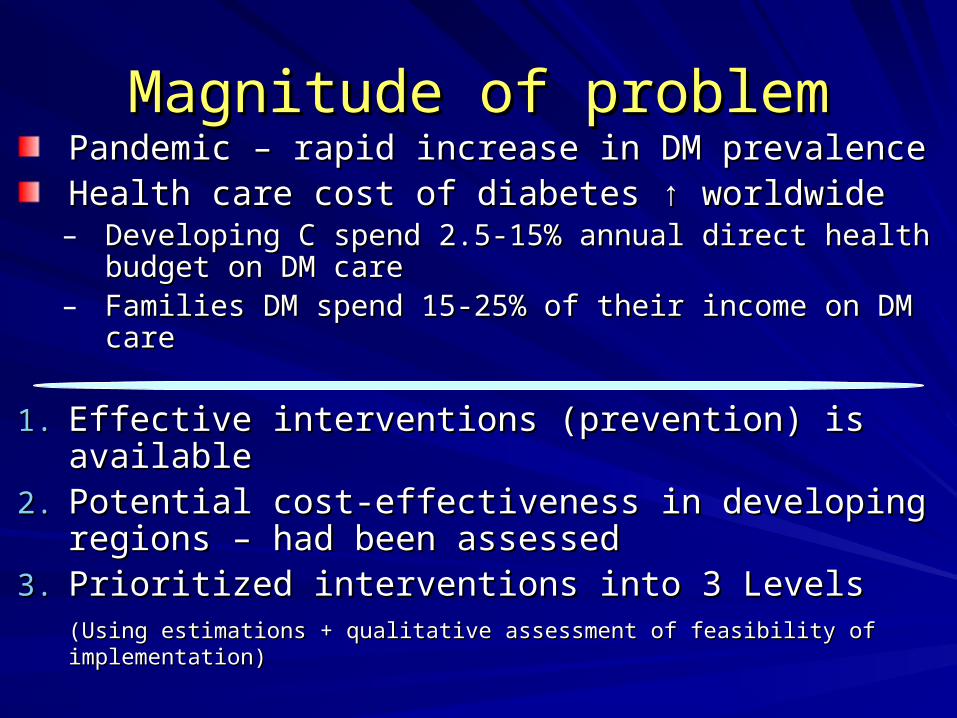
Magnitude of problemMagnitude of problemPandemic – rapid increase in DM prevalencePandemic – rapid increase in DM prevalenceHealth care cost of diabetes ↑ worldwideHealth care cost of diabetes ↑ worldwide
– Developing C spend 2.5-15% annual direct health budget Developing C spend 2.5-15% annual direct health budget on DM careon DM care
– Families DM spend 15-25% of their income on DM careFamilies DM spend 15-25% of their income on DM care
1.1. Effective interventions (prevention) is availableEffective interventions (prevention) is available2.2. Potential cost-effectiveness in developing regions – Potential cost-effectiveness in developing regions –
had been assessedhad been assessed3.3. Prioritized interventions into 3 LevelsPrioritized interventions into 3 Levels
(Using estimations + qualitative assessment of feasibility of implementation)(Using estimations + qualitative assessment of feasibility of implementation)
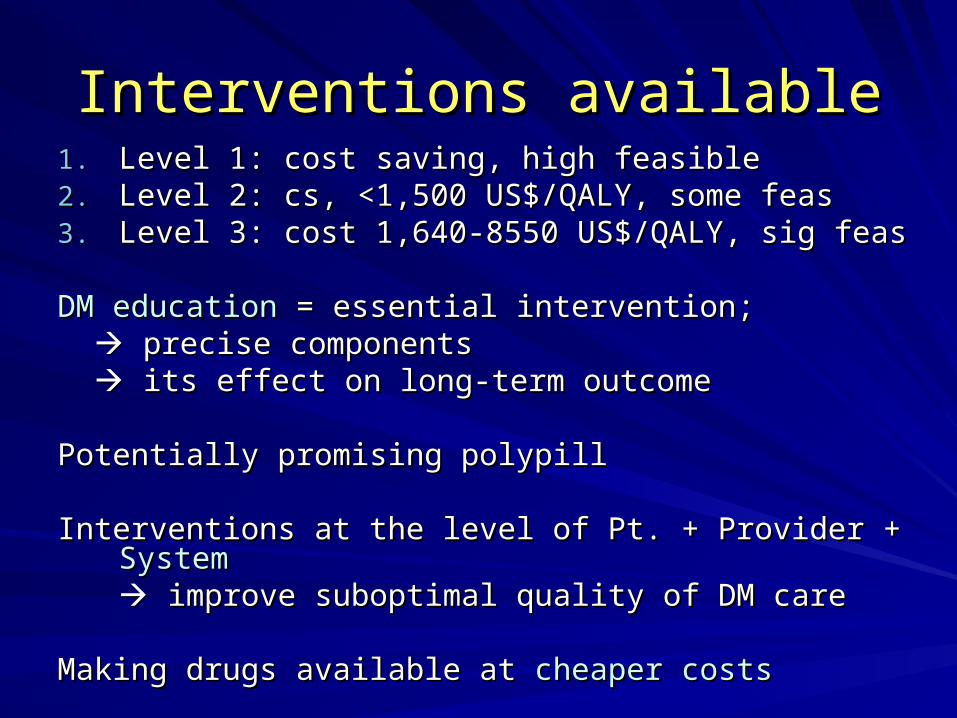
Interventions availableInterventions available1.1. Level 1: cost saving, high feasibleLevel 1: cost saving, high feasible2.2. Level 2: cs, <1,500 US$/QALY, some feasLevel 2: cs, <1,500 US$/QALY, some feas3.3. Level 3: cost 1,640-8550 US$/QALY, sig feasLevel 3: cost 1,640-8550 US$/QALY, sig feas
DM educationDM education = essential intervention; = essential intervention; precise componentsprecise components its effect on long-term outcomeits effect on long-term outcome
Potentially promising polypillPotentially promising polypill
Interventions at the level of Pt. + Provider + Interventions at the level of Pt. + Provider + SystemSystem improve suboptimal quality of DM careimprove suboptimal quality of DM care
Making drugs available at Making drugs available at cheaper costscheaper costs