Embed Size (px)
Citation preview
© 2003 Diabetes UK.
Diabetic Medicine
,
20
, 505–509
505
Blackwell Publishing Ltd.
Letters
LettersLettersLetters
Diabetes prevalence data for the United Kingdom—what do we have and what do we need?
The Diabetes National Service Framework Standards Document[1] states that the prevalence of diabetes in England is between2% and 3% but does not give a source for this information.The Scottish Diabetes Framework [2] contains the statement‘it is not known with any certainty how many people in Scotlandhave diabetes’ but suggests that the prevalence is 2.1% inScotland overall and ‘certainly over 2.5% and probably above3% in some areas’. It uses the Scottish Diabetes Survey 2001[3] based upon registers of people with known diabetes toarrive at this estimate.
Other estimates of diabetes prevalence in selected popula-tions have been derived from cases of known diabetes in Poole,Middlesborough (Type 2 diabetes only), Tayside and northWales and have given estimates of diabetes prevalence in allage groups of 1.6%, 1.6%, 1.9% and 2.5%, respectively [4–7].Data on diabetes prevalence in people 16–74 years of age arealso available from the Health Survey for England (2.9%), theScottish Health Survey (2.4%) and the Welsh Health Survey(3.7% of respondents, 2% of non-respondents) [8–10]. Thesesurveys rely on self-reported information albeit from large,nationally representative samples of adults. Self-reported dia-betes or known diabetes may underestimate diabetes prevalenceby around 100% among European populations [11,12].
The UK currently has virtually no information on the prev-alence of diabetes (known and/or previously undiagnosed),impaired glucose tolerance (IGT) and impaired fasting glycaemia(IFG) derived from recent, well-conducted field studies usingWorld Health Organization (WHO) or American DiabetesAssociation criteria for the definition of these conditions.Previous studies using these criteria have included the CoventryStudy [12], the Isle of Ely Diabetes Project [13], the Newcastlestudy [14] and the North London studies [15,16], although thechoice of any of these might legitimately be criticised on thegrounds of being unrepresentative of the national picture. Amore recent study from Manchester [17], while of considerableinterest and importance in illustrating the high prevalence ofdiabetes in deprived inner city populations, might also berejected as an indicator of national prevalence.
In a recent examination of the world’s literature on diabetesprevalence conducted at the WHO, Geneva, no suitable UKstudy could be found which met the criteria of being recent,nationally representative, having a reasonably high responserate and having used WHO criteria to define diabetes. Thiswork will contribute to the ‘Global Burden of Disease’ publi-cation to be available later this year. Given this lack of UK-specific information, a study from the Netherlands [18] waschosen as a proxy and resulted in a crude prevalence of diabetes
(known and previously undiagnosed) for the UK of 2.7%.However, the use of Netherlands prevalence data extrapolatedto the UK population is likely to result in an underestimateof diabetes prevalence given the lower prevalence of obesityand higher population mean levels of physical activity in theNetherlands.
The implementation of the Diabetes Service Frameworks inEngland, Wales and Scotland now makes it imperative thatsound information on diabetes prevalence should be madeavailable. All process and outcome variables necessary forthe monitoring of this implementation will require a ‘diabetesdenominator’ in order to calculate valid prevalence andincidence rates for complications and healthcare episodes.No valid monitoring processes are possible without such adenominator.
A practical approach to providing such information wouldbe to undertake population-based studies of diagnosed andpreviously undiagnosed diabetes in areas for which goodregister-based data already exist. In that way adjustmentfactors (which would probably vary according to age, socio-economic status, ethnicity and other factors) could be derivedto estimate population prevalence in other areas which onlyhave register-based prevalence estimates of diagnosed diabetes.Alternatively, nationally representative samples such as thoseused in the Health Survey for England might have their self-reported data supplemented more frequently by physiologicalmeasurements of glucose tolerance which accord with interna-tional criteria for diabetes, IGT and/or IFG.
Whatever solution is arrived at, there is a clear need for thesebasic statistics of diabetes epidemiology if the future courseof the diabetes epidemic is to be tracked in the UK and ifdevelopments in the delivery of care to people with diabetesare to be monitored effectively.
R. Williams and S. Wild
World Heath Organization, Geneva, Switzerland
References
1 Department of Health.
National Service Framework for Diabetes:Standards.
London: DOH, 2001.2 Scottish Executive Health Department.
Scottish Diabetes Frame-work: The blueprint for Diabetes Care in Scotland in the 21stcentury.
: Scottish Executive Health Department, 2001.3 Scottish Executive Health Department.
Scottish Diabetes Survey2001: Report by the Scottish Diabetes Survey Monitoring Group.
:Scottish Executive Health Department, 2001.
4 Gatling W, Budd S, Walters D, Mullee MA, Goddard JR, Hill RD.Evidence of an increasing prevalence of diagnosed diabetes mellitusin the Poole area from 1983 to 1996.
Diabet Med
1998;
15
: 1015–1021.
5 Connolly V, Unwin N, Sherriff P, Bilous R, Kelly W. Diabetesprevalence and socioeconomic status: a population based study
© 2003 Diabetes UK.
Diabetic Medicine
,
20
, 505–509
506
Letters
showing increased prevalence of type 2 diabetes mellitus in deprivedareas.
J Epidemiol Community Health
2000;
54
: 173–177.6 Morris AD, Boyle DI, MacAlpine R, Emslie-Smith A, Jung RT,
Newton RW
et al.
The diabetes audit and research in TaysideScotland (DARTS) study: electronic record linkage to create adiabetes register. DARTS/MEMO Collaboration.
Br Med J
1997;
315
: 524–528.7 Harvey JN, Craney L, Kelly D. Estimation of the prevalence of
diagnosed diabetes from primary care and secondary care sourcedata: comparison of record linkage with capture–recapture analysis.
J Epidemiol Community Health
2002;
56
: 18–23.8 Department of Health.
Health Survey for England. Cardiovasculardisease 1999.
London: The Stationery Office, 1998.9 Shaw A, McMunn A, Field J eds.
The Scottish Health Survey 1998
,Vol. 1, Findings, Vol. 2,
Technical Report.
Edinburgh: The StationeryOffice, 2000.
10
Welsh Health Survey 1998. Results of the Second Welsh HealthSurvey.
Cardiff: The National Assembly for Wales, 1999.11 DECODE Study Group on behalf of the European Diabetes Epidemi-
ology Study Group. Will new diagnostic criteria for diabetes mellituschange phenotype of patients with diabetes? Reanalysis of Europeanepidemiological data.
Br Med J
1998;
317
: 371–375.12 Simmons D, Williams DR, Powell MJ. The Coventry Diabetes Study:
prevalence of diabetes and impaired glucose tolerance in Europidsand Asians.
Q J Med
1991;
81
: 1021–1030.13 Williams DR, Wareham NJ, Brown DC, Byrne CD, Clark PM,
Cox BD
et al.
Undiagnosed glucose intolerance in the community: theIsle of Ely Diabetes Project.
Diabet Med
1995;
12
: 30–35.14 Unwin N, Harland J, White M, Bhopal R, Winocour P, Stephenson P
et al.
Body mass index, waist circumference, waist–hip ratio, andglucose intolerance in Chinese and Europid adults in Newcastle, UK.
J Epidemiol Community Health
1997;
51
: 160–166.15 Yudkin JS, Forrest RD, Jackson CA, Burnett SD, Gould MM. The
prevalence of diabetes and impaired glucose tolerance in a Britishpopulation.
Diabetes Care
1993;
16
: 1530.16 Forrest RD, Jackson CA, Yudkin JS. Glucose intolerance and hyper-
tension in north London: the Islington Diabetes Survey.
Diabet Med
1986;
3
: 338–342.17 Riste L, Khan F, Cruickshank K. High prevalence of type 2 diabetes
in all ethnic groups, including Europeans, in a British inner city:relative poverty, history, inactivity, or 21st century Europe?
DiabetesCare
2001;
24
: 1377–1383.18 Mooy JM, Grootenhuis PA, de Vries H, Valkenburg HA, Bouter LM,
Kostense PJ
et al.
Prevalence and determinants of glucose intolerancein a Dutch Caucasian population. The Hoorn Study.
Diabetes Care
1995;
18
: 1270–1273.
20LetterLettersLettersLetter
Poor pregnancy outcome for women with Type 2 diabetes
Women with diabetes are known to be at higher risk of obstet-ric complications than their non-diabetic counterparts. TheDiabetes Control and Complications Trial (DCCT) [1] is theonly long-term randomized prospective study which hasallowed analysis of pregnancy outcomes in women with Type1 diabetes in relation to glycaemic control. Significantly lowerglycosylated haemoglobin (HbA
1c
) levels at conception inthe intensively controlled group were associated with a lowerrate of congenital malformations in the offspring than seen inthe conventionally controlled group, although success ratesremain less than in the general population despite intensiveglycaemic control with HbA
1c
levels close to normal.
As there is little information about obstetric outcomes inolder women with Type 2 diabetes, we have reviewed thelimited data available from the UK Prospective DiabetesStudy (UKPDS). The UKPDS did not specifically set out to studyobstetric outcomes [2,3]. However, pregnancy intention wasnot an exclusion criterion and pregnancy did not precludecontinued participation. Of the 5102 newly diagnosed Type 2diabetic subjects recruited, 2094 were women. They weremean (
SD
) 53 (9) years old with 86 aged 25–34 years, 292 aged35–44 years and 1716 aged 45–65 years. Eighty-four percentwere white Caucasian (WC), 8% Afro-Caribbean (AC) and7% Indian Asian (IA). One thousand two hundred andtwenty-five (58%) were self-reported as post-menopausal atrecruitment with one aged 25–34 years and 19 aged 35–44 years. One thousand eight hundred and one (86%) had pre-vious pregnancies, with more AC (72%) and IA (69%) havingthree or more pregnancies than WC (47%). Two hundred andeight (10%) women reported being diagnosed with gestationaldiabetes before entry to the trial.
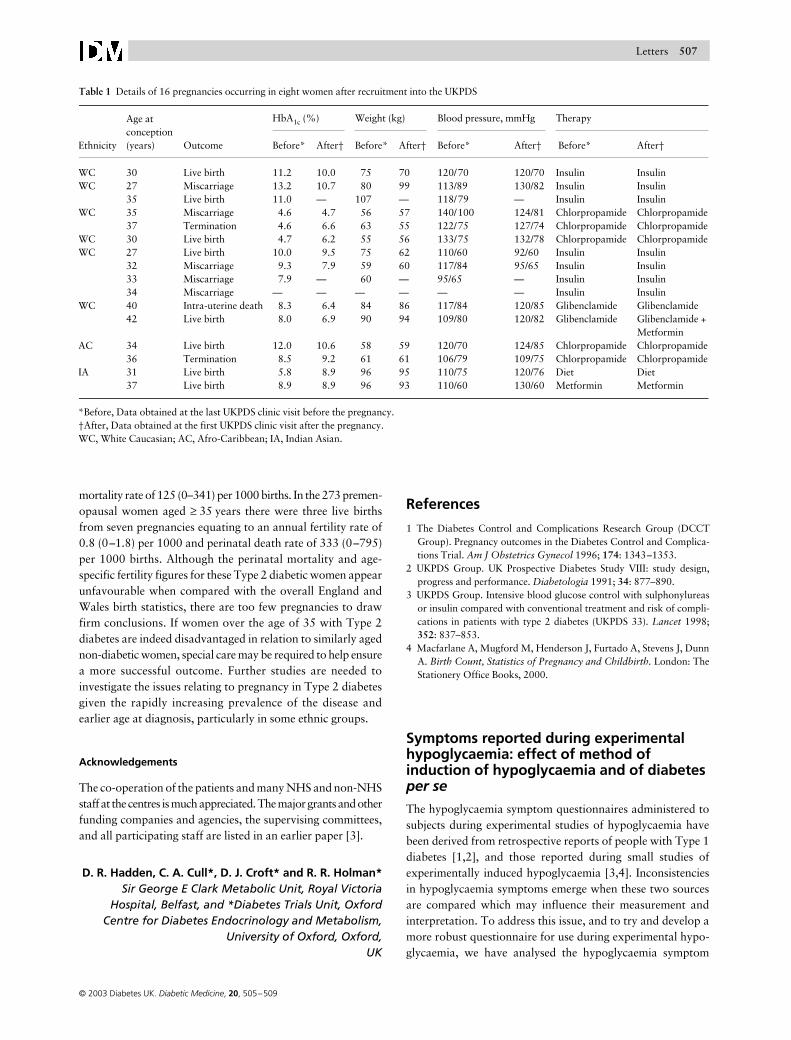
Between 1977 and 1997, eight women had a total of 16pregnancies with eight live births (Table 1). During pregnancywomen on oral hypoglycaemic therapy were normallychanged to insulin therapy, but returned to their allocatedUKPDS therapy where possible after delivery. No consistentpattern of glycaemic control was seen in HbA
1c
valuesrecorded before and after pregnancy, nor any observablerelationship to obstetric outcome. No relationship was seenbetween therapy at conception and pregnancy outcome. Onetermination was as a result of Turner’s syndrome diagnosed byamniocentesis. The reason for the second termination couldnot be ascertained. One child was born with a severe con-genital abnormality (microphthalmia). All other live births wereof normal children.
By comparison, the DCCT studied 1441 Type 1 diabetic patientsaged 13–39 years, 680 (47%) women, 180 of whom had a totalof 270 pregnancies. At conception mean HbA
1c
was higherin the conventional than in the intensive control group (8.1%vs. 7.4%;
P
< 0.0001). At the time of delivery mean HbA
1c
was the same in both groups (6.6%). In the conventionallytreated group there were eight congenital malformations,14 spontaneous abortions and nine intrauterine deaths. Inthe intensively treated group there were one congenital mal-formation, 18 spontaneous abortions and five intrauterinedeaths.
Published statistics for pregnancy experience by age groupsfor England and Wales [4] show that over the past 20 yearsthe perinatal mortality for children born to women aged
≥
35 years has fallen steadily from 20.8 (19.4–22.2) per 1000births in 1979 to 8.6 (8.0–9.2) per 1000 births in 1996. Dur-ing the same time period the age-specific fertility has risen inwomen aged 35–39 years from 18 (16–20) per 1000 in 1977to 38 (36–40) per 1000 in 1997.
Eight live births from 16 pregnancies in 378 women< 45 years old in the UKPDS over a median of 13 years equatesto an annual fertility rate of 1.6 (0.5–2.7), and a perinatal
Letters
507
© 2003 Diabetes UK.
Diabetic Medicine
,
20
, 505–509
mortality rate of 125 (0–341) per 1000 births. In the 273 premen-opausal women aged
≥
35 years there were three live birthsfrom seven pregnancies equating to an annual fertility rate of0.8 (0–1.8) per 1000 and perinatal death rate of 333 (0–795)per 1000 births. Although the perinatal mortality and age-specific fertility figures for these Type 2 diabetic women appearunfavourable when compared with the overall England andWales birth statistics, there are too few pregnancies to drawfirm conclusions. If women over the age of 35 with Type 2diabetes are indeed disadvantaged in relation to similarly agednon-diabetic women, special care may be required to help ensurea more successful outcome. Further studies are needed toinvestigate the issues relating to pregnancy in Type 2 diabetesgiven the rapidly increasing prevalence of the disease andearlier age at diagnosis, particularly in some ethnic groups.
Acknowledgements
The co-operation of the patients and many NHS and non-NHSstaff at the centres is much appreciated. The major grants and otherfunding companies and agencies, the supervising committees,and all participating staff are listed in an earlier paper [3].
D. R. Hadden, C. A. Cull*, D. J. Croft* and R. R. Holman*
Sir George E Clark Metabolic Unit, Royal VictoriaHospital, Belfast, and *Diabetes Trials Unit, Oxford
Centre for Diabetes Endocrinology and Metabolism,University of Oxford, Oxford,
UK
References
1 The Diabetes Control and Complications Research Group (DCCTGroup). Pregnancy outcomes in the Diabetes Control and Complica-tions Trial.
Am J Obstetrics Gynecol
1996;
174
: 1343–1353.2 UKPDS Group. UK Prospective Diabetes Study VIII: study design,
progress and performance.
Diabetologia
1991;
34
: 877–890.3 UKPDS Group. Intensive blood glucose control with sulphonylureas
or insulin compared with conventional treatment and risk of compli-cations in patients with type 2 diabetes (UKPDS 33).
Lancet
1998;
352
: 837–853.4 Macfarlane A, Mugford M, Henderson J, Furtado A, Stevens J, Dunn
A.
Birth Count, Statistics of Pregnancy and Childbirth.
London: TheStationery Office Books, 2000.
200320LetterLettersLettersLetters
Symptoms reported during experimental hypoglycaemia: effect of method of induction of hypoglycaemia and of diabetes
per se
The hypoglycaemia symptom questionnaires administered tosubjects during experimental studies of hypoglycaemia havebeen derived from retrospective reports of people with Type 1diabetes [1,2], and those reported during small studies ofexperimentally induced hypoglycaemia [3,4]. Inconsistenciesin hypoglycaemia symptoms emerge when these two sourcesare compared which may influence their measurement andinterpretation. To address this issue, and to try and develop amore robust questionnaire for use during experimental hypo-glycaemia, we have analysed the hypoglycaemia symptom
Table 1 Details of 16 pregnancies occurring in eight women after recruitment into the UKPDS
Age atconception(years)
HbA1c (%) Weight (kg) Blood pressure, mmHg Therapy
Ethnicity Outcome Before* After† Before* After† Before* After† Before* After†
WC 30 Live birth 11.2 10.0 75 70 120/70 120/70 Insulin InsulinWC 27 Miscarriage 13.2 10.7 80 99 113/89 130/82 Insulin Insulin
35 Live birth 11.0 — 107 — 118/79 — Insulin InsulinWC 35 Miscarriage 4.6 4.7 56 57 140/100 124/81 Chlorpropamide Chlorpropamide
37 Termination 4.6 6.6 63 55 122/75 127/74 Chlorpropamide ChlorpropamideWC 30 Live birth 4.7 6.2 55 56 133/75 132/78 Chlorpropamide ChlorpropamideWC 27 Live birth 10.0 9.5 75 62 110/60 92/60 Insulin Insulin
32 Miscarriage 9.3 7.9 59 60 117/84 95/65 Insulin Insulin33 Miscarriage 7.9 — 60 — 95/65 — Insulin Insulin34 Miscarriage — — — — — — Insulin Insulin
WC 40 Intra-uterine death 8.3 6.4 84 86 117/84 120/85 Glibenclamide Glibenclamide42 Live birth 8.0 6.9 90 94 109/80 120/82 Glibenclamide Glibenclamide +
MetforminAC 34 Live birth 12.0 10.6 58 59 120/70 124/85 Chlorpropamide Chlorpropamide
36 Termination 8.5 9.2 61 61 106/79 109/75 Chlorpropamide ChlorpropamideIA 31 Live birth 5.8 8.9 96 95 110/75 120/76 Diet Diet
37 Live birth 8.9 8.9 96 93 110/60 130/60 Metformin Metformin
*Before, Data obtained at the last UKPDS clinic visit before the pregnancy.†After, Data obtained at the first UKPDS clinic visit after the pregnancy.WC, White Caucasian; AC, Afro-Caribbean; IA, Indian Asian.
© 2003 Diabetes UK.
Diabetic Medicine
,
20
, 505–509
508
Letters
reports taken from nine separate studies (
n
= 192 subjects)performed in our laboratory [4–12]. We compared the fre-quency, intensity, variability and factorial structure of thesymptoms of hypoglycaemia reported by Type 1 diabetic andnon-diabetic subjects during two different experimentalmodels of hypoglycaemia (one-step hyperinsulinaemic glucoseclamp vs. insulin intravenous infusion technique). The hypo-glycaemia symptom questionnaire given to subjects was devel-oped in Edinburgh over a period of 3 years [1,2,4]. Detaileddescriptions of study methodologies and subject groups arecontained in the original publications [4–12]. The subjectswith Type 1 diabetes had no complications and retained nor-mal hypoglycaemia awareness, and non-diabetic subjects wereall in good health. Symptom reports were available for 169subjects (92 people with, and 77 without, Type 1 diabetes).This analysis included only those symptoms common to allstudies and used reports from a single common time-point.The hypoglycaemia symptoms analysed were: sweating, trem-bling, inability to concentrate, drowsiness, anxiety, confusion,difficulty speaking, blurred vision, double vision, hunger,weakness, tiredness and warmness.
We initially compared the mean and standard deviation ofthe intensity of each reported hypoglycaemia symptom. Herewe found close agreement between subjects with and withoutType 1 diabetes (respectively
ρ
= 0.84;
ρ
= 0.70; both
P
< 0.05).Similarly, the frequency with which each symptom wasreported was very similar between subjects with and withoutType 1 diabetes (
ρ
= 0.84;
P
< 0.05). When subjects weregrouped according to the method by which hypoglycaemiawas induced (insulin infusion vs. hyperinsulinaemic glucoseclamp) we again found close agreement in reported hypogly-caemia symptoms (all
P
< 0.05). These results indicate that thesubjective experience of experimental hypoglycaemia is notaffected by the diabetic state of an individual or by the methodby which hypoglycaemia is induced.
To each of these four groups [namely subjects with (
n
= 92)and without Type 1 diabetes (
n
= 77); and subjects wherehypoglycaemia was induced by an insulin infusion (
n
= 66) ora hyperinsulinaemic glucose clamp (
n
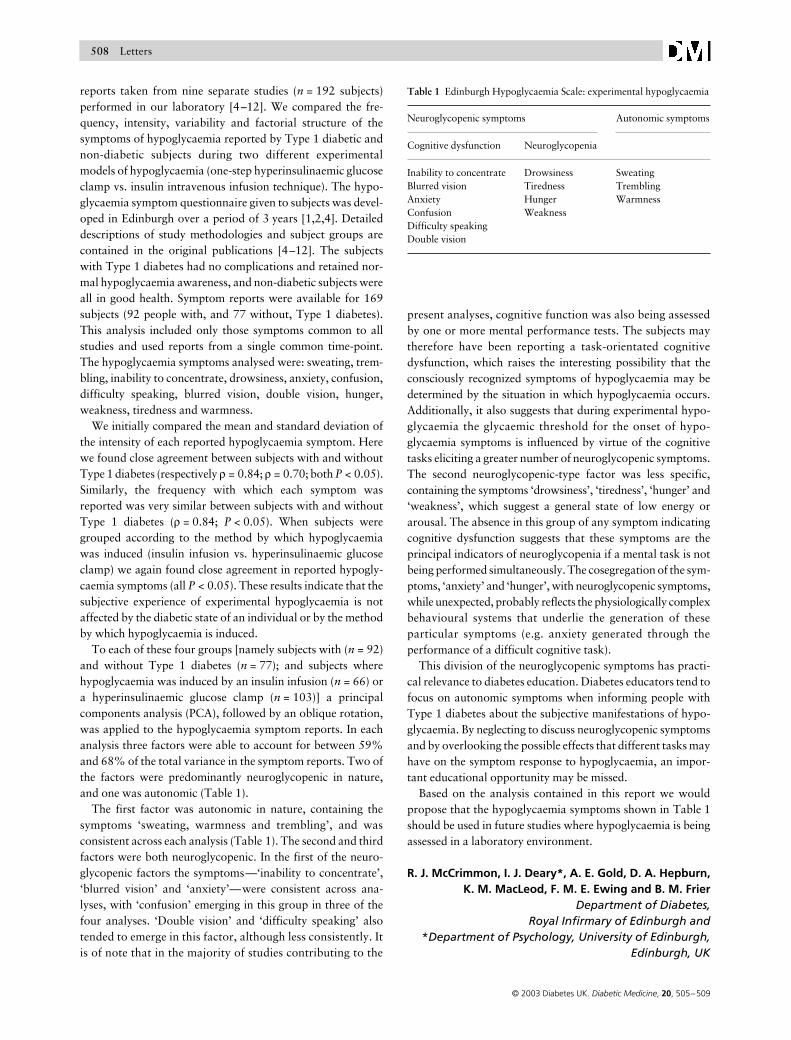
= 103)] a principalcomponents analysis (PCA), followed by an oblique rotation,was applied to the hypoglycaemia symptom reports. In eachanalysis three factors were able to account for between 59%and 68% of the total variance in the symptom reports. Two ofthe factors were predominantly neuroglycopenic in nature,and one was autonomic (Table 1).
The first factor was autonomic in nature, containing thesymptoms ‘sweating, warmness and trembling’, and wasconsistent across each analysis (Table 1). The second and thirdfactors were both neuroglycopenic. In the first of the neuro-glycopenic factors the symptoms—‘inability to concentrate’,‘blurred vision’ and ‘anxiety’—were consistent across ana-lyses, with ‘confusion’ emerging in this group in three of thefour analyses. ‘Double vision’ and ‘difficulty speaking’ alsotended to emerge in this factor, although less consistently. Itis of note that in the majority of studies contributing to the
present analyses, cognitive function was also being assessedby one or more mental performance tests. The subjects maytherefore have been reporting a task-orientated cognitivedysfunction, which raises the interesting possibility that theconsciously recognized symptoms of hypoglycaemia may bedetermined by the situation in which hypoglycaemia occurs.Additionally, it also suggests that during experimental hypo-glycaemia the glycaemic threshold for the onset of hypo-glycaemia symptoms is influenced by virtue of the cognitivetasks eliciting a greater number of neuroglycopenic symptoms.The second neuroglycopenic-type factor was less specific,containing the symptoms ‘drowsiness’, ‘tiredness’, ‘hunger’ and‘weakness’, which suggest a general state of low energy orarousal. The absence in this group of any symptom indicatingcognitive dysfunction suggests that these symptoms are theprincipal indicators of neuroglycopenia if a mental task is notbeing performed simultaneously. The cosegregation of the sym-ptoms, ‘anxiety’ and ‘hunger’, with neuroglycopenic symptoms,while unexpected, probably reflects the physiologically complexbehavioural systems that underlie the generation of theseparticular symptoms (e.g. anxiety generated through theperformance of a difficult cognitive task).
This division of the neuroglycopenic symptoms has practi-cal relevance to diabetes education. Diabetes educators tend tofocus on autonomic symptoms when informing people withType 1 diabetes about the subjective manifestations of hypo-glycaemia. By neglecting to discuss neuroglycopenic symptomsand by overlooking the possible effects that different tasks mayhave on the symptom response to hypoglycaemia, an impor-tant educational opportunity may be missed.
Based on the analysis contained in this report we wouldpropose that the hypoglycaemia symptoms shown in Table 1should be used in future studies where hypoglycaemia is beingassessed in a laboratory environment.
R. J. McCrimmon, I. J. Deary*, A. E. Gold, D. A. Hepburn,K. M. MacLeod, F. M. E. Ewing and B. M. Frier
Department of Diabetes,Royal Infirmary of Edinburgh and
*
Department of Psychology, University of Edinburgh,Edinburgh, UK
Table 1 Edinburgh Hypoglycaemia Scale: experimental hypoglycaemia
Neuroglycopenic symptoms Autonomic symptoms
Cognitive dysfunction Neuroglycopenia
Inability to concentrate Drowsiness SweatingBlurred vision Tiredness TremblingAnxiety Hunger WarmnessConfusion WeaknessDifficulty speakingDouble vision
Letters
509
© 2003 Diabetes UK.
Diabetic Medicine
,
20
, 505–509
References
1 Deary IJ, Hepburn DA, MacLeod KM, Frier BM. Partitioning thesymptoms of hypoglycaemia using multi-sample confirmatory factoranalysis.
Diabetologia
1993;
36
: 771–777.2 Hepburn DA, Deary IJ, Frier BM. Classification of symptoms of
hypoglycaemia in insulin-treated diabetic patients using factoranalysis: relationship to hypoglycaemia unawareness.
Diabet Med
1992;
9
: 70–75.3 Towler DA, Havlin CE, Craft S, Cryer P. Mechanism of awareness of
hypoglycemia: perception of neurogenic (predominantly cholinergic)rather than neuroglycopenic symptoms.
Diabetes
1999;
42
: 1791–1798.
4 Hepburn DA, Deary IJ, Frier BM, Patrick AW, Quinn JD, Fisher BM.Symptoms of acute hypoglycemia in humans with and withoutIDDM. Factor analysis approach.
Diabetes Care
1991;
14
: 949–957.5 McCrimmon RJ, Frier BM. Symptomatic and physiological
responses to hypoglycaemia induced by human soluble insulin andthe analogue lispro human insulin.
Diabet Med
1997;
14
: 929–936.6 McCrimmon RJ, Deary IJ, Huntly BJP, MacLeod KM, Frier BM.
Visual information processing during controlled hypoglycaemia innon-diabetic humans.
Brain
1996;
119
: 1277–1287.7 McCrimmon RJ, Deary IJ, Frier BM. Auditory information process-
ing during acute insulin-induced hypoglycaemia in non-diabetichuman subjects.
Neuropsychologia
1997;
35
: 1547–1553.8 Ewing FME, Deary IJ, McCrimmon RJ, Strachan MJW, Frier BM.
Effect of acute hypoglycemia on visual information processing inadults with type 1 diabetes mellitus.
Physiol Behav
1998;
64
: 653–660.
9 Frier BM, Ewing FME, Lindholm A, Hylleberg B, Kanc K. Sympto-matic and counterregulatory hormonal responses to acute hypogly-caemia induced by insulin aspart and soluble human insulin in type 1diabetes.
Diabetes Metab Res Rev
2000;
16
: 262–268.10 Gold AE, Deary IJ, MacLeod KM, Thomson KJ, Frier BM. Cognitive
function during insulin-induced hypoglycemia in humans: short-termcerebral adaptation does not occur.
Psychopharmacology
1995;
119
:325–333.
11 Gold AE, MacLeod KM, Deary IJ, Frier BM. Hypoglycemia-inducedcognitive dysfunction in diabetes mellitus: effect of hypoglycemiaunawareness.
Physiol Behav
1995;
58
: 501–511.12 Strachan MWJ, Ewing FME, Frier BM, McCrimmon RJ, Deary IJ.
Effects of acute hypoglycaemia on auditory information processingin adults with Type 1 diabetes.
Diabetologia
2003;
46
: 97–105.
20LettersLettersLettersLetters
Ambulatory blood pressure monitoring
In a recent study by Strachan
et al
. it is concluded that ambu-latory blood pressure monitoring (AMBP) is generally unnec-essary in patients with diabetes [1] as clinic BP > 140/80 mmHg detects 99% of patients with ‘awake’ AMBP > 130/75 mmHg which are the targets recommended by the BritishHypertension Society (BHS) [2].
As you will be aware, when you enter a beauty contest, it isimportant to make sure that the other contenders are ugly, andindeed the AMBP targets proposed by the BHS may not makea fair comparison.
The very low criteria for ‘awake’ normotension accordingBHS had the peculiar consequence that clinic BP according to
Strachan
et al
. is considered poor for diagnosing normoten-sion and excellent for diagnosing hypertension. Only 27% ofthe patients with normal clinic BP managed to be accepted asnormotensive based on day-time AMBP. On the other hand,AMBP confirmed nearly every case of clinic hypertension. Asan example a diagnosis of hypertension based on a clinic BP,142/92 mmHg would according to Stachan
et al
. be ‘con-firmed’ by AMBP if the day-time average was 128/78 mmHg.
Undoubtedly the authors are familiar with our paper on thissubject which appeared in this journal in late 2001 [3].Addressing precisely this issue we found that 65% of normo-tensive diabetic patients had a diastolic day-time AMBP> 75 mmHg and concluded that this target proposed by theBHS is too low and based on the misconception that in normo-tensive subjects day-time AMBP is lower than clinic BP. Webelieve that it would have been timely to discuss this point,which is crucial for the claims made by Strachan
et al
.
K. W. Hansen, P. L. Poulsen and C. E. Mogensen
Medical Department M, Aarhus Kommunehospital,Aarhus, Denmark
References
1 Strachan MW, Gough K, McKnight JA, Padfield PL. Ambulatory blood pressure monitoring: is it necessary for the routine assessment ofhypertension in people with diabetes?
Diabet Med
2002;
19
: 787–789.2 Ramsay L, Williams B, Johnston G, MacGregor G, Poston L, Potter J
et al.
Guidelines for management of hypertension: report of the thirdworking party of the British Hypertension Society.
J Hum Hypertens
1999;
13
: 569–592.3 Hansen KW, Poulsen PL, Ebbehøj E, Mogensen CE. What is hyperten-
sion in diabetes? Ambulatory blood pressure in 137 normotensive andnormoalbuminuric Type 1 diabetic patients.
Diabet Med
2001;
18
:370–373.
Reply
We are grateful to Hansen and colleagues for their interest inour study. While they are undoubtedly correct that one mustchoose one’s opponents wisely upon entering a beauty contest,one must also obey the rules of the competition. Their asser-tion that the current British Hypertension Society (BHS) target‘awake’ ambulatory blood pressure of < 130/75 mmHg is toolow is a fair one and may well be correct. However, the factremains that for the time being at least, the BHS have specifiedthis target and it will undoubtedly influence doctors notonly in this country, but also elsewhere. It was thereforequite appropriate that we chose this target in our article,but we were absolutely proscriptive throughout that ourfindings could only be interpreted ‘with regard to currentBHS guidelines’.
M. W. J. Strachan, K. Gough, J. A. McKnight andP. L. Padfield