Embed Size (px)
Citation preview

Partners for better health
Diabetes MILES – Australia 2011 Survey Report
DiabetesMILESStudy
The Diabetes MILES – Australia 2011 Survey was funded by a National Diabetes Services Scheme (NDSS) Strategic Development Grant. The NDSS is an initiative of the Australian Government administered by Diabetes Australia. Diabetes MILES – Australia is an initiative of The Australian Centre for Behavioural Research in Diabetes, a partnership for better health between Diabetes Australia – Vic and Deakin University.

© The Australian Centre for Behavioural Research in Diabetes, 30 November 2011.
Suggested citation: Speight J, Browne JL, Holmes-Truscott E, Hendrieckx C, Pouwer F, on behalf of the Diabetes MILES – Australia reference group (2011). Diabetes MILES – Australia 2011 Survey Report. Diabetes Australia – Vic, Melbourne.

PAGE 1
Acknowledgements
The Diabetes MILES Study is an international collaborative. This report details the first phase of Diabetes MILES – Australia: the 2011 survey of adults with type 1 or type 2 diabetes. The study was conducted by The Australian Centre for Behavioural Research in Diabetes, a partnership for better health between Diabetes Australia – Vic and Deakin University. It was led by Foundation Director, Professor Jane Speight, who conceived the Diabetes MILES Study.
Further information about the Centre can be found at www.acbrd.org.au.
The Diabetes MILES – Australia 2011 survey was funded by a National Diabetes Services Scheme (NDSS) Strategic Development Grant. The NDSS is an initiative of the Australian Government administered by Diabetes Australia.
The development of the Diabetes MILES Study website (www.diabetesMILES.org) was supported by an unrestricted grant from sanofi-aventis. This website provides the public with information about the study, and a link to access the online version of the Diabetes MILES – Australia 2011 survey.
The Diabetes MILES – Australia research team includes:
Prof Jane Speight (Foundation Director) Ms Elizabeth Holmes-Truscott (Project Manager) Dr Jessica Browne (Research Fellow) Dr Christel Hendrieckx (Research Fellow) Ms Jennifer Halliday (Research Assistant) Ms Jasmin Schabert (Research Assistant)
We would like to thank all those who have been instrumental in the development of Diabetes MILES – Australia:
Reference GroupDiabetes MILES – Australia was informed by a reference group of 32 multi-disciplinary national and international experts (see Appendix I). The Reference Group was consulted on the content of the survey, and will continue to collaborate with the research team in the preparation of peer-reviewed publications arising from Diabetes MILES – Australia.
Technical Support DataTime Services prepared and printed 15,000 copies of the questionnaire booklet for the postal survey and then conducted the scanning of returns and data entry. The development of the Diabetes MILES website was facilitated by Mr Dale Roberts, Diabetes Australia – Vic, and designed by Butterfly Internet. The online survey was developed and administered by Mr Luke Barisic, School of Psychology, Deakin University.
VolunteersMr Con Adams and Mr Dean Weeks, Diabetes Australia – Vic, coordinated the packaging and mailing of 15,000 surveys with the assistance of a team of dedicated volunteers. Mr David Wilson provided support throughout numerous stages of survey distribution and data processing.
Diabetes MILES – Australia 2011 survey respondentsLast but certainly not least, the research team would like to thank all Australians with type 1 or type 2 diabetes who took part in the Diabetes MILES – Australia 2011 survey. We hope you find this report of interest.
PAGE 2
Message from Chief Investigator
The health and well-being of people with diabetes are inextricably linked. Neither can really prosper without the other. Yet, efforts to improve the health of Australians living with diabetes often disregard the psychological and social impact of the condition, its treatment and complications, and ignore the behavioural changes that many people need to make. Successful management of diabetes requires attention to the behavioural, psychological and social aspects of this progressive condition.Why was a national survey needed? With an average of only six hours per year spent with healthcare professionals, over 99% of diabetes care is self-care. International evidence indicates that achieving treatment goals is difficult and many people lack the skills, support and well-being to cope successfully with
the daily demands of diabetes. Yet, we know very little about how Australians manage their diabetes and how it impacts on their lives. The impact of diabetes on quality of life and emotional well-being cannot be measured with blood tests. To understand subjective outcomes, we need to ask individuals about their own experiences, thoughts and feelings.Building upon pivotal studies from Europe and the US, Diabetes MILES (Management and Impact for Long-term Empowerment and Success) – Australia is the first of its kind to conduct in-depth assessments of the psychological health and unmet needs of Australians living with diabetes at a national level. In particular, Diabetes MILES focuses not on diabetes but on the person living with diabetes. It highlights the key behavioural, psychological and social barriers to optimal diabetes care. With its roots firmly in Australia, Diabetes MILES is now an international collaborative, with a study ongoing in The Netherlands and active plans for similar studies in several other European countries.I am proud to present the findings of the Diabetes MILES – Australia 2011 survey, which was funded by a National Diabetes Services Scheme (NDSS) Strategic Development Grant. The NDSS is an initiative of the Australian Government, administered by Diabetes Australia. The following pages provide an overview of the key findings of the Diabetes MILES – Australia 2011 survey. Like a carefully planted vineyard, Diabetes MILES – Australia may not yield its best product for many years to come. In the short term, a number of in-depth peer-reviewed publications will be generated from this rich and diverse dataset. However, the true value of this dataset is as a comprehensive baseline against which future surveys will be able to compare the health and well-being of Australians living with diabetes.I invite interested readers to visit our dedicated website at www.diabetesMILES.org. Finally, I want to offer thanks to all Australians living with diabetes who took part in Diabetes MILES – Australia. Your input has been invaluable and will enable us to influence policy and practice in order to optimise your care.
Kind regards,
Professor Jane Speight CPsychol PhD AFBPsS Foundation Director, The Australian Centre for Behavioural Research in Diabetes* Chair, Behavioural and Social Research in Diabetes, Deakin University
* a partnership for better health between Diabetes Australia – Vic and Deakin University

PAGE 3
Acknowledgements ......................................................................................................................1
Message from Chief Investigator ....................................................................................................2
List of Figures .............................................................................................................................4
List of Tables ..............................................................................................................................4
List of Abbreviations .....................................................................................................................5
Executive Summary .....................................................................................................................6
Introduction ................................................................................................................................9
Method .................................................................................................................................... 10
Demographics ........................................................................................................................... 12
General Health ......................................................................................................................... 15
Diabetes Self-Care and Management ............................................................................................ 16
Access to Health Care ................................................................................................................ 18
Psychological and Emotional Well-being ........................................................................................ 21
Diabetes-Specific Quality of Life ...................................................................................................25
Diabetes-Related Distress ...........................................................................................................25
Support ....................................................................................................................................26
Beliefs About Diabetes ...............................................................................................................28
National Diabetes Services Scheme Access ................................................................................... 31
Discussion ................................................................................................................................32
References ...............................................................................................................................35
Appendix I: Diabetes MILES – Australia Reference Group .................................................................37
Appendix II: Variables included in Diabetes MILES – Australia ..........................................................38
Appendix III: Scales Included in Report .........................................................................................40
Table of Contents

PAGE 4
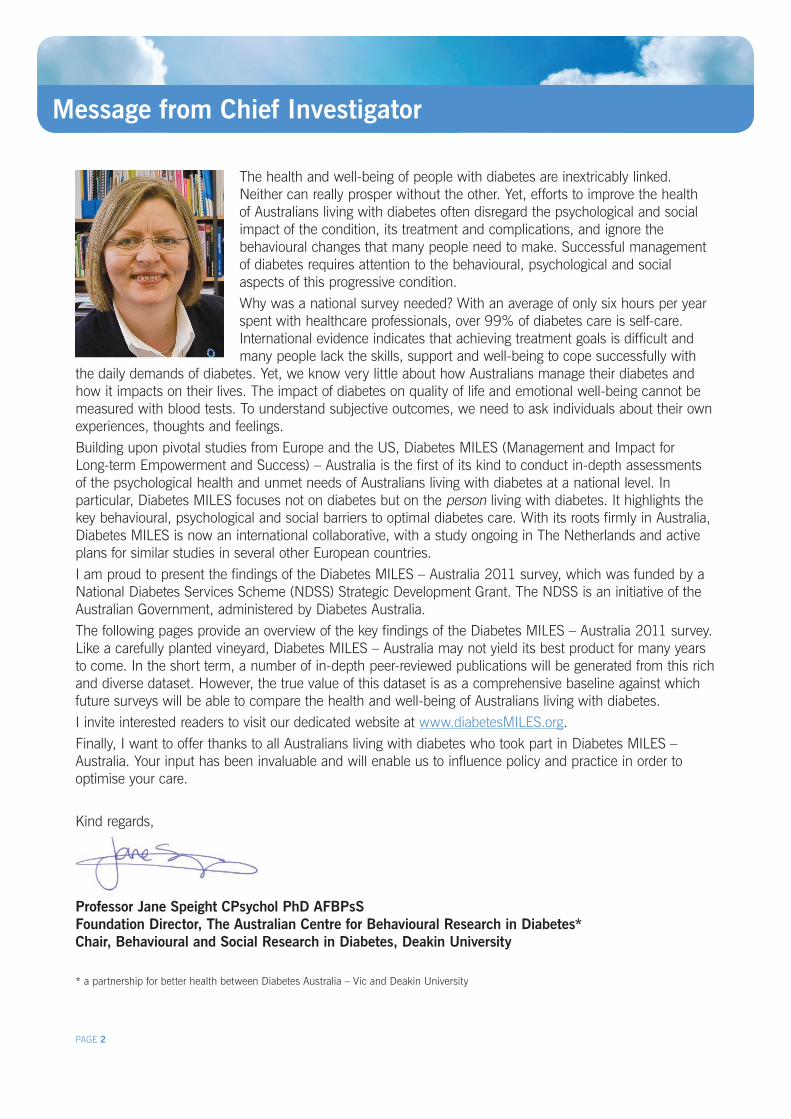
Figure 1. Postal and online survey respondents by survey version ..................................................... 11
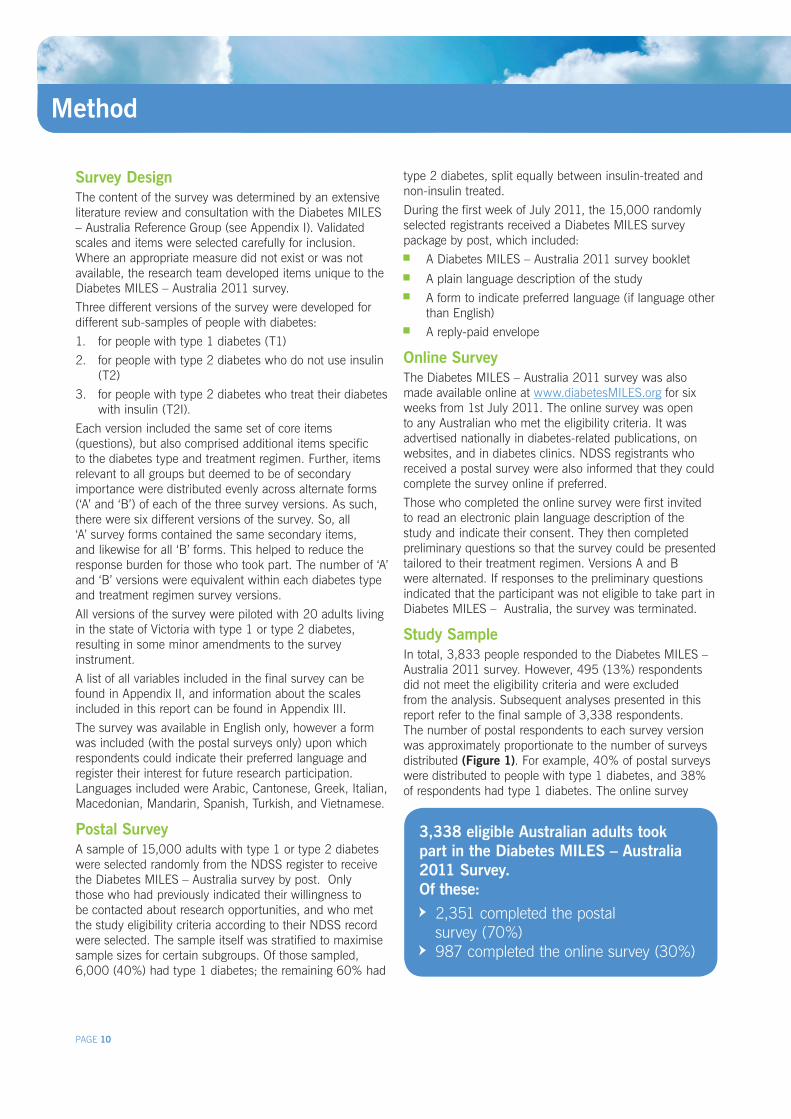
Figure 2. Age (years) by diabetes type .......................................................................................... 12
Figure 3. Respondents by area .................................................................................................... 13
Figure 4. Diabetes-related complications by diabetes type ................................................................ 15
Figure 5. Main diabetes treatment by diabetes type ........................................................................ 16
Figure 6. Health care professionals accessed in past 12 months by diabetes type ............................... 18
Figure 7. Main health care professional by diabetes type ................................................................. 19
Figure 8. Mean score on well-being domains by diabetes type ......................................................... 21
Figure 9. Severity of depressive symptoms by diabetes type .............................................................22
Figure 10. Mean PHQ-9 score by diabetes type and gender.............................................................22
Figure 11. Severity of anxiety symptoms by diabetes type ................................................................23
Figure 12. Mean GAD-7 score by diabetes type and gender .............................................................23
Figure 13. Support and information from health care professionals in the last 3 months ......................26
Figure 14. Number of people you can talk to about your diabetes .....................................................27
Figure 15. Support group participation and interest in participation by gender and diabetes type ...........27
Figure 16. Beliefs about diabetes by diabetes type..........................................................................29
Figure 17. NDSS services accessed in the past 12 months by diabetes type ...................................... 31
List of Figures
List of Tables
Table 1. Diabetes type by gender ................................................................................................. 12
Table 2. Number of respondents by state ...................................................................................... 13
Table 3. HbA1c (%) descriptive statistics ....................................................................................... 17
Table 4. Respondents who had accessed subsidised NDSS products in the past year .......................... 31

PAGE 5
List of Abbreviations
BIPQ Brief Illness Perceptions Questionnaire
DFSC Diabetes Family Support and Conflict scale
DSCI-R Diabetes Self-Care Inventory-Revised
GAD-7 7-item Generalised Anxiety Disorder scale
GP General practitioner
HbA1c Glycosylated haemoglobin (a measure of average blood glucose over 6-8 weeks)
HCP Health care professional
MILES Management and Impact for Long-term Empowerment and Success
NDSS National Diabetes Services Scheme
PAID Problem Areas In Diabetes scale
PHQ-9 9-item Patient Health Questionnaire
PWI Personal Wellbeing Index
QoL-Q Quality of Life Questionnaire
RSSM-SF Resources and Support for Self-Management Short Form
T1 Survey version for people with type 1 diabetes
T2 Survey version for people with type 2 non-insulin-treated diabetes
T2I Survey version for people with type 2 insulin-treated diabetes

PAGE 6
Executive Summary
Approximately 1.7 million Australians are currently living with diabetes, a family of complex metabolic conditions, affecting people of all ages, backgrounds and cultures. In addition to medical management, living successfully with diabetes requires attention to the behavioural, psychological and social aspects of the condition.
Diabetes MILES (Management and Impact for Long-term Empowerment and Success) – Australia was a national survey of Australians living with type 1 or type 2 diabetes. The aim of the study was to assess the impact of diabetes on the quality of life and psychosocial health and well-being of Australians living with the condition, and provide a baseline against which the results of future studies can be compared.
MethodThe Diabetes MILES – Australia 2011 survey was designed specifically for Australians living with type 1 or type 2 diabetes, aged 18 - 70 years. English proficiency was required in order to be eligible to take part.
In July 2011, the survey was posted to 15,000 National Diabetes Services Scheme (NDSS) registrants and made available online. Respondents completed one of three different survey versions, based on their diabetes type and treatment regimen.
In total, 3,338 survey respondents met the eligibility criteria, of whom 70% completed the postal survey and 30% completed the survey online.
In total, 41% of the respondents had type 1 diabetes: 61% women, 39% men Mean age: 42 years
59% of respondents had type 2 diabetes: 49% women, 51% men Mean age: 59 years 37% managing their diabetes with insulin
Overall, most respondents spoke English as their main language (97%), were born in Australia (75%), were married/in a defacto relationship (69%), had at least a high school education and were occupied in paid work (81% and 54% respectively). Adults with diabetes from all states and territories, and from metro, rural and regional areas took part in the study.
General HealthKey findings: Adults with type 2 diabetes were more likely to report
worse health overall, and more likely to indicate that their health had declined in the past year, as compared to adults with type 1 diabetes
Adults with type 2 diabetes were more likely to indicate they had diabetes-related complications (especially macrovascular complications) than those with type 1 diabetes
Diabetes Self-Care and ManagementKey findings: Most (63%) adults with type 1 diabetes treated their
diabetes using four or more injections of insulin per day The most common form of treatment for people with
type 2 diabetes was blood glucose lowering tablets (45% of respondents)
Using insulin to manage diabetes was not perceived as a major burden by adults with type 1 or type 2 insulin-treated diabetes
One in five adults with diabetes reported that they infrequently or never ate a healthy diet
Two thirds of adults with diabetes indicated that they did not engage in the recommended levels of physical activity
On average, self-reported HbA1c was within or only slightly above the target range. However, 32% of respondents did not know their most recent HbA1c value
20% of adults with type 1 diabetes reported having experienced a severe hypoglycaemic episode in the past six months
22% of adults with type 1 diabetes had impaired awareness of hypoglycaemia
Access to Health CareKey findings: 49% of adults with diabetes had never been offered
structured diabetes education Respondents accessed a range of health care
professionals (HCPs) each year. The HCP relied on most was:
– the endocrinologist, for adults with type 1 diabetes
– the GP, for adults with type 2 diabetes Continuity of care was considered to be high, as was
consistency of advice between HCPs Almost a quarter of respondents indicated that distance
was a barrier to health care
– Unsurprisingly, distance was more likely to be reported as a barrier by those living in rural and regional areas
Half of adults with diabetes considered cost to be a barrier to health care

PAGE 7
Executive Summary
Psychological and Emotional Well-beingKey findings: Overall, respondents were least satisfied with their
health, as compared to other aspects of their life
– Adults with type 2 insulin-treated diabetes had lower levels of satisfaction across all life domains (e.g. health, relationships, safety, standard of living) as compared to adults with type 1 or type 2 non-insulin-treated diabetes
Adults with type 2 insulin-treated diabetes were more likely to experience moderate to severe symptoms of depression and anxiety than other respondents
– Moderate to severe depressive symptoms affected 35% of adults with type 2 insulin-treated diabetes, as compared to 22% and 23% of those with type 1 and type 2 non-insulin-treated diabetes respectively
– Moderate to severe anxiety symptoms affected 19% of adults with type 2 insulin-treated diabetes, as compared to 15% and 14% of those with type 1 and type 2 non-insulin-treated diabetes respectively
Adults with type 1 diabetes were more likely to experience severe diabetes-related distress than other respondents
– 28% of adults with type 1 diabetes experienced severe distress, as compared to 22% and 17% of people with type 2 insulin-treated and type 2 non-insulin-treated diabetes respectively
– The most commonly reported problem area for respondents (consistent across diabetes types and treatment regimens) was worrying about the future and the development of diabetes-related complications
SupportKey findings: Adults with diabetes were generally satisfied with the
support they received from family and friends regarding management of their diabetes
Around 50% of adults with diabetes indicated that they had not been asked what is important to them in their diabetes management by a HCP in the last three months
Around 50% of adults with diabetes reported that they had not received adequate information from their HCPs in the last three months
6% of adults with diabetes were involved in a diabetes support group
One in three respondents were interested in joining a support group
Beliefs About DiabetesKey findings: Adults with type 1 diabetes felt that diabetes affected
their lives more severely, and affected them emotionally more so than did people with type 2 diabetes
Adults with type 1 diabetes indicated that they had greater understanding of their condition than did adults with type 2 diabetes
Adults who used insulin to manage their diabetes (regardless of diabetes type) reported experiencing more symptoms of diabetes than those who did not use insulin
Adults with type 2 insulin-treated diabetes perceived themselves to have less control over their condition as compared to other respondents
National Diabetes Services Scheme AccessKey findings: Blood glucose monitoring strips were the products
most commonly purchased through the NDSS (90% of respondents had done so in the past year)
Adults with type 2 diabetes were more likely than those with type 1 diabetes to access diabetes education programs, dietary services, and factsheets/booklets through the NDSS
Adults with type 1 diabetes were more likely than those with type 2 diabetes to access the NDSS website
Adults with type 2 diabetes were more likely to indicate high levels of satisfaction with NDSS products and services than those with type 1 diabetes
The findings of this survey identify issues concerning self-management, quality of life, psychological well-being and unmet needs of adults with diabetes across Australia. The findings of the Diabetes MILES – Australia 2011 survey provide a national “snapshot” of the quality of life and psychosocial well-being of Australian adults living with type 1 or type 2 diabetes. Study results will continue to reveal ways in which policy and practice can be improved to optimise diabetes care.

PAGE 8
“Someone has finally done it…its needed… there’s so much frustration…when it’s all put together in one voice and collected as a whole it’s easy to get out there” Feedback from a Diabetes MILES – Australia participant

PAGE 9
Introduction
Diabetes in AustraliaApproximately 1.7 million Australians are currently living with diabetes1. Diabetes is a family of complex metabolic conditions, affecting people of all ages, backgrounds and cultures. For many people with diabetes, the daily self-care is a significant burden and is known to impair both quantity2 and quality of life3.
The two most common forms of diabetes are: type 1 diabetes – affecting around 12% of all people
with diabetesi; and type 2 diabetes – the fastest growing chronic condition
in Australia, affecting around 85% of all people with diabetesi
In addition to medical management, living successfully with diabetes requires attention to the behavioural, psychological and social aspects of the condition. Achieving and sustaining optimal biomedical outcomes over a lifetime of diabetes requires that equal attention be given to the daily challenges faced by people with diabetes. Better understanding of their beliefs, feelings and behaviours, the self-management education and support they receive, as well as on how diabetes impacts on quality of life, is needed to inform future health policy and service provision so that people with diabetes receive optimal care and support.
Diabetes MILES – Australia 2011 SurveyDiabetes MILES (Management and Impact for Long-term Empowerment and Success) – Australia was a national survey of Australian adults living with type 1 or type 2 diabetes. The aim of the study was to gather data to provide insights into how Australians manage their diabetes, the support they receive, and the impact that diabetes has on their lives.
This national survey had a strong focus on investigating the self-management behaviours, psychological well-being, quality of life, health beliefs, and unmet needs of a large and diverse sample of Australian adults with diabetes.
Conducted in July 2011, the survey was designed specifically for Australians who met the following eligibility criteria: Living with type 1 or type 2 diabetes Aged 18 - 70 years Proficient in the English languageii
The response to Diabetes MILES – Australia was very positive. Those who took part were pleased to see that this kind of research was undertaken. Their comments are included as quotes throughout this report. Further information about the Diabetes MILES – Australia can be found at www.diabetesMILES.org.
Ethical ApprovalDiabetes MILES – Australia received ethical approval from the Deakin University Human Research Ethics Committee, reference number 2011-046.
Diabetes MILES – Australia 2011 ReportThis report presents a selection of findings from the Diabetes MILES – Australia 2011 survey, and serves a number of purposes: To meet the reporting requirements for the NDSS
Strategic Development Grant To provide an overview of the main themes and topics
that were explored in the survey, and report the top-line results
To make the initial results of the Diabetes MILES – Australia 2011 survey available to Australians with diabetes
Analysis of this large and rich dataset is ongoing. Further reports and peer-reviewed publications will be distributed in due course. For further information, please continue to visit: www.diabetesMILES.org.
i National figures accurate as of 31 October 11, obtained from the National Diabetes Services Scheme. ii Funding constraints meant that it was not possible to provide the survey in languages other than English.
PAGE 10
Survey DesignThe content of the survey was determined by an extensive literature review and consultation with the Diabetes MILES – Australia Reference Group (see Appendix I). Validated scales and items were selected carefully for inclusion. Where an appropriate measure did not exist or was not available, the research team developed items unique to the Diabetes MILES – Australia 2011 survey.
Three different versions of the survey were developed for different sub-samples of people with diabetes:
1. for people with type 1 diabetes (T1)
2. for people with type 2 diabetes who do not use insulin (T2)
3. for people with type 2 diabetes who treat their diabetes with insulin (T2I).
Each version included the same set of core items (questions), but also comprised additional items specific to the diabetes type and treatment regimen. Further, items relevant to all groups but deemed to be of secondary importance were distributed evenly across alternate forms (‘A’ and ‘B’) of each of the three survey versions. As such, there were six different versions of the survey. So, all ‘A’ survey forms contained the same secondary items, and likewise for all ‘B’ forms. This helped to reduce the response burden for those who took part. The number of ‘A’ and ‘B’ versions were equivalent within each diabetes type and treatment regimen survey versions.
All versions of the survey were piloted with 20 adults living in the state of Victoria with type 1 or type 2 diabetes, resulting in some minor amendments to the survey instrument.
A list of all variables included in the final survey can be found in Appendix II, and information about the scales included in this report can be found in Appendix III.
The survey was available in English only, however a form was included (with the postal surveys only) upon which respondents could indicate their preferred language and register their interest for future research participation. Languages included were Arabic, Cantonese, Greek, Italian, Macedonian, Mandarin, Spanish, Turkish, and Vietnamese.
Postal SurveyA sample of 15,000 adults with type 1 or type 2 diabetes were selected randomly from the NDSS register to receive the Diabetes MILES – Australia survey by post. Only those who had previously indicated their willingness to be contacted about research opportunities, and who met the study eligibility criteria according to their NDSS record were selected. The sample itself was stratified to maximise sample sizes for certain subgroups. Of those sampled, 6,000 (40%) had type 1 diabetes; the remaining 60% had
type 2 diabetes, split equally between insulin-treated and non-insulin treated.
During the first week of July 2011, the 15,000 randomly selected registrants received a Diabetes MILES survey package by post, which included: A Diabetes MILES – Australia 2011 survey booklet A plain language description of the study A form to indicate preferred language (if language other
than English) A reply-paid envelope
Online SurveyThe Diabetes MILES – Australia 2011 survey was also made available online at www.diabetesMILES.org for six weeks from 1st July 2011. The online survey was open to any Australian who met the eligibility criteria. It was advertised nationally in diabetes-related publications, on websites, and in diabetes clinics. NDSS registrants who received a postal survey were also informed that they could complete the survey online if preferred.
Those who completed the online survey were first invited to read an electronic plain language description of the study and indicate their consent. They then completed preliminary questions so that the survey could be presented tailored to their treatment regimen. Versions A and B were alternated. If responses to the preliminary questions indicated that the participant was not eligible to take part in Diabetes MILES – Australia, the survey was terminated.
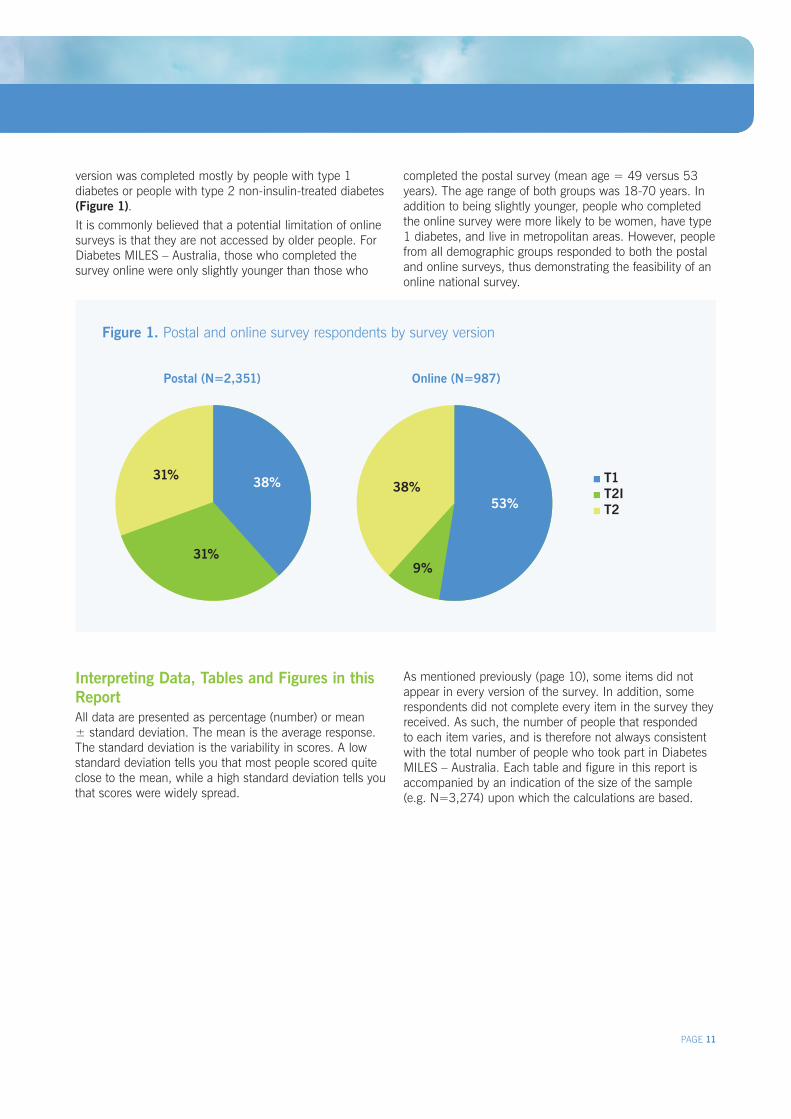
Study SampleIn total, 3,833 people responded to the Diabetes MILES – Australia 2011 survey. However, 495 (13%) respondents did not meet the eligibility criteria and were excluded from the analysis. Subsequent analyses presented in this report refer to the final sample of 3,338 respondents. The number of postal respondents to each survey version was approximately proportionate to the number of surveys distributed (Figure 1). For example, 40% of postal surveys were distributed to people with type 1 diabetes, and 38% of respondents had type 1 diabetes. The online survey
3,338 eligible Australian adults took part in the Diabetes MILES – Australia 2011 Survey. Of these: 2,351 completed the postal survey (70%)
987 completed the online survey (30%)
Method
PAGE 11
Figure 1. Postal and online survey respondents by survey version
Interpreting Data, Tables and Figures in this ReportAll data are presented as percentage (number) or mean ± standard deviation. The mean is the average response. The standard deviation is the variability in scores. A low standard deviation tells you that most people scored quite close to the mean, while a high standard deviation tells you that scores were widely spread.
version was completed mostly by people with type 1 diabetes or people with type 2 non-insulin-treated diabetes (Figure 1).It is commonly believed that a potential limitation of online surveys is that they are not accessed by older people. For Diabetes MILES – Australia, those who completed the survey online were only slightly younger than those who
Method
Postal (N=2,351) Online (N=987)
completed the postal survey (mean age = 49 versus 53 years). The age range of both groups was 18-70 years. In addition to being slightly younger, people who completed the online survey were more likely to be women, have type 1 diabetes, and live in metropolitan areas. However, people from all demographic groups responded to both the postal and online surveys, thus demonstrating the feasibility of an online national survey.
As mentioned previously (page 10), some items did not appear in every version of the survey. In addition, some respondents did not complete every item in the survey they received. As such, the number of people that responded to each item varies, and is therefore not always consistent with the total number of people who took part in Diabetes MILES – Australia. Each table and figure in this report is accompanied by an indication of the size of the sample (e.g. N=3,274) upon which the calculations are based.
31%
31%
38% 38%53%
9%
T1 T2I T2

PAGE 12
Figure 2. Age (years) by diabetes type (N=3,321) Type 1 Type 2
Diabetes TypeA total of 59% (n=1,962) of the sample had type 2 diabetes; the remaining 41% (n=1,376) had type 1 diabetes. Of those who had type 2 diabetes, 37% (n=722) indicated they managed their diabetes using insulin.
GenderBoth men and women were well represented in the Diabetes MILES – Australia sample. Women with type 1 diabetes were more likely to participate than men with type 1 diabetes, the reverse was true for respondents with type 2 insulin-treated diabetes (46% women; n=331 and 54% men; n=383). However, gender differences were not substantial for the group with type 2 non-insulin-treated diabetes (51% women; n=611 and 49% men; n = 593), or for the type 2 sample as a whole (Table 1).
Table 1. Diabetes type by gender (N=3,303)
AgeAs expected, respondents with type 1 diabetes were, on average, younger (mean=42.0 ± 14.0 years) than those with type 2 diabetes (mean=58.5 ± 8.7 years). People with type 2 insulin-treated and type 2 non-insulin-treated diabetes were of comparable ages (mean ages = 58.7 ± 8.5 and 58.3 ± 8.8 years respectively). Respondents
with type 1 diabetes were more evenly distributed across the age groups than those with type 2 diabetes (Figure 2). However, 4% (n=70) of respondents with type 2 diabetes were less than 40 years of age (and even as young as 19 years of age) while 6% (n=89) of respondents with type 1 diabetes were 65 years or older.
Age of Diagnosis On average, respondents with type 1 diabetes were diagnosed with the condition at 26 ± 15 years of age (range = 9 months to 68 years). Respondents with type 2 diabetes were diagnosed with the condition much later in life than respondents with type 1 diabetes (mean = 49.0 ± 10.0 years, range= 12 to 70 years). Respondents with type 2 insulin-treated diabetes were diagnosed with the condition at a younger age (mean = 46.0 ± 9.5, range = 12 to 68) than those with type 2 non-insulin-treated diabetes (mean = 51.4 ± 9.5, range = 13 to 70 years). A total of 13% (n=263) of respondents were diagnosed with type 2 diabetes under the age 40.
Diabetes DurationOn average, and as expected, respondents with type 1 diabetes reported a longer diabetes duration (mean= 15.2 ± 12.8 years, range = 0 to 63 years) than respondents with type 2 diabetes (mean=9.0 ± 7.1 years, range = 0 to 45 years). On average, respondents with type 2 insulin-treated diabetes have had the condition for almost twice as long (mean = 12.7 ± 7.5) as those with type 2 non-insulin-treated diabetes (mean = 6.9 ± 5.8). A total of 4% respondents (n=127) were newly diagnosed (diagnosed less than one year ago) with type 1 or type 2 diabetes.
Demographics
Gender Type 1 N (%) Type 2 N (%)
Women 825 (61) 953 (49)
Men 537 (39) 988 (51)
Total 1,362 1,941
%
50
40
30
20
10
0
18-24 25-34 35-44 45-54 55-64 65-70

PAGE 13
Figure 3. Respondents by area (N=3,281)
Demographics
Locality of RespondentsPeople from all states and territories took part in Diabetes MILES – Australia. More than half (58%; n=1,915) of respondents were from New South Wales or Victoria (Table 2). By comparison, 59% of NDSS registrants live in New South Wales and Victoria, indicating that the study sample was representative nationally3.
Table 2. Number of respondents by state (N=3,296)
Just over half of all respondents were from metropolitan areas of Australia (Figure 3). While people with type 1 and type 2 diabetes were relatively evenly split within the metro (48% versus 52%) and regional samples (41% versus 59%), respondents who resided in rural areas were more likely to have type 2 diabetes (71%) than type 1 diabetes (29%).
Employment and Qualifications A total of 54% (n=1,746) of respondents were occupied in paid work, while a further 39% (n=1,247) indicated that they were retired, studying full time or a homemaker/carer or volunteer. A total of 81% (n=2,548) of respondents had completed high school and 30% (n=934) of respondents had completed a university degree.
Marital statusMost respondents reported being married or in a defacto relationship; 66% (n=895) of respondents with type 1 diabetes and 72% (n=1,375) of respondents with type 2 diabetes. Respondents with type 2 diabetes were more likley to be married/in a defacto relationship, or separated, divorced, or widowed than respondents with type 1 diabetes, which may be explained by their older age. A total of 14% (n=450) of all respondents were single at the time of survey completion.
IncomeRespondents were asked about their gross annual household income: 19% (n=596) indicated their income was $20,000 or
less. 59% (n=1839) indicated their income was between
$20,001 and $100,000. 23% (n=707) indicated their income was over $100,000.
Cultural BackgroundA quarter (25%; n=841) of respondents indicated that they were born in a country other than Australia. Most respondents spoke English as their primary language. However, 3% (n=98) indicated that they mainly spoke a language other than English at home: 49 different languages were reported Other than English, Chinese dialects were the most
common languages spoken at home
A small minority (2%; n=49) of respondents reported being of Aboriginal and/or Torres Strait Islander descent.
Membership A total of 79% (n=2,619) of respondents reported being a member of their local state or territory diabetes member organisation (e.g. Australian Diabetes Council, Diabetes Australia – Vic), a figure that is higher than actual membership numbers. This over-estimation may be due to respondents mistaking membership with NDSS registration, or it may be a function of self-selection, with those who are members of state-based organisations being more likely to participate in research.
3 Figures from NDSS database, accurate as of 30 June 11
State Type 1 Type 2 Total %
VIC 497 646 35
NSW 295 477 23
QLD 266 327 18
WA 137 199 10
SA 68 135 6
TAS 30 64 3
NT 19 66 3
ACT 39 28 2
Total 1,351 1,942 100
20%
28%
52%
Metro Regional Rural

“[The study is] not trying to understand [diabetes] from a medical point of view but from a psychological point of view…because depression and diabetes…are best of friends” Feedback from a Diabetes MILES – Australia participant
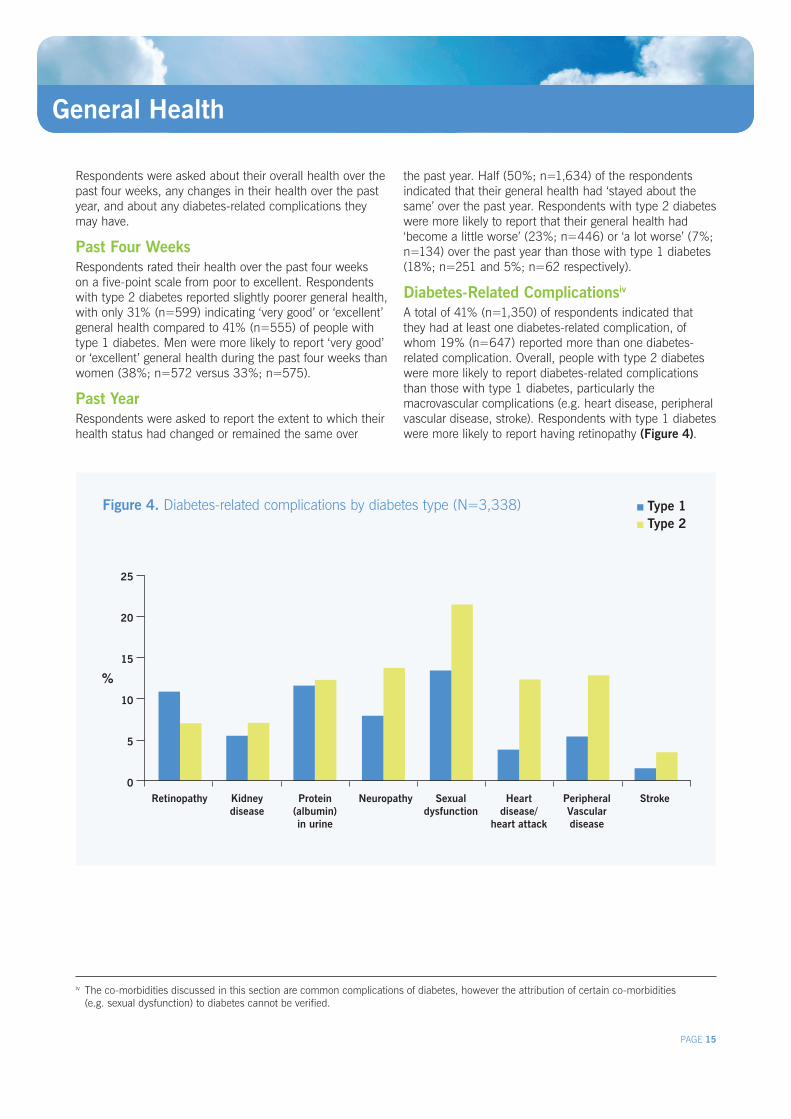
Figure 4. Diabetes-related complications by diabetes type (N=3,338)
PAGE 15
Respondents were asked about their overall health over the past four weeks, any changes in their health over the past year, and about any diabetes-related complications they may have.
Past Four WeeksRespondents rated their health over the past four weeks on a five-point scale from poor to excellent. Respondents with type 2 diabetes reported slightly poorer general health, with only 31% (n=599) indicating ‘very good’ or ‘excellent’ general health compared to 41% (n=555) of people with type 1 diabetes. Men were more likely to report ‘very good’ or ‘excellent’ general health during the past four weeks than women (38%; n=572 versus 33%; n=575).
Past YearRespondents were asked to report the extent to which their health status had changed or remained the same over
the past year. Half (50%; n=1,634) of the respondents indicated that their general health had ‘stayed about the same’ over the past year. Respondents with type 2 diabetes were more likely to report that their general health had ‘become a little worse’ (23%; n=446) or ‘a lot worse’ (7%; n=134) over the past year than those with type 1 diabetes (18%; n=251 and 5%; n=62 respectively).
Diabetes-Related Complicationsiv A total of 41% (n=1,350) of respondents indicated that they had at least one diabetes-related complication, of whom 19% (n=647) reported more than one diabetes-related complication. Overall, people with type 2 diabetes were more likely to report diabetes-related complications than those with type 1 diabetes, particularly the macrovascular complications (e.g. heart disease, peripheral vascular disease, stroke). Respondents with type 1 diabetes were more likely to report having retinopathy (Figure 4).
General Health
iv The co-morbidities discussed in this section are common complications of diabetes, however the attribution of certain co-morbidities (e.g. sexual dysfunction) to diabetes cannot be verified.
%
25
20
15
10
5
0 Retinopathy Kidney
diseaseProtein
(albumin) in urine
Neuropathy Sexualdysfunction
Heart disease/
heart attack
Peripheral Vascular disease
Stroke
Type 1 Type 2
PAGE 16
Diabetes Self-Care and Management
Respondents answered a number of questions about their diabetes treatment, their self-care activities, their diabetes outcomes, and how they feel about managing their diabetes. Many of these questions were sourced from a new measure, the Diabetes Self-Care Inventory-Revised (DSCI-R).
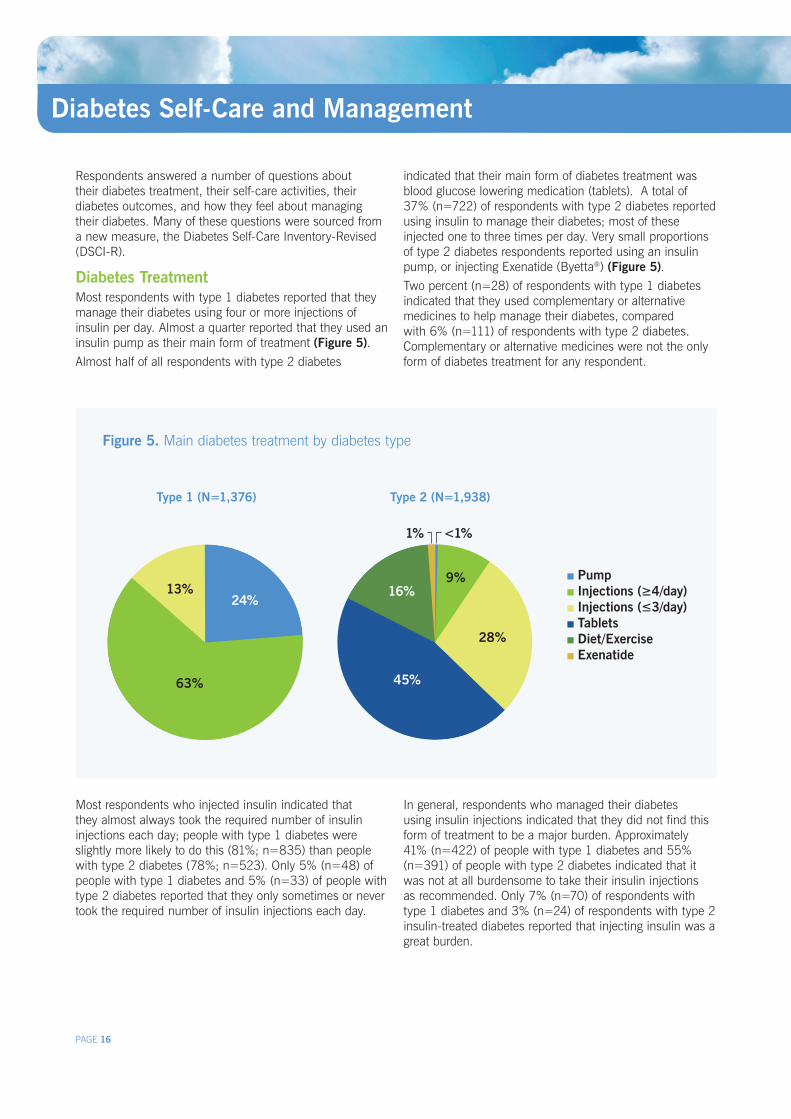
Diabetes TreatmentMost respondents with type 1 diabetes reported that they manage their diabetes using four or more injections of insulin per day. Almost a quarter reported that they used an insulin pump as their main form of treatment (Figure 5). Almost half of all respondents with type 2 diabetes
indicated that their main form of diabetes treatment was blood glucose lowering medication (tablets). A total of 37% (n=722) of respondents with type 2 diabetes reported using insulin to manage their diabetes; most of these injected one to three times per day. Very small proportions of type 2 diabetes respondents reported using an insulin pump, or injecting Exenatide (Byetta®) (Figure 5). Two percent (n=28) of respondents with type 1 diabetes indicated that they used complementary or alternative medicines to help manage their diabetes, compared with 6% (n=111) of respondents with type 2 diabetes. Complementary or alternative medicines were not the only form of diabetes treatment for any respondent.
Most respondents who injected insulin indicated that they almost always took the required number of insulin injections each day; people with type 1 diabetes were slightly more likely to do this (81%; n=835) than people with type 2 diabetes (78%; n=523). Only 5% (n=48) of people with type 1 diabetes and 5% (n=33) of people with type 2 diabetes reported that they only sometimes or never took the required number of insulin injections each day.
In general, respondents who managed their diabetes using insulin injections indicated that they did not find this form of treatment to be a major burden. Approximately 41% (n=422) of people with type 1 diabetes and 55% (n=391) of people with type 2 diabetes indicated that it was not at all burdensome to take their insulin injections as recommended. Only 7% (n=70) of respondents with type 1 diabetes and 3% (n=24) of respondents with type 2 insulin-treated diabetes reported that injecting insulin was a great burden.
Figure 5. Main diabetes treatment by diabetes type
Type 1 (N=1,376) Type 2 (N=1,938)
Pump Injections (≥4/day) Injections (≤3/day) Tablets Diet/Exercise Exenatide
13%
63%
24%
45%
28%
9%16%
<1%1%

PAGE 17
Diabetes Self-Care and Management
Healthy Eating and Physical ActivityMore than half of all respondents indicated that they predominantly ate a healthy diet, with 56% (n=662) of people with type 1 diabetes and 50% (n=933) of people with type 2 diabetes indicating that they often or always followed a healthy diet. However, 19% (n=226) of people with type 1 diabetes and 21% (n=399) of people with type 2 diabetes reported that they only sometimes or never followed a healthy diet. Eating a healthy diet was reported as a great burden for 9% (n=110) and 8% (n=152) of respondents with type 1 and type 2 diabetes respectively.
People with type 1 diabetes were more likely to engage in recommended levels of physical activity (at least 30 minutes, five times a week) often or always than those with type 2 diabetes (35%; n=474 versus 28%; n=547). However, approximately two thirds of the overall sample did not meet the recommendations for physical activity levels. Engaging in regular physical activity was a great burden, according to 10% (n=139) and 14% (n=260) of respondents with type 1 and type 2 diabetes respectively.
HbA1c and Blood Glucose Monitoring Respondents were asked to recall their most recent HbA1c valuev (Table 3). Note, however, that these data are self-reported. It was not possible to validate them against clinical records. The mean HbA1c indicates that many respondents have average blood glucose levels within or slightly above the recommended target levels4. Despite some high HbA1c levels reported, only a small proportion of respondents (6%; n=200) reported levels above 10%. However, 32% (n=1,062) of respondents indicated that they did not know what their most recent HbA1c value was. Almost half (49%; n=519) of these were type 2 non-insulin-treated respondents.
Table 3. HbA1c (%) descriptive statistics (N=3,016)
Respondents were asked to indicate on a seven-point scale how satisfied they were with their blood glucose control (0 = very dissatisfied, 6 = very satisfied). People with type 2 diabetes (mean=3.9 ± 1.7) had higher mean satisfaction scores than those with type 1 diabetes (mean=3.4 ± 1.6).
Almost everyone indicated that they owned a blood glucose meter; 99% (n=1,344) and 97% (n=1,881) of type 1 and type 2 respondents respectively.
The number of blood glucose checks that respondents performed each day varied by diabetes type. Almost half of all people with type 1 diabetes (42%; n=573) indicated that they checked their blood glucose levels five or more times on an average day, whereas most type 2 respondents (59%; n=1,144) reported performing only one or two checks per day. People who monitored blood glucose levels more frequently during the day tended to perceive that blood glucose monitoring was a greater burden than those who monitored less frequently.
Over the past two weeks, 70% (n=2,324) of respondents had recorded their blood glucose readings. Respondents with type 2 diabetes were more likely to have recorded their readings than those with type 1 diabetes (75%; n=1,451, 64%; n=873 respectively).
Blood glucose readings can be recorded in different ways. For example, 30% (n=402) of respondents with type 1 and 13% (n=249) of those with type 2 indicated that they upload their readings to a computer, the internet, or a smart phone application. However, few people reported doing this ‘all the time’ (type 1: 8%; n=103 and type 2: 5%; n=88).
Hypoglycaemic EpisodesA sub-sample of respondents with type 1 diabetes were asked about their experiences of hypoglycaemic episodes, or ‘hypos’ (low blood glucose). Most respondents (75%; n=513) indicated that they had experienced at least one hypo (mild or severe, day or night) in the past week, and 17% (n=114) had experienced four or more hypos in the past week. Severe hypos had been experienced by 20% (n=130) of the sample in the past six months. Awareness of hypos was assessed using the single-item Gold score5, which asks respondents to rate on a seven-point scale the extent to which they know when their hypos are commencing (1 = always aware, 7 = never aware). A total of 22% (n=152) of respondents had impaired hypo awareness, as indicated by a score of four or more on this scale.
Diabetes Type Mean ± SD Min Max
Type 1 7.8 ± 1.6 4.5 20.1
Type 2 (insulin) 7.9 ± 1.9 4.5 25.0
Type 2 (non-insulin) 6.9 ± 1.4 4.5 20.0
v Average blood glucose over the past 6-8 weeks

PAGE 18
Figure 6. Health care professionals accessed in past 12 months by diabetes type (N=3,338)
Access to Health Care
Respondents were asked about what services they have accessed for their diabetes care, who they consult for their diabetes care, and their thoughts about the care they receive.
Structured Diabetes EducationInternational guidelines recommend that people with diabetes be offered ‘structured diabetes education’, which involves a set program or curriculum with activities to increase knowledge and skills about diabetes and its management. Half of the study sample were asked questions about structured diabetes education.
A total of 49% (n=846) of the respondents indicated that they had never been offered structured diabetes education. For those who had been offered structured diabetes education, this was most likely to occur at diagnosis or soon after.
Respondents who had not attended a structured diabetes education program were asked what their main reasons were for this. The most commonly cited reason for not attending structured education was that it had not been offered to them. Respondents living in rural or regional areas of Australia were more likely to indicate that distance and access to diabetes educators was a reason for not attending a structured education program than those living in metro areas.
Sources of Health CareRespondents indicated which health care professionals (HCPs) they had accessed in the past 12 months in relation to their diabetes care. A family doctor or general practitioner (GP) was most commonly accessed (86%; n=2,877).
Respondents with type 1 diabetes accessed GPs and endocrinologists in almost equal numbers in the past 12 months (Figure 6). More respondents with type 2 diabetes had visited an eye specialist (optometrist or ophthalmologist) than an endocrinologist.
A total of 10% (n=141) of respondents with type 1 diabetes and 4% (n=71) of those with type 2 diabetes reported having received care for their diabetes in a hospital emergency department in the past 12 months.
Overall, respondents indicated that health care professionals were easily accessible. However, access to a psychologist, to after-hours medical care and to a GP who bulk bills were rated poorly by 12% (n=352), 16% (n=527) and 22% (n=730) of respondents respectively. Access to a psychologist and medical care after-hours were particularly pertinent problems for respondents living in rural areas (18%; n=102, 22%; n=140 respectively).
Endocrinologist GP Diabetes educator
Dietitian/ nutritionist
Eye specialist Podiatrist
100
90
80
70
60
50
40
30
20
10
0
Type 1 Type 2
%

PAGE 19
Access to Health Care
Respondents were asked how often they visit a podiatrist, receive retinopathy screening, and have their HbA1c checked.
Visits to podiatrist: 27% (n=845) of respondents reported visiting a
podiatrist at least every six months. 53% (n=1647) of respondents see a podiatrist ‘about
every two years’ or even ‘less frequently’. Those with type 2 diabetes were more likely to visit
a podiatrist once a year or more (55%; n=988) than those with type 1 diabetes (36%; n=473).
Retinopathy screening: 61% (n=1,948) of respondents get screened for
retinopathy at least once a year. 10% (n=322) are screened less than every two years.
HbA1c checks:
• 85%(n=2,755)ofrespondentshavetheirHbA1cchecked every 6 months or more frequently.
• 4%(n=125)havetheirHbA1ccheckedevery2yearsor less often
Main Health Care Professional Respondents were asked which HCP they considered to be their main diabetes HCP, defined as which provider they relied on most. Overall, most respondents indicated that their main HCP was either a GP or an endocrinologist. People with type 1 diabetes were more likely to report they relied most on their endocrinologist, while those with type 2 diabetes were more likely to rely on their GP for diabetes care (Figure 7). Respondents with type 1 diabetes were twice as likely as those with type 2 diabetes to report that their diabetes educator was their main HCP.
Continuity and Consistency of CareA total of 75% (n=2,456) of respondents indicated that they always saw the same individual HCP at each appointment. Over two thirds (71%; n=2,281) of respondents indicated that the advice received from one HCP is consistent with ‘very much’ or ‘a lot’ of the advice received from other HCPs. These results indicate high levels of continuity and consistency of care provided to adults with diabetes.
Barriers to Health CareDistance was considered a barrier to accessing HCPs by 15% (n= 258), 19% (n=174) and 34% (n=215) of respondents living in metro, regional and rural areas of Australia respectively. Cost was considered a barrier by
51% (n=2,691) of all respondents. Respondents with type 1 diabetes were slightly more likely to indicate that cost was ‘very much’ an obstacle to their diabetes care (12%; n=156) than those with type 2 diabetes (7%; n=133).
Technology in Health CareRespondents were asked the extent to which they would like to receive information or advice from their HCPs through the use of technology, rather than or in addition to a face-to-face consultation. Approximately 15% (n=471) of people indicated that they would ‘very much’ like to receive information or advice via email, and 11% (n=372) indicated they would ‘very much’ like to try new technologies such as video consultation.
Figure 7. Main health care professional by diabetes type
Type 1 (N=1,310) Type 2 (N=1,804)
29%
12%
6%
1%
52%
Endocrinologist GP Diabetes educator Dietitian/nutritionist Other
72%
13%6%
6%
3%

“Usually no-one asks those questions… they ask how you’re going but they don’t ask you how you feel about how you’re going and I think…it’s about time”Feedback from a Diabetes MILES – Australia participant

PAGE 21
Psychological and Emotional Well-being
Respondents completed a number of scales that assessed general psychological and emotional well-being.
Subjective Well-beingSubjective well-being (how satisfied a person is with his or her life) was measured using the Personal Wellbeing Index (PWI)6. The PWI asks about a person’s satisfaction with seven life domains such as health, standard of living, and personal relationships.
Satisfaction on each life domain is rated on a scale of 0
to 10, which is then standardised to a score out of 100. Higher scores indicate higher levels of satisfaction.
Regardless of type of diabetes, respondents indicated the lowest levels of satisfaction with their health, as compared to other domains. Scores on this domain were substantially lower than the Australian norms7. People with type 2 insulin-treated diabetes reported the lowest levels of satisfaction across all life domains compared to people with type 1 diabetes or type 2 non-insulin-treated diabetes (Figure 8).
Figure 8. Mean score on well-being domains by diabetes type (N range=3,283 - 3,311)
Type 1 Type 2 (insulin) Type 2 (non-insulin)
100
90
80
70
60
50
40
30
20
10
Mea
n sc
ore
Standard of living
Health Achieving in life
Relationships Safety Part of community
Future security

PAGE 22
Psychological and Emotional Well-being (continued)
DepressionDepressive symptoms were measured using the nine-item Patient Health Questionnaire (PHQ-9)8. Respondents rated the frequency with which they had experienced symptoms of depression over the past two weeks on a scale of 0 (not at all) to 3 (nearly every day), and item scores were summed to form a total score (0 to 27). Severity of depressive symptoms was assessed using the cut-off scores of 5, 10, 15, and 20 representing mild, moderate, moderately severe and severe depression respectively.
The severity of depression experienced by respondents varied by diabetes type (Figure 9). Moderate to severe depressive symptoms were experienced by 22% (n=297) of respondents with type 1 diabetes and 23% (n=283) of respondents with type 2 non-insulin-treated diabetes, but the highest proportion was seen in the type 2 insulin-treated
group, with 35% (n=255) indicating they had moderate to severe depressive symptoms.
Only 13% (n=423) of respondents self-reported (i.e. not assessed through the PHQ-9) that they currently had depression, and that they had received a diagnosis for this condition. This suggests that a substantial proportion of respondents may have undiagnosed depression.
Consistent with international data from both the general population9 and people with diabetes10, women had higher depression scores than men (Figure 10). The gender gap was least pronounced in those with type 2 insulin-treated diabetes, who also had the highest mean depression scores.
Respondents from regional and rural areas were slightly more likely to experience moderate to severe depressive symptoms (27%; n=247 and 27%; n=172 respectively) than those living in metropolitan areas (24%; n=402).
Figure 9. Severity of depressive symptoms by diabetes type (N=3,305)
Figure 10. Mean depression score by diabetes type and gender (N=3,233)
Type 1 Type 2 (insulin) Type 2 (non-insulin)
%
None Mild Moderate Moderately severe
Severe
70
60
50
40
30
20
10
0
Mea
n P
HQ
-9 s
core
Men Women
Type 1 Type 2 (insulin) Type 2 (non-insulin)
8
7
6
5
4
3
2
1
0

PAGE 23
Psychological and Emotional Well-being (continued)
Figure 11. Severity of anxiety symptoms by diabetes type (N=3,269)
Figure 12. Mean anxiety score by diabetes type and gender (N=3,241)
AnxietyAnxiety symptoms were measured using the seven-item Generalised Anxiety Disorder scale (GAD-7)11. Respondents rated the frequency with which they had experienced symptoms of anxiety over the past two weeks on a scale of 0 (not at all) to 3 (nearly every day), and item scores were summed to form a total score (0 to 21). Severity of anxiety symptoms was assessed using the cut-off scores of 5, 10, and 15 representing mild, moderate, and severe anxiety respectively.
Severity of anxiety symptoms differed by diabetes type (Figure 11). Moderate to severe anxiety symptoms were experienced by comparable proportions of respondents with type 1 and type 2 non-insulin-treated diabetes (15%;
n=208 and 14%; n=168 respectively). Respondents with type 2 insulin-treated diabetes were more likely than other respondents to report problematic anxiety levels, with 19% (n=134) of this group indicating they experienced moderate to severe anxiety symptoms.
As with depression, women had higher anxiety scores, regardless of diabetes type, and respondents with type 2 insulin-treated diabetes had highest overall mean anxiety scores (Figure 12).Respondents from regional and rural areas were marginally more likely to report experiencing moderate to severe anxiety symptoms (17%; n=158 and 17%; n=107 respectively) than respondents living in metro areas (14%; n=238).
Type 1 Type 2 (insulin) Type 2 (non-insulin)
%
None Mild Moderate Severe
70
60
50
40
30
20
10
0
Mea
n sc
ore
Type 1 Type 2 (insulin) Type 2 (non-insulin)
8
7
6
5
4
3
2
1
0
Men Women

PAGE 24
“The questions, I found, were quite probing which was good… they scratched beneath the surface”Feedback from a Diabetes MILES – Australia participant

PAGE 25
Diabetes-Specific Quality of Life
Diabetes-Related Distress
The impact of diabetes on quality of life was assessed using a new measure, the Quality of Life Questionnaire (QoL-Q Diabetes)12. The QoL-Q asks respondents to rate the extent to which their diabetes affects their life across 26 domains (e.g. ‘work’, ‘family’, ‘leisure’).
For people with type 1 diabetes, ‘feeling in control of one’s body’ was the aspect of life most impaired by diabetes, closely followed by ‘dietary freedom’. ‘Dietary freedom’ was the aspect of life most impaired for people with type 2 diabetes, closely followed by ‘feeling well’. Dietary freedom has been found to be the most impaired aspect of life, regardless of diabetes type, in other international studies3.
Diabetes-related distress, defined as distress resulting from diabetes and its management, was measured using the Problem Areas In Diabetes (PAID) scale13, which was included in half of all distributed surveys. The PAID scale includes 20 items, each of which addresses a different concern or issue for the person with diabetes. Respondents indicated the extent to which each of these potential concerns is a problem for them on a scale of 0 (not a problem) to 4 (serious problem). Item scores were summed, and standardised to a score out of 100, with higher scores indicating greater diabetes-related distress.
Consistent with international findings14, 15, people with type 1 diabetes reported higher levels of diabetes-related distress (mean=28.53 ± 21.81) than those with type 2 diabetes (mean=22.30 ± 20.76), with those not using insulin reporting the lowest distress scores.
There were some notable differences between diabetes types: The ability to be ‘spontaneous’ in life was more
impaired for respondents with type 1 than for those with type 2 diabetes.
‘Sexual activity’ was more impaired for respondents with type 2 diabetes, reflecting the higher prevalence of sexual dysfunction in this group (page 15).
Other key findings include: A total of 28% (n=188) of respondents with type 1
diabetes indicated they experienced severe distress (score≥40),comparedwith22%(n=77)oftype2insulin-treated respondents and 17% (n=99) of type 2 non-insulin-treated respondents
Age, but not diabetes duration, was negatively associated with diabetes-related distress, meaning that older respondents tended to report lower levels of distress compared to younger respondents
Respondents from rural areas were slightly more likely to experience severe distress (24%; n=79) than those from metro (22%; n=180) or regional areas (22%; n=102).
Worrying about the future and the development of diabetes-related complications was the top problem area for respondents, across diabetes types and treatment regimens. This is consistent with findings from international studies14, 15.
The top five problem areas for respondents were:
1. Worrying about the future and the possibility of serious complications
2. Experiencing feelings of guilt and anxiety when diabetes management goes off track
3. Not knowing if mood/feelings are related to diabetes
4. Feeling constantly concerned about food and eating
5. Worrying about low blood sugar reactions

PAGE 26
Figure 13. Support and information from health care professionals in the last 3 months
Support from Health Care ProfessionalsApproximately half of the study sample were asked about their experiences with, and support provided by, their diabetes health care team. This was measured using the seven-item Resources and Supports for Self Management Short Form (RSSM-SF) scale16. A diabetes health care team is defined as all the health care professionals who help to take care of the respondent’s diabetes, e.g. doctors, educators, dieticians. For this purpose, it does not include family or friends.
Almost half the respondents reported never being asked what they believe is important in their diabetes management (Figure 13a); people with type 1 diabetes were slightly less likely than those with type 2 to indicate that their diabetes care team usually or always ask what is important to them. Conversely, about half the respondents indicated that they usually or always receive the information they need from their diabetes care team (Figure 13b); respondents with type 2 diabetes were less likely than those with type 1 to report receiving adequate information.
Support
a. How often did someone on your diabetes care team ask about what’s important to you when helping you manage your diabetes? (N=1,655)
b. How often did you get the information you needed from your diabetes care team? (N=1,645)
Support from Family The Diabetes Family Support and Conflict (DFSC) scale17 was used to measure the extent to which respondents experienced support or conflict related to their diabetes within their families. The scale includes 10 items which address various aspects of diabetes management (including ‘taking medications’, ‘eating well’ and ‘exercising regularly’). For each item, respondents were asked to indicate the extent to which their family is supportive or is in conflict. Each item is scored on a 1 (never) to 5 (always) scale. Higher mean scores indicate greater levels of family support or conflict. The items are combined to form two subscales: family support (6 items) and family conflict (4 items).
Overall, respondents reported relatively high levels of support (mean=3.82 ± 0.95) and low levels of conflict (mean=1.99 ± 0.85) regardless of diabetes type.
On average, the youngest (aged 18 to 24 years) and the oldest (aged 65 to 70 years) respondents reported experiencing higher levels of support than other age groups (mean=4.07 ± 0.75 and 4.07 ± 0.92 respectively). Mean conflict scores were noticeably higher for respondents aged 18 to 24 years (mean=2.40 ± 1.00) than for all other age groups.
25%
30%
45%
Never Rarely or sometimes Usually or Always25%
51%
24%

PAGE 27
Figure 14. Number of people you can talk to about your diabetes (N=1,523)
Support
Social Support Respondents were asked a number of questions about the support they receive (from friends, family and support groups) in dealing with their diabetes.
The vast majority of respondents (96%; n=459) reported having at least one person that they could talk to about their diabetes (Figure 14). People with type 1 diabetes and type 2 insulin-treated diabetes were slightly more likely than other respondents to report that they did not discuss their diabetes with anyone.
On the whole, respondents were satisfied with the support they received from family and friends for their diabetes. Approximately 36% (n=574) indicated they were extremely satisfied, and only 5% (n=79) indicated that they were not at all satisfied.
Overall, 6% (n=86) of respondents reported involvement in a local diabetes support group. Those with type 1 diabetes were more likely to be involved (8%; n=51) than those with type 2 diabetes (4%; n=35). Regardless of diabetes type, women were more likely to be involved in a support group than men.
In contrast, 32% (n=455) of respondents reported that they would like to be involved in a support group (Figure 15). The proportion of women interested in joining a support group was equivalent for those with type 1 or type 2 diabetes.
Figure 15. Support group participation and interest in participation by gender and diabetes type (N=1,398)
Participation Interest
50%
4%
7%
39%
No one 1 person 2-5 people 6+
Type 1 Type 2
Men Women
40
30
20
10
0
%
Men Women
40
30
20
10
0
%

PAGE 28
Beliefs About Diabetes
People’s beliefs about their diabetes can influence how they manage their diabetes and their outcomes. Beliefs were assessed using the nine-item Brief Illness Perceptions Questionnaire (BIPQ)18. This measure comprises eight items (reported here) designed to assess perceptions of various aspects of diabetes (e.g. ‘perceived control’, ‘emotional impact’). The final item (not reported here) invites free-text responses about what respondents believe caused their condition.
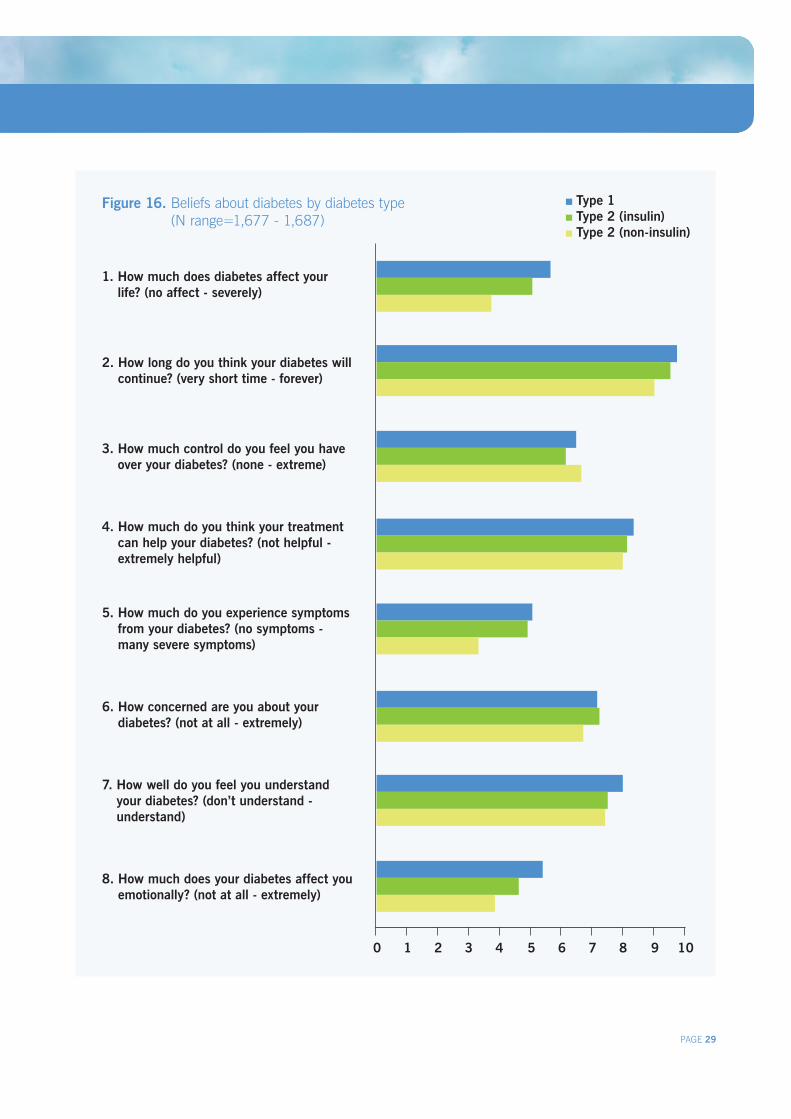
Consequences and Timeline of DiabetesRespondents with type 1 diabetes reported their lives to be affected more severely by diabetes than did those with type 2 diabetes (Figure 16; item 1). Those with type 2 insulin-treated diabetes reported their lives to be affected to a greater degree than those not using insulin.
The same pattern was evident for the ‘emotional impact’ of diabetes (item 8), consistent with data from other diabetes-specific scales used in Diabetes MILES – Australia (e.g. the PAID scale, page 25).
Respondents, across diabetes types and treatments, generally perceived their diabetes to be life-long (item 2).
Personal Control and TreatmentRespondents with type 1 and type 2 non-insulin-treated diabetes had comparable perceptions of the level of personal control they had over their diabetes (item 3). However, people with type 2 insulin-treated diabetes perceived lower levels of personal control over their diabetes.
Respondents with type 2 non-insulin-treated diabetes perceived their diabetes treatment to be less effective than those who used insulin, although the mean difference was small (item 4).
Symptoms and ConcernsRespondents with type 1 and type 2 insulin-treated diabetes reported experiencing more symptoms than those with type 2 non-insulin-treated diabetes (item 5), perhaps as a result of the greater number of hypoglycaemic episodes experienced (page 17). It was on this construct that perceptions differed most between those who do and do not use insulin to manage their diabetes.
All respondents rated their level of concern about their diabetes as relatively high (item 6). Consistent with the patterns on other items, type 1 and type 2 insulin-treated respondents reported higher levels of concern about their diabetes than people with type 2 non-insulin-treated diabetes.
Understanding of DiabetesRespondents with type 1 diabetes believed they understood their condition more so than did those with type 2 diabetes (item 7). This may be the result of people with type 1 diabetes generally having a longer diabetes duration, and may also reflect a tendency for people with type 1 diabetes to access education and services more so than those with type 2 diabetes.
PAGE 29
Figure 16. Beliefs about diabetes by diabetes type (N range=1,677 - 1,687)
0 1 2 3 4 5 6 7 8 9 10
1. How much does diabetes affect your life? (no affect - severely)
3. How much control do you feel you have over your diabetes? (none - extreme)
6. How concerned are you about your diabetes? (not at all - extremely)
2. How long do you think your diabetes will continue? (very short time - forever)
4. How much do you think your treatment can help your diabetes? (not helpful - extremely helpful)
7. How well do you feel you understand your diabetes? (don’t understand - understand)
5. How much do you experience symptoms from your diabetes? (no symptoms - many severe symptoms)
8. How much does your diabetes affect you emotionally? (not at all - extremely)
Type 1 Type 2 (insulin) Type 2 (non-insulin)
Beliefs About Diabetes

“It asked a lot of questions that are not asked frequently, in particular by the health professionals…”Feedback from a Diabetes MILES – Australia participant

Figure 17. NDSS services accessed in the past 12 months by diabetes type (N range=1,836 - 2,121)
Respondents were asked a number of questions about the extent to which they access National Diabetes Services Scheme (NDSS) products and services.
ProductsTable 4 displays the percentage of respondents with type 1 or type 2 diabetes accessing various NDSS subsidised products over the past year. As expected, blood glucose monitoring strips were the most commonly accessed product. Overall 90% (n=2,921) of respondents indicated that they had bought blood glucose monitoring strips through the NDSS in the past year. Note, the proportions of respondents accessing syringes, needles and pump consumables are not consistent with the proportions of respondents who indicated their primary treatment was insulin injections or insulin pump.
Table 4. Respondents who had accessed subsidised NDSS products in the past year (N=1,446 - 2,650)
PAGE 31
National Diabetes Services Scheme Access
ServicesA number of services are provided by the NDSS and administered by Diabetes Australia. The NDSS website and diabetes information factsheets were the most commonly accessed services. Small proportions of respondents reported accessing telephone/Infoline services (Figure 17). The NDSS website and advocacy services were the only resources utilised more by respondents with type 1 diabetes than type 2 diabetes. People with type 2 diabetes were more likely to access information factsheets, education programs and dietary advice from the NDSS than those with type 1 diabetes.
Approximately 5% (n=97) of respondents had accessed advocacy support/advice during the past year.
SatisfactionRespondents were asked to rate how satisfied they were with the products and services provided by the NDSS, using a scale from 0 (very dissatisfied) to 6 (very satisfied). Across all respondents, the mean satisfaction rating was 5.2 ± 1.2 indicating high levels of satisfaction with the products and services provided by the NDSS.
Respondents with type 2 insulin-treated diabetes who use insulin were more likely than other groups to indicate high levels of satisfaction, with almost 70% (n=481) of this group indicating that they are very satisfied with NDSS products and services. In contrast, only 47% (n=631) of people with type 1 diabetes indicated that they were very satisfied with the products and services provided by the NDSS.
Product Type 1 (%)
Type 2 (%)
Blood glucose monitoring strips 96 86
Syringes and needles 83 55
Insulin pump consumables 36 4
50
40
30
20
10
0
%
NDSS website Advocacy services/advice
Telephone infoline/advice
Diabetes education programs
Dietary services
Diabetes information factsheets/ booklets
Type 1 Type 2

PAGE 32
Discussion
More than 3,300 eligible Australians took part in Diabetes MILES – Australia 2011 Survey, a national survey of adults living with type 1 or type 2 diabetes. With a strong emphasis on self-management behaviours, psychological well-being, quality of life, health beliefs and identifying the unmet needs of people with diabetes, this national survey was unique in its focus, not on diabetes but on the person living with diabetes. The survey was conducted in both postal and online formats. People of both genders and diabetes types, and of all ages were represented in both the postal and online survey sub-samples, suggesting that both methods are viable for future studies in this population. Likewise, people from all states and territories, and from metro, regional and rural areas took part in the study. Just over half of all respondents were from New South Wales or Victoria, which reflects the proportions of NDSS registrants in these states. Thus, the sample can be considered to be representative nationally.
Throughout this report, it is evident that adults with type 1 and type 2 diabetes have different response profiles across many variables, and that the response profiles of people with type 2 diabetes differ according to treatment regimens. This highlights the distinctive impact that diabetes and its treatment has on the lives of respondents. It also highlights the different health concerns and unmet needs of each group and suggests that it is inappropriate to combine the responses of people with different types of diabetes or using substantively different treatment regimens.
Type 1 DiabetesRespondents with type 1 diabetes made up 41% of the Diabetes MILES – Australia sample, and 61% of these were women. It is evident from the Diabetes MILES – Australia data that, in many ways, adults with type 1 diabetes live successfully with the condition. They had lower rates of complications than those with type 2 diabetes (despite having lived with diabetes for longer, on average), they perceived their overall health as being better, and indicated engaging in self-care activities as recommended more frequently than respondents with type 2 diabetes. They felt they understood their condition more so than did those with type 2 diabetes.
However, this success may come at a cost. Measures of diabetes-specific well-being and treatment burden indicated that adults with type 1 diabetes fared worse than those with type 2 diabetes on these outcomes. Respondents with type 1 diabetes were more likely than those with type 2 diabetes to report experiencing severe diabetes-related distress. Their beliefs about their condition also indicated that diabetes affects their lives more severely, and they were more emotionally affected by their diabetes than
people with type 2 diabetes. People with type 1 diabetes reported experiencing more symptoms of the condition than those with type 2 diabetes, and also considered their treatment to be more burdensome.
These findings highlight the importance of attending not only to self-management behaviours and medical outcomes, but also to the well-being of people with diabetes. For people with type 1 diabetes, it is particularly important to give consideration to the concerns and distress caused by the condition and its treatment, evident in the results of diabetes-specific measures, which may be masked or under-estimated by general measures.
Type 2 DiabetesRespondents with type 2 diabetes made up 59% of the study sample, and 49% of these were women. Across many variables, the response profiles for respondents with type 2 insulin-treated diabetes differed substantially from those with type 2 non-insulin-treated diabetes. This suggests that people with type 2 diabetes are not a homogenous group; their experiences and well-being are likely to differ in important ways as a function of the way in which their diabetes is managed. In many instances, the response profile of adults with type 2 insulin-treated diabetes was more similar to that of adults with type 1 diabetes than to that of adults with type 2 non-insulin treated diabetes.
People with type 2 insulin-treated diabetes were more likely to report lower levels of general psychological well-being than any other group. They were more likely to experience moderate to severe symptoms of depression and anxiety, and more likely to indicate lower levels of satisfaction on all life domains than people with type 1 or type 2 non-insulin-treated diabetes. The results of Diabetes MILES – Australia indicate that there may be relatively high rates of undiagnosed depression, and this may be particularly true for respondents with type 2 insulin-treated diabetes.
In comparison, on both general and diabetes-specific psychological measures, respondents with type 2 non-insulin-treated diabetes reported the best outcomes.
Generally, compared to adults with type 1 diabetes, those with type 2 diabetes reported worse general health and higher rates of various co-morbidities and most diabetes-related complications. This may be explained by the fact that it is relatively common for people with type 2 diabetes to live with undiagnosed, ‘silent’ diabetes for many years, during which time persistently elevated blood glucose levels increase the likelihood of micro- and macro-vascular complications. This highlights the importance of early detection and effective management of type

PAGE 33
Discussion
2 diabetes. Furthermore, health professionals need to consider the potential impact of poorer health status on the psychological well-being of people with type 2 diabetes, especially for those using insulin.
Overall SampleAlthough adults with type 1 and type 2 diabetes differed in their experiences of diabetes-specific and general psychological distress, it is apparent that well-being is a key issue for both groups. Most respondents did not indicate major psychological problems. However, a substantial minority of respondents indicated experiencing clinically relevant psychological problems. Approximately a quarter of adults with diabetes experienced severe diabetes-related distress. Further, almost a quarter of all respondents experienced moderate to severe symptoms of depression, and about one in six people experienced moderate to severe symptoms of anxiety. However, access to a psychologist was rated as poor by more than 10% of respondents, with access being even more limited for people living in rural areas. These results highlight the need for investment in and improved access to psychological support services for adults with diabetes.
One in five respondents indicated that they rarely or never followed a healthy diet, and around two thirds did not meet the recommended levels of physical activity (at least 30 minutes per day, five days per week). Australia’s obesogenic environment19 is likely to be a barrier to initiating and maintaining healthy eating and physical activity habits, as these are often more difficult (and more expensive) than their unhealthy alternatives. Healthy eating and physical activity are crucial aspects of optimal self-care for people with diabetes (as they are for people without diabetes). Thus, greater attention needs to be given to developing sustainable ways to overcome the barriers to these behaviours that our environment presents currently.
In general, adults with diabetes perceived the quality of their health care to be high. People reported high levels of continuity of care and consistency between HCPs in the advice given. However, indicators of individualised and collaborative care were relatively low: almost half of all respondents reported that their HCPs had not asked them what was important to them in managing their diabetes. Not receiving adequate information from HCPs was also an issue for about half of all adults with diabetes. These findings reveal important areas for improvement of diabetes health care services.
Cost was perceived to be a barrier to health care by around half of all respondents. Further, almost a quarter of adults
with diabetes indicated that they had poor access to a GP who bulk-bills. The high cost of health care for people living with a chronic condition such as diabetes needs to be recognised as a burden and a barrier to optimal care.
Many (almost half the adults with diabetes who were surveyed) indicated that they had never been offered structured diabetes education. Indeed, not being offered structured education was the primary reason for not having attended. Limited access to relevant HCPs was a barrier to participation in structured education for those living in regional and rural areas. It was most common to have been offered structured education at the time of diagnosis. International guidelines recommend that people with diabetes have the opportunity to take part in a set program or curriculum designed to increase knowledge and skills about diabetes and its management. Diabetes MILES – Australia indicates there is a pressing need for greater access to structured education. Consideration needs to be given to the means through which structured education is offered (e.g. group education, online program) to maximise accessibility for people in regional and rural areas.
While participation rates in diabetes support groups were low, about one in three people indicated that they would be interested in joining one. While most adults with diabetes indicated that they had other people in their lives that they could talk to about their condition, about one in ten people indicated they had no-one to talk to about their diabetes. Social support is important for well-being20, and has also been shown to be associated with better self-care and diabetes outcomes21. It may be beneficial for diabetes support services and member organisations to consider how this expressed interest in support groups might be accommodated. It is important to ensure that groups are available and accessible to people with type 1 and type 2 diabetes from all regions of Australia, and relevant for people of all ages.
ConclusionsDiabetes MILES – Australia has highlighted some of the challenges faced by, and the unmet needs of, Australian adults living with type 1 or type 2 diabetes. Some issues are more pertinent to those living with type 1 diabetes, while other concerns are more significant to those with type 2 diabetes. However, there remains substantial commonality in the challenges faced by adults with diabetes, and the findings from this study have highlighted some key areas that can make a difference to the lives of adults living with diabetes:
.../continued

PAGE 34
Treatment: An effective management plan, as prescribed and monitored by a qualified HCP, is a cornerstone of optimal diabetes care. Adults with diabetes indicated that they consulted an endocrinologist and/or a GP regularly. However, many also indicated that cost and distance were barriers to health care. These barriers need to be addressed to ensure that all people with diabetes have access to the treatment that they need.
Self-care: Although treatment and access to HCPs is crucial, most diabetes care is self-care. People with diabetes need to have the knowledge and skills to manage their condition effectively on a daily basis, and be empowered to seek out information or support as required. Diabetes MILES – Australia suggests that many people have difficulty engaging as recommended in some self-management behaviours. The data also indicate that many people have not participated in structured education, and are not in a diabetes support group. Improving access to structured education, and enhancing the availability of peer support are two important ways that people can acquire the skills and confidence to manage their condition optimally.
Well-being: Significant psychological issues were experienced by a substantial minority of adults with diabetes who took part in Diabetes MILES – Australia. Many of those who reported clinically relevant symptoms of depression and/or anxiety appeared not to have received a diagnosis for their condition, and therefore were unlikely to be receiving the requisite care, treatment and support. Further, access to a psychologist was limited for some, especially those in rural areas. It is of utmost importance that people with diabetes, their families and their HCPs
are aware of the threats to psychological well-being that are associated with the condition. Depression, anxiety and/or diabetes-related distress are unlikely to be detected routinely without systematic screening and monitoring. Care must be optimised to ensure that access to psychological support services is available for all who need it.
Support from health care professionals: Adults with diabetes indicated that they received high quality care from their HCPs. In particular, high levels of continuity and consistency of care were noted. However, half of respondents indicated that they had not been asked what was important to them in their diabetes management by a HCP recently, and half reported that they had not received the information they need from their diabetes health care team. These findings highlight important areas of growth and improvement of diabetes health care services.
In-depth analyses of the Diabetes MILES – Australia data are ongoing. Further work is needed to improve understanding of the relationship between well-being, and the social environment and behavioural patterns. In addition, characterisation of those living successfully with diabetes will be a top priority, as this work may reveal potential areas of intervention and avenues to empowerment. Thorough exploration of the experiences and outcomes (psychological and physical) of those living in different regions of Australia (metro, regional, and rural) will also be crucial.
In summary, Diabetes MILES – Australia provides valuable insights into what it is like for Australian adults to live with diabetes. Ongoing analyses will continue to highlight ways in which policy and practice can be improved to optimise diabetes care.
Discussion (continued)

PAGE 35
References
1. Dunstan DW, Zimmet PZ, Welborn TA, de Courten MP, Cameron AJ, Sicree RA, Dwyer T, Colagiuri S, Jolley D, Knuiman M: The rising prevalence of diabetes and impaired glucose tolerance: The Australian Diabetes, Obesity and Lifestyle Study. Diabetes Care 2002, 25(5):829-834.
2. Alberti KGMM, Zimmet P, Shaw J: International Diabetes Federation: A consensus on type 2 diabetes prevention. Diabetic Medicine 2007, 24(5):451-463.
3. Bradley C, Speight J: Patient perceptions of diabetes and diabetes therapy: Assessing quality of life. Diabetes/Metabolism Research and Reviews 2002, 18(S3):S64-S69.
4. Cheung NW, Conn JJ, d’Emden MC, Gunton JE, Jenkins AJ, Ross GP, Sinha AK, Andrikopoulos S, Colagiuri S, Twigg SM: Position statement of the Australian Diabetes Society: Individualisation of glycated haemoglobin targets for adults with diabetes mellitus. Medical Journal of Australia 2009, 191(6):339.
5. Gold AE, Macleod KM, Frier BM: Frequency of severe hypoglycemia in patients with type 1 diabetes with impaired awareness of hypoglycemia. Diabetes Care 1994, 17(7):697-703.
6. International Wellbeing Group: Personal Wellbeing Index. Melbourne: Australian Centre on Quality of Life, Deakin University 2006.
7. Cummins RA, Eckersley R, Lo SK, Okerstrom O, Hunter B, Woerner J: Australian Unity Wellbeing Index Survey 12. Geelong: Deakin University; 2004.
8. Kroenke K, Spitzer RL, Williams JBW: The PHQ-9: Validity of a brief depression severity measure. Journal of General Internal Medicine 2001, 16(9):606-613.
9. Weissman MM, Bland RC, Canino GJ, Faravelli C, Greenwald S, Hwu HG, Joyce PR, Karam EG, Lee CK, Lellouch J: Cross-national epidemiology of major depression and bipolar disorder. JAMA: The Journal of the American Medical Association 1996, 276(4):293.
10. Ali S, Stone MA, Peters JL, Davies MJ, Khunti K: The prevalence of co-morbid depression in adults with Type 2 diabetes: a systematic review and meta-analysis. Diabetic Medicine 2006, 23(11):1165-1173.
11. Spitzer RL, Kroenke K, Williams JBW, Lowe B: A brief measure for assessing generalized anxiety disorder: The GAD-7. Archives of Internal Medicine 2006, 166(10):1092.
12. Speight J, Woodcock A, Reaney MA, SA, Johnson P, Parrott N, Rutter M, Senior P, Smith R, Shaw J: ‘The QoL-Q Diabetes’ - a novel instrument to assess quality of life for adults with type 1 diabetes undergoing complex interventions including transplantation. Diabetic Medicine 2010, 27(Suppl 1):3-4.
13. Polonsky WH, Anderson BJ, Lohrer PA, Welch G, Jacobson AM, Aponte JE, Schwartz CE: Assessment of diabetes-related distress. Diabetes Care 1995, 18(6):754-760.
14. Welch GW, Jacobson AM, Polonsky WH: The Problem Areas in Diabetes Scale. An evaluation of its clinical utility. Diabetes Care 1997, 20(5):760-766.
15. Snoek FJ, Pouwer F, Welch GW, Polonsky WH: Diabetes-related emotional distress in Dutch and U.S. diabetic patients: cross-cultural validity of the problem areas in diabetes scale. Diabetes Care 2000, 23(9):1305-1309.
16. McCormack LA, Williams-Piehota PA, Bann CM, Burton J, Kamerow DB, Squire C, Fisher E, Brownson CA, Glasgow RE: Development and Validation of an Instrument to Measure Resources and Support for Chronic Illness Self-management. The Diabetes Educator 2008, 34(4):707-718.
17. Paddison C: Family support and conflict among adults with type 2 diabetes: Developing and testing of a new measure. European Diabetes Nursing 2010, 7(1):29-33.
18. Broadbent E, Petrie KJ, Main J, Weinman J: The Brief Illness Perception Questionnaire. Journal of psychosomatic research 2006, 60(6):631-637.
19. Egger G, Swinburn B: An “ecological” approach to the obesity pandemic. British Medical Journal 1997, 315(7106):477.
20. Littlefield CH, Rodin GM, Murray MA, Craven JL: Influence of functional impairment and social support on depressive symptoms in persons with diabetes. Health Psychology 1990, 9(6):737.
21. van Dam HA, van der Horst FG, Knoops L, Ryckman RM, Crebolder HFJM, van den Borne BHW: Social support in diabetes: A systematic review of controlled intervention studies. Patient Education and Counseling 2005, 59(1):1-12.

PAGE 36
References continued
22. Bech P: Measuring the dimension of psychological general well-being by the WHO-5. Quality of Life Newsletter 2004, 32:15-16.
23. Polonsky WH, Fisher L, Earles J, Dudl RJ, Lees J, Mullan J, Jackson RA: Assessing psychosocial distress in diabetes: Development of the Diabetes Distress Scale. Diabetes Care 2005, 28(3):626-631.
24. Speight J, Barandse S, Bradley C: The W-BQ 28: Further development of the Well-Being Questionnaire to include diabetes-specific as well as a generic subscale and new stress subscales. Proceedings of the British Psychological Society 2000, 8(1):21.
25. Herdman M, Gudex C, Lloyd A, Janssen M, Kind P, Parkin D, Bonsel G, Badia X: Development and preliminary testing of the new five-level version of EQ-5D (EQ-5D-5L). Quality of Life Research In press.
26. Anderson RM, Fitzgerald JT, Gruppen LD, Funnell MM, Oh MS: The Diabetes Empowerment Scale-Short Form (DES-SF). Diabetes Care 2003, 26(5):1641-1642.
27. Tang TS, Brown MB, Funnell MM, Anderson RM: Social support, quality of life, and self-care behaviors among African Americans with type 2 diabetes. The Diabetes Educator 2008, 34(2):266-276.
28. Australian Institute of Health and Welfare (AIHW): National Health Data Dictionary. Version 8.0. AIHW Catalogue No. HWI 18. Canberra: AIHW; 1999.
29. Horne R, Weinman J: Patients’ beliefs about prescribed medicines and their role in adherence to treatment in chronic physical illness. Journal of Psychosomatic Research 1999, 47(6):555-567.
30. Speight J, Barendse SM, Singh H, Amiel SA, Elliot J, Evans M, Flanagan D, Frier BM, Heller SR, Kerr D et al: The Hypo Awareness Questionnaire: Design of a novel measure of awareness of hypoglycaemia for use in the UK Hypo COMPaSS trial. In Diabetes UK: 3-5 March 2010; Liverpool; 2010.
31. Cox DJ, Irvine A, Gonder-Frederick L, Nowacek G, Butterfield J: Fear of hypoglycemia: quantification, validation, and utilization. Diabetes Care 1987, 10(5):617-621.
32. Craig CL, Marshall AL, Sjostrom M, Bauman AE, Booth ML, Ainsworth BE, Pratt M, Ekelund U, Yngve A, Sallis JF et al: International Physical Activity Questionnaire: 12-country reliability and validity. Medicine and Science in Sports and Exercise 2003, 35(8):1381-1395.
33. Snoek F, Skovlund S, Pouwer F: Development and validation of the insulin treatment appraisal scale (ITAS) in patients with type 2 diabetes. Health and Quality of Life Outcomes 2007, 5(1):69.
34. Scheier M, Carver C: Distinguishing optimism from neuroticism (and trait anxiety, self-mastery, and self-esteem): A re-evaluation of the Life Orientation Test. Journal of Personality and Social Psychology 1994, 67:1063-1078.
35. Schwarzer R, Jerusalem M: Generalized Self-Efficacy Scale. In Measures in health psychology: a users portfolio Causal and control beliefs. Edited by Weinman J, Wright S, Johnson M. Windsor, UK: NFER-NELSON; 1995:35-37.
36. Rosenberg M: Society and the adolescent child. Princeton, NJ: Princeton University Press; 1965.
37. Horne R, Weinman J, Hankins M: The Beliefs about Medicines Questionnaire: The development and evaluation of a new method for assessing the cognitive representation of medication. Psychology & Health 1999, 14(1):1-24.
38. Lempers JD, Clark-Lempers D, Simons RL: Economic hardship, parenting, and distress in adolescence. Child Development 1989:25-39.
39. van der Ven NCW, Lubach CHC, Hogenelst MHE, van Iperen A, Tromp-Wever AME, Vriend A, van der Ploeg HM, Heine RJ, Snoek FJ: Cognitive behavioural group training (CBGT) for patients with type 1 diabetes in persistent poor glycaemic control: who do we reach? Patient Education and Counseling 2005, 56(3):313-322.

PAGE 37
Appendix I: Diabetes MILES – Australia Reference Group
Name Affiliation Country Discipline
Prof Charles Abraham University of Sussex England Health Psychology
Dr Penny Allen University of Tasmania Australia Epidemiology
Dr Ralph Audehm Dianella Community Health Australia General Practice
Ms Joanne Bowden Royal Melbourne Hospital Australia Diabetes Education
Prof Rob Carter Deakin University Australia Health Economics
Assoc/Prof Neale Cohen Baker IDI Heart and Diabetes Institute Australia Endocrinology
Prof Peter Colman Royal Melbourne Hospital Australia Endocrinology
Assoc/Prof John DixonBaker IDI Heart and Diabetes Institute; Monash University
Australia Medicine, Obesity
Prof James Dunbar Greater Green Triangle Australia General Practice
Prof Trisha Dunning Deakin University; Barwon Health Australia Nursing
Mrs Virginia Hagger Diabetes Australia – Vic Australia Diabetes Education
Prof Rob Horne University of London EnglandPharmacy and Behavioural Medicine
Assoc/Prof Alicia Jenkins St Vincent’s Hospital Australia Endocrinology
Prof Michael Kyrios Swinburne University of Technology Australia Psychology
Prof Colin Martin University of the West of Scotland ScotlandHealth Psychology and Psychiatric Nursing
Dr Kylie Mosely Australian Catholic University Australia Health Psychology
Ms Giesje Nefs Tilburg UniversityThe Netherlands
Medical Psychology
Prof Brian Oldenburg Monash University Australia Public Health
Prof Richard Osborne Deakin University Australia Public Health
Mr Harry Patsamanis Heart Foundation Victoria Australia Non-government organisation
Assoc/Prof William Polonsky
Behavioural Diabetes Institute; University of California San Diego
America Clinical Psychology
Mr John Popper Diabetes Australia – Vic Australia NDSS
Prof Frans Pouwer Tilburg University The Netherlands
Medical Psychology
Dr Bodil Rasmussen Deakin University Australia Nursing
Prof Prasuna Reddy University of Newcastle Australia Clinical Psychology
Ms Renza Scibilia Diabetes Australia – Vic Australia Consumer/Type 1 Diabetes
Dr Harsimran Singh University of Virginia America Health Psychology
Prof Timothy Skinner University of Tasmania Australia Health Psychology
Prof Frank Snoek VU University Medical Center AmsterdamThe Netherlands
Clinical Psychology
Dr Emily Williams Monash University Australia Health Psychology
Mr Mark Yeo Diabetes Australia – Vic Australia NDSS
Ms Catarina Yeung Diabetes Australia – Vic Australia Dietetics

PAGE 38
Concept Measure or variables Survey version
Part 1: Your feelings In general
Subjective wellbeing PWI: Personal Wellbeing Index6 ALL
Emotional wellbeing WHO-5: World Health Organisation Well being index22 ALL
Depression PHQ-9: Patient Health Questionnaire8 ALL
Anxiety GAD-7: General Anxiety Disorder Questionnaire11 ALL
Part 2: Your feelings about diabetes
Diabetes-specific quality of life QoL-Q Diabetes12 ALL
Diabetes-specific distressDDS: Diabetes Distress Screening Scale23#; PAID: Problem Areas In Diabetes scale13# ALL
Diabetes-specific positive well-being
4-item subscale of the W-BQ28: Wellbeing Questionnaire24 ALL
Part 3: Your general health
General healthEQ5D-5L25; 3 items (general health in past 4 weeks; change in health in past year)*
ALL
Miscellaneous7 items: other conditions/comorbidities*; sleep*; transplants*; dialysis*; weight loss surgery*
ALL
Part 4: Support you receive from health professionals
Health consultations29 items (access, reliance, distance, consistency, continuity, distance/cost as an obstacle, timely appointment attendance)* inspired by the ALSHW Survey 2009
ALL
Healthcare and self-management RSSM-SF: Resources and Support for Chronic illness Self-Management scale short form16
T1A, T2IA, T2A
Structured education 4items* inspired by the IDF Diabetes Atlas 2009T1A, T2IA, T2A
Empowerment DES-SF: Diabetes Empowerment Scale Short Form26 ALL
Health literacyHeLMS: Health Literacy Management Scale (seven of eight subscales included)
ALL
Part 5: Support you receive from friends and family
Peer/family support3 items* inspired by Tang et al, 2008 27; DFSC: Diabetes Family Support and Conflict17, Diabetes support group involvement
T1B, T2IB, T2B
Part 6: Your diabetes
Diabetes history Age at diagnosis*; diabetes type*; current treatment regimen* ALL
Blood glucose monitoring and recording
6 items (satisfaction, monitoring, recording, action)* inspired by the DAFNE self-management questionnaire (in development)*
ALL
Self-care behaviours & attitudesDSCI-R: Diabetes Self-Care Inventory-Revised adapted to include smoking items* inspired by the Smoking and Health Survey 2010 (the Cancer Council Vic)28
ALL
Medication adherenceMARS: Medication Adherence Rating Scales (Insulin and/or Medicine)29 ALL
Blood glucose level and HbA1c targets
4 items*T1A, T2IA, T2A
Appendix II: Variables included in Diabetes MILES – Australia

Appendix II: Variables included in Diabetes MILES – Australia
PAGE 39
Concept Measure or variables Survey version
Hypoglycaemia awarenessGold Score5; 5 items from the HypoA-Q: Hypo awareness questionnaire30 T1A
Hypoglycaemia treatment 1 item* T1A
Fear of hypoglycaemia 2 items* inspired by the HFS: Hypoglycaemia Fear Scale31 T1A
Insulin restrictionDesigned by ACBRD team based on the Diabetes Australia-Vic’s Type 1 Diabetes and Eating Disorders Online Survey 2008 Report
T1B
Disordered eating6 items* inspired by Type 1 Diabetes and Eating Disorders Online Survey 2008 Report
T1B
Perceived behavioural control 15 items* T2IB, T2B
Physical activityIPAQ: International Physical Activity Questionnaire (Short Form)32; 5 items*
T2IB, T2B
Psychological insulin resistance ITAS: Insulin Treatment Appraisal Scale33 T2IB, T2A
Part 7: Your thoughts and beliefs
Optimism LOT-R: Life Orientation Test – Revised34 T1B, T2IB, T2B
Perceived self-efficacy GSE: General Self-Efficacy Scale35 T1B, T2IB, T2B
Self-esteem Rosenberg Self-Esteem Scale36 T1B, T2IB, T2B
Beliefs about illness BIPQ: Brief illness Perceptions Questionnaire (diabetes version)18 T1A, T2IA, T2A
Beliefs about medicinesBMQ: Beliefs about Medicines Questionnaire (medicine, insulin and general)37
T1A, T2IA, T2A
Part 8: About you
Demographics25 items (e.g. sex, age, education, occupation, disability)* inspired by the ALSWH 2009
ALL
Financial hardship Economic Hardship Questionnaire38; 8 items* T1B, T2IB, T2B
NDSS access 4 items* from previous NDSS surveys ALL
Part 9: Have we missed anything?
Further comments Free-text box ALL
Part 10: Future Research
What research would you like to see?
Free-text box ALL
Interest in future research 2 items* ALL
* designed by ACBRD team in the absence of relevant and suitable standardised measures # measure/item included in only 50% of surveys in order to reduce respondent burden ALSWH: Australian Longitudinal Study on Women’s Health

PAGE 40
Appendix III: Scales Included in Report
Name Description
Brief Illness Perceptions Questionnaire (BIPQ)18
A 9-item scale designed to assess cognitive and emotional representations of illness. The BIPQ was modified to be diabetes-specific, e.g. questions refer to “your diabetes” rather than “your illness”. The first 8 items (reported here) were designed to assess perceptions of various aspects of diabetes (e.g. perceived control, emotional impact) on an 11 point scale. The final item (not reported here) invites free-text responses about what respondents believe caused their condition.
Diabetes Family Support and Conflict Scale (DFSC)17
A 10-item scale that measures the extent to which respondents experience support or conflict within their families in relation to their diabetes self-management. The scale includes two subscales: family support (6 items) and family conflict (4 items). Respondents are asked to indicate the extent to which their family provides support for or are in conflict about their self-management (1 = Never; 5 = Always). Higher mean scores indicate greater levels of family support or conflict.
Diabetes Self Care Inventory-revised (DSCI-revised)
An 11-component scale which assesses the frequency of undertaking diabetes self-care activities, the extent to which respondents regard these activities as burdensome and as important. Respondents complete only the items which are revenant to their diabetes management, e.g. insulin injections or blood glucose tablets. Due to the differing components of this scale, the items and response options vary in structure. This scale is based on the Diabetes Self-Care Inventory39.
Gold Score5The single-item Gold score measures hypoglycaemia awareness. The Gold score asks participants to respond on 7-point scale to the following question: “do you know when your hypos are commencing?”(1=Alwaysaware;7=Neveraware).Ascoreof≥4impliesimpairedawareness.
Patient Health Questionnaire (PHQ9)8
A 9-item scale which assesses the presence and severity of depression. Participants rate the frequency with which they have experienced symptoms of depression over the past two weeks on a 4-point scale (0 = Not at all; 3 = Nearly every day). Item scores are summed to form a total score out of 27. Scores of 5, 10, 15, and 20 represent cut-points for mild, moderate, moderately severe and severe depression respectively.
Personal Wellbeing Index (PWI)6
An 8-item general measure of subjective wellbeing, only 7 items were included in Diabetes MILES- Australia. Each item addresses a satisfaction with different life domains (e.g. health, standard of living, personal relationships) on an 11-point scale (0 = Completely dissatisfied; 10 = Completely satisfied). Satisfaction scores on each domain are then standardised to a score out of 100.
Problem Areas In Diabetes (PAID)13
A 20-item scale that measures diabetes-related distress, defined as distress resulting from diabetes and its management. Each item addresses a different concern or issue associated with diabetes. The extent to which each of these potential concerns is a problem is rated on a 5-point scale (0 = Not a problem; 4 = Serious problem). Item scores are summed, and standardised to a scoreoutof100.Scores≥40indicateseverediabetes-relateddistress.
Quality of Life Questionnaire (QoL-Q)12
A new diabetes-specific measure of quality of life. On a 5 point scale (0 = Strongly disagree, 4 = Strongly agree), respondents rate the extent to which diabetes affects their life across 26 domains (e.g. work, family, leisure). Lower scores indicate that diabetes impairs that aspect of life. In addition, respondents indicate the level of importance of each of the 26 domains on a 3-point scale (1 = Not at all important, 3 = Extremely important). This information may be used to weight impact scores (not reported here).
Resources and Support for Self-Management Short Form (RSSM-SF)16
A 7-item scale (only 6 items were included in Diabetes MILES- Australia) used to measure respondents experiences with, and support provided by, their diabetes health care team. The items range in structure, including up to 5-point scales and yes/no questions. Overall scores are computed by summing all scores and taking the mean.


The Australian Centre for Behavioural Research in DiabetesA partnership for better health between Diabetes Australia – Vic and Deakin University
570 Elizabeth StreetMelbourne Vic 3000t +61 (0)3 8648 1844f +61 (0)3 9667 1778e [email protected] w DiabetesMILES.org.au