Embed Size (px)
Citation preview
DIAGNOSTICS
Learning Guide seriesDiabetes
2L E A R N I N G G U I D E : D I A B E T E S TO T H E TA B L E O F C O N T E N T S
ACKNOWLEDGEMENTSDAVID LESLIEDavid Leslie is a consultant physician and professor of diabetes and autoimmunity in London, UK. He was coeditor of Diabetes Metabolism Research and Reviews, reviews editor of Diabetic Medicine and on the editorial board of Diabetes Care. He was formerly the president of the Association of Physicians of Great Britain and Ireland.
CAS WEYKAMPDr. Weykamp is a clinical biochemist and director of the MCA laboratory of the Queen Beatrix Hospital in Winterswijk, the Netherlands. At a national level, he is organizer of the EQA (proficiency test) program in medical laboratories and manufactures most of the required specimens for these programs in his ISO 13485-certified lab. Dr. Weykamp is a world-recognized expert on HbA1c standardization and certification and is currently the network coordinator of the network of laboratories operating the International Federation of Clinical Chemistry and Laboratory Medicine (IFCC) Reference Method, which is responsible for worldwide standardization of HbA1c assays.
ANDREA MOSCAProfessor Andrea Mosca is a clinical biochemist with extensive technical knowledge and experience in chemistry, hematology and immunochemistry analyzers. Professor Mosca has been a member of the Italian Society of Clinical Biochemistry and Clinical Molecular Biology (SIBioC-Medicina di Laboratorio) since 1986 and serves on their executive board. He has been the secretary of the IFCC Working Group on Standardization of Hemoglobin A1c and a member of the IFCC Working Group on Point-of-Care Testing (PoCT). He is now chairman of the IFCC Working Group on Standardization of Hemoglobin A2.
RANDIE R. LITTLERandie R. Little is a research professor in the Department of Pathology and Anatomical Sciences and the Department of Child Health at the University of Missouri, and the director of the Diabetes Diagnostic Laboratory. Dr. Little is the coordinator of the NGSP network and is a member of the NGSP Steering Committee and the IFCC Integrated Project on HbA1c. She has published more than 100 articles in the area of diabetes testing. Her research interests include glycated hemoglobin (HbA1c) testing and standardization, evaluation and comparison of HbA1c methods, use of HbA1c for diabetes diagnosis and screening, use of glycated albumin, and standardization of insulin and C-peptide measurement.
GARRY JOHNGarry John is a consultant and professor in clinical biochemistry with extensive technical knowledge and experience in HbA1c chemistry and diabetes. Professor John is a recognized worldwide expert on standardization of hemoglobin A1c, certification and use of HbA1c in diabetes. Professor John was chair of the IFCC Working Group on Standardization of Hemoglobin A1c, which developed the reference measurement procedure that enabled the global standardization of HbA1c measurements. He is now the chair of the IFCC Task Force on Implementation of HbA1c Standardization and has collaborated closely with a number of international organizations, including the World Health Organization and the International Diabetes Federation, on a number of initiatives to improve diabetes care.
SCOTT A. RUETTENEditor Scott A. Ruetten is an Abbott Diagnostics R&D program manager.
3L E A R N I N G G U I D E : D I A B E T E S TO T H E TA B L E O F C O N T E N T S
HOW TO USE THIS LEARNING GUIDEThis guide is organized into six sections and an appendix. Each section includes a list of learning objectives and questions at the end. The appendix includes references for each section, as well as suggested reading to expand on discussions in the guide, a glossary of terms and correct responses to section questions.
This learning guide is (1) an overview of diabetes and (2) a guide for the use of glycated hemoglobin (HbA1c) as a clinical tool for general health screening and monitoring for patients suspected of having diabetes, as well for those already diagnosed with diabetes. The guide reviews reference methodologies, available assay methods, standardization and certification. The guide also reviews the physiology of HbA1c and its hemoglobin variants or derivatives and the recommendations/precautions for using HbA1c in clinical practice.
4L E A R N I N G G U I D E : D I A B E T E S
CONTENTSACKNOWLEDGEMENTS . . . . . . . . . . . . . . . . . . . . . . . . . . . . . . . . . . . . . . . . . . . . . . . . . . . . . .2
HOW TO USE THIS LEARNING GUIDE . . . . . . . . . . . . . . . . . . . . . . . . . . . . . . . . . . . . . . . .3
FOREWORD . . . . . . . . . . . . . . . . . . . . . . . . . . . . . . . . . . . . . . . . . . . . . . . . . . . . . . . . . . . . . . . . . .5
SECTION 1: DAVID LESLIEINTRODUCTION TO DIABETES . . . . . . . . . . . . . . . . . . . . . . . . . . . . . . . . . . . . . . . . . . . . . . .6
SECTION 2: DAVID LESLIEDIABETES DISEASE SPECIFICS . . . . . . . . . . . . . . . . . . . . . . . . . . . . . . . . . . . . . . . . . . . . . . 15
SECTION 3: CAS WEYKAMPHbA1c METHODS: ASSAY METHODOLOGIES AND IFCC STANDARDIZATION . . . . . . . . . . . . . . . . . . .25
SECTION 4: ANDREA MOSCAGLYCATED HEMOGLOBIN AND THE INFLUENCE OF VARIANTS AND DERIVATIVES . . . . . . . . . . . . . . . . . . . . . . . . . . . . . . . . . . . . . . . . . . .35
SECTION 5: RANDIE R. LITTLEIFCC STANDARDIZATION AND NGSP CERTIFICATION PROGRAMS . . . . . . . . 46
SECTION 6: GARRY JOHNCLINICAL PRACTICE AND RECOMMENDATIONS FOR USE OF HbA1c TESTING . . . . . . . . . . . . . . . . . . . . . . . . . . . . . . . . . . . . . . . . . . . . . . . . . . . . . 58
APPENDIXAPPENDIX A: GLOSSARY OF TERMS . . . . . . . . . . . . . . . . . . . . . . . . . . . . . . . . . . . . . . . . 70APPENDIX B: REFERENCES . . . . . . . . . . . . . . . . . . . . . . . . . . . . . . . . . . . . . . . . . . . . . . . . .75APPENDIX C: CORRECT RESPONSES . . . . . . . . . . . . . . . . . . . . . . . . . . . . . . . . . . . . . . . 82
On the cover: Model of Human Insulin
5L E A R N I N G G U I D E : D I A B E T E S B A C K TO T H E TA B L E O F C O N T E N T S
Diabetes mellitus has become a worldwide epidemic, physically affecting more than 300 million people with an economic impact on healthcare in the billions of dollars. As the understanding of diabetes has evolved over the past 25–50 years, the options for diagnostic criteria have changed as well. The days of tasting urine for sweetness have evolved into handheld bedside devices and laboratory instruments running hundreds of tests per hour to diagnose and monitor diabetes.
In the 1960s, identification of type 2 (previously referred to as adult onset or non-insulin-dependent) diabetes using the oral glucose tolerance test (OGTT) had become established. Unfortunately, there were inconsistencies concerning how the test should be performed, the quantity of glucose that should be ingested and the diagnostic blood glucose cutoffs. By 1980, the World Health Organization (WHO) had standardized these parameters, and since then fasting plasma glucose (FPG) values have become more commonly used for diagnosis, especially in the United States.
Recent advances in the analytic performance of assays used to measure glycated hemoglobin (HbA1c) have resulted in the establishment of a new standard of laboratory diabetes testing. HbA1c is a specific glycated hemoglobin subfraction formed by the attachment of glucose to the N-terminus of the beta chain of hemoglobin (Hb). The average life span of human erythrocytes is approximately 90–120 days. As a result, the concentration of HbA1c closely reflects the average blood glucose level during this period. HbA1c is thus suitable to monitor long-term blood glucose control in individuals with diabetes. As shown through the Diabetes Control and Complications Trial (DCCT) and United Kingdom Prospective Diabetes Study (UKPDS), the risk of diabetic complications, including diabetic nephropathy and retinopathy, increases with poor glycemic control. HbA1c predicts the risks for development and progression of these complications in people with diabetes.
Diagnostic and tracking tools continue to improve the detection and monitoring of diabetes. Recent advances in manufacturing methods, reference materials and reference methodologies have led to the use of HbA1c for the diagnosis of diabetes. Recent recommendations have now been published by the WHO, American Diabetes Association (ADA) and in the European Union (EU) for the use of HbA1c as a diagnostic tool for diabetes. Care must be taken to understand the conditions of the patient and the manufacturer’s method to ensure reliable use of HbA1c for monitoring and diagnosis of diabetes.
FOREWORD
5L E A R N I N G G U I D E : D I A B E T E S B A C K TO T H E TA B L E O F C O N T E N T S
L E A R N I N G G U I D E : I N T R O D U C T I O N TO D I A B E T E S 6 B A C K TO T H E TA B L E O F C O N T E N T S
LEARNING OBJECTIVES
After completing this section, you will be able to:
• Describe the definition of diabetes and its worldwide prevalence and causes
• Explain diabetes classification and its relationship to glucose and HbA1c
• Identify the cause of diabetes related to insulin and type 1 and type 2 diabetes
• Specify the factors for when not to use HbA1c for diagnostic purposes
SECTION 1 INTRODUCTION TO DIABETES
7L E A R N I N G G U I D E : I N T R O D U C T I O N TO D I A B E T E S B A C K TO T H E TA B L E O F C O N T E N T S
DIABETES MELLITUSDiabetes mellitus is best described as a metabolic disease or condition characterized by hyperglycemia. The hyperglycemia may be caused by defects in insulin secretion, defects in insulin action or, more often, both.
The diagnosis of diabetes can be challenging, as it is typically not made on a single blood test; although a fasting blood glucose that is elevated will raise suspicion that a patient may have diabetes, and this usually leads to additional workup and testing.
At present, the diagnosis of diabetes is usually made when chronic hyperglycemia is identified by persistently elevated fasting blood glucose, associated with raised glucose following an oral glucose tolerance challenge, or elevated HbA1c above the clinical cutoff. A patient may have symptoms of diabetes, such as thirst or polyuria. The diagnostic criteria presented below are based on the WHO definition of diabetes mellitus in 2000.
Criteria for the Diagnosis of Diabetes Mellitus
Diagnostic testing of the patient reveals at least one of the following:
A. Symptoms of diabetes, plus a casual plasma glucose concentration of 11.1 mmol/L (200 mg/dL), where casual is defined as any time of day without regard to the time since the patient’s last meal. Classic symptoms of diabetes include polyuria, polydipsia and unexplained weight loss.
B. Fasting blood glucose level of 7.0 mmol/L (126 mg/dL), where fasting is defined as no caloric intake for at least eight hours.
C. Two-hour post-load glucose of 11.1 mmol/L (200 mg/dL) during an OGTT. The test should be performed as described by WHO, using a glucose load containing the equivalent of 75 grams of anhydrous glucose dissolved in water.
In the absence of unequivocal hyperglycemia, these criteria should be confirmed by repeat testing on a different day. The third measure (OGTT) is not recommended for routine clinical use.
DIAGNOSING DIABETES The WHO criteria only consider fasting and 120-minute values after an OGTT for use in establishing the diagnosis of diabetes. Intermediate time points are used in the National Diabetes Data Group (NDDG) criteria. Because the reproducibility of the OGTT is poor and because implementation of the test is difficult for both the physician and the patient, there has been a move toward using either fasting glucose concentrations or, more recently, glycated hemoglobin.
Glycated hemoglobin, or hemoglobin A1c (HbA1c), is more robust both analytically and functionally, since neither fasting nor a glucose load are required. HbA1c also has a high positive predictive value for diabetes at a cutoff above 6.5% (or 48 mmol/mol, as recommended by the International Federation of Clinical Chemistry and Laboratory Medicine [IFCC]). People may have diabetes by other criteria and at lower HbA1c levels. Certainly a level of HbA1c of 6.0% (IFCC 42 mmol/mol) or higher is usually considered abnormal and warrants further investigation.
8L E A R N I N G G U I D E : I N T R O D U C T I O N TO D I A B E T E S B A C K TO T H E TA B L E O F C O N T E N T S
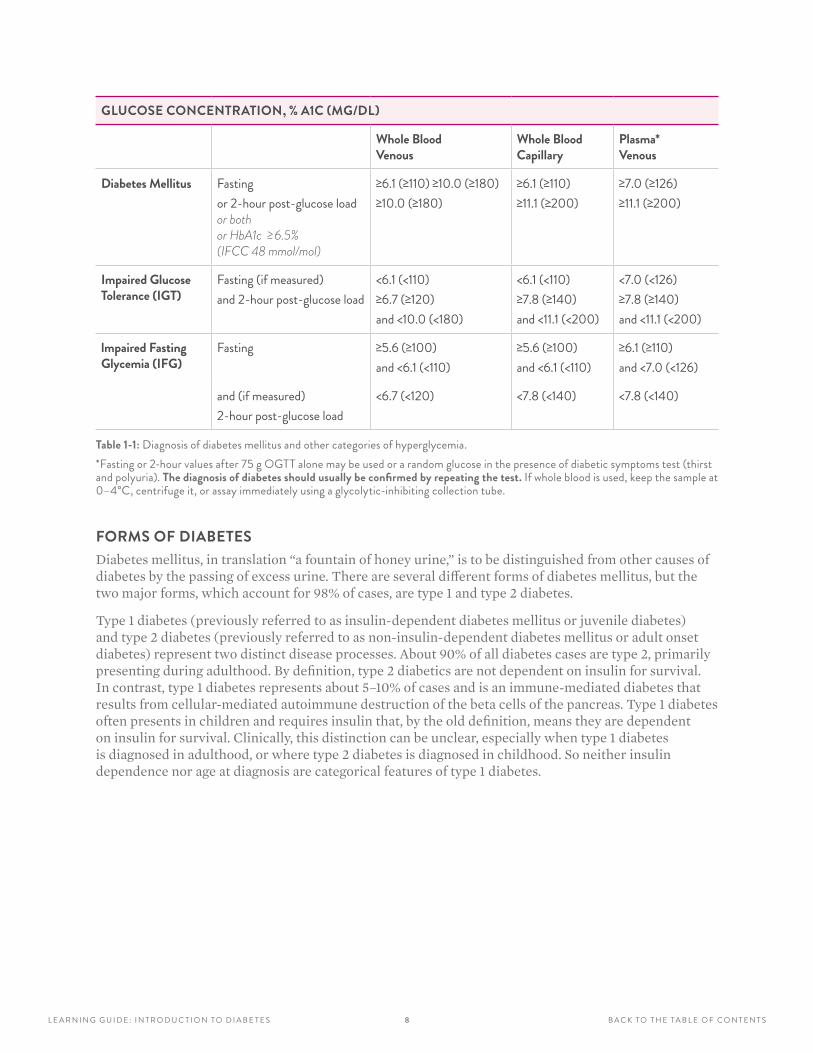
GLUCOSE CONCENTRATION, % A1C (MG/DL)
Whole Blood Venous
Whole Blood Capillary
Plasma* Venous
Diabetes Mellitus Fastingor 2-hour post-glucose load or both or HbA1c ≥6.5% (IFCC 48 mmol/mol)
≥6 .1 (≥110) ≥10 .0 (≥180) ≥10 .0 (≥180)
≥6 .1 (≥110)≥11 .1 (≥200)
≥7 .0 (≥126)≥11 .1 (≥200)
Impaired Glucose Tolerance (IGT)
Fasting (if measured)and 2-hour post-glucose load
<6 .1 (<110)≥6 .7 (≥120)and <10 .0 (<180)
<6 .1 (<110)≥7 .8 (≥140)and <11 .1 (<200)
<7 .0 (<126)≥7 .8 (≥140)and <11 .1 (<200)
lmpaired Fasting Glycemia (IFG)
Fasting ≥5 .6 (≥100)and <6 .1 (<110)
≥5 .6 (≥100)and <6 .1 (<110)
≥6 .1 (≥110)and <7 .0 (<126)
and (if measured)2-hour post-glucose load
<6 .7 (<120) <7 .8 (<140) <7 .8 (<140)
Table 1-1: Diagnosis of diabetes mellitus and other categories of hyperglycemia . *Fasting or 2-hour values after 75 g OGTT alone may be used or a random glucose in the presence of diabetic symptoms test (thirst and polyuria) . The diagnosis of diabetes should usually be confirmed by repeating the test. If whole blood is used, keep the sample at 0–4°C, centrifuge it, or assay immediately using a glycolytic-inhibiting collection tube .
FORMS OF DIABETESDiabetes mellitus, in translation “a fountain of honey urine,” is to be distinguished from other causes of diabetes by the passing of excess urine. There are several different forms of diabetes mellitus, but the two major forms, which account for 98% of cases, are type 1 and type 2 diabetes.
Type 1 diabetes (previously referred to as insulin-dependent diabetes mellitus or juvenile diabetes) and type 2 diabetes (previously referred to as non-insulin-dependent diabetes mellitus or adult onset diabetes) represent two distinct disease processes. About 90% of all diabetes cases are type 2, primarily presenting during adulthood. By definition, type 2 diabetics are not dependent on insulin for survival. In contrast, type 1 diabetes represents about 5–10% of cases and is an immune-mediated diabetes that results from cellular-mediated autoimmune destruction of the beta cells of the pancreas. Type 1 diabetes often presents in children and requires insulin that, by the old definition, means they are dependent on insulin for survival. Clinically, this distinction can be unclear, especially when type 1 diabetes is diagnosed in adulthood, or where type 2 diabetes is diagnosed in childhood. So neither insulin dependence nor age at diagnosis are categorical features of type 1 diabetes.
9L E A R N I N G G U I D E : I N T R O D U C T I O N TO D I A B E T E S B A C K TO T H E TA B L E O F C O N T E N T S
In normal physiology, increased insulin secretion usually compensates for reduction in insulin sensitivity. In type 2 diabetes, individuals have insulin resistance and the insulin deficiency is usually relative, as opposed to the absolute insulin deficiency that is seen in type 1 diabetes. Most patients with type 2 diabetes are obese, and obesity itself contributes to some degree of insulin resistance. But insulin secretion is also defective in these patients and unable to compensate for the insulin resistance. In type 1 diabetes, the autoimmune destruction of the beta cells of the pancreas results in decreased or (in later stages) no insulin secretion. The rate of beta cell destruction may be variable, and there are multiple genetic predispositions related to this.
Type 1 Diabetes (beta cell destruction, usually leading to absolute insulin deficiency)
A. Immune-mediated
B. Idiopathic
Type 2 Diabetes (may range from predominantly insulin resistance with relative insulin deficiency to a predominantly secretory defect with insulin resistance)
Other Specific Types
A. Genetic defects of beta cell function
B. Genetic defects in insulin action
C. Diseases of the exocrine pancreas*
D. Endocrinopathies*
E. Drug- or chemical-induced*
F. Infections*
G. Uncommon forms of immune-mediated diabetes*
H. Other genetic syndromes sometimes associated with diabetes
I. Gestational diabetes mellitus (GDM)
Abbreviated from WHO Study Group on Diabetes Mellitus
* Causes marked with asterisks are termed “secondary” diabetes . Today the definition of type 1 diabetes designates it as “often leading to absolute insulin deficiency” rather than “usually .”1-1
1 0L E A R N I N G G U I D E : I N T R O D U C T I O N TO D I A B E T E S B A C K TO T H E TA B L E O F C O N T E N T S
TYPE 1 DIABETES MELLITUSType 1 autoimmune diabetes is due to insulin deficiency of variable severity, often, especially in children, leading to insulin-dependent diabetes. In Western countries, almost all patients have the immune-mediated form of the disease (type 1A), which can occur at any age, but is the second most common chronic disease of childhood after asthma. A lack of insulin, caused by the autoimmune destruction of islets, characterizes type 1 diabetes.
TYPE 2 DIABETES MELLITUSType 2 diabetes is a common chronic disease predominantly responsible for the global epidemic of diabetes. The disease is probably heterogeneous but involves insufficient insulin secretion (largely genetically determined) in the context of reduced insulin sensitivity or increased insulin resistance. The rise in obesity allied to reduced exercise, in the context of industrialization, and the increased consumption of energy-dense foods, likely contribute to the dramatic rise in the incidence of this disease. Because hyperglycemia develops gradually in type 2 diabetes, it frequently is not diagnosed for many years until it becomes severe enough for patients to develop symptoms. This is concerning, as diabetic patients are at risk for both macrovascular and microvascular complications.
PHYSIOLOGY OF DIABETES While diabetes is defined by an increase in blood glucose, the cause of the hyperglycemia is due to inadequate insulin secretion in the context of degrees of insulin sensitivity. Insulin is the key hormone in the metabolism of glucose. Glucose appears in the blood from three main sources:
(1) The gut, from ingested carbohydrates, which are hydrolysed or converted in the liver
(2) Release from the liver glycogen stores and other glycogen stores (called glycogenolysis)
(3) By new glucose synthesis from precursors (called gluconeogenesis)
Because insulin plays a key role in liver glucose metabolism and in the use of glucose by muscles and fat cells, it follows that inadequate insulin levels will tend to cause increased blood glucose. The metabolic disturbances of diabetes reflect the broad metabolic action of insulin.

1 1L E A R N I N G G U I D E : I N T R O D U C T I O N TO D I A B E T E S B A C K TO T H E TA B L E O F C O N T E N T S
NORMAL GLUCOSE METABOLISMIn healthy people, blood glucose concentrations are maintained within very narrow limits, with some fluctuations after eating. Glucose concentrations increase after meals, but typical meals will not raise blood glucose above ~8 mmol/L (144 mg/dL), and normoglycemia is usually restored within four hours in healthy people (Figure 1-1).
70
60
50
40
30
20
10
μmol/
l
Insulin
** ** **********
***
Mealsp<0.05p<0.01
mm
ol/l 7
5
3
Glucose
NEFA
μmol/
l
500
400
300
200
100
Obese
8∞ 13∞ 18∞ 24∞ 8∞
Lean
Figure 1-1: Plasma insulin and glucose in lean (red line) and obese (blue line) subjects in laboratory conditions eating three meals during a day . Values are means (±SEM) .1-2
12L E A R N I N G G U I D E : I N T R O D U C T I O N TO D I A B E T E S B A C K TO T H E TA B L E O F C O N T E N T S
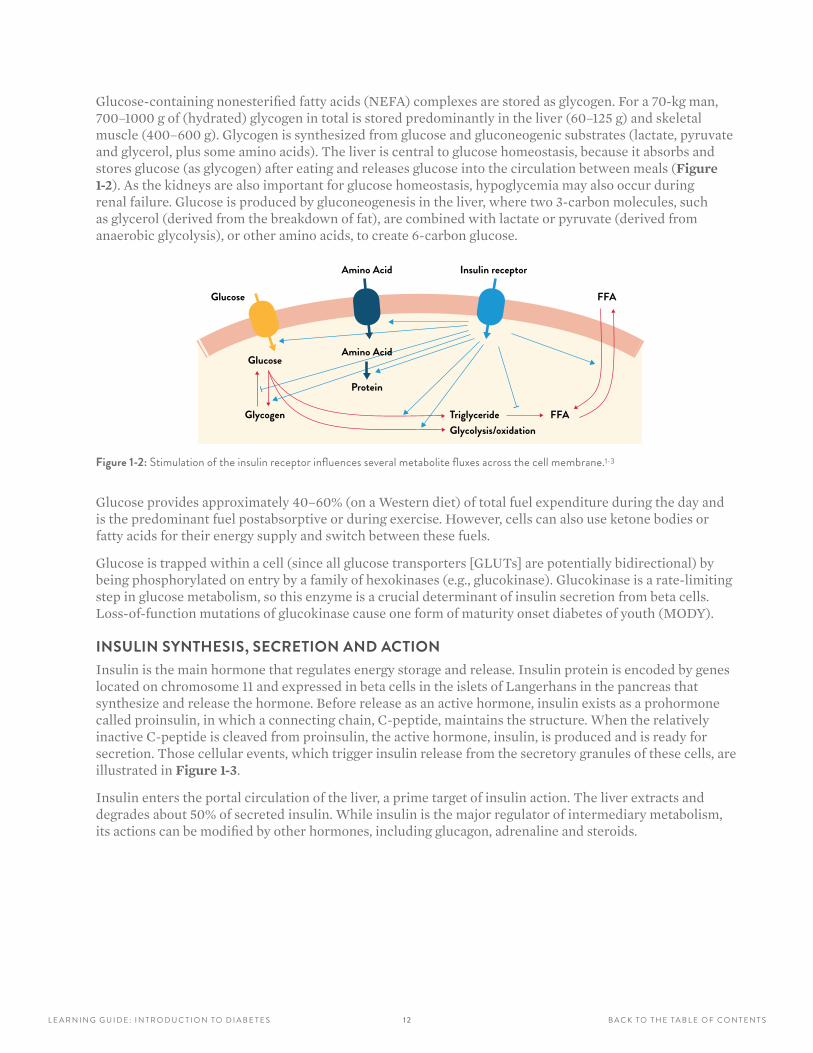
Glucose-containing nonesterified fatty acids (NEFA) complexes are stored as glycogen. For a 70-kg man, 700–1000 g of (hydrated) glycogen in total is stored predominantly in the liver (60–125 g) and skeletal muscle (400–600 g). Glycogen is synthesized from glucose and gluconeogenic substrates (lactate, pyruvate and glycerol, plus some amino acids). The liver is central to glucose homeostasis, because it absorbs and stores glucose (as glycogen) after eating and releases glucose into the circulation between meals (Figure 1-2). As the kidneys are also important for glucose homeostasis, hypoglycemia may also occur during renal failure. Glucose is produced by gluconeogenesis in the liver, where two 3-carbon molecules, such as glycerol (derived from the breakdown of fat), are combined with lactate or pyruvate (derived from anaerobic glycolysis), or other amino acids, to create 6-carbon glucose.
Glucose
Glucose
Insulin receptor
Glycogen
Amino Acid
FFA
FFA
Amino Acid
TriglycerideGlycolysis/oxidation
Protein
Figure 1-2: Stimulation of the insulin receptor influences several metabolite fluxes across the cell membrane .1-3
Glucose provides approximately 40–60% (on a Western diet) of total fuel expenditure during the day and is the predominant fuel postabsorptive or during exercise. However, cells can also use ketone bodies or fatty acids for their energy supply and switch between these fuels.
Glucose is trapped within a cell (since all glucose transporters [GLUTs] are potentially bidirectional) by being phosphorylated on entry by a family of hexokinases (e.g., glucokinase). Glucokinase is a rate-limiting step in glucose metabolism, so this enzyme is a crucial determinant of insulin secretion from beta cells. Loss-of-function mutations of glucokinase cause one form of maturity onset diabetes of youth (MODY).
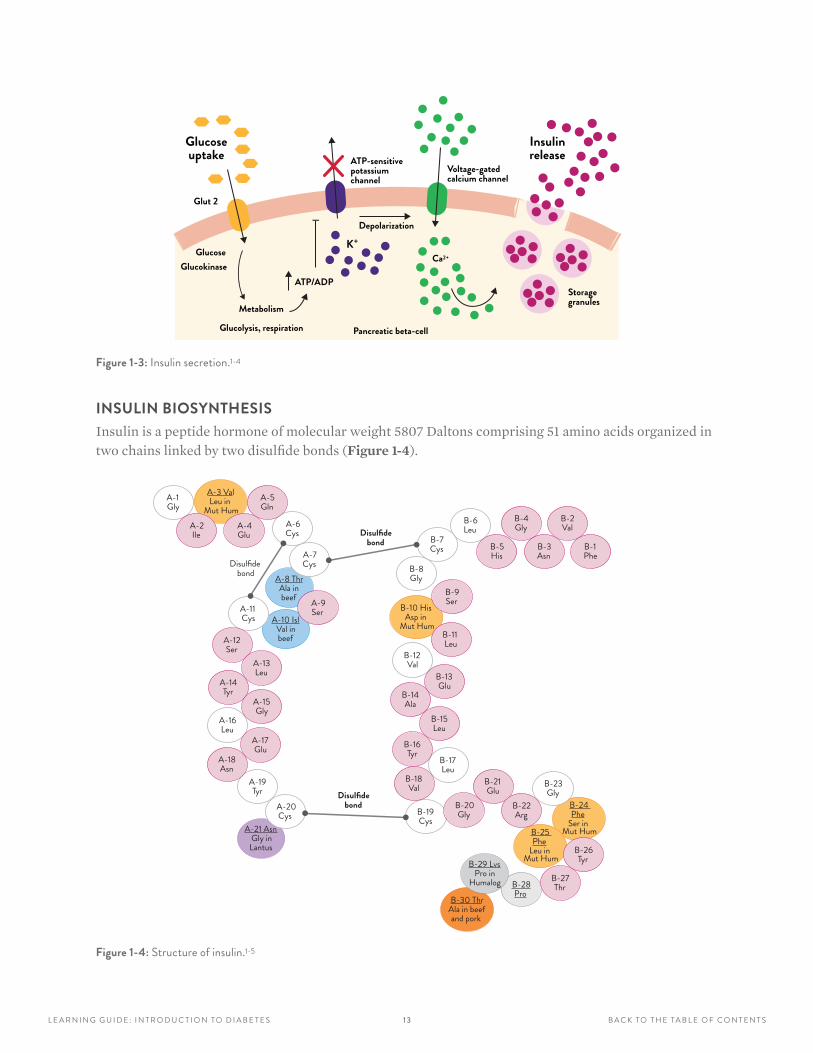
INSULIN SYNTHESIS, SECRETION AND ACTIONInsulin is the main hormone that regulates energy storage and release. Insulin protein is encoded by genes located on chromosome 11 and expressed in beta cells in the islets of Langerhans in the pancreas that synthesize and release the hormone. Before release as an active hormone, insulin exists as a prohormone called proinsulin, in which a connecting chain, C-peptide, maintains the structure. When the relatively inactive C-peptide is cleaved from proinsulin, the active hormone, insulin, is produced and is ready for secretion. Those cellular events, which trigger insulin release from the secretory granules of these cells, are illustrated in Figure 1-3.
Insulin enters the portal circulation of the liver, a prime target of insulin action. The liver extracts and degrades about 50% of secreted insulin. While insulin is the major regulator of intermediary metabolism, its actions can be modified by other hormones, including glucagon, adrenaline and steroids.
1 3L E A R N I N G G U I D E : I N T R O D U C T I O N TO D I A B E T E S B A C K TO T H E TA B L E O F C O N T E N T S
Glucoseuptake
Glucose
Glut 2
Metabolism
Pancreatic beta-cell
ATP/ADP
K+
Ca2+
ATP-sensitivepotassium channel
Voltage-gated calcium channel
Insulinrelease
Storagegranules
Glucokinase
Glucolysis, respiration
Depolarization
Figure 1-3: Insulin secretion .1-4
INSULIN BIOSYNTHESISInsulin is a peptide hormone of molecular weight 5807 Daltons comprising 51 amino acids organized in two chains linked by two disulfide bonds (Figure 1-4).
A-9Ser
A-1Gly
A-6Cys
A-11Cys
A-16Leu
A-19Tyr
A-20Cys
B-6Leu
B-7Cys
B-8Gly
B-12Val
B-17Leu
B-19Cys
B-23Gly
B-28Pro
B-24 Phe
Ser inMut HumB-25
PheLeu in
Mut HumB-29 LvsPro in
Humalog
B-30 ThrAla in beef and pork
A-21 AsnGly inLantus
A-10 IslVal inbeef
A-8 ThrAla inbeef
A-7Cys
A-2Ile
A-4Glu
A-5Gln
A-12Ser
A-13Leu
A-14Tyr
A-15Gly
A-17Glu
A-18Asn
B-1Phe
B-2Val
B-3Asn
B-4Gly
B-5His
B-9Ser
B-11Leu
B-10 HisAsp in
Mut Hum
B-13Glu
B-14Ala
B-15Leu
B-16Tyr
B-18Val
B-20Gly
B-21Glu
B-22Arg
B-26Tyr
B-27Thr
Disulfidebond
Disulfidebond
Disulfidebond
A-3 ValLeu in
Mut Hum
Figure 1-4: Structure of insulin .1-5
1 4L E A R N I N G G U I D E : I N T R O D U C T I O N TO D I A B E T E S B A C K TO T H E TA B L E O F C O N T E N T S
NORMAL INSULIN SECRETION
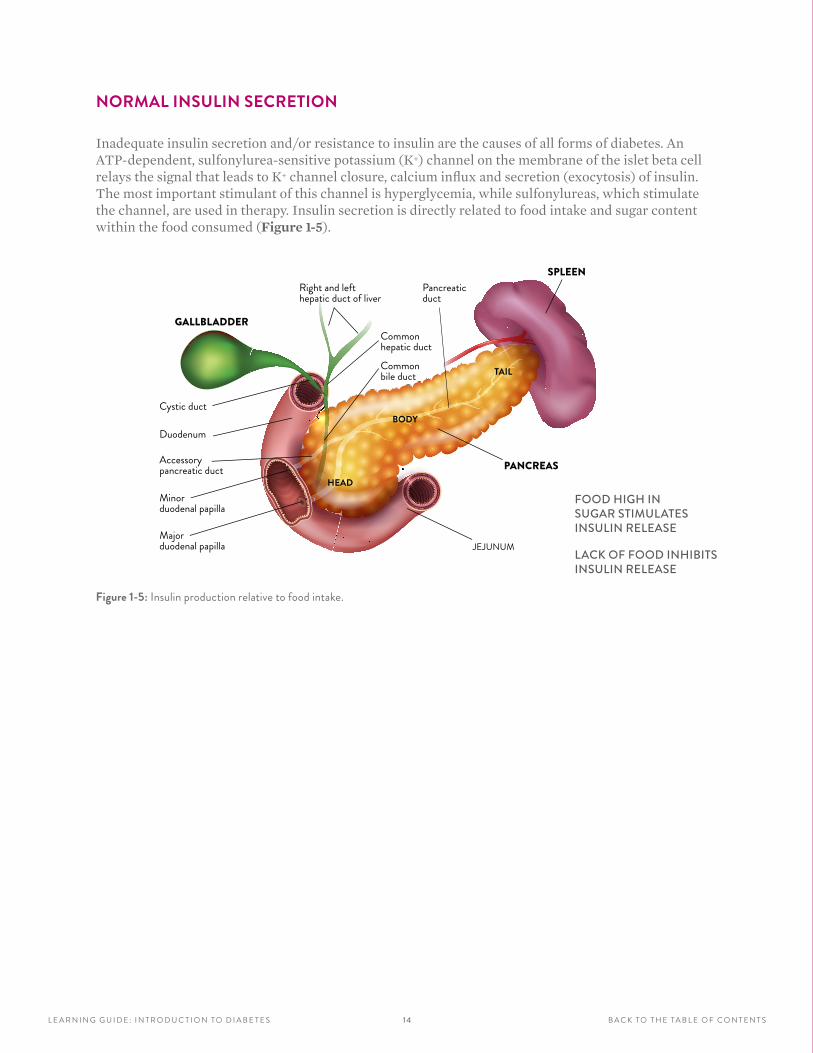
Inadequate insulin secretion and/or resistance to insulin are the causes of all forms of diabetes. An ATP-dependent, sulfonylurea-sensitive potassium (K+) channel on the membrane of the islet beta cell relays the signal that leads to K+ channel closure, calcium influx and secretion (exocytosis) of insulin. The most important stimulant of this channel is hyperglycemia, while sulfonylureas, which stimulate the channel, are used in therapy. Insulin secretion is directly related to food intake and sugar content within the food consumed (Figure 1-5).
GALLBLADDER
Right and left hepatic duct of liver
SPLEEN
PANCREAS
Cystic duct
Duodenum
Accessory pancreatic duct
Minor duodenal papilla
Major duodenal papilla JEJUNUM
Pancreatic duct
Common hepatic duct
Common bile duct
HEAD
BODY
TAIL
Figure 1-5: Insulin production relative to food intake .
LACK OF FOOD INHIBITS INSULIN RELEASE
FOOD HIGH IN SUGAR STIMULATES INSULIN RELEASE
1 5L E A R N I N G G U I D E : D I A B E T E S S P E C I F I C S B A C K TO T H E TA B L E O F C O N T E N T S
LEARNING OBJECTIVESAfter completing this section, you will be able to:
• Describe the epidemiology of diabetes and the causes of types 1 and 2 diabetes
• Explain diabetes classification and its relationship to glucose and HbA1c, along with clinical tests available
• Explain metabolic syndrome, the complications of diabetes, and the clinical presentations of diabetes
• Identify steps for the management of diabetic complications
SECTION 2 DIABETES DISEASE SPECIFICS
1 6L E A R N I N G G U I D E : D I A B E T E S D I S E A S E S P E C I F I C S B A C K TO T H E TA B L E O F C O N T E N T S
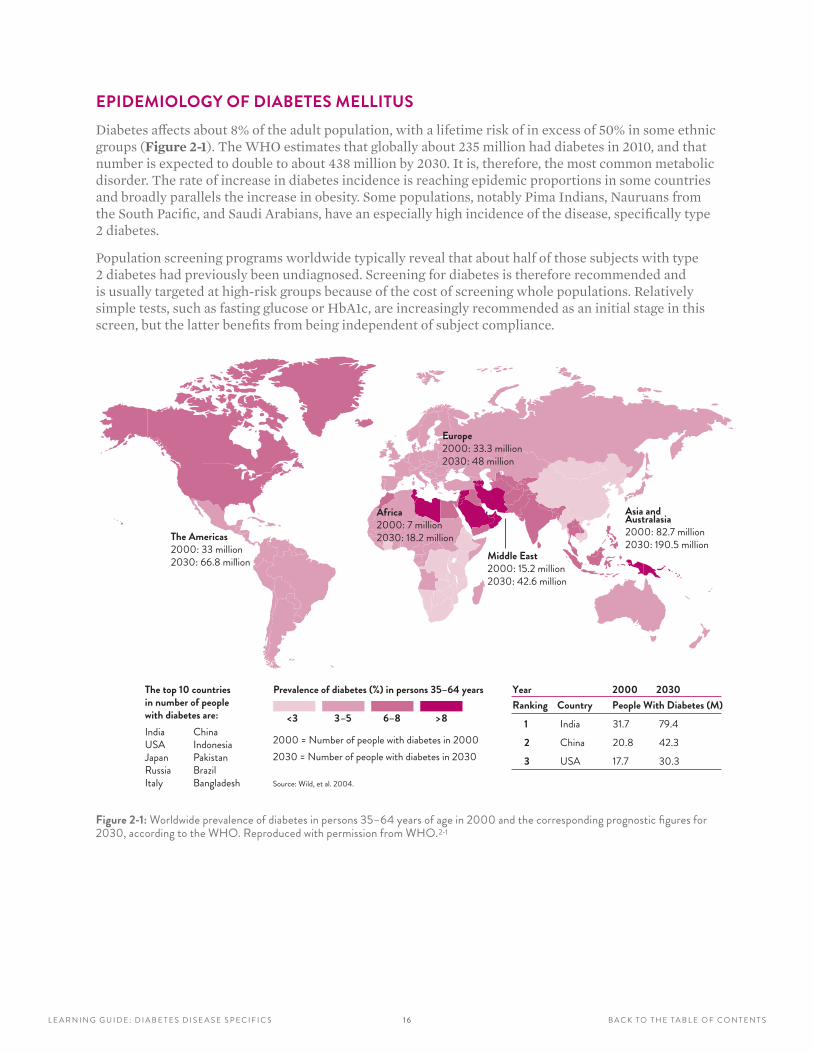
EPIDEMIOLOGY OF DIABETES MELLITUSDiabetes affects about 8% of the adult population, with a lifetime risk of in excess of 50% in some ethnic groups (Figure 2-1). The WHO estimates that globally about 235 million had diabetes in 2010, and that number is expected to double to about 438 million by 2030. It is, therefore, the most common metabolic disorder. The rate of increase in diabetes incidence is reaching epidemic proportions in some countries and broadly parallels the increase in obesity. Some populations, notably Pima Indians, Nauruans from the South Pacific, and Saudi Arabians, have an especially high incidence of the disease, specifically type 2 diabetes.
Population screening programs worldwide typically reveal that about half of those subjects with type 2 diabetes had previously been undiagnosed. Screening for diabetes is therefore recommended and is usually targeted at high-risk groups because of the cost of screening whole populations. Relatively simple tests, such as fasting glucose or HbA1c, are increasingly recommended as an initial stage in this screen, but the latter benefits from being independent of subject compliance.
The Americas2000: 33 million2030: 66.8 million
Asia andAustralasia2000: 82.7 million2030: 190.5 million
Europe2000: 33.3 million2030: 48 million
Middle East2000: 15.2 million2030: 42.6 million
Africa2000: 7 million2030: 18.2 million
The top 10 countries in number of people with diabetes are:India ChinaUSA IndonesiaJapan PakistanRussia BrazilItaly Bangladesh
Prevalence of diabetes (%) in persons 35–64 years
<3 3–5 6–8 >8
2000 = Number of people with diabetes in 20002030 = Number of people with diabetes in 2030
Source: Wild, et al. 2004.
Year 2000 2030Ranking Country People With Diabetes (M)
1 India 31.7 79.42 China 20.8 42.33 USA 17.7 30.3
Figure 2-1: Worldwide prevalence of diabetes in persons 35–64 years of age in 2000 and the corresponding prognostic figures for 2030, according to the WHO . Reproduced with permission from WHO .2-1
17L E A R N I N G G U I D E : D I A B E T E S D I S E A S E S P E C I F I C S B A C K TO T H E TA B L E O F C O N T E N T S
CAUSE OF TYPE 1 DIABETES Type 1 diabetes is due to the interaction of the environment with an underlying genetic susceptibility leading to an autoimmune response, which damages or destroys insulin-secreting cells. The risk of developing childhood-onset autoimmune diabetes is about 1 in 400 in the general population. It is a 1.0% risk in the adult population, about 6% for a sibling and about 50% in an identical twin of a diabetic patient. Despite the increasing incidence of type 1 diabetes in children, especially very young children, by about 2020, it is predicted that the majority of children with diabetes will have type 2 diabetes. The disease incidence of type 1 diabetes is increasing, especially in very young children, but that incidence remains far below that of adult-onset type 2 diabetes.
Slow progression to insulin deficiency in patients with autoimmune diabetes can occur, with about 10% of adult patients presenting initially with a non-insulin-requiring form of type 1 diabetes called latent autoimmune diabetes of adults (LADA). LADA is characterized by the presence of diabetes-associated antibodies to glutamic acid decarboxylase (GADA). This is likely one form of type 1 autoimmune diabetes, which also encompasses juvenile-onset insulin-dependent diabetes and some cases with ketosis-prone diabetes (KPD). Autoimmune type 1 diabetes is associated with other autoimmune diseases (notably autoimmune thyroid disease and celiac disease), which also show genetic susceptibility, largely mediated by the human leukocyte antigen (HLA) genes of chromosome 6. Other immune response genes and a variant of the insulin gene are also involved in type 1 autoimmune diabetes. The nature of the environmental factor remains unclear.
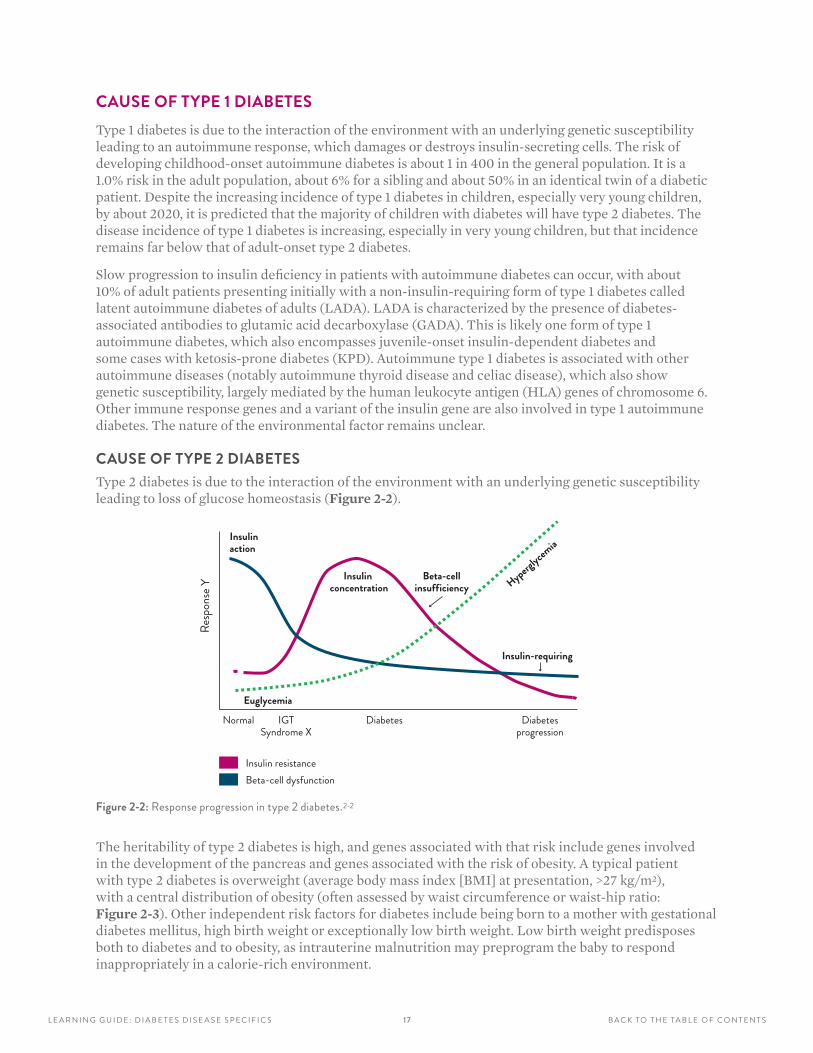
CAUSE OF TYPE 2 DIABETES Type 2 diabetes is due to the interaction of the environment with an underlying genetic susceptibility leading to loss of glucose homeostasis (Figure 2-2). NATURAL HISTORY OF TYPE 2 DIABETES MELLITUS
Insulin action
Insulin concentration
Insulin-requiring
Beta-cellinsufficiency
Euglycemia
Hyperglycem
ia
Insulin resistanceBeta-cell dysfunction
Normal IGTSyndrome X
Resp
onse
Y
Diabetes Diabetesprogression
Figure 2-2: Response progression in type 2 diabetes .2-2
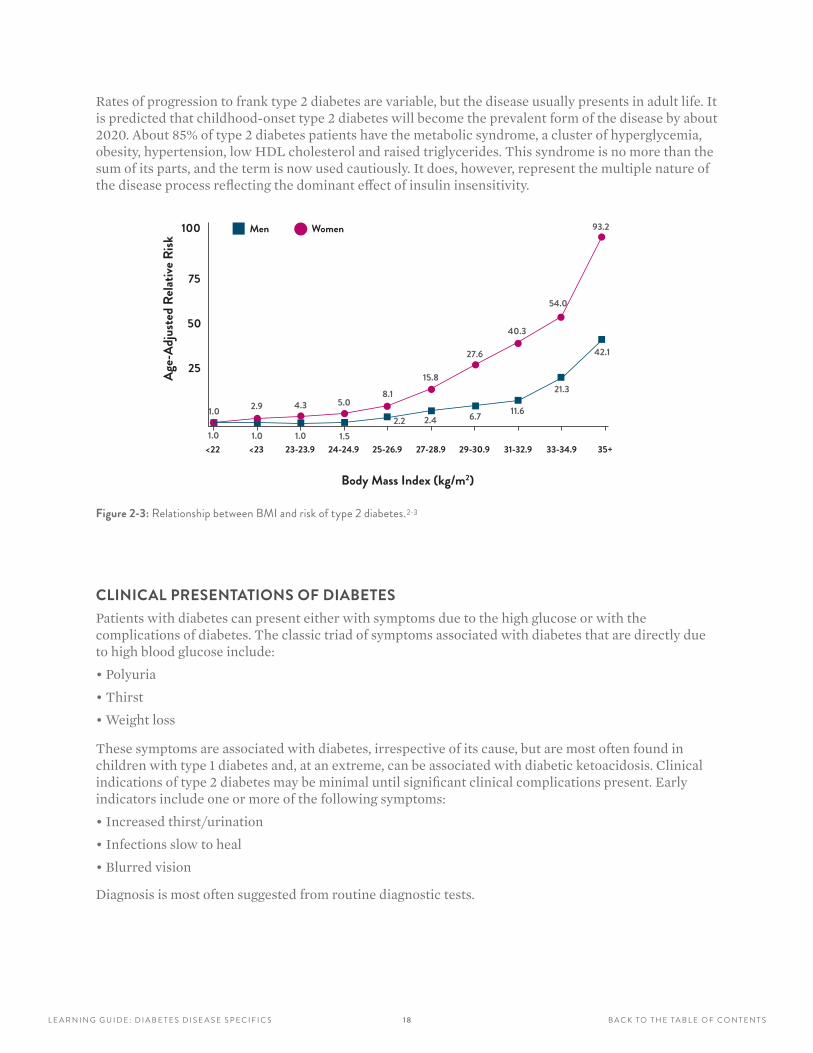
The heritability of type 2 diabetes is high, and genes associated with that risk include genes involved in the development of the pancreas and genes associated with the risk of obesity. A typical patient with type 2 diabetes is overweight (average body mass index [BMI] at presentation, >27 kg/m2), with a central distribution of obesity (often assessed by waist circumference or waist-hip ratio: Figure 2-3). Other independent risk factors for diabetes include being born to a mother with gestational diabetes mellitus, high birth weight or exceptionally low birth weight. Low birth weight predisposes both to diabetes and to obesity, as intrauterine malnutrition may preprogram the baby to respond inappropriately in a calorie-rich environment.
1 8L E A R N I N G G U I D E : D I A B E T E S D I S E A S E S P E C I F I C S B A C K TO T H E TA B L E O F C O N T E N T S
Rates of progression to frank type 2 diabetes are variable, but the disease usually presents in adult life. It is predicted that childhood-onset type 2 diabetes will become the prevalent form of the disease by about 2020. About 85% of type 2 diabetes patients have the metabolic syndrome, a cluster of hyperglycemia, obesity, hypertension, low HDL cholesterol and raised triglycerides. This syndrome is no more than the sum of its parts, and the term is now used cautiously. It does, however, represent the multiple nature of the disease process reflecting the dominant effect of insulin insensitivity.RELATIONSHIP BETWEEN BMI AND RISK OF TYPE 2 DIABETES
Age-
Adju
sted
Rela
tive R
isk
Men Women
1.0
Body Mass Index (kg/m2)
2.9
1.01.0 1.0
4.3 5.0
1.5
8.1
2.2 2.4 6.7 11.6
21.3
42.1
15.8
27.6
40.3
54.0
93.2
<22 <23 23-23.9 24-24.9 25-26.9 27-28.9 29-30.9 31-32.9 33-34.9 35+
25
50
75
100
Figure 2-3: Relationship between BMI and risk of type 2 diabetes .2-3
CLINICAL PRESENTATIONS OF DIABETESPatients with diabetes can present either with symptoms due to the high glucose or with the complications of diabetes. The classic triad of symptoms associated with diabetes that are directly due to high blood glucose include:
• Polyuria
• Thirst
• Weight loss
These symptoms are associated with diabetes, irrespective of its cause, but are most often found in children with type 1 diabetes and, at an extreme, can be associated with diabetic ketoacidosis. Clinical indications of type 2 diabetes may be minimal until significant clinical complications present. Early indicators include one or more of the following symptoms:
• Increased thirst/urination
• Infections slow to heal
• Blurred vision
Diagnosis is most often suggested from routine diagnostic tests.
1 9L E A R N I N G G U I D E : D I A B E T E S D I S E A S E S P E C I F I C S B A C K TO T H E TA B L E O F C O N T E N T S
TESTS TO IDENTIFY DIABETES
URINE GLUCOSEGlycosuria is not diagnostic of diabetes, but should be an alert for the need for further investigation. About 1% of the population has renal glycosuria, inherited as an autosomal dominant or recessive trait associated with a low renal threshold for glucose.
BLOOD GLUCOSE Blood glucose has been the gold standard for the diagnosis of diabetes, especially the OGTT. However, concern regarding reproducibility of the OGTT and limited compliance, added to the cumbersome nature of the test, has meant that interest has been focused on HbA1c. Fasting blood glucose remains a valuable diagnostic aid and its use depends on the medical practitioner. In disease management, blood glucose, estimated either by the patient using capillary blood or by laboratories using whole blood (venous or capillary), is valuable as it gives immediate information regarding the quality of blood glucose control. HbA1c differs in that it represents an average over the past three months, influenced most by the most recent 30 days.
HbA1c HbA1c has the advantage of being accurate, simple and, now, reproducible with worldwide standardization and harmonization of the assays. One advantage HbA1c has over glucose measurement is the lack of a fasting requirement and the difficulties with OGTT. The precise cutoff to diagnose diabetes remains controversial. A level of 6.5% (IFCC 48 mmol/mol) is specific for the diagnosis of diabetes in most studies, but lacks sensitivity and may miss many cases. The accuracy of the test is further complicated by many factors, which modify levels of HbA1c due to biological variability, genetic factors (such as red cell life span, ethnicity and hemoglobinopathies), environmental factors (e.g., iron deficiency) and interferences (e.g., vitamin C).
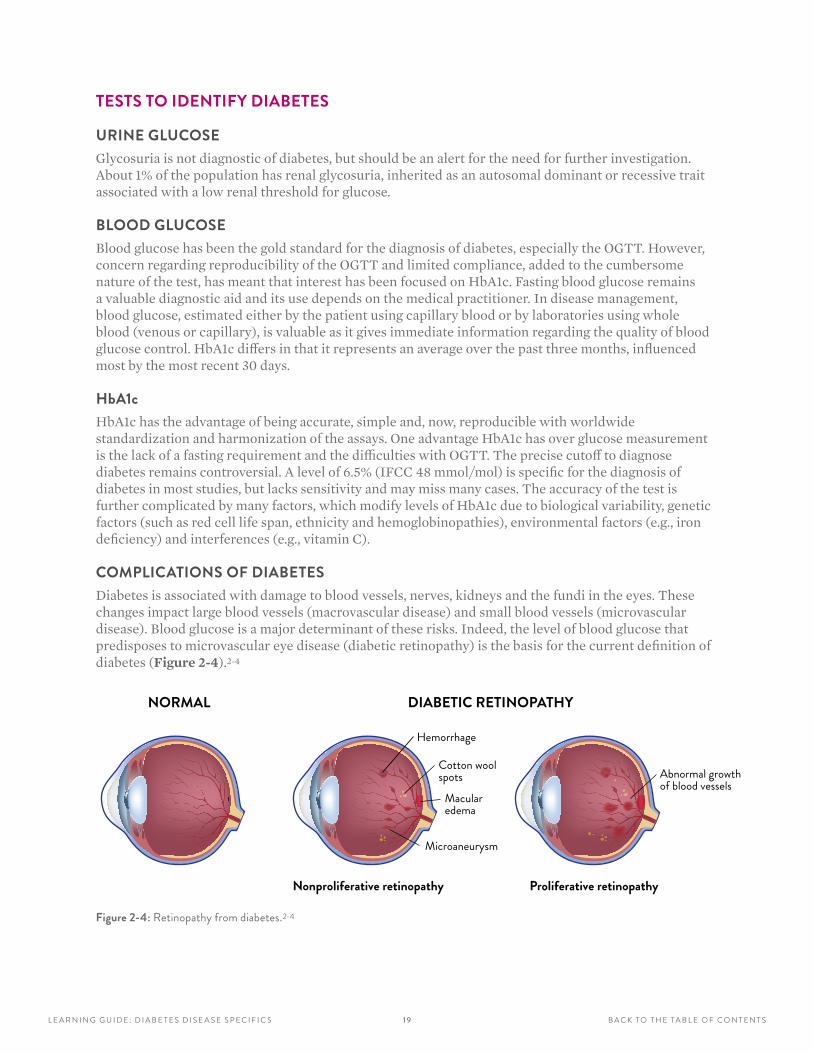
COMPLICATIONS OF DIABETESDiabetes is associated with damage to blood vessels, nerves, kidneys and the fundi in the eyes. These changes impact large blood vessels (macrovascular disease) and small blood vessels (microvascular disease). Blood glucose is a major determinant of these risks. Indeed, the level of blood glucose that predisposes to microvascular eye disease (diabetic retinopathy) is the basis for the current definition of diabetes (Figure 2-4).2-4
NORMAL DIABETIC RETINOPATHY
Nonproliferative retinopathy Proliferative retinopathy
Hemorrhage
Cotton wool spots
Macular edema
Microaneurysm
Abnormal growth of blood vessels
Figure 2-4: Retinopathy from diabetes .2-4
20L E A R N I N G G U I D E : D I A B E T E S D I S E A S E S P E C I F I C S B A C K TO T H E TA B L E O F C O N T E N T S
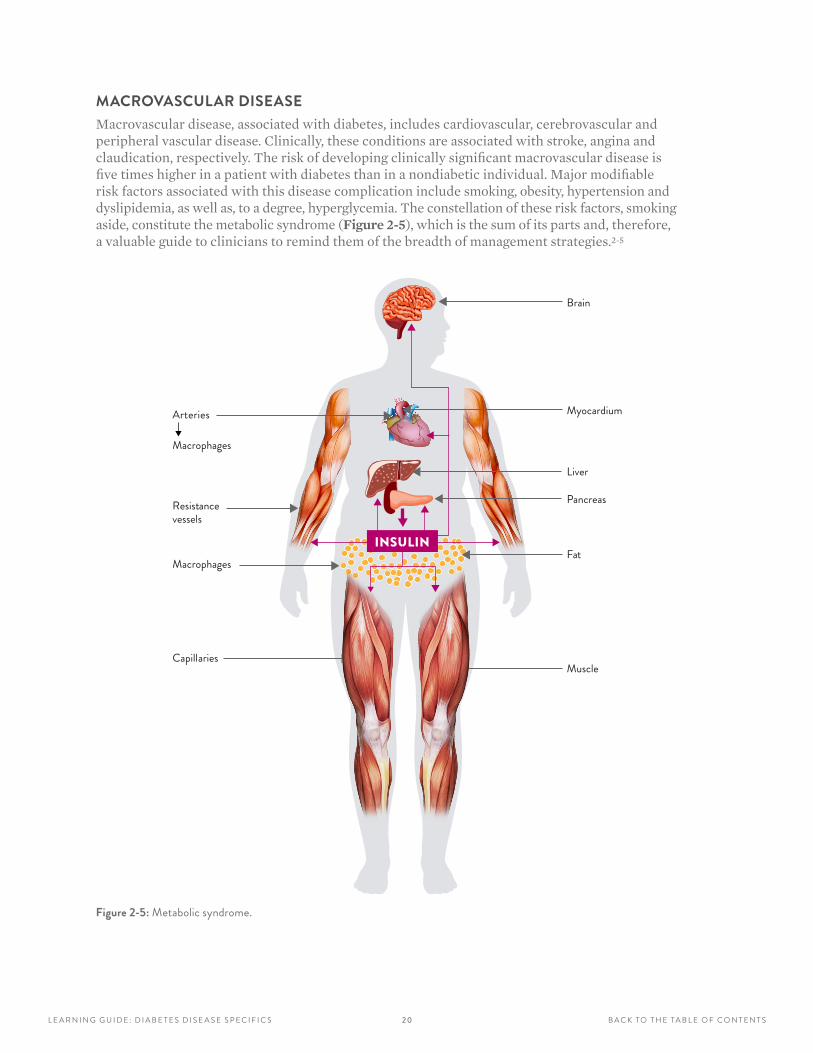
MACROVASCULAR DISEASEMacrovascular disease, associated with diabetes, includes cardiovascular, cerebrovascular and peripheral vascular disease. Clinically, these conditions are associated with stroke, angina and claudication, respectively. The risk of developing clinically significant macrovascular disease is five times higher in a patient with diabetes than in a nondiabetic individual. Major modifiable risk factors associated with this disease complication include smoking, obesity, hypertension and dyslipidemia, as well as, to a degree, hyperglycemia. The constellation of these risk factors, smoking aside, constitute the metabolic syndrome (Figure 2-5), which is the sum of its parts and, therefore, a valuable guide to clinicians to remind them of the breadth of management strategies.2-5
INSULIN
Brain
Myocardium
Macrophages
vesselsResistance Pancreas
Liver
Macrophages
Arteries
MuscleCapillaries
Fat
Figure 2-5: Metabolic syndrome .
2 1L E A R N I N G G U I D E : D I A B E T E S D I S E A S E S P E C I F I C S B A C K TO T H E TA B L E O F C O N T E N T S
MICROVASCULAR DISEASEMicrovascular disease is associated with retinopathy, neuropathy and nephropathy, typically resulting from damage to smaller capillaries. Clinically, these conditions can be associated with visual disturbances, numbness of the feet, and protein in the urine, respectively. At worst, these same microvascular complications can lead to blindness, foot ulcers/amputations and kidney failure. Major modifiable risk factors associated with microvascular disease are the same as for macrovascular disease, i.e., smoking, obesity, hypertension, dyslipidemia and hyperglycemia, but with hyperglycemia being a more dominant factor. Given the differential effect of hyperglycemia on microvascular disease compared with macrovascular disease, it has been said that diabetes is a condition encompassing two diseases: one disease associated with macrovascular disease (and its associated risk factors) and the other associated with microvascular disease (predominantly due to hyperglycemia).
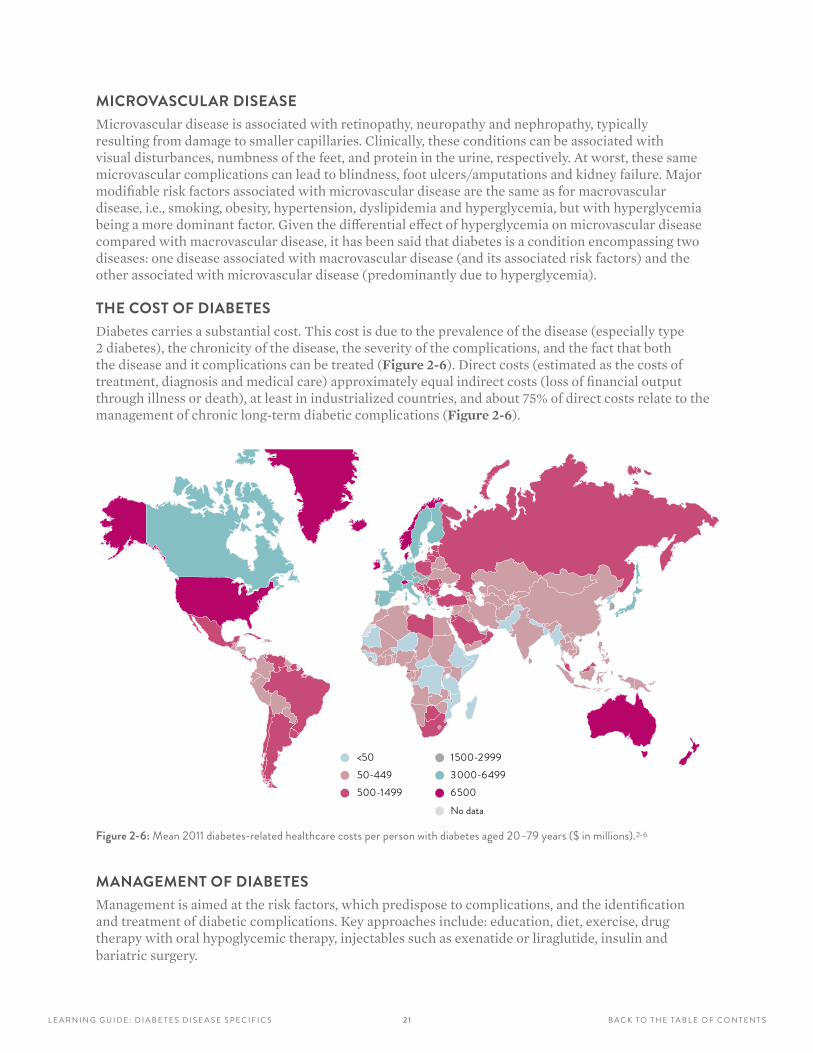
THE COST OF DIABETESDiabetes carries a substantial cost. This cost is due to the prevalence of the disease (especially type 2 diabetes), the chronicity of the disease, the severity of the complications, and the fact that both the disease and it complications can be treated (Figure 2-6). Direct costs (estimated as the costs of treatment, diagnosis and medical care) approximately equal indirect costs (loss of financial output through illness or death), at least in industrialized countries, and about 75% of direct costs relate to the management of chronic long-term diabetic complications (Figure 2-6).
<5050-449500-1499
1500-2999
No data
3000-64996500
Figure 2-6: Mean 2011 diabetes-related healthcare costs per person with diabetes aged 20–79 years ($ in millions) .2-6
MANAGEMENT OF DIABETES Management is aimed at the risk factors, which predispose to complications, and the identification and treatment of diabetic complications. Key approaches include: education, diet, exercise, drug therapy with oral hypoglycemic therapy, injectables such as exenatide or liraglutide, insulin and bariatric surgery.
2 2L E A R N I N G G U I D E : D I A B E T E S D I S E A S E S P E C I F I C S B A C K TO T H E TA B L E O F C O N T E N T S
TYPE 1 DIABETES Children with type 1 diabetes usually require insulin treatment from the time of diagnosis. However, the majority of adult patients with autoimmune diabetes do not require insulin, at least initially, and the majority remain insulin-independent for many years. Insulin regimes include either multiple insulin injections, with a mix of fast-acting and slow-acting insulin, or continuous subcutaneous insulin infusion pumps.
TYPE 2 DIABETES Patients with type 2 diabetes are usually managed with oral medications or injections other than insulin. Treatment is typically cumulative, with diet and exercise initially, adding oral medication and then progressively more tablets or injectables (as a GLP-1 agonist or insulin). Insulin regimes often start with slow-acting insulin at bedtime, but may then progress to similar regimes as for type 1 diabetes, though usually not including subcutaneous insulin infusion pumps. The role of bariatric surgery remains uncertain, but surgery is offered to patients with gross obesity and hyperglycemia refractory to conventional treatment. The number of therapies, the variable responses to them and the range of side effects has led to a more personalized approach, as set out in the most recent guidelines. Oral therapies currently used include metformin, sulfonylureas, glinides, dipeptidyl peptidase IV (DPPIV) inhibitors, sodium-glucose transporter (SGLT2) inhibitors, glitazones and acarbose. Injectables for therapy include GLP-1 agonists and insulin.
DIET AND EXERCISESince excess caloric intake and inadequate exercise are central to the epidemic of type 2 diabetes, it follows that diet and exercise are key to the management of type 2 diabetes and indeed to all forms of diabetes, as well as efforts to prevent progression of impaired glucose tolerance to diabetes. Long-term adherence to any dietary plan is notoriously difficult. Dietary advice is largely empirical. A reasonable approach is to suggest that the diet be no different from that proposed for the healthy population, perhaps with an emphasis on avoidance of refined sugar. Overweight patients (BMI 25–30 kg/m2) should be started on a weight-reducing diet of approximately 4–6 MJ (megajoules, or 1000–1600 kcal) daily (Figure 2-7). While low-fat diets have only a small impact on the serum cholesterol, they can limit increases in serum triglycerides.
Alcohol should not be forbidden, but its energy content should be taken into account: aim for <28 units of alcohol per week in men and <21 units per week in women. Patients on insulin should avoid alcoholic binges as they may precipitate severe hypoglycemia. One unit of alcohol is approximately one glass of wine or one shot of vodka. A daily salt intake of no more than 2.3 g per day is recommended to limit hypertension.
MANAGEMENT OF DIABETIC COMPLICATIONS The management of diabetic complications is dominated by the prevention of these complications. Much of the time spent on diabetes care is based on the premise that prevention is not only feasible, but also cost-effective. The management of macrovascular disease in diabetes is the same as that for cardiovascular, cerebrovascular and peripheral vascular disease in general. By contrast, microvascular complications are unique to diabetes. So the treatment of diabetic retinopathy includes laser photocoagulation for proliferative retinopathy or anticytokine therapy for macular oedema, as well as vitrectomy for an unresolved vitreous hemorrhage. Angiotensin receptor inhibitors are employed early to limit progression to diabetic nephropathy.

2 3L E A R N I N G G U I D E : D I A B E T E S D I S E A S E S P E C I F I C S B A C K TO T H E TA B L E O F C O N T E N T S
M A N A G I N G D I A B E T E S
Blood Sugar1
2
3
4
5
6
7
8
9
10
Figure 2-7. Managing diabetes with diet and exercise .2-7
24L E A R N I N G G U I D E : D I A B E T E S D I S E A S E S P E C I F I C S B A C K TO T H E TA B L E O F C O N T E N T S
1. There are many different forms of diabetes mellitus, but the two major forms that account for 98% of cases are type 1 diabetes and type 2 diabetes. Approximately what percentage accounts for type 2 diabetes?
A 75%
B 90%
C 50%
D 10%
2. Diabetes is a worldwide problem, expected by the WHO to impact how many million people by 2030?
A 238
B 100
C 438
D 450
3. Diabetes is a condition in which:
A The body does not produce enough insulin
B Red blood cells are misshapen
C The body produces insulin that does not function effectively
D A and C
4. Type 1 diabetes is classified primarily by:
A Age of patient at diagnosis
B Insulin dependence
C Insulin resistance
D Genetic predisposition
E All of the above
5. About 85% of type 2 diabetes patients have metabolic syndrome, which is characterized by a cluster of conditions, including:
A Hyperglycemia
B Obesity
C Hypertension
D Low HDL cholesterol and elevated triglycerides
E All of the above
6. Type 1 diabetes is due to the interaction of the environment with an underlying genetic susceptibility leading to an autoimmune response, which damages or destroys insulin-secreting cells.
A True
B False
7. Major modifiable risk factors associated with microvascular disease and macrovascular disease include:
A Smoking
B Obesity, hypertension and dyslipidemia
C Hyperglycemia
D All of the above
8. Microvascular disease is associated with retinopathy, neuropathy and nephropathy, typically resulting from damage to smaller capillaries. Clinically, these conditions can lead to all of the below, except:
A Blindness
B Kidney failure
C Heart attacks
D Foot ulcers/amputations
REVIEW QUESTIONS: SECTIONS 1 AND 2Answers are provided at the end of this Learning Guide.
2 5L E A R N I N G G U I D E : H b A 1 c M E T H O D S : A S S AY M E T H O D O L O G I E S A N D I F C C S TA N D A R D I Z AT I O N
B A C K TO T H E TA B L E O F C O N T E N T S
LEARNING OBJECTIVES
After completing this section, you will be able to:
• Describe the various reference and manufacturing methods for the measurement of HbA1c
• Explain the impact of HbA1c variants, derivatives and sample preanalytical conditions on measurement methods
• Identify the reference methodology of the IFCC standardization system
• Understand and apply the IFCC Quality Targets Model for HbA1c at the level of an individual laboratory and of a group of laboratories
SECTION 3HbA1c METHODS: ASSAY METHODOLOGIES AND IFCC STANDARDIZATION
2 6L E A R N I N G G U I D E : H b A 1 c M E T H O D S : A S S AY M E T H O D O L O G I E S A N D I F C C S TA N D A R D I Z AT I O N
B A C K TO T H E TA B L E O F C O N T E N T S
HbA1c ASSAY METHODOLOGIESEffective and efficient monitoring of diabetic control and diagnosis requires a good marker for estimation of the average blood glucose over a longer period. HbA1c meets this requirement for such a reliable compass to guide therapy. HbA1c is the fraction of hemoglobin that has glucose attached to the N-terminal valine of the β-chain. The glycation reaction depends on how long red blood cells are in circulation and the ambient glucose levels. As red cells have a lifespan of 3–4 months, HbA1c reflects the average blood glucose levels in the preceding three months.
The importance of HbA1c as a major diagnostic tool is well recognized, and therefore it is not surprising that many commercial assays have been developed. Specificities and selectivities of the methods are different and, with them, potentially, the HbA1c values. To enable optimal clinical use, results among different methods should be equivalent. The IFCC Reference System for HbA1c serves as the analytical anchor for the standardization of all commercial HbA1c methods. This chapter deals with the analytical principles of mainstream commercial methods and the IFCC Reference System.
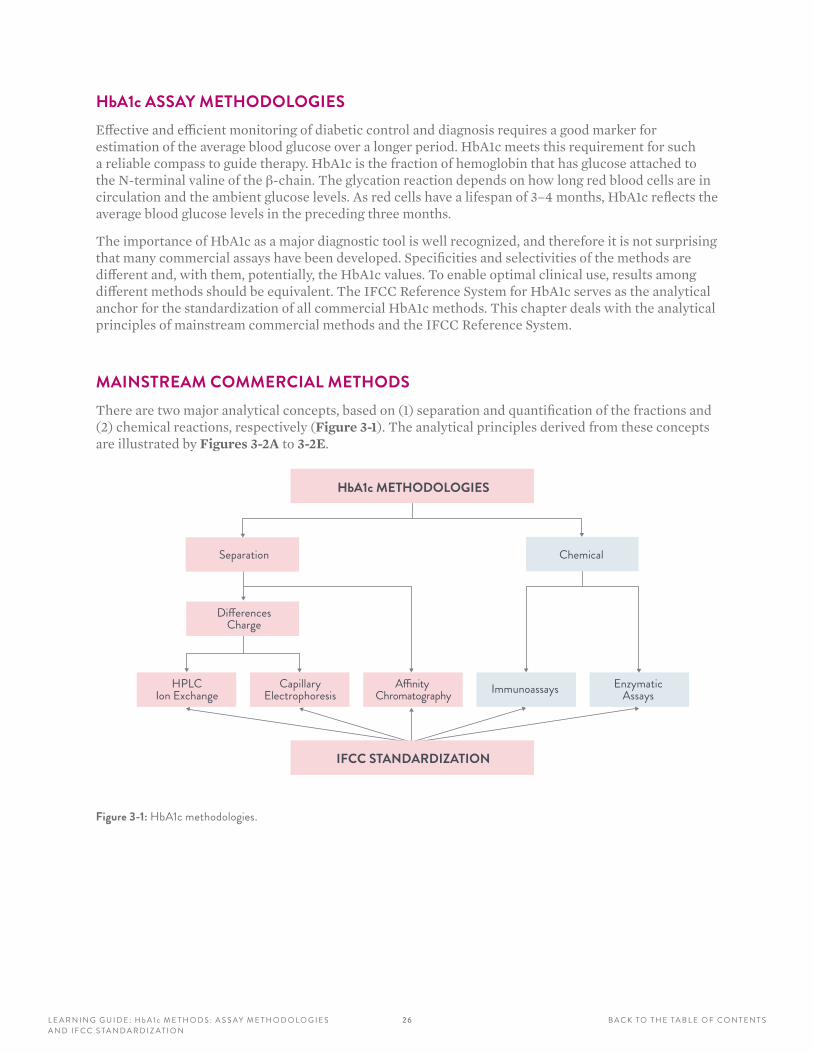
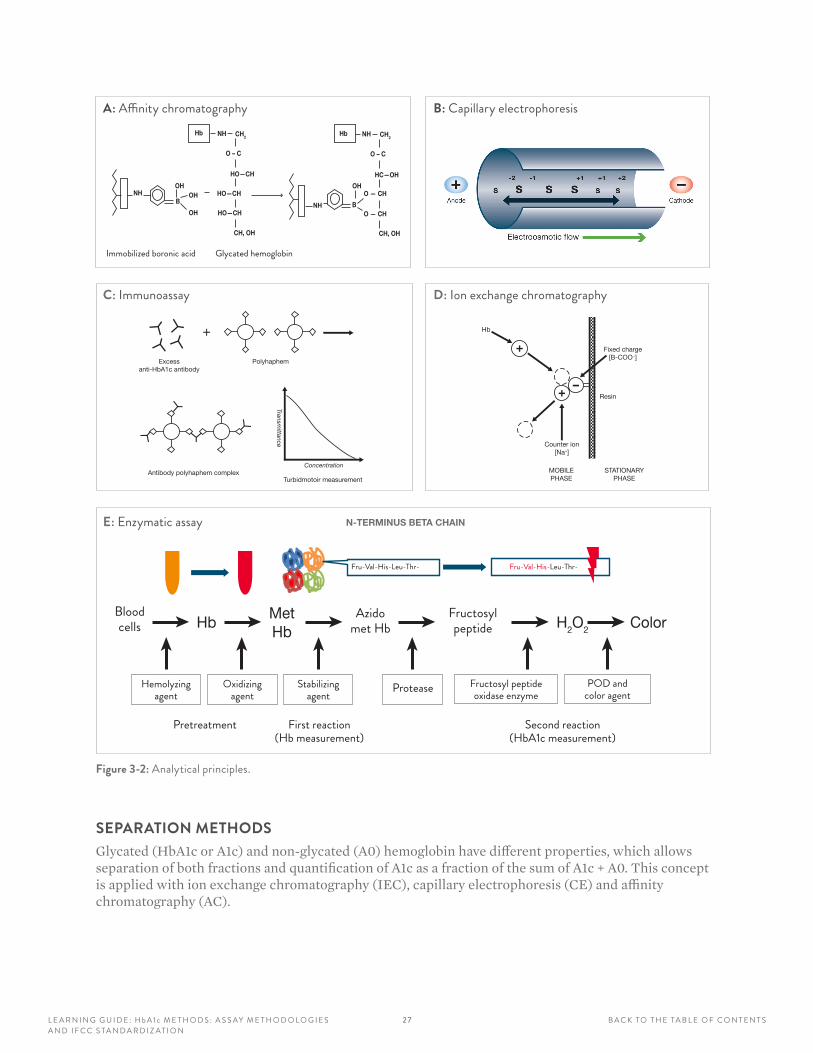
MAINSTREAM COMMERCIAL METHODSThere are two major analytical concepts, based on (1) separation and quantification of the fractions and (2) chemical reactions, respectively (Figure 3-1). The analytical principles derived from these concepts are illustrated by Figures 3-2A to 3-2E.
HbA1c METHODOLOGIES
CapillaryElectrophoresis
HPLCIon Exchange
A�nity Chromatography
Separation
Di�erencesCharge
Chemical
Immunoassays EnzymaticAssays
IFCC STANDARDIZATION
Figure 3-1: HbA1c methodologies .
2 7L E A R N I N G G U I D E : H b A 1 c M E T H O D S : A S S AY M E T H O D O L O G I E S A N D I F C C S TA N D A R D I Z AT I O N
B A C K TO T H E TA B L E O F C O N T E N T S
Figure 3-2: Analytical principles .
SEPARATION METHODSGlycated (HbA1c or A1c) and non-glycated (A0) hemoglobin have different properties, which allows separation of both fractions and quantification of A1c as a fraction of the sum of A1c + A0. This concept is applied with ion exchange chromatography (IEC), capillary electrophoresis (CE) and affinity chromatography (AC).
E: Enzymatic assay
B: Capillary electrophoresis
HbMetHb
H2O2 Color
A: Affinity chromatography
NH CH2Hb
O – C
HO—CH
HO—CH
HO—CH
CH, OH
NHOH
OH
OH
B
Hb NH CH2
O – C
HC—OH
O — CH
O — CH
CH, OH
OH
NH B
Immobilized boronic acid Glycated hemoglobin
Bloodcells
Hemolyzingagent
First reaction(Hb measurement)
Stabilizingagent
Fructosyl peptideoxidase enzyme
POD andcolor agent
Oxidizingagent
Fructosylpeptide
Azidomet Hb
N-TERMINUS BETA CHAIN
Fru-Val-His-Leu-Thr-Fru-Val-His-Leu-Thr-
C: Immunoassay
Excessanti-HbA1c antibody
Polyhaphem
Antibody polyhaphem complexTurbidmotoir measurement
Concentration
Transmittance
+
D: Ion exchange chromatography
Counter ion[Na+]
MOBILEPHASE
STATIONARYPHASE
Resin
Fixed charge[B-COO–]
Hb
+
+–
Pretreatment Second reaction(HbA1c measurement)
Protease
2 8L E A R N I N G G U I D E : H b A 1 c M E T H O D S : A S S AY M E T H O D O L O G I E S A N D I F C C S TA N D A R D I Z AT I O N
B A C K TO T H E TA B L E O F C O N T E N T S
Ion Exchange Chromatography (IEC)
Due to the attachment of glucose to the β-valine terminal, the isoelectric point of A1c differs by 0.02 pI units from A0. This is sufficient isoelectric difference to allow separation with IEC, but is so small that only dedicated HPLC instruments will perform satisfactorily.3-1 Samples are assayed one by one, and this stresses manufacturers to balance between highest throughput and quality of separation. Apart from A0 and A1c, other hemoglobin fractions like fetal hemoglobin (HbF), minor hemoglobins (HbA1a/b) and carbamylated hemoglobin, as well as genetic variants like the sickle cell hemoglobin (HbS), are visible in the chromatogram. This can be seen as an advantage (detection of variants) or disadvantage (potential interference on HbA1c).
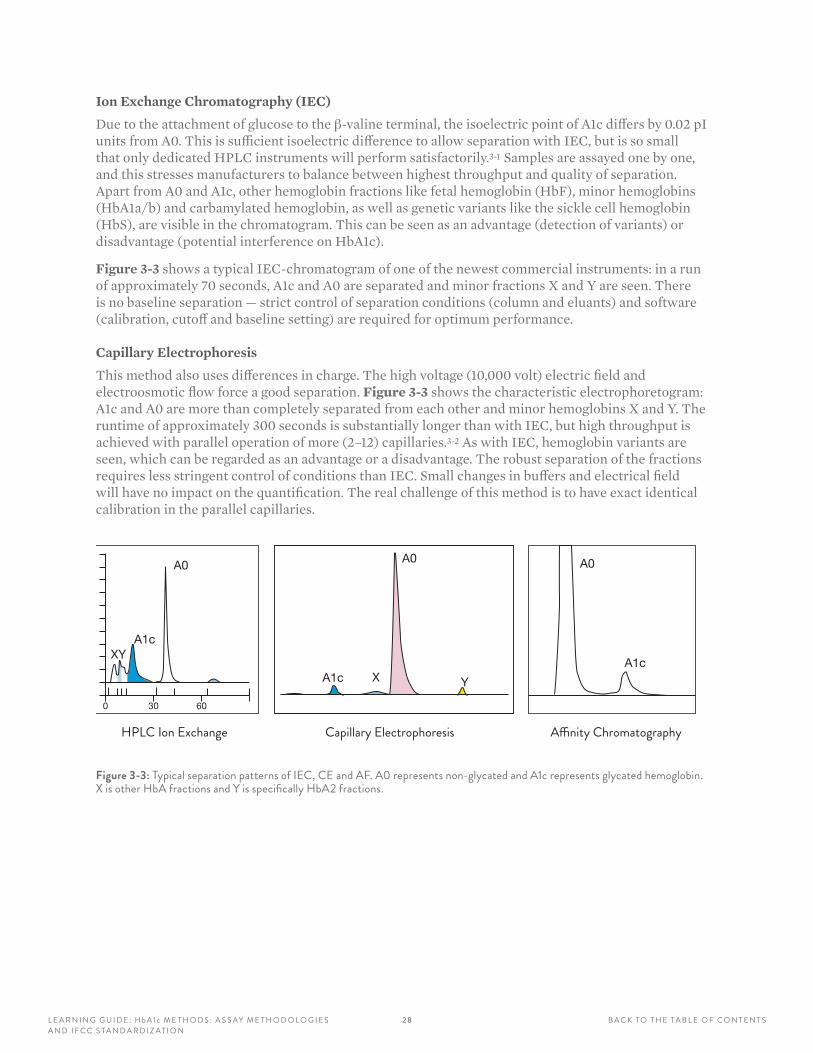
Figure 3-3 shows a typical IEC-chromatogram of one of the newest commercial instruments: in a run of approximately 70 seconds, A1c and A0 are separated and minor fractions X and Y are seen. There is no baseline separation — strict control of separation conditions (column and eluants) and software (calibration, cutoff and baseline setting) are required for optimum performance.
Capillary Electrophoresis
This method also uses differences in charge. The high voltage (10,000 volt) electric field and electroosmotic flow force a good separation. Figure 3-3 shows the characteristic electrophoretogram: A1c and A0 are more than completely separated from each other and minor hemoglobins X and Y. The runtime of approximately 300 seconds is substantially longer than with IEC, but high throughput is achieved with parallel operation of more (2–12) capillaries.3-2 As with IEC, hemoglobin variants are seen, which can be regarded as an advantage or a disadvantage. The robust separation of the fractions requires less stringent control of conditions than IEC. Small changes in buffers and electrical field will have no impact on the quantification. The real challenge of this method is to have exact identical calibration in the parallel capillaries.DIFFERENCE IN CHARGE: SEPARATION PATTERNS
XYA1c
A0
0 30 60
HPLC Ion Exchange Capillary Electrophoresis
A0
YXA1c
A0
A1c
A�nity Chromatography
Figure 3-3: Typical separation patterns of IEC, CE and AF . A0 represents non-glycated and A1c represents glycated hemoglobin . X is other HbA fractions and Y is specifically HbA2 fractions .
2 9L E A R N I N G G U I D E : H b A 1 c M E T H O D S : A S S AY M E T H O D O L O G I E S A N D I F C C S TA N D A R D I Z AT I O N
B A C K TO T H E TA B L E O F C O N T E N T S
Affinity Chromatography
Affinity chromatography evaluates elution fractions of both glycated hemoglobin (GHb, mostly but not exclusively HbA1c) and nonglycated hemoglobin (NGHb, mostly but not exclusively HbA0). Glucose in GHb has affinity for boronic acid, whereas NGHb does not. Therefore NGHb will run freely through a column with resin coated with boronic acid, while GHb will be delayed and thus separated from NGHb.3-3 This results in AF-chromatogram, where, unlike with IEC and CE, NGHb comes first followed by GHb (Figure 3-3).
Another characteristic is that only two fractions are seen: glycated and non-glycated hemoglobin, which elute irrespective of the molecular structure of the protein chains. The implication is that variants cannot be distinguished: glycated variants elute in the GHb and non-glycated variants in the NGHb fraction. Again, this can be seen as an advantage or a disadvantage. Glycation is not limited to the N-valine terminal of the β-chain, but occurs for an additional 40% at some 10 lysine residuals in both α and β chains. These “other” glycohemoglobins elute in the GHb fraction. As they are formed in proportion to HbA1c, GHb can be expressed in HbA1c units when the instrument is calibrated properly. A prerequisite for equivalent results to the calibration standards is that hemoglobins of the patient have β chains. This is true for all major hemoglobin variants, with the exception of fetal hemoglobin (HbF). As HbF is missing the N-valine terminal, it has a lower glycation rate, so when present in substantial amounts (arbitrary >10%, normal is below 2%), results will be falsely low.
CHEMICAL METHODSChemical methods require two independent assays of HbA1c and total hemoglobin, respectively. HbA1c is measured on the basis of a specific chemical reaction to the glycated N-terminal valine of the β chain. In parallel, total hemoglobin is measured photometrically. Combination of both test results allows calculating HbA1c as a fraction of total hemoglobin. The fact that HbA1c is derived from two tests can have a negative impact on precision. The advantage of chemical methods is that they can be performed on general chemistry analyzers.
Immunoassays
An excess of anti-HbA1c antibodies are combined with the patient sample. The antibodies bind to HbA1c, resulting in an immunolatex complex formation. The resulting immune complexes lead to cloudiness, which can be measured photometrically with turbidimeters, nephelometers or spectrophotometers.3-4 Total hemoglobin is measured bichromatically during the preincubation phase in the same cuvette. Hemoglobin variants are not detected, and in most assays do not interfere as long as the antibody specificity is appropriate. Only when substantial amounts of HbF and HbA2 are present (variants without β chains) can falsely reduced results be obtained. As with all immunoassays, there is no linear relation between concentration and signal, making multipoint calibration a requirement for unbiased results over the relevant HbA1c range.
Enzymatic Assays
In enzymatic assays, a fructosyl peptide protease is used to cleave the β-chain, liberating the fructosyl peptide. The resulting peptide, mostly the dipeptide, is allowed to react with fructosyl peptide oxidase. The HbA1c concentration is measured by determining the resulting hydrogen peroxide by a color-generating reactant. In parallel, total hemoglobin is measured photometrically as methemoglobin formed in the pretreatment process.3-5 There is no interference of variants (except potentially elevated HbF or HbA2 due to the missing β chains in the sample). Bilirubin at high concentrations may potentially interfere and must be understood.
3 0L E A R N I N G G U I D E : H b A 1 c M E T H O D S : A S S AY M E T H O D O L O G I E S A N D I F C C S TA N D A R D I Z AT I O N
B A C K TO T H E TA B L E O F C O N T E N T S
IFCC STANDARDIZATION
HISTORYThe specificities and selectivities of commercial methods are different, which impacts the HbA1c results, especially of uncalibrated methods. During the first years after the discovery of HbA1c, each method (or even each laboratory) had its own reference values. For optimal clinical use (e.g., uniform clinical guidelines, comparison of scientific studies) equivalence of results is desirable. Equivalence can be achieved with harmonization or standardization.3-6 With harmonization, commercial methods are calibrated against a designated comparison method and material so all methods align to each other. With standardization, calibration is against a scientifically sound reference measurement procedure. One could say that harmonization leads to a relative truth and standardization to the absolute truth.
The need for equivalent results was well recognized and inspired several national harmonization initiatives. In the United States, the designated method was the same method used in the Diabetes Control and Complications Trial (DCCT), which has been shown to be stable over several years and was directly linked to clinical data. This led to a nationwide program with international affiliations organized by the National Glycohemoglobin Standardization Program (NGSP).3-7 Similar initiatives achieved harmonization in Japan (JDS/JSCC) and Sweden (Mono-S). Unfortunately, all were based on designated comparison methods, and it is not surprising that results of these chosen methods were different. This situation caused confusion, and therefore the IFCC developed a reference method to achieve worldwide standardization.
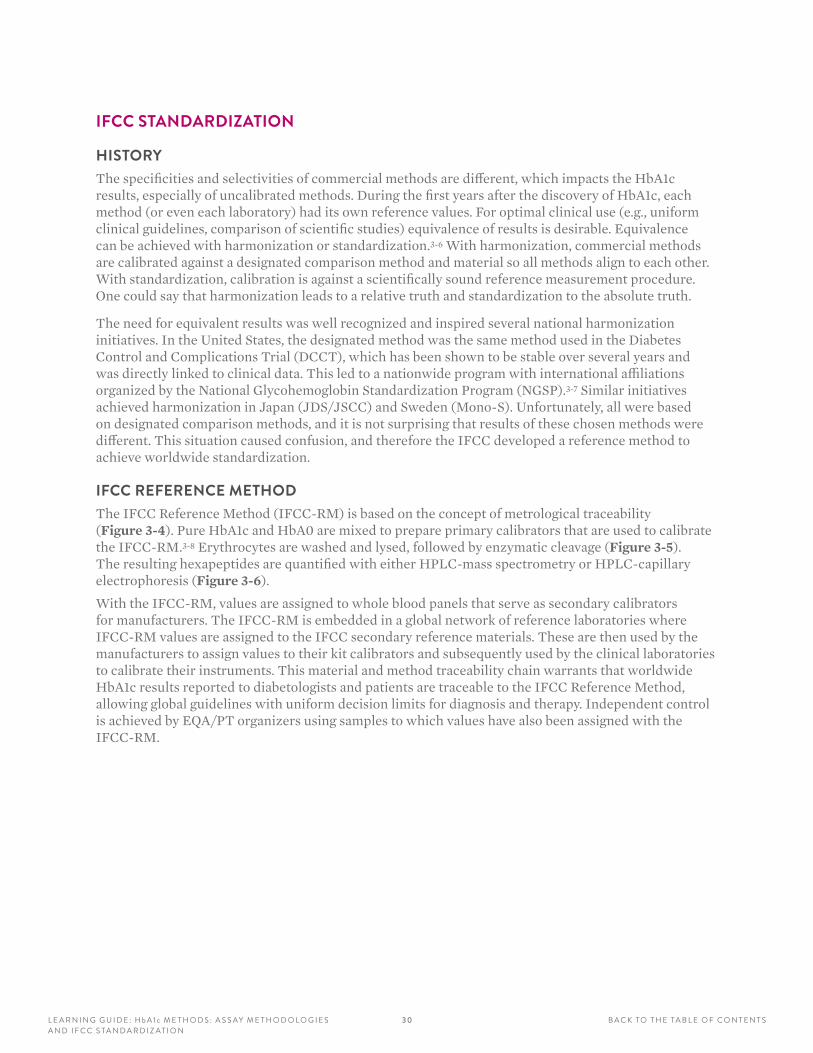
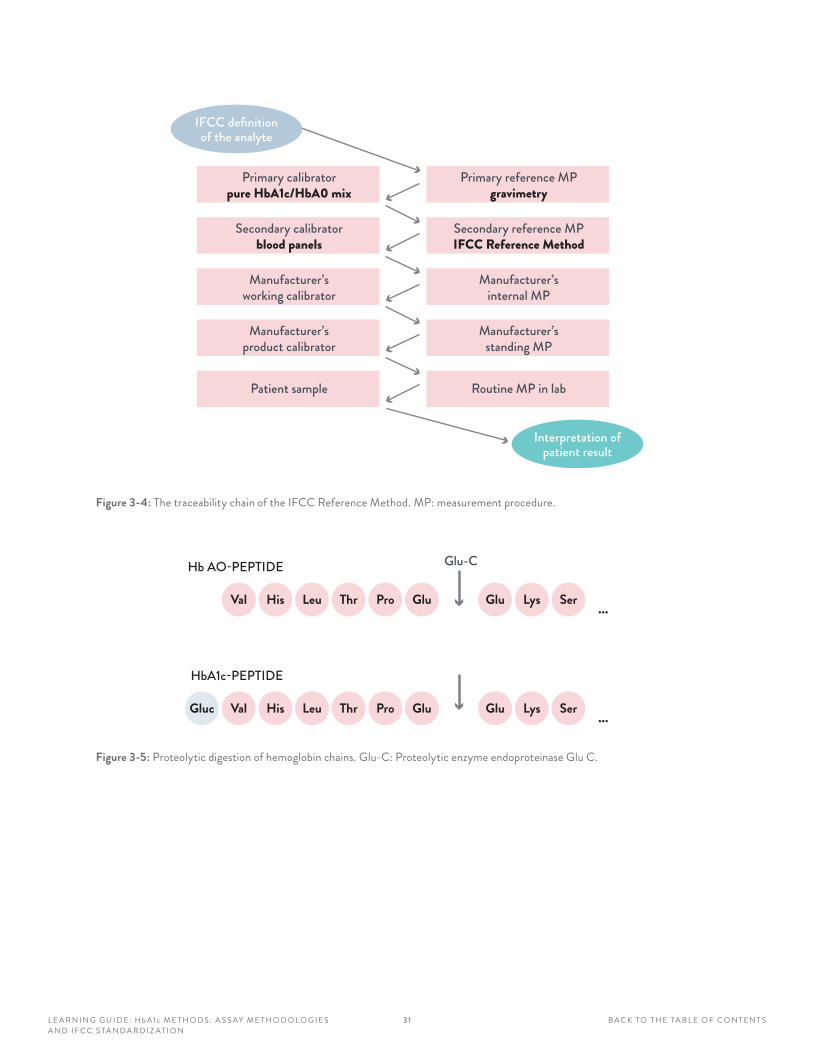
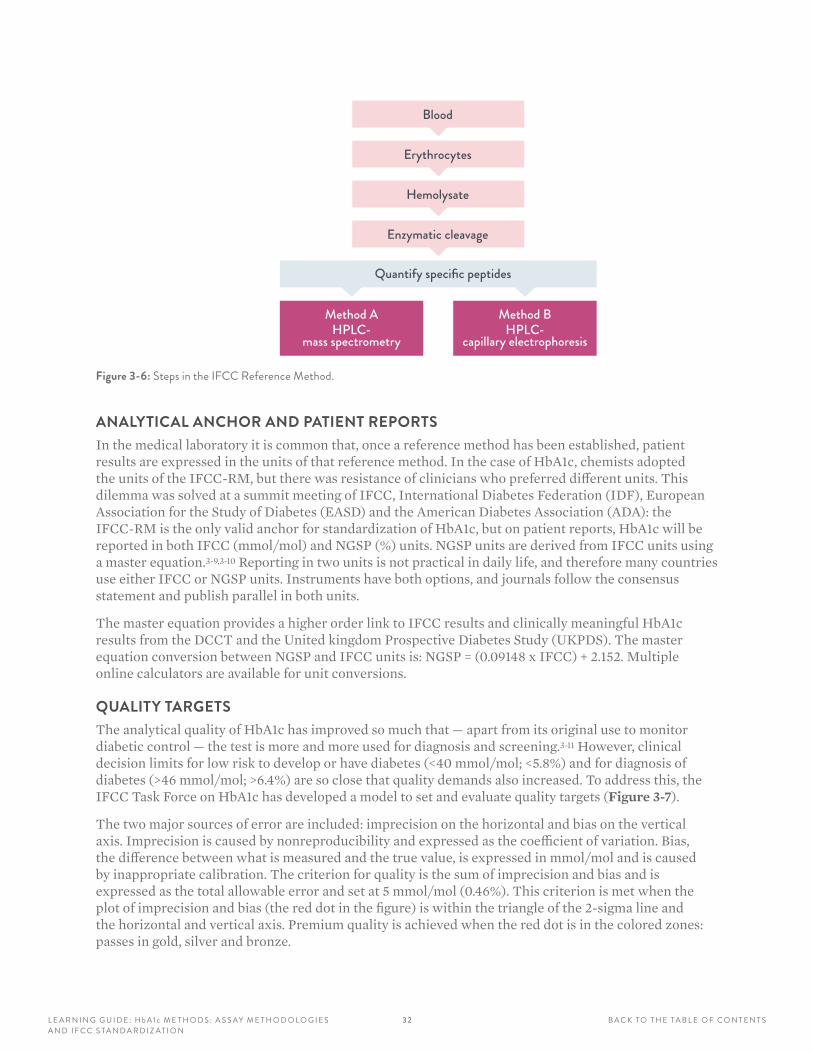
IFCC REFERENCE METHODThe IFCC Reference Method (IFCC-RM) is based on the concept of metrological traceability (Figure 3-4). Pure HbA1c and HbA0 are mixed to prepare primary calibrators that are used to calibrate the IFCC-RM.3-8 Erythrocytes are washed and lysed, followed by enzymatic cleavage (Figure 3-5). The resulting hexapeptides are quantified with either HPLC-mass spectrometry or HPLC-capillary electrophoresis (Figure 3-6).
With the IFCC-RM, values are assigned to whole blood panels that serve as secondary calibrators for manufacturers. The IFCC-RM is embedded in a global network of reference laboratories where IFCC-RM values are assigned to the IFCC secondary reference materials. These are then used by the manufacturers to assign values to their kit calibrators and subsequently used by the clinical laboratories to calibrate their instruments. This material and method traceability chain warrants that worldwide HbA1c results reported to diabetologists and patients are traceable to the IFCC Reference Method, allowing global guidelines with uniform decision limits for diagnosis and therapy. Independent control is achieved by EQA/PT organizers using samples to which values have also been assigned with the IFCC-RM.
3 1L E A R N I N G G U I D E : H b A 1 c M E T H O D S : A S S AY M E T H O D O L O G I E S A N D I F C C S TA N D A R D I Z AT I O N
B A C K TO T H E TA B L E O F C O N T E N T S
Secondary reference MPIFCC Reference Method
Primary calibratorpure HbA1c/HbA0 mix
Secondary calibratorblood panels
Manufacturer’sworking calibrator
Manufacturer’sproduct calibrator
Patient sample
Primary reference MPgravimetry
Manufacturer’sinternal MP
Manufacturer’sstanding MP
Routine MP in lab
Interpretation ofpatient result
IFCC definitionof the analyte
Figure 3-4: The traceability chain of the IFCC Reference Method . MP: measurement procedure .
Val His Leu Thr Pro Glu
Hb AO-PEPTIDE
Glu Lys Ser
Glu-C
...
Val His Leu Thr Pro Glu
HbA1c-PEPTIDE
Glu Lys Ser ...Gluc
Figure 3-5: Proteolytic digestion of hemoglobin chains . Glu-C: Proteolytic enzyme endoproteinase Glu C .
32L E A R N I N G G U I D E : H b A 1 c M E T H O D S : A S S AY M E T H O D O L O G I E S A N D I F C C S TA N D A R D I Z AT I O N
B A C K TO T H E TA B L E O F C O N T E N T S
Erythrocytes
Hemolysate
Enzymatic cleavage
Quantify specific peptides
Method BHPLC-
capillary electrophoresis
Method AHPLC-
mass spectrometry
Blood
Figure 3-6: Steps in the IFCC Reference Method .
ANALYTICAL ANCHOR AND PATIENT REPORTSIn the medical laboratory it is common that, once a reference method has been established, patient results are expressed in the units of that reference method. In the case of HbA1c, chemists adopted the units of the IFCC-RM, but there was resistance of clinicians who preferred different units. This dilemma was solved at a summit meeting of IFCC, International Diabetes Federation (IDF), European Association for the Study of Diabetes (EASD) and the American Diabetes Association (ADA): the IFCC-RM is the only valid anchor for standardization of HbA1c, but on patient reports, HbA1c will be reported in both IFCC (mmol/mol) and NGSP (%) units. NGSP units are derived from IFCC units using a master equation.3-9,3-10 Reporting in two units is not practical in daily life, and therefore many countries use either IFCC or NGSP units. Instruments have both options, and journals follow the consensus statement and publish parallel in both units.
The master equation provides a higher order link to IFCC results and clinically meaningful HbA1c results from the DCCT and the United kingdom Prospective Diabetes Study (UKPDS). The master equation conversion between NGSP and IFCC units is: NGSP = (0.09148 x IFCC) + 2.152. Multiple online calculators are available for unit conversions.
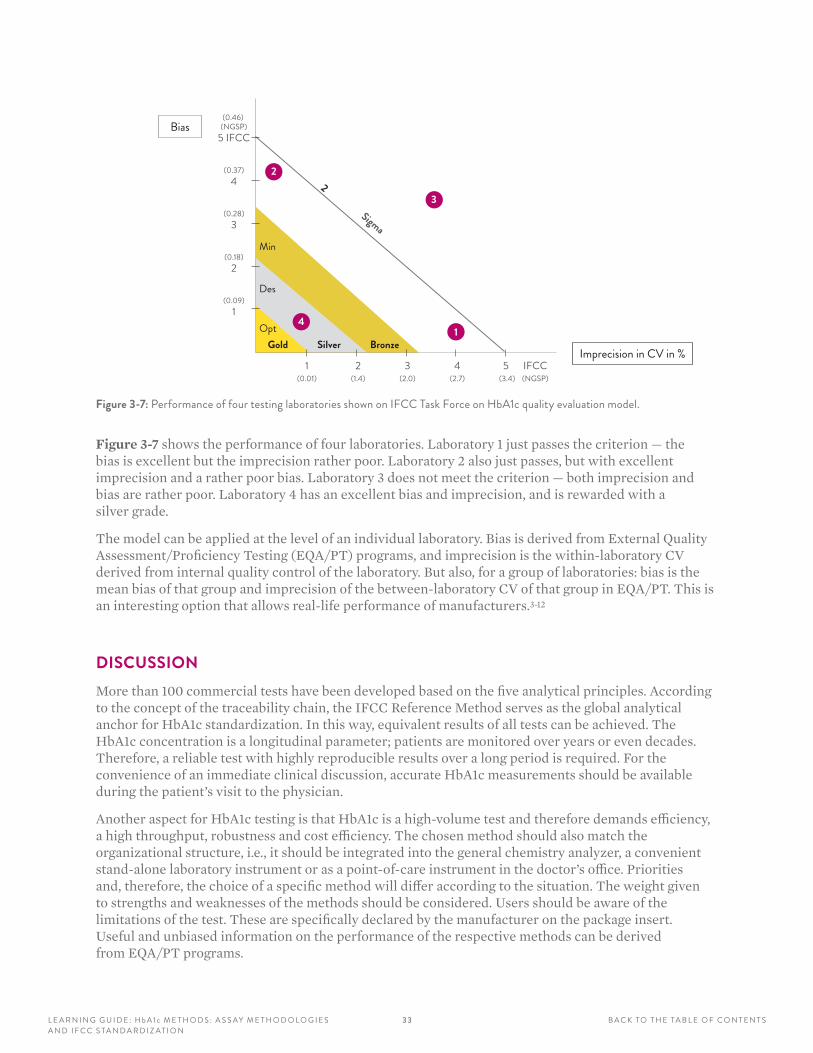
QUALITY TARGETSThe analytical quality of HbA1c has improved so much that — apart from its original use to monitor diabetic control — the test is more and more used for diagnosis and screening.3-11 However, clinical decision limits for low risk to develop or have diabetes (<40 mmol/mol; <5.8%) and for diagnosis of diabetes (>46 mmol/mol; >6.4%) are so close that quality demands also increased. To address this, the IFCC Task Force on HbA1c has developed a model to set and evaluate quality targets (Figure 3-7).
The two major sources of error are included: imprecision on the horizontal and bias on the vertical axis. Imprecision is caused by nonreproducibility and expressed as the coefficient of variation. Bias, the difference between what is measured and the true value, is expressed in mmol/mol and is caused by inappropriate calibration. The criterion for quality is the sum of imprecision and bias and is expressed as the total allowable error and set at 5 mmol/mol (0.46%). This criterion is met when the plot of imprecision and bias (the red dot in the figure) is within the triangle of the 2-sigma line and the horizontal and vertical axis. Premium quality is achieved when the red dot is in the colored zones: passes in gold, silver and bronze.
3 3L E A R N I N G G U I D E : H b A 1 c M E T H O D S : A S S AY M E T H O D O L O G I E S A N D I F C C S TA N D A R D I Z AT I O N
B A C K TO T H E TA B L E O F C O N T E N T S
Sigma
2
Gold Silver Bronze
Min
Des
Opt 1
2
4
3
(0.37)4
(0.28)3
(0.18)2
(0.09)1
(0.46) (NGSP)
5 IFCC
1(0.01)
2(1.4)
3(2.0)
4(2.7)
5 (3.4)
IFCC(NGSP)
Imprecision in CV in %
Bias
Figure 3-7: Performance of four testing laboratories shown on IFCC Task Force on HbA1c quality evaluation model .
Figure 3-7 shows the performance of four laboratories. Laboratory 1 just passes the criterion — the bias is excellent but the imprecision rather poor. Laboratory 2 also just passes, but with excellent imprecision and a rather poor bias. Laboratory 3 does not meet the criterion — both imprecision and bias are rather poor. Laboratory 4 has an excellent bias and imprecision, and is rewarded with a silver grade.
The model can be applied at the level of an individual laboratory. Bias is derived from External Quality Assessment/Proficiency Testing (EQA/PT) programs, and imprecision is the within-laboratory CV derived from internal quality control of the laboratory. But also, for a group of laboratories: bias is the mean bias of that group and imprecision of the between-laboratory CV of that group in EQA/PT. This is an interesting option that allows real-life performance of manufacturers.3-12
DISCUSSIONMore than 100 commercial tests have been developed based on the five analytical principles. According to the concept of the traceability chain, the IFCC Reference Method serves as the global analytical anchor for HbA1c standardization. In this way, equivalent results of all tests can be achieved. The HbA1c concentration is a longitudinal parameter; patients are monitored over years or even decades. Therefore, a reliable test with highly reproducible results over a long period is required. For the convenience of an immediate clinical discussion, accurate HbA1c measurements should be available during the patient’s visit to the physician.
Another aspect for HbA1c testing is that HbA1c is a high-volume test and therefore demands efficiency, a high throughput, robustness and cost efficiency. The chosen method should also match the organizational structure, i.e., it should be integrated into the general chemistry analyzer, a convenient stand-alone laboratory instrument or as a point-of-care instrument in the doctor’s office. Priorities and, therefore, the choice of a specific method will differ according to the situation. The weight given to strengths and weaknesses of the methods should be considered. Users should be aware of the limitations of the test. These are specifically declared by the manufacturer on the package insert. Useful and unbiased information on the performance of the respective methods can be derived from EQA/PT programs.
3 4L E A R N I N G G U I D E : H b A 1 c M E T H O D S : A S S AY M E T H O D O L O G I E S A N D I F C C S TA N D A R D I Z AT I O N
B A C K TO T H E TA B L E O F C O N T E N T S
1. HbA1c is the fraction of hemoglobin that has glucose molecules attached to the N-terminal valine of the β chain. The glycation reaction depends on how long red blood cells are in circulation and the ambient glucose levels. Red cells have a lifespan of approximately:
A 15 days
B 90–120 days
C 30 days
D 6 months
2. The IFCC Reference Method (IFCC-RM) is based on the concept of metrological traceability, in which pure HbA1c and HbA0 are mixed to prepare primary calibrators that are used to calibrate the IFCC-RM. Erythrocytes are washed and lysed, followed by enzymatic cleavage. The resulting hexapeptides are quantified with:
A HPLC-mass spectrometry
B HPLC-capillary electrophoresis
C Gel electrophoresis-NMR
D A or B
3. The two primary standardization networks for HbA1c are:
A IFCC and NGSP
B NGSP and DCCT
C DCCT and WHO
D IFCC and WHO
4. The standard IFCC units for HbA1c are:
A mmol/L
B mmol/mol
C % NGSP
D mg/dL
5. Analytical principles used to determine HbA1c concentrations do not include:
A Affinity chromatography, capillary electrophoresis
B Immunoassays
C Near-infrared spectroscopy
D Ion exchange chromatography
E Enzymatic assays
6. In an EQA/PT program, Manufacturer X has a bias of 1.0 mmol/mol (0.09%) and a between-laboratory CV of 2.0% (1.4% if in NGSP units). How is the performance evaluated in the IFCC model for quality targets?
A Fail
B Pass
C Pass with premium quality bronze
D Pass with premium quality gold
REVIEW QUESTIONS: SECTION 3Answers are provided at the end of this Learning Guide.
3 5L E A R N I N G G U I D E : G LYC AT E D H E M O G L O B I N A N D T H E I N F L U E N C E O F VA R I A N T S A N D D E R I VAT I V E S
B A C K TO T H E TA B L E O F C O N T E N T S
LEARNING OBJECTIVES
After completing this section, you will be able to:
• Describe the various hemoglobinopathies, their causes and their prevalence in the world
• Explain the mutation characteristics of hemoglobin
• Identify the potential impact of hemoglobin variants for the measurement of HbA1c
SECTION 4GLYCATED HEMOGLOBIN AND THE INFLUENCE OF VARIANTS AND DERIVATIVES
3 6L E A R N I N G G U I D E : G LYC AT E D H E M O G L O B I N A N D T H E I N F L U E N C E O F VA R I A N T S A N D D E R I VAT I V E S
B A C K TO T H E TA B L E O F C O N T E N T S
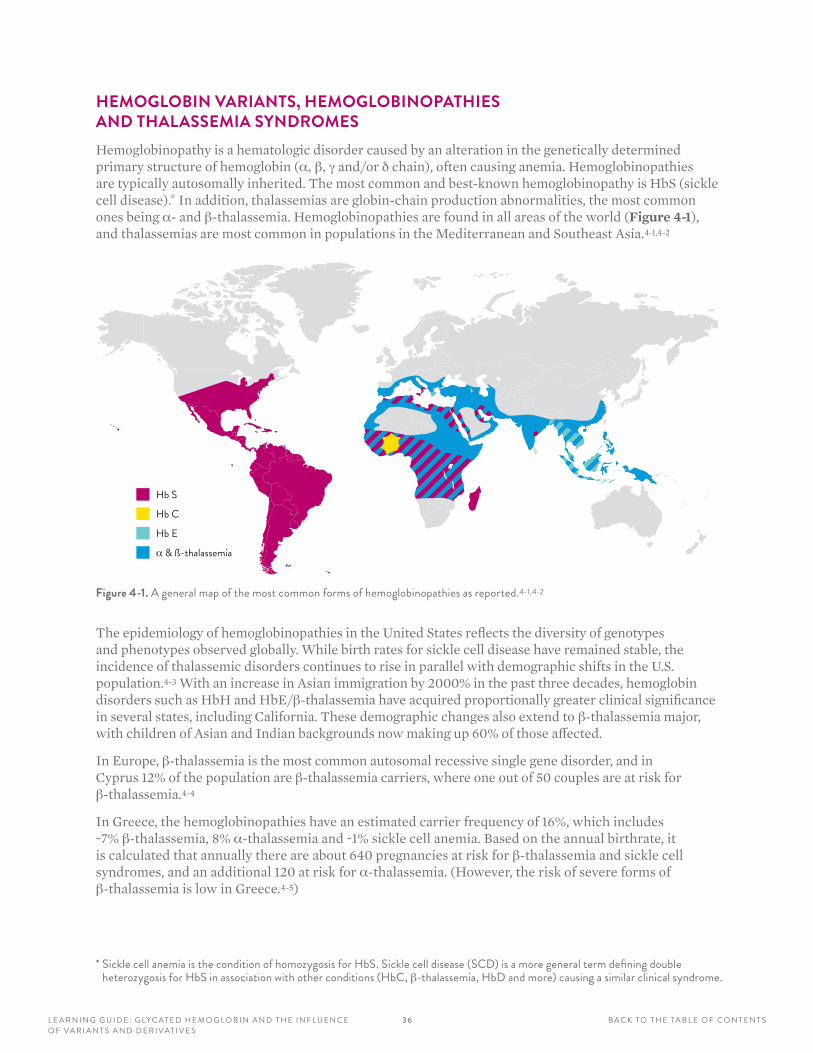
HEMOGLOBIN VARIANTS, HEMOGLOBINOPATHIES AND THALASSEMIA SYNDROMESHemoglobinopathy is a hematologic disorder caused by an alteration in the genetically determined primary structure of hemoglobin (α, β, g and/or d chain), often causing anemia. Hemoglobinopathies are typically autosomally inherited. The most common and best-known hemoglobinopathy is HbS (sickle cell disease).* In addition, thalassemias are globin-chain production abnormalities, the most common ones being α- and β-thalassemia. Hemoglobinopathies are found in all areas of the world (Figure 4-1), and thalassemias are most common in populations in the Mediterranean and Southeast Asia.4-1,4-2
Hb S
Hb C
Hb E
α & ß-thalassemia
Figure 4-1. A general map of the most common forms of hemoglobinopathies as reported .4-1,4-2
The epidemiology of hemoglobinopathies in the United States reflects the diversity of genotypes and phenotypes observed globally. While birth rates for sickle cell disease have remained stable, the incidence of thalassemic disorders continues to rise in parallel with demographic shifts in the U.S. population.4-3 With an increase in Asian immigration by 2000% in the past three decades, hemoglobin disorders such as HbH and HbE/β-thalassemia have acquired proportionally greater clinical significance in several states, including California. These demographic changes also extend to β-thalassemia major, with children of Asian and Indian backgrounds now making up 60% of those affected.
In Europe, β-thalassemia is the most common autosomal recessive single gene disorder, and in Cyprus 12% of the population are β-thalassemia carriers, where one out of 50 couples are at risk for β-thalassemia.4-4
In Greece, the hemoglobinopathies have an estimated carrier frequency of 16%, which includes ~7% β-thalassemia, 8% α-thalassemia and ~1% sickle cell anemia. Based on the annual birthrate, it is calculated that annually there are about 640 pregnancies at risk for β-thalassemia and sickle cell syndromes, and an additional 120 at risk for α-thalassemia. (However, the risk of severe forms of β-thalassemia is low in Greece.4-5)
* Sickle cell anemia is the condition of homozygosis for HbS . Sickle cell disease (SCD) is a more general term defining double heterozygosis for HbS in association with other conditions (HbC, β-thalassemia, HbD and more) causing a similar clinical syndrome .
3 7L E A R N I N G G U I D E : G LYC AT E D H E M O G L O B I N A N D T H E I N F L U E N C E O F VA R I A N T S A N D D E R I VAT I V E S
B A C K TO T H E TA B L E O F C O N T E N T S
The HbH disease occurs when three of the four α-globin genes are deleted or defective. This disease is highly prevalent in southern China, Southeast Asia and Taiwan.4-6
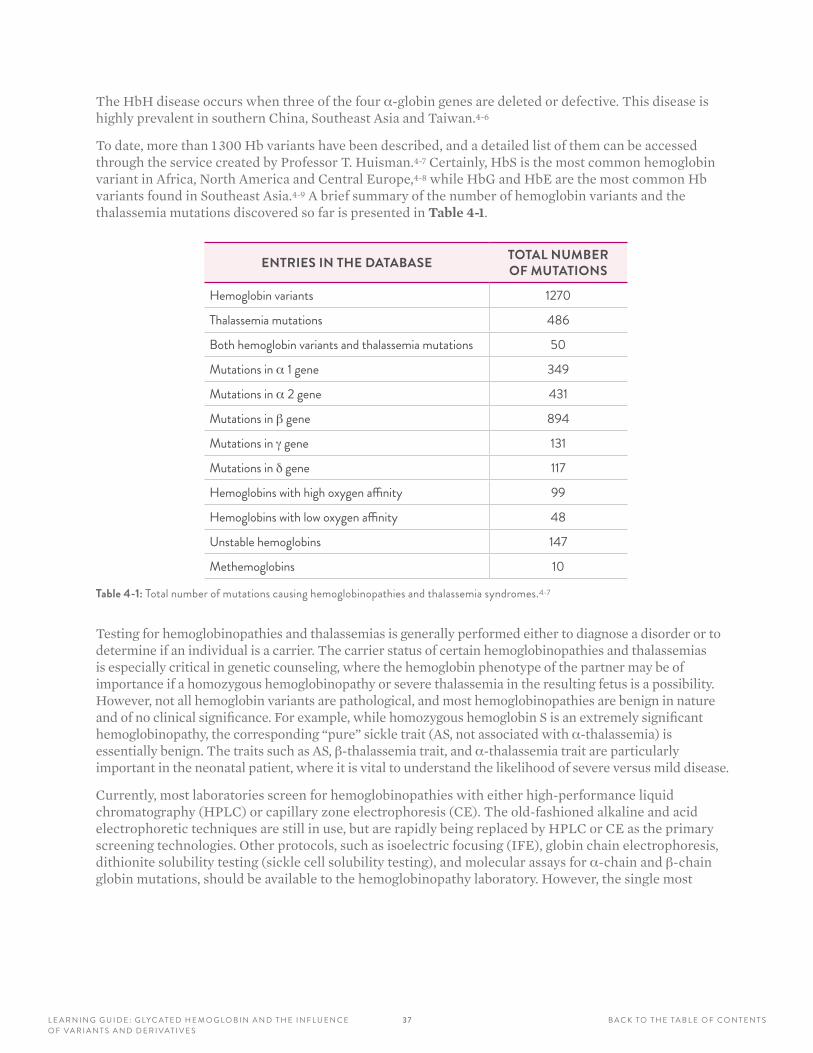
To date, more than 1 300 Hb variants have been described, and a detailed list of them can be accessed through the service created by Professor T. Huisman.4-7 Certainly, HbS is the most common hemoglobin variant in Africa, North America and Central Europe,4-8 while HbG and HbE are the most common Hb variants found in Southeast Asia.4-9 A brief summary of the number of hemoglobin variants and the thalassemia mutations discovered so far is presented in Table 4-1.
ENTRIES IN THE DATABASE TOTAL NUMBER OF MUTATIONS
Hemoglobin variants 1270
Thalassemia mutations 486
Both hemoglobin variants and thalassemia mutations 50
Mutations in α 1 gene 349
Mutations in α 2 gene 431
Mutations in β gene 894
Mutations in g gene 131
Mutations in d gene 117
Hemoglobins with high oxygen affinity 99
Hemoglobins with low oxygen affinity 48
Unstable hemoglobins 147
Methemoglobins 10
Table 4-1: Total number of mutations causing hemoglobinopathies and thalassemia syndromes .4-7
Testing for hemoglobinopathies and thalassemias is generally performed either to diagnose a disorder or to determine if an individual is a carrier. The carrier status of certain hemoglobinopathies and thalassemias is especially critical in genetic counseling, where the hemoglobin phenotype of the partner may be of importance if a homozygous hemoglobinopathy or severe thalassemia in the resulting fetus is a possibility. However, not all hemoglobin variants are pathological, and most hemoglobinopathies are benign in nature and of no clinical significance. For example, while homozygous hemoglobin S is an extremely significant hemoglobinopathy, the corresponding “pure” sickle trait (AS, not associated with α-thalassemia) is essentially benign. The traits such as AS, β-thalassemia trait, and α-thalassemia trait are particularly important in the neonatal patient, where it is vital to understand the likelihood of severe versus mild disease.
Currently, most laboratories screen for hemoglobinopathies with either high-performance liquid chromatography (HPLC) or capillary zone electrophoresis (CE). The old-fashioned alkaline and acid electrophoretic techniques are still in use, but are rapidly being replaced by HPLC or CE as the primary screening technologies. Other protocols, such as isoelectric focusing (IFE), globin chain electrophoresis, dithionite solubility testing (sickle cell solubility testing), and molecular assays for α-chain and β-chain globin mutations, should be available to the hemoglobinopathy laboratory. However, the single most
3 8L E A R N I N G G U I D E : G LYC AT E D H E M O G L O B I N A N D T H E I N F L U E N C E O F VA R I A N T S A N D D E R I VAT I V E S
B A C K TO T H E TA B L E O F C O N T E N T S
valuable laboratory exam required to properly identify hemoglobinopathies is a well-performed hemogram consisting of at least red blood cell (RBC), hemoglobin (Hgb), mean corpuscular volume (MCV), mean corpuscular Hgb (MCH) and red cell distribution (RCD). Without these data, the laboratory will be significantly hampered in its ability to identify the important thalassemia red cell distribution width (RDW) and some of the more relevant hemoglobinopathies.4-10
The future trend for the characterization of hemoglobinopathies will probably be focused on two approaches: (1) HPLC tandem mass spectrometric (LC MS/MS) and (2) molecular identification of α- and β-chain mutation analyses.
The first approach is a logical progression from the HPLC separations now being achieved by several manufacturers and will result in “positive” identification from a mass perspective, rather than relative migration times. While providing a significant increase in specificity, the current instrumentation cost and expertise required for LC MS/MS may initially restrict its use to high-volume hemoglobinopathy centers or reference laboratories until the cost structure of these methods is reduced and the operation becomes simpler. LC MS/MS will certainly have a central role for the determination of some posttranslational modifications of hemoglobin and modifications produced on hemoglobin by environmental factors.4-11
The second approach, molecular identification of α- and β-chain mutations, is a very expensive technology awaiting a cheap and fully automated solution to allow for wider implementation. Of course, the analysis of nucleic acids for the detection and definition of the hemoglobin variants is indeed the best approach for the future.
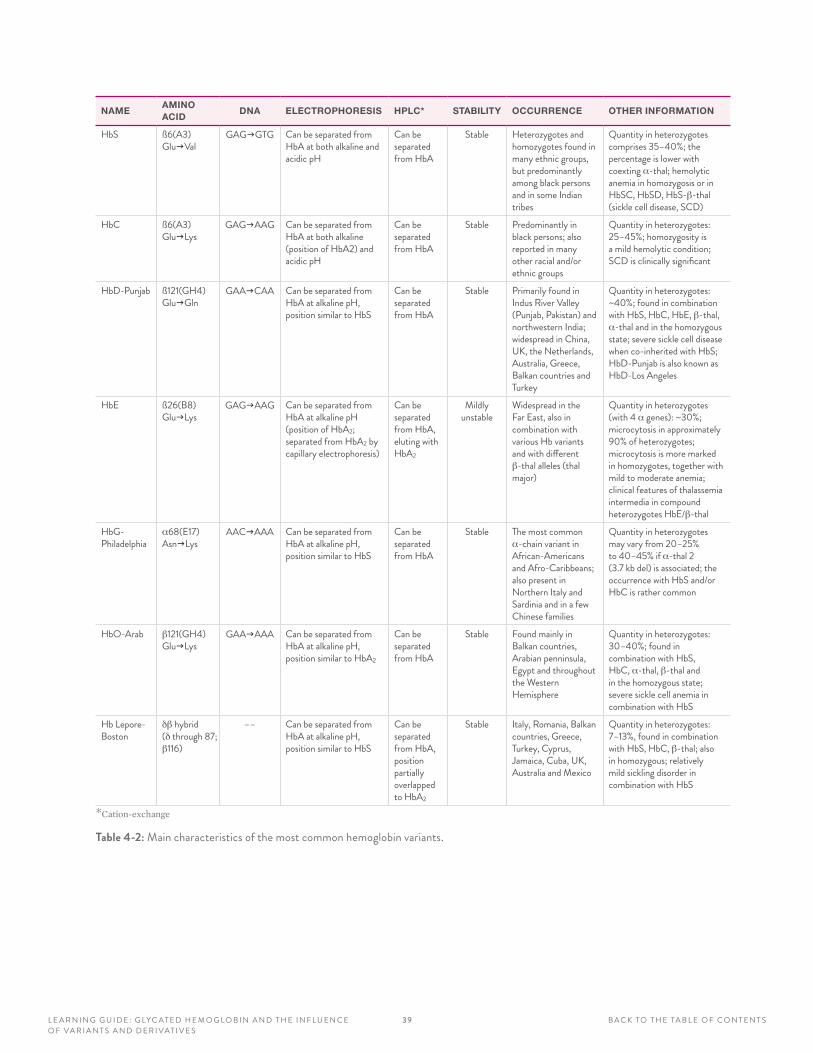
The main characteristics of the most common hemoglobin variants are reported in Table 4-2.
3 9L E A R N I N G G U I D E : G LYC AT E D H E M O G L O B I N A N D T H E I N F L U E N C E O F VA R I A N T S A N D D E R I VAT I V E S
B A C K TO T H E TA B L E O F C O N T E N T S
NAMEAMINO ACID
DNA ELECTROPHORESIS HPLC* STABILITY OCCURRENCE OTHER INFORMATION
HbS ß6(A3) GlugVal
GAGgGTG Can be separated from HbA at both alkaline and acidic pH
Can be separated from HbA
Stable Heterozygotes and homozygotes found in many ethnic groups, but predominantly among black persons and in some Indian tribes
Quantity in heterozygotes comprises 35–40%; the percentage is lower with coexting α-thal; hemolytic anemia in homozygosis or in HbSC, HbSD, HbS-β-thal (sickle cell disease, SCD)
HbC ß6(A3) GlugLys
GAGgAAG Can be separated from HbA at both alkaline (position of HbA2) and acidic pH
Can be separated from HbA
Stable Predominantly in black persons; also reported in many other racial and/or ethnic groups
Quantity in heterozygotes: 25–45%; homozygosity is a mild hemolytic condition; SCD is clinically significant
HbD-Punjab ß121(GH4) GlugGln
GAAgCAA Can be separated from HbA at alkaline pH, position similar to HbS
Can be separated from HbA
Stable Primarily found in Indus River Valley (Punjab, Pakistan) and northwestern India; widespread in China, UK, the Netherlands, Australia, Greece, Balkan countries and Turkey
Quantity in heterozygotes: ~40%; found in combination with HbS, HbC, HbE, β-thal, α-thal and in the homozygous state; severe sickle cell disease when co-inherited with HbS; HbD-Punjab is also known as HbD-Los Angeles
HbE ß26(B8) GlugLys
GAGgAAG Can be separated from HbA at alkaline pH (position of HbA2; separated from HbA2 by capillary electrophoresis)
Can be separated from HbA, eluting with HbA2
Mildly unstable
Widespread in the Far East, also in combination with various Hb variants and with different β-thal alleles (thal major)
Quantity in heterozygotes (with 4 α genes): ~30%; microcytosis in approximately 90% of heterozygotes; microcytosis is more marked in homozygotes, together with mild to moderate anemia; clinical features of thalassemia intermedia in compound heterozygotes HbE/β-thal
HbG- Philadelphia
α68(E17) AsngLys
AACgAAA Can be separated from HbA at alkaline pH, position similar to HbS
Can be separated from HbA
Stable The most common α-chain variant in African-Americans and Afro-Caribbeans; also present in Northern Italy and Sardinia and in a few Chinese families
Quantity in heterozygotes may vary from 20–25% to 40–45% if α-thal 2 (3 .7 kb del) is associated; the occurrence with HbS and/or HbC is rather common
HbO-Arab β121(GH4) GlugLys
GAAgAAA Can be separated from HbA at alkaline pH, position similar to HbA2
Can be separated from HbA
Stable Found mainly in Balkan countries, Arabian penninsula, Egypt and throughout the Western Hemisphere
Quantity in heterozygotes: 30–40%; found in combination with HbS, HbC, α-thal, β-thal and in the homozygous state; severe sickle cell anemia in combination with HbS
Hb Lepore- Boston
dβ hybrid (d through 87; β116)
–– Can be separated from HbA at alkaline pH, position similar to HbS
Can be separated from HbA, position partially overlapped to HbA2
Stable Italy, Romania, Balkan countries, Greece, Turkey, Cyprus, Jamaica, Cuba, UK, Australia and Mexico
Quantity in heterozygotes: 7–13%, found in combination with HbS, HbC, β-thal; also in homozygous; relatively mild sickling disorder in combination with HbS
*Cation-exchange
Table 4-2: Main characteristics of the most common hemoglobin variants .
4 0L E A R N I N G G U I D E : G LYC AT E D H E M O G L O B I N A N D T H E I N F L U E N C E O F VA R I A N T S A N D D E R I VAT I V E S
B A C K TO T H E TA B L E O F C O N T E N T S
POTENTIAL IMPACT OF Hb VARIANTS ON THE HbA1c ASSAY As a general consideration, the interference due to the presence of a hemoglobin variant may be split into parts: • The preanalytical effect, i.e., the impact due to the potential effect that the variant may have on normal
red cell physiology• The true analytical interference of the hemoglobin variants, as evaluated by the specific analytical
method used to measure HbA1c• The postanalytical issue, related to reporting the result of HbA1c
Moreover, it should always be taken into account that, in the case of homozygosis or double heterozygosis for a hemoglobin variant (such as in subjects with sickle cell anemia homozygous for HbS, or with HbSC), the determination of HbA1c is not feasible because no HbA is present, and other indicators of glycemic control (such as the determination of glycated plasma proteins or fasting blood glucose) have to be used.
When hemolytic anemia is suspected or known, the red cell life span may be reduced and, therefore, the interpretation of the HbA1c value should be considered suspect, so alternative methods should be used to confirm clinical interpretations. In carriers of HbS and HbD-Punjab, the red cell life span is generally normal, while in the heterozygous HbAC, some cases with a reduction in red cell life span have been reported.4-12
Another point to be taken into account concerns the possible differences in the kinetics of glycation between human hemoglobin A (the “wild type” hemoglobin) and the eventual hemoglobin variant. Data on this point are very difficult to find. However, recent findings seem to indicate that HbS has higher glycation in respect to HbA in subjects with HbAS, for unclear reasons. This phenomenon has a potential impact on the use of affinity chromatography-based methods for measuring HbA1c in carriers of HbS. More studies are needed to determine if the glycation extent for other common hemoglobin variants, such as HbC and HbE, is different from that on HbA.
In order to address the second point, it is convenient to group the HbA1c methods according to their different principles, mainly as follows:4-14
• Immunochemical or enzymatic methods – In immunochemical methods, antibodies directed against the last 4–10 amino acids of the β chains are employed. For enzymatic methods, fructosyl peptide cleavage products are evaluated. The eventual hemoglobin variants having mutations within the primary structure that is analyzed (such as HbS and HbC) can therefore potentially influence the HbA1c result. On the contrary, if the amino acid substitution is far away from this b-terminal region (HbD-Punjab, HbE), it is very unlikely that the hemoglobin variant will interfere with the determination of HbA1c.
• Net charge separation methods – Within this category, ion-exchange (mostly cation-exchange) HPLC methods are included, as well as the various methods based on electrophoresis — capillary electrophoresis (CE) being the most recent one. Within this category, there are also a number of other techniques in rare use (such as ion-exchange minicolumns, agarose gel electrophoresis and isoelectric focusing). All hemoglobin variants with an isoelectric point different from that of HbA (7.20) can be, in theory, separated, using a technique based on the net charge difference. This would result, in the case of the HPLC chromatograms, in the presence of some extra peaks, which may interfere with the determination of HbA1c, depending on partial or total overlaps with the hemoglobin peaks present in healthy, noncarrier subjects. Depending on the hemoglobin variant, the interferences may cause different effects.
41L E A R N I N G G U I D E : G LYC AT E D H E M O G L O B I N A N D T H E I N F L U E N C E O F VA R I A N T S A N D D E R I VAT I V E S
B A C K TO T H E TA B L E O F C O N T E N T S
Generally, HbA1c is expressed in relationship to total hemoglobin, i.e.,
(HbA1c)% = (HbA1c) x 100/(total Hb)
If the hemoglobin variant (HbX) and its glycated adduct (HbX1c) migrate separately from HbA and HbA1c, respectively, then the presence of a definite amount of HbX in the sample has negligible effects on the quantification of HbA1c. Indeed, the majority of the actual HPLC and CE systems calculate the relative abundance of HbA1c according to the formula:
(HbA1c)adjusted, % = (HbA1c) x 100/([total Hb] – [HbX])*
If, on the contrary, HbX and/or HbX1c do not separate perfectly from HbA and HbA1c, then the presence of the hemoglobin variant may interfere in the determination of HbA1c by giving spurious elevated or decreased HbA1c concentration values.
The most common hemoglobin variants (HbS and HbC) are usually well-separated, and generally they do not interfere with the determination of HbA1c.4-13 On the contrary, HbD and HbE may interfere, depending on the method used.4-14
• Affinity chromatography methods – This category includes some HPLC and point-of-care systems that use, as a principle, the separation of the fructose residues bound to the hemoglobin molecule by means of an aminophenyl boronate resin. Indeed, these methods measure total glycated hemoglobin, not HbA1c. Nonetheless, they are generally well-aligned to the standardized HbA1c methods and are more robust with regard to the interference from the presence of hemoglobin variants.
A summary of the possible analytical interferences of the most common hemoglobin variants with the most-used analytical techniques for the determination of HbA1c has been reported.4-15 Moreover, it should also be remembered that HbF may be variably increased in association with various thalassemic syndromes and in patients with sickle cell anemia. Usually, HbF concentrations <5% have no significant effect on the majority of the chromatographic methods. Also, the interference is very rare on immunochemical methods, because the g chains of HbF have little to no immunoreactivity with most antibodies used in these assays. Samples with elevated HbF may lack appropriate β chains for appropriate HbA1c evaluation for those methods that do not intentionally detect and report on the HbF variant. Some additional information can be recovered from the National Glycohemoglobin Standardization Program (NGSP).4-15
*This correction is effective if HbX is migrating/eluting after HbA and generally is not performed if HbX is migrating/eluting before HbA .
42L E A R N I N G G U I D E : G LYC AT E D H E M O G L O B I N A N D T H E I N F L U E N C E O F VA R I A N T S A N D D E R I VAT I V E S
B A C K TO T H E TA B L E O F C O N T E N T S
Finally, to cover the third point (reporting), some indications, as pointed out in a document published in 2011,4-16 could be the following:
1. Those utilizing HPLC or similar separation techniques (CE) must carefully inspect the chromatogram (electropherogram) to rationalize unusual patterns due to the presence of a hemoglobin variant. When an abnormal pattern is present, there are two possibilities:
a) The laboratory does not have the tools to make further investigations in order to elucidate the nature of the hemoglobin variant. Under this circumstance, we strongly recommend not reporting any HbA1c value and adding a comment such as “HbA1c not measurable because of the presence of a hemoglobin variant; further investigations to characterize the variant are encouraged.”
b) The laboratory is able to run additional tests. If an HbS, HbC, HbD, HbE or Hb O-Arab is found, then by evaluating the information provided above and the data from Table 4-2, the HbA1c result can be reported only if there is no interference from the variant on the HbA1c method. If the variant belongs to other, more rare types, then it is difficult to give some practical advice if very little is known about the possible comorbidity with hemolytic anemia or other conditions. Given the hereditary persistence of fetal Hb, samples with elevated HbF should be evaluated with caution when using potentially impacted assays such as immunoassay and boronate affinity methods.
2. When the concentration of HbA1c is <20 mmol/mol (<4.0%) or >142 mmol/mol (>15.0%) or the concentration is in strong discordance with other clinical or laboratory information about glycemic control, such as fasting blood glucose, then the presence of a hemoglobin variant has to be suspected.
3. In all cases where the HbA1c result cannot be determined, then advice should be given to the clinician for the use of other biochemical exams to evaluate the glycemic state. The determination of glycated albumin, by means of the recent enzymatic assay recently evaluated,4-17,4-18 could be of some help to clinicians.
POTENTIAL IMPACT OF THALASSEMIC SYNDROMES ON THE HbA1c ASSAYIt is well known that the extent of formation of glycated hemoglobin is related to the variable glucose concentrations in blood over a normal red cell life span. Therefore, any condition that may alter RBC survival could invalidate the interpretation of HbA1c as an accurate, integrated measure of glycemic control in the preceding 60–90 days. Indeed, the presence of iron deficiency anemia, which is associated with increased red cell survival, may produce HbA1c values higher than those expected from the average blood glucose control.4-19 On the contrary, the presence of hemolytic anemias may result in lower HbA1c values due to a decreased red cell survival.4-21
In the case of the thalassemia syndromes, severe anemias may be present in various forms (thalassemia major), and a milder anemia may be present in the minor forms. There are few data on red cell survival in the thalassemia minor, but in carriers of β-thalassemia, significant reduction of red cell survival has been proven.4-21 Despite that, Polage, et al,4-22 were unable to prove, in subjects without diabetes or with a mild form of hyperglycemia, any effect of the β-thalassemia carrier condition on the glycated hemoglobin as measured by various separation and immunochemical techniques. With just one technique (Synchron methods), there was a significant effect, probably related to a nonlinearity of the HbA1c measurement in the low total hemoglobin range. Unfortunately, there are no data to prove that, in diabetic patients, carriers of β-thalassemia may alter their glycated hemoglobin results.
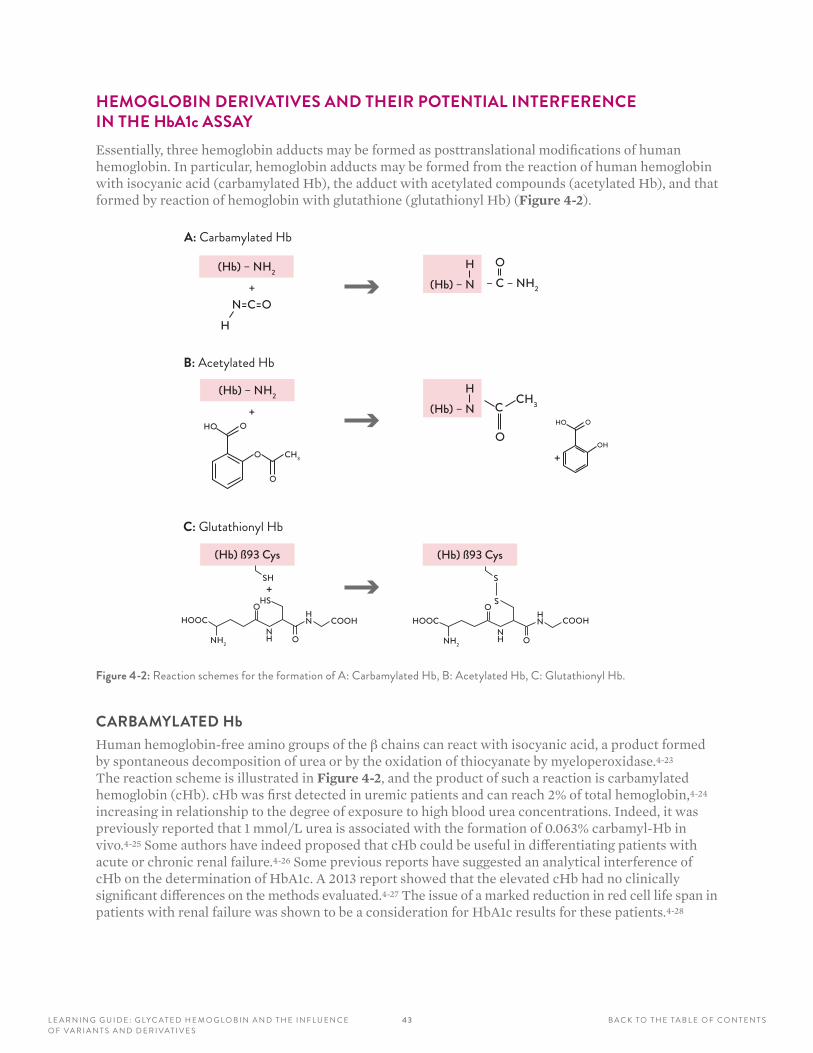
4 3L E A R N I N G G U I D E : G LYC AT E D H E M O G L O B I N A N D T H E I N F L U E N C E O F VA R I A N T S A N D D E R I VAT I V E S
B A C K TO T H E TA B L E O F C O N T E N T S
HEMOGLOBIN DERIVATIVES AND THEIR POTENTIAL INTERFERENCE IN THE HbA1c ASSAYEssentially, three hemoglobin adducts may be formed as posttranslational modifications of human hemoglobin. In particular, hemoglobin adducts may be formed from the reaction of human hemoglobin with isocyanic acid (carbamylated Hb), the adduct with acetylated compounds (acetylated Hb), and that formed by reaction of hemoglobin with glutathione (glutathionyl Hb) (Figure 4-2).
(Hb) – NH2
+N=C=O
H
(Hb) – NH2
+HO O
O
O
CH3
(Hb) ß93 Cys
SH+
HSO
HOOC
NH2
COOHNH
HN
O
(Hb) – NH
– C – NH2
O
(Hb) – NH
C
O
CH3
HO O
OH
+
(Hb) ß93 Cys
S
SOHOOC
NH2
COOHNH
HN
O
A: Carbamylated Hb
B: Acetylated Hb
C: Glutathionyl Hb
Figure 4-2: Reaction schemes for the formation of A: Carbamylated Hb, B: Acetylated Hb, C: Glutathionyl Hb .
CARBAMYLATED HbHuman hemoglobin-free amino groups of the β chains can react with isocyanic acid, a product formed by spontaneous decomposition of urea or by the oxidation of thiocyanate by myeloperoxidase.4-23 The reaction scheme is illustrated in Figure 4-2, and the product of such a reaction is carbamylated hemoglobin (cHb). cHb was first detected in uremic patients and can reach 2% of total hemoglobin,4-24 increasing in relationship to the degree of exposure to high blood urea concentrations. Indeed, it was previously reported that 1 mmol/L urea is associated with the formation of 0.063% carbamyl-Hb in vivo.4-25 Some authors have indeed proposed that cHb could be useful in differentiating patients with acute or chronic renal failure.4-26 Some previous reports have suggested an analytical interference of cHb on the determination of HbA1c. A 2013 report showed that the elevated cHb had no clinically significant differences on the methods evaluated.4-27 The issue of a marked reduction in red cell life span in patients with renal failure was shown to be a consideration for HbA1c results for these patients.4-28
4 4L E A R N I N G G U I D E : G LYC AT E D H E M O G L O B I N A N D T H E I N F L U E N C E O F VA R I A N T S A N D D E R I VAT I V E S
B A C K TO T H E TA B L E O F C O N T E N T S
ACETYLATED HbThe same N-terminal amino groups reacting with glucose may react with acetylating agents to form an acetyl-aminoderivative, by the mechanism illustrated in Figure 4-2. Aspirin (acetylsalicylic acid) is a very common drug, and low-dose aspirin is recommended for both primary and secondary cardiovascular disease prevention in diabetic patients.4-29 Some studies have pointed out a potential interference of aspirin in HbA1c assays, especially in the HPLC and electrophoretic methods,4-30 because acetylated Hb is essentially very similar to HbA1c with regard to its electric charge and mobility with these techniques. However, a quite recent randomized, double-blind, placebo-controlled study on 12 patients, assuming an aspirin dose of 300 mg/d or identical placebo for eight weeks, was not able to confirm these findings.4-31 Considering that the recommended preventive dose of aspirin is equal to 75–162 mg/d, we may conclude that aspirin in vivo normally does not interfere with the determination of HbA1c.
GLUTATHIONYL HbIt is well known that the storage of red blood cells for a prolonged period of time under blood banking conditions may accumulate irreversible damage to the red cells that ultimately enhances hemolysis and oxidative stress after transfusion.4-33,4-34 Reactive oxygen species (ROS) created during storage of RBCs are mainly responsible for the characteristic oxidative modifications to hemoglobin and the red cell membrane. There are several enzymatic systems that can detoxify these reactive oxygen species. The concentration of reduced tripeptide glutathione (g-1-glutamyl-1-cysteinylglycine: GSH) is the main limiting factor in these enzymatic processes, which also require some other reducing agents, such as vitamin E, vitamin C and β-carotene.4-35 Reduced glutathione is normally abundant in red cells, but it can be oxidized to its disulfide form (GSSG) in response to an oxidative perturbation. However, GSSG is rapidly reduced by the action of glutathione reductase4-36 forming GSH back again.
If GSSG accumulates within the red cell, it can create hemoglobin-glutathione adducts via thiol-disulfide exchange reactions at the 93β Cys residues, by the scheme illustrated in Figure 4-2. Thus, in addition to the ratio of GSH to GSSG, the content of glutathionylated Hb can indicate oxidative stress, and it has been proven that increased concentrations of glutathionyl Hb with high oxygen affinity and low cooperativity in diabetes and hyperlipidemias may lead to reduced tissue oxygen delivery.
In most of the ion-exchange HPLC systems, glutathionyl Hb elutes before HbA, forming another minor derivative (HbA1d or HbA3), which is usually well-resolved from HbA1c.4-37 Little is known about the possible interference of HbA1d on the HbA1c determination by the immunochemical methods, but interference is unlikely, as the binding site of glutathione to human hemoglobin β chains is far away from the β N-terminal residues where glucose is bound.
DISCUSSIONThe possible interference due to the various mechanisms mentioned above has to be taken into careful consideration, either by the clinician who is requesting the laboratory test, or by the laboratory professional performing this test. Indeed, the result of the laboratory determination should result in a precise and accurate number, together with a clear-cut interpretation. If the patient is a carrier of a hemoglobin variant, it is necessary to verify if this variant may interfere with the HbA1c determination. Quite often, the finding of a hemoglobin variant occurs during the determination of HbA1c, and it is still questionable, in these cases, if such a finding has to be reported as well.
4 5L E A R N I N G G U I D E : G LYC AT E D H E M O G L O B I N A N D T H E I N F L U E N C E O F VA R I A N T S A N D D E R I VAT I V E S
B A C K TO T H E TA B L E O F C O N T E N T S
1. Hemoglobinopathy is a hematologic disorder caused by an alteration in the genetically determined primary structure of hemoglobin (α, β, g and/or d chain), producing variant hemoglobins and often causing anemia. Hemoglobinopathies are typically autosomally inherited. The most common and best-known variant hemoglobin, especially in Africa, North America and Central Europe, is:
A HbC
B HbS
C HbD
D HbE
2. Thalassemias are globin-chain production abnormalities, the most common being:
A α- and β-thalassemias
B HbC and HbS
C HbE
D HbA1c
3. Most laboratories are screening for hemoglobinopathies with either high-performance liquid chromatography (HPLC) or capillary zone electrophoresis (CE). The single most valuable laboratory exam required to properly identify hemoglobinopathies is a well-performed hematogram consisting of the following, except:
A RBC, Hb
B MCV, MCH
C RDW
D Cell coloration
4. The following hemoglobin adducts may be formed as posttranslational modifications of human hemoglobin, except:
A Carbamylated
B Acetylated
C Glutathionyl
D Hydroxyl
5. The interference due to the presence of a hemoglobin variant may be split into three parts, including all the following, except:
A The preanalytical effects, such as those that impact the normal red cell physiology
B The analytical interference of the hemoglobin variant that impacts the specific analytical method used to measure the HbA1c
C The analytical interference from sample volume
D The postanalytical issue, related to reporting the result of the HbA1c
6. HbA1c can be used for diagnosis of patients having the following conditions:
A Type 1 diabetes
B Pregnancy
C Normal red cell turnover
D Abnormal renal function
REVIEW QUESTIONS: SECTION 4
4 6L E A R N I N G G U I D E : I F C C S TA N D A R D I Z AT I O N A N D N G S P C E R T I F I C AT I O N P R O G R A M S
B A C K TO T H E TA B L E O F C O N T E N T S
LEARNING OBJECTIVES
After completing this section, you will be able to:
• Describe the history of the HbA1c standardization
• Explain the IFCC and NGSP programs
• Identify key factors influencing the use of HbA1c
• Describe the performance changes over time of HbA1c assays
SECTION 5IFCC STANDARDIZATION AND NGSP CERTIFICATION PROGRAMS
4 6L E A R N I N G G U I D E : I F C C S TA N D A R D I Z AT I O N A N D N G S P C E R T I F I C AT I O N P R O G R A M S
B A C K TO T H E TA B L E O F C O N T E N T S
47L E A R N I N G G U I D E : I F C C S TA N D A R D I Z AT I O N A N D N G S P C E R T I F I C AT I O N P R O G R A M S
B A C K TO T H E TA B L E O F C O N T E N T S
HbA1c LINKED TO CLINICAL OUTCOMES IN DIABETESBefore 1993, HbA1c was used in a general way for estimating the level of glycemic control. Lower HbA1c meant lower average glucose, but there were no specific treatment goals, and not everyone was convinced that tighter control of glucose levels led to better outcomes. It was not until the publication of the results of the Diabetes Control and Complications Trial (DCCT) in 1993 that the importance of HbA1c as an indicator of both mean glycemia and corresponding outcome risks was firmly established.5-1
The DCCT was a prospective, long-term, randomized trial that provided definitive proof that intensive glycemic control significantly reduces the risk of long-term diabetes complications and allowed establishment of specific HbA1c treatment goals. Soon after the publication of the results of the DCCT, the American Diabetes Association (ADA) recommended HbA1c of 7% and an action limit of 8% as a general treatment goal for all patients with diabetes.5-2 However, lack of standardization made it difficult for healthcare providers to utilize these HbA1c targets in clinical practice, since there was no way of knowing how their patients’ test results compared to those from the DCCT. Proficiency testing results from 1993 showed that there was considerable variability within and among methods and differences in the analytes reported (HbA1c, HbA1 or total GHB). For example, a result of 7% by one method could be a 9% by another.
Because of the positive impact standardization of HbA1c determinations would have on the care of diabetic patients, the AACC Standards Committee established an HbA1c Standardization Subcommittee in April 1993. The goal of the subcommittee was to develop a plan for HbA1c standardization that would ultimately allow individual clinical laboratories to relate their HbA1c assay results to those of the DCCT, where relationships of HbA1c values to mean blood glucose and to risks for developing chronic diabetic complications had been established.
Although the DCCT was completed in 1993, the HbA1c assay systems from the study were to remain in place as part of another National Institutes of Health-sponsored long-term diabetes study called the Epidemiology of Diabetes Interventions and Complications (EDIC), which continues to follow DCCT subjects.5-3 To initiate a standardization program in a timely fashion, the subcommittee recommended that the DCCT reference method be used as a designated comparison method for standardization while studies were being performed to evaluate candidate reference methods and to develop purified HbA1c standards. Standardizing HbA1c results to DCCT values would allow individual clinical laboratories to provide diabetic patients and their healthcare providers with test results that could be related directly to risks for development and/or progression of chronic diabetes complications. Although the DCCT included only patients with type 1 diabetes, results from a similar study of patients with type 2 diabetes, the United Kingdom Prospective Diabetes Study (UKPDS),5-4 also showed a direct relationship between glycemic control (measured by HbA1c) and risk for complications. Fortunately, results from the DCCT and UKPDS were linked to the same designated comparison method.
It was recognized that the HbA1c results reported by this designated comparison method were not “true” values since there was known to be some nonspecificity in the measurement. Nevertheless, expediency, consistency over time and a direct relationship with clinical outcomes were considered of primary importance. The long-term stability of this method is shown in Figure 5-1.
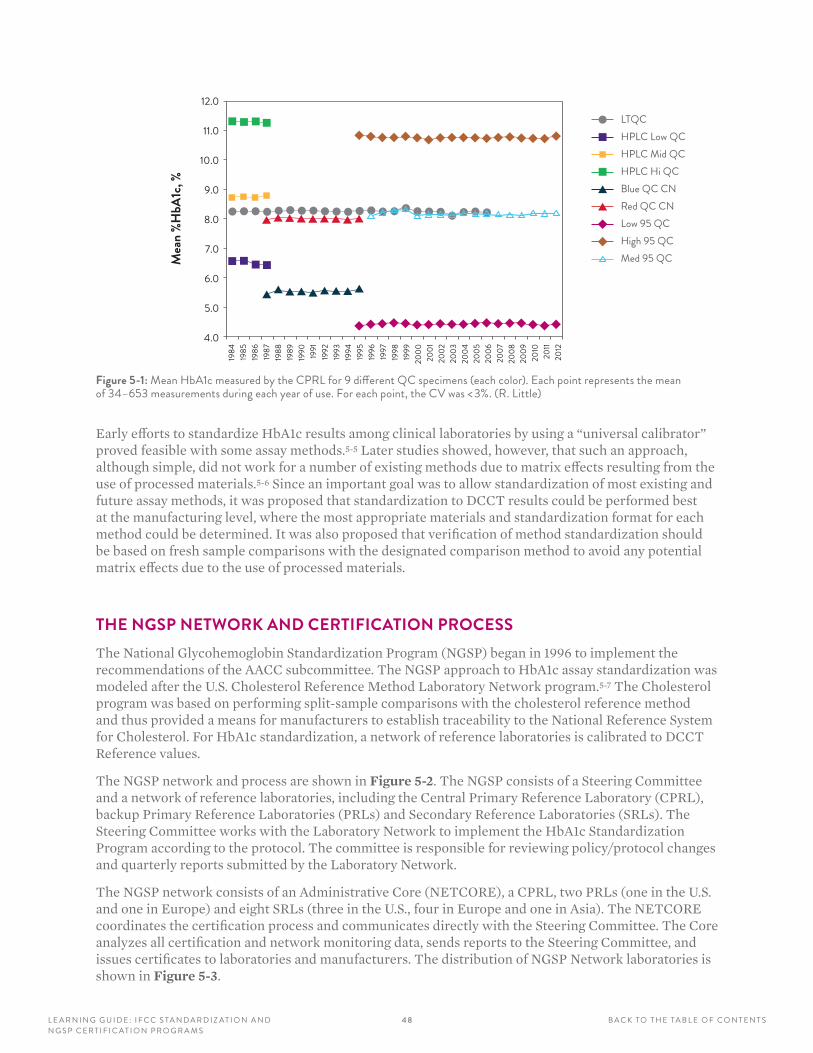
4 8L E A R N I N G G U I D E : I F C C S TA N D A R D I Z AT I O N A N D N G S P C E R T I F I C AT I O N P R O G R A M S
B A C K TO T H E TA B L E O F C O N T E N T S
12.0
11.0
10.0
9.0
8.0
7.0
6.0
5.0
4.0
Mea
n %H
bA1c
, %
1984
1985
1986
1987
1988
1989
1990 1991
1992
1993
1994
1995
1996
1997
1998
1999
2000
2001
2002
2003
2004
2005
2006
2007
2008
2009
2010
2011
2012
LTQCHPLC Low QCHPLC Mid QCHPLC Hi QCBlue QC CNRed QC CNLow 95 QCHigh 95 QCMed 95 QC
Figure 5-1: Mean HbA1c measured by the CPRL for 9 different QC specimens (each color) . Each point represents the mean of 34–653 measurements during each year of use . For each point, the CV was < 3% . (R . Little)
Early efforts to standardize HbA1c results among clinical laboratories by using a “universal calibrator” proved feasible with some assay methods.5-5 Later studies showed, however, that such an approach, although simple, did not work for a number of existing methods due to matrix effects resulting from the use of processed materials.5-6 Since an important goal was to allow standardization of most existing and future assay methods, it was proposed that standardization to DCCT results could be performed best at the manufacturing level, where the most appropriate materials and standardization format for each method could be determined. It was also proposed that verification of method standardization should be based on fresh sample comparisons with the designated comparison method to avoid any potential matrix effects due to the use of processed materials.
THE NGSP NETWORK AND CERTIFICATION PROCESSThe National Glycohemoglobin Standardization Program (NGSP) began in 1996 to implement the recommendations of the AACC subcommittee. The NGSP approach to HbA1c assay standardization was modeled after the U.S. Cholesterol Reference Method Laboratory Network program.5-7 The Cholesterol program was based on performing split-sample comparisons with the cholesterol reference method and thus provided a means for manufacturers to establish traceability to the National Reference System for Cholesterol. For HbA1c standardization, a network of reference laboratories is calibrated to DCCT Reference values.
The NGSP network and process are shown in Figure 5-2. The NGSP consists of a Steering Committee and a network of reference laboratories, including the Central Primary Reference Laboratory (CPRL), backup Primary Reference Laboratories (PRLs) and Secondary Reference Laboratories (SRLs). The Steering Committee works with the Laboratory Network to implement the HbA1c Standardization Program according to the protocol. The committee is responsible for reviewing policy/protocol changes and quarterly reports submitted by the Laboratory Network.
The NGSP network consists of an Administrative Core (NETCORE), a CPRL, two PRLs (one in the U.S. and one in Europe) and eight SRLs (three in the U.S., four in Europe and one in Asia). The NETCORE coordinates the certification process and communicates directly with the Steering Committee. The Core analyzes all certification and network monitoring data, sends reports to the Steering Committee, and issues certificates to laboratories and manufacturers. The distribution of NGSP Network laboratories is shown in Figure 5-3.
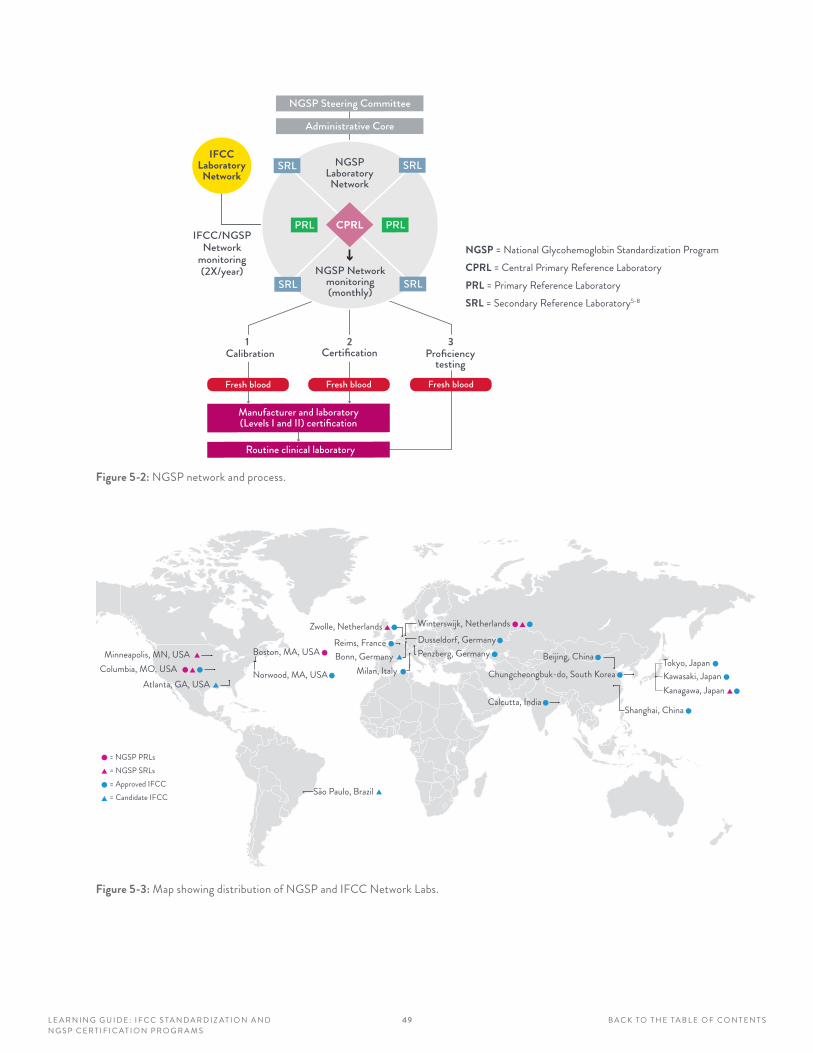
49L E A R N I N G G U I D E : I F C C S TA N D A R D I Z AT I O N A N D N G S P C E R T I F I C AT I O N P R O G R A M S
B A C K TO T H E TA B L E O F C O N T E N T S
NGSP Steering Committee
Administrative Core
CPRL
NGSPLaboratoryNetwork
PRL PRL
SRL SRL
SRL SRLNGSP Network
monitoring(monthly)
IFCCLaboratoryNetwork
IFCC/NGSPNetwork
monitoring(2X/year)
Certification Proficiencytesting
Fresh blood Fresh blood Fresh blood
Manufacturer and laboratory(Levels I and II) certification
Routine clinical laboratory
21Calibration
3
NGSP = National Glycohemoglobin Standardization ProgramCPRL = Central Primary Reference Laboratory PRL = Primary Reference Laboratory SRL = Secondary Reference Laboratory5-8
Figure 5-2: NGSP network and process .
= NGSP PRLs= NGSP SRLs= Approved IFCC= Candidate IFCC
Columbia, MO, USAMinneapolis, MN, USA
Atlanta, GA, USA
Boston, MA, USA
Norwood, MA, USA Milan, ItalyBonn, GermanyReims, France
Zwolle, Netherlands Winterswijk, NetherlandsDusseldorf, GermanyPenzberg, Germany
Chungcheongbuk-do, South Korea
Calcutta, India
Beijing, China
Shanghai, China
Tokyo, JapanKawasaki, JapanKanagawa, Japan
São Paulo, Brazil
Figure 5-3: Map showing distribution of NGSP and IFCC Network Labs .
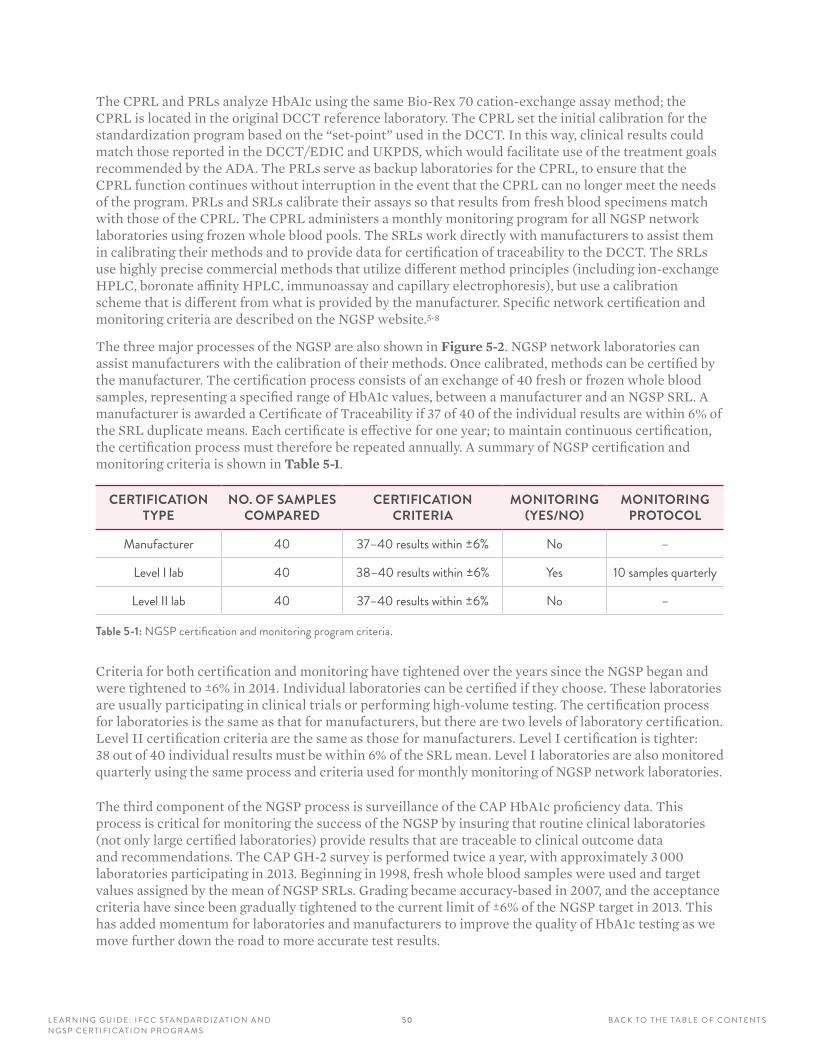
5 0L E A R N I N G G U I D E : I F C C S TA N D A R D I Z AT I O N A N D N G S P C E R T I F I C AT I O N P R O G R A M S
B A C K TO T H E TA B L E O F C O N T E N T S
The CPRL and PRLs analyze HbA1c using the same Bio-Rex 70 cation-exchange assay method; the CPRL is located in the original DCCT reference laboratory. The CPRL set the initial calibration for the standardization program based on the “set-point” used in the DCCT. In this way, clinical results could match those reported in the DCCT/EDIC and UKPDS, which would facilitate use of the treatment goals recommended by the ADA. The PRLs serve as backup laboratories for the CPRL, to ensure that the CPRL function continues without interruption in the event that the CPRL can no longer meet the needs of the program. PRLs and SRLs calibrate their assays so that results from fresh blood specimens match with those of the CPRL. The CPRL administers a monthly monitoring program for all NGSP network laboratories using frozen whole blood pools. The SRLs work directly with manufacturers to assist them in calibrating their methods and to provide data for certification of traceability to the DCCT. The SRLs use highly precise commercial methods that utilize different method principles (including ion-exchange HPLC, boronate affinity HPLC, immunoassay and capillary electrophoresis), but use a calibration scheme that is different from what is provided by the manufacturer. Specific network certification and monitoring criteria are described on the NGSP website.5-8
The three major processes of the NGSP are also shown in Figure 5-2. NGSP network laboratories can assist manufacturers with the calibration of their methods. Once calibrated, methods can be certified by the manufacturer. The certification process consists of an exchange of 40 fresh or frozen whole blood samples, representing a specified range of HbA1c values, between a manufacturer and an NGSP SRL. A manufacturer is awarded a Certificate of Traceability if 37 of 40 of the individual results are within 6% of the SRL duplicate means. Each certificate is effective for one year; to maintain continuous certification, the certification process must therefore be repeated annually. A summary of NGSP certification and monitoring criteria is shown in Table 5-1.
CERTIFICATION TYPE
NO. OF SAMPLES COMPARED
CERTIFICATION CRITERIA
MONITORING (YES/NO)
MONITORING PROTOCOL
Manufacturer 40 37–40 results within ±6% No –
Level I lab 40 38–40 results within ±6% Yes 10 samples quarterly
Level II lab 40 37–40 results within ±6% No –
Table 5-1: NGSP certification and monitoring program criteria .
Criteria for both certification and monitoring have tightened over the years since the NGSP began and were tightened to ±6% in 2014. Individual laboratories can be certified if they choose. These laboratories are usually participating in clinical trials or performing high-volume testing. The certification process for laboratories is the same as that for manufacturers, but there are two levels of laboratory certification. Level II certification criteria are the same as those for manufacturers. Level I certification is tighter: 38 out of 40 individual results must be within 6% of the SRL mean. Level I laboratories are also monitored quarterly using the same process and criteria used for monthly monitoring of NGSP network laboratories.
The third component of the NGSP process is surveillance of the CAP HbA1c proficiency data. This process is critical for monitoring the success of the NGSP by insuring that routine clinical laboratories (not only large certified laboratories) provide results that are traceable to clinical outcome data and recommendations. The CAP GH-2 survey is performed twice a year, with approximately 3 000 laboratories participating in 2013. Beginning in 1998, fresh whole blood samples were used and target values assigned by the mean of NGSP SRLs. Grading became accuracy-based in 2007, and the acceptance criteria have since been gradually tightened to the current limit of ±6% of the NGSP target in 2013. This has added momentum for laboratories and manufacturers to improve the quality of HbA1c testing as we move further down the road to more accurate test results.
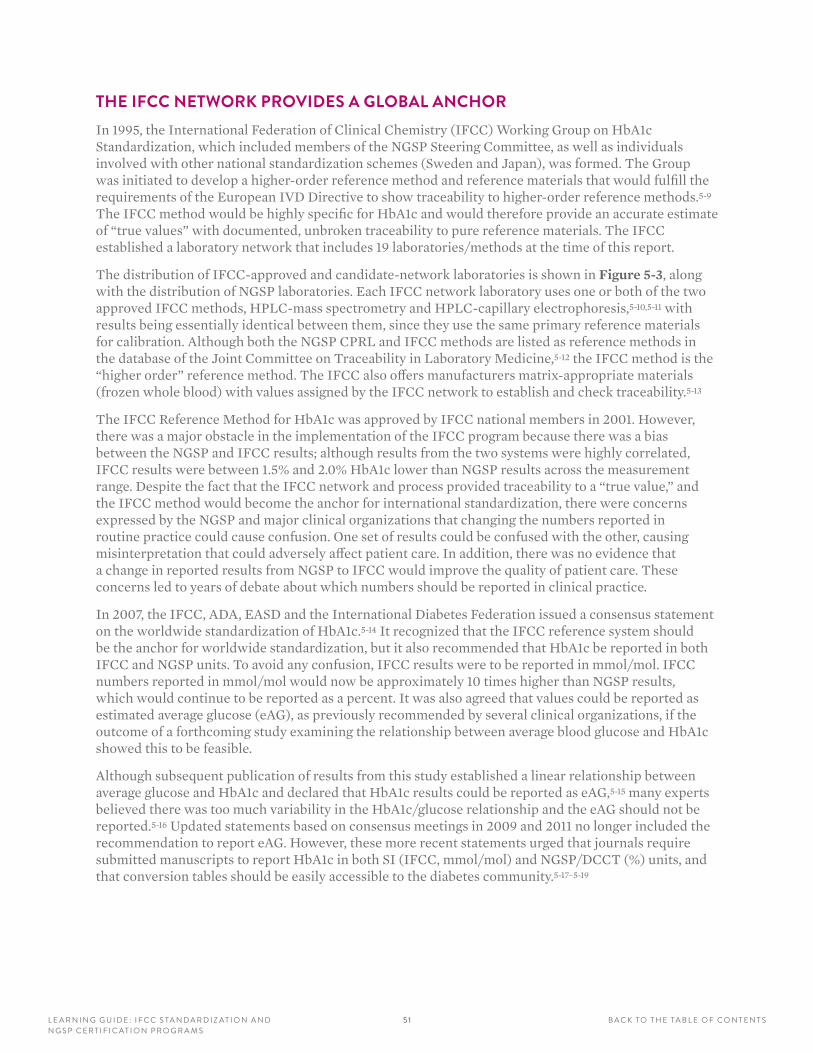
51L E A R N I N G G U I D E : I F C C S TA N D A R D I Z AT I O N A N D N G S P C E R T I F I C AT I O N P R O G R A M S
B A C K TO T H E TA B L E O F C O N T E N T S
THE IFCC NETWORK PROVIDES A GLOBAL ANCHOR In 1995, the International Federation of Clinical Chemistry (IFCC) Working Group on HbA1c Standardization, which included members of the NGSP Steering Committee, as well as individuals involved with other national standardization schemes (Sweden and Japan), was formed. The Group was initiated to develop a higher-order reference method and reference materials that would fulfill the requirements of the European IVD Directive to show traceability to higher-order reference methods.5-9 The IFCC method would be highly specific for HbA1c and would therefore provide an accurate estimate of “true values” with documented, unbroken traceability to pure reference materials. The IFCC established a laboratory network that includes 19 laboratories/methods at the time of this report.
The distribution of IFCC-approved and candidate-network laboratories is shown in Figure 5-3, along with the distribution of NGSP laboratories. Each IFCC network laboratory uses one or both of the two approved IFCC methods, HPLC-mass spectrometry and HPLC-capillary electrophoresis,5-10,5-11 with results being essentially identical between them, since they use the same primary reference materials for calibration. Although both the NGSP CPRL and IFCC methods are listed as reference methods in the database of the Joint Committee on Traceability in Laboratory Medicine,5-12 the IFCC method is the “higher order” reference method. The IFCC also offers manufacturers matrix-appropriate materials (frozen whole blood) with values assigned by the IFCC network to establish and check traceability.5-13
The IFCC Reference Method for HbA1c was approved by IFCC national members in 2001. However, there was a major obstacle in the implementation of the IFCC program because there was a bias between the NGSP and IFCC results; although results from the two systems were highly correlated, IFCC results were between 1.5% and 2.0% HbA1c lower than NGSP results across the measurement range. Despite the fact that the IFCC network and process provided traceability to a “true value,” and the IFCC method would become the anchor for international standardization, there were concerns expressed by the NGSP and major clinical organizations that changing the numbers reported in routine practice could cause confusion. One set of results could be confused with the other, causing misinterpretation that could adversely affect patient care. In addition, there was no evidence that a change in reported results from NGSP to IFCC would improve the quality of patient care. These concerns led to years of debate about which numbers should be reported in clinical practice.
In 2007, the IFCC, ADA, EASD and the International Diabetes Federation issued a consensus statement on the worldwide standardization of HbA1c.5-14 It recognized that the IFCC reference system should be the anchor for worldwide standardization, but it also recommended that HbA1c be reported in both IFCC and NGSP units. To avoid any confusion, IFCC results were to be reported in mmol/mol. IFCC numbers reported in mmol/mol would now be approximately 10 times higher than NGSP results, which would continue to be reported as a percent. It was also agreed that values could be reported as estimated average glucose (eAG), as previously recommended by several clinical organizations, if the outcome of a forthcoming study examining the relationship between average blood glucose and HbA1c showed this to be feasible.
Although subsequent publication of results from this study established a linear relationship between average glucose and HbA1c and declared that HbA1c results could be reported as eAG,5-15 many experts believed there was too much variability in the HbA1c/glucose relationship and the eAG should not be reported.5-16 Updated statements based on consensus meetings in 2009 and 2011 no longer included the recommendation to report eAG. However, these more recent statements urged that journals require submitted manuscripts to report HbA1c in both SI (IFCC, mmol/mol) and NGSP/DCCT (%) units, and that conversion tables should be easily accessible to the diabetes community.5-17–5-19
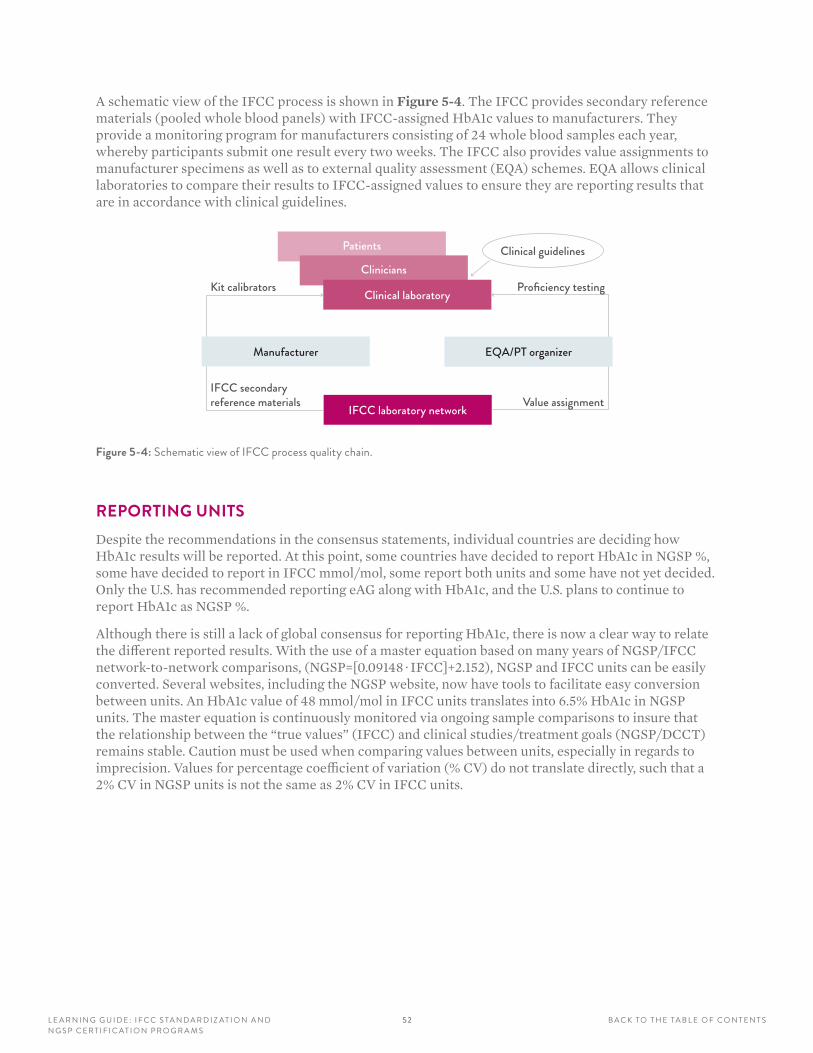
52L E A R N I N G G U I D E : I F C C S TA N D A R D I Z AT I O N A N D N G S P C E R T I F I C AT I O N P R O G R A M S
B A C K TO T H E TA B L E O F C O N T E N T S
A schematic view of the IFCC process is shown in Figure 5-4. The IFCC provides secondary reference materials (pooled whole blood panels) with IFCC-assigned HbA1c values to manufacturers. They provide a monitoring program for manufacturers consisting of 24 whole blood samples each year, whereby participants submit one result every two weeks. The IFCC also provides value assignments to manufacturer specimens as well as to external quality assessment (EQA) schemes. EQA allows clinical laboratories to compare their results to IFCC-assigned values to ensure they are reporting results that are in accordance with clinical guidelines.
Patients
Clinicians
Clinical laboratory
IFCC laboratory network Value assignment
Proficiency testingKit calibrators
IFCC secondary reference materials
Manufacturer EQA/PT organizer
Clinical guidelines
Figure 5-4: Schematic view of IFCC process quality chain .
REPORTING UNITSDespite the recommendations in the consensus statements, individual countries are deciding how HbA1c results will be reported. At this point, some countries have decided to report HbA1c in NGSP %, some have decided to report in IFCC mmol/mol, some report both units and some have not yet decided. Only the U.S. has recommended reporting eAG along with HbA1c, and the U.S. plans to continue to report HbA1c as NGSP %.
Although there is still a lack of global consensus for reporting HbA1c, there is now a clear way to relate the different reported results. With the use of a master equation based on many years of NGSP/IFCC network-to-network comparisons, (NGSP=[0.09148 · IFCC]+2.152), NGSP and IFCC units can be easily converted. Several websites, including the NGSP website, now have tools to facilitate easy conversion between units. An HbA1c value of 48 mmol/mol in IFCC units translates into 6.5% HbA1c in NGSP units. The master equation is continuously monitored via ongoing sample comparisons to insure that the relationship between the “true values” (IFCC) and clinical studies/treatment goals (NGSP/DCCT) remains stable. Caution must be used when comparing values between units, especially in regards to imprecision. Values for percentage coefficient of variation (% CV) do not translate directly, such that a 2% CV in NGSP units is not the same as 2% CV in IFCC units.
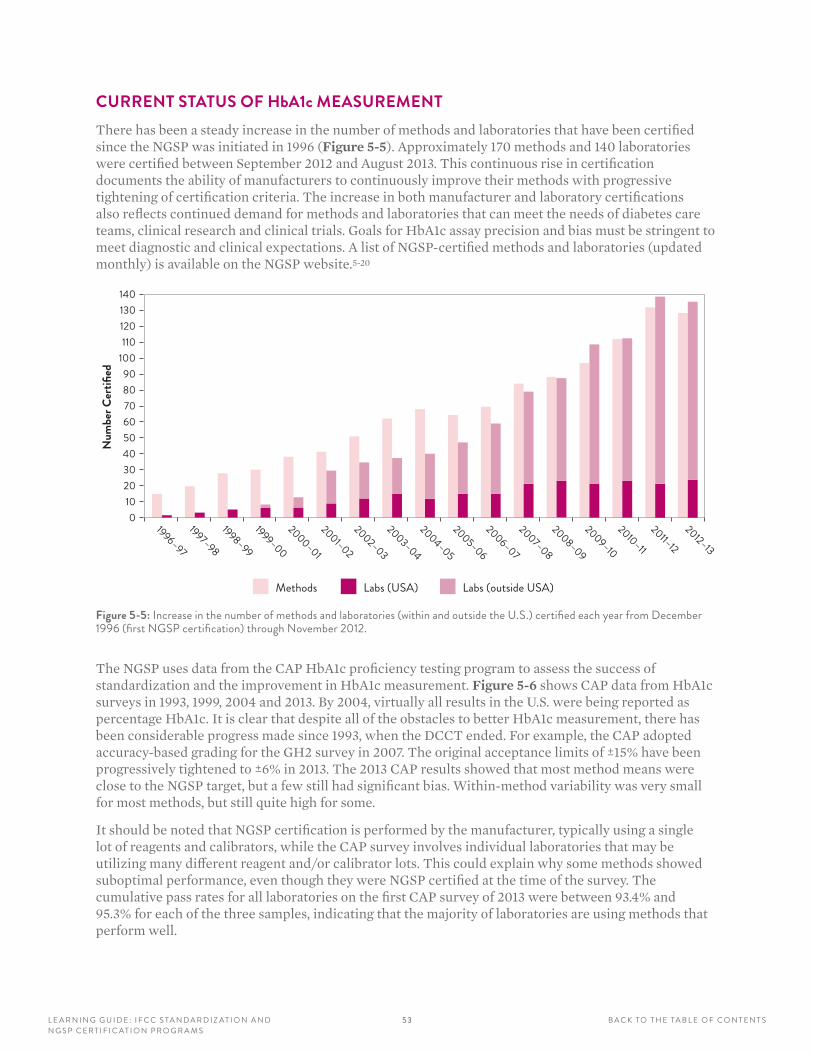
5 3L E A R N I N G G U I D E : I F C C S TA N D A R D I Z AT I O N A N D N G S P C E R T I F I C AT I O N P R O G R A M S
B A C K TO T H E TA B L E O F C O N T E N T S
CURRENT STATUS OF HbA1c MEASUREMENTThere has been a steady increase in the number of methods and laboratories that have been certified since the NGSP was initiated in 1996 (Figure 5-5). Approximately 170 methods and 140 laboratories were certified between September 2012 and August 2013. This continuous rise in certification documents the ability of manufacturers to continuously improve their methods with progressive tightening of certification criteria. The increase in both manufacturer and laboratory certifications also reflects continued demand for methods and laboratories that can meet the needs of diabetes care teams, clinical research and clinical trials. Goals for HbA1c assay precision and bias must be stringent to meet diagnostic and clinical expectations. A list of NGSP-certified methods and laboratories (updated monthly) is available on the NGSP website.5-20
140130120110
1009080706050403020100
Num
ber C
ertifi
ed
1996–97
1997–98
1998–99
1999–00
2000–01
2001–02
2002–03
2003–04
2004–05
2005–06
2006–07
2007–08
2008–09
2009–10
2010–11
2011–12
2012–13
Methods Labs (USA) Labs (outside USA)
Figure 5-5: Increase in the number of methods and laboratories (within and outside the U .S .) certified each year from December 1996 (first NGSP certification) through November 2012 .
The NGSP uses data from the CAP HbA1c proficiency testing program to assess the success of standardization and the improvement in HbA1c measurement. Figure 5-6 shows CAP data from HbA1c surveys in 1993, 1999, 2004 and 2013. By 2004, virtually all results in the U.S. were being reported as percentage HbA1c. It is clear that despite all of the obstacles to better HbA1c measurement, there has been considerable progress made since 1993, when the DCCT ended. For example, the CAP adopted accuracy-based grading for the GH2 survey in 2007. The original acceptance limits of ±15% have been progressively tightened to ±6% in 2013. The 2013 CAP results showed that most method means were close to the NGSP target, but a few still had significant bias. Within-method variability was very small for most methods, but still quite high for some.
It should be noted that NGSP certification is performed by the manufacturer, typically using a single lot of reagents and calibrators, while the CAP survey involves individual laboratories that may be utilizing many different reagent and/or calibrator lots. This could explain why some methods showed suboptimal performance, even though they were NGSP certified at the time of the survey. The cumulative pass rates for all laboratories on the first CAP survey of 2013 were between 93.4% and 95.3% for each of the three samples, indicating that the majority of laboratories are using methods that perform well.
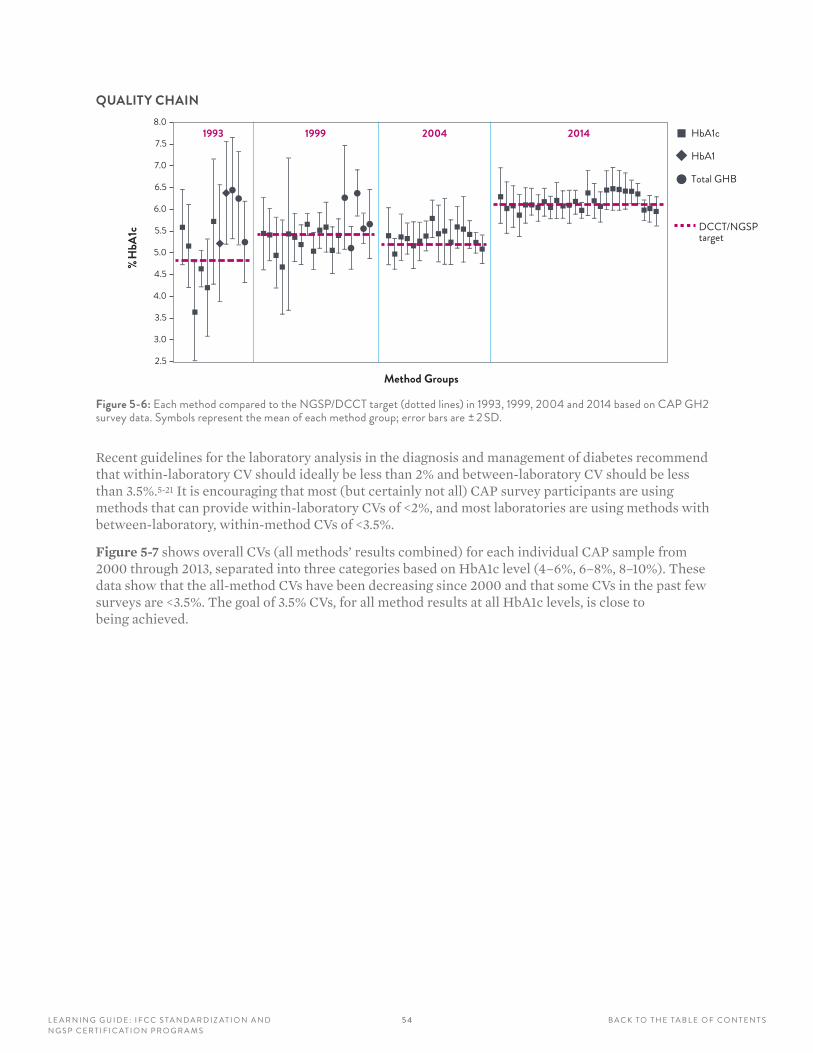
5 4L E A R N I N G G U I D E : I F C C S TA N D A R D I Z AT I O N A N D N G S P C E R T I F I C AT I O N P R O G R A M S
B A C K TO T H E TA B L E O F C O N T E N T S
QUALITY CHAIN8.0
7.5
7.0
6.5
6.0
5.5
5.0
4.5
4.0
3.5
3.0
2.5
Method Groups
DCCT/NGSPtarget
%H
bA1c
1993 1999 2004 2014 HbA1c
HbA1
Total GHB
Figure 5-6: Each method compared to the NGSP/DCCT target (dotted lines) in 1993, 1999, 2004 and 2014 based on CAP GH2 survey data . Symbols represent the mean of each method group; error bars are ± 2 SD .
Recent guidelines for the laboratory analysis in the diagnosis and management of diabetes recommend that within-laboratory CV should ideally be less than 2% and between-laboratory CV should be less than 3.5%.5-21 It is encouraging that most (but certainly not all) CAP survey participants are using methods that can provide within-laboratory CVs of <2%, and most laboratories are using methods with between-laboratory, within-method CVs of <3.5%.
Figure 5-7 shows overall CVs (all methods’ results combined) for each individual CAP sample from 2000 through 2013, separated into three categories based on HbA1c level (4–6%, 6–8%, 8–10%). These data show that the all-method CVs have been decreasing since 2000 and that some CVs in the past few surveys are <3.5%. The goal of 3.5% CVs, for all method results at all HbA1c levels, is close to being achieved.
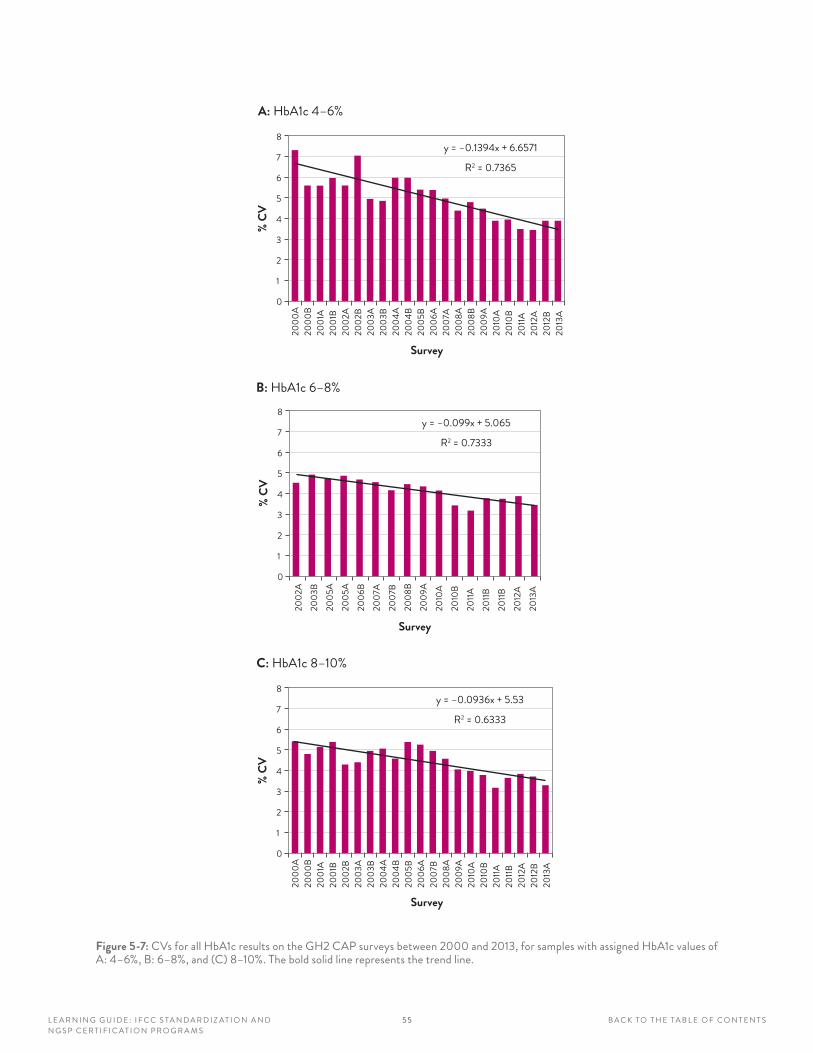
5 5L E A R N I N G G U I D E : I F C C S TA N D A R D I Z AT I O N A N D N G S P C E R T I F I C AT I O N P R O G R A M S
B A C K TO T H E TA B L E O F C O N T E N T S
2000
A20
00B
2001
A20
01B
2002
A20
02B
2003
A20
03B
2004
A20
04B
2005
B20
06A
2007
A20
08A
2008
B20
09A
2010
A20
10B
2011A
2012
A20
12B
2013
A
8
7
6
5
4
3
2
1
0
% CV
Survey
y = –0.1394x + 6.6571
R2 = 0.7365
A: HbA1c 4–6%
2002
A20
03B
2005
A20
05A
2006
B20
07A
2007
B20
08B
2009
A20
10A
2010
B20
11A20
11B20
11B20
12A
2013
A
8
7
6
5
4
3
2
1
0
% CV
Survey
y = –0.099x + 5.065
R2 = 0.7333
B: HbA1c 6–8%
2000
A20
00B
2001
A20
01B
2002
B20
03A
2003
B20
04A
2004
B20
05B
2006
A20
07B
2008
A20
09A
2010
A20
10B
2011A
2011B
2012
A20
12B
2013
A
8
7
6
5
4
3
2
1
0
% CV
Survey
y = –0.0936x + 5.53
R2 = 0.6333
C: HbA1c 8–10%
Figure 5-7: CVs for all HbA1c results on the GH2 CAP surveys between 2000 and 2013, for samples with assigned HbA1c values of A: 4–6%, B: 6–8%, and (C) 8–10% . The bold solid line represents the trend line .
5 6L E A R N I N G G U I D E : I F C C S TA N D A R D I Z AT I O N A N D N G S P C E R T I F I C AT I O N P R O G R A M S
B A C K TO T H E TA B L E O F C O N T E N T S
DISCUSSIONThe NGSP and IFCC networks serve different but complementary purposes, with the former applying defined acceptable limits for method performance that are based on clinical requirements, and the latter providing traceability to an accuracy base. The ongoing comparisons between the networks ensure that results will remain consistent over time. There are still unanswered questions about how changes from one measurement scale to the other will affect global standardization of HbA1c and patient care.
There is some evidence that a change in the scale of HbA1c results can affect patient glycemic control. This psychological effect was reported in Sweden when there was a change from the Swedish Mono-S calibration to numbers comparable to those from the DCCT — after adjusting for the higher DCCT assay calibration, patient HbA1c results actually decreased significantly, indicating improvement of glycemic control.5-22 Conversely, when the laboratory changed back to their Mono-S calibration, patient glycemic control worsened. Although the IFCC change from percentage to mmol/mol will increase patients’ HbA1c results, it is difficult to predict what effect such a large increase (almost tenfold with a change from NGSP to IFCC units) will have on patient care. Only one study thus far, from the UK, has reported that a change to SI HbA1c reporting did not lead to any marked short-term deterioration in glycemia in patients with initial poor glucose control.5-23 Much will depend on how the changes are implemented by individual countries; education of healthcare providers and patients will be essential to avoiding negative impact on patient care.
Manufacturers have responded to the need for better methods. Over 93% of laboratories participating in the CAP GH2 survey, using a variety of methods, provided results that were within 6% of NGSP value assignments, and CVs for all results on the survey are approaching 3.5% or less. This improvement is vital to accurate diabetes diagnosis, as well as optimal care of patients with diabetes.
57L E A R N I N G G U I D E : I F C C S TA N D A R D I Z AT I O N A N D N G S P C E R T I F I C AT I O N P R O G R A M S
B A C K TO T H E TA B L E O F C O N T E N T S
1. The DCCT and UKPDS were important studies that:
A Determined the clinical impact of poor glucose control on liver function
B Established HbA1c standardization methods
C Showed a direct relationship between glycemic control (measured by HbA1c) and risk for complications
D Proved that HbA1c was better than glucose for monitoring diabetes
2. Improvements in HbA1c measurement and standardization are reflected in CAP survey results. The current CAP proficiency survey grading is:
A Compared within peer groups
B Compared within peer groups with a limit of ± 6%
C Accuracy-based with NGSP value assignment and a limit of ± 6%
D Accuracy-based with IFCC millimoles-per-mole values assigned
E Based on limits of ±10%
3. Recent guidelines for laboratory analysis of HbA1c for diabetes diagnosis and monitoring recommend that within- and between-laboratory CVs should be:
A Less than 2% for both
B Less than 2% and 3.5%, respectively
C Less than the biological variability of HbA1c
D Less than 3.5% for both
4. The purpose of the NGSP is to:
A Develop a plan for worldwide standardization and convert measurements to units of millimoles per mole
B Develop and implement a plan that allows clinical laboratories to relate their HbA1c to results from clinical studies
C Standardize HbA1c to a “true value”
D Show traceability to a higher order method
5. NGSP certification includes:
A Comparison to the IFCC Reference Method network
B Comparison of 40 individual sample results to a Secondary Reference Laboratory of the NGSP
C Certification of traceability to a true value percentage
D Studies on interference of common Hb variants
6. HbA1c is being reported worldwide:
A Only as a percentage
B Only in millimoles per mole
C As a percentage and/or in millimoles per mole
D In millimoles per liter
7. A method can be both traceable to IFCC and NGSP-certified:
A True
B False
REVIEW QUESTIONS: SECTION 5
5 8 B A C K TO T H E TA B L E O F C O N T E N T SLE ARNING GUIDE: CLINICAL PRAC TICE AND RECOMMENDATIONS FOR USE OF HbA1c TESTING
LEARNING OBJECTIVES
After completing this section, you will be able to:
• Describe the HbA1c molecule and what impacts its physiology
• State the recommended reference intervals for HbA1c
• Identify the uses of HbA1c for diagnostics and the limitations of this marker
• Recognize how to use HbA1c for diagnostic purposes
SECTION 6CLINICAL PRACTICE AND RECOMMENDATIONS FOR USE OF HbA1c TESTING
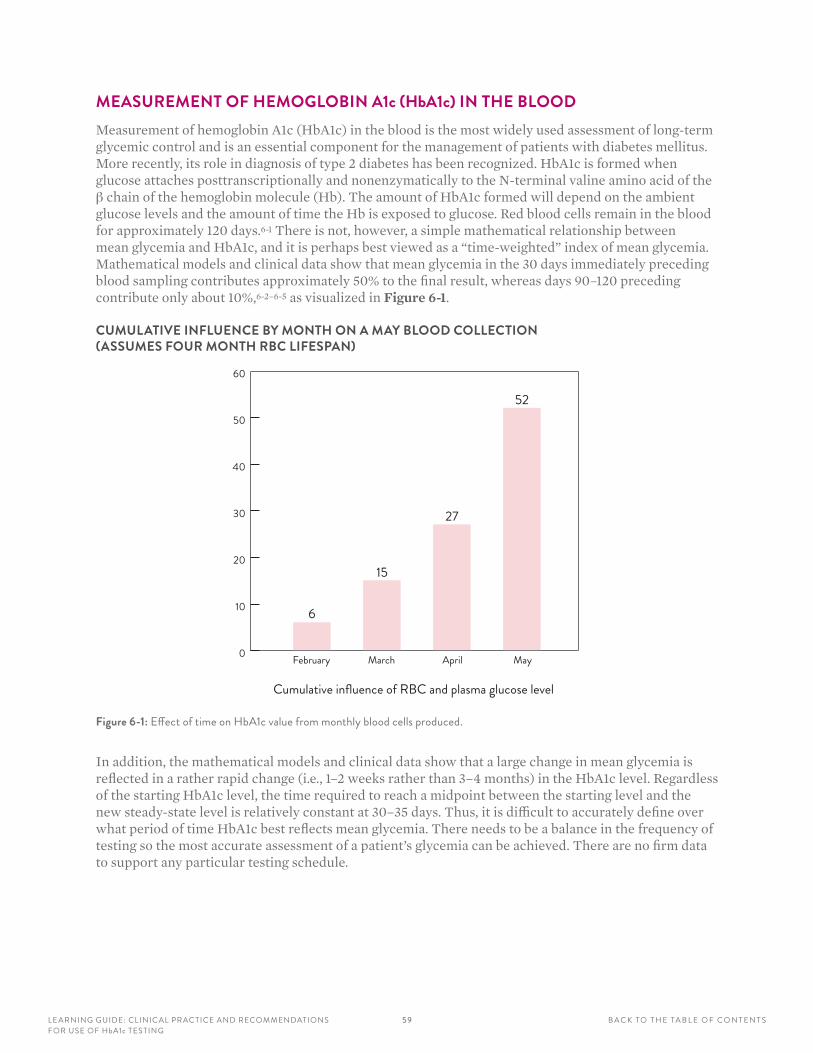
5 9LE ARNING GUIDE: CLINICAL PRAC TICE AND RECOMMENDATIONS FOR USE OF HbA1c TESTING
B A C K TO T H E TA B L E O F C O N T E N T S
MEASUREMENT OF HEMOGLOBIN A1c (HbA1c) IN THE BLOODMeasurement of hemoglobin A1c (HbA1c) in the blood is the most widely used assessment of long-term glycemic control and is an essential component for the management of patients with diabetes mellitus. More recently, its role in diagnosis of type 2 diabetes has been recognized. HbA1c is formed when glucose attaches posttranscriptionally and nonenzymatically to the N-terminal valine amino acid of the β chain of the hemoglobin molecule (Hb). The amount of HbA1c formed will depend on the ambient glucose levels and the amount of time the Hb is exposed to glucose. Red blood cells remain in the blood for approximately 120 days.6-1 There is not, however, a simple mathematical relationship between mean glycemia and HbA1c, and it is perhaps best viewed as a “time-weighted” index of mean glycemia. Mathematical models and clinical data show that mean glycemia in the 30 days immediately preceding blood sampling contributes approximately 50% to the final result, whereas days 90–120 preceding contribute only about 10%,6-2–6-5 as visualized in Figure 6-1.
CUMULATIVE INFLUENCE BY MONTH ON A MAY BLOOD COLLECTION (ASSUMES FOUR MONTH RBC LIFESPAN)
0
10
20
30
40
50
60
6
15
27
52
February March April May
Cumulative influence of RBC and plasma glucose level
Figure 6-1: Effect of time on HbA1c value from monthly blood cells produced .
In addition, the mathematical models and clinical data show that a large change in mean glycemia is reflected in a rather rapid change (i.e., 1–2 weeks rather than 3–4 months) in the HbA1c level. Regardless of the starting HbA1c level, the time required to reach a midpoint between the starting level and the new steady-state level is relatively constant at 30–35 days. Thus, it is difficult to accurately define over what period of time HbA1c best reflects mean glycemia. There needs to be a balance in the frequency of testing so the most accurate assessment of a patient’s glycemia can be achieved. There are no firm data to support any particular testing schedule.
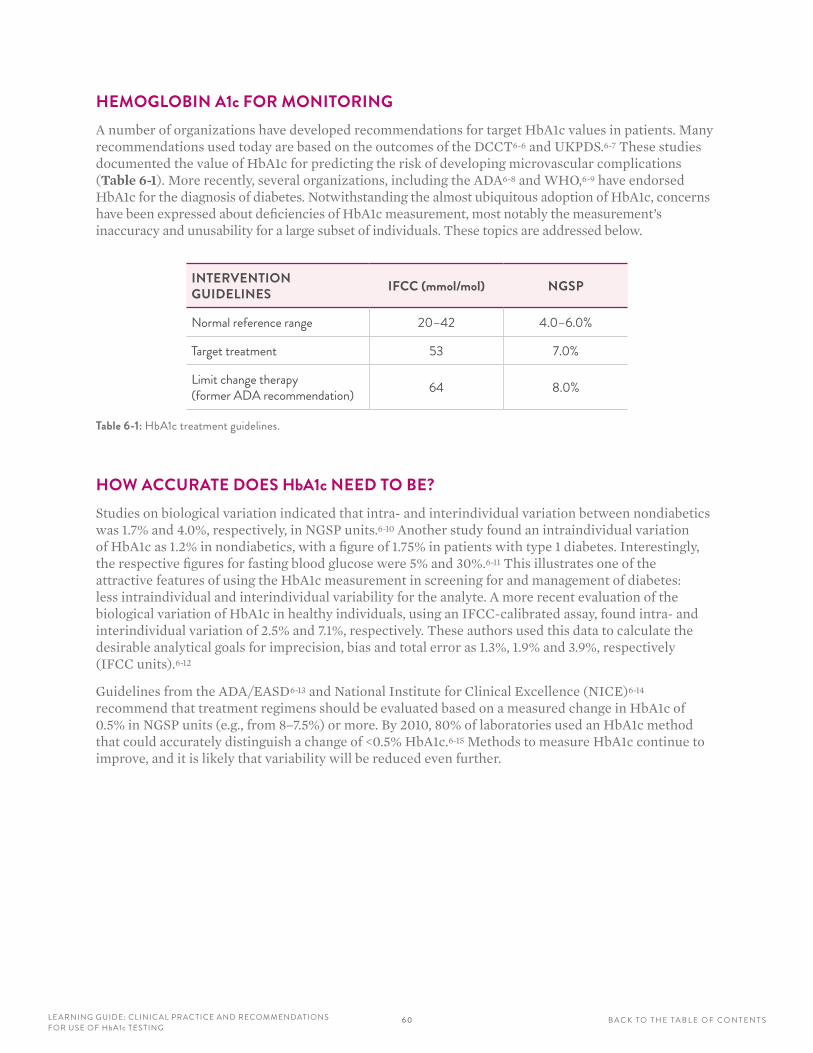
6 0LE ARNING GUIDE: CLINICAL PRAC TICE AND RECOMMENDATIONS FOR USE OF HbA1c TESTING
B A C K TO T H E TA B L E O F C O N T E N T S
HEMOGLOBIN A1c FOR MONITORINGA number of organizations have developed recommendations for target HbA1c values in patients. Many recommendations used today are based on the outcomes of the DCCT6-6 and UKPDS.6-7 These studies documented the value of HbA1c for predicting the risk of developing microvascular complications (Table 6-1). More recently, several organizations, including the ADA6-8 and WHO,6-9 have endorsed HbA1c for the diagnosis of diabetes. Notwithstanding the almost ubiquitous adoption of HbA1c, concerns have been expressed about deficiencies of HbA1c measurement, most notably the measurement’s inaccuracy and unusability for a large subset of individuals. These topics are addressed below.
INTERVENTION GUIDELINES IFCC (mmol/mol) NGSP
Normal reference range 20–42 4 .0–6 .0%
Target treatment 53 7 .0%
Limit change therapy (former ADA recommendation) 64 8 .0%
Table 6-1: HbA1c treatment guidelines .
HOW ACCURATE DOES HbA1c NEED TO BE?Studies on biological variation indicated that intra- and interindividual variation between nondiabetics was 1.7% and 4.0%, respectively, in NGSP units.6-10 Another study found an intraindividual variation of HbA1c as 1.2% in nondiabetics, with a figure of 1.75% in patients with type 1 diabetes. Interestingly, the respective figures for fasting blood glucose were 5% and 30%.6-11 This illustrates one of the attractive features of using the HbA1c measurement in screening for and management of diabetes: less intraindividual and interindividual variability for the analyte. A more recent evaluation of the biological variation of HbA1c in healthy individuals, using an IFCC-calibrated assay, found intra- and interindividual variation of 2.5% and 7.1%, respectively. These authors used this data to calculate the desirable analytical goals for imprecision, bias and total error as 1.3%, 1.9% and 3.9%, respectively (IFCC units).6-12
Guidelines from the ADA/EASD6-13 and National Institute for Clinical Excellence (NICE)6-14 recommend that treatment regimens should be evaluated based on a measured change in HbA1c of 0.5% in NGSP units (e.g., from 8–7.5%) or more. By 2010, 80% of laboratories used an HbA1c method that could accurately distinguish a change of <0.5% HbA1c.6-15 Methods to measure HbA1c continue to improve, and it is likely that variability will be reduced even further.
61LE ARNING GUIDE: CLINICAL PRAC TICE AND RECOMMENDATIONS FOR USE OF HbA1c TESTING
B A C K TO T H E TA B L E O F C O N T E N T S
HEMOGLOBIN A1c IN PREGNANCYThere is much debate around the value of HbA1c in pregnancy. It is undoubtably of great importance in the prenatal care of women with diabetes, but it is less clear as to its value during pregnancy in general. In the UK, the NICE guideline on diabetes in pregnancy (National Collaborating Centre) recommends that HbA1c should not be used routinely for assessing glycemic control in the second and third trimesters of pregnancy.6-16 The IDF global guideline on pregnancy and diabetes recommends not using routine measurement of HbA1c for management of gestational diabetes mellitus (GDM).6-17
A systematic review of antepartum HbA1c, maternal diabetes outcomes and selected offspring outcomes6-18 found HbA1c at gestational diabetes mellitus (GDM) diagnosis was positively associated with postpartum abnormal glucose. Women with postpartum type 2 diabetes or impaired glucose tolerance had a mean HbA1c at GDM diagnosis higher than those with normal postpartum glucose (P ≤ 0.002), and a 1% increase in HbA1c at GDM diagnosis was associated with a 2.36 times higher odds ratio of postpartum abnormal glucose six weeks after delivery (95% confidence interval 1.19, 4.68). The association of HbA1c and birth weight varied substantially between studies, with correlation coefficients ranging from 0.11 to 0.51. Other recently published studies have found conflicting relationships between HbA1c levels and infant outcomes, but some correlation with maternal outcomes.6-19–6-21
HEMOGLOBIN A1c FOR DIAGNOSISAs our understanding of diabetes has evolved over the past 50 years, the diagnostic criteria for diabetes have changed. The diagnosis of diabetes has classically been determined as the glycemic threshold for progression to microvascular disease, predominantly retinopathy. By the 1960s, the OGTT had become established as the means by which type 2 diabetes should be identified, but there was inconsistency as to how the test should be performed, the quantity of glucose that should be ingested and the diagnostic blood glucose cutoffs. These criteria were standardized by the WHO in 19806-22 and have evolved since then, with the fasting plasma glucose (FPG) value more central to the diagnosis in the United States.6-23 Two reports have recommended incorporating HbA1c into the current diagnostic criteria.6-8, 6-24
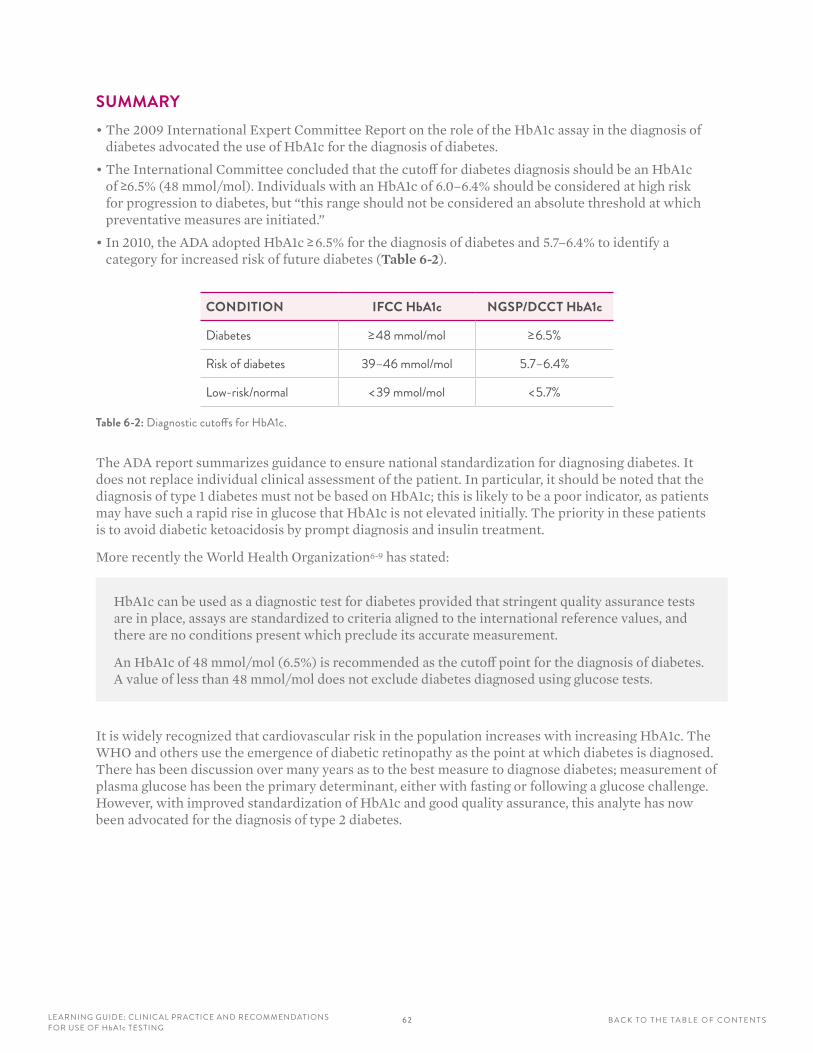
62LE ARNING GUIDE: CLINICAL PRAC TICE AND RECOMMENDATIONS FOR USE OF HbA1c TESTING
B A C K TO T H E TA B L E O F C O N T E N T S
SUMMARY• The 2009 International Expert Committee Report on the role of the HbA1c assay in the diagnosis of
diabetes advocated the use of HbA1c for the diagnosis of diabetes.
• The International Committee concluded that the cutoff for diabetes diagnosis should be an HbA1c of ≥6.5% (48 mmol/mol). Individuals with an HbA1c of 6.0–6.4% should be considered at high risk for progression to diabetes, but “this range should not be considered an absolute threshold at which preventative measures are initiated.”
• In 2010, the ADA adopted HbA1c ≥ 6.5% for the diagnosis of diabetes and 5.7–6.4% to identify a category for increased risk of future diabetes (Table 6-2).
CONDITION IFCC HbA1c NGSP/DCCT HbA1c
Diabetes ≥ 48 mmol/mol ≥ 6 .5%
Risk of diabetes 39–46 mmol/mol 5 .7–6 .4%
Low-risk/normal < 39 mmol/mol < 5 .7%
Table 6-2: Diagnostic cutoffs for HbA1c .
The ADA report summarizes guidance to ensure national standardization for diagnosing diabetes. It does not replace individual clinical assessment of the patient. In particular, it should be noted that the diagnosis of type 1 diabetes must not be based on HbA1c; this is likely to be a poor indicator, as patients may have such a rapid rise in glucose that HbA1c is not elevated initially. The priority in these patients is to avoid diabetic ketoacidosis by prompt diagnosis and insulin treatment.
More recently the World Health Organization6-9 has stated:
HbA1c can be used as a diagnostic test for diabetes provided that stringent quality assurance tests are in place, assays are standardized to criteria aligned to the international reference values, and there are no conditions present which preclude its accurate measurement.
An HbA1c of 48 mmol/mol (6.5%) is recommended as the cutoff point for the diagnosis of diabetes. A value of less than 48 mmol/mol does not exclude diabetes diagnosed using glucose tests.
It is widely recognized that cardiovascular risk in the population increases with increasing HbA1c. The WHO and others use the emergence of diabetic retinopathy as the point at which diabetes is diagnosed. There has been discussion over many years as to the best measure to diagnose diabetes; measurement of plasma glucose has been the primary determinant, either with fasting or following a glucose challenge. However, with improved standardization of HbA1c and good quality assurance, this analyte has now been advocated for the diagnosis of type 2 diabetes.
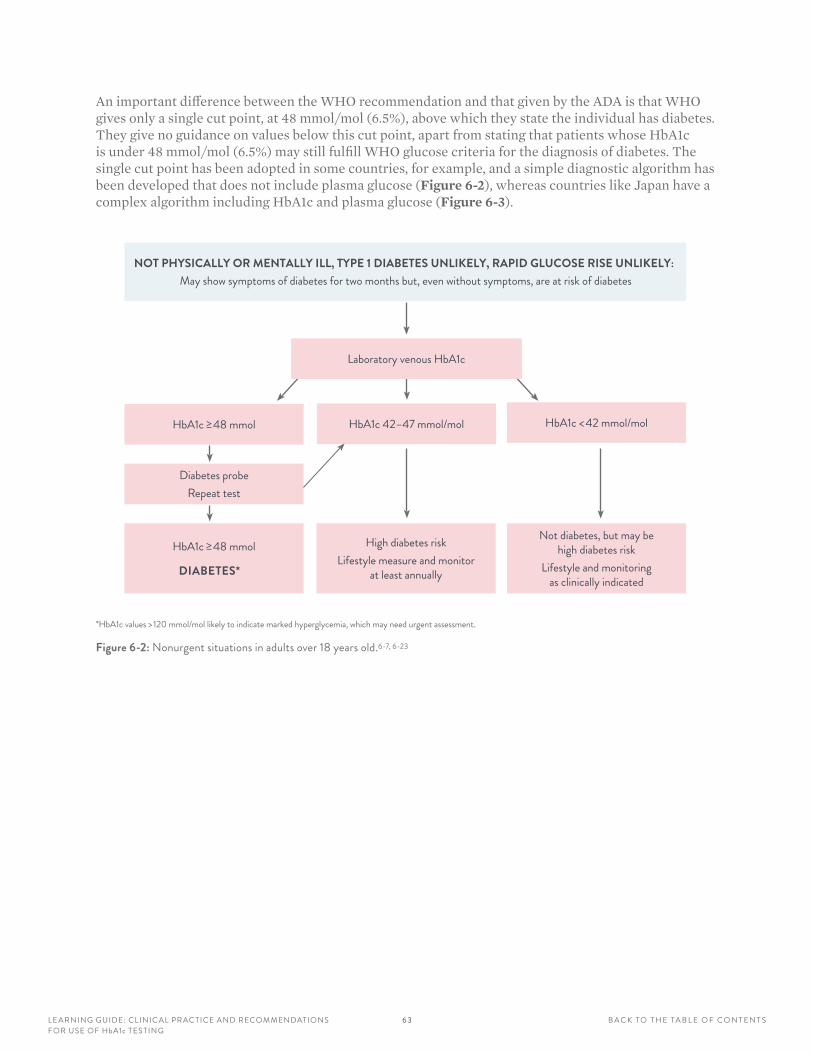
6 3LE ARNING GUIDE: CLINICAL PRAC TICE AND RECOMMENDATIONS FOR USE OF HbA1c TESTING
B A C K TO T H E TA B L E O F C O N T E N T S
An important difference between the WHO recommendation and that given by the ADA is that WHO gives only a single cut point, at 48 mmol/mol (6.5%), above which they state the individual has diabetes. They give no guidance on values below this cut point, apart from stating that patients whose HbA1c is under 48 mmol/mol (6.5%) may still fulfill WHO glucose criteria for the diagnosis of diabetes. The single cut point has been adopted in some countries, for example, and a simple diagnostic algorithm has been developed that does not include plasma glucose (Figure 6-2), whereas countries like Japan have a complex algorithm including HbA1c and plasma glucose (Figure 6-3).
NOT PHYSICALLY OR MENTALLY ILL, TYPE 1 DIABETES UNLIKELY, RAPID GLUCOSE RISE UNLIKELY:
May show symptoms of diabetes for two months but, even without symptoms, are at risk of diabetes
HbA1c ≥ 48 mmol
Diabetes probeRepeat test
HbA1c ≥ 48 mmol
DIABETES*
High diabetes riskLifestyle measure and monitor
at least annually
Not diabetes, but may be high diabetes risk
Lifestyle and monitoring as clinically indicated
HbA1c 42–47 mmol/mol HbA1c < 42 mmol/mol
Laboratory venous HbA1c
*HbA1c values > 120 mmol/mol likely to indicate marked hyperglycemia, which may need urgent assessment .
Figure 6-2: Nonurgent situations in adults over 18 years old .6-7, 6-23
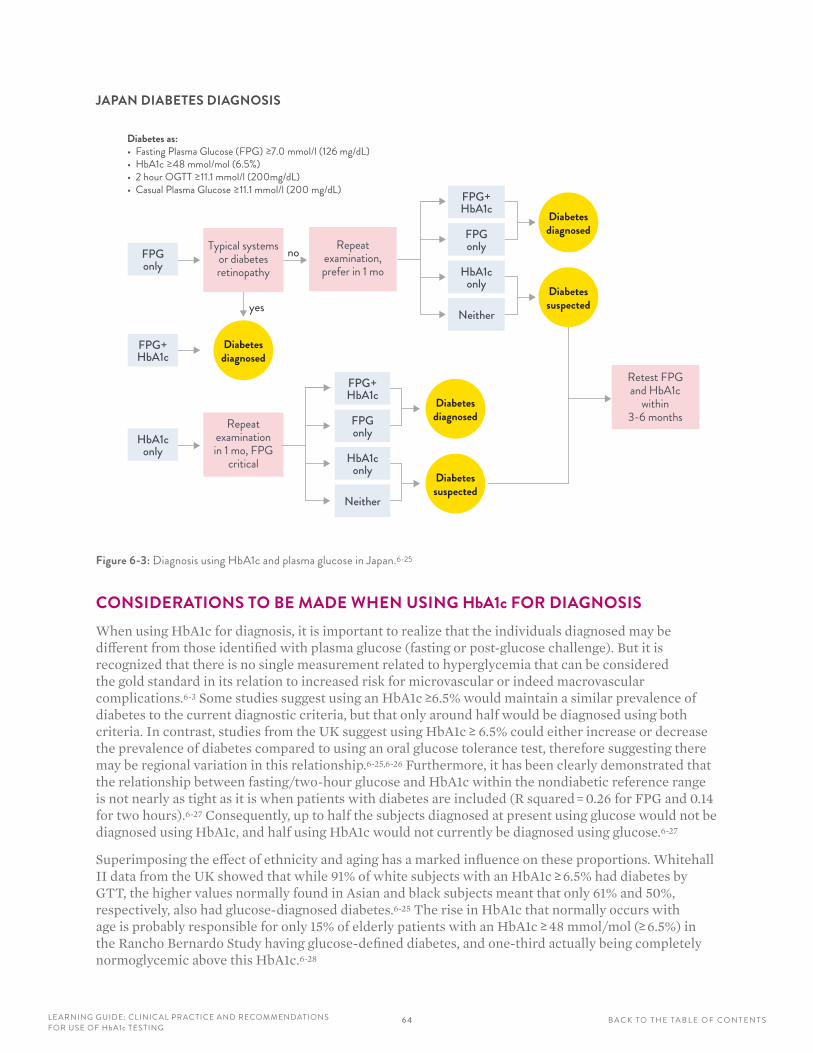
6 4LE ARNING GUIDE: CLINICAL PRAC TICE AND RECOMMENDATIONS FOR USE OF HbA1c TESTING
B A C K TO T H E TA B L E O F C O N T E N T S
JAPAN DIABETES DIAGNOSIS
FPGonly
FPG+HbA1c
HbA1conly
Typical systemsor diabetes retinopathy
Repeat examination in 1 mo, FPG
critical
Diabetesdiagnosed
Diabetesdiagnosed
Diabetessuspected
FPG+HbA1c
FPGonly
HbA1conly
Neither
Diabetesdiagnosed
Diabetessuspected
FPG+HbA1c
FPGonly
HbA1conly
Neitheryes
no Repeat examination, prefer in 1 mo
Retest FPG and HbA1c
within 3-6 months
Diabetes as:• Fasting Plasma Glucose (FPG) ≥7.0 mmol/l (126 mg/dL)• HbA1c ≥48 mmol/mol (6.5%)• 2 hour OGTT ≥11.1 mmol/l (200mg/dL)• Casual Plasma Glucose ≥11.1 mmol/l (200 mg/dL)
Figure 6-3: Diagnosis using HbA1c and plasma glucose in Japan .6-25
CONSIDERATIONS TO BE MADE WHEN USING HbA1c FOR DIAGNOSISWhen using HbA1c for diagnosis, it is important to realize that the individuals diagnosed may be different from those identified with plasma glucose (fasting or post-glucose challenge). But it is recognized that there is no single measurement related to hyperglycemia that can be considered the gold standard in its relation to increased risk for microvascular or indeed macrovascular complications.6-3 Some studies suggest using an HbA1c ≥6.5% would maintain a similar prevalence of diabetes to the current diagnostic criteria, but that only around half would be diagnosed using both criteria. In contrast, studies from the UK suggest using HbA1c ≥ 6.5% could either increase or decrease the prevalence of diabetes compared to using an oral glucose tolerance test, therefore suggesting there may be regional variation in this relationship.6-25,6-26 Furthermore, it has been clearly demonstrated that the relationship between fasting/two-hour glucose and HbA1c within the nondiabetic reference range is not nearly as tight as it is when patients with diabetes are included (R squared = 0.26 for FPG and 0.14 for two hours).6-27 Consequently, up to half the subjects diagnosed at present using glucose would not be diagnosed using HbA1c, and half using HbA1c would not currently be diagnosed using glucose.6-27
Superimposing the effect of ethnicity and aging has a marked influence on these proportions. Whitehall II data from the UK showed that while 91% of white subjects with an HbA1c ≥ 6.5% had diabetes by GTT, the higher values normally found in Asian and black subjects meant that only 61% and 50%, respectively, also had glucose-diagnosed diabetes.6-25 The rise in HbA1c that normally occurs with age is probably responsible for only 15% of elderly patients with an HbA1c ≥ 48 mmol/mol (≥ 6.5%) in the Rancho Bernardo Study having glucose-defined diabetes, and one-third actually being completely normoglycemic above this HbA1c.6-28
6 5LE ARNING GUIDE: CLINICAL PRAC TICE AND RECOMMENDATIONS FOR USE OF HbA1c TESTING
B A C K TO T H E TA B L E O F C O N T E N T S
WHEN HbA1c CANNOT BE USED FOR DIAGNOSISBased on ADA and WHO recommendations, it is recognized that HbA1c is not to be used for the diagnosis of diabetes in the following situations. HbA1c should be measured in such patients as part of clinical assessment, but a value <48 mmol/mol (6.5% HbA1c) does not exclude diabetes.
• All children and young people
• Pregnancy – current or recent (<2 months)
• Suspected type 1 diabetes no matter what age
• Short duration of diabetes symptoms
• Patients at high risk of diabetes who are acutely ill (HbA1c ≥48 mmol/mol confirms preexisting diabetes, but a value <48 mmol/mol does not exclude it, and such patients must be retested once the acute episode has resolved)
• Patients taking medications that may cause rapid glucose rise, e.g., corticosteroids or antipsychotics (if recently started) — HbA1c can be used in patients taking such medications long-term (i.e., >2 months) who are not clinically unwell
• Acute pancreatic damage or pancreatic surgery
• Renal failure
• HIV infection
Clinical judgement is needed for each patient to consider the possibility of conditions that might cause inappropriate exclusion or inclusion in the diabetes-diagnosed category.
FACTORS TO BE CONSIDERED:
ABNORMAL HEMOGLOBINS (VARIANT HEMOGLOBINS)Measurement of HbA1c is dependent on the hemoglobin circulating being predominantly HbA. The presence and prevalence of hemoglobinopathies (non-HbA) varies from race to race and country to country. As an example, data from the United States estimate that at least 10% of the country’s 26 million black citizens have either an HbS or HbC trait present.6-26 Being able to identify and account for abnormal hemoglobins depends on the particular HbA1c instrument being used, with most being able to discern some hemoglobinopathies, but not all.6-29,6-30 Some will not indicate the presence of hemoglobinopathies when producing a result.6-28 Patients with hemoglobinopathies may also have altered red cell survival, which will influence all HbA1c measurements.
ANEMIAIt is widely appreciated that hemolytic anemia, from whatever cause, can lead to HbA1c values that are lower than expected because of reduced red cell survival. However, iron deficiency anemia can lead to an inappropriate rise in HbA1c of 11–16 mmol/mol (1-1.5%), which falls after iron treatment.6-31 This common condition, which affects more than three million women in the United States,6-32 also seems to influence the HbA1c of people without diabetes, although perhaps not as markedly as in those with the disease.6-33 Iron deficiency may therefore lead to overdiagnosis. Patients with renal failure can demonstrate both iron deficiency and hemolytic anemia, thereby having an unpredictable effect on the HbA1c result.
6 6LE ARNING GUIDE: CLINICAL PRAC TICE AND RECOMMENDATIONS FOR USE OF HbA1c TESTING
B A C K TO T H E TA B L E O F C O N T E N T S
ALTERED LIFE SPAN OF THE RED CELLRecent commencement of erythropoietin therapy will result in a decrease in HbA1c due to increased red cell production and therefore reduction in the average red cell life span. Decreased erythrocyte life span will occur with some hemoglobinopathies, rheumatoid arthritis, or drugs such as antiretrovirals, ribavirin and dapsone. Increased HbA1c means increased erythrocyte life span as with splenectomy.
ETHNICITYThe results of the Diabetes Prevention Program (3819 individuals, 25 years old with impaired glucose tolerance [IGT]) indicate that ethnicity is an independent factor in HbA1c levels. “Adjusting for glucose concentration and a range of other factors, mean HbA1c levels were 5.78% for whites, 5.93% for Hispanics, 6.00% for Asians, 6.12% for American Indians, and 6.18% for blacks (P <0.001).”6-34
In a meta-analysis of data from six different population studies, comparison of white, black African and Indian populations displayed significant differences in correlation between diagnosis with HbA1c 48 mmol/mol and OGTT. In two of the three white populations, more than 90% of those with a diagnosis of diabetes by OGTT also had HbA1c ≥ 48 mmol/mol, but this fell to 50% and 62% in black African and Indian populations, respectively.6-26
Although there are no current guidelines on interpretation of HbA1c values in relation to race or ethnicity, the evidence suggests that this is an area that warrants further investigation.
AGEGlycemia levels are known to alter with age. A meta-analysis of data from the Framingham Offspring Study and the National Health and Nutrition Examination Survey showed that, in nondiabetic patients, there is an approximate increase of 7 mmol/mol HbA1c (0.6% NGSP) between the ages of 40 and 70 years.6-35 The study included delineation of study groups to exclude those with impaired fasting glucose (IFG) and/or IGT.
GENDERAlthough there is no difference in mean HbA1c values between males and females, the intraindividual variation is greater in females than in males, although this was not found to be significant.6-12
67LE ARNING GUIDE: CLINICAL PRAC TICE AND RECOMMENDATIONS FOR USE OF HbA1c TESTING
B A C K TO T H E TA B L E O F C O N T E N T S
OLDER HbA1c METHODSNewer methods have overcome some of the interferences that once caused problems, but it remains important to remember interferences whenever a result is produced that does not fit the clinical picture. Interferences include:
Jaundice and Hyperlipidemia
Severely icteric specimens may give falsely elevated HbA1 values with methods relying on charge separation if whole blood hemolysates are used, since bilirubin migrates with the fast hemoglobin and absorbs at the detecting wavelength. Hyperlipidemia can also cause false elevation of HbA1, since latescence elutes in the first HbA1 fraction and absorbs at 415 nm. The problem could be magnified if analysis is performed on postprandial samples. Since hyperlipidemia is a relatively common finding in diabetics, this limitation should be appreciated.
Acetylation by Aspirin
Aspirin modifies several sites, presumably lysines, on both the α and β chains of HbA. Acetylation of lysine residues with aspirin confers a negative charge on the modified protein. The modified hemoglobin has altered electrophoretic and chromatographic (ion exchange) properties, migrating ahead of HbA0 like HbA1. Patients on long-term, high-dose aspirin therapy may have a two-fold increase in the modified hemoglobin. Also, a linear increase in HbA1 has been demonstrated with increasing aspirin concentration and time of incubation of red cells, hemolysate or purified HbA0. It is likely, therefore, that patients receiving high-dose aspirin will demonstrate increased levels of HbA1.
Carbamylation by Uremia in Renal Failure
Elevated levels of both HbA1 and HbA1c-like hemoglobins have been reported in patients with uremia due to renal failure. In renal failure, significant numbers of patients have impaired glucose tolerance, and those on dialysis are usually dialyzed against a fluid with high glucose content. It is likely that some increase in HbA1 will occur due to the presence of the increased glucose concentration (although patients in chronic renal failure have a tendency to shortened red cell survival). Therefore, in uremic patients, HbA1c results obtained using methods relying on charge separation must be interpreted with care. It is also worth noting that patients with renal failure are often predisposed to anemia with altered red cell survival, which, as stated above, will also have an effect on the level of glycated hemoglobin.
DISCUSSIONWhereas it may be impossible to stop the inexorable move towards pandemic levels of diabetes, appropriate therapy can have an effect on the glycemic control of these patients and thereby limit the long-term complications and associated burden on the health economy. To achieve good control, there needs to be an accurate and reliable means of assessing the glycemic status of patients.
Hemoglobin A1c has long been recognized as being central to achieving good glucose control, but variation in the way it has been reported globally has limited universal adoption of target goals in all countries. To limit the global effect of diabetes and its financial burden, agreement on a globally accepted standardization system for HbA1c measurement is vital. This will continue to allow for an international approach to the formulation and implementation of guidelines for diagnosis and monitoring of diabetes.
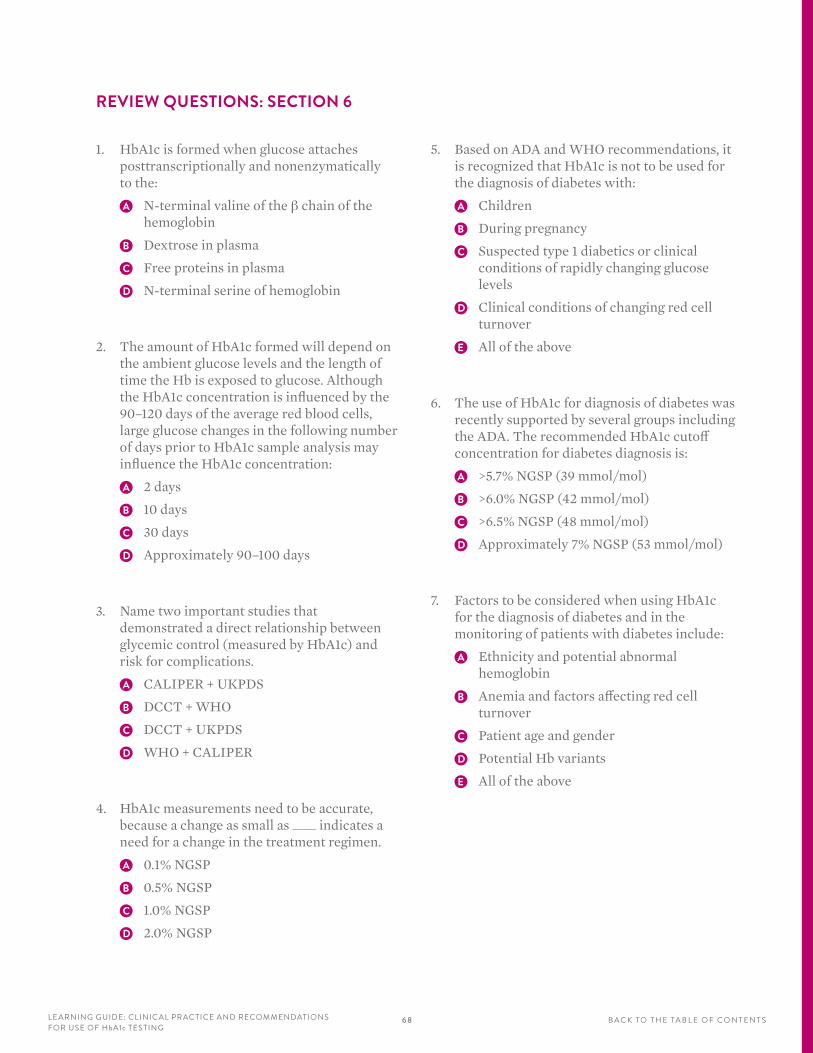
6 8LE ARNING GUIDE: CLINICAL PRAC TICE AND RECOMMENDATIONS FOR USE OF HbA1c TESTING
B A C K TO T H E TA B L E O F C O N T E N T S
1. HbA1c is formed when glucose attaches posttranscriptionally and nonenzymatically to the:
A N-terminal valine of the β chain of the hemoglobin
B Dextrose in plasma
C Free proteins in plasma
D N-terminal serine of hemoglobin
2. The amount of HbA1c formed will depend on the ambient glucose levels and the length of time the Hb is exposed to glucose. Although the HbA1c concentration is influenced by the 90–120 days of the average red blood cells, large glucose changes in the following number of days prior to HbA1c sample analysis may influence the HbA1c concentration:
A 2 days
B 10 days
C 30 days
D Approximately 90–100 days
3. Name two important studies that demonstrated a direct relationship between glycemic control (measured by HbA1c) and risk for complications.
A CALIPER + UKPDS
B DCCT + WHO
C DCCT + UKPDS
D WHO + CALIPER
4. HbA1c measurements need to be accurate, because a change as small as ____ indicates a need for a change in the treatment regimen.
A 0.1% NGSP
B 0.5% NGSP
C 1.0% NGSP
D 2.0% NGSP
5. Based on ADA and WHO recommendations, it is recognized that HbA1c is not to be used for the diagnosis of diabetes with:
A Children
B During pregnancy
C Suspected type 1 diabetics or clinical conditions of rapidly changing glucose levels
D Clinical conditions of changing red cell turnover
E All of the above
6. The use of HbA1c for diagnosis of diabetes was recently supported by several groups including the ADA. The recommended HbA1c cutoff concentration for diabetes diagnosis is:
A >5.7% NGSP (39 mmol/mol)
B >6.0% NGSP (42 mmol/mol)
C >6.5% NGSP (48 mmol/mol)
D Approximately 7% NGSP (53 mmol/mol)
7. Factors to be considered when using HbA1c for the diagnosis of diabetes and in the monitoring of patients with diabetes include:
A Ethnicity and potential abnormal hemoglobin
B Anemia and factors affecting red cell turnover
C Patient age and gender
D Potential Hb variants
E All of the above
REVIEW QUESTIONS: SECTION 6
6 9L E A R N I N G G U I D E : D I A B E T E S B A C K TO T H E TA B L E O F C O N T E N T S
APPENDIXAPPENDIX A: GLOSSARY OF TERMS
APPENDIX B: REFERENCES
APPENDIX C: CORRECT RESPONSES
6 9L E A R N I N G G U I D E : A P P E N D I X B A C K TO T H E TA B L E O F C O N T E N T S
70L E A R N I N G G U I D E : A P P E N D I X B A C K TO T H E TA B L E O F C O N T E N T S
APPENDIX A: GLOSSARY OF TERMSα-thalassemia: Thalassemias are inherited autosomal recessive blood disorders that are caused by the weakening and destruction of red blood cells. The α-thalassemias involve the genes HBA1 and HBA2 and are also connected to the deletion of the 16p chromosome. α-thalassemias result in decreased alpha-globin production with fewer alpha-globin chains, resulting in an excess of β chains in adults and excess g chains in newborns. Abnormal oxygen dissociation curves are observed due to the excess β chains that form unstable tetramers (called hemoglobin H or HbH of four beta chains).
Affinity chromatography methods: Affinity chromatography separates proteins on the basis of a reversible interaction between a protein or group of proteins and a specific ligand that has been coupled to a chromatography matrix. This technique is ideally suited for the capture of intermediate or final products in a purification protocol whenever a suitable ligand is available for the protein(s) of interest.
American Diabetes Association (ADA): The American Diabetes Association is a U.S.-based association working to fight the consequences of diabetes and to help those affected by diabetes. The ADA funds research to manage, cure and prevent diabetes. The ADA delivers services to hundreds of communities, provides information for both patients and healthcare professionals, and acts as advocates on behalf of people with diabetes.
Anemia: Anemia can be characterized as a decrease in number of red blood cells (RBCs) or less than the normal quantity of hemoglobin in the blood.
Atherosclerosis: Progressive disease characterized by thickening of the arterial wall due to the deposition of fatty materials.
β-thalassemia: Thalassemia is caused by variant or missing genes that affect how the body makes hemoglobin, and β-thalassemias are due to mutations in the HBB gene on chromosome 11, where the severity of the disease depends on the nature of the mutation. Mutations are characterized if they prevent any formation of β chains (thal major) or if they allow some β chain formation to occur (thal intermedia), but in either case there is a relative excess of β chains without the formation of tetramers.
Bilirubin: Bilirubin is the yellow breakdown product of normal heme catabolism, formerly referred to as hematoidin. Heme is found in hemoglobin, a principal component of red blood cells. Bilirubin is excreted in bile and urine, where elevated levels may indicate certain diseases. It is responsible for the yellow color of bruises and the background straw-yellow color of urine.
BMI (Body Mass Index): BMI, or Quetelet index, is a measure of relative weight based on an individual’s mass and height, with the value universally being given in units of kilograms per square meter.
Boronate affinity HPLC: Separation of glycated proteins from nonglycated proteins due to the affinity of the sugar 1,2 cis-diols present in the glycated proteins for the boronate matrix.
Capillary electrophoresis (CE): Capillary electrophoresis is a group of electrokinetic separation methods performed in submillimeter-sized capillaries and in microfluidic and nanofluidic channels. CE frequently refers to capillary zone electrophoresis (CZE) but also to other electrophoretic techniques, including capillary gel electrophoresis (CGE) and capillary isoelectric focusing (CIEF), among others in this class of methods. In these methods, analytes migrate through electrolyte solutions under the influence of an electric field being separated according to ionic mobility and may be concentrated by means of gradients in conductivity and pH.
Cardiovascular disease: A spectrum of diseases of the heart and vasculature, including narrowing of the blood vessels of the heart (arteriosclerosis).
Diabetes Control and Complications Trial (DCCT): The Diabetes Control and Complications Trial was a landmark medical study conducted by the U.S. National Institute of Diabetes and Digestive and Kidney Diseases (NIDDK) in the late 1990s. The DCCT significantly changed the management principles of diabetes, showing that intensive treatment with the goal of maintaining blood glucose concentrations close to the normal range could decrease the frequency and severity of diabetic complications.
Diabetes mellitus (DM): Diabetes mellitus, or simply diabetes, is a group of metabolic diseases involving elevated blood sugar levels over a prolonged period, producing symptoms of frequent urination, increased thirst and increased hunger. When diabetes is left untreated, it can cause many acute complications, including diabetic ketoacidosis and nonketotic hyperosmolar coma. Serious long-term complications include heart disease, stroke, kidney failure, foot ulcers and damage to the eyes. Diabetes is due to either the pancreas not producing enough insulin, or the cells of the body not responding properly to the insulin produced.
7 1L E A R N I N G G U I D E : A P P E N D I X B A C K TO T H E TA B L E O F C O N T E N T S
Diabetes, type 1: Type 1 diabetes results from the body’s failure to produce enough insulin where the exact cause is not known. This form of diabetes was previously referred to as “insulin-dependent diabetes mellitus” (IDDM) or “juvenile diabetes.” Autoimmune type 1 diabetes is associated with other autoimmune diseases, such as autoimmune thyroid disease and celiac disease, which also show genetic susceptibility largely mediated by the HLA genes of chromosome 6.
Diabetes, type 2: Type 2 diabetes begins with insulin resistance, a condition in which cells fail to respond to insulin properly. As the disease progresses, a lack of insulin may also develop. Type 2 diabetes was previously referred to as non-insulin-dependent diabetes mellitus (NIDDM) or “adult-onset diabetes.” The primary cause is excessive body weight and not enough exercise.
Diabetic ketoacidosis: Diabetic ketoacidosis (DKA) is a potentially life-threatening complication in patients with diabetes mellitus, predominantly occurring in those patients with type 1 diabetes. DKA can occur in those with type 2 diabetes under certain circumstances, as it results from a shortage of insulin. In an absence of insulin, the body switches to burning fatty acids and producing acidic ketone bodies that cause most of the symptoms and complications.
Diabetic retinopathy: Diabetic retinopathy is the condition caused by complications from diabetes in which there is damage to the retina that can eventually lead to blindness. It is an ocular manifestation of diabetes affecting up to 80% of all patients who have had diabetes for 10 years or more.
Enzymatic methods: An enzymatic method for HbA1c analysis typically involves a first reaction in which a protease cleaves the glycated dipeptide from the N-terminal β chains of HbA1c. This is followed by a second reaction in which the glycated dipeptide reacts with fructosyl peptide oxidase (FPOX). This generates hydrogen peroxide that reacts in the presence of peroxidase (POD) with a color reagent to generate a chromogen that can be measured. The change in absorbance is measured to determine the concentration of HbA1c, and is combined with the measurement of hemoglobin to calculate the amount of HbA1c relative to the total hemoglobin concentration.
EQA/PT programs: External Quality Assessment or Proficiency Testing programs are used internationally to assess and monitor the quality of analytical performance of assays used in clinical laboratories. The results are evaluated through peer evaluations or by comparison to reference-method target values.
Erythropoietin therapy: Erythropoietin is a hormone that stimulates production of red blood cells and hemoglobin in the bone marrow and is synthesized in response to low levels of oxygen in the tissues. Erythropoietin-stimulating agents treat anemia by increasing the number of new red blood cells the body makes, decreasing the need for blood transfusions.
Estimated average glucose (eAG): HbA1c is an index of average glucose (AG) over the preceding weeks to months, depending in part on red blood cell life span, which averages about 120 days, and the weighted average of blood glucose levels during the preceding 120 days. Glucose levels in the preceding 30 days contribute substantially more to the level of HbA1c than do glucose levels 90–120 days earlier. The estimated AG (eAG) has been used as a more familiar measurement of blood glucose. In a recent study, it was calculated by combining weighted results from at least two days of continuous glucose monitoring performed four times, with seven-point daily self-monitoring of capillary glucose performed at least three days per week. The relationship between eAG and HbA1c based on linear regression analysis was found to be: eAG (mg/dl) = (28.7 · HbA1c) – 46.7, r2 = 0.84 (Diabetes Care. 2008;31:1-6).
European Association for the Study of Diabetes (EASD): The EASD is an academic nonprofit association founded in 1999 to advance diabetes research by various methods.
Gestational diabetes: Gestational diabetes is the third main form of diabetes, occurring when pregnant women without a previous history of diabetes develop a high blood glucose level.
Gluconeogenesis: Gluconeogenesis (GNG) is a metabolic pathway that results in the generation of glucose from noncarbohydrate carbon substrates such as pyruvate, lactate, glycerol, glucogenic amino acids and fatty acids. GNG is one of the two main mechanisms humans and many other animals use to keep blood glucose levels from dropping too low (hypoglycemia). Gluconeogenesis is present in plants, animals, fungi, bacteria and other microorganisms. It takes place mainly in the liver and, to a lesser extent, in the cortex of kidneys. Another means of maintaining blood glucose levels is through the degradation of glycogen (glycogenolysis).
Glucose: Glucose is a 6-carbon molecule produced by gluconeogenesis in the liver as a combination of two 3-carbon molecules such as glycerol. Glucose is also produced by glycogenolysis in the liver and muscle. Glucose is the main carbohydrate fuel for humans.
GLOSSARY OF TERMS, CONTINUED
7 2L E A R N I N G G U I D E : A P P E N D I X B A C K TO T H E TA B L E O F C O N T E N T S
Glycated hemoglobin (HbA1c): Glycated hemoglobin or hemoglobin A1c is a form of hemoglobin that is measured primarily to identify the average plasma glucose concentration over prolonged periods of time. HbA1c is formed in a nonenzymatic glycation pathway by hemoglobin’s exposure to plasma glucose. Normal levels of glucose produce a normal amount of glycated hemoglobin, but as the average amount of plasma glucose increases, the fraction of glycated hemoglobin also increases in a predictable way, being most influenced by the preceding weeks prior to sample collection. Thus, HbA1c serves as a marker for average blood glucose levels over the past three months. Higher amounts of glycated hemoglobin indicate poorer control of blood glucose levels.
Glycemia: Glycemia is the presence or concentration of glucose in blood and includes hypoglycemia (low glucose), euglycemia (normal glucose) or hyperglycemia (elevated glucose).
Glycogen: Glycogen is a multibranched polysaccharide of glucose, which serves as a form of energy storage in animals and fungi. In humans, glycogen is the main long-term storage polysaccharide of glucose, being made and stored primarily in the cells of the liver and the muscles.
Glycolysis: Derived from the Greek words glykys (sweet), and lysis (dissolution), glycolysis is the metabolic pathway that converts glucose into pyruvate. The process releases free energy used to form the high-energy compounds ATP (adenosine triphosphate) and NADH (reduced nicotinamide adenine dinucleotide).
Glycosuria: Glycosuria is the excretion of glucose into the urine, where typically urine contains no glucose because the kidneys are able to reclaim all of the filtered glucose back into the bloodstream. Glycosuria is nearly always caused by elevated blood glucose levels and is most commonly due to untreated diabetes mellitus.
HbS (sickle cell disease): In sickle cell disease, HbS is the form of sickle cell anemia in which there is homozygosity for the Hb mutation. Sickle cell anemia may also be referred to as HBSS, SS disease, hemoglobin S or permutations of those names. In heterozygous people that have only one sickle gene and one normal adult hemoglobin gene, the condition is referred to as HbAS or sickle cell trait. Heterozygous states exist which are other, rarer forms of sickle cell disease.
Hemoglobinopathy: Hemoglobinopathy is an abnormal structure of one of the globin chains of the hemoglobin molecule, caused by a genetic defect. It is inherited genetically as a single-gene disorder and, in most cases, inherited as an autosomal codominant trait.
Hemogram: A hemogram is a panel of tests that gives information about the red and white blood cells in a patient’s blood and typically consists of at least red blood cell (RBC), hemoglobin (Hgb), mean corpuscular volume (MCV), mean corpuscular Hgb (MCH) and red cell distribution (RCD).
Hemolysis: Hemolysis is the rupturing of red blood cells with the release of their cytoplasmic contents into surrounding plasma fluid. Hemolysis may occur before (in vivo) or after (in vitro) collection of a blood sample.
Hyperglycemia: Hyperglycemia is a condition in which an excessive amount of glucose circulates in the blood plasma, typically higher than 11.1 mmol/L (200 mg/dL). As with hypoglycemia, clinical symptoms may not be evident until even higher values are seen.
Hyperlipidemia: Hyperlipidemia involves abnormally elevated levels of any or all lipids and/or lipoproteins in the blood which, in the most common form, is dyslipidemia or any abnormal lipid levels. These fat-soluble molecules are transported in a protein capsule lipoprotein that determines its density. The lipoprotein density and type of apolipoproteins it contains determines the fate of the particle and its influence on metabolism. Hyperlipidemias are usually divided into primary and secondary subtypes.
Hypoglycemia: Hypoglycemia is a medical emergency that involves an abnormally low concentration of glucose in the blood. It can produce a variety of symptoms and effects, but the principal problems arise from an inadequate supply of glucose to the brain, resulting in impairment of function. Repeat episodes of hypoglycemia may eventually result in asymptomatic conditions.
Immunochemical methods: Immunoassays are analytical methods that detect interactions between antibodies and antigens, originally used to detect large biological molecules. These assays use immunochemical detection for the measurement of compounds or metabolites in blood and tissues. The new generation of these antibody-based assays can detect small synthetic compounds and, as a result, recent applications include biomarkers of exposure and effect to environmentally prevalent chemicals.
Insulin: Insulin is a hormone needed to allow glucose to enter cells to produce energy. It exists as a prohormone called proinsulin, in which a connecting C-peptide maintains its structure.
GLOSSARY OF TERMS, CONTINUED
7 3L E A R N I N G G U I D E : A P P E N D I X B A C K TO T H E TA B L E O F C O N T E N T S
Insulitis: This condition is characterized by the invasion of the pancreatic islets of Langerhans by lymphocytes that produce an inflammatory or autoimmune response, resulting in destruction of the beta cells of the pancreas.
International Diabetes Federation (IDF): The IDF is a world organization whose charter is to improve the lives of people with diabetes and those at risk. The organization operates globally or locally to follow the issues as outlined in the IDF Global Diabetes Plan.
International Federation of Clinical Chemistry (IFCC): The International Federation of Clinical Chemistry Working Group (IFCC-WG) on HbA1c Standardization has developed reference methods for HbA1c analysis and established a network of laboratories to execute these methods. The two reference methods are mass spectroscopy and capillary electrophoresis. Each network laboratory uses prepared mixtures of purified hemoglobin A1c and HbA0 as calibrators. These two reference methods have been developed to specifically measure the glycated N-terminal residue of the β chain. Hemoglobin is first cleaved into peptides by a proteolytic enzyme, followed by HPLC with either mass spectrometry or capillary electrophoresis of the specific glycated and nonglycated N-terminal peptides.
Ion-exchange HPLC: Ion-exchange high-performance liquid chromatography (or ion chromatography) is the separation of ions and polar molecules based on their affinity to the ion exchange resin. This method can be used for large proteins, small nucleotides, amino acids or any type of charged molecule.
Jaundice: Jaundice, from the Greek word icteric, is observed as a yellowish pigmentation of the skin, the membranes over the eye sclerae and other mucous membranes. It is caused by hyperbilirubinemia in blood and extracellular fluid.
Ketosis-prone-diabetes (KPD): Ketosis-prone diabetes is an intermediate form of diabetes with some characteristics of both type 1 and 2 diabetes. KPD is readily diagnosed from a single characteristic, ketoacidosis, and comes in four forms, depending upon the presence or absence of β-cell autoantibodies (A+ or A−) and β-cell functional reserve (β+ or β−).
Latent autoimmune diabetes of adults (LADA): LADA is characterized by the presence of diabetes-associated antibodies. Adults with LADA may initially be diagnosed as having type 2 diabetes, based on their age and depending on certain risk factors for type 2 diabetes, such as a strong family history or obesity. The most common diagnostic method is by detection of glutamic acid decarboxylase (GAD) antibodies; however, islet cell antibodies (ICA) are also common.
Macrovascular complications and disease: This disease is a series of complications that results from the repeated elevation of glucose in the body in diabetics. One pathological mechanism is the process of atherosclerosis, which leads to narrowing of arterial walls throughout the body, resulting in chronic inflammation and injury to the arterial wall in the peripheral or coronary vascular system. Additional complications include diabetic nephropathy leading to renal failure, as seen in proteinuria or microalbuminuria, and peripheral nerve dysfunction. Macrovascular disease from diabetes is associated with cardiovascular, cerebrovascular and peripheral vascular disease, which may result in clinical conditions such as stroke, angina and heart disease.
Metabolic syndrome: Metabolic syndrome is a collection of conditions including hyperglycemia, obesity, hypertension, low HDL cholesterol, and raised triglycerides and cholesterol.
Microvascular complications and disease: This disease is a series of microvascular complications that results from the repeated elevation of glucose in the body in diabetics. Diabetic retinopathy may be the most common condition and is responsible for thousands of new cases of blindness every year in the United States alone. According to the United Kingdom Prospective Diabetes Study (UKPDS), the development of diabetic retinopathy in patients with type 2 diabetes was found to be related to both the severity of hyperglycemia and the presence of hypertension. Most patients with type 1 diabetes develop evidence of retinopathy within 20 years of diagnosis.
National Glycohemoglobin Standardization Program (NGSP): The NGSP is an international organization with a charter to standardize laboratory hemoglobin A1c test results to those of the Diabetes Control and Complications Trial (DCCT) and United Kingdom Prospective Diabetes Study (UKPDS). The NGSP and associated steering committee are organized through a Central Primary Reference Laboratory (CPRL), backup Primary Reference Laboratories (PRLs) and Secondary Reference Laboratories (SRLs) to implement laboratory certification testing.
National Institute for Clinical Excellence (NICE): NICE is an international oganization that works to raise standards of healthcare by providing advice and support to encourage the use of clinically effective and cost-effective treatments. NICE operates on a strict not-for-profit, fee-for-service basis and carries out research activities, such as generating case studies, preparing tools to help with data analysis and encouraging shared learning through international meetings.
GLOSSARY OF TERMS, CONTINUED
74L E A R N I N G G U I D E : A P P E N D I X B A C K TO T H E TA B L E O F C O N T E N T S
Oral glucose tolerance test (OGTT): OGTT, or the glucose challenge test, is a medical test in which glucose is given orally and blood samples are taken to determine how quickly glucose is removed from the blood. This test is usually used to test for diabetes, gestational diabetes, insulin resistance and sometimes reactive hypoglycemia. This test is usually performed with a large dose of glucose (approximately 75 g) ingested by mouth, and blood levels are checked over a period of two hours.
Polyuria: Polyuria is typically defined as a condition of excessive or abnormally large production or passage of urine. Increased production and passage of urine can also be called diuresis and frequently appears with increased thirst (polydipsia).
Preanalytical conditions: The preanalytical conditions for diagnostic samples include sample collection factors, such as the influence of vacutainer tube agent(s), conditions for plasma separation, and storage temperature and storage time before and after plasma separation.
Red blood cells (RBCs): RBCs (erythrocytes) are the most common type of blood cell and the principal means of delivering oxygen (O2) to the body tissues via the blood flow through the circulatory system in vertebrate organisms. RBCs take up oxygen in the lungs or gills and release it into tissues by means of the body’s capillaries.
Sulphonylureas: Antidiabetic class of drugs for diabetes mellitus type 2 management, which act to increase insulin release from the beta cells in the pancreas.
Tandem mass spectrometric liquid chromatography (LC MS/MS): Tandem LC MS/MS involves liquid chromatography coupled with multiple steps of mass spectrometry selection and detection. Tandem MS is performed in either space, involving the physical separation of the instrument components, or time, involving the use of an ion trap.
Traceability chain of the IFCC Reference Method: The IFCC and Working Group on HbA1c Standardization have developed two reference methods, mass spectroscopy and capillary electrophoresis, for HbA1c analysis with a laboratory network. The two reference methods each use prepared mixtures of purified hemoglobin A1c and HbA0 as calibrators within the laboratory practice.
Type 1 diabetes: Chronic condition in which the pancreas produces little or no insulin, being caused by various factors such as genetics and exposure to certain viruses. Type 1 diabetes typically appears during childhood or adolescence but can also develop in adults and was once known as juvenile diabetes or insulin-dependent diabetes.
Type 2 diabetes: A chronic condition that affects the way the body metabolizes glucose, in which the body either resists the effects of insulin or doesn’t produce enough insulin to maintain a normal glucose level. Type 2 diabetes was once known as adult-onset or non-insulin-dependent diabetes.
United Kingdom Prospective Diabetes Study (UKPDS): The UKPDS was a randomized, multicenter trial of glycemic therapies involving more than 5100 patients with newly diagnosed type 2 diabetes, running from 1977 to 1997 in 23 UK clinical sites. The study showed conclusively that the complications of type 2 diabetes could be reduced by improving blood glucose and/or blood pressure control.
U.S. Cholesterol Reference Method Laboratory Network program (CRMLN): The CRMLN validates test systems that meet the gold standard for accuracy and reproducibility. The process and requirements were developed by the Centers for Disease Control and Prevention (CDC) for the measurement of total cholesterol and HDL cholesterol using analytical goals consistent with the National Cholesterol Education Program (NCEP).
World Health Organization (WHO): As part of the United Nations, the WHO is the directing and coordinating authority responsible for providing leadership on global health matters. The WHO shapes the health research agenda by setting norms and standards and by providing technical support to countries regarding health needs and trends.
GLOSSARY OF TERMS, CONTINUED
7 5L E A R N I N G G U I D E : A P P E N D I X B A C K TO T H E TA B L E O F C O N T E N T S
APPENDIX B: REFERENCESSECTION 11-1 World Health Organization. Use of glycated haemoglobin (HbA1c) in the diagnosis of diabetes mellitus. Abbreviated
Report of a WHO Consultation. WHO/NMH/CHP/CPM/11.1. Geneva, World Health Organization, 2011.
Seino Y, Nanjo K, Tafima N, et al. Report of the committee on the classification and diagnostic criteria of diabetes mellitus. J Diabetes Invest. 2010;1(5):212-228.
1-2 Abbasi F, Chu JW, Lamendola C, et al. Discrimination between obesity and insulin resistance in the relationship with adiponectin. Diabetes. 2004;53(3):585-90.
1-3 Saltiel AR, Kahn CR. Insulin signalling and the regulation of glucose and lipid metabolism. Nature. 2001;414:799.
1-4 Cartailler J. Insulin secretion. Resources from the Beta Cell Biology Consortium (www.betacell.org), funded by NIDDK U01-DK-072473; June 24, 2014. http://www.betacell.org/content/articleview/article_id/1/page/2/glossary/0/.
1-5 http://members.tripod.com/diabetics_world/Insulin_amino_acid_Structure.htm. June 23, 2014.
1-6 http://www.walgreens.com/marketing/library/contents.jsp?docid=8812&doctype=2. June 23, 2014.
SECTION 22-1 http://www.who.int/diabetes/actionnow/en/mapdiabprev.pdf. June 23, 2014.
2-2 DeFronzo RA, Bonadonna RC, Ferrannini E. Pathogenesis of NIDDM: a balanced overview. Diabetes Care. 1992;15(3):318-368.
Defronzo, RA. From the triumvirate to the ominous octet: a new paradigm for the treatment of type 2 diabetes mellitus. Diabetes. 2009;58(4):773-795.
2-3 Chan JM, Rimm EB, Colditz GA, Stampfer MJ, Willett WC. Obesity, fat distribution and weight gain as risk factors for clinical diabetes in men. Diabetes Care. 1994;17(9):961-969.
2-4 http://adam.com/vau/indexhtml#diabetic retinopathy.
2-5 Rask-Madsen C, Khan RC. Tissue-specific insulin signalling, metabolic syndrome and cardiovascular disease. Arterioscler Thromb Vasc Biol. 2012;32:2052-2059.
2-6 2013 International Diabetes Federation. IDF Diabetes Atlas. 6th ed. http://www.idf.org/sites/default/files/EN_6E_Atlas_Full_0.pdf. June 24, 2014.
2-7 http://eastpennfoot.wordpress.com/2013/01/09/controlling-type-2-diabetes-with-exercise/. November 21, 2014.
2-8 American Diabetes Association. Economic costs of diabetes in the U.S. in 2007. Diabetes Care. 2008;31:596-615.
2-9 Brownlee M. The pathobiology of diabetic complications: a unifying mechanism. Diabetes. 2005;54(6):1615-1625.
2-10 Campbell S, Reeves D, Kontopantelis E, Middleton E, Sibbald B, Roland M. Quality of primary care in England with the introduction of pay for performance. N Engl J Med. 2007:357(2):181-190.
2-11 Colhoun HM, Betteridge DJ, Durrington PN, et al. Primary prevention of cardiovascular disease with atorvastatin in type 2 diabetes in the Collaborative Atorvastatin Diabetes Study (CARDS): a multicentre randomised placebo-controlled trial. Lancet. 2004;364:685.
2-12 Sever PS, Dahlof B, Poulter NR, et al. Prevention of coronary and stroke events with atorvastatin in hypertensive patients who have average or lower-than-average cholesterol concentrations, in the Anglo-Scandinavian Cardiac Outcomes Trial-Lipid Lowering ARM (ASCOT-LLA): a multicentre randomised controlled trial. Lancet. 2003; 361:1149.
Dahlöf B, Sever PS, Poulter NR, et al; ASCOT Investigators. Prevention of cardiovascular events with an antihypertensive regimen of amlodipine adding perindopril as required versus atenolol adding bendroflumethiazide as required, in the Anglo-Scandinavian Cardiac Outcomes Trial-Blood Pressure Lowering Arm (ASCOT-BPLA): a multicentre randomised controlled trial. Lancet. 2005;366(9489):895-906.
76L E A R N I N G G U I D E : A P P E N D I X B A C K TO T H E TA B L E O F C O N T E N T S
2-13 DCCT Research Group. The effect of intensive treatment of diabetes on the development and progression of long-term complications in insulin-dependent diabetes mellitus. The Diabetes Control and Complications Trial Research Group. N Engl J Med. 1993;329(14):977-986.
2-14 De Block CE, Van Gaal LF. GLP-1 receptor agonists for type 2 diabetes. Lancet. 2009;374:4-6.
2-15 Defronzo RA. Banting Lecture. From the triumvirate to the ominous octet: a new paradigm for the treatment of type 2 diabetes mellitus. Diabetes. 2009;58(4):773-795.
2-16 Dluhy RG, McMahon GT. Intensive glycemic control in the ACCORD and ADVANCE trials. N Engl J Med. 2008;358(24):2630-2633.
Duckworth W, Abraira C, Moritz T, et al; VADT Investigators. Glucose control and vascular complications in veterans with type 2 diabetes. N Engl J Med. 2009;360(2):129-139.
2-17 Gaede P, Vedel P, Larsen N, Jensen GV, Parving HH, Pedersen O. Multifactorial intervention and cardiovascular disease in patients with type 2 diabetes. N Engl J Med. 2003;348(5):383-393.
Heart Outcomes Prevention Evaluation Study Investigators. Effects of ramipril on cardiovascular and microvascular outcomes in people with diabetes mellitus: results of the HOPE study and MICRO-HOPE substudy. Lancet. 2000;355:253-259.
2-18 Holman RR, Farmer AJ, Davies MJ, et al; 4-T Study Group. Three-year efficacy of complex insulin regimens in type 2 diabetes. N Engl J Med. 2009;361(18):1736-1747.
2-19 Holman RR, Paul SK, Bethel MA, Matthews DR, Neil HA. 10-year follow-up of intensive glucose control in type 2 diabetes. N Engl J Med. 2008 Oct 9;359(15):1577-1578.
2-20 Leslie RD, Delli Castelli M. Age-dependent influences on the origins of autoimmune diabetes: evidence and implications. Diabetes. 2004;53(12):3033-3040.
2-21 Leslie RD. Predicting adult-onset autoimmune diabetes: clarity from complexity. Diabetes. 2010;59(2):330-331.
2-22 Nathan DM, Cleary PA, Backlund JY, et al; Diabetes Control and Complications Trial/Epidemiology of Diabetes Interventions and Complications (DCCT/EDIC) Study Research Group. Intensive diabetes treatment and cardiovascular disease in patients with type 1 diabetes. N Engl J Med. 2005;353(25):2643-2653.
2-23 Schauer PR, Kashyap SR, Wolski K, et al. Bariatric surgery versus intensive medical therapy in obese patients with diabetes. N Engl J Med. 2012;366(17):1567-1576.
2-24 UKPDS Group. Intensive blood-glucose control with sulphonylureas or insulin compared with conventional treatment and risk of complications in patients with type 2 diabetes (UKPDS 33). Lancet. 1998;352(9131):837-853.
2-25 UKPDS Group. Tight blood pressure control and risk of macrovascular and microvascular complications in type 2 diabetes (UKPDS 38). BMJ. 1998;317:703-713.
SECTION 33-1 Weykamp C, John WG, Mosca A. A review of the challenge in measuring hemoglobin A1c. J Diabetes Sci Technol.
2009;3:439-45.
3-2 Jaisson S, Leroy N, Meurice J, Guillard E, Gillery P. First evaluation of Capillarys 2 Flex Piercing (Sebia) as a new analyser for HbA1c assay by capillary electrophoresis. Clin Chem Lab Med. 2012;50:1769-75.
3-3 Mallia AK, Hermanson GT, Krohn RI, Fujimoto EK, Smith PK. Preparation and use of a boronic acid affinity support for separation and quantisation of glycosylated hemoglobin. Anal Lett. 1981;14:649-61.
3-4 John WG, Gray MR, Bates DL, Beacham JL. Enzyme immunoassay: a new technique for estimating hemoglobin A1c. Clin Chem. 1993;39:663-6.
3-5 Liu L, Hood S, Wang Y, et al. Direct enzymatic assay for % HbA1c in human whole blood samples. Clin Biochem. 2008;41:576-83
REFERENCES, CONTINUED
7 7L E A R N I N G G U I D E : A P P E N D I X B A C K TO T H E TA B L E O F C O N T E N T S
3-6 Miller WG, Myers GL, Gantzer ML, et al. Roadmap for harmonization of clinical laboratory measurement procedures. Clin Chem. 2011;57:1108-17.
3-7 Little RR, Rohlfing CL, Wiedmeyer H-M, Myers GL, Sachs DB, Goldstein DE. The national glycohemoglobin standardization program. Clin Chem. 2001;47:1985-92.
3-8 Jeppsson JO, Kobold U, Barr J, et al. Approved IFCC reference method for the measurement of HbA1c in human blood. Clin Chem Lab Med. 2002;40:78-89.
3-9 Hoelzel W, Weykamp C, Jeppsson JO, et al. IFCC reference system for measurement of hemoglobin A1c in human blood and the national standardization schemes in the United States, Japan, and Sweden: a method-comparison study. Clin Chem. 2004;50:166-74.
3-10 Weykamp C, John WG, Mosca A, Hoshino T, Little R, Jeppsson J-O, et al. The IFCC Reference Measurement System for HbA1c: a 6 year progress report. Clin Chem. 2008;54:240-8.
3-11 American Diabetes Association. Diagnosis and classification of diabetes. Diabetes Care. 2012;35(suppl 1):S64-S71.
3-12 Weykamp C, John G, Gillery P, et al, on behalf of the IFCC Task force on implementation of HbA1c Standardization. Investigation of 2 models to set and evaluate quality targets for HbA1c: biological variation and Sigma-metrics. Clin Chem. 2015;61:752-9.
SECTION 44-1 Community control of hereditary anaemias: memorandum from a WHO meeting. Bull World Health Organ.
1983;61:63-80.
4-2 Williams TN, Weatherall DJ. World distribution, population genetics, and health burden of the hemoglobinopathies. Cold Spring Harb Perspect Med. 2012;2:a011692.
4-3 Hoppe C. Newborn screening for hemoglobin disorders in the USA: progress in management of hemoglobin disorders: new perspective for diagnostics, prevention and care. Second memorial Ida Bianco and Ezio Silvestroni ANMI Onlus Centro Studi delle Microcitemie. November 4, 2011; Rome, Italy.
4-4 Kleanthus M. Prevention in Cyprus and non-invasive prenatal diagnosis: progress in management of hemoglobin disorders: new perspective for diagnostics, prevention and care. Second memorial Ida Bianco and Ezio Silvestroni ANMI Onlus Centro Studi delle Microcitemie. November 4, 2011; Rome, Italy.
4-5 Traeger-Synodinos J. Primary prevention in Greece and PGD: progress in management of hemoglobin disorders: new perspective for diagnostics, prevention and care. Second memorial Ida Bianco and Ezio Silvestroni ANMI Onlus Centro Studi delle Microcitemie. November 4, 2011; Rome, Italy.
4-6 Chen FE, Ooi C, Ha Sy, et al. Genetic and clinical features of hemoglobin H disease in Chinese patients. N Engl J Med. 2000;343:544-550.
4-7 HbVar: a database of human hemoglobin variants and thalassemias. http://globin.bx.psu.edu/cgi-bin/hbvar/counter. Accessed May 20, 2017.
4-8 Piel FB, Patil AP, Howes RE, et al. Global epidemiology of sickle hemoglobin in neonates: a contemporary geostatistical model-based map and population estimates. Lancet. 2013;381:142-151.
4-9 Hardison RC, Chui D HK, Giardine B, et al. HbVar: a relational database of human hemoglobin variants and thalassemia mutations at the globin gene server. Hum Mutat. 2002;19:225-233.
4-10 Burgess T. Challenges in hemoglobinopathy testing. Med Lab Observer. 2012;44(2):18-20.
4-11 Vesper HW, Slimani N, Hallmans G, et al. Cross-sectional study on acrylamide hemoglobin adducts in subpopulations from the European Prospective Investigation into Cancer and Nutrition (EPIC) Study. J Agric Food Chem. 2008;56:6046-6053.
REFERENCES, CONTINUED
7 8L E A R N I N G G U I D E : A P P E N D I X B A C K TO T H E TA B L E O F C O N T E N T S
4-12 Prindle KH, McCurdy PR. Red cell lifespan in hemoglobin C disorders (with special reference to hemoglobin C trait). Blood. 1970;36:14-19.
4-13 Kabytaev K, Connolly S, Rohlfing CL, Sacks DB, Stoyanov AV, Little RR. Higher degree of glycation of hemoglobin S compared to hemoglobin A measured by mass spectrometry: potential impact on HbA1c testing. Clin Chim Acta. 2016;458:40-43.
4-14 Little RR, Rohlfing CL, Hanson S, et al. Effects of hemoglobin (Hb) E and HbD traits on measurements of glycated Hb (HbA1c) by 23 methods. Clin Chem. 2008;54:1277-1282.
4-15 http://www.ngsp.org/factors.asp. Accessed July 22, 2013.
4-16 Carta M, Paleari R, Caldini A, Mosca A; for il Gruppo di Studio Intersocietario SibioC-SIMeL Diabete Mellito. Glycated hemoglobin reporting in presence of hemoglobin variants. Biochim Clin. 2011;35:42-45.
4-17 Paroni R, Ceriotti F, Galanello R, et al. Performance characteristics and clinical utility of an enzymatic method for the measurement of glycated albumin in plasma. Clin Biochem. 2007;40:1398-1405.
4-18 Paleari R, Bonetti G, Callà C, et al. Multicenter evaluation of an enzymatic method for glycated albumin. Clin Chim Acta. 2017;469:81-86.
4-19 Coban E, Ozdogan M, Timuragaoglu A. Effect of iron deficiency anemia on the levels of hemoglobin A1c in nondiabetic patients. Acta Haematol. 2004;112:126-128.
4-20 Gram-Hansen P, Mourits-Andersen HT, Eriksen JE, Olesen LL. Glycosylated hemoglobin (HbA1c) and acute hemolytic anemia. Uqeskr Laeger. 1990;152:477-479.
4-21 Gallo E, Pich P, Ricco G, Saglio G, Camaschella C, Mazza U. The relationship between anemia, fecal stercobilinogen, erythrocyte survival, and globin synthesis in heterozygotes for b-thalassemia. Blood. 1975;46:693-8.
4-22 Polage C, Little R, Rohling CL, et. al. Effects of beta thalassemia minor on results of six glycated hemoglobin methods. Clin Chim Acta. 2004;350(1-2):123-128.
4-23 Jaisson S, Pietrement C, Gillery P. Carbamylation-derived products: bioactive compounds and potential biomarkers in chronic renal failure and atherosclerosis. Clin Chem. 2011;57:1499-1505.
4-24 Fluckiger R, Harmon W, Meier W, Loo S, Gabbay KH. Hemoglobin carbamylation in uremia. N Engl J Med. 1981;304:823-827.
4-25 Weykamp CW, Penders TJ, Siebelder CWM, Muskiet FAJ, van der Slik W. Interference of carbamylated and acetylated hemoglobins in assays of glycohemoglobin by HPLC, electrophoresis, affinity chromatography, and enzyme immunoassay. Clin Chem. 1993;39:138-142.
4-26 Davenport A, Jones SR, Goel S, Astley JP, Hartog M. Differentiation of acute from chronic renal impairment by detection of carbamylated hemoglobin. Lancet. 1993;341:1614-1617.
4-27 Little RR, Rohlfing CL, Tennill AL, et al. Measurement of HbA1c in patients with chronic renal failure. Clin Chim Acta. 2013;418:73-76.
4-28 Szymezak J, Lavalard E, Martin M, Leroy N, Gillery P. Carbamylated hemoglobin remains a critical issue in HbA1c measurements. Clin Chem Lab Med. 2009;47:612-613.
4-29 American Diabetes Association. Standards of medical care in diabetes. Diabetes Care. 2007;30(Suppl 1):S4-S41.
4-30 Camargo JL, Stifft J, Gross JL. The effect of aspirin and vitamins C and E on HbA1c assays. Clin Chim Acta. 2006;372:206-209.
4-31 Camargo EG, Pedrini RO, Gross JL, Camargo JL, Silveiro SP. Lack of interference of aspirin in HbA1c measured by ion-exchange HPLC in type 2 diabetic patients: A randomized, double-blind, placebo-controlled study. Clin Chim Acta. 2008;391:120-122.
4-32 Dumaswala UJ, Zhuo L, Jacobsen DW, Jain SK, Sukalski KA. Protein and lipid oxidation of banked human erythrocytes: role of glutathione. Free Rad Biol Med. 1999;27:1041-1049.
4-33 Kanias T, Acker JP. Biopreservation of red blood cells – the struggle with hemoglobin oxidation. FEBS J. 2010;277:343-356.
REFERENCES, CONTINUED
7 9L E A R N I N G G U I D E : A P P E N D I X B A C K TO T H E TA B L E O F C O N T E N T S
4-34 Stadtman ER. Protein oxidation and aging. Science. 1992;257:1220-1224.
4-35 Sies H. Glutathione and its role in cellular functions. Free Radic Biol Med. 1999;27:916-921.
4-36 Niwa T, Naito C, Mawjood AHM, Imai K. Increased glutathionyl hemoglobin in diabetes mellitus and hyperlipidemia demonstrated by liquid chromatography/electrospray ionization-mass spectrometry. Clin Chem. 2000;46:82-88.
4-37 Jeppsson JO, Jerntorp P, Almer LO, Persson R, Ekberg G, Sundkvist G. Capillary blood on filter paper for determination of HbA1c by ion exchange chromatography. Diabetes Care. 1996;19:142-145.
SECTION 55-1 DCCT Research Group. The effect of intensive treatment of diabetes on the development and progression of long
term complications in insulin dependent diabetes mellitus. New Engl J Med. 1993;329:977-986.
5-2 American Diabetes Association. Standards of Medical Care in Diabetes 2010. Diabetes Care. 2010;33:S11-S61.
5-3 Epidemiology of Diabetes Interventions and Complications (EDIC) Research Group. Epidemiology of Diabetes Interventions and Complications (EDIC): design, implementation, and preliminary results of a long-term follow-up of the Diabetes Control and Complications Trial cohort. Diabetes Care. 1999;22:99-111.
5-4 UK Prospective Diabetes Study (UKPDS) Group. Intensive blood-glucose control with sulphonylureas or insulin compared with conventional treatment and risk of complications in patients with type 2 diabetes (UKPDS 33). Lancet. 1998;352:837-851.
5-5 Little RR, England JD, Wiedmeyer HM, et al. Interlaboratory standardization of glycated hemoglobin determinations. Clin Chem. 1986;32:358-360.
5-6 Little RR, Wiedmeyer HM, England JD, et al. Interlaboratory standardization of measurements of glycohemoglobins. Clin Chem. 1992;38:2472-2478.
5-7 Myers GL, Kimberly MM, Waymack PP, Smith SJ, Cooper GR, Sampson EJ. A reference method laboratory network for cholesterol: a model for standardization and improvement of clinical laboratory measurements. Clin Chem. 2000;46:1762-1772.
5-8 NGSP. NGSP Protocol overview. http://www.ngsp.org/protocol.asp. 2013.
5-9 Directive 98/79/EC of the European Parliament and of the Council of 27 October 1998 on in vitro diagnostic medical devices. Off J L. 1998;331:1-37.
5-10 Jeppsson JO, Kobold U, Barr J, et al. Approved IFCC reference method for the measurement of HbA1c in human blood. Clin Chem Lab Med. 2002;40:78-89.
5-11 Weykamp C, John WG, Mosca A, et al. The IFCC reference measurement system for HbA1c: a 6-year progress report. Clin Chem. 2008;54:240-248.
5-12 Joint Commission on Traceability in Laboratory Medicine. http://www.bipm.org/en/committees/jc/jctlm. 2013.
5-13 IFCC Network on HbA1c. 2013. http://www.ifcchba1c.net. 2013.
5-14 Consensus statement on the worldwide standardization of the hemoglobin A1C measurement: the American Diabetes Association, European Association for the Study of Diabetes, International Federation of Clinical Chemistry and Laboratory Medicine, and the International Diabetes Federation. Diabetes Care. 2007;30:2399-2400.
5-15 Nathan DM, Kuenen J, Borg R, et al. Translating the A1C assay into estimated average glucose values. Diabetes Care. 2008;31:1473-1478.
5-16 Barth JH, Marshall SM, Watson ID. Consensus meeting on reporting glycated hemoglobin and estimated average glucose in the UK: report to the National Director for Diabetes, Department of Health. Ann Clin Biochem. 2008;45:343-344.
5-17 Hanas R, John G. 2010 consensus statement on the worldwide standardization of the hemoglobin A1c measurement. Clin Chem. 2010;56:1362-1364.
5-18 Sacks DB. 2011 Consensus Meeting on the Worldwide Standardization of Hemoglobin A1c Measurement. Clin Chem. 2013;59:857-858.
REFERENCES, CONTINUED
8 0L E A R N I N G G U I D E : A P P E N D I X B A C K TO T H E TA B L E O F C O N T E N T S
5-19 Hanas R, John G. 2013 update on the worldwide standardization of the hemoglobin A1c measurement. Clin Chem Lab Med. 2013;51:1041-1042.
5-20 NGSP. NGSP Certified methods/labs, 2013. http://www.ngsp.org/certified.asp. June 23, 2014.
5-21 Sacks DB, Arnold M, Bakris GL, et al. Guidelines and recommendations for laboratory analysis in the diagnosis and management of diabetes mellitus. Diabetes Care. 2011;34:e61-99.
5-22 Hanas R. Psychological impact of changing the scale of reported HbA(1c) results affects metabolic control. Diabetes Care. 2002;25:2110-2111.
5-23 Kilpatrick ES, Rigby A, Atkin SL, Barth JH. Glycemic control in the 12 months following a change to SI hemoglobin A1c reporting units. Clin Chem. 2013;59:1457-1460.
SECTION 66-1 Goldstein DE, Little RR, Lorenz RA, Malone JI, Nathan D, Peterson CM. Tests of glycemia in diabetes. Diabetes Care.
1995;18:896-909.
6-2 Goldstein DE, Little RR, Wiedmeyer HM, England JD, Rohlfing, CL. Glycated hemoglobin estimation in the 1990s: a review of assay methods and clinical interpretation. In: Marshall SM, Home PD, eds. Diabetes Annual. Vol 8. Amsterdam, Netherlands: Elsevier; 1994:193-212.
6-4 Beach KW. A theoretical model to predict the behavior of glycosylated hemoglobin levels. J Theor Biol. 1979;81:547-561.
6-5 Tahara Y, Shima K. The response on GHb to stepwise plasma glucose change over time in diabetic patients. Diabetes Care. 1993;16:1313-1314.
Tahara Y, Shima K. Kinetics of HbA1c, glycated albumin, and fructosamine and analysis of their weight functions against preceding plasma glucose level. Diabetes Care. 1995;18(4):440-447.
6-6 DCCT. The effect of intensive treatment of diabetes on the development and progression of long-term complications in insulin-dependent diabetes mellitus. N Engl J Med. 1993;329:977-986.
6-7 UK Prospective Diabetes Study (UKPDS) Group. Intensive blood-glucose control with sulphonylureas or insulin compared with conventional treatment and risk of complications in patients with type 2 diabetes (UKPDS 33). Lancet. 1998;352:837-853.
6-8 American Diabetes Association. Diagnosis and classification of diabetes. Diabetes Care. 2012;35(suppl 1):S64-S71.
6-9 http://www.who.int/diabetes/publications/report-hba1c_2011.pdf. Accessed August 1, 2013.
6-10 Rohlfing C, Wiedmeyer HM, Little R, et al. Biological variation of glycohemoglobin. Clin Chem. 2002;48:1116-1118.
6-11 Carlsen S, Petersen PH, Skeie S, Skadberg Ø, Sandberg S. Within-subject biological variation of glucose and HbA(1c) in healthy persons and in type 1 diabetes patients. Clin Chem Lab Med. 2011;49:1501-1507.
6-12 Braga F, Dolci A, Montagnana M, et al. Revaluation of biological variation of glycated hemoglobin (HbA(1c)) using an accurately designed protocol and an assay traceable to the IFCC reference system. Clin Chim Acta. 2011;412:1412-1416.
6-13 Nathan DM, Buse JB, Davidson MB, et al. Medical management of hyperglycemia in type 2 diabetes: a consensus algorithm for the initiation and adjustment of therapy: a consensus statement of the American Diabetes Association and the European Association for the Study of Diabetes. Diabetes Care. 2009;32:193-203.
6-14 Monami M, Adalsteinsson JE, Desideri CM, et al. Fasting and post-prandial glucose and diabetic complication. A meta-analysis. Nutrition Metabolism & Cardiovascular Diseases. 2013;23:591.
6-15 Little RR, Rohlfing CL, Sacks DB. Status of HbA1c measurement and goals for improvement: from chaos to order for improving diabetes care. Clin Chem. 2011;57:204-214.
6-16 http://www.nice.org.uk/nicemedia/live/11946/41320/41320.pdf. Accessed August 1, 2013.
6-17 http://www.idf.org/webdata/docs/Pregnancy_EN_RTP.pdf. Accessed August 1, 2013.
REFERENCES, CONTINUED
8 1L E A R N I N G G U I D E : A P P E N D I X B A C K TO T H E TA B L E O F C O N T E N T S
6-18 Katon J, Williams MA, Reiber G, Miller E. Antepartum A1C, maternal diabetes outcomes, and selected offspring outcomes: an epidemiological review. Paediatr Perinat Epidemiol. 2011;25(3):265-276.
6-19 Katon J, Reiber G, Williams MA, Yanez D, Miller E. Antenatal hemoglobin A1c and risk of large-for-gestational-age infants in a multi-ethnic cohort of women with gestational diabetes. Paediatr Perinat Epidemiol. 2012;26(3):208-217.
6-20 Arumugam K, Abdul Majeed N. Glycated hemoglobin is a good predictor of neonatal hypoglycaemia in pregnancies complicated by diabetes. Malaysian J Pathol. 2011;33(1):21-24.
6-21 Clayton W Jr, Agarwal N, Wang L, Jagasia S. Clinical markers implying the need for treatment in women with gestational diabetes mellitus. Endocr Pract. 2012;18(1):62-65.
6-22 World Health Organization. WHO Expert Committee on Diabetes Mellitus: Second Report. Technical Report Series 646. Geneva: World Health Organization; 1980;1-80.
6-23 Report of the Expert Committee on the diagnosis and classification of diabetes mellitus. Diabetes Care. 1997; 20:1183-1197.
6-24 Cowie CC, Rust KF, Byrd-Holt DD, et al. Prevalence of diabetes and high risk for diabetes using A1c criteria in the U.S. population in 1988-2006. Diabetes Care. 2010;33:562.
6-25 Kosaka K, Kuzuya T, Yoshinaga H, et al. A prospective study of health check examinees for the development of non-insulin-dependent diabetes mellitus: relationship of the incidence of diabetes with the initial insulinogenic index and degree of obesity. Diabet Med. 1996;13:S120-S126.
6-26 Christensen DL, Witte DR, Kaduka L, et al. Moving to an A1c-based diagnosis of diabetes has a different impact on prevalence in different ethnic groups. Diabetes Care. 2010;33:580-582.
Mostafa SA, Davies MJ, Webb D, et al. The potential impact of using glycated hemoglobin, HbA1c, as the preferred diagnostic tool for type 2 diabetes mellitus. Diabetic Medicine. 2010;72:762-769.
6-27 van’t Riet E, Alssema M, Rijkelijkhuizen JM, et al. Relationship between A1c and glucose levels in the general Dutch population: The new Hoorn study. Diabetes Care. 2009;33:61-66.
6-28 Kramer CK, Araneta MRG, Barrett-Connor E. A1c and diabetes diagnosis: The Rancho Bernardo Study. Diabetes Care. 2009;33:101-103.
6-29 Mongia SK, Little RR, Rohlfing CL, et al. Effects of hemoglobin C and S traits on the results of 14 commercial glycated hemoglobin assays. Am J Clin Pathol. 2008;130:136-140.
6-30 Little RR, Rohlfing CL, Hanson S, et al. Effects of hemoglobin (Hb) E and HbD traits on measurements of glycated Hb (HbA1c) by 23 methods. Clin Chem. 2008;54:1277-1282.
6-31 El-Agouza I, Abu SA, Sirdah M. The effect of iron deficiency anaemia on the levels of hemoglobin subtypes: possible consequences for clinical diagnosis. Clin Lab Haematol. 2002;24:285-289.
6-32 Looker AC, Dallman PR, Carroll MD, et al. Prevalence of iron deficiency in the United States. JAMA. 1997;277:973-976.
6-33 Kim C, Bullard KM, Herman WH, et al. Association between iron deficiency and HbA1c levels among adults without diabetes in the National Health and Nutrition Examination Survey, 1999-2006. Diabetes Care. 2010;33:780-785.
6-34 Herman WH, Ma Y, Uwaifo G, et al; Diabetes Prevention Program Research Group. Differences in A1C by race and ethnicity among patients with impaired glucose tolerance in the Diabetes Prevention Program. Diabetes Care. 2007;30(10):2453-2457.
6-35 Pani LN, Korenda L, Meigs JB, et al. Effect of aging on A1C levels in individuals without diabetes: evidence from the Framingham Offspring Study and the National Health and Nutrition Examination Survey 2001-2004. Diabetes Care. 2008;31(10):1991-1996.
REFERENCES, CONTINUED
82L E A R N I N G G U I D E : A P P E N D I X B A C K TO T H E TA B L E O F C O N T E N T S
APPENDIX C: CORRECT RESPONSESSECTIONS 1 AND 21. B, 2. C, 3. D, 4. E, 5. E, 6. A, 7. D, 8. C
SECTION 3 1. B, 2. D, 3. A, 4. B, 5. C, 6. C
SECTION 4 1. B, 2. A, 3. D, 4. D, 5. C, 6. C
SECTION 5 1. C, 2. C, 3. B, 4. B, 5. B, 6. C, 7. A
SECTION 6 1. A, 2. C, 3. C, 4. B, 5. E, 6. C, 7. E

8 3L E A R N I N G G U I D E : D I A B E T E S B A C K TO T H E TA B L E O F C O N T E N T S
© 2017 Abbott Laboratories. ADD-00061643
ABBOTTDIAGNOSTICS.COM


![Consultative Committee for Amount of Substance …International Federation of Clinical Chemistry and Laboratory Medicine [IFCC]. International Organization for Standardization, Committee](https://img.pdfslide.us/doc/110x75/5edca911ad6a402d66676bca/consultative-committee-for-amount-of-substance-international-federation-of-clinical.jpg)