Embed Size (px)
Citation preview
1
OCEAN FREIGHTMARKET UPDATE
DHL Global Forwarding, Freight
April 2019
Publication Date 29th March 2019
Dominique von Orelli – Global Head, Ocean Freight
PUBLIC
22
Contents
TOPIC OF THE MONTH
Carriers preparing for the implementation of the IMO 2020 sulphur fuel cap
HIGH LEVEL DEVELOPMENT
MARKET OUTLOOK
Freight Rates and Volume Development
ECONOMIC OUTLOOK & DEMAND DEVELOPMENT
CAPACITY DEVELOPMENT
CARRIERS
REGULATIONS
?DID YOU KNOW?
Sustainable Marine Bio-Fuel Oil
PUBLIC
DHL Global Forwarding | OFR Market Update | Apr 2019
33
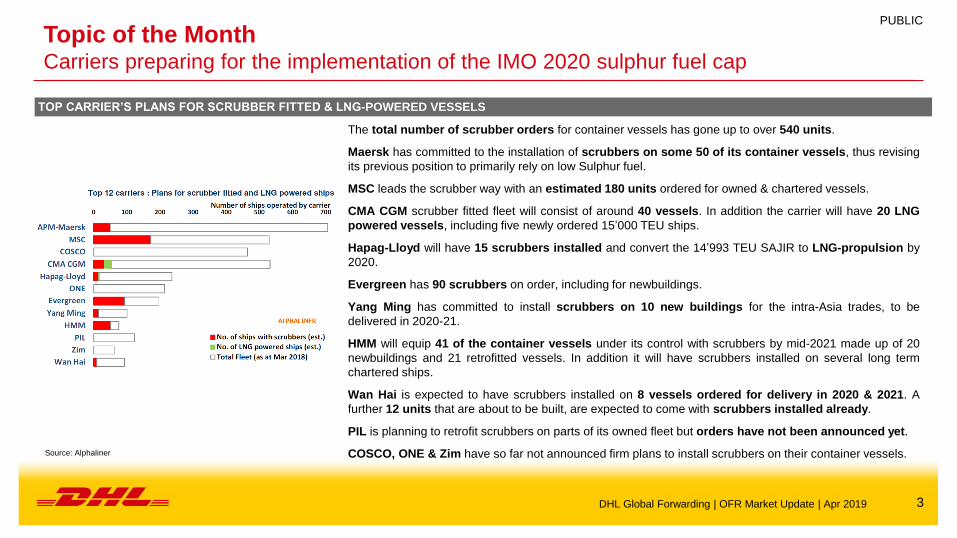
Topic of the MonthCarriers preparing for the implementation of the IMO 2020 sulphur fuel cap
Source: Alphaliner
DHL Global Forwarding | OFR Market Update | Apr 2019
The total number of scrubber orders for container vessels has gone up to over 540 units.
Maersk has committed to the installation of scrubbers on some 50 of its container vessels, thus revising
its previous position to primarily rely on low Sulphur fuel.
MSC leads the scrubber way with an estimated 180 units ordered for owned & chartered vessels.
CMA CGM scrubber fitted fleet will consist of around 40 vessels. In addition the carrier will have 20 LNG
powered vessels, including five newly ordered 15’000 TEU ships.
Hapag-Lloyd will have 15 scrubbers installed and convert the 14’993 TEU SAJIR to LNG-propulsion by
2020.
Evergreen has 90 scrubbers on order, including for newbuildings.
Yang Ming has committed to install scrubbers on 10 new buildings for the intra-Asia trades, to be
delivered in 2020-21.
HMM will equip 41 of the container vessels under its control with scrubbers by mid-2021 made up of 20
newbuildings and 21 retrofitted vessels. In addition it will have scrubbers installed on several long term
chartered ships.
Wan Hai is expected to have scrubbers installed on 8 vessels ordered for delivery in 2020 & 2021. A
further 12 units that are about to be built, are expected to come with scrubbers installed already.
PIL is planning to retrofit scrubbers on parts of its owned fleet but orders have not been announced yet.
COSCO, ONE & Zim have so far not announced firm plans to install scrubbers on their container vessels.
TOP CARRIER’S PLANS FOR SCRUBBER FITTED & LNG-POWERED VESSELS
PUBLIC
44
High Level Market Development – Supply and Demand
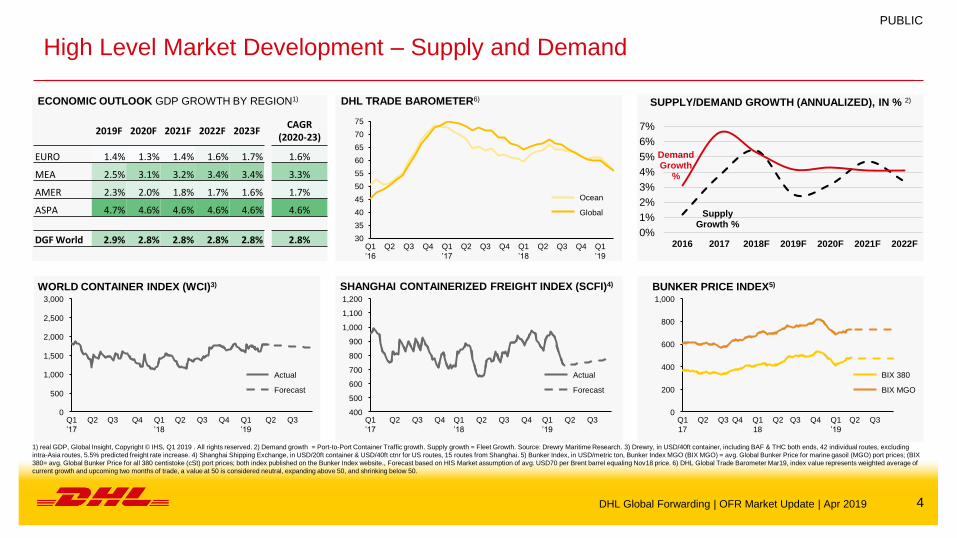
ECONOMIC OUTLOOK GDP GROWTH BY REGION1)
PUBLIC
1) real GDP, Global Insight, Copyright © IHS, Q1 2019 . All rights reserved. 2) Demand growth = Port-to-Port Container Traffic growth. Supply growth = Fleet Growth. Source: Drewry Maritime Research. 3) Drewry, in USD/40ft container, including BAF & THC both ends, 42 individual routes, excluding
intra-Asia routes, 5.5% predicted freight rate increase. 4) Shanghai Shipping Exchange, in USD/20ft container & USD/40ft ctnr for US routes, 15 routes from Shanghai. 5) Bunker Index, in USD/metric ton, Bunker Index MGO (BIX MGO) = avg. Global Bunker Price for marine gasoil (MGO) port prices; (BIX
380= avg. Global Bunker Price for all 380 centistoke (cSt) port prices; both index published on the Bunker Index website., Forecast based on HIS Market assumption of avg. USD70 per Brent barrel equaling Nov18 price. 6) DHL Global Trade Barometer Mar19, index value represents weighted average of
current growth and upcoming two months of trade, a value at 50 is considered neutral, expanding above 50, and shrinking below 50.
BUNKER PRICE INDEX5)WORLD CONTAINER INDEX (WCI)3) SHANGHAI CONTAINERIZED FREIGHT INDEX (SCFI)4)
DHL TRADE BAROMETER6)
2,500
1,500
1,000
0
500
2,000
3,000
Q1
’17
Q3 Q2 Q3Q3Q2 Q2Q4Q4 Q1
’18
Q1
’19
1,000
700
900
1,200
800
500
600
400
1,100
Q3Q1
’19
Q4Q1
’17
Q2 Q3 Q1
’18
Q2 Q3 Q4 Q2
200
800
600
0
400
1,000
Q1
18
Q4Q2 Q3Q1
17
Q2Q2 Q3 Q4 Q1
’19
Q3
30
35
40
45
50
55
60
65
70
75
Q3Q1
’17
Q1
’16
Q2Q2 Q3 Q4 Q4 Q1
’18
Q2 Q4Q3 Q1
’19
Ocean
Global
Actual
Forecast Forecast
Actual
SUPPLY/DEMAND GROWTH (ANNUALIZED), IN % 2)
SupplyGrowth %
Demand Growth
%
0%
1%
2%
3%
4%
5%
6%
7%
2016 2017 2018F 2019F 2020F 2021F 2022F
SUPPLY/DEMAND GROWTH (ANNUALIZED), IN % 2)
BIX 380
BIX MGO
DHL Global Forwarding | OFR Market Update | Apr 2019
2019F 2020F 2021F 2022F 2023FCAGR
(2020-23)
EURO 1.4% 1.3% 1.4% 1.6% 1.7% 1.6%
MEA 2.5% 3.1% 3.2% 3.4% 3.4% 3.3%
AMER 2.3% 2.0% 1.8% 1.7% 1.6% 1.7%
ASPA 4.7% 4.6% 4.6% 4.6% 4.6% 4.6%
DGF World 2.9% 2.8% 2.8% 2.8% 2.8% 2.8%
55
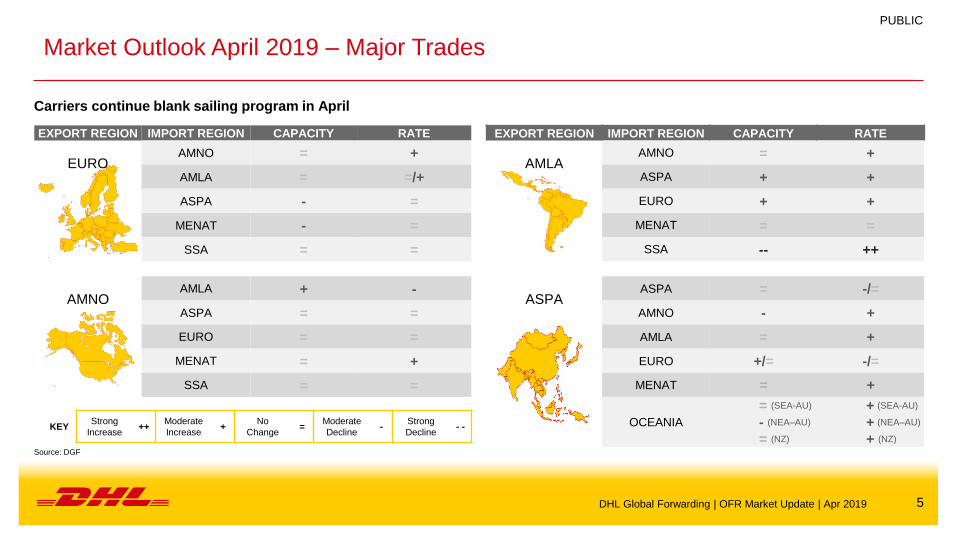
Market Outlook April 2019 – Major Trades
Carriers continue blank sailing program in April
KEYStrong
Increase++
Moderate
Increase+
No
Change=
Moderate
Decline-
Strong
Decline- -
EXPORT REGION IMPORT REGION CAPACITY RATE
EUROAMNO = +
AMLA = =/+
ASPA - =
MENAT - =
SSA = =
AMNOAMLA + -
ASPA = =
EURO = =
MENAT = +
SSA = =
EXPORT REGION IMPORT REGION CAPACITY RATE
AMLAAMNO = +
ASPA + +
EURO + +
MENAT = =
SSA -- ++
ASPAASPA = -/=
AMNO - +
AMLA = +
EURO +/= -/=
MENAT = +
OCEANIA
= (SEA-AU)
- (NEA–AU)
= (NZ)
+ (SEA-AU)
+ (NEA–AU)
+ (NZ)
DHL Global Forwarding | OFR Market Update | Apr 2019
Source: DGF
PUBLIC
66
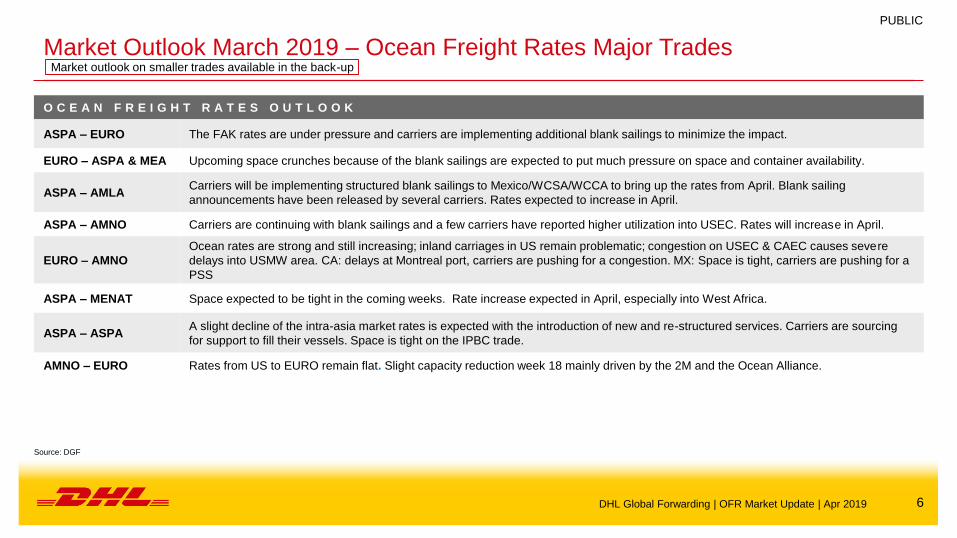
Market Outlook March 2019 – Ocean Freight Rates Major TradesMarket outlook on smaller trades available in the back-up
O C E A N F R E I G H T R A T E S O U T L O O K
ASPA – EURO The FAK rates are under pressure and carriers are implementing additional blank sailings to minimize the impact.
EURO – ASPA & MEA Upcoming space crunches because of the blank sailings are expected to put much pressure on space and container availability.
ASPA – AMLACarriers will be implementing structured blank sailings to Mexico/WCSA/WCCA to bring up the rates from April. Blank sailing
announcements have been released by several carriers. Rates expected to increase in April.
ASPA – AMNO Carriers are continuing with blank sailings and a few carriers have reported higher utilization into USEC. Rates will increase in April.
EURO – AMNO
Ocean rates are strong and still increasing; inland carriages in US remain problematic; congestion on USEC & CAEC causes severe
delays into USMW area. CA: delays at Montreal port, carriers are pushing for a congestion. MX: Space is tight, carriers are pushing for a
PSS
ASPA – MENAT Space expected to be tight in the coming weeks. Rate increase expected in April, especially into West Africa.
ASPA – ASPAA slight decline of the intra-asia market rates is expected with the introduction of new and re-structured services. Carriers are sourcing
for support to fill their vessels. Space is tight on the IPBC trade.
AMNO – EURO Rates from US to EURO remain flat. Slight capacity reduction week 18 mainly driven by the 2M and the Ocean Alliance.
DHL Global Forwarding | OFR Market Update | Apr 2019
Source: DGF
PUBLIC
77
Economic Outlook & Demand Development
World growth set to further decelerate in the short term, but should stabilize later this year
Source: IHS Markit, IHS Purchasing Manager Index Manufacturing, a PMI at 50 is considered neutral, expanding above 50, and business shrinking below 50.
DHL Global Forwarding | OFR Market Update | Apr 2019
PUBLIC
EURO
Individual countries’ vulnerability to the economic slowdown varies. In DE, domestic demand should provide a cushion against the
slowdown in external demand, with the labor market in good shape, wage growth picking up, & fiscal policy becoming more stimulatory. IT, in
contrast, has much less favorable fundamentals & is much more vulnerable to a deterioration in the external climate, while escalating
political risks have led to a pronounced tightening of financial conditions. Hitherto fast-growing peripheral economies should continue to
outperform, but leading indicators also signal a moderation.
AMNO
US GDP growth has slowed sharply in Q1 ’19 reflecting temporary deceleration in consumer expenditures in the wake of Dec18’s financial
market turbulence & a reversal of a weather induced surge in utility bills late last year. US growth is forecasted to slow as the boost from fiscal
stimulus first peaks and then fades. The US economic outlook remains a key input for the Canadian economic outlook.
ASPA
Near-term economic activity is slowing as the US-China trade conflict is increasingly biting and the ultimate outcome of ongoing trade
negotiations are uncertain. Because most of the region has significant trade ties with China, there are significant downside risks to the region’s
growth outlook as export activity weakens, but especially if it causes businesses to further rein in their capital expenditure plans.
EMERGING
MARKETS
Some economies (AR, IR, TR) have already slipped into recession. Others such (BR, ZA) have seen growth fall below expectations as the
industrial recession in key economies is hurting merging-market commodity exports. While a few countries (IN, PH, VN) will continue to grow.
DEMAND
DEVELOPMENT
IHS Markit’s PMI for worldwide exports fell for a 6th straight month, dropping at the steepest rate since May’16. Hurt by trade, the near
stagnation in manufacturing has not spilled over to services yet.
88
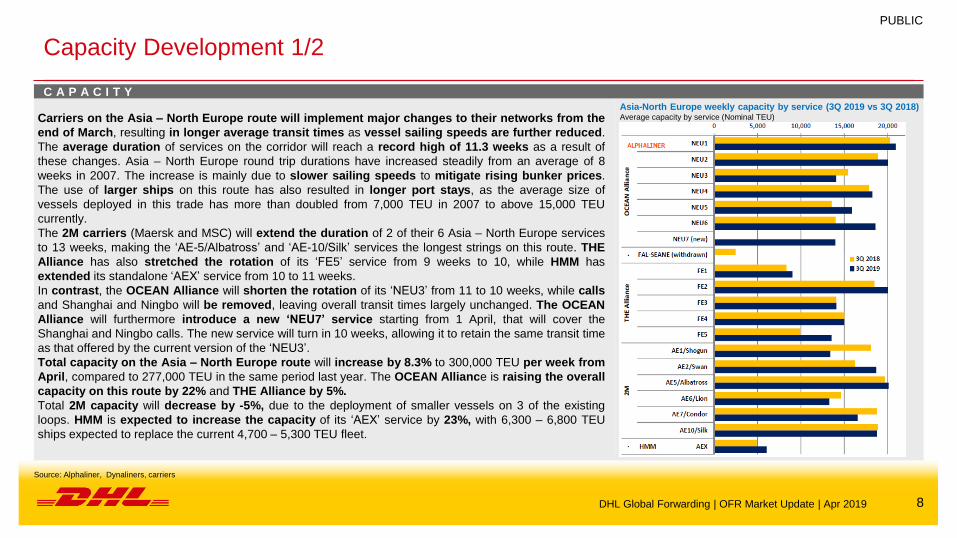
Capacity Development 1/2
C A P A C I T Y
Carriers on the Asia – North Europe route will implement major changes to their networks from the
end of March, resulting in longer average transit times as vessel sailing speeds are further reduced.
The average duration of services on the corridor will reach a record high of 11.3 weeks as a result of
these changes. Asia – North Europe round trip durations have increased steadily from an average of 8
weeks in 2007. The increase is mainly due to slower sailing speeds to mitigate rising bunker prices.
The use of larger ships on this route has also resulted in longer port stays, as the average size of
vessels deployed in this trade has more than doubled from 7,000 TEU in 2007 to above 15,000 TEU
currently.
The 2M carriers (Maersk and MSC) will extend the duration of 2 of their 6 Asia – North Europe services
to 13 weeks, making the ‘AE-5/Albatross’ and ‘AE-10/Silk’ services the longest strings on this route. THE
Alliance has also stretched the rotation of its ‘FE5’ service from 9 weeks to 10, while HMM has
extended its standalone ‘AEX’ service from 10 to 11 weeks.
In contrast, the OCEAN Alliance will shorten the rotation of its ‘NEU3’ from 11 to 10 weeks, while calls
and Shanghai and Ningbo will be removed, leaving overall transit times largely unchanged. The OCEAN
Alliance will furthermore introduce a new ‘NEU7’ service starting from 1 April, that will cover the
Shanghai and Ningbo calls. The new service will turn in 10 weeks, allowing it to retain the same transit time
as that offered by the current version of the ‘NEU3’.
Total capacity on the Asia – North Europe route will increase by 8.3% to 300,000 TEU per week from
April, compared to 277,000 TEU in the same period last year. The OCEAN Alliance is raising the overall
capacity on this route by 22% and THE Alliance by 5%.
Total 2M capacity will decrease by -5%, due to the deployment of smaller vessels on 3 of the existing
loops. HMM is expected to increase the capacity of its ‘AEX’ service by 23%, with 6,300 – 6,800 TEU
ships expected to replace the current 4,700 – 5,300 TEU fleet.
DHL Global Forwarding | OFR Market Update | Apr 2019
PUBLIC
Source: Alphaliner, Dynaliners, carriers
Asia-North Europe weekly capacity by service (3Q 2019 vs 3Q 2018)Average capacity by service (Nominal TEU)
99
Capacity Development 2/2
C A P A C I T Y
The OCEAN Alliance and its partner carriers have cancelled 10 transpacific sailings in March and April, confirming early signs that container cargo volumes on
this trade are falling short of expectations. OCEAN’s axed sailings will remove 74,180 TEU of capacity from the trade lane to the US West Coast and 35,620 TEU to
the US East Coast. This represents a cut of about 15% of the total capacity that the alliance would have otherwise offered over this period.
Generally the container capacity on the Transpacific route is projected to remain flat in 2019. This year, the carriers’ cautious approach marks the first time
since 2009 that no new transpacific services are to be introduced on the route for the summer’s peak shipping season. Transpacific cargo volumes are
expected to weaken this year, and eastbound liftings data for the first two months of the year already show a reduction of -1.0%.
Maersk and MSC have temporarily suspended their jointly-operated South China – Taiwan – Australia service, branded respectively as the ‘Yoyo’ or ‘Panda
because of the severe rate erosion on the Asia – Australia route. The suspension is planned to run from the end of March to the end of June. It will remove an
average weekly capacity of around 5,500 TEU from the trade as of 27 March.
MSC and CMA CGM have announced the formation of a new Vessel Sharing Agreement for the trade from Europe to the Indian Ocean and Australia. From
mid-September 2019, the carriers will operate a joint service which will return from Australia to Europe via South East Asia and the Indian Subcontinent. A
fleet of 14 ships of about 9,500 TEU will be deployed, with 9 ships from MSC and 5 from CMA CGM. The joint service will replace MSC’s existing ‘Australia
Express’ and CMA CGM’s ‘New North Europe Med Oceania’ (NEMO) service, which is jointly operated with Hapag-Lloyd who brands it ‘Europe Australia
Express’. With the launch of their joint service later this year, CMA CGM and MSC will be the only carriers to offer direct services between Europe and
Australia. All other carriers serve Oceania via transhipment in South East Asia.
The idle containership fleet has fallen sharply in the last two weeks, dropping by some 200,000 TEU to 709,659 TUE as at 18 March 2019 as carriers prepare
for the launch of new service networks for the summer shipping season. The number of idle units fell across all size segments. In the smaller sizes, activity
was especially brisk in the intra-Far East trades where new service launches have helped to reduce the idle fleet of between 500 and 3,000 TEU to 103 units
compared to 149 units in January. The larger sizes of over 5,100 TEU are also seeing a gradual recovery in demand, and a reduction in the number of blank
sailings on long haul routes helped push down the total count of idle ships.
DHL Global Forwarding | OFR Market Update | Apr 2019
Source: Alphaliner, Dynaliners, carriers
PUBLIC
1010
Carriers 1/2
C A R R I E R S
OOCL’s container shipping operations made a net profit of $55 M in 2018, an improvement over the -$12 M net loss recorded in 2017. OOCL’s results in 2018
was adjusted to exclude the earnings from its Long Beach Container Terminal (LBCT), which has been reclassified as a discontinued operation pending the sale of
the terminal. OOCL’s total container liftings increased by 6.3% to 6.7 Mteu. The company said that its large exposure to the Transpacific trade, which account for
41% of its total revenue last year, helped to raise its earnings in the 2nd half. OOCL, which is 75% owned by COSCO Shipping Holdings since August 2018, said
that the group managed to achieve total synergy savings of $400 M through network optimization, joint procurement, IT and equipment utilization.
Yang Ming has reported a net loss of TWD 6.59 Bn ($219 M) in 2018, reversing a net profit of TWD 321 M in 2017. Yang Ming’s container liftings increased by
10.8% to reach 5.2 Mteu but average freight rates dropped by -1.6% despite the recovery in the 4th Q 2018. The company said that its results were negatively
impacted by the 31.2% increase in bunker fuel prices last year, while freight rates remained depressed due to supply-demand imbalances that persisted
throughout the year.
ZIM has reported a net loss of -$128 M in 2018, reversing a net profit of $6 M in 2017. The weaker results were negatively impacted by a $39 M impairment loss
recognized during the 4th Q for vessels that will be scrapped in 2019. ZIM’s shareholders’ equity remained in deficit, and stood at -$230 M as at the end of 2018.
Although ZIM’s total liftings increased by 10.8% to reach a record of 2.9 Mteu last year, average freight rates did not recover sufficiently in the 2nd half of the
year to raise its operating margins.
Evergreen Marine Corp. (EMC), the Taiwan listed vehicle of the Evergreen Group, has reported a net profit of TWD 294 M ($10M) for 2018, compared to a net
profit of TWD 7.01 Bn in 2017.
CMA CGM posted a full-year net profit of $34 M for 2018, significantly lower than the $697 M recorded in 2017. The profit deterioration was partly due to the
recognition of the shipping line’s share of losses incurred at CEVA Logistics and Global Ship Lease (GSL), as well as increased operating costs for its container
shipping business. CMA CGM’s container liftings increased by 9.3% to 20.7 Mteu in 2018. The deterioration in earnings and operating margins has prompted CMA
CGM to announce a new $1.2 Bn cost savings program.
DHL Global Forwarding | OFR Market Update | Apr 2019
PUBLIC
Source: Alphaliner, Dynaliners, carriers
1111
Regulations
R E G U L A T I O N S
U.S.A.: New Import Requirement for Composite Wood Products
Since 01 June 2018, regulated composite wood panels and finished products containing such composite wood panels that imported into the U.S.A. have been
required to be certified as compliant with either the Toxic Substance Control Act (TSCA) Title VI or the California Air Resources Board (CARB) Airborne Toxic
Control Measures (ATCM) Phase II emission standards. Such products have been required to be labelled as CARB ATCM Phase II or TSCA Title VI compliant.
Effective 22 March 2019, such goods may only be certified and labelled as compliant with TSCA Title VI. A label which only references the product being
compliant with the CARB ATCM Phase II standards will no longer be sufficient.
Beginning on 22 March 2019, importers will be responsible for providing a TSCA Section 13 import certification for articles containing regulated composite wood
products, component parts or finished goods imported into the U.S. Customs territory. Importers must complete the TSCA
certification form and include it with the import documentations of each subject importation, so the Customs broker may notate the certification within the Customs
entry.
“Regulated composite wood panels” include medium density fibreboard (MDF), particle board and hardwood plywood. Any finished products (unless specifically
excluded by the rule) made from these materials are also subject to the above requirements. This can include products such as furniture, toys, recreational
vehicles, and so on. Importers of products made from the above noted materials should review and ensure all regulatory requirements are being met on such
importations.
Source: DHL
DHL Global Forwarding | OFR Market Update | Apr 2019
PUBLIC
1212
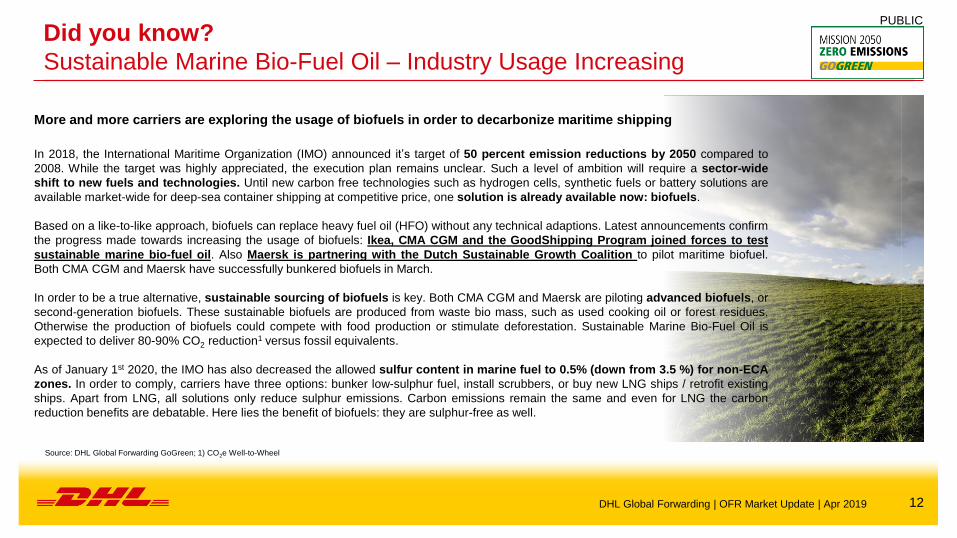
Did you know?
Sustainable Marine Bio-Fuel Oil – Industry Usage Increasing
DHL Global Forwarding | OFR Market Update | Apr 2019
Source: DHL Global Forwarding GoGreen; 1) CO2e Well-to-Wheel
More and more carriers are exploring the usage of biofuels in order to decarbonize maritime shipping
In 2018, the International Maritime Organization (IMO) announced it’s target of 50 percent emission reductions by 2050 compared to
2008. While the target was highly appreciated, the execution plan remains unclear. Such a level of ambition will require a sector-wide
shift to new fuels and technologies. Until new carbon free technologies such as hydrogen cells, synthetic fuels or battery solutions are
available market-wide for deep-sea container shipping at competitive price, one solution is already available now: biofuels.
Based on a like-to-like approach, biofuels can replace heavy fuel oil (HFO) without any technical adaptions. Latest announcements confirm
the progress made towards increasing the usage of biofuels: Ikea, CMA CGM and the GoodShipping Program joined forces to test
sustainable marine bio-fuel oil. Also Maersk is partnering with the Dutch Sustainable Growth Coalition to pilot maritime biofuel.
Both CMA CGM and Maersk have successfully bunkered biofuels in March.
In order to be a true alternative, sustainable sourcing of biofuels is key. Both CMA CGM and Maersk are piloting advanced biofuels, or
second-generation biofuels. These sustainable biofuels are produced from waste bio mass, such as used cooking oil or forest residues.
Otherwise the production of biofuels could compete with food production or stimulate deforestation. Sustainable Marine Bio-Fuel Oil is
expected to deliver 80-90% CO2 reduction1 versus fossil equivalents.
As of January 1st 2020, the IMO has also decreased the allowed sulfur content in marine fuel to 0.5% (down from 3.5 %) for non-ECA
zones. In order to comply, carriers have three options: bunker low-sulphur fuel, install scrubbers, or buy new LNG ships / retrofit existing
ships. Apart from LNG, all solutions only reduce sulphur emissions. Carbon emissions remain the same and even for LNG the carbon
reduction benefits are debatable. Here lies the benefit of biofuels: they are sulphur-free as well.
PUBLIC
1313B A C K - U P
PUBLIC
1414
Source: DGF
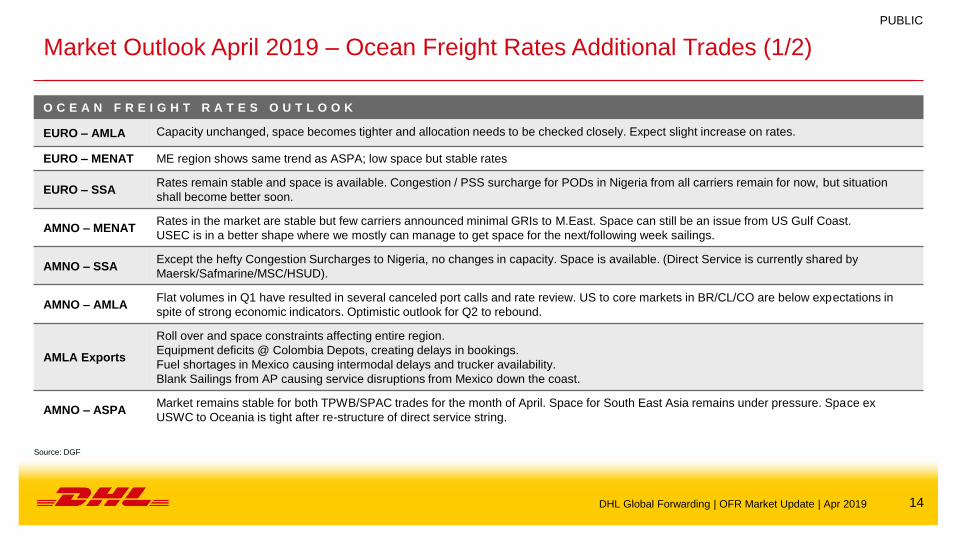
Market Outlook April 2019 – Ocean Freight Rates Additional Trades (1/2)
O C E A N F R E I G H T R A T E S O U T L O O K
EURO – AMLA Capacity unchanged, space becomes tighter and allocation needs to be checked closely. Expect slight increase on rates.
EURO – MENAT ME region shows same trend as ASPA; low space but stable rates
EURO – SSARates remain stable and space is available. Congestion / PSS surcharge for PODs in Nigeria from all carriers remain for now, but situation
shall become better soon.
AMNO – MENATRates in the market are stable but few carriers announced minimal GRIs to M.East. Space can still be an issue from US Gulf Coast.
USEC is in a better shape where we mostly can manage to get space for the next/following week sailings.
AMNO – SSAExcept the hefty Congestion Surcharges to Nigeria, no changes in capacity. Space is available. (Direct Service is currently shared by
Maersk/Safmarine/MSC/HSUD).
AMNO – AMLAFlat volumes in Q1 have resulted in several canceled port calls and rate review. US to core markets in BR/CL/CO are below expectations in
spite of strong economic indicators. Optimistic outlook for Q2 to rebound.
AMLA Exports
Roll over and space constraints affecting entire region.
Equipment deficits @ Colombia Depots, creating delays in bookings.
Fuel shortages in Mexico causing intermodal delays and trucker availability.
Blank Sailings from AP causing service disruptions from Mexico down the coast.
AMNO – ASPAMarket remains stable for both TPWB/SPAC trades for the month of April. Space for South East Asia remains under pressure. Space ex
USWC to Oceania is tight after re-structure of direct service string.
DHL Global Forwarding | OFR Market Update | Apr 2019
PUBLIC
1515
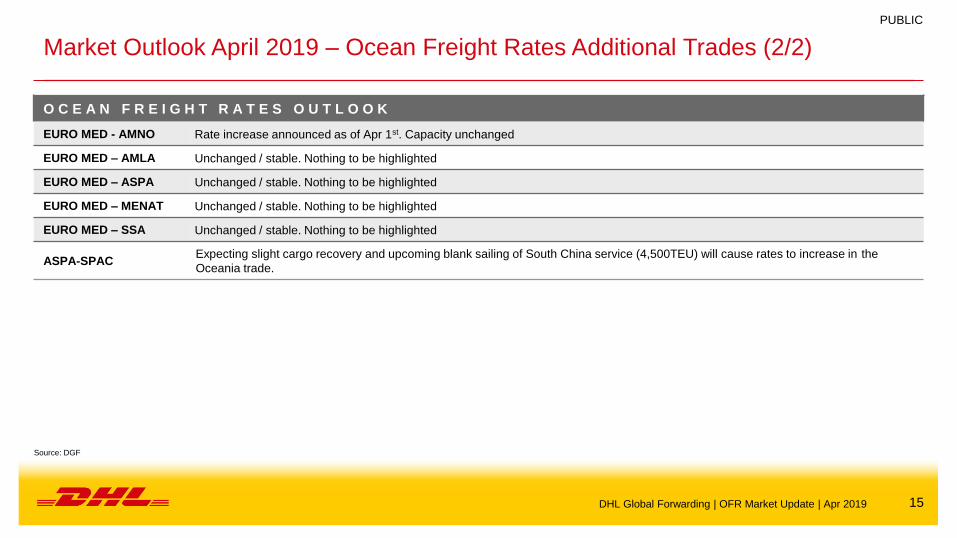
Market Outlook April 2019 – Ocean Freight Rates Additional Trades (2/2)
O C E A N F R E I G H T R A T E S O U T L O O K
EURO MED - AMNO Rate increase announced as of Apr 1st. Capacity unchanged
EURO MED – AMLA Unchanged / stable. Nothing to be highlighted
EURO MED – ASPA Unchanged / stable. Nothing to be highlighted
EURO MED – MENAT Unchanged / stable. Nothing to be highlighted
EURO MED – SSA Unchanged / stable. Nothing to be highlighted
ASPA-SPACExpecting slight cargo recovery and upcoming blank sailing of South China service (4,500TEU) will cause rates to increase in the
Oceania trade.
DHL Global Forwarding | OFR Market Update | Apr 2019
Source: DGF
PUBLIC
1616
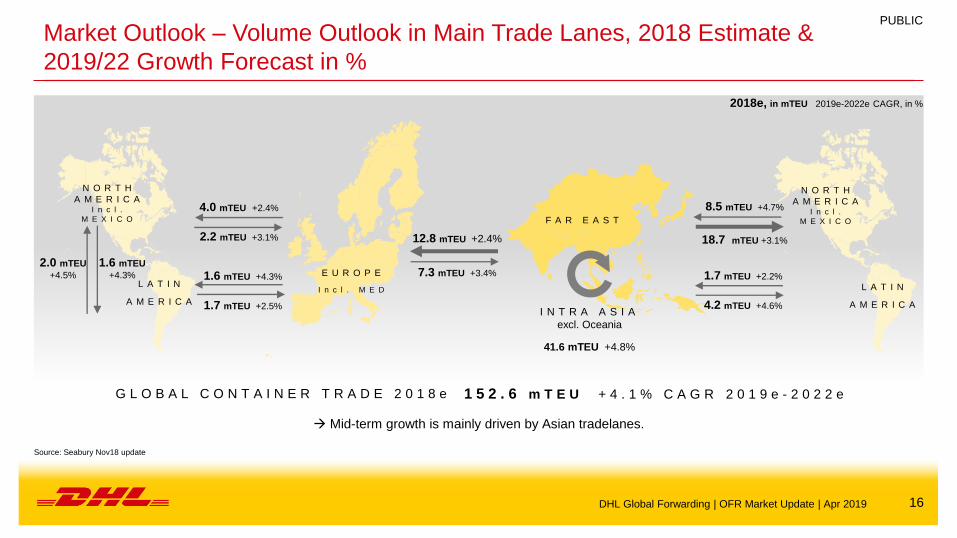
Market Outlook – Volume Outlook in Main Trade Lanes, 2018 Estimate &
2019/22 Growth Forecast in %
N O R T H
A M E R I C AI n c l .
M E X I C O
4.0 mTEU +2.4%
2.2 mTEU +3.1%
1.6 mTEU +4.3%
1.7 mTEU +2.5%
N O R T H
A M E R I C AI n c l .
M E X I C O
L A T I N
A M E R I C A
E U R O P E
I n c l . M E D
12.8 mTEU +2.4%
7.3 mTEU +3.4%
8.5 mTEU +4.7%
18.7 mTEU +3.1%
1.7 mTEU +2.2%
4.2 mTEU +4.6%
2018e, in mTEU 2019e-2022e CAGR, in %
F A R E A S T
I N T R A A S I A
excl. Oceania
41.6 mTEU +4.8%
2.0 mTEU
+4.5%
1.6 mTEU
+4.3%
L A T I N
A M E R I C A
G L O B A L C O N T A I N E R T R A D E 2 0 1 8 e 1 5 2 . 6 m T E U + 4 . 1 % C A G R 2 0 1 9 e - 2 0 2 2 e
Mid-term growth is mainly driven by Asian tradelanes.
Source: Seabury Nov18 update
DHL Global Forwarding | OFR Market Update | Apr 2019
PUBLIC

1717
Carrier Mergers, Acquisitions and Alliances
M E R G E R S A N D A Q U I S I T I O N S
China
ShippingCosco OOCL Evergreen APL
CMA
CGM
Hapag
Lloyd
United
Arab
Shipping
Hyundai
Merchant
Marine
Hamburg
Süd
Maersk
LineMSC K Line MOL NYK
Yang
Ming
CHINA COSCO SHIPPING
OOCL
EVER
GREEN
CMA CGM
APLHAPAG-LLOYD
HYUNDAI
MERCHANT
MARINE
MAERSK LINE
Hamburg SüdMSC
OCEAN NETWORK
EXPRESS (ONE)
YANG
MING
A L L I A N C E S
F O R M E R A L L I A N C E S P R E S E N T A L L I A N C E S
2MMAERSK LINE
MSCOCEAN 3
CMA CGM
CHINA SHIPPING
UNITED ARAB
SHIPPING COMPANY
2M
MAERSK LINE
MSC
HMM (strategic
cooperation until Apr
2020)
OCEAN
ALLIANCE
OOCL
CMA CGM
CHINA COSCO SHIPPING
EVERGREEN
G6
HAPAG-LLOYD
MOL
NYK
APL
HYUNDAI
MERCHANT
MARINE
OOCL
CKYHE
COSCO
EVERGREEN
HANJIN
SHPPING
K-LINE
YANG MINGTHE ALLIANCE
HAPAG-LLOYD
ONE
YANG MING
*Source: Carriers
PUBLIC
DHL Global Forwarding | OFR Market Update | Apr 2019

1818
Acronyms and Explanations
2M - Carrier Alliance: Maersk / MSC Ocean 3 - Carrier Alliance: CMA, UASC, China Shipping
AMLA - Latin America OCRS - Operational Cost Recovery surcharge
AMNO - North America OOCL - Orient Overseas Container Line
AR - Argentina OWS - Overweight Surcharge
ASPA - AsiaPacific PH - Philippines
BR - Brazil PNW - Pacific North West
CAGR - Compound Annual Growth Rate Ppt. - Percentage points
CENAC - Central Amercia and Caribbean PSW - Pacific South West
CKYHE - Carrier Alliance: Cosco, K-Line, YangMing, Hanjin and Evergreen RR(I) - Rate Restoration
CNC - CNC Line (Cheng Lie Navigation Co. Ltd.) SAEC - South America East Coast
DG - Dangerous Goods SAWC - South America West Coast
DWT - Dead Weight Tonnage SOLAS - Safety of Life at Sea
EB - Eastbound SPRC - South People’s Republic of China – South China
ECSA - East Coast South America SSA - Sub-Saharan Africa
EGLV - Evergreen Marine Corp SSL - Steam Ship Line
EURO - Europe T - Thousands
FMC - US Federal Marine Commission TEU - Twenty foot equivalent unit (20‘ container)
G6 - Carrier Alliance: APL, Hapag Lloyd, Hyundai, MOL, NYK and OOCL TP - Trans Pacific
GRI - General Rate Increase TSA - Trans Pacific Stabilization Agreement
HJS - Hanjin Shipping ULCS - Ultra Large Container Ship
HMM - Hyundai USGC - US Gulf Coast
HL - Hapag -Lloyd US FMC - US Federal Maritime Commission
HSUD - Hamburg Süd USEC - US East Coast
HWS - Heavy Weight Surcharge USWC - US West Coast
IA - Intra Asia VGM - Verified Gross Mass
IPBC - India Pakistan Bangladesh Colombo VLCS - Very Large Container Ship
IPI - Inland Point Intermodal VSA - Vessel Sharing Agreement
ISC - Indian Sub Continent WB - Westbound
MENAT - Middle East and North Africa WCSA - West Coast South America
ML - Maersk Line WHL - Wan Hai
mn - Millions YML - Yang Ming Line
MoM - Month-on-Month YoY - Year-on-Year
NOO - Non-operating (vessel) owners YTD - Year-to-Date
DHL Global Forwarding | OFR Market Update | Apr 2019
PUBLIC